OECD C Assessing biodiversityrelated financial risks: Navigating the landscape of existing approaches OECD ENVIRONMENT POLICY PAPER NO. 36 POLICY PERSPECTIVES
Assessing biodiversity-related financial risks
Navigating the landscape of existing approaches

| 1 ASSESSING BIODIVERSITY-RELATED FINANCIAL RISKS
PUBE
Disclaimers
This paper is published under the responsibility of the Secretary-General of the OECD. The opinions expressed and arguments employed herein do not necessarily reflect the official views of OECD member countries.
This document, as well as any data and any map included herein, are without prejudice to the status of or sovereignty over any territory, to the delimitation of international frontiers and boundaries and to the name of any territory, city or area.
This document was produced with the financial assistance of the European Union. The views expressed herein can in no way be taken to reflect the official opinion of the European Union.
© OECD (2023)
You can copy, download or print OECD content for your own use, and you can include excerpts from OECD publications, databases and multimedia products in your own documents, presentations, blogs, websites and teaching materials, provided that suitable acknowledgment of OECD as source and copyright owner is given. All requests for commercial use and translation rights should be submitted to rights@oecd.org
Authorised for publication by Jo Tyndall, Acting Director, Environment Directorate.
2 | ASSESSING BIODIVERSITY-RELATED FINANCIAL RISKS
Acknowledgments
This report has been developed as a deliverable of the project on “Developing a Supervisory Framework for Financial Risks Stemming from Biodiversity Loss”, launched by the European Commission, together with the OECD as the implementing partner, to support the Magyar Nemzeti Bank (MNB). The project is carried out with funding by the European Union via the Technical Support Instrument and in cooperation with the European Commission's Directorate-General for Structural Reform Support (DG REFORM). DG REFORM coordinates and provides tailor-made technical support to EU Member States, in cooperation with the relevant Commission services. The support is primarily provided through the Technical Support Instrument (TSI). The goal is to support Member States’ efforts to design and implement resilienceenhancing reforms, thereby contributing to the EU’s recovery from the COVID-19 crisis, improving the quality of public services and getting back on the path of sustainable and inclusive growth.
The report is being undertaken jointly by the OECD Environment Policy Committee (EPOC) and the OECD Committee on Financial Markets (CMF). This report has been drafted by Riccardo Boffo, Giulio Mazzone, Hugh Miller, Juan Pavajeau Fuentes, Edward Perry and Geraldine Ang, under the supervision of Robert Patalano. This report and the broader project are managed by Geraldine Ang, under the supervision of Robert Patalano, Senior Counsellor, OECD Directorate for Financial and Enterprise Affairs. The authors are thankful for the substantive contributions of Tamás Boldizsár Hajas and Katia Karousakis (OECD Secretariat) as well as inputs from the following OECD colleagues: Dominique Blaquier; Serdar Celik; Emily Halstead; Fatos Koc; Jolien Noels; Marjin Korndewal; and Delia Sanchez Trancon The authors are also thankful for useful inputs received from external experts: Elena Almeida and Simon Dikau (LSE INSPIRE); Sebastian Bekker, Matt Jones and James Vause (UNEP-WCMC); Chiara Colesanti Senni (CEP); Gregus Ditta (Ministry of Agriculture, Hungary); Malte Hessenius, Andrew McConnell and Liyana Nayan (Climate & Company); Catherine Higham and Joana Setzer (LSE); Justin Johnson (University of Minnesota); Arne Klug, Sylvain Vanston and Juan Castro (MSCI), Christian Metzler (Adelphi); Johan Lammerant (ARCADIS); William Oman (IMF); Robert-Alexandre Poujade (BNPPAM); and Grant Rudgley and Nina Seega (University of Cambridge)
The authors are grateful to Kasia Kornosz-Koronowska and Mauro Sibilia (Policy Officers, DG REFORM, European Commission), David Papp (Head of Unit, Sustainable Finance Policy, MNB), Katalin Juhasz and Balázs Lorant (Analysts, MNB) for their inputs to the draft report. The authors would also like to thank the following persons for contributions through discussions in the preparatory phase of the report: Sebastian Bekker, Matt Jones and James Vause (UNEP-WCMC); Joshua Berger (CDC Biodiversité); Chiara Colesanti Senni (CEP/UZH); Simon Dikau and Elena Almeida (LSE INSPIRE); Nepomuk Dunz and Fiona Stewart (World Bank); Justin Johnson (University of Minnesota); Margaret Kulhow, Maud Abdelli and Elizabeth Aceituno (WWF); Johan Lammerant (ARCADIS); Serafin Martínez Jaramillo, Banco de México; Julie Maurin (AFD); Matthieu Maurin (Iceberg Datalab); Emily McKenzie and Tony Goldner (TNFD); Christian Metzler (Adelphi); Liyana Nayan (Climate & Company); William Oman (IMF); Garry Peterson (Stockholm Resilience Centre); Robert-Alexandre Poujade (BNPPAM); Arne Klug (MSCI); Grant Rudgley and Nina Seega (University of Cambridge); Mathilde Salin and Romain Svartzman (Banque de France); Joana Setzer (Grantham Research Institute on Climate Change and the Environment, LSE); Robin Smale and Charlie Dixon (Vivid Economics, McKinsey & Company); Joris van Toor (formerly at DNB); and Ulrich Volz (SOAS).
| 3 ASSESSING BIODIVERSITY-RELATED FINANCIAL RISKS
4 | ASSESSING BIODIVERSITY-RELATED FINANCIAL RISKS Table of contents Acknowledgments 3 Abbreviations and acronyms 6 Definitions 8 Executive Summary 12 1 Overview of biodiversity-related financial risks 14 The rationale for assessing biodiversity-related financial risks 14 An emerging work area requiring co-operation with key stakeholders 15 From biodiversity to financial systems and vice versa: Impacts, dependencies, and transmission channels 16 The Climate-Biodiversity Nexus 19 2 Mapping of existing approaches to measure biodiversity-related financial risks, impacts and dependencies 22 Overview of biodiversity data, metrics and indicators 23 Primary and secondary data 25 Modelled metrics and indicators 27 Measurement approaches 31 Approaches to Translate Exposure into Risk 40 Public policy for biodiversity 53 Brief review of liability risk 66 3 Challenges, gaps and considerations for next steps 69 General gaps and challenges 70 Data, metrics and indicators 70 Modelling, Scenario and Risk approaches 71 Next steps 72 References 74 Tables Table 1. Ecosystem services and their classifications 9 Table 2. Characteristics of Climate and Biodiversity 20 Table 3. Selected ecosystem services covered by ENCORE 32
| 5 ASSESSING BIODIVERSITY-RELATED FINANCIAL RISKS Table 4. Summary of IPBES Scenario Types and Example Assessments 42 Table 5. Nature-Economy Model Comparison 43 Table 6. Overview of policy instruments for biodiversity protection 57 Table 7. Economic instruments for biodiversity 64 Table 8. Framework of biodiversity-related liability risks 67 Figures Figure 1. Ecosystem services and the materialisation of biodiversity loss risks for the economy 17 Figure 2. Transmission channels for biodiversity risks 19 Figure 3. Summary of data, metrics and indicators related to the biodiversity loss-financial risk nexus 23 Figure 4. Example of Potentially Disappeared Fraction 29 Figure 5. Illustration of the detailed GBS Input-Output approach 36 Figure 6. EXIOBASE Input-Output Table (MR-IOT) features 37 Figure 7. The financial sector and ecosystem services dependencies per Malaysian ringgit invested 39 Figure 8.The environmental impact of financial sector lending per Malaysian ringgit invested 40 Figure 9. Translating Biodiversity Loss into Financial Risks 41 Figure 10. Earth-Economy Model Methods and Linkages 46 Figure 11. IPR Integrated Climate-Biodiversity Transition Trends 48 Figure 12. Natural Capital Valuation Model 49 Figure 13. Framework for identifying nature-related financial risks 50 Figure 14. TNFD LEAP FI Scoping Guidance 52 Figure 15. LSE Database: Yearly Trend for Biodiversity-relevant Litigation Cases 68 Figure 16. Draft methodological framework 73
Box 1. Selected key findings on the dependencies of economic sectors and the financial system on biodiversity 18 Box 2. Integrating biodiversity into financial markets instruments 24 Box 3. The Taskforce on Nature-related Financial Disclosures (TNFD) 31 Box 4. The application of ENCORE and GLOBIO: Indebted to nature: Exploring biodiversity risks for the Dutch financial sector (De Nederlandsche Bank, DNB) 34 Box 5. The application of MSA and ENCORE: A “Silent Spring” for the Financial System? Exploring Biodiversity-Related Financial Risks in France (Banque De France) 38 Box 6. The application of ENCORE: An Exploration of Nature-Related Financial Risks in Malaysia (Central Bank of Malaysia, BNM). 39 Box 7. Literature Review: Global Biodiversity Scenarios 42 Box 8. Stocktake of Nature-Economy Models 43 Box 9. Example Use-case – Scenario Analysis using IAMs 45 Box 10. Example Use-case – Partial Nature Collapse and Sovereign Credit Analysis 46 Box 11. Example Use-case – Natural Capital Valuation Model 48 Box 12. Example Use-case – East Asia and Water Curtailment Sectoral Analysis 51 Box 13. Example Use-case – Nature Risk Profiling and Biodiversity Risk Filter 52 Box 14. Increasing policies for nitrogen pollution put Dutch farmers out of business 54 Box 15. Other multilateral environmental agreements with a biodiversity focus 56 Box 16. The Coalition of Finance Ministers for Climate Action’s potential policy actions 57 Box 17. Protected areas and transition risk – recent analyses 59 Box 18. Moratoriums and bans 60 Box 19. OECD Guidelines for Multinational Enterprises and related due diligence guidance for responsible business conduct 61 Box 20. EU Regulation on deforestation-free products 62 Box 21. Target 15 under the Kunming-Montreal Global Biodiversity Framework 64 Box 22. OECD Policy Instruments for the Environment (PINE) database 65 Box 23. Biodiversity-related Litigation Databases 67
Boxes
Abbreviations and acronyms
AFD Agence Française de Développement
API Application Programming Interface
BdF Central Bank of France (Banque de France)
BIA-GBS Biodiversity Impact Analytics powered by the Global Biodiversity Score
BII Biodiversity Intactness Index
BIM Biodiversity Impact Metric
BNM Bank Negara Malaysia
BRFR Biodiversity-Related Financial Risks
C4F Carbon 4 Finance
CBD Convention on Biological Diversity
CBF Corporate Biodiversity Footprint
CICES Common International Classification of Ecosystem Services
CISL Cambridge Institute for Sustainable Leadership
CITES Convention on International Trade in Endangered Species of Wild Fauna and Flora
CMS Convention on Migratory Species
CRIS Climate Risk Impact Screening
DEMs Digital Elevation Models
DNB Central Bank of The Netherlands (De Nederlandsche Bank)
ENCORE Exploring Natural Capital Opportunities, Risks and Exposure
EPI Environmental Performance Index
ESG Environmental, Social & Governance
G20 Group of 20
G7 Group of Seven
GBIF Global Biodiversity Information Facility
GCE Computable General Equilibrium
GD-PAME Global Database on Protected Area Management Effectiveness
GHG Greenhouse Gas
GLOBIO Global Biodiversity Model for Policy Support
GLOBIOM Global Biosphere Management Model
GTAP Global Trade Analysis Project
GTAP-AEZ Global Trade Analysis Project Agro-Ecological Zone Data Base
IAMs Integrated Assessment Models
IAP Integrated Action Portfolio
IBAT Integrated Biodiversity Assessment Tool
IDL Iceberg Data Lab
IFC International Finance Corporation
IMAGE Integrated Model to Assess the Global Environment
INSPIRE International Network for Sustainable Financial Policy Insights, Research, and Exchange
InVEST Integrated Valuation of Ecosystem Services and Tradeoffs
IOTA Input-Output Trade Analysis
IPBES Intergovernmental Science-Policy Platform on Biodiversity and Ecosystem Services
IUCN International Union for Conservation of Nature
KBA Key Biodiversity Areas
ASSESSING BIODIVERSITY-RELATED FINANCIAL RISKS
6 |
LCA Life Cycle Assessment
LCI Life Cycle Inventory
MA Millennium Ecosystem Assessment
MNB Central Bank of Hungary (Magyar Nemzeti Bank)
Moody’s Moody’s Investors Service
MRIO Multi-Region Input-Output
MR-IOT Multi-Region Input-Output Table
MR-SUT Multi-Regional Environmentally Extended Supply-Use Table
MSA Mean Species Abundance
MSCI Morgan Stanley Capital International
NCFA Natural Capital Finance Alliance
NGFS Network of Central Banks and Supervisors for Greening the Financial System
OECMs Other Effective Area-based Conservation Measures
PBL Netherlands Environmental Assessment Agency (Planbureau voor de Leefomgeving)
PDF Potentially Disappeared Fraction
PINE OECD Policy Instruments for the Environment Database
RBC Royal Bank of Canada
RWAs Risk-Weighted Assets
SAR Synthetic Aperture Radar
SBTN Science-Based Targets Network
SDGs Sustainable Development Goals
SEALS Spatial Economic Allocation Landscape Simulator
SEEA EA System of Environmental Economic Accounting–Ecosystem Accounting
SFDR EU Sustainable Finance Disclosures Regulation
STAR Species Threat Abatement and Restoration
TNFD Taskforce on Nature-related Financial Disclosures
UNECE United Nations Economic Commission for Europe
UNEP United Nations Environment Programme
UNEP-WCMC United Nations Environment Programme World Conservation Monitoring Centre
WDPA World Database on Protected Areas
WEF World Economic Forum
WWF World Wildlife Fund
ASSESSING BIODIVERSITY-RELATED FINANCIAL RISKS
| 7
Definitions
The following listed terms have the sole purpose of aiding the reader and do not reflect the official view of the OECD.
Biological diversity (also known as biodiversity): According to the Convention on Biological Diversity (CBD), biological diversity or biodiversity is “the variability among living organisms from all sources including, inter alia, terrestrial, marine and other aquatic ecosystems and the ecological complexes of which they are part; this includes diversity within species, between species and of ecosystems” (CBD, 1992[1])
Biodiversity-related financial risks: Biodiversity-related financial risks (BRFR) are the sources of potential losses for financial actors associated to the deterioration of biodiversity. Such losses include the alteration of portfolios’ revenues or balance sheets or the adverse impacts of financial decisions. Building on Mark Carney’s initial classification of financial risks posed by climate change, this input has been adapted to address biodiversity. For this reason, BRFR tend to be classified into two types of risks:
• Physical risks: Sources of potential losses in production, service delivery and the financial position of a firm caused by direct shocks associated to biodiversity loss. These risks can either be chronic (e.g. droughts causing damages in agriculture), acute (e.g. diseases spreading due to alien species), or both (e.g. disruption of the hydrological cycle caused by deforestation) (NGFSINSPIRE, 2022[2])
• Transition risks: All factors that force market participants to adapt to a new reality, including policy changes, shifts in consumer or investor preferences, and technological developments While transition risks also serve environmental purposes, they present a challenge for different market participants, particularly investors who would have profited from economic activities which drive biodiversity loss. (See the section on Public policy for Biodiversity for more information on types of policy and regulations that can create transition risks). There exist, nonetheless, additional subset of risks related to BRFR). For example:
• Liability risks: The possibility of a market participant being held responsible for an action or inaction, resulting in a financial loss. Liability risks associated with biodiversity loss can materialise from the failure to prevent biodiversity loss or for the consequences of an action that leads to ecosystem damage (Barker, Mulholland and Temitope, 2020[3]) (see the Brief review of liability risk for further information).
• Reputational risks: Possible events or practices that can lead to the distrust and a negative perception of a company. Reputational risks can materialise through consumer boycott, stock market collapse or business stoppage (AFD, 2021[4])
Drivers and pressures of biodiversity loss: Drivers and pressures of biodiversity loss include all external factors that lead to the deterioration of biodiversity, which tend to be the result of human interventions/activities. IPBES has identified the following five main direct drivers of biodiversity loss (IPBES, 2019[5]):
• Changes in land and sea use: Includes conversion of land cover, changes in ecosystem management and changes in spatial configuration of a landscape (e.g. habitat fragmentation). It is mostly attributed to the increasing use of land for agriculture and the expansion of urban areas.
• Direct exploitation of organisms: Unsustainable use of nature for food and materials. For instance, excess fishing could lead to a scenario where the extraction of fish and shellfish is faster
8 | ASSESSING BIODIVERSITY-RELATED FINANCIAL RISKS
than the capacity of marine fauna to regenerate itself. Likewise, unsustainable forest management and deforestation over time lead to damages of natural resources
• Climate change: Rising global and ocean temperatures can cause shifts in species distribution (e.g. poleward and toward higher ground); disrupt species interaction and lead to mismatches in the timing of migration patterns, breeding cycles and food supply. Climate change also increases the frequency of extreme weather events such as floods and droughts, which can push ecosystems closer to thresholds and tipping points.
• Pollution: Harmful materials in the environment such as greenhouse gas emissions, excess nitrogen from agriculture run-off, oil spills and disposable plastics affect nature.
• Invasive alien species: The voluntary or accidental introduction of alien species into a natural environment where they are not normally found could lead to problems including the arrival of new pests and the elimination of native species to the point of extinction.
Ecosystems: Ecosystems refers to the dynamic complex of all living organisms (plant, animal, fungi and microorganism communities), and their non-living environment interacting as a functional unit (IPBES, 2019[5])
Ecosystem services: Ecosystem services are defined as the benefits people obtain from ecosystems, and have been categorised as provisioning, regulating, cultural and supporting services (Millenium Ecosystem Assessment, 2005[6])
Table 1. Ecosystem services and their classifications
Provisioning services
Regulating services
Cultural services
Supporting services
Definition
All tangible products extracted directly from ecosystems
The positive externalities of ecosystem processes in nature and the processes that moderate natural phenomena and make life possible
The non-material benefits of ecosystem that contribute to the social and intellectual development of societies
The benefits of several simultaneous processes taking place in nature, which maintain functional ecosystems
Examples
Ground water
Surface water
Genetic materials
Mass stabilization and erosion control
Climate regulation
Flood and storm protection
Source: Author’s creation based on (Millenium Ecosystem Assessment, 2005[6]).
Recreation
Aesthetic
Education
Photosynthesis
Soil formation
Nutrient cycle
Nature: As shown by IPBES, the definition of nature strictly depends on the context in which it is used (Dasgupta, 2021[7]) (IPBES, 2019[8]). Here, nature refers to all physical aspects of the natural world, biotic and abiotic, including the kingdom of species, the landscape and other features and products of the earth. Biodiversity relates to the living components of nature
Natural capital: Natural capital is defined as the stock of renewable and non-renewable natural resources that together provide benefits to people (Capitals Coalition, 2016[9]). The term is interchangeable with nature, but is used to emphasise that nature is an asset or capital stock (i.e., natural capital), like produced (physical) and human capital (OECD, 2021[10]). Natural capital provides goods and services contributing directly or indirectly to a country’s economic output as well as human well-being. Natural capital is the most important of all capital stocks, as it provides fundamental life-support functions. It sets the ecological boundaries for socio-economic systems.
| 9
BIODIVERSITY-RELATED FINANCIAL
ASSESSING
RISKS
Planetary Boundaries: The planetary boundaries are the quantifiable limits within which planet earth can safely tolerate drivers of change and pressures of loss (Rockström et al., 2009[11]). The framework has set the following nine planetary boundaries, whose control variables have changed over the years (Stockholm Resilience Centre, n.d.[12]):
• Stratospheric ozone depletion: The stratospheric ozone layer filters out ultraviolet radiation from the sun. The concentration of ozone-depleting chemical substances increases the levels of ultraviolet radiation, which will lead to the damage of biological systems. Studies indicate that humans are on a positive track within this boundary thanks to the adoption of the Montreal Protocol, which has inspired many international actions such as the regulation of ozone-depleting substances.
• Loss of biosphere integrity (biodiversity loss and extinctions): As discussed throughout the report, human actions have caused significant biodiversity loss, which will possibly lead to several tipping points. Owing to the complexity of biodiversity and Earth systems, uncertainty remains as to where planetary boundaries and many ecosystem tipping points are.
• Chemical pollution and the release of novel entities: The emission of organic pollutants, radioactive materials and heavy metals have potentially irreversible effects on ecosystems. Nonetheless, scientists are still unable to quantify a single chemical pollution boundary. Yet, the consequences of crossing earth system thresholds are enough reasons to define this aspect as a priority for the international agenda.
• Climate change: Current emissions of CO2 in the atmosphere indicate that the earth has already trespassed this planetary boundary. Questions remain about how long the earth can remain over this boundary before a major climate crisis.
• Ocean acidification: Pollutants such as the dissolved CO2 in the ocean have decreased the average pH of surface ocean water, leading to cascading problems such as biodiversity loss. CO2 is the controlling variable for both the climate change and the ocean acidification boundaries, illustrating how boundaries are interconnected.
• Freshwater consumption and the global hydrological cycle: Human actions have hindered the functioning and distribution of freshwater systems. Experts have proposed to set a water boundary to maintain the freshwater system’s resilience and avoid the risk of cascading consequences.
• Land system change: Forests, wetlands and other systems are converted for mostly economic reasons. Aggregated impacts of improper local system changes can disturb global processes. The global boundary for this dimension should reflect the quantity, function, quality, as well as spatial distribution of land system changes.
• Nitrogen and phosphorus flows to the biosphere and oceans: The cycles of nitrogen and phosphorus have been altered due to many industrial and agricultural processes.
• Atmospheric aerosol loading: Aerosols can alter the earth’s climate system; they alter cloud formation, as well as other patterns of regional circulation. However, the effect and behaviour of aerosols in the atmosphere is complex and many questions remain on the casual links between aerosols and natural phenomena. For this reason, their boundaries are not quantified yet.
Threshold: A threshold is defined as the point at which an ecosystem shifts from one state to another. It is difficult to identify all thresholds in all earth system processes. For instance, there is limited knowledge of the threshold of global and regional land use change; even though there is a consensus that sustained and disproportionate growth of built land will interrupt natural processes such as carbon cycles, it is unknown what is the exact maximum point before the system changes at a regional or global level (Rockström et al., 2009[11])
Tipping point: The point when any additional change can cause a large and irreversible alteration of a system. Every ecosystem can withstand disturbances up to certain threshold. However, once this threshold
10 | ASSESSING BIODIVERSITY-RELATED FINANCIAL RISKS
is passed, further disturbance can lead to non- linear and abrupt changes to the ecosystem. For instance, if the Amazon’s thresholds were crossed after extensive deforestation, there would be major irreversible alterations for local biodiversity. Considering that ecologic systems are interdependent from each other, when a particular tipping point is reached, it could be the beginning of tipping cascades. In other words, it could trigger the crossing of other critical thresholds (OECD, 2019[13]). Building on the Amazon’s example, crossing the rainforest’s deforestation thresholds implies irreversible changes in the ecosystem’s structure and function. This could not only lead to major alterations for local biodiversity, but also for global carbon cycles and regional precipitation patterns, which could alter other ecosystems.
| 11 ASSESSING BIODIVERSITY-RELATED FINANCIAL RISKS
Executive Summary
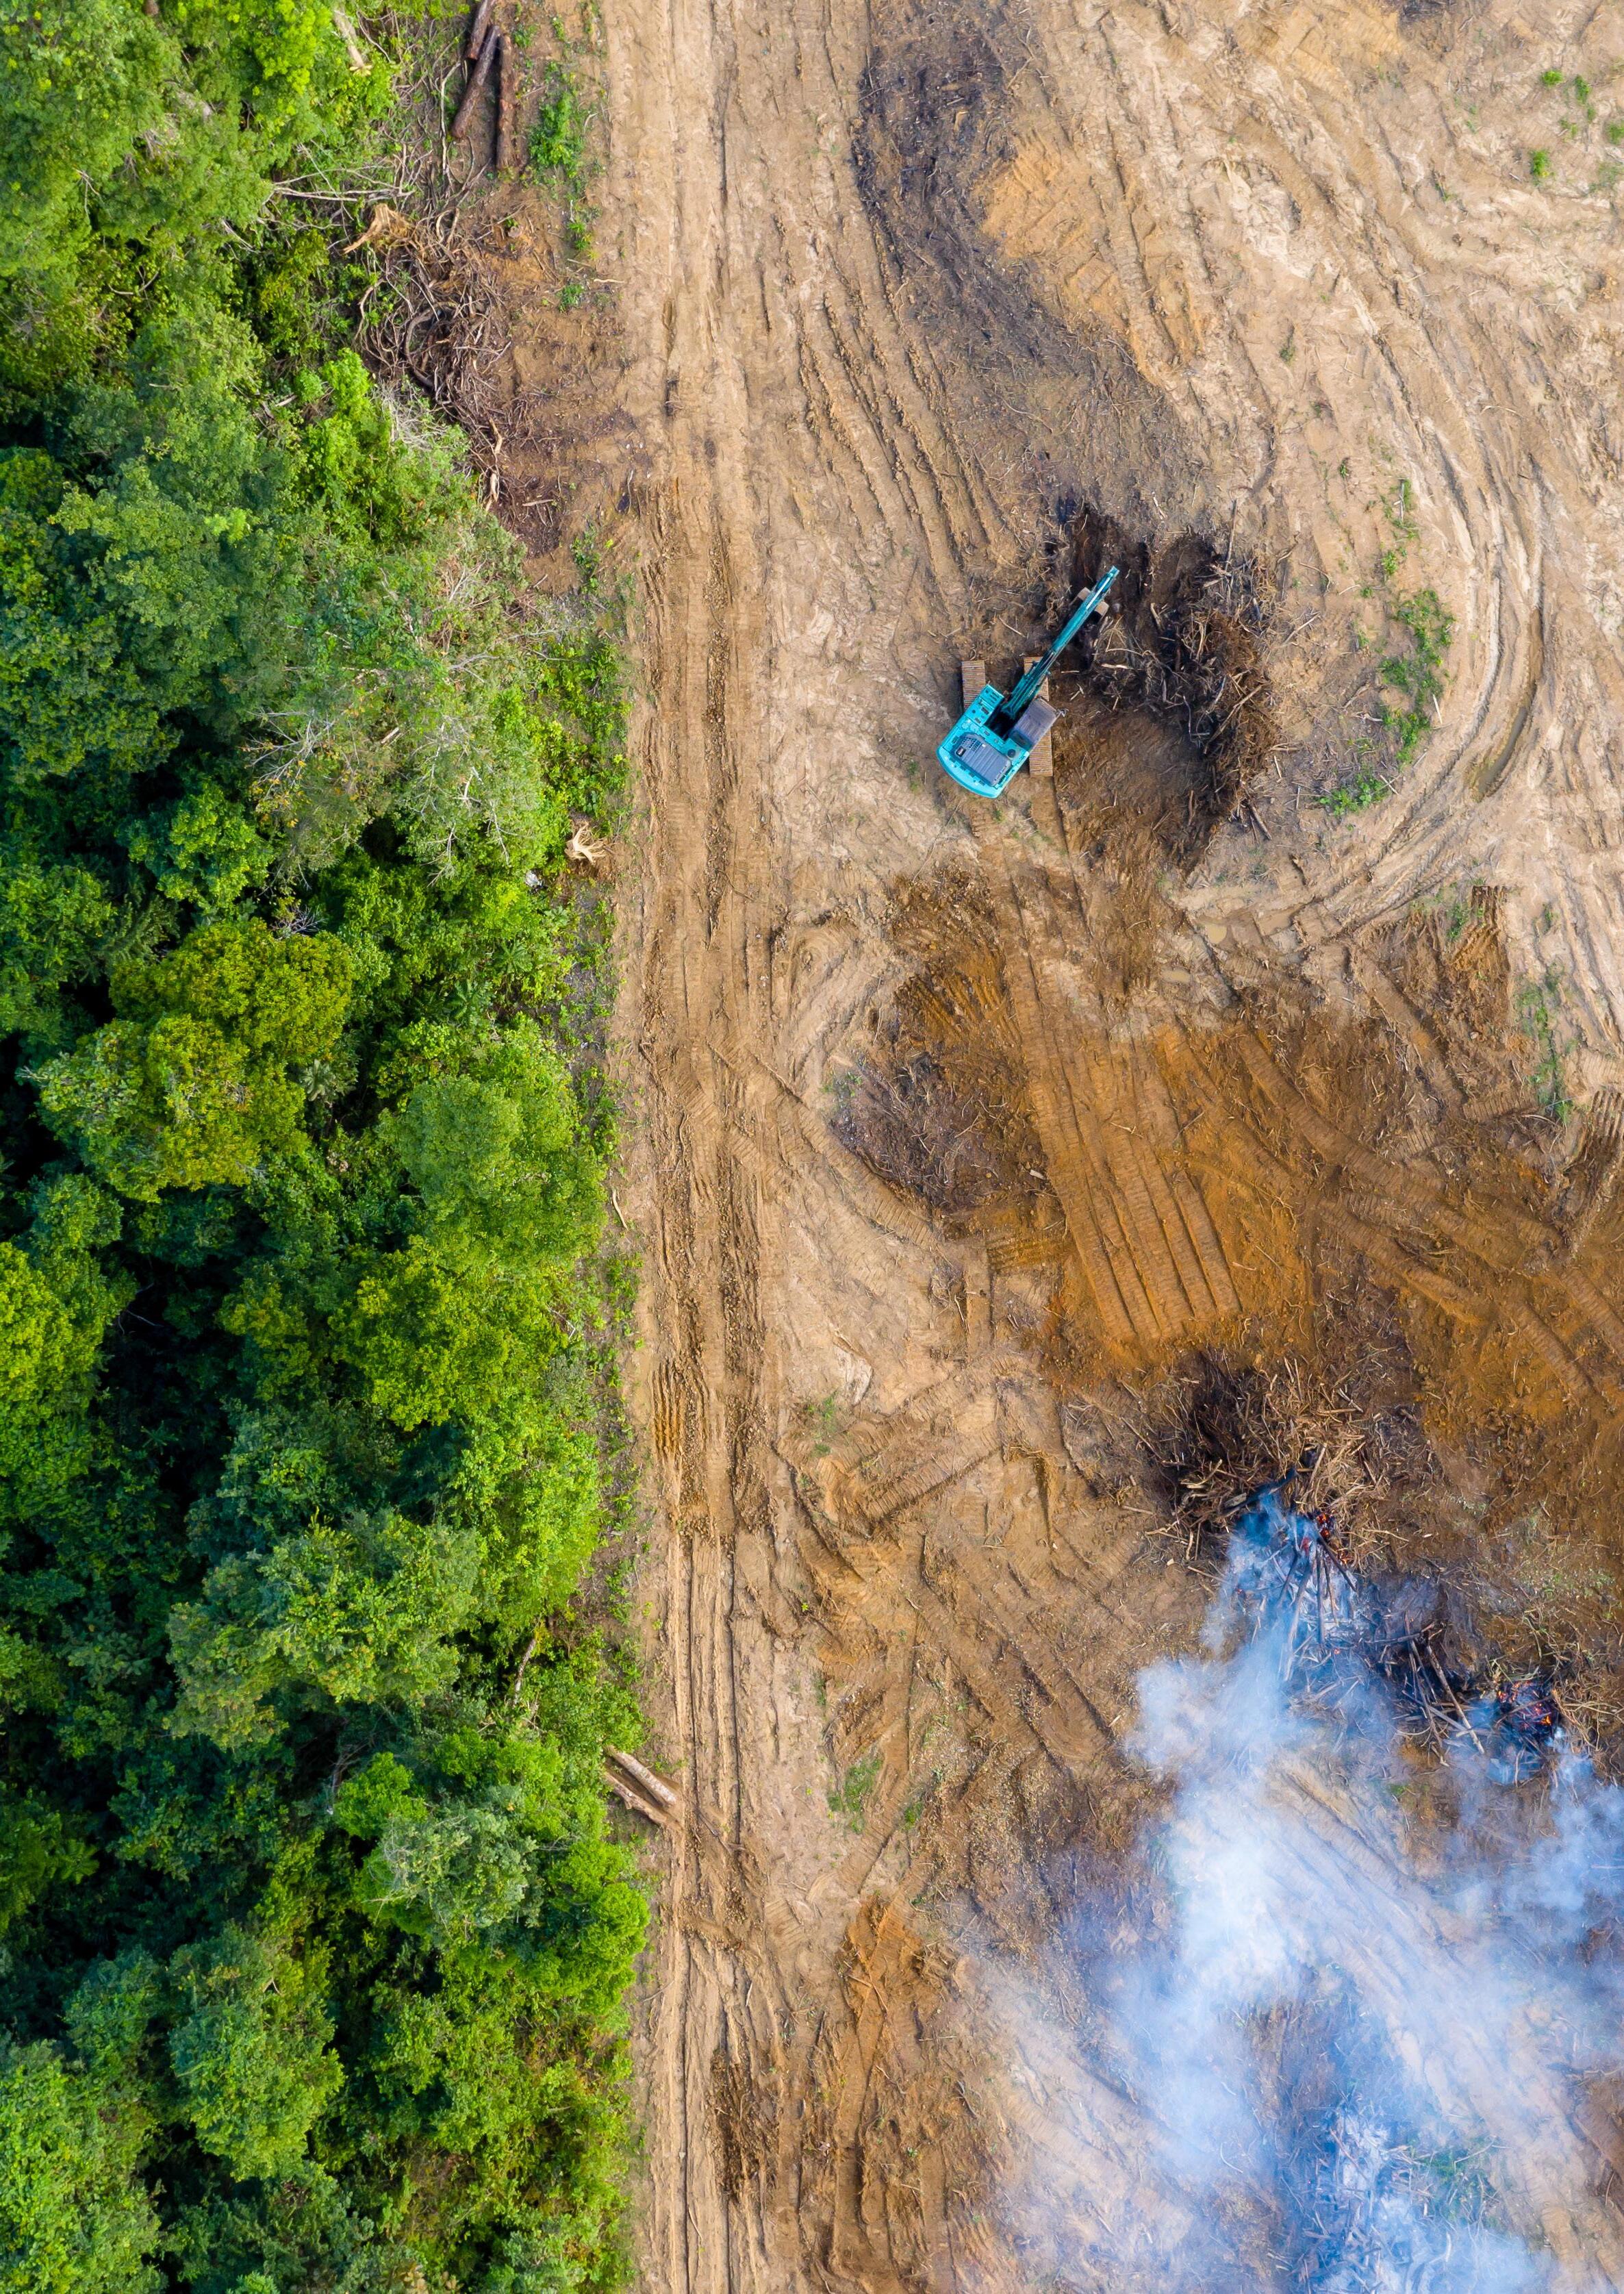
Biodiversity – the variety of life on Earth – plays a fundamental role for human well-being and economic activities through the provision of a range of ecosystem services, including food provisioning and clean water, flood protection, nutrient cycling and pollination. Yet humanity is destroying biodiversity at an unprecedented rate; species populations continue to decline globally, and many ecosystems are being degraded, raising concerns about the threat this poses to human well-being One example is represented by the almost 50 percent decline in natural ecosystems relative to their originally estimated state (IPBES, 2019[8])
In this context, an increasing number of policy makers, central banks, financial supervisors, market participants and other stakeholders are starting to recognise the risks biodiversity loss poses to economic activities and financial systems, with possible consequences for price and financial stability as well as society more broadly.
The transmission of biodiversity-related risks throughout the economy remains a complex issue. Models to analyse the economic and financial systems dependence on biodiversity and how these systems impact nature and biodiversity through its over-exploitation, are limited. Economic and financial impacts and dependencies on nature can lead to transition and physical risks for businesses. These risks can spread through different channels to eventually translate into credit, market, liquidity, operational and underwriting risks for financial institutions. For instance, more than 40 percent of securities of French financial institutions were highly or very highly dependent on ecosystem services in 2019, highlighting the connection of its financial system with biodiversity (Svartzman et al., 2021[14]). Moreover, the loss of biodiversity could be further compounded by its interdependency with climate change, the latter being a growing direct driver of biodiversity loss
Recognising the need for central banks and other financial actors to better understand and assess biodiversity-related financial risks, using models and measurement approaches to translate biodiversity loss into financial risk, the European Commission has launched in September 2022, together with the OECD and at the initiative of Magyar Nemzeti Bank (MNB), a new project on “Developing a Supervisory Framework for Financial Risks Stemming from Biodiversity-related Losses”.
The aim of the two-year project is to develop a supervisory framework for central banks and retail banks to assess biodiversity-related financial risks, impacts and dependencies, building on a mapping of existing and emerging approaches, practices, metrics, and tools to assess such risks. The OECD will then implement this conceptual framework to the Hungarian financial system and up to three banks with retail activities in Hungary, working in coordination with MNB and other Hungarian stakeholders.
This report intends to inform the conceptualisation of the methodological framework to translate biodiversity risks into financial risks. It explores existing and emerging definitions, key metrics and indicators, measurement approaches, and tools and practices for measuring biodiversity-related financial risks, impacts and dependencies in the financial sector. It is particularly timely in the context of the goals and targets for 2030 adopted under the Kunming-Montreal Global Biodiversity Framework (GBF) in December 2022 during the 15th Conference of the Parties (COP15) of the Convention on Biological Diversity (CBD). In particular, Target 15 calls on governments to take measures “to encourage and enable business, and in particular to ensure that large and transnational companies and financial institutions [to] regularly monitor, assess and transparently disclose their risks, dependencies and impacts on biodiversity.
Section 1 analyses the rationale for assessing biodiversity-related financial risks. It identifies recent studies on biodiversity-related financial risks and emerging methodologies from different stakeholders, including central banks, analysing the extent to which biodiversity is connected to the economic system.
12 | ASSESSING BIODIVERSITY-RELATED FINANCIAL RISKS
The section delves deeper to explain the transmission mechanisms through which biodiversity losses can translate to the economic and financial system due to physical or transition risks, as well as other derived risks such as liability risk. The section also explores the interconnectedness of biodiversity with climate change, highlighting how climate change is one of the primary drivers of biodiversity loss and is expected to become an even stronger driver in future, which could lead to compounding risk effects, depending on the future pathways for climate change and biodiversity loss
Section 2 provides a mapping of existing approaches to measure biodiversity-related financial risks. The chapter comprises three main sub-sections focusing on (i) data, metrics, and indicators, which provides information on primary, secondary and modelled biodiversity data and databases; (ii) measurement approaches and approaches to translate exposure into risk, which explores how existing biodiversity data is being modelled and how companies’ exposure can be translated into risk; (iii) public policies for biodiversity, highlighting governments’ currently adopted policies for biodiversity as well as providing a review of liability risks. The section identifies how biodiversity data and metrics can come from a variety of sources and can be quantitative, qualitative or spatial. High quality data and metrics on biodiversity can enable policymakers, central banks and supervisors to measure the extent of the impact of biodiversity loss on the economic and financial system.
Section 3 provides an overview of outstanding gaps and challenges to measure biodiversity-related financial risks, highlighting the complexity surrounding the translation of biodiversity risks into risks to financial markets and institutions. In addition to general challenges related to biodiversity, there are limitations with existing data, metrics and indicators to measure biodiversity-related impacts and dependencies, as well as broader gaps to translate biodiversity impacts and dependencies into risks, through biodiversity modelling, scenarios and risk approaches. Outstanding gaps to assess biodiversityrelated financial risks however should not discourage financial actors, as this is an emerging area that is likely to evolve fast both in terms of expectations as well as new research, modelling and scenarios being developed to assess biodiversity-related financial risks. Any conceptual framework to assess such risks will likely need to rely on a diversity of approaches – whether micro- and macro-level, forward-looking and based on existing data – and provide careful guidance to central banks and retail banks on prioritisation process, to navigate the complex landscape of biodiversity and nature. In terms of next steps, the OECD will develop new analysis and coordinate closely with researchers to help navigate biodiversity data, metrics, tools, models and approaches to inform the creation of a methodological framework to translate biodiversity risks to financial risks. The OECD aims to publish an initial methodological framework for central and retail banks to assess biodiversity-related financial risks by the Fall 2023.
| 13
BIODIVERSITY-RELATED
ASSESSING
FINANCIAL RISKS
1 Overview of biodiversity-related financial risks
The rationale for assessing biodiversity-related financial risks
Biodiversity – the variety of life on Earth – includes the biological diversity within species, as well as between species and ecosystems (CBD, 1992[1]). Biodiversity plays a fundamental role for human wellbeing and economic activities through the provision of a range of ecosystem services, including the provision of food and clean water, but also largely invisible services such as flood protection, nutrient cycling, water filtration and pollination (OECD, 2021[15])
Despite its importance, global biodiversity loss continues at an unprecedented rate 1, owing to land and sea use change, over-exploitation of natural resources, climate change, pollution and invasive alien species (IPBES, 2019[5]) Biodiversity is declining across all three of its dimensions: species, ecosystems and genetic diversity. The current rate of species extinction is estimated to be around tens to hundreds of times higher than the natural, pre-human background rate, and it is accelerating. Twenty-five percent of remaining plant and animal species are threatened with extinction, many in the coming decades (IPBES, 2019[5]). Diversity within species is also declining, further undermining nature’s ability to adapt to climate change, disease and other disturbances and compromising evolutionary processes. And many of the world’s terrestrial, freshwater and marine ecosystems have been destroyed or degraded. Humans have significantly altered 75 percent of land cover and 66 percent of the ocean is subject to increasing cumulative impacts
The global decline in biodiversity is compromising ecosystem services. For instance, the IPBES Global Assessment (IPBES, 2019[8]) finds that 14 out of 18 assessed categories of ecosystem services have declined since 1970. Biodiversity loss and climate change are closely interlinked and perceived by business leaders and policymakers as one of the top global risks to society (WEF, 2023[16])
The loss of biodiversity and ecosystem services pose significant macroeconomic and financial risks and could result in economic shocks (NGFS - INSPIRE, 2022[2]) (Dasgupta, 2021[7]) In recent years, economic and financial actors have started to explore and understand whether a link exists between such losses and financial risks to economic activities and the financial system (Svartzman et al., 2021[14]) (The World Bank Group, 2021[17]). For this reason, recent studies have assessed whether biodiversity loss might be connected through transmission channels with the economic and financial system, and the extent to which losses can affect society. Initial studies have attempted to link biodiversity loss to the associated economic impact, with results indicating over a 20 percent GDP loss for some countries (The World Bank Group, 2021[17]), but these results come with limitations. However, the risk to the financial system remains relatively unexplored since biodiversity-related financial risks (BRFR) are pervasive but poorly understood and remain largely unpriced
1 In Hungary, for instance, the Natural Capital Index is 9.9 percent, meaning that 90 percent of ecosystem services have already been depleted (Czúcz, 2008[99]).
14 | ASSESSING BIODIVERSITY-RELATED FINANCIAL RISKS
Central banks and supervisors recognise the financial risks stemming from the loss of biodiversity and ecosystem services (NGFS, 2022[18]). These risks can result in higher costs and risks for corporates and financial institutions, and directly affect their financial performance, with implications in terms of financial stability and even price stability (NGFS - INSPIRE, 2022[2]). For example, recent analysis from De Nederlandsche Bank (DNB) and Banque de France (BdF) have assessed biodiversity-related impacts and dependencies of the financial sector (See Box 1) (DNB, 2020[19]) (Svartzman et al., 2021[14]).
As discussed below, corporations depend on biodiversity and ecosystem services to produce goods and services, which creates financial-related risks through various transmission channels (Svartzman et al., 2021[14]). In addition, corporate activities have significant adverse impacts on biodiversity (IPBES, 2016[20]).
The rising awareness from central banks and financial market participants on the need to better understand and assess biodiversity and broader nature-related financial risks is in part thanks to: G7 work in support for action on biodiversity and nature (OECD, 2019[13]) (WWF France & AXA, 2019[21]); the impact of the Dasgupta Review that called for changes “in how we think, act and measure economic success to protect and enhance our prosperity and the natural world” (Dasgupta, 2021[7]) momentum from the Network of Central Banks and Supervisors for Greening the Financial System (NGFS) and the joint NGFS-INSPIRE study group to gather commitments from central banks and supervisors to better assess biodiversityrelated financial risks, and with their report on biodiversity loss and the relevance for central banks (NGFS - INSPIRE, 2022[2]); and industry-led initiatives, including the Taskforce on Nature-related Financial Disclosures (TNFD). Furthermore, private sector participants have started to assess the value of nature, the global risks from the loss of natural capital, as well as the impacts and dependencies of economic activities (McKinsey & Company, 2020[22]) (BCG, 2021[23]).
In this context, the European Commission has launched, together with the OECD, and at the initiative of the central bank of Hungary, Magyar Nemzeti Bank (MNB), a new project on “Developing a Supervisory Framework for Financial Risks Stemming from Biodiversity-related Losses”. The aim of the two-year project is twofold:
1. During a first phase, to map and conceptualise a supervisory framework for central banks and retail banks to assess biodiversity risks in the financial system; and
2. During a second phase, to implement this framework to the Hungarian financial sector, working in co-operation with the MNB and up to three commercial banks with retail activities in Hungary. The objective of the project, carried out with funding by the European Union via the Technical Support Instrument and in cooperation with the European Commission's Directorate General for Structural Reform Support (DG REFORM), is to support Hungary in their efforts to implement reforms, which could encourage investment, increase competitiveness, and assist in achieving sustainable economic and social convergence, resilience, and recovery.
As part of the first phase of the project, this mapping report consists of a literature review to create a comprehensive catalogue of existing and emerging definitions, key metrics and indicators, measurement approaches, tools and practices for measuring biodiversity-related financial risks from relevant actors, supervisory authorities and central banks. The OECD will then publish by summer 2023 a second report presenting the conceptualisation of a methodological framework to translate biodiversity risks to financial risks and analyse biodiversity-related financial risks, impacts and dependencies in the financial system, including the designing of the associated tool to implement the methodological framework, constructed with a view in mind for broad applicability. During the second phase of the Project, the OECD will implement the framework to the Hungarian financial system, working in cooperation with DG REFORM, MNB and other key public and private stakeholders.
An emerging work area requiring co-operation with key stakeholders
Central banks around the world have started to consider the extent to which biodiversity risks could pose a threat to financial stability. Among the front runners, De Nederlandsche Bank (DNB), Banque de France (BdF), Banco Central do Brasil and the Bank Negara Malaysia (BNM) (with the World Bank), have taken
| 15 ASSESSING BIODIVERSITY-RELATED FINANCIAL RISKS
steps to explore biodiversity risks in their respective jurisdictions, conducting financial and economic stability assessments (Box 1):
De Nederlandsche Bank was the first central bank to quantify the extent to which the financial institutions it oversees are exposed to risks from biodiversity loss (DNB, 2020[19]).
In 2021, Banque de France followed suit with an assessment of impacts and dependencies of ecosystem services in the French financial system, by looking at financial institutions (Svartzman et al., 2021[14]) Also in 2021, Banco Central do Brasil, jointly with the World Bank, published an assessment of financial sector exposure to the loss of biodiversity. As Brazil is a megadiverse country that hosts almost 20 percent of the world’s biodiversity, the research noted the importance of looking at transmission channels given the key role of local banks in Brazil’s economy, accounting for two-thirds of total financial system assets (Calice, Kalan and Miguel, 2021[24])
In 2022, Bank Negara Malaysia worked with the World Bank to explore nature-related financial risks in Malaysia (World Bank; Bank Negara Malaysia (BNM), 2022[25])
In addition, two international initiatives are building momentum for improved assessment, reporting and management of biodiversity-related financial risks, impacts, dependencies and opportunities. The OECD is closely collaborating with both initiatives to ensure synergies and avoid overlaps:
• The Network of Central Banks and Supervisors for Greening the Financial System (NGFS) has acknowledged that nature-related risks could have significant macroeconomic and financial implications, and subsequently has established a Taskforce on Biodiversity Loss and Naturerelated Risks to which OECD actively contributes as an observer (NGFS, 2022[18]). The NGFS has also collaborated with the International Network for Sustainable Financial Policy Insights, Research, and Exchange (INSPIRE) to publish, under the NGFS-INSPIRE Study Group on Biodiversity and Financial Stability, a report that analyses the role that central banks and supervisors need to play with regard to the financial and economic risks stemming from biodiversity loss, and includes a detailed overview of current central bank efforts on biodiversity (NGFSINSPIRE, 2022[2])
• The Taskforce on Nature-related Financial Disclosures (TNFD), of which the OECD contributes as knowledge partner, seeks to develop and deliver a risk management and disclosure framework for organisations to report and act on evolving nature-related risks and opportunities, with the ultimate aim of supporting a shift in global financial flows away from nature-negative outcomes and toward nature-positive outcomes (Box 3).
From biodiversity to financial systems and vice versa: Impacts, dependencies, and transmission channels
The loss of biodiversity and ecosystem services creates direct risks for individual corporations and financial institutions and also constitutes an indirect systemic threat, which may propagate through economic spheres, to the financial sector. As discussed, biodiversity loss is a recent concern for financial institutions, intermediaries, regulators, and supervisors. Considering this and given the high level of complexity of the subject, it is crucial to assess how all the possible sources of risk, may influence macro- and microeconomic structures and their complex interactions with biodiversity on the one hand and the financial system on the other.
The complex connection between biodiversity loss and financial sector is indirect and can be described as a two-way system, where dependencies and impacts on biodiversity and ecosystem services can be identified. This involves a deeper understanding of the linkages between financial materiality and environmental impacts. On one side, through their lending, investing and insuring activities, the financial
16 | ASSESSING BIODIVERSITY-RELATED FINANCIAL RISKS
institutions depend indirectly on ecosystem services, and reduced availability of ecosystem services is a source of physical risk for financial institutions. This implies that changes in biodiversity and ecosystem services may impact the financial domain through underlying economic activities. The loss of biodiversity and ecosystem services can threaten the production processes of companies, and this can lead to a deterioration of their financial position, both in the short and medium to long term (DNB, 2020[19]). On the other hand, financial activities may indirectly impact biodiversity and impacts on ecosystem services and biodiversity can lead to transition and reputational risks for financial institutions. New biodiversity-relevant government policies (with implications for transition risk) or changing consumer preferences (with implications for reputational risk), may induce companies with a high impact on ecosystem services to make their business processes more sustainable (see Error! Reference source not found.). This may also have an impact on financial institutions that invest in these companies that are exposed to transition risk. For example, financial institutions that invest in companies with a negative impact on ecosystem services might face a greater reputational risk. Moreover, these companies risk having to adapt, and thus increasing the exposure to transition risk, to government measures and technological developments that aim to reduce damage to biodiversity and ecosystems services
Figure 1. Ecosystem services and the materialisation of biodiversity loss risks for the economy
BIODIVERSITY AND ECOSYSTEM SERVICES
Impacts ( drivers of change)
Transi�on Risk Responses to impacts (e g regula�on , li�ga�on , shi�ing consumer preferences)
• Opera�onal costs associated with decline of biodiversity /ecosystem services
• Reloca�on and adjustment of ac�vi�es


• Pricing externali�es
Source: OECD elaboration from NGFS-INSPIRE, 2022.
Liability Risk Liability for ecosystem impacts (e g lawsuits from harmed communi�es, fines from regulators)
ECONOMY
Physical Risks
Dependencies (e g pollina�on, food provisioning, erosion control)
• Capital destruc�on
• More vola�le row material prices
Dependencies ( losing ecosystem services )
• Disrup�on of produc�on processes and value chains
• Stranded assets
Biodiversity loss can translate to the financial system, via the real economy, through either physical or transition risks, as well as other derived risks such as liability risk. These risk types do co-exist and may reinforce one another during materialisation (NGFS - INSPIRE, 2022[2]) These can be considered exposures to the physical impacts of environmental degradation, including biodiversity loss, to the transition to a lower-carbon economy and to litigation and reputational risks. Physical risk sources represent the degradation of ecosystem services on which economic actors depend and can be either chronic or acute (WEF, 2020[26]). Transition risks stem from the speed at which stakeholders are shifting to a more nature-aligned system. These risks can be considered strictly interconnected, as increased physical risk can lead to more stringent government policies, which could in turn lead to transition risks. Similarly, the inaction regarding transitioning to a nature aligned system would increase the risk of physical calamities in the longer term.
| 17 ASSESSING BIODIVERSITY-RELATED FINANCIAL RISKS
For financial institutions, risks from biodiversity and ecosystem impacts and dependencies translate into financial risks, like credit, market, and operational risks. Initially, the transition to higher levels of biodiversity protection may increase the likelihood of loan defaults and devaluation of investments in companies with production processes that negatively impact biodiversity. On the one hand, both the degradation of biodiversity and the higher level of protection (e.g. more protected area that cannot be exploited anymore from economic activities) can hurt specific companies reliant on nature. On the other, the negative impact of companies on biodiversity can cause credit deterioration, as well as higher capital charges due to factors such as fines against companies due to pollution. Then, dependencies on biodiversity and ecosystem services can jeopardise business continuity, reducing the value of the company, damaging its ability to generate profits due to higher costs, and reduce its ability repay debts due to higher borrowing costs. This means that both effects can affect cash-flows, leverage ratios, value-at-risk and probability of default, among others. Therefore, as an indirect effect, the loss of biodiversity leads to increased market and credit risk for financial institutions.
Box 1. Selected key findings on the dependencies of economic sectors and the financial system on biodiversity
Several studies have quantitatively analysed the dependencies of the financial system on ecosystem services and biodiversity (see also Box 3, Box 4 and Box 5). Below are two of the European case studies that provide numerical results in this regard.
Indebted to nature: Exploring biodiversity risks for the Dutch financial sector (De Nederlandsche Bank, DNB)
The Dutch central bank reports that:
1. Dutch financial institutions financed companies that are highly or very highly dependent on one or more ecosystem services for EUR 510 billion.
2. EUR 28 billion is the total exposure of the financial sector to products that depend on pollination.
3. With respect to the liability risk, EUR 96 billion is the amount of investments in, or loans to, companies involved in environmental controversies with negative consequences for ecosystem services or biodiversity.
4. The reputational risk results in a total exposure of EUR 97 billion to businesses with a very high exposure to this kind of risk, from products or activities related to deforestation.
5. Moreover, about transition risk, financial institutions have an exposure of EUR 28 billion to companies operating in areas that are protected or that might come under protection, impacting on the risk profile of these companies.
Source: Van Toor, J., Piljic, D., Schellekens, G., van Oorschot, M., & Kok, M. (2020). Indebted to nature Exploring biodiversity risks for the Dutch financial sector. De Nederlandsche Bank (DNB) and Planbureau voor de Leefomgeving (PBL). https://www.pbl.nl/en/publications/indebted-to-nature
A “Silent Spring” for the Financial System? Exploring Biodiversity-Related Financial Risks in France sector (Banque de France, BdF)
The Bank of France’s paper shows the following main results:
1. 42 percent of the value of securities held by French financial institutions comes from issuers that are highly or very highly dependent on at least one of the 21 ecosystem services considered in this paper The securities held by French financial institutions in 2019 produce an
18 | ASSESSING BIODIVERSITY-RELATED FINANCIAL RISKS
accumulated terrestrial biodiversity footprint that is comparable to the loss of at least 130,000km² of unspoilt nature, corresponding to the 24 percent of the area of metropolitan France. The annual additional impact on biodiversity is equivalent to the loss of an area equal to 48 times the area of Paris.
2. Concerning the freshwater biodiversity footprint of French financial institutions, the accumulated (or static) footprint is comparable with the loss of 9,595km² of unspoilt nature (1.7 percent of the area of metropolitan France), while the additional (dynamic) footprint each year can be compared to the loss of 92km² of ‘intact’ ecosystems (around the surface area of Paris).
Source: Svartzman, Romain and Espagne, Etienne and Julien, Gauthey and Paul, Hadji-Lazaro and Mathilde, Salin and Allen, Thomas and Berger, Joshua and Calas, Julien and Godin, Antoine and Godin, Antoine and Vallier, Antoine, A 'Silent Spring' for the Financial System? Exploring Biodiversity-Related Financial Risks in France (August 2021). Banque de France Working Paper No. 826, Available at SSRN: https://ssrn.com/abstract=4028442 or http://dx.doi.org/10.2139/ssrn.4028442
Biodiversity
Source: OECD illustration.
Notes: Value chain dependencies refers to economic activities which will be indirectly affected by biodiversity-related risks due to the dependencies along their value chain. Substitution refers to the ability to substitute natural capital in response to biodiversity loss.
The Climate-Biodiversity Nexus
Climate change and biodiversity loss are interlinked and mutually compounding challenges. Climate change is one of the five key drivers of biodiversity loss and is expected to become a stronger driver in future (IPBES, 2022[27]; Pörtner, 2021[28]). Conversely, protecting and restoring biodiversity, including ecosystems such as forests and wetlands, can mitigate some of the impacts from climate change and build societal resilience to climate impacts (Pörtner, 2021[28]). The climate-biodiversity interaction may lead to compounding or alleviating risk effects, depending on the future pathways for climate change and biodiversity loss (NGFS - INSPIRE, 2022[2]). Therefore, to comprehensively capture potential financial

| 19
ASSESSING BIODIVERSITY-RELATED FINANCIAL RISKS
Figure 2. Transmission channels for biodiversity risks
Transition risk Government policies • Technological development • Sentiment Physical risk Acute • Chronic Microeconomic (direct effects) Macroeconomic (indirect effects) Key Sectors Sovereign institutions Corporates Households Credit and equity Sovereign institutions Corporates Households Credit and equity Banks Asset managers Insurance Credit risk Central banks and financial regulators Price stability Financial stability Natural system Economic system Financial system Liability risk • Regulatory and legal • Reputational Sovereign risk / credit risk Commodities Geopolitics FX rates Value chain dependencies Market risk Liquidity risk Operational risk Underwriting risk
risks, both environmental risks need to be considered concurrently within modelling approaches. However, there are some differences in the risk characteristics of each type of environmental risk, which impacts the trade-offs in modelling approach used. For example, biodiversity loss occurs on a more localised scale, with differing impacts depending on the location and ecosystem affected.
The differing risk characteristics present challenges to an integrated modelling approach for climate change and biodiversity loss. The NGFS have modelled exploratory transition scenarios for climate risk, using integrated assessment models (IAMs). These scenarios project possible futures over a long-time horizon (until 2100), with a focus on the direct impacts, and adopt a global context (NGFS, 2022[29]) The differing risk characteristics between climate and biodiversity loss, leads to a trade- off between integration of modelling between the two environmental risks, and appropriateness of models to capture each of the risks.
Table 2. Characteristics of Climate and Biodiversity
Differences and similarities in Climate Change and Biodiversity Loss Risk Characteristics for Modelling
Details
Physical Risk GHG Atmospheric Concentration
Multiple Indicators GHG atmospheric concentration can be used to assess the physical risks from climate change. Biodiversity loss physical risk requires a broader range of indicators.
Transition Risk Carbon Price Multiple Indicators A carbon price can be used as a proxy for transition risks. No single metric currently exists to capture biodiversity-related transition risks.
Direct Impacts Sector Impacts, Global Sector Impacts, Dependencies, & location contextual
For both, transition risk direct impacts depend on sectoral activity impacts, with a greater degree of attributability for biodiversity impacts. For physical risks, direct climate impacts are global, with regional differences. Whereas direct impacts from biodiversity loss are limited to sectors with a direct interface with biodiversity and are location contextual.
Indirect Impacts Yes
Yes Both have indirect impacts, which will transmit through value chains. However, these may be more important for biodiversity loss because of the intersectoral differences in physical impacts.
Time Horizon Short and Long Time Horizon Short and Long Time Horizon Acute physical and transition risks may materialise in the short-term. More chronic risks will likely materialise over a longer time horizon.
Tipping Points Yes
Yes Both have tipping points, which potentially systemic consequences. The tipping points for biodiversity are less certain and it is difficult to identify their thresholds.
Note: This is a non-exhaustive list of relevant characteristics comparison for modelling socio-economic risks.
Source: Compiled by Authors. (NGFS - INSPIRE, 2022[2]) (IPBES, 2019[8]) (IPBES-IPCC, 2021[30])
In addition to climate and biodiversity as own risk categories, biodiversity loss can exacerbate climaterelated risks. As nature can mediate the impacts of climate hazards, nature-related data could in future feed into climate risk models to inform on assets’ vulnerability to climate hazards. For example, insurance-
20 | ASSESSING BIODIVERSITY-RELATED FINANCIAL
RISKS
Climate Change Biodiversity Loss
Risk Characteristics
related research showed that coastal wetlands reduced storm surge-related property damages in the northeast US by 20 percent on average during Superstorm Sandy (Colgan, M.W Beck and S. Narayan, 2017[31]). Consequently, nature-related data that is now being explored to model biodiversity risks could in future also inform climate-related risk modelling. Further climate risk scenarios that get exacerbated by biodiversity loss include river flooding and freshwater scarcity risks. However, currently no coherent assessment methodology exists to understand the impact of biodiversity loss on those environmental risks. The interlinkages between climate change, biodiversity loss, and wider nature-related losses, highlights the need to consider these risks concurrently, due to their potentially exacerbating and reinforcing nature.
| 21
ASSESSING BIODIVERSITY-RELATED FINANCIAL RISKS
2 Mapping of existing approaches to measure biodiversity-related
financial risks, impacts and dependencies
Although measurement of biodiversity-related financial risks is in its infancy, emerging metrics and indicators for assessing biodiversity-related impacts and dependencies in the financial system are growing in quantity and quality. Despite limitations, a wide range of data on biodiversity is available, which can be used to inform financial actors and supervisors.
The report is structured in three sections, which intend to outline a comprehensive catalogue of existing and emerging key metrics and indicators, measurement approaches, tools and practices for measuring biodiversity-related financial risks from relevant actors, supervisory authorities and central banks:
• The first section of this second chapter focuses on biodiversity data, metrics and indicators, outlining primary, secondary and modelled data, in order to provide a clear understanding of what type of data is collected and what constitutes the basis of measurement approaches. In this case, modelled data is often the result of a measurement approach, which is outlined in the second section. The databases mapped here focus specifically on primary biodiversity data.
• The second section builds on the first one, outlining the measurement approaches, as well as models, scenarios and risk approaches. In this case, some measurement approaches can also be considered databases, as they provide a range of modelled metrics created through their own models.
• Finally, the third section highlights existing challenges and gaps in seeking to translate biodiversity loss into financial risks, summarises the findings of the report and outlines the next steps.
As shown in Figure 3, primary biodiversity data, jointly with financial data, is generally modelled using measurement approaches, to then provide biodiversity metrics and indicators. These metrics and indicators can be re-modelled to then be used to assess economic and financial risks through models and scenarios.
22 | ASSESSING BIODIVERSITY-RELATED FINANCIAL RISKS
Overview of biodiversity data, metrics and indicators
As a growing number of central banks and supervisors are interested in understanding biodiversity related financial risks and given the reliance of measurement approaches on a combination of data collection, measurement and valuation techniques, credible metrics and indicators to measure impacts and dependencies have become fundamental to provide a clear assessment of biodiversity related risks. A clear distinction of data, metrics, and indicators, is essential to better understand this section:
• Data: Facts and statistics collected for reference and analysis;
• Metrics: Figures or statistics that measure results; and
• Indicator: A measure that indicates the state or level of a system.
Biodiversity data and metrics come from a variety of sources and can be quantitative, qualitative or spatial. They can also range from primary collected and observed data, which includes for example site level data collected through sampling, and secondary data, such as published and peer-reviewed data, to modelled data, which is derived using modelling techniques that can be based on primary and secondary data (Lammerant, 2021[32]).
Data and metrics on biodiversity can enable policymakers, central banks and supervisors to measure the impact of biodiversity loss on the economic and financial system, as well as to understand possible consequences of policies actions to tackle the issue and tracking the outcomes of enabled policies. While biodiversity data and metrics can be complex due to the multi-dimensionality of biodiversity and the difficulty in measuring biodiversity loss can be summarised to two main components: species and ecosystems. Species include the diversity of different species, therefore genetic diversity, as well as the richness of the populations. Ecosystems represent the dynamic complex of all living organisms and their non-living environment interacting as one.
While these metrics are essential to understand the state of biodiversity, it is also important to consider the benefits biodiversity provides to people through ecosystem services. Metrics and data related to biodiversity generally simplify its complexity, making it important to consider the challenges and limitations
| 23 ASSESSING BIODIVERSITY-RELATED FINANCIAL RISKS
Figure 3. Summary of data, metrics and indicators related to the biodiversity loss-financial risk nexus
Source: OECD illustration.
Impacts and dependencies ENCORE BIA-GBS Globio IBAT Corporate Biodiversity Footprint EORA MRIO Value Chain Footprinting Others Measurement approaches Credit Market Liquidity Operational Underwriting Risk approaches and economic valuations MSA PDF STAR Others Scenarios Macro Micro Integrated assessment models AIM GCAM MESSAGE REMIND Ecosystem service models Earth-Economy Model SEEA EA Handbook for Naturerelated Financial Risks TNFD LEAP FI Approach Exploratory Policy screening Target-seeking Policy-review Data Biodiversity Financial Species Land use Ecosystems Others Revenues Profitability Leverage Others Financial risks Others Metrics and indicators
of the chosen approaches and to decide whether the chosen ones are fit for purpose, including trough translation in financial risks as well as scalability of frameworks.
Box 2. Integrating biodiversity into financial markets instruments
Biodiversity loss is already affecting and is likely to increasingly affect, finances and credit ratings around the world. Recently, several research institutes and even rating agencies and data providers have begun to pay attention to the phenomenon of biodiversity loss. The micro and macroeconomic consequences of biodiversity loss can impact sovereign, financial, and corporate creditworthiness simultaneously. So far, the methodologies applied by leading credit rating agencies (CRAs) to assess the different level of risks do not adequately incorporate biodiversity and nature-related risks. The lack of these kind of risks can undermine market and financial stability. As environmental pressures intensify, the gap between the information conveyed by ratings and real-world risk exposure may grow 2
Rating agencies, data providers and research centres are however beginning to highlight the possible risks and economic and financial damage resulting from the loss of biodiversity and ecosystem services. In a recent report (June 2021), Moody’s estimates that about USD 2.1 trillion of rated debt is highly exposed to impacts or dependencies on natural capital in 12 sectors, including all extractive industries such as mining. Debt of USD 8.3 trillion is currently moderately (not considering a possible increase in transition risk) exposed to natural capital risk in 16 sectors, which include construction, retail and apparel. In the report, Moody’s considers the impact and dependence of an issuer on natural capital as a primary source of risk. Furthermore, according to the authors, investor preferences on the one hand and new policies for a more sustainable economy on the other will result in increased reputational risks, as companies that are deemed to contribute to biodiversity loss may suffer the backlash.
Financial data providers have also begun to emphasise the importance of data concerning biodiversity and ecosystem services. MSCI reported that 39 percent of MSCI ACWI Index constituents had assets in biodiversity-sensitive areas, with metals and mining companies representing a high share of assets in sensitive areas with limited practices to manage these risks. This led MSCI to introduce within its environmental metrics, two metrics concerning natural capital and in particular biodiversity and land use, based on an index taking into account two factors: Management Score and Exposure Score related to biodiversity. During COP15, MSCI also introduced two screeners to identify issuers connected to deforestation and issuers in certain industries with operations in sensitive areas from a biodiversity standpoint Also, other ESG providers have also begun to pay attention to biodiversity, emphasising the need to define metrics suitable for measuring impacts and dependencies on ecosystem services. As example, Robeco Asset Management is in the process of establishing its own biodiversity policy by 2023, with the aim to define new approach to biodiversity towards the integration of nature-related risks, opportunities, and impacts 3 ShareAction, in its new report of November 2022, provides overview of sustainability benchmarks and rankings with information relevant to biodiversity, ranking companies and financial institutions based on environmental sustainability and biodiversity impacts.
In terms of financial instruments, we are seeing an increasing flow of investments towards instruments that aim at environmental sustainability and biodiversity. Biodiversity funds, although not yet in large numbers, are on the rise and select companies that aim to enable the stabilisation or amelioration of biodiversity loss through technologies and solutions that can reduce the impact of climate change,
2 See Nature Loss and Sovereign Credit Ratings, Bennett Institute for Public Policy, SOAS, Finance for biodiversity Initiative, June 2022.
3 See Robeco’s approach to biodiversity at https://www.robeco.com/docm/docu-202201-robecos-approach-tobiodiversity-white-paper.pdf
24 | ASSESSING BIODIVERSITY-RELATED FINANCIAL RISKS
pollution and overexploitation of natural resources 4 (especially deforestation and water use). Finally, also research activity started to shed light on the impacts of biodiversity loss on credits and financial instruments. In a very recent report, the Finance for Biodiversity Initiative 5 models the effect of biodiversity loss on credit ratings, default probabilities, and the cost of borrowing highlighting the significant impacts the loss of ecosystem services could have on sovereign creditworthiness, probability of default and cost of capital.
Sources: Nature Loss and Sovereign Credit Ratings, Bennett Institute for Public Policy, SOAS, Finance for biodiversity Initiative, June 2022.
Source: Moody’s - $2.1 trillion of rated debt highly exposed to natural capital impact or dependency , Moody’s Investors service Report, June 2021; Mollod G., Klug A. P., Location Matters: Using Geospatial Analysis to Assess Biodiversity Risks, May 2022, https://www.msci.com/www/blog-posts/location-matters-using/03176029261.
Source: “The Time is Now: Three ways the financial sector can take action to address biodiversity loss today”, ShareAction report, November 2022.
Primary and secondary data
The following section provides an overview of the main providers of primary biodiversity data as well as the main metrics derived from existing primary data, particularly when they are used by central banks and supervisors. All the tools analysed below are generally free and open to the public. While considered modelled data, metrics can be the the result of measurement approaches that combine different primary biodiversity data in order to create a datapoint which is able to reflect different aspects of biodiversity. While the availability of primary and secondary data is extensive, work is needed to make sure it is useful to research and to understand impacts and dependencies.
In this context, the TNFD launched in 2022 the Nature-related Data Catalyst, which aims to identify shortcomings in nature-related data and analytics and recommend ways to accelerate the development and access to data, analytics and tools (TNFD, 2022[33]).
In addition there are a number of resources for knowledge sharing and capacity building, such as the European Commission Knowledge Centre for Biodiversity 6, the aim of which is to create tools to support the implementation of the EU Biodiversity Strategy, identify, filter and structure relevant information to make it accessible to researchers, policy-makers, NGOs, industry and citizens. Likewise, ENCORE provides a catalogue of nature datasets that will serve the prupose of helping financial institutions to better understand, assess and integrate natural risks in their activities 7 Moreover, the International Finance Corporation (IFC) launched a web-based Private Sector Guide to Biodiversity to help companies in emerging markts to understand, manage and identify opportunities linked to biodiversity. 8 The Guide offers an overview and good practices related to nature considerations linked to some industry sectors in which the IFC operates such as agribusiness, power, forestry, as well as water and sanitation utilities.
4 See as example and among others the Fidelity Sustainable Biodiversity Fund at: https://www.fidelityinternational.com/FDS/KIID/FF/en-gb/FF-Sustainable%20Biodiversity%20Fund%20A-ACCEuro_strd_en-gb_LU2514100978.pdf
5 Bennett Institute for Public Policy, Cambridge University and the Centre for Sustainable Finance of SOAS University of London.
6 Knowledge Centre for Biodiversity
7 See https://encore.naturalcapital.finance/en/data-and-methodology/data
8 See https://www.ifc.org/wps/wcm/connect/topics_ext_content/ifc_external_corporate_site/sustainability-atifc/publications/biodiversityguide
| 25 ASSESSING BIODIVERSITY-RELATED FINANCIAL RISKS
However, even in the databases listed below there can be instances of biases as well as challenges regarding the proper measurement of biodiversity In some instances areas that are more accessible seem to be better covered, while areas with confirmed populations are omitted or covered insufficiently Moreover, information in these databases can sometimes be outdated. Furthermore, there can also be inconsistencies in the coverage of private conservation areas.
Google Earth Engine Data Catalog
The Earth Engine Data catalogue includes different sources for climate and weather, imagery and geophysical data. Geophysical data includes terrain, land cover, cropland and others, which is key to understand global water consumption and agricultural production and the consequences on local biodiversity (Gorelick, 2017[34]).
Microsoft Planetary Computer
Microsoft’s Planetary Computer provides a catalogue of global environmental data, including air quality; biodiversity; biomass and vegetation; climate and weather; digital elevation models (DEMs); demographics; fire; imagery; infrastructure; land use and cover; Synthetic Aperture Radar (SAR); snow; soils; solar; temperature; water. The different databases are accessible through Azure Blob Storage with APIs (Microsoft, 2021[35])
Quantis geoFootprint
GeoFootprint allows the automated integration of spatially explicit data into life-cycle assessments (LCA) calculation, providing regionalized environmental footprints of agricultural products at a resolution of 5x5 arc minutes (i.e. 10x10 km at the equator). The database includes major crops around the world, carbon, water, soil land use change among others (Reinhard J., 2021[36])
Global Biodiversity Information Facility (GBIF)
The Global Biodiversity Information Facility (GBIF) is an international network and data infrastructure, providing global data that document the occurrence of species. The database provides open access to data, combining different data sources, including specimen-related data from natural history museums, observations from citizen science networks, and automated environmental surveys. GBIF currently integrates datasets documenting over 1.6 billion species occurrences (GBIF.org, 2021[37]).
IUCN Red List of Threatened Species
The International Union for Conservation of Nature’s Red List of Threatened Species (IUCN Red List) is a database assessing many species groups including mammals, amphibians, birds, reef building corals and conifers among others. It currently includes information on threats, ecological requirements, and habitats of over 147,517 species as well as conservation actions that can be taken to reduce or prevent extinctions. The database accepts global-level as well as regional assessments for species thought a standardized process using the IUCN Red List Categories and Criteria, ensuring high standards of scientific documentation, information management, expert review, and justification, as well as an objective system for assessing the risk of extinction of a species based on past, present, and projected threats (IUCN, 2022[38]).
26 | ASSESSING BIODIVERSITY-RELATED FINANCIAL RISKS
Protected Planet
Protected Planet is a database including data on protected areas and other effective area-based conservation measures (OECMs), which can be accessed through the World Database on Protected Areas (WDPA), the World Database on OECMs, and the Global Database on Protected Area Management Effectiveness (GD-PAME). The database was instituted by the UN Environment Programme and the International Union for Conservation of Nature (IUCN), managed by UN Environment World Conservation Monitoring Centre. Data is collected from international convention secretariats, governments, and collaborating NGOs (UNEP-WCMC and IUCN, 2022[39])
World Database of Key Biodiversity Areas
The World Database of Key Biodiversity Areas provides information about Key Biodiversity Areas, which are sites that contribute significantly to the global persistence of biodiversity, in terrestrial, freshwater and marine ecosystems. In order to qualify as a KBA, sites need to meet one or more of eleven criteria across the following categories: threatened biodiversity; geographically restricted biodiversity; ecological integrity; biological processes; and irreplaceability (BirdLife International, 2022[40])
Modelled metrics and indicators
Using primary and secondary data, metrics and indicators generally provide a more comprehensive understanding of the state of biodiversity in a specific area in a defined period of time. Metrics and indicators are different than measurement approaches in that the latter try to define a complex connection between biodiversity loss and the dependencies and impacts linked to economic and financial services. Metrics and indicators are particularly useful when data gaps are present and when there is the need for scaling up models.
The mapping and understanding of biodiversity metrics, due to their complexity, represents a fundamental part of the assessment of risks for the financial system. Biodiversity metrics can measure the richness of species, diversity of species and ecosystem services, which in some instances can coincide.
Mean species abundance
Mean Species Abundance (MSA) is an indicator of local biodiversity intactness. It measures the mean abundance of original species relative to their abundance in an undisturbed ecosystem. Its calculation is based on the comparison between individual species under influence of a given pressure, compared to their abundance in an undisturbed situation (natural situation/reference) (GLOBIO, n.d.[41])
It is important to note that only native species of an undisturbed natural area are considered for the calculation of MSA to avoid the inflation of the index and the propagation of misleading information about the state of species abundance in a given context. This is because, for instance, there could be presence of alien species in certain areas as a result of habitat disturbances. Hence, their consideration in the index would not provide an accurate scenario of the loss of species. The MSA indicator ranges from 0 to 1, where 1 means that the species assemblage is fully intact, and 0 means that all original species are extirpated (locally extinct). The results of the index tend to be illustrated in a grid map.
Despite this indicator’s capacity to provide simplified measurement of ecosystem health, additional research suggests that there is a need for additional metrics and indicators to address three points that the MSA does not provide (NGFS - INSPIRE, 2022[2]):
• Differentiation into classes of species: The MSA considers living species from different kingdoms (e.g. animal, plant, fungi). Even though the aggregation of these species can provide a
| 27 ASSESSING BIODIVERSITY-RELATED FINANCIAL RISKS
complete overall state of biodiversity, it is not possible to keep track of the loss of particular species with this index.
• Scenario assumption: There is limited information about the assumptions on the scenarios used by GLOBIO to produce the MSA. Hence, monitoring of the state of biodiversity may not be considering biases and other relevant information for their analyses.
• Comparison with absolute number of species prevalent in the same grid map: This information can provide more detailed information to better assess the state of biodiversity at granular levels.
Species Threat Abatement and Restoration (STAR)
The Species Threat Abatement and Restoration (STAR) metric draws from the IUCN Red List of Threatened Species to create two complementary global layers presenting threat abatement and restoration potential. The metrics allow for the identification of threat abatement and restoration opportunities to tackle species extinction risks (IBAT, 2021[42])
Threat abatement STAR
For a specific area of interest, the Threat abatement STAR represents the sum of the scores of the proportion of each species’ habitat range present, weighted by its IUCN Red List status. The scores indicate potential contribution regarding the reduction in global species extinction risk from threat abatement actions in the specific area. The sum of all values across all species is the global threat abatement effort needed for all species to be classified as Least Concern regarding extinction risk. A higher score indicates an area where species are at higher risk of extinction or where many species are threatened. The score can be broken down to show the relative contribution of different threats, enabling the identification of actions to contribute to conservation goals.
Restoration STAR
The Restoration STAR follows a similar approach to the Threat abatement STAR, but for areas that previously included species that are no longer present. A higher score shows areas that previously supported relatively high numbers of threatened species or a large proportion of individual species’ ranges. The score therefore shows the potential contribution towards reduction of global species extinction risk through restoration actions in a given area. In addition, and differently from the Threat abatement STAR, a discounting multiplier is applied to reflect the fact that species restoration is generally slow and may not fully succeed.
Potentially disappeared fraction (PDF)
The Potentially disappeared fraction (PDF) metric reflects the percentage of species richness that could be lost due to environmental pressures such as land use, ecotoxicity and climate change among others. The metric is generally integrated over space and time, and is expressed in PDF.m².year. The metric can have a maximum value of 1 (100 percent), which entails that all species disappeared, or zero, which entails that no species disappeared (Finance for Biodiversity, 2022[43])
28 | ASSESSING BIODIVERSITY-RELATED FINANCIAL RISKS
Due to its feature of measuring disappearance over a period of time, the metric can entail different outcomes for the same result, as long as the product of area and time equals the result. For example, a PDF.m2.yr of 50, can be interpreted in several ways:
1. 50 percent of the species disappear on an area of 100 m2 during one year.

2. 25 percent of the species disappear in an area of 10 m2 during 20 years
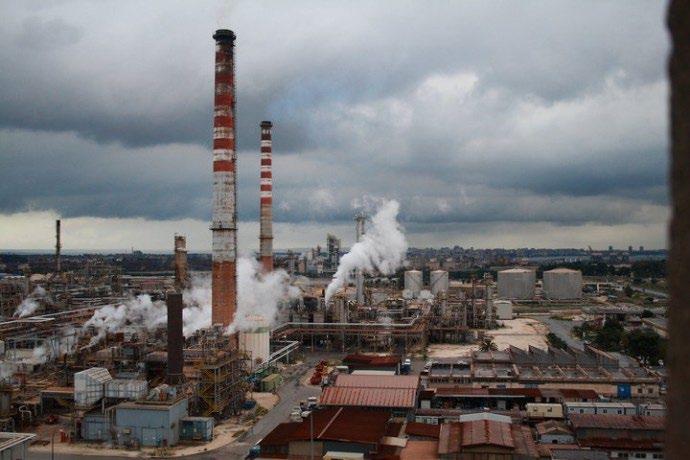

Therefore, only the combined effect of the metric is known, making it necessary to predefine how the metric should be interpreted.
Biodiversity Intactness Index (BII)
The BII measures the change in the state of nature under the pressure of humans, mostly in terms of land use changes; it indicates the abundance of living organisms in concrete geographical locations, relative to their reference populations.

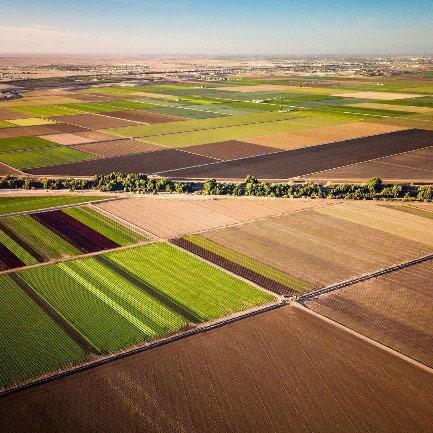
It is calculated based on a ‘top-down’ approach, estimating the impacts of a set of land use activities (which can range from complete protection to total transformation, in other words, complete urbanisation) on the population sizes of groups of ecologically similar species. Every activity is expressed on the basis of the area affected. It is also possible to aggregate the index by weighting the area subject to each activity and the number of species in the particular area. It is also important to note that the BII focuses on plants and vertebrates because they are the most documented species (Scholes and Biggs, 2005[44])
An advantage of BII is its capacity to be disaggregated to meet all the information needs for different interested parties. For instance, it is possible to obtain the results by ecosystem units or land use. Moreover, it is possible to calculate the BII either for the past or for projections.
On the other hand, it is important to highlight two limitations of BII. First, it does not highlight individual species that are under current threat, meaning that it should be used together with other metrics and indicators if an interested party requires such information. On the other hand, studies suggest that BII could
| 29 ASSESSING BIODIVERSITY-RELATED FINANCIAL RISKS
Figure 4. Example of Potentially Disappeared Fraction
Source: OECD illustration.
Natural state PDF = 0 PDF = 0.25 PDF = 0.5 PDF = 0.75 Modified state PDF = 1
be considered as “insensitive to slow acting, diffuse impacts on biodiversity, for instance the long-term effects of habitat fragmentation, climate change or pollution” (Scholes and Biggs, 2005[44]).
Biodiversity Impact Metric (BIM)
The BIM helps businesses understand the impact of their supply chains in nature; it analyses to what extent the sourcing of a company is a driver of biodiversity loss (CISL, 2020[45]). Hence, this metric quantifies the change of land and sea use (either overall or per unit) caused by each commodity in a company’s supply chain. This information serves different purposes, namely the identification of the key element causing biodiversity loss in a supply chain, as well as the provision of insights to define specific actions and priorities to avoid the deterioration of biodiversity.
The metric’s framework suggests that the BIM can assess impact based on three variables:
• Land area: The total hectares needed to produce the total amount or volume of purchased commodity.
• Quantity of impacted biodiversity: The proportion of biodiversity loss caused by the change of land use. In case a company does not count on this information, the metric suggests the assumption of an ‘intense’ land use.
• Biodiversity importance: The relative global relevance of biodiversity in a specific area. BIM looks specifically on granular information on richness and range rarity of species.
The BIM is simply calculated by multiplication of these three variables. The result is read in ‘weighted hectares’ (hectares weighted by biodiversity impact) and can also be divided by the total amount of purchased commodity to calculate the impact per unit sourced. This is a fully additive metric across commodities and geographies. For this reason, non-exhaustive examples of possible calculations include:
• The overall BIM score of a company: The addition of BIM results across all its sourcing areas.
• The BIM score of companies in a specific geographic area: The addition of all companies’ scores in a specific geographic area.
30 | ASSESSING BIODIVERSITY-RELATED FINANCIAL RISKS
Box 3. The Taskforce on Nature-related Financial Disclosures (TNFD)
The Taskforce on Nature-related Financial Disclosures (TNFD) was established in 2021 in response to the growing need to factor nature into financial and business decisions. The TNFD is a global, marketled initiative with the mission to develop and deliver a risk management and disclosure framework for organisations to report and act on evolving nature-related risks and opportunities. Its aim is to support a shift in global financial flows away from nature-negative outcomes and toward nature-positive outcomes. To achieve these outcomes, the Taskforce resolved at its first meeting in October 2021 that the TNFD risk management and disclosure framework should be applicable to, and used by, business and financial institutions of different sizes, across sectors and jurisdictions, irrespective of their preferred or required approach to materiality. The TNFD’s complete recommendations are due to be published in September 2023 but beta versions are already in the public domain and feedback from users and interested groups are already welcomed and encouraged.
Source: TNFD (2022), The TNFD Nature-related Risk and Opportunity Management and Disclosure Framework – Beta v0.3 Summary, https://framework.tnfd.global/wp-content/uploads/2022/11/TNFD_Executive_Summary_v0-3_B.pdf
Measurement approaches
The financial consequences of biodiversity loss can be severe and quantifying them is a complex task for different reasons. First, there is no common homogenous definition of impacts and dependences, or defined variables and criteria used to define and calculate them. Second, an analysis of the ecosystem services on which the economy and financial sector are still developing, and this results in a lack of a comprehensive understanding about the interaction between ecosystem services and the financial sector Third, it is difficult to quantify impacts and dependencies of biodiversity loss on the provision of ecosystem services, and of these on the economic system. Ecosystems are at the same time complex and dynamic. To appropriately measure the impact of ecosystem loss on the economy, the high degree of heterogeneity and feedback effects should be accounted for. Ecosystem losses can have negative consequences also on other ecosystem services with a cumulative impact on the economy.
Despite the high degree of complexity and the early stage of development, several financial institutions have used different approaches to measure impacts and dependencies on biodiversity and ecosystem services. A review of the different methods for defining impacts and dependencies is provided below.
Impact and dependencies: approaches and methodologies
Understanding the economic consequences of potential biodiversity-related shocks and their impacts and dependencies on economics requires an understanding of how ecosystems function (Svartzman et al., 2021[14]). A major difficulty in this is the non-linearity and complexity of ecosystems. In this regard, the measurement of biodiversity impacts and dependencies requires multiple indicators to capture progress across various spatial and ecological dimensions. This means that ecological elements such as soil erosion, invasive species, groundwater depletion, and species loss, are also the result of various anthropogenic factors (e.g. intensive agriculture, chemical pollution, deforestation) and acting at different levels.
Various financial institutions have carried out studies on, among other things, the definition of impacts and dependencies on biodiversity and economic systems in the economic and financial sectors. An overview of the most frequently used approaches and databases is provided below.
| 31 ASSESSING BIODIVERSITY-RELATED FINANCIAL RISKS
ENCORE database and methodology
Provided by UNEP and Natural Capital Finance Alliance, the Exploring Natural Capital Opportunities, Risks and Exposure (ENCORE) is a tool that focuses on the goods and services that nature provides to enable economic production and on the impact of different sectors on nature. ENCORE is a database that maps sector-based impacts and dependencies on ecosystem services for sectors of the economy and it gives the possibility to qualitative explore across all sectors of the economy that potentially depends and impacts on nature.
Among others, it has been used by DNB (Box 1), BdF and the World Bank to assess dependencies, as well as by the Central Bank of Malaysia (BNM) to measure both dependencies and impacts (DNB, 2020[19]) (Svartzman et al., 2021[14]) (World Bank, 2021[46]) (World Bank; Bank Negara Malaysia (BNM), 2022[25]) ENCORE assesses the interdependence of 86 types of production processes with 21 ecosystem services, which are themselves related to eight types of natural assets. The 21 ecosystem services are classified according to the Common International Classification of Ecosystem Services (CICES) 9 (see Table 1).
Among the 21 ecosystem services provided by ENCORE, 16 are regulation ecosystem services (15 biotic and one abiotic 10). The five remaining ecosystem services consist in two biotic provisioning services and three abiotic provisioning services (Ground water, Surface water, Genetic materials, Fibers and other materials, Animal-based energy). ENCORE does not include cultural ecosystem services that are linked to more intangible forms of attachment to ecosystems or biodiversity (Natural Capital Finance Alliance and UNEP-WCMC, 2021[47])
Table 3. Selected ecosystem services covered by ENCORE
The ecosystem services are classified according to the CICES (Common International Classification of Ecosystem Services).
Ecosystem service
Type of ecosystem service
Ground water
Surface water
Genetic materials
Fibers and other materials
Animal-based energy
Mass stabilization and erosion control
Climate regulation
Flood and storm protection
Filtration
Dilution by atmosphere and ecosystems
Water flow maintenance
Water quality
Provisioning
Provisioning
Provisioning
Provisioning
Provisioning
Regulation and Maintenance
Regulation and Maintenance
Regulation and Maintenance
Regulation and Maintenance
Regulation and Maintenance
Regulation and Maintenance
Regulation and Maintenance
9 The Common International Classification of Ecosystem Services (CICES), developed from the work the European Environment Agency (EEA) on environmental accounting, provides a standardisation and systematic approaches to naming and describing ecosystem services For an example of a description of ecosystems see: https://cices.eu/cicesstructure/
10 Biotic ecosystems are those dependent on living organisms: e.g. biomass division and cultivated terrestrial plants for nutrition, materials or energy. Example of abiotic ecosystems: water division and surface water used for nutrition, materials or energy.
32 | ASSESSING BIODIVERSITY-RELATED FINANCIAL
RISKS
Soil quality
Pest control
Disease control
Ventilation
Buffering and attenuation of mass flows
Bio-remediation
Maintain nursery habitats
Source: (Svartzman et al., 2021[14]), (Natural Capital Finance Alliance and UNEP-WCMC, 2021[47])
BIA-GBS database and methodology
Regulation and Maintenance
Regulation and Maintenance
Regulation and Maintenance
Regulation and Maintenance
Regulation and Maintenance
Regulation and Maintenance
Regulation and Maintenance
Provided by CDC Biodiversité and Carbon4 Finance (C4F), BIA-GBS measures impacts (i.e., the biodiversity footprint) and dependencies of companies and sovereign entities. The impact is assessed in Mean Species Abundance (MSA.km2) the biodiversity dimension of ecosystem integrity, by linking data on economic activities to pressures on biodiversity and translating them into biodiversity impacts. BIA-GBS uses an internal Carbon4 Finance (C4F) database that allows each security to be identified with its issuer by ISIN code. And through C4F’s Climate Risk Impact Screening (CRIS) database, it gives the possibility to differentiate each issuer’s exposure by region and sector. Then these sectors and regions are converted using the EXIOBASE database (discussed in the next part of this paper). Also, C4F's Climate Impact Analytics (CIA) database provides greenhouse gas emissions across all Scope, collected and recalculated by C4F. Finally, this database also contains physical data (e.g. tonnage of products sold or water consumption) which is progressively combined with the previous information to improve the granularity of the measurement. The entire available database consists of more than 6,000 large issuers and more than 120,000 instruments, covering the major market indices across all sectors, allowing for global coverage of equities and fixed income securities at the parent company level. The underlying footprinting tool, the Global Biodiversity ScoreTM, relies on GLOBIO model pressure-impact relationships, covering Scopes 1, 2 and 3 of the value chains, including stocks (static) and evolution of the stocks (dynamic) of impacts accounted separately. In terms of real covered and pressure coverage it is possible to identify: Terrestrial (5 pressures), Aquatic or freshwater (6 pressures), Marine (not covered yet), IPBES pressures are covered except invasive species.
GLOBIO model
The GLOBIO Model estimates biodiversity footprint (i.e. impacts), measured in Mean Species Abundance (MSA) as a function of six human pressures: land use, road disturbance, fragmentation, hunting, atmospheric nitrogen deposition and climate change. The core of the model consists of quantitative pressure-impact relationships that have been established based on extensive terrestrial biodiversity databases.
GLOBIO combines the pressure–impact relationships with data on past, present or future pressure levels, typically retrieved from the IMAGE model 11. This results in maps with MSA values corresponding with each of the six human pressures. These maps are then combined to obtain overall MSA values. Then, MSA values are aggregated to larger regions, depending on the chosen scale. In addition, the contributions of the different pressures to the losses in MSA are quantified for each region.
| 33 ASSESSING BIODIVERSITY-RELATED FINANCIAL RISKS
11 IMAGE, Integrated Model to Assess the Global Environment, is an integrated assessment model that simulates the environmental consequences of human activities worldwide. It is provided by Netherlands Environmental Assessment Agency (PBL)
Box 4. The application of ENCORE and GLOBIO: Indebted to nature: Exploring biodiversity risks for the Dutch financial sector (De Nederlandsche Bank, DNB)
Ecosystem services dependencies
In order to show how the exposure of Dutch financial institutions depends on ecosystem services, DNB uses ENCORE database that exploits and defines the dependencies on 21 ecosystem services for 86 business activities. Each business activity has a dependence score for each of the defined ecosystem service. The dependence score is calculated considering two main variables. First, the degree to which production processes are disrupted. Second, the projected extent of financial losses if the ecosystem service is lost (DNB, 2020). So, the business activities are firstly linked to economic sectors. Then, shares, loans and corporate bonds are linked to those sectors to determine the exposure of Dutch financial institutions. Finally, the ecosystem services are listed for each of these business activities with a high or very high level of dependency.
Ecosystem services impacts
Regarding impacts, DNB determines the biodiversity footprint of Dutch financial institutions, using in this case the GLOBIO model developed by PBL. To this end they calculate the biodiversity impact of over 8 000 firms in which Dutch financial institutions are currently investing. These firms represent the 80 percent (that account for EUR 320 billion) of the share portfolio of all the Dutch financial institutions (DNB, 2020). The biodiversity impact per euro of turnover is determined by sector and by geographical area. This means that DNB assumes that firms in the same sector, with economic activity and investment in the same area, have the same impact per euro for that investment. In addition to the impact of companies’ own production processes, the impact of their value chains is also considered. The biodiversity impact of firms in which the Dutch financial sector invests is weighted to the financial sector with respect to the market capitalization. This outcome produces the biodiversity impact for the Dutch financial sector. (DNB, 2020)
Source: Van Toor, J., Piljic, D., Schellekens, G., van Oorschot, M., & Kok, M. (2020). Indebted to nature Exploring biodiversity risks for the Dutch financial sector. De Nederlandsche Bank (DNB) and Planbureau voor de Leefomgeving (PBL). https://www.pbl.nl/en/publications/indebted-to-nature.
Corporate Biodiversity Footprint
The Corporate Biodiversity Footprint (CBF) assess the annual impacts on ecosystem services and biodiversity of the underlying activities of a corporate or a financial institution. The CBF assesses the impacts of business activities on nature and ecosystem services through four main categories of environmental pressures: Change of land use, Climate change with GHG emissions, Air Pollution and Water Pollution. The CBF index is obtained after 4 methodological steps as follows:
1. The products bought and sold by the company along its value chain are evaluated on the basis of the environmental variables in the Input-Output table and then allocated the company’s product flows for each sector.
2. The environmental pressures of the company per sector are calculated based on its product flows.
3. These pressures are transformed into the same biodiversity impact unit (MSA.km2).
4. The different impacts are aggregated into an overall absolute impact and weighted by the different degrees of financial and physical heterogeneity (this to avoid the possible measurement bias related to the different degrees of heterogeneity, e.g. size and area).
34 | ASSESSING BIODIVERSITY-RELATED FINANCIAL RISKS
The Integrated Biodiversity Assessment Tool (IBAT) offers the possibility to give access to three global biodiversity datasets: IUCN Red List of Threatened Species, World Database on Protected Areas and the World Database of Key Biodiversity Areas. IBAT exploits the most up to date information from each of these datasets to ensure accuracy for biodiversity data. The database is used to assess both impact and dependencies: it provides information on the global conservation status of animal, fungi and plant species and their links to human livelihoods. Moreover, IBAT provides also information about protected areas and on all sites of significance for the global persistence of biodiversity, used for impacts and transition risk assessments.
The databases provided by IBAT make it possible to exploit the Species Threat Abatement and Restoration Metric (STAR) methodology, which quantifies the potential contribution of species abatement and restoration activities to reducing the risk of extinction worldwide. This measurement approach can support the decisions made by firms, governments, civil society and other actors involved to achieve global targets for halting extinctions. It is calculated based on data on the distribution, threats and extinction risk of threatened species, obtained in particular from the IUCN Red List of Threatened Species 12
The Nature-Finance Alignment Tool
The Nature-Finance Alignment Tool assesses quantitatively the alignment of public and private financial flows with nature positive outcomes. The tool provides a score from 0-10 on the alignment of financial data, where 0 means no alignment and 10 stands for complete alignment. The scoring methodology is based on a country framework and a sector framework. While the former considers aspects such as relevant policy, species intactness and ecological deficit within specific jurisdictions, the latter is based on activities at the operational, upstream and downstream levels.
The resulting score apart from reflecting the alignment of financial data with nature goals and objectives, it also enables users to compare their portfolios with alternatives and industry standards, while identifying exposure to activities that are not aligned with nature positive outcomes. Therefore, the score can inform decision-making regarding where to invest in order to achieve nature positive outcomes. 13
Input-Output Tables
To directly link consumption and production patterns to assess impacts and dependencies on biodiversity, environmentally extended multi-regional input–output table methods have been started to use in order to trace these environmental pressures arising from consumption, production and also financial activities (see Figure 5 for a graphic illustration).
12 Integrated Biodiversity Assessment Tool (IBAT) (ibat-alliance.org)
13 See: Nature-Finance Alignment Tool - NatureFinance
| 35
ASSESSING BIODIVERSITY-RELATED FINANCIAL RISKS IBAT
Source: OECD re-elaboration from GBS Review: Input-Output modelling, CDC Biodiversité, 2021.
EORA MRIO
The Eora global supply chain database is a multi-region input-output table (MRIO) model that provides a time series of Input-Output tables, matching environmental, social and economic indicators for 15 909 sectors across 190 countries. The IO tables provided cover the following categories: greenhouse gas emissions, labour inputs, air pollution, energy use, water requirements, land use, primary agricultural inputs (including 172 types of crops) and the Human Appropriation of Net Primary Productivity. The individual country tables contain primary inputs and final demand blocks, imports and exports itemized by partner, and environmental satellite accounts.
EXIOBASE
EXIOBASE is defined as “global, detailed Multi-Regional Environmentally Extended Supply-Use Table (MR-SUT) and Input-Output Table (MR-IOT)” (Merciai and Schmidt, 2016[48]). EXIOBASE input-output table has the main goal to harmonize and provide supply-use economic linked variable for a large number of countries, estimating quantitative environmental metrics (e.g. emissions and resource extractions) by industry and sector. Given that, EXIOBASE Input-Output tables can be used to measure the impacts on ecosystem services and biodiversity (and more broadly, the environmental impacts) associated with the final production or consumption of goods. So far, EXIOBASE provides two input-output table forms: monetary and hybrid MR-IOT. Below the features of the two types of input-output tables:


36 | ASSESSING BIODIVERSITY-RELATED FINANCIAL RISKS
Figure 5. Illustration of the detailed GBS Input-Output approach
Company A data I- O Table 163 x 163 industries Produc�on ( �er 0 ) Company B data Company C data Produc�on/ Turnove r NACE codes Intermediary consump�on s Company or Por�olio Input-Output transla�on Produc�on and purchases per industry and region STEP 1 STEP 2 Region Industry ( M€) Emission s Materials consumed EXIOBASE GLOBI O RMlivestok RMforestry RMcrops RMextrac�ve RMother D matrices Direct environmental pressures M matrices Biodiversity loss factors Por�olio / Company Impact
Source: OECD elaboration from EXIOBASE
Ecoinvent
The ecoinvent Database is a Life Cycle Inventory (LCI) database that supports various types of sustainability assessments. It is a database that covers a set of sectors at global and regional level. It gives quantitative and qualitative information about more than 18 000 activities. It provides information about, among others, the natural resources withdrawn from the environment, the emissions released to the water, soil and air, the products demanded from other processes (electricity), and the products, co-products and wastes produced 14
Value Chain Footprinting Dashboard
The Value Chain Footprinting dashboard provides estimates of the environmental and ecosystem service impacts of production and consumption activities. It incorporates the production of over 160 agricultural products and selected environmental impacts and risks associated with these products in 240 producing countries and territories within national and international supply chains. Then, the dashboard links these impacts from production activities to consumption activities in 44 countries/territories.
In terms of methodology, the data used in this dashboard is provided through an Input-Output Trade Analysis (IOTA) framework, with a Multi-Region Input-Output (MRIO) physical-financial model (Croft et al. 2018, 2021). Input-Output Trade Analysis, through production, trade data and monetary financial flows associated to each commodity, provide an estimate of environmental impacts from production to final consumption.
14 https://ecoinvent.org/the-ecoinvent-database.
| 37 ASSESSING BIODIVERSITY-RELATED FINANCIAL RISKS
Figure 6. EXIOBASE Input-Output Table (MR-IOT) features
Box 5. The application of MSA and ENCORE: A “Silent Spring” for the Financial System? Exploring Biodiversity-Related Financial Risks in France (Banque De France)
In this paper, Banque De France contributes to link biodiversity loss and financial instability, by exploring biodiversity-related financial risks in France. Proposing an analytical framework with the aim of understanding and delineating biodiversity-related financial risks, BdF work provides quantitative estimates of the dependencies and impacts of the French financial system on biodiversity: to date, approximately 42 percent of the value of securities held by French financial institutions come from issuers that are highly or highly dependent on one or more ecosystem services.
Concerning the methodology side, Banque de France (BdF) analysis to assess impacts and dependencies on ecosystem services and biodiversity of French financial institutions is characterised by 3 steps: 1. Linking securities held by French financial institutions to their issuer; 2. Each issuer is assessed for dependencies and impacts on ecosystem services and biodiversity. In this step, a dependency score and biodiversity impacts (MSA.km²) are estimated; 3. The score of dependencies and impacts at the portfolio level is calculated. BdF combines the number of securities of each issuer held by French financial institutions with the dependency scores and impacts of the issuers of the securities. This results in a dependency and impact score for the total securities portfolio of French financial institutions
Dependencies on Biodiversity and Ecosystem Services
Banque de France uses of the ENCORE methodology to assessing the dependencies on ecosystem services of the economic activities financed by French financial institutions. In the absence of standard scenarios of physical shocks, the rationale for BdF is to assume a priori that an activity with a high level of dependence on ecosystem services and biodiversity is more likely to be directly affected by a physical shock as the greater the exposure to physical hazards.
Impacts on Biodiversity and Ecosystem Services
To provide a measure of the total impacts of the economic activities financed by French financial institutions on biodiversity, Banque de France uses the BIA-GBS methodology, which relies on GLOBIO model pressure-impact relationships used by the DNB (Svartzman et al., 2021[14]); (DNB, 2020[19]) Then, in the absence of standard transition shock scenarios and following the logic assumed by the DNB, BdF considers that an economic activity with a significant negative impact on biodiversity is more likely to be affected by a biodiversity transition shock than one with a low impact on ecosystem services and biodiversity.
Source: Svartzman, Romain and Espagne, Etienne and Julien, Gauthey and Paul, Hadji-Lazaro and Mathilde, Salin and Allen, Thomas and Berger, Joshua and Calas, Julien and Godin, Antoine and Godin, Antoine and Vallier, Antoine, A ‘ Silent Spring’ for the Financial System? Exploring Biodiversity-Related Financial Risks in France (August 2021). Banque de France Working Paper No. 826, Available at SSRN: https://ssrn.com/abstract=4028442 or http://dx.doi.org/10.2139/ssrn.4028442
38 | ASSESSING BIODIVERSITY-RELATED FINANCIAL RISKS
Box 6. The application of ENCORE: An Exploration of Nature-Related Financial Risks in Malaysia (Central Bank of Malaysia, BNM).
BNM, the Central Bank of Malaysia, analyses the biodiversity impacts and dependencies of banking to economic sectors using the ENCORE tool for both. The results obtained, for each bank, are reported at the segment level (such as size and bank type) to ensure confidentiality in terms of exposure.
Regarding dependencies on ecosystem services of different economic sectors, the analysis focuses on the relationships between sectors with high or very high dependencies, as the resulting physical risk could have serious consequences in terms of profitability of business translating into market, credit, liquidity and operational risks in the medium to long term.
On the other hand, regarding the analysis of impacts on ecosystem services, banks’ exposures to sectors that have a negative impact on ecosystem services and could therefore be subject to transition risk (e.g. new policies to protect the environment and biodiversity) are identified. As an additional element for the transition risk assessment, the exposure (weighted for each geographic area) of banks’ loans for the purchase of commercial real estate, infrastructure projects and constructions in areas considered today as key biodiversity areas 15 (KBAs) that might become protected in the future is also quantified. Finally, BNM performs a partial scenario analysis of hypothetical risk scenarios concerning biodiversity and ecosystem services.
Dependencies on Ecosystem Services
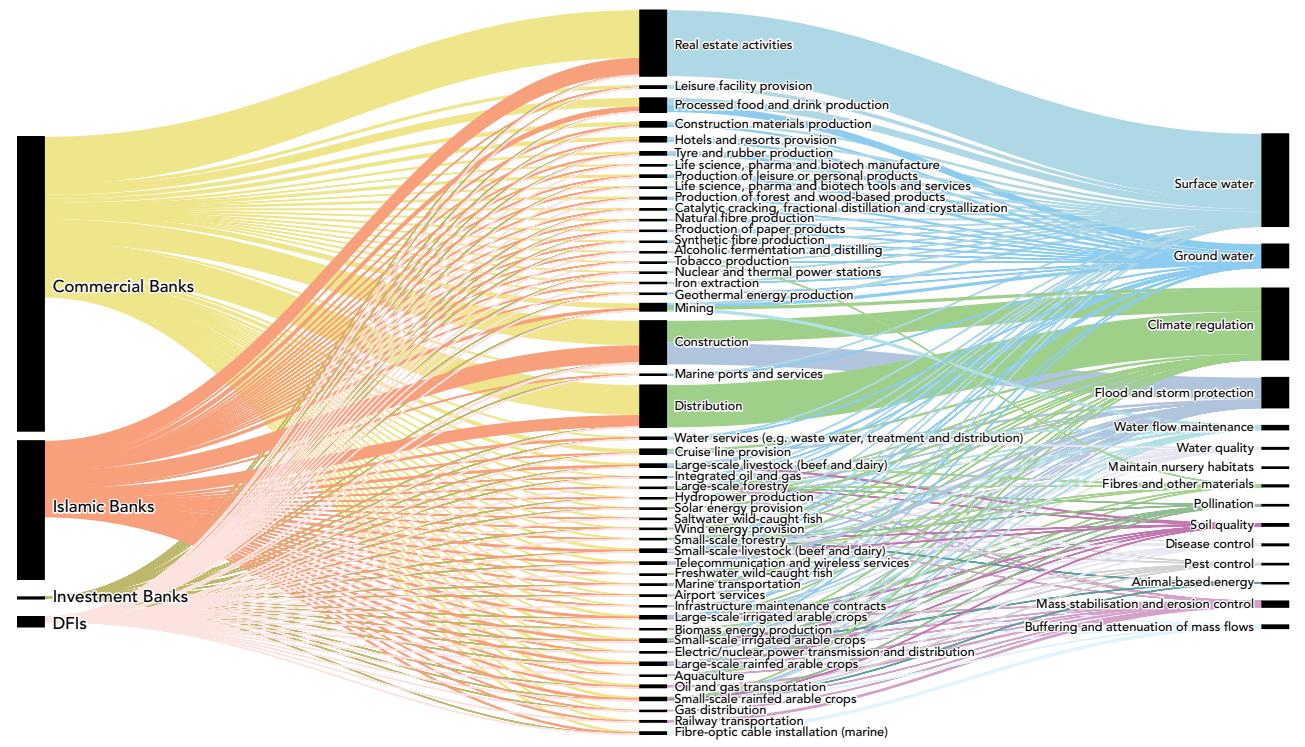
Figure 7. The financial sector and ecosystem services dependencies per Malaysian ringgit invested
The BNM’s sectoral analysis is about the 90 percent of the total corporate loan portfolio of Malaysian banks.
Source: World Bank and Bank Negara Malaysia (BNM). An Exploration of Nature-Related Financial Risks in Malaysia. Kuala Lumpur. World Bank. (2022); ENCORE.
Figure 7 above shows the results of the analysis of banking sector dependencies on ecosystem services. To give an example that may help clarify the methodology implemented, it can be seen from
| 39 ASSESSING BIODIVERSITY-RELATED FINANCIAL RISKS
the figure that most commercial banks (shown on the left axis) may suffer from dependencies on ecosystem services arising from real estate and construction activities (centre axis). In turn, then, real estate activities are highly dependent on surface water supply, while construction activities are particularly vulnerable to physical climate risk, and thus depend on climate regulation (chronic temperature rise) and protection from floods and storms (on the right axis).
Impacts on Ecosystem Services
In BNM’s assessment, the analysis of impacts on ecosystem services uses the same methodology as the dependency on ecosystem services evaluation (ENCORE database and methodology). Figure 8 below provides the impacts of banking system on ecosystem services and biodiversity, mainly accounted by six sectors: real estate, infrastructure holdings, construction, distribution, retail trade, and crops and animal production
Figure 8.The environmental impact of financial sector lending per Malaysian ringgit invested
Commercial Banks that highly or very highly drive impacts, are mainly accounted by six sectors which are responsible for over the 50 percent of those impacts.
Note: The six sectors that mainly impact on financial sector for Malaysian are: real estate, infrastructure holdings, construction, distribution, retail trade, and crops and animal production. The labels of Retail trade and crops and Animal production sectors are not reported in the figure.
Source: World Bank and Bank Negara Malaysia (BNM). An Exploration of Nature- Related Financial Risks in Malaysia. Kuala Lumpur. World Bank. (2022); ENCORE.
Approaches to Translate Exposure into Risk
To translate biodiversity loss into financial risks, one needs to go beyond impact and dependency, which only assess the exposure to biodiversity loss, but falls short of assessing the resultant financial risk. In this regard, impacts and dependencies are a necessary step, but insufficient to ascertain the financial risk associated with the loss of biodiversity. To translate biodiversity loss into financial risks, two further steps
15 The Key Biodiversity Areas are defined as sites that contribute significantly to the global persistence of biodiversity
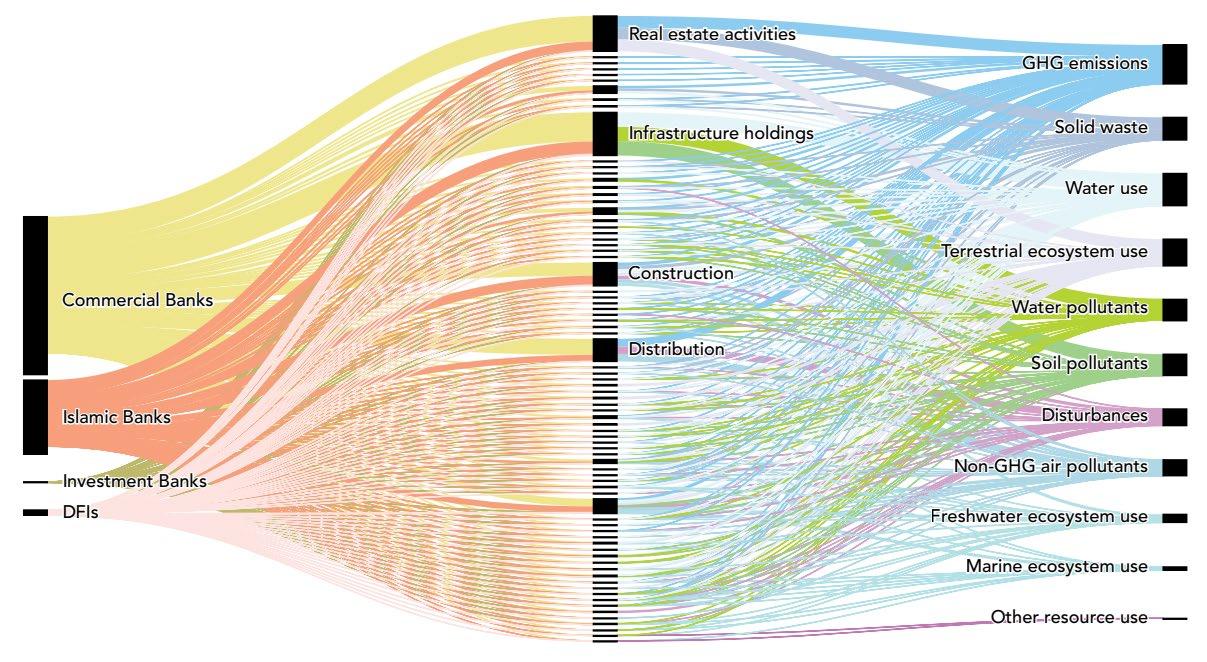
40 | ASSESSING BIODIVERSITY-RELATED FINANCIAL RISKS
are necessary. First, is the vulnerability of a financial portfolio or assets to biodiversity loss and the acute risks which may materialise as a result. In this specific instance, vulnerability relates to the likelihood of a specific ecosystem collapse or other nature-relate event occurring, based on different plausible futures. Second, is the materiality of a specific biodiversity-related occurrence on a financial asset or portfolio, in other words, the consequential expected financial or economic losses from a biodiversity loss event.
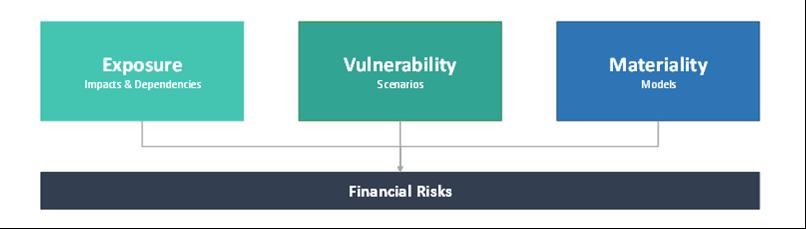
The vulnerability can be examined using exploratory scenarios to determine the likelihood of events under different futures against a baseline. The materiality of biodiversity loss for financial assets can be assessed with the use of models which examine the interaction factors between nature and the economy. Vulnerability and materiality are interlinked, with models helping financial actors understand the likelihood of events, and scenarios their financial materiality.
Figure 9. Translating Biodiversity Loss into Financial Risks
Models are qualitative or quantitative descriptions of key components of a system and of relationships between those components (IPBES, 2022[49]). In this case, the key components are the natural ecosystems, the real economy, and the financial sector.
Scenarios are qualitative and/or quantitative representations of possible futures. These describe the evolution of multiple system components, including alternative policies or management options to reduce biodiversity loss. The Intergovernmental Science-Policy Platform on Biodiversity and Ecosystem Services (IPBES) defines four types of scenarios with differing purposes in the policy cycle: (i) agenda setting (exploratory scenarios); (ii) policy design (target-seeking scenarios); (iii) policy implementation (policyscreening scenarios); (iv) policy review (retrospective evaluation scenarios) (IPBES, 2022[27]).
| 41 ASSESSING BIODIVERSITY-RELATED FINANCIAL RISKS
Source: OECD illustration.
Table 4. Summary of IPBES Scenario Types and Example Assessments
Scenario Type
Exploratory Scenarios
Target-seeking Scenarios
Policy-screening Scenarios
Policy-review Scenarios
Source: Collated from (IPBES, 2022[49]).
IPBES Example Assessments
Millennium Ecosystem Assessment
Global Environmental Outlook
OpenNESS
United Kingdom National Ecosystem Assessment
Roads from Rio +20: Pathways to achieve global sustainability goals by 2020
VOLANTE European VISIONS on sustainable land use
Strategic Environmental Assessment of Hydropower on the Mekong mainstream
Assessment of biofuel policies on direct and indirect land use change
Rethinking Global Biodiversity Strategies
Reassessing the forest impacts of protection: the challenge of nonrandom location and a corrective method
The combination of models with scenarios enables the examination of interaction effects stemming from the exposure to both transition and physical risks (impacts and dependencies). Two pieces of recent research conducts reviews of global biodiversity scenarios and models which can be used to assess the economic and financial impact.
Box 7. Literature Review: Global Biodiversity Scenarios
Recent research by the French development agency AFD provides a review of existing global quantitative scenarios which assess biodiversity. In this study, the authors identify 8 studies and 78 scenarios which assess the financial risks from global biodiversity loss. The work highlights various conceptual frameworks, qualitative narratives, assumptions, modelling trajectories, and quantitative results. The review highlights the lack of scenarios to assess physical risk, only the scenarios in the Johnson et al., 2021 study are acknowledged to be suitable for physical risk analysis. Additionally, none of the narratives for transition scenarios address some of the key risk characteristics for biodiversity including planetary boundaries, potential ecosystem regime shifts, or tipping points. The paper offers some avenues for improving biodiversity scenarios and modelling: (i) combine Integrated Assessment Models (IAMs) with environmentally extended multi-regional input–output (EE-MRIO) tables for greater sectoral granularity when assessing transition or physical shocks; (ii) need to better understand the link and feedback loops between economic and ecological systems, with adding two damage feedback loops to refer to the consequences of biodiversity and ecosystem loss on economic activity; (iii) the dynamics of biodiversity and ecosystem services need to feedback into narratives. Furthermore, the paper suggests some more immediate steps to analyse the socio-economic impacts emerging from CBD ‘2050 Vision’. First, to use the Environmental Sustainability Gap Analysis (ESGAP) framework to construct physical scenarios. Second, to adapt recent work on climate transition risk analysis to compare biodiversity-dependent and biodiversity-impacting sectors in a given country with its equivalents in the same sector and biome type. Finally, to increase data collection, open publication, and distribution approaches, including nonconvention approaches, to feed into future models.
Source: Maurin, et al., (2022). Global biodiversity scenarios: what do they tell us for biodiversity-related socio-economic impacts?, Policy Paper, AFD.
42 | ASSESSING BIODIVERSITY-RELATED FINANCIAL RISKS
Box 8. Stocktake of Nature-Economy Models
New research by (Almeida, Senni Colesanti and Dunz, 2023[50]) compares different biophysical and economic models which can be used to assess the socio-economic impact of biodiversity outcomes. The analysis indicates that modelling approaches are readily available; however, they only partially satisfy the criteria necessary to assess financial risks stemming from biodiversity and wider nature-related risks. The paper identifies five key challenges to improve current assessment approaches: (i) data inputs needs (ii) specifications around model assumptions to properly capture nature loss; (iii) the strong uncertainty regarding economic and biophysical processes which is characterised in models and scenarios; (iv) the translation of outputs from a local to a global scale, and vice versa; (v) the challenge to translate these modelling outputs into indicators for the financial system.
Table 5. Nature-Economy Model Comparison
Model Globio Globiom (IIASA) IMAGE (PBL) REMIND (PIK) Earth-Economy (World Bank)
Model Type Biodiversity model
Partial equilibrium model of land-use change (bottom up)
Integrated assessment model
Integrated assessment model (Ramsey-type growth economic module)
Land-use enhanced computable general equilibrium (GTAPAEZ) combined with ecosystem service model (InVEST)
Objective
Measures average population level response across species to different stressors
Scope Biophysical outcome
Outputs
Location-based species loss (MSA)
Analyses competition for land use between agriculture, forestry, and bioenergy
Economics outcome (in land-based sectors)
Land-use change, GDP, agricultural sector outcomes
Captures the global dynamics among societies, biosphere, and atmosphere
Economic and biophysical outcomes
Impacts on climate change, land-use change, biodiversity loss, modified nutrient cycles, and water scarcity
Computes trade-off between investment and energy needs for given economic and biophysical constraints
Economic and biophysical outcomes
Optimal economic and energy investment,
Computes the economic costs of ecosystem services loss
Economic and biophysical outcomes
Land-use change, GDP, sectoral disaggregated value added
Data
Sources
Spatial data on infrastructure, fragmentation and land-use change, climate change, nitrogen deposition, hunting and road disturbance projected in meters
Sectors NA
Regions NA
Grid-cell information on land-based ecosystems
Time series data on various drivers (e.g. population, economy, policy, technology, lifestyle, resources, climate)
Time series data on various drivers (e.g. population, economy, policy, technology, lifestyle, resources, climate
Agriculture (including livestock), forestry and bioenergy Energy, agriculture, landuse Energy and non-energy sectors
37 aggregated economic regions 26 regions
Note: This table is adapted from Almeida et al., 2023
12 regions
Spatial data on land use, and the state of select ecosystem services (InVEST), sectoral disaggregated economic data (GTAP)
65 sectors, including agriculture, forestry, fisheries, and related industries
137 regions
| 43 ASSESSING BIODIVERSITY-RELATED FINANCIAL RISKS
Source: Almeida et al., 2023. Building Blocks for Central Banks to Develop Nature Scenarios, INSPIRE.
This section explores different types of models and scenarios which can be used to translate biodiversity loss into financial risks. This is not an exhaustive list of all models and scenarios, but rather an exploratory exercise on types of models, with focus given to specific models which have previously been used to explicitly examine the economic or financial losses resultant of biodiversity loss. The purpose is to illustrate how these models and scenarios can be applied to assess the economic and financial risks stemming related to biodiversity.
Biodiversity and Economic Models
Biodiversity models aim to translate the direct drivers of biodiversity loss into impacts on biodiversity, which may be expressed using different metrics (NGFS - INSPIRE, 2022[2]). These models include INSIGHTS, AIM-B, GLOBIO, and PREDICTS (Ibid). Some of these models have previously been utilised to assess the impacts of economic activities on biodiversity loss. For example, the GLOBIO model, was used by the Dutch Central Bank to assess the impacts of corporations on biodiversity (DNB, 2020[19]) (as described above).
Separately, there are also ecosystem service models and assessment tools, which translate the state of ecosystem services into ecosystem service flows (NGFS - INSPIRE, 2022[2]). These include Ecosim, IMAGE 3.0, ARIES, Ecopath, InVEST, TESSA, Co$ting Nature (Ibid). Some of these models have also been used to assess the economic impacts from biodiversity loss. For example, the InVEST model is combined with a computable general equilibrium (GCE) model (Johnson et al., 2020[51]) to assess the GDP impact from nature loss. Existing models which connect these two types of models are typically restricted to specific ecosystem services. More in detail, the models mentioned above aim to cover non-marketed (or non-provisioning) ecosystem services. Provisioning services (such as mining, farming, etc.) are well captured by other model types (e.g. IAMS) (NGFS - INSPIRE, 2022[2]).
Macroeconomic Assessment Approaches
Integrated Assessment Models (IAMs)
Integrated Assessment Models (IAMs) provide policy-relevant insights by offering quantitative descriptions of the interactions between physical earth systems and human or economic system. The modelling approach is integrated, including information from both the biophysical and the economic systems (UNFCCC, 2022[52]). These models often include land-use components, which can assess the land-use change drivers for biodiversity loss and the associated transition risks. These IAMs include (but not limited to) AIM (Fujimori, Masui and Matsuoka, 2017[53]), GCAM (Calvin et al., 2019[54]), MESSAGE (Huppmann et al., 2019[55]), and REMIND (Baumstark et al., 2021[56]).The models vary in exact specifics, for example Global Biosphere Management Model (GLOBIOM) (land use module of MESSAGE). It is a partialequilibrium model which represents the primary land-use sectors, including agriculture and forestry, and was developed by the International Institute for Applied Systems Analysis (IIASA). The supply-side of the model adopts a bottom-up approach, with spatially explicit modelling of land-use (IIASA, 2018[57]). Conversely, the IMAGE land use IAM module (part of the MAGNET), focuses on the agricultural economy (forest management, land-use allocation, and livestock systems) and the energy system (energy demand, energy supply, and energy conversion). From here, it assesses land cover and land use, as well as emissions to assess the interaction between earth and economic systems (PBL, 2020[58]). It is a part of computable general equilibrium (CGE) model.
44 | ASSESSING BIODIVERSITY-RELATED FINANCIAL RISKS
Box 9. Example Use-case – Scenario Analysis using IAMs Land Resource and Food Price Nexus
The GLOBIOM model has been applied to assess the land resource – food price nexus, in the context of the Sustainable Development Goals (SDGs). Obersteiner et al., 2016 use the GLOBIOM model to assess the trade-offs between environmental conversation initiatives and food prices. The authors assess a variety of environmental policies against a business-as-usual baseline to identify the impact on the trade-off. The study finds that Sustainable Consumption and Production policies are the most effective at minimising trade-offs, regarding land resource and food prices (Obersteiner et al., 2016[59]).
Bending the Curve of Terrestrial Biodiversity
The land use of components of four IAMs are used by Leclère et al., 2020 to seven scenarios which assess global terrestrial biodiversity trends and the impact on the food provisioning system. The study includes the land use module components, AIM, GLOBIOM, IMAGE, and MAGPIE to examine the economic and environmental impacts in an integrated action portfolio (IAP) scenario against a baseline scenario. The contributions of various policies to reverse land-use change-induced biodiversity trends are analysed. The results indicate further sustainable intensification and trade, reduced food waste and more plant-based diets, would avoid more than two-thirds of future biodiversity loss (Leclère et al., 2020[60]).
Sources: Obersteiner et al., (2016), Assessing the land resource-food price nexus of Sustainable Development Goals, Science Advances, Assessing the land resource–food price nexus of the Sustainable Development Goals | Science Advances; Leclère et al., (2020), Bending the curve of terrestrial biodiversity needs an integrated strategy, Nature, Bending the curve of terrestrial biodiversity needs an integrated strategy | Nature
GTAP-InVEST Earth-Economy Model
A recent Earth-Economy Model combines the Global Trade Analysis Project (GTAP) computable general equilibrium (CGE) model, a set of ecosystem service models, and a spatial simulator, to create an integrated ecosystem-economy model (The World Bank Group, 2021[17]). The model uses an expanded version of the GTAP model, which includes agroecological zones, called the GTAP Agro- Ecological Zone (GTAP-AEZ) Data Base, which has been augmented to include land-supply curves (similar to the approach in MAGNET). The general equilibrium model is linked to a suite of high-resolution, spatially explicit ecosystem services models, most notably through endogenously-determined land-use change which create input maps used in the ecosystem service models. The Integrated Valuation of Ecosystem Services and Tradeoffs (InVEST) tool is a suite of models which map and value the goods and services provided by nature. These models are based on production functions which define changes in ecosystems, and the effects on the flows and values of ecosystem services. Finally, the Spatial Economic Allocation Landscape Simulator (SEALS) (Suh et al., 2020[61]), enables the downscaling of the land-use change predictions generated by GTAP to the high-resolution scale (300-meter grid cells) needed by InVEST. The GTAP database covers 226 countries and territories, which are aggregated into 37 GTAP country units, as well as 18 agro-ecological zones.
| 45 ASSESSING BIODIVERSITY-RELATED FINANCIAL RISKS
Figure 10. Earth-Economy Model Methods and Linkages
Macro level
Nature Change Economic Change
GTAP-AEZ
Run 1: Economic Projects
Assumptions Endogenous land-use change calculations
Endogenous land-use change
Land-use change prediction inputs
- Time series observed LULC change
- Spatial adjacency
- Suitability regressors
Calibrated LULC change prediction model
SEALS
High-resolution landscapes
Micro level
Source: Adapted and simplified from (The World Bank Group, 2021[17]).
GTAP-AEZ
Run 2: Environmental feedback impacts
Ecosystem model shocks
- Crop and region prod. shocks
- Region prod. Shocks
- Reduction in forest stock
- Social cost of carbon
ES-impact on GTAP inputs
Ecosystem service model outputs
- Pollination - Marine fisheries - Timber provision
- Carbon storage
Ecosystem Service production function estimation
Box 10. Example Use-case – Partial Nature Collapse and Sovereign Credit Analysis
Partial Nature Collapse Scenario
The Earth-Economy model can be used to assess the impact from the decline or loss of ecosystem services on a country or region’s GDP. This can be achieved through the design of exploratory scenarios to determine the level of ecosystem service loss against the current baseline, and the associated economic impact, in terms of GDP. The World Bank explore the impact on GDP for different geographic regions under ‘business-as-usual’ and ‘partial nature collapse’ scenarios. A partial nature collapse is defined to be where selected ecosystems face pressures which push them to tipping points (The World Bank Group, 2021[17]). While the results presented in ‘The Economic Case for Nature’ are aggregated on a regional basis, the model is suitable to be applied in a country-specific context (Ibid). Furthermore, there is a possibility to link the outputs from the Earth-Economy model to commodity prices to examine the inflationary pressures under different nature scenarios.
Sovereign Credit Analysis
Moreover, the outputs from the Earth-Economy model can be incorporated into additional approaches, for further application. The GDP estimates provided by (The World Bank Group, 2021[17]) can be
46 | ASSESSING BIODIVERSITY-RELATED FINANCIAL RISKS
InVEST
included in methods for assessing sovereign credit ratings. For example, Agarwala et al., 2022 integrate the findings from ‘The Economic Case for Nature’ into their model for assessing sovereign credit ratings. First, the authors collect countries’ macroeconomic data and their associated credit ratings. The data is processed through a random forest model, which involves isolating the variables which provide the best answers with the least error. These variables are then used to determine future credit rating changes. Credit ratings are not merely quantitative assessments but include subjective elements which are difficult to capture in traditional modelling approaches. The random forest approach can handle distributional properties, non-linearities, and qualitative components, allows more accurate predictions about credit ratings with new data to be made. Second, the authors used the findings from Johnson et al., 2021, with the model from the first step to predict sovereign credit rating changes based on GDP losses from a partial nature collapse (Agarwala et al., 2022[62]). The results reveal that 15 out of 26 sovereigns assessed would face a downgrade of one notch or more under a ‘partial ecosystem services collapse’. The results can then be used to examine potential increases in the cost of sovereign borrowing, consequential of the downgrade due to nature loss.
Source: The World Bank Group, (2021), The Economic Case for Nature, World Bank, World Bank Document; Agarwala et al., (2022), Nature Loss and Sovereign Credit Ratings, NatureLossSovereignCreditRatings (cam.ac.uk)
Integrated Nature and Climate Scenarios
The Inevitable Policy Response (IPR) has published integrated climate and nature scenarios for investors. IPR have integrated nature transition considerations into their Forecast Policy Scenario (FPS), to create FPS + Nature (Inevitable Policy Response, 2023[63]) The scenario focuses on forceful response to climate change and nature loss out to 2030 and 2050. The FPS+N scenario focuses on nature-related policies which impact land-use, with the impacts filtering through the real economy and interacting with climate policies, specifically across food, energy, nature-related good, services, and assets, supply chains, and the global environment. The scenarios forecast the growth of nature markets, particularly nature-based solution-based carbon markets. Six other policy areas at the nexus of land-use, climate, and nature are also considered (carbon pricing, bioenergy, diets, deforestation, sustainable agriculture, and food waste).
| 47 ASSESSING BIODIVERSITY-RELATED FINANCIAL RISKS
Figure 11. IPR Integrated Climate-Biodiversity Transition Trends
Microeconomic Assessment Approaches
System of Environmental Economic Accounting–Ecosystem Accounting SEEA EA


SEEA EA is a framework of ecosystem accounting to organise biophysical data on ecosystems and ecosystem services, accounting for spatially explicit information. The framework tracks changes in the extent and condition of ecosystems, ‘valuing ecosystem services and assets and linking this information to measures of economic and human activity’ (United Nations et al., 2012[64]). This framework is developed from the SEEA central framework on Environmental-Economic Accounting (United Nations et al., 2012[64]) The approach of ecosystem accounting provides a method to assess the impacts and dependency of economic as well as human activity on the environment. SEEA EA covers “all terrestrial, freshwater, marine and subterranean ecosystem realms”. The framework utilises the concept of exchange value to align with standard economic accounting principles and assist with comparison to economic and financial data (United Nations et al., 2012[64]).
Box 11. Example Use-case – Natural Capital Valuation Model
The Natural Capital Valuation (NCV) Model has been developed by Arcadis and partners on behalf of the European Bank for Reconstruction and Development (EBRD) The NCV Model aims to provide insights in the main natural capital risks and priority ecosystem services at a landscape scale and how these are expected to evolve over time. This helps the EBRD in identifying sustainable investment opportunities in their regions of operation which will contribute to achieving nature positive outcomes. The model also provides necessary contextual information for assessing projects which are in EBRD’s pipeline and will support collecting information for disclosure according to TNFD, in collaboration with the European Commission. The NCV model builds upon the SEEA EA framework to provide quantitative, and, where
48 | ASSESSING BIODIVERSITY-RELATED FINANCIAL RISKS
Source: Adapted by authors from (Inevitable Policy Response, 2023 [63]).
Emissions pricing & regulation y Diet shifts stainable griculture od waste Land restoration
possible, monetary information on the state of nature at a landscape level. The model is scenario-based, comparing ‘a Business as Usual (BAU)-scenario with a sustainable or ‘nature positive scenario against the current baseline’. The model includes quantified ecological thresholds to inform natural capital risks and enables compliance with a planetary boundaries approach. The model is compatible with other natural capital risk approaches, such as the Water Risk Filter and climate risk scenarios (Ibid). The model has initially been piloted in Kyrgyzstan and Uzbekistan (Ibid) and is now applied on the Red Sea in Egypt and on a landfill in Serbia.
o
o
o


Handbook for Nature-related Financial Risks
The Cambridge Institute for Sustainable Leadership (CISL) have developed a framework to identify naturerelated risks. Its purpose is to: (i) define key concepts; (ii) detail transmission channels that make nature loss a financial risk; and (iii) outline a framework that banks and asset managers can use to identify naturerelated financial risks. The framework identifies the relevant risk driver types (physical, transition, and liability risk) as well as the transmission channels (through risk manifestation and resultant impact on companies) to financial risks (credit, market, liquidity, and business risk). This is conducted in a four-step approach – identify the type of risk, how the risk manifests, the impact on companies, and the resultant financial risk. The framework distinguishes between acute (value chain disruption) and chronic risks (pricing externalities), in their transmission channels to financial risks (CISL, 2021[65]). Furthermore, the framework identifies three types of effects or risk impacts stemming from nature-related risks:

• First-order effects – where the risk materialisation has a direct impact on the company
• Second-order effects – where the risk materialisation has a wider, indirect impact, on the associated value-chain, stemming from the initial direct impact.
| 49 ASSESSING BIODIVERSITY-RELATED FINANCIAL RISKS
Figure 12. Natural Capital Valuation Model
Source: For more information, contact Johan Lammerant (johan.lammerant@arcadis.com) and Alexander Hadzhiivanov (hadzhiia@ebrd.com).
Key NC risk themes & priority ecosystem services at landscape level Understand landscape & develop baseline o State of nature: extent & condition (stocks), ecosystem services (flows)
Interaction with stakeholders: dependencies/impacts assessment NATURAL CAPITAL BASELINE NATURAL CAPITAL RISK ASSESSMENT Natural capital risk profile of landscape
Physical, transition and systemic risks
Quantified, monetized, prioritized
Distance to thresholds
Double materiality NATURAL CAPITAL INVESTMENT OPPORTUNITIES Investment opportunities
o
o
o
o
Financing Green
Greening Finance for new and existing projects Outcomes o Improved risk scores for key risk themes (based on intensity of impact drivers combined with ecosystem integrity level) o Reduced distance to Nature Positive (planetary boundaries) o Reduced distance to SDGs (incl economic and social) Outcomes o Risk scores for key risk themes (based on intensity of impact drivers combined with ecosystem integrity level) o Distance to Nature Positive (planetary boundaries) o Distance to SDGs (incl economic and social) NATURAL CAPITAL VALUATION MODEL (NCV MODEL) OVERVIEW SCENARIOANALYSIS 1 2 3 © Arcadis 2023
• Contagion risks – or spill over effects, where the financial difficulties at one or more institutions may ‘spill over’ to the rest of financial system.
Physical Risk
- Climate Change
- Invasive Species
- Land use Change
- Overexploitation Pollution
Transition Risk
- In response to nature loss
Liability Risk
- Air quality and climate
- Food and other goods provisions
- Habitat intactness
- Hazard regulation
- Policy and regulation
- Technology
- Business and innovation
- Consumer or investor sentiment
- Litigation
Disruption of activities or value chain
Raw material price volatility
Adjustment or relocation of activities
Pricing externalities
Stranded assets
Capital destruction
Source: Adapted from the Handbook for Nature-related Financial Risks (CISL, 2021[65]).
Credit Market Liquidity
Business
50 | ASSESSING BIODIVERSITY-RELATED FINANCIAL RISKS
Figure 13. Framework for identifying nature-related financial risks
A • Type of risk B • Risk manifests as a result of… C • Impact on companies D
Resultant financial risk
•
Box 12. Example Use-case – East Asia and Water Curtailment Sectoral Analysis
The CISL framework has been applied in five sectoral scenarios to assess the financial risks stemming from nature- and biodiversity-related risks. One of which is the impact of water curtailment on the credit rating of heavy industry companies in East Asia, conducted in partnership with HSBC (CISL and HSBC, 2022[66]). The case study examines 50 East Asia-based industrial corporates, with a business model which is dependent on water and focuses on banks’ internal ratings used to calculate risk-weighted assets (RWAs). In the year following the shock, RWA increases by approximately 20 per cent, with most companies subject to an internal ratings downgrade of at least 1 notch (CISL and HSBC, 2022[66]). Similar case studies have been conducted to assess nature-related risks using this framework, including on soil degradation in the agricultural value chain (Robeco & CISL, 2022[67]), land degradation in the UK (CISL and NatWest Group, 2022[68]), and agricultural policies in the EU (CISL, Deutsche Bank, & UBP, 2022[69]).
Sources: CISL & HSBC, (2022), Nature-related financial risk: use case, Impact of water curtailment on the credit rating of heavy industry companies in East Asia, Cambridge Institute for Sustainable Leadership, Impact of water curtailment on the credit rating of heavy industry – Nature-related financial risk: use case | Cambridge Institute for Sustainability Leadership; Robeco & CISL, (2022), How soil degradation amplifies the financial vulnerability of listed companies in the agricultural value chain, Cambridge Institute for Sustainable Leadership, How soil degradation amplified financial vulnerability – Nature-related financial risk use case | Cambridge Institute for Sustainability Leadership; CISL & NatWest Group, (2022), Nature-related financial risk: use case. Land degradation, UK farmers and indicative financial risk, Cambridge Institute for Sustainable Leadership, cisl_nwg_land_degradation_financial_risk_uk_apr_22final.pdf (cam.ac.uk) ; CISL, Deutsche Bank, & UBP, (2022), Nature-related financial risk: use case. The EU Farm to Fork Strategy and Fertiliser Companies, Cambridge Institute for Sustainable Leadership, The EU Farm to Fork Strategy and Fertiliser Companies – Nature-related financial risk use case | Cambridge Institute for Sustainability Leadership
TNFD LEAP FI Approach
The Taskforce on Nature-related Financial Disclosures has developed a framework for market participants to disclose nature-related risks and opportunities. The LEAP approach outlines four main ways for companies to undertake when assessing nature-related risks and opportunities. 1. Locate, the interface with nature;
2. Evaluate, dependencies & impacts; 3. Assess, material risks & opportunities;
4. Prepare, to respond & report. Within each of these four steps, the TNFD offers additional guidance on actions companies should undertake to achieve each one of the steps. In addition to the LEAP approach, the TNFD offers further guidance for financial institutions within the LEAP FI framework. The guidance helps financial institutions identify different entry points to the LEAP approach, with different emphasis on the four components to identify the relevant risks and opportunities (TNFD, 2022[70]). LEAP FI offers specific guidance on the scope of the assessment for financial institutions:
| 51 ASSESSING BIODIVERSITY-RELATED FINANCIAL RISKS
Figure 14. TNFD LEAP FI Scoping Guidance
Scope of Assessment
F1
F1 – FIs may choose to initially focus on one area, but in time should assess all business areas.
What is the nature of our business as a financial institution?
What are the main functional units within our business?
F2
F3 Type of Business Entry Points Type of Analysis
F2 – FIs should use best judgement to determine the entry point –considering one or more questions for the analysis.
What sectors/geographies do we allocate capital?
What are our financial products and what are their interactions with nature?
What biomes/ecosystems do our financial activities interact with and how?
Source: Adapted from the TNFD v0.3 Beta Version (TNFD, 2022[70]).
F3 – FIs should determine appropriate granularity of assessment for given asset classes.
What level of assessment is feasible given the level of aggregation of financial products and services?
Box 13. Example Use-case – Nature Risk Profiling and Biodiversity Risk Filter Nature Risk Profiling
The UNEP, in partnership with S&P Global, have developed a methodology for profiling nature-related dependencies and impacts, which builds upon the LEAP framework developed by TNFD. The approach focuses on risks based on impact and dependency using spatial data, structured around two core tiers. These tiers refer to the level of geospatial granularity which is available, at either the asset-level, or using sectors and regional averages.
(i) Tier 1 – company level impacts and dependencies estimated using sector averages and regional-level spatial risk factors.
(ii) Tier 2 – applied to spatially resolved asset-level data. Spatial risk factors calculated for specific geolocation of asset.
The dependency-based risk profiling is comprised of three distinct components; the reliance on ecosystem services, resilience on ecosystem services (ability of the ecosystems to sustain a continued flow of services), and risk mitigation. Impact based risk profiling is comprised of the magnitude of potential impact, significance of potential impact, and risk mitigation. This follows the impact “footprinting” approach, using the Ecosystem Integrity Index (EII) to assess a companies’ impacts at either the asset or whole entity level.
52 | ASSESSING BIODIVERSITY-RELATED FINANCIAL RISKS
WWF Biodiversity Risk Filter
WWF have developed a biodiversity risk filter which helps companies and financial institutions identify, prioritise, and assess biodiversity-related risks. The risk filter aligns with the TNFD LEAP approach to assessing biodiversity risks, with a 4-level risk hierarchy: level 1 – risk types (physical and reputational risk); level 2 – risk categories; level 3 – indicators; level 4 – metrics. A three-step methodology is proposed to identify, assess, and then aggregate biodiversity risks at the portfolio level.
Step 0: Scoping the assessment – Identify industry materiality and explore biodiversity and water integrity (using the BRF inform module, and the BRF and WRF (water risk filter) explore modules).
Step 1: Collection location-specific company and supply chain data – using geographic location data, industry classification of sites, and business importance of sites to use the BRF assess module. (Additional guidance is given for financial institutions to use proxy location data.)
Step 2: Assessing biodiversity-related risks – the BRF assess module combines the industry materiality rating and the local biodiversity importance or integrity rating to create a scape risk score for each company location.
Step 3: Aggregating biodiversity risk to the company and portfolio level – this is calculated by multiplying the portfolio weight of a company, to the aggregated company risk score, per risk type.
Source: United Nations Environment Programme (2023). ‘Nature Risk Profile: A methodology for profiling nature related dependencies and impacts. nature-risk-profile-methodology.pdf (spglobal.com), WWF Biodiversity Risk Filter (2023). ‘WWF Biodiversity Risk Filter Methodology Documentation’. BiodiversityRiskFilter_Methodology.pdf (kettufy.io)
Public policy for biodiversity
A strong case exists for governments to increase the extent and stringency of biodiversity policy. The world is accumulating produced (built) capital and human capital at the expense of natural capital (Dasgupta, 2021[7]). An estimated one million species are now threatened with extinction, while many of the world’s ecosystems are degraded (IPBES, 2019[5]). The destruction of biodiversity poses macroeconomic and financial risks. Moreover, it threatens the well-being of current and future generations (OECD, 2021[15]) Governments, businesses, and the financial sector are increasingly aware of the risks: the interlinked challenges of climate action failure, extreme weather events, and biodiversity loss and ecosystem collapse are perceived to be the top three global risks by severity over the next ten years (WEF, 2020[71]). Governments are expected to ratchet up policy to drive the transition to a nature-positive future, particularly after the adoption of the Kunming-Montreal Global Biodiversity Framework in December 2022 (see next section). If this transpires, businesses and investors whose activities and portfolio allocations are inconsistent with changes in government strategy and policy may face transition risks. These could entail, for example, higher costs due to more stringent environmental impact assessment, monitoring and impact mitigation requirements, projects being delayed or cancelled, and development permits being denied. As a result, the profitability of some companies may be negatively affected, with some companies becoming economically unviable. Companies and sectors that directly and disproportionately contribute to biodiversity loss – or that operate in areas of high biodiversity value (e.g. Key Biodiversity Areas) – are likely to be most exposed to policy-related transition risks. Sectors associated with particularly large impacts on biodiversity include agriculture, forestry, fishery, mining, energy, and infrastructure.
Whereas some companies may face transition risks, those with business models and practices that are consistent with changes in biodiversity policy may gain a comparative advantage. Furthermore, some
| 53 ASSESSING BIODIVERSITY-RELATED FINANCIAL RISKS
businesses may capitalise on the new opportunities emerging from stricter policies, for example, by developing new technologies to help mitigate biodiversity impacts or facilitate biodiversity data collection and monitoring; creating or growing markets for sustainably-sourced products (e.g. biodiversity-friendly crops; meat alternatives); offering biodiversity-related advisory services; developing new businesses (e.g. in ecosystem restoration or biobanking); and harnessing new revenue streams (e.g. from payments for ecosystem services). Emerging opportunities to engage in nature-positive business models could add up to USD 10.1 trillion in annual business value and could create 395 million jobs by 2030 (WEF, 2022[72])
Box 14. Increasing policies for nitrogen pollution put Dutch farmers out of business
The potential impact of stricter biodiversity policies on businesses and, by extension, their investors, is illustrated by the recent policy change in the Netherlands to address nitrogen pollution. In 2019 the Dutch Council of State ruled that the Dutch Nitrogen policy was in violation of EU’s nature protection laws. Emissions were immediately capped, causing some businesses to cease operations to ensure the country’s overall output did not exceed the cap. Under new plans, the Dutch government aims to reduce overall Dutch nitrogen GHG emissions by 50 percent by 2030, and to ensure three-quarters of the Netherlands’ “Natura 2000” areas are at “a healthy level” by 2030. The National Program outlines a per-area nitrogen emission reduction. The targeted reductions for farms vary between 12 percent in some areas to 70 percent in nitrogen sensitive areas around Natura 2000 areas. Within Natura 2000 areas, targeted reductions are 95 percent. The government’s plan notes that “there isn’t a future for all farmers within the area-oriented approach.”
Source: Raad van State (n.d.), Stikstof, Stikstof - Raad van State; Rijksoverheid (n.d.), Nationaal Programma Landelijk Gebied, https://www.rijksoverheid.nl/onderwerpen/omgevingswet/nationaal-programma-landelijk-gebied; USDA FAS (2021), Dutch Parliament Approves Law to Reduce Nitrogen Emissions and USDA FAS (2022), Government Presents National Program to Reduce Nitrogen Greenhouse Gas Emissions in Rural Areas.
The speed and ambition with which biodiversity policy is scaled up will differ from one country to another. Companies operating in countries where biodiversity policy is lagging may (initially) face lower policyrelated transition risks. However, if they are embedded within international supply chains, they may be affected by the adoption of stricter policies in other (importing) countries. For example, the EU’s bill against importation of deforestation (discussed below) and the EU Illegal, Unreported and Unregulated (IUU) Regulation 16 could affect companies operating in non-EU countries. While companies operating in countries that do not strengthen their biodiversity policy may face lower policy-related transition risks, their physical risks could be higher owing to the ongoing decline of biodiversity and associated ecosystem services (e.g. erosion control, flood protection and freshwater provision).
The aim of this section is to summarise the range of regulatory, economic and information-based policy instruments that governments may introduce to promote a nature-based transition, as these may generate policy-related transition risks for financial and non-financial companies.
International policy context
In December 2022 countries adopted the Kunming-Montreal Global Biodiversity Framework under the UN Convention on Biological Diversity. The framework replaces the 2011-2020 Strategic Plan for Biodiversity and the associated Aichi Targets. The mission of this post-2020 framework is "to take urgent action to halt
16 Under the IUU Regulation, non-EU countries identified as having inadequate measures in place to prevent and deter IUU may be issued with a formal warning (yellow card) to improve. If they fail to do so, they face having their fish banned from the EU market (red card) among other measures EU Carding Decisions - IUU Watch
54 | ASSESSING BIODIVERSITY-RELATED FINANCIAL RISKS
and reverse biodiversity loss to put nature on a path to recovery for the benefit of people and planet by conserving and sustainably using biodiversity, and ensuring the fair and equitable sharing of benefits from the use of genetic resources, while providing the necessary means of implementation."
The Global Biodiversity Framework is structured around four goals which, broadly speaking, address maintaining, enhancing and restoring ecosystems, halting species extinction and maintaining genetic diversity (Goal A); sustainable use of biodiversity to ensure provision of ecosystem services to meet sustainable development now and in the future (Goal B); equitable sharing of benefits that arise from nature's genetic resources and protection of traditional knowledge (Goal C); and ensuring adequate financial resources, capacity-building, technical and scientific cooperation and access to and transfer of technology (Goal D). The 2050 goals are supported by a total of 23 targets for 2030 covering a wide range of issues. Examples include:
• Increasing terrestrial and marine protected areas to 30 percent;
• Reducing pollution risks and negative impacts;
• Monitoring, assessing and disclosing risks, dependencies and impacts by transnational companies and financial institutions;
• Reforming harmful incentives and scaling up positive incentives; and
• Aligning activities and financial flows with biodiversity values.
Countries that adopted the agreement have an international obligation to ensure their national policy is consistent with the framework. This will require governments to update their national targets and National Biodiversity Strategies and Action Plans.
Several other multilateral environmental agreements exist that also address elements of biodiversity loss, and help shape national policy efforts and international coordination ( Box 15).
| 55 ASSESSING BIODIVERSITY-RELATED FINANCIAL RISKS
Box 15. Other multilateral environmental agreements with a biodiversity focus Convention on International Trade in Endangered Species of Wild Fauna and Flora (CITES):
CITES is an international convention ratified by 184 Parties which aims to ensure that international trade in specimens of wild animals and plants does not threaten the survival of the species. CITES subjects international trade in specimens of selected species to certain controls. All import, export, reexport and introduction from the sea of species covered by CMS must be authorized through a licensing system.
Convention on Migratory Species
CMS provides a global platform for the conservation and sustainable use of migratory animals and their habitats. It brings together the States through which migratory animals pass, the Range States, and lays the legal foundation for internationally coordinated conservation measures throughout a migratory range. CMS Parties (currently 130), strive towards strictly protecting threatened migratory species, conserving, or restoring the places where they live, mitigating obstacles to migration and controlling other factors that might endanger them. CMS establishes obligations for each State joining the Convention and promotes concerted action among the Range States of many of these species.
Ramsar Convention
The Ramsar Convention’s mission is “the conservation and wise use of all wetlands through local and national actions and international cooperation, as a contribution towards achieving sustainable development throughout the world”. Each Contracting Party must designate at least one wetland site within their territory for inclusion in the List of Wetlands of International Importance (the Ramsar List). There are currently over 2 400 Ramsar Sites globally. These Ramsar Sites are recognized as being of significant value not only for the country or the countries in which they are located, but for humanity. The inclusion of a wetland in the List embodies the government’s commitment to take the steps necessary to ensure that its ecological character is maintained. The Convention includes various measures to respond to threats to the ecological character of Sites.
Source: (CITES, n.d.[73]); (CMS, 2020[74]); (Ramsar Convention, 2014[75]).
In addition to these MEAs, Members of the European Union adopted a 2030 Biodiversity Strategy as part of the European Green Deal. This Strategy sets out several targets and commitments for the bloc, with an aim of achieving healthy and resilient ecosystems. Examples of targets include:
• Establish biodiversity-rich landscape on at least 10 percent of farmland.
• Reduce the use and risk of pesticides by at least 50 percent
• Manage 25 percent of agricultural land under organic farming, and promote the uptake of agroecological practices.
• No chemical pesticides are used in sensitive areas such as EU urban green areas.
• Restore at least 25 000 km of EU’s rivers to be free-flowing.
National policy measures
Governments use various policy instruments to slow, halt and reverse biodiversity loss. These instruments include regulatory tools such as restrictions on access to land and natural resources, economic instruments which make activities that harm biodiversity more expensive (e.g. taxes) or reward activities that benefit biodiversity (e.g. payments for ecosystem services), and measures to address asymmetries in information,
56 | ASSESSING BIODIVERSITY-RELATED FINANCIAL RISKS
such as ecolabelling and disclosure requirements (see Table 6). The mix of policy instruments differs from one country to another.
Different government institutions have distinctive mandates and operate in different contexts, meaning they employ different policy instruments to address nature-related risks. For instance, as ministries of finance are increasingly becoming more involved in biodiversity-risk management, there has been an emergence of potential policy practices recommendations tailored for their needs (see Box 16)
Table 6. Overview of policy instruments for biodiversity protection
Regulatory requirements
Restrictions or prohibitions on use (e.g. trade in endangered species; logging/fishing quotas) or on access (e.g. protected areas)
Performance based standards; quality or quantity standards (e.g. commercial fishing net specifications)
Due diligence requirements
Disclosure requirements
Environmental Impact Assessment and Strategic Environmental Assessment requirements
Spatial planning / zoning requirements
Source: Adapted from (OECD, 2010[76])
Economic instruments
Taxes (e.g. on groundwater extraction, carbon, pesticide and fertilizer use)
Charges/Fees (e.g. for natural resource use, access to National Parks, hunting or fishing license fees)
Information instruments and voluntary approaches
Ecolabelling and certification (e.g. sustainably harvested fish, timber and palm oil labels)
Public procurement (e.g. of sustainably harvested timber)
Tradable permits (e.g. ITQs for fisheries) Industry guidelines on integrating biodiversity
Biodiversity offsets
Biodiversity-motivated subsidies and payments for ecosystem services Reform of environmentally harmful subsidies
Box 16. The Coalition of Finance Ministers for Climate Action’s potential policy actions
The Coalition of Finance Ministers for Climate Action is a group of 72 Ministries of Finance advocating for the inclusion of environmental considerations into economic, fiscal and financial policies. In recognition that nature represents a source of risk for the financial system, The Coalition published the report An Overview of Nature-Related Risks and Potential Policy Actions for Ministries of Finance: Bending the Curve of Nature Loss in 2022. Based on the report’s findings, ministries of finance were given three recommendations:
• Increase the understanding and awareness across governments about nature-related risks.
• Incorporate criteria related to nature into their strategy and decision- making building on previous climate integration efforts.
• Co-ordinate nature-related risk management with relevant ministries, regulators and central banks.
Furthermore, the report presents four potential policy actions for Ministries of Finance to manage nature-related risks:
• Developing valuation, metrics and decision support tools on nature-related risks such as the creation of nature loss scenarios.
• Supporting economic policy reform to align incentives with sustainable practices. For instance, assessing harmful subsidies and offering guidance on phasing out of these subsidies.
| 57 ASSESSING BIODIVERSITY-RELATED FINANCIAL RISKS
• Integrating nature-related risks and opportunities into the key sectors exerting the greatest pressure on nature
• Mobilising finance for nature-related purposes.
Source: (Power, Dunz and Gavryliuk, 2022[77])
Protected areas
Protected areas have long been the cornerstone of biodiversity policy. They are used to protect species and habitats in various terrestrial (e.g. forests, grasslands), freshwater (e.g. wetlands) and marine (e.g. coral reefs) ecosystems. Different categories of protected areas exist, which vary in the specific aims and concerns. All categories place restrictions on human activity, however the severity of restrictions differs across categories. For example, all but light human use is permitted in Category 1 Strict Nature Reserve while some developments are permitted in Category V – protected landscape or seascape and Category VI Protected Area with Sustainable Use of Natural Resources.
Countries who adopted the Kunming-Montreal Global Biodiversity Framework committed to placing 30 percent of land and sea areas under protected areas or other effective area-based conservation measures (OECMs) by 2030 (Target 3). This is a significant increase in ambition from the 2020 target (Aichi Target 11), which was 17 percent of terrestrial and inland water areas and 10 per cent of coastal and marine areas. Countries also committed to ensuring protected area networks are ecologically representative, protect the most important areas for biodiversity and are effectively managed.
Target 3: Ensure and enable that by 2030 at least 30 per cent of terrestrial, inland water, and of coastal and marine areas, especially areas of particular importance for biodiversity and ecosystem functions and services, are effectively conserved and managed through ecologically representative, well-connected and equitably governed systems of protected areas and other effective area-based conservation measures, recognizing indigenous and traditional territories, where applicable, and integrated into wider landscapes, seascapes and the ocean, while ensuring that any sustainable use, where appropriate in such areas, is fully consistent with conservation outcomes, recognizing and respecting the rights of indigenous peoples and local communities, including over their traditional territories.
As governments extend their protected area network, businesses operating in priority areas for biodiversity protection may be required to adjust their activities, which could potentially increase capital or operational expenditure and reduce output. In some cases, businesses may be required to move to other locations. Similarly, those businesses with plans to expand their operations into such areas may have their permits denied or may face higher costs associated with more rigorous environmental impact assessments, monitoring and mitigation measures.
Recent studies provide an indication of the extent of the financial sector exposure to protected area policy (Box 17).
58 | ASSESSING BIODIVERSITY-RELATED FINANCIAL RISKS
Box 17. Protected areas and transition risk – recent analyses
Recent studies of the Dutch and Brazilian financial sector indicate the extent to which financial institutions may be exposed to transition risks generated from more ambitious protected area policies. The Indebted to Nature report released by De Nederlandsche Bank concluded that the Dutch financial sector has EUR 15 billion in exposure to companies that are active in already protected areas. In a scenario where protected areas coverage is extended to 30 percent, as required by the KunmingMontreal Global Biodiversity Framework, this amount rises to EUR 28 billion. The World Bank Group’s Nature-related Financial Risks in Brazil study found that 15 percent of Brazilian banks’ corporate loan portfolio is to firms potentially operating in protected areas. This equates to BRL 254 billion (EUR 45 billion). The study estimates that this could increase to 25 percent or corporate loan portfolios should conservation gaps be closed and 38 percent should all priority areas become protected.
It is important to note that estimates of the financial sector exposure to protected area expansion provide only a conservative estimate of the financial sectors’ exposure to policy-related transition risks. This is because protected areas are only one of many policy instruments that governments use to promote the conservation, sustainable use and restoration of biodiversity. Areas outside protected areas also play a critical role in supporting biodiversity and providing ecosystem services to society. Therefore, companies operating outside protected areas may face other policy pressure (e.g. from stricter quotas and standards, increased taxes and due diligence requirements).
Source: (DNB, 2020[19]) (Calice, Kalan and Miguel, 2021[24]). Note: Conservation gaps refers to those areas which are not currently protected and are classified as areas of very high priority actions for biodiversity conservation.
Quotas, moratoriums and bans
Quantity-based restrictions on use/extraction of natural resources and pollution are fundamental policies for ensuring ecosystems and populations of species do not reach tipping points (Dasgupta, 2021[7]). A widespread example is quotas and permits for fishing, logging, hunting, water extraction and pollution (e.g. Nitrogen emissions). These can potentially be traded (e.g. New Zealand’s Tradable Permit Scheme for Fisheries) to improve cost-effectiveness, similar to emissions trading schemes used to combat greenhouse gas emissions.
Where economic activities, products or practices pose an unacceptable risk to biodiversity governments may introduce bans. Bans can be temporary, with the aim of avoiding the collapse of ecosystems and species populations, and allowing time for their recovery (e.g. temporary logging and fishing bans), or permanent (e.g. bans on various pesticides such as Dichlorodiphenyltrichloroethane [DDT]). Examples of bans are summarised below.
| 59 ASSESSING BIODIVERSITY-RELATED FINANCIAL RISKS
Box 18. Moratoriums and bans
Several countries have set in place moratoriums and bans on economic sectors or business activities associated with the loss of biodiversity and ecosystem services. They include notably:
• International whaling: In 1982 the International Whaling Commission established a moratorium on commercial whaling. Japan, Norway, and Iceland objected to the moratorium but instead introduced their own quotas. This has helped avoid population collapses and potential extinction.
• Deep-sea mining: At the IUCN World Conservation Congress in Marseille (September 2021), IUCN Members adopted Resolution 122 to protect deep-ocean ecosystems and biodiversity through a moratorium on deep-sea mining unless and until several conditions are met.
• Open-pit mining bans: In 2022, Honduras’ government announced that permits for open-pit mining would no longer be issued due to environmental and health concerns.
• Small hydropower ban in Bosnia and Herzegovina: new regulation in Bosnia and Herzegovina partially bans small hydropower schemes. 111 planned projects without concessions will not be permitted but 62 projects with concessions were permitted unless further changes made to law.
• Indonesian moratoriums on new palm oil concessions and logging: in 2018, Indonesia imposed a three-year moratorium on new palm oil permits to address environmental concerns. However, the moratorium was not renewed in 2021. In 2011 Indonesia adopted a two-year moratorium on the clearing of primary forest and peatlands that was renewed and eventually made permanent.
Sources: (Dasgupta, 2021[7]) ; (IUCN World Conservation Congress, 2020[78]) (Radwin, 2022[79]) ; (Arnika, 2022[80]); (Jong, 2021[81]) ; (Jong, 2019[82])
Due diligence requirements
Due diligence is a process that financial and non-financial companies can conduct to identify, prevent, mitigate and account for their actual and potential adverse impacts on the environment (including biodiversity) and other responsible business conduct (RBC) issues (e.g. human rights, bribery and corruption) (OECD, 2018[83])(Box 19). These impacts may arise in a company’s own operations, supply chain and other business relationships. While due diligence and responsible business conduct is voluntary in most jurisdictions, an increasing number of governments are adopting laws requiring companies to undertake human rights and environmental due diligence (e.g. European Union, France, Germany, Norway and the UK).
60 | ASSESSING BIODIVERSITY-RELATED FINANCIAL RISKS
Box 19. OECD Guidelines for Multinational Enterprises and related due diligence guidance for responsible business conduct
The OECD Guidelines for Multinational Enterprises (“the Guidelines”) are the most comprehensive government-backed instrument on Responsible Business Conduct (RBC) – covering all areas of business responsibility, with a dedicated chapter on the Environment, including biodiversity The Guidelines and related OECD due diligence guidance, lay out the expectation that business, including investors, avoid causing or contributing to adverse impacts associated with their activities and business relationships on society and the environment, including biodiversity, and seek to prevent or mitigate such impacts (“do no harm”), including by carrying out due diligence throughout their value chains. The Guidelines and associated due diligence also recognise that companies should contribute positively to environmental, economic, and social progress worldwide, with a view to achieving sustainable development (“do good”).
Due diligence is the process enterprises should carry out to identify, prevent, mitigate and account for how they address adverse risks and impacts in their own operations, their supply chain and other business relationships, as recommended in the Guidelines RBC due diligence recommendations are aimed at helping enterprises, including investors, identify and address adverse environmental and social risks and impacts associated with their activities and business relationships on people and the planet. The role of RBC in the context of biodiversity, climate and other environmental challenges has become particularly pertinent in light of the climate and biodiversity crises, as well as increasing expectations regarding mandatory and voluntary environmental supply chain due diligence.
The OECD has developed a draft report explaining how the RBC due diligence framework can be applied by investors to prevent and mitigate adverse climate impacts and risks on society and the environment associated with their investee companies, which has benefited from broad market consultation (2023 forthcoming). Future work could usefully develop tailored guidance to clarify how the RBC due diligence approach can be applied by financial actors to prevent and mitigate adverse biodiversity impacts and risks.
Sources: OECD (2018), OECD Due Diligence Guidance for Responsible Business Conduct, https://mneguidelines.oecd.org/OECD-DueDiligence-Guidance-for-Responsible-Business-Conduct.pdf;
| 61 ASSESSING BIODIVERSITY-RELATED FINANCIAL RISKS
Box 20. EU Regulation on deforestation-free products
On the 6th of December 2022 the Council and the European Parliament reached a provisional agreement on a proposal to minimise the risk of deforestation and forest degradation associated with products that are imported into or exported from the European Union. The agreement is provisional pending formal adoption in both institutions.
The provisional agreement sets mandatory due diligence rules for all operators and traders who place, make available or export the following commodities from the EU market: palm oil, beef, timber, coffee, cocoa, rubber and soy. The rules also apply to a number of derived products such as chocolate, furniture, printed paper and selected palm oil based derivates (used for example as components in personal care products). A review will be carried out in two years to see if other products need to be covered.
Source: Council and Parliament strike provisional deal to cut down deforestation worldwide
Nature-related disclosure
Nature-related disclosure is gaining increasing attention as a tool for aligning financial flows with biodiversity objectives. It involves organisations assessing and reporting on their dependency and impacts on biodiversity, and the associated risks. Disclosure is intended to provide companies and investors with the necessary information to better align their activities and portfolios with biodiversity objectives. The Taskforce on Nature-related Financial Disclosures (TNFD) was established in 2021 to help guide and inform disclosure (see Box 3).
While disclosure is voluntary in many countries, some countries have taken steps to regulate climate and now also nature-related disclosures. For example:
• Article 29 of the French law on Energy and Climate provides details on expected disclosures across both biodiversity and climate. It requires financial institutions to publish information on the portion of their assets complying with the environmental criteria set out in the EU Taxonomy. Article 29 replaces the pioneering Article 173, which required French investors to disclose their climaterelated risks on a comply-or-explain basis since 2016. A key difference of Article 29 is the requirement for all French financial institutions – including banks, investors and insurers – to disclose biodiversity-related risks as well as climate-related risks. Financial institutions must disclose both how their financial activities depend on climate and biodiversity and how they impact climate and biodiversity. Furthermore, the institutions are required to disclose their strategy for reducing biodiversity impacts, including specific targets and a measure of alignment with international biodiversity goals.
• The EU Sustainable Finance Disclosure Regulation (SFDR) (EU, 2019[84]), which is part of the broader EU sustainability disclosure framework, was developed to improve transparency in the market for sustainable investment products, to prevent greenwashing and to increase transparency around sustainability claims made by financial market participants. The disclosure requirements cover a range of environmental, social & governance (ESG) metrics at both entity- and productlevel, including for biodiversity. For example, investors must provide information on the share of investments in investee companies with sites/operations located in or near to biodiversity-sensitive areas 17 where activities of those investee companies negatively affect those areas (EU, 2022[85]).
62 | ASSESSING BIODIVERSITY-RELATED FINANCIAL RISKS
17 Biodiversity-sensitive areas refers to Natura 2000 network of protected areas, Unesco World Heritage sites and Key Biodiversity Areas (‘KBAs’), as well as other protected areas,
• The European Sustainability Reporting Standards (ESRS) / EU’s Corporate Sustainability Reporting Directive (CSRD) impacts approximately 50,000 companies operating within the European Union and mandates that they report their sustainability practices using the European Sustainability Reporting Standards "Water and Marine Resources" (ESRS E3) and "Biodiversity and Ecosystems" (ESRS E4) modules as prescribed by the European Commission The ESRS E3 mandates the disclosure of information related to the impacts of company activities on water and marine resources, mitigation efforts, and the financial effects of such activities, as well as the material risks to these resources (WWF, 2023[86]). On the other hand, the ESRS E4 mandates companies to disclose information regarding the financial implications of their impact on biodiversity and ecosystems, risks and opportunities associated with these impacts, and their transition plans towards achieving no net loss of biodiversity by 2030, net gain by 2030, and full biodiversity recovery by 2050. Additionally, companies are required to provide measurable targets for biodiversity and ecosystem conservation (WWF, 2023[86])
Governments also included a target on nature-related disclosures (Target 15; see Box 21) in the KunmingMontreal Global Biodiversity Framework adopted in December 2022 at the 15th Conference of the Parties (COP15) of the Convention on Biological Diversity (CBD), which may help drive further efforts to advance nature-related disclosures by companies and financial institutions. The move towards standardised and potentially mandatory nature-related disclosure could increase transparency, help limit greenwashing and mean that companies with large biodiversity footprints come under greater scrutiny and face greater liability risks (see next section).
| 63 ASSESSING BIODIVERSITY-RELATED FINANCIAL RISKS
Box 21. Target 15 under the Kunming-Montreal Global Biodiversity Framework
On 19 December 2022, during the 15th Conference of the Parties (COP15) of the Convention on Biological Diversity (CBD), countries adopted 23 targets for 2030 under the Kunming-Montreal Global Biodiversity Framework. Target 15 specifically focuses on priorities to help financial institutions assess biodiversity-related financial risks:
“Target 15: Take legal, administrative or policy measures to encourage and enable business, and in particular to ensure that large and transnational companies and financial institutions:
a. Regularly monitor, assess, and transparently disclose their risks, dependencies and impacts on biodiversity, including with requirements for all large as well as transnational companies and financial institutions along their operations, supply and value chains and portfolios;
b. Provide information needed to consumers to promote sustainable consumption patterns;
c. Report on compliance with access and benefit-sharing regulations and measures, as applicable
In order to progressively reduce negative impacts on biodiversity, increase positive impacts, reduce biodiversity-related risks to business and financial institutions, and promote actions to ensure sustainable patterns of production.”
Source: CBD (2022), «COP15 : Nations adopt four goals, 23 targets for 2030 in landmark UN biodiversity agreement”, https://www.cbd.int/article/cop15-cbd-press-release-final-19dec2022
Taxation of harmful products or activities
Taxes place an additional cost on the use of a natural resource or the emission of a pollutant, to reflect the negative environmental externalities that they generate. A tax is a compulsory unrequited payment and is an example of an economic instrument (see for an overview of biodiversity-related economic instruments). Examples of taxes that governments may introduce to address biodiversity loss include taxes on pesticides and fertilisers; tax on total fish catch; taxes on forest products and timber harvests; taxes on wastewater discharge etc (OECD, 2021[10]). The OECD maintains a database of biodiversity-related taxes and other economic instruments and tracks their use.
Table 7. Economic instruments for biodiversity
Economic instruments Description Biodiversity-relevant examples
Taxes
Taxes place an additional cost on the use of a natural resource or the emission of a pollutant, to reflect the negative environmental externalities that they generate. A tax is a compulsory unrequited payment.
Taxes on pesticides, fertilizers, forest products and on timber harvests (e.g. tax on logging, British Columbia, Canada; tax on pesticides, France).
Fees / charges
A charge is a requited payment to general government, meaning that the payer of the charge gets something in return, more or less in proportion to the payment made.
Entrance fees to national parks, fees on hunting licenses, charges for groundwater abstraction and biodiversity-relevant noncompliance fines (e.g. subnational water abstraction charges Germany; coastal protection fees, Texas, US).
Tradable permits
Set a limit on total amount of a natural resource that can be exploited, and then allocate individual permits to users that they can also trade. The allocation of these permits can be grandfathered (i.e. allocated
Individual transferable quotas (ITQs) for fisheries; tradable development rights; and tradable hunting rights (e.g. tradable development rights for pinelands management, US; tradable fishery quotas,
64 | ASSESSING BIODIVERSITY-RELATED FINANCIAL RISKS
Economic instruments Description
Biodiversity-relevant examples to existing users of the resource free of charge, typically in perpetuity) or auctioned. If auctioned, tradable permits can generate revenue.
Biodiversity offsets
“Measurable conservation outcomes resulting from actions designed to compensate for significant residual adverse biodiversity impacts arising from project development after appropriate prevention and mitigation measures have been taken.” Biodiversity offsets take one of three forms: one-off offsets by the developer or a third party; payments-in lieu; and biobanking.
Restoration, creation, or enhancement of wetlands to compensate for impacts on wetlands at other locations resulting from e.g. agriculture or infrastructure development. (e.g. US Wetland Compensatory Mitigation).
Biodiversity-motivated subsidies
Subsidies that support the conservation, sustainable use or restoration of biodiversity. A subsidy is biodiversity-motivated if it reduces directly or indirectly the use of something that has a proven, specific negative impact on biodiversity.
Subsidies for forest management and reforestation, subsidies for organic, environmentally friendly agriculture or pesticide-free cultivation, and subsidies for land conservation. (e.g. subsidies for reforestation, Canada).
Payments for ecosystem services (PES)
Based on the beneficiary pays approach, PES are voluntary transactions between ecosystem service users and providers, that are conditional on agreed rules of natural resource management.
Payments from a downstream beverage company or local government to upstream landholders to incentivise them to protect or restore the watershed.
(e.g. Vittel (Nestlé Waters) watershed payments, France; US Grassland reserve programme).
Source: Based on (OECD, 2013[87]), Scaling-up Finance Mechanisms for Biodiversity, OECD Publishing, Paris, https://doi.org/10.1787/9789264193833-en and (OECD, 2021[10]), Tracking Economic Instruments and Finance for Biodiversity
Box 22. OECD Policy Instruments for the Environment (PINE) database
The OECD PINE database was established in 1996 to gather information on policy instruments relevant for environmental protection and natural resource management. Today it contains more than 4 100 instruments, of which about 3 680 are currently in force, from across more than 120 countries. The policy instruments covered include taxes, fees and charges, tradable permits, deposit-refund systems, environmentally-motivated subsidies and voluntary approaches. Efforts are underway to integrate data on biodiversity offsets and payments for ecosystem services as well. The data is publicly available at the PINE database portal and the OECD provides frequent analysis of the biodiversity-relevant economic instruments in Tracking Economic Instruments and Finance for Biodiversity
Source: (OECD, 2022[88]), PINE database portal https://pinedatabase.oecd.org/ ; (OECD, 2021[10]), Tracking Economic Instruments and Finance for Biodiversity, www.oecd.org/environment/resources/biodiversity/tracking-economic-instruments-and-finance-for-biodiversity2021.pdf
Biodiversity offsets
Biodiversity offsets are measurable conservation outcomes that result from actions designed to compensate for significant, residual biodiversity loss resulting from development projects (OECD, 2016[89]) They aim to internalise the external costs of development by imposing a cost on the activities that cause biodiversity loss and are therefore based on the polluter pays approach. Biodiversity offsets entail one of three approaches: 1) implementation of offsetting measures by the developer or a third-party on their
| 65 ASSESSING BIODIVERSITY-RELATED FINANCIAL RISKS
UK).
behalf; 2) purchase of credits from a pre-established biobank; 3) in-lieu payments for governments or a third-party to then spend on compensatory measures Offsets are intended to be implemented only after all reasonable steps have been taken to avoid and minimise biodiversity loss at the development site and restore on-site impacts. They have been applied in a range of sectors and development projects, such as agriculture, energy, transport, and urban development.
An increasing number of countries require biodiversity offsets or have policies that enable or encourage offsets. Today biodiversity offsets are required in some contexts in at least thirty-seven countries, while more than sixty additional countries have policies that facilitate offsetting (IUCN, TBC and DICE, 2019[90]).
Reform of environmentally harmful support
Government support such as subsidies can incentivise unsustainable production and consumption practices. The volume of government support that is potentially harmful to biodiversity is substantial. For example, from 2019-2021 54 economies provided approximately USD 611 billion per year in agricultural producer support, of which 64 percent (391 billion) is considered potentially most environmentally harmful (OECD, 2022[88]). In 2021, government support for fossil fuels in 51 countries worldwide was USD 697.2 billion (up from USD 362.4 billion in 2020). Thirty-nine economies spend on average USD 3.2 billion per year (2016-2018 average) on fisheries support that reduces the cost of inputs (e.g. fuel), the type of support most likely to lead to overfishing and illegal unreported and unregulated fishing (Martini and Innes, 2018[91]) Various government and non-government stakeholders including Business for Nature 18 have called for greater efforts to address subsidies and other incentives harmful to biodiversity. Target 18 of the new post2020 Kunming-Montreal Global Biodiversity Framework includes a commitment to "Identify by 2025, and eliminate, phase out or reform incentives, including subsidies, harmful for biodiversity [...]" A handful of countries have already taken steps to identify and assess their harmful subsidies (Matthews and Karousakis, 2022[92]), which is a first step towards reforming harmful subsidies. Removal or reform of harmful subsidies and other incentives could affect the profitability of companies dependent on them.
Brief review of liability risk
Liability risk refers to the possibility of a market participant being held responsible for an action or inaction, with financial implications. Liability encompasses but is broader than litigation 19 risk; it includes regulatory fines and enforcement, or a determination outside the courtroom of who is legally responsible (Barker, Mulholland and Temitope, 2020[3]). Biodiversity-related liability risk can arise from physical impacts on nature, failure to manage or adapt to biodiversity-related policy shifts, and from misrepresenting biodiversity risks or ecosystem impacts (Barker, Mulholland and Temitope, 2020[3]) (Table 8. Framework of biodiversity-related liability risks ). It is, therefore, closely linked to physical and transition risks.
According to (Barker, Mulholland and Temitope, 2020[3]), three factors influence the magnitude of liability exposure and whether it is material: i) the nature and breadth of potential liability exposures; ii) the transmission mechanisms between the real economy and the financial sector; iii) legal and market dynamics in the jurisdiction.
18https://static1.squarespace.com/static/5d777de8109c315fd22faf3a/t/606cf8f198040d17ff6312a6/1617754353671/ FINAL+-+BfN+position+on+updated+draft+of+the+POst-2020+Global+Biodiversity+Framework+-+Jan+2021+v5.pdf
19 Litigation refers to parties who suffer from biodiversity loss seek legal strategies for compensation, to hold others accountable for the loss, or to drive preventative action.
66 | ASSESSING BIODIVERSITY-RELATED FINANCIAL RISKS
Table 8. Framework of biodiversity-related liability risks
Physical or ecosystem impacts
Direct impact through failure to prevent biodiversity loss or ecosystem consequences
Indirect enablement through failure to prevent biodiversity loss or ecosystem consequences
Failure to manage or adapt to biodiversityrelated physical risks or ecosystem dependencies
Failure to comply with regulatory requirements associated with biodiversity loss or ecosystem protection
Financier or advisor liability for investee conduct under the above
Transition to sustainable or regenerative economy
Failure to manage and adapt to biodiversityrelated economic transition risks from policy, regulation, technology or shifts in stakeholder preferences
Anti-biodiversity regulation claims disputing the validity or application of biodiversityrelated regulation
‘Anti’-climate regulation claims disputing the validity or application of climate-related regulation or seeking compensation
‘Anti-action’ litigation strategic claims against investors by conservative interest groups seeking to preserve the economic status quo
Misrepresentation of biodiversity risks or ecosystem impacts
Market misrepresentation of material biodiversity-related risks in mandatory securities or other regulatory filings
Promotional misrepresentation or greenwashing of biodiversity-related impacts or credentials in advertising or promotion
Financier, advisor or auditor liability for investee or client misrepresentations under the above
Source: (Barker, Mulholland and Temitope, 2020 [3]) For more information, please reach out to Sarah Barker at MinterEllison
Biodiversity-related liability risk is expected to increase for companies and their investors (Clyde and Co, 2022[93]). This is due to the increasing transparency (e.g. through biodiversity-related disclosure requirements) and scrutiny of business’ biodiversity dependencies and impacts, as well as the growing awareness and manifestation of the social, economic and cultural impacts of biodiversity loss. Such a trend has been seen for climate-related litigation, with the cumulative number of climate-related litigation more than doubling since 2015 (Setzer and Higham, 2021[94]). New biodiversity-focused litigants are emerging, suggesting increasing interest in biodiversity litigation (e.g. EarthJustice’s new biodiversity law centre; Biodiversity Defense Program; Conservation Litigation). In 2022 ClientEarth was reported to have 25 active cases defending wildlife and habitats (Clyde and Co, 2022[93]) (Phelps et al., 2021[95])note that many countries already have legislation that facilitates biodiversity-related litigation, and suggest considerable scope to scale up litigation for biodiversity impacts. Likewise, more resources to track climate litigation have been delivered such as the Sabin Center for Climate Change Law’s U.S. Climate Change Litigation database. 20
Box 23. Biodiversity-related Litigation Databases
Two databases are identified as resources to use to measure directly or using a proxy for biodiversityrelated litigation risks: the OECD National Contact Points (NCPs) and the LSE Climate Change Laws of the World database.
The OECD NCPs for Responsible Business Conduct (RBC) are agencies established by governments to promote the OECD Guidelines for Multinational Enterprises (“the Guidelines”) and related due diligence guidance, and to handle cases (referred to as “specific instances”) as a non-judicial grievance mechanism. To date, 51 governments have an NCP for RBC. NCPs are not courts and cannot order any measures, their “good offices” are offered to the parties to facilitate an agreement between the submitter and the company through non-adversarial methods such as mediation or conciliation Still, the NCP cases provide a useful proxy to measure biodiversity-related liability risk. Climate Change Laws of the World
20 http://climatecasechart.com/us-climate-change-litigation/
| 67 ASSESSING BIODIVERSITY-RELATED FINANCIAL RISKS
features climate litigation cases from over 40 countries. The database is created by the Grantham Research Institute at LSE and the Sabin Center at Columbia Law School
Figure 15. LSE Database: Yearly Trend for Biodiversity-relevant Litigation Cases
Note: This analysis of the LSE Climate Change Litigation of the World database uses the following keywords to identify biodiversity-relevant cases: ‘agriculture’, ‘Amazon Forest’, ‘biodiversity’, ‘coastal erosion’, ‘deforestation’, ‘drought’, ‘farming’, ‘forests’, ‘Great Barrier Reef’, ‘land use’, ‘meat production’, ‘mining’, ‘palm oil’, ‘water management’, ‘water’, ‘wildfire’. The cases are classified by keywords in the LSE database. Source: Climate Change Laws of the World database, Grantham Research Institute on Climate Change and the Environment
From just under 700 cases on the LSE database, almost 50 cases relate to biodiversity according to the keyword search. Although specific biodiversity-targeted cases are not currently prevalent, the growing in the number of cases since 2018 may indicate that the materiality of liability-related risk is increasing. Biodiversity-related litigation is more proliferate on the ‘Global South’, with a greater number of deforestation-related cases, particularly in Brazil and Indonesia. The sectors with the largest number of cases include forestry and agriculture (including livestock), with a significant number of mining cases. There is no clear trend on whether cases are won or lost, but with increases in the number of cases, it may escalate the associated reputational risk for companies.
Source: Climate Change Laws of the World database, Grantham Research Institute on Climate Change and the Environment, National Contact Points Database, OECD
68 | ASSESSING BIODIVERSITY-RELATED FINANCIAL RISKS
0 1 2 3 4 5 6 7 8 9 10 2009 2011 2013 2014 2015 2016 2017 2018 2019 2020 2021 2022 No. of CasesNo. of Cases
3 Challenges, gaps and considerations for next steps
This report constitutes a first step in the project to assess the financial risks stemming from biodiversity loss. This report is a mapping and understanding of existing data, tools, and methodologies for assessing biodiversity related risks for financial markets. While the report highlights the complexity surrounding biodiversity elements, the OECD work is meant to help the reader navigate through biodiversity data, metrics, tools, models, and approaches. The report identifies three components, which are essential to identify and assess biodiversity-related financial risks, namely, data and metrics, impacts and dependencies, and scenarios and modelling approaches. The report identifies, classifies, and outlines much of the existing work, to organise and establish the current approaches to assess biodiversity-related financial risks. The recent increased recognition of the importance of biodiversity loss has led to substantial progress; however, significant gaps remain. The review of the literature reveals the challenges and gaps which still exist and highlights what types of assessments can currently be achieved. This is particularly pertinent in the scenarios, modelling, and risk approaches section, which highlights various applications to directly assess the economic and financial risks stemming from biodiversity loss. This offers potential future avenues to assess the biodiversity-related financial risks in the context of the Hungarian financial sector.
The results of the work will help inform the creation of a conceptual framework to translate biodiversity risks to financial risks and analyse biodiversity-related financial risks, impacts and dependencies in the financial system. The elements that are relevant to this exercise can therefore be summarised as:
• General gaps and challenges related to biodiversity;
• Limitations with existing biodiversity data, metrics and indicators; and
• Gaps and challenges to translate biodiversity impacts and dependencies and risk into financial risks through modelling, scenarios and risk approaches
This section provides an overview of outstanding gaps and challenges to measure biodiversity-related financial risks, highlighting the complexity surrounding the translation of biodiversity risks into financial risks. Outstanding gaps to assess biodiversity-related financial risks however should not discourage financial actors, as this is an emerging area that is very likely to evolve fast both in terms of expectations as well as new research, modelling and scenarios being developed to assess biodiversity-related financial risks. Likely, any conceptual framework to assess such risks will need to rely on a diversity of approaches – whether micro- and macro-level, forward-looking and based on existing data – and provide careful guidance to central banks and retail banks on prioritisation process, to navigate the complex landscape of biodiversity and nature. In terms of next steps, the OECD will develop new analysis and coordinate closely with researchers to help navigate biodiversity data, metrics, tools, models, and approaches to inform the creation of a conceptual framework to translate biodiversity risks to financial risks. The OECD aims to publish an initial supervisory framework for assessing biodiversity-related financial risks by mid-2023.
| 69 ASSESSING BIODIVERSITY-RELATED FINANCIAL RISKS
General gaps and challenges
Despite initial works by central banks, identified challenges and gaps will be given further attention in order to properly develop a conceptual framework to help supervisors and central banks address the financial risk implications linked to biodiversity loss. Importantly, methodologies to translate biodiversity risks into financial risk need to be built with central banks and supervisors in mind, understanding biodiversity loss’ impact on price stability and financial stability. This would entail modelling variables including GDP, inflation and credit risk among others.
Gaps and challenges include different aspects to be taken into account, ranging from the complexity of metrics to the differentiation between micro and macro level risks, as biodiversity loss can have impacts at a firm-level as well as a wider system-level as well as timeframe and geographical issues:
• Biodiversity complexity: Biodiversity risks need to be considered in a multidimensional as well as a dynamic rather than a static manner, consequently making models and metrics to measure biodiversity developments complex. This translates also in a higher difficulty of translating these risks to the economic and financial system, particularly considering the possibility of ecosystems reaching tipping points. Other additional complexities to take into account revolve around the potential substitution of natural capital.
• Timeframe and geography: Biodiversity risks need to be modelled considering short-term risks as well as capturing the long-term consequences of biodiversity losses. In this case, while shortterm risks might be more localised, long-term risks need to be tackled in a global way, as a widespread loss of biodiversity and ecosystems would have impacts extending beyond countries’ borders (e.g. the amazon forest destruction would have worldwide effects), making it harder to reconcile the two. Moreover, It can be a source of systemic risks leading to sudden non-linear and global shocks when tipping points are exceeded. Additionally, countries can be affected in different ways, exposing emerging and developing economies to a higher degree of risk if compared to developed economies.
• Frameworks and methodologies: While a range of frameworks and models exist, choices need to be made to reconcile the complexity of biodiversity data with a feasible and understandable outcome. In particular, models should allow to assess individual firms, reflecting how biodiversity losses are reflected in credit ratings and credit defaults, as well as aggregate challenges for the economic and financial system. This requires a certain level of granularity, in order to understand how the microeconomic effects can expand to the wider economic and financial system.
Data, metrics and indicators
While a range of data and metrics is available to track biodiversity developments, gaps and challenges remain, ranging from data on ecosystem processes to taxonomies. These can include:
• Translation of biodiversity data into useful financial metrics: Analysed metrics and indicators focus on the delivery of information related to environmental considerations. This means that they provide enough information for driving environmental decision making. Nevertheless, this information remains insufficient for finance-related purposes. For this reason, further actions are needed to effectively translate current biodiversity metrics into relevant information that can provide insights on BRFR. This also accounts for biodiversity’s role in mediating climate risks. Further research needs to identify decision-useful biodiversity data that could inform on climate-related financial risks.
• Access to data on transmission channels: Several approaches to assess financial risks and dependencies on biodiversity (including the approaches developed in the Handbook for Nature-
70 | ASSESSING BIODIVERSITY-RELATED FINANCIAL RISKS
related Financial Risks and the corporate and financial disclosure approaches developed by TNFD) require identification of the financial and economic transmission channels by which geographically located changes in biodiversity influence financial outcomes (CISL, 2021[65]). This requires geolocation data of economic assets at risk, and the relationship between those assets and their investors or economic actors downstream in the value-chain. Several initiatives exist which are increasing the availability of these areas of data. However, further action is needed to increase transparency and data availability in these areas, building on best practice.
• Multidimensional indices: The literature review suggests there is a consensus on the complexity of biodiversity. Therefore, a single metric or index remains insufficient to provide a comprehensive view of the state of biodiversity. Some studies suggest that different metrics should be used together to provide a broader understanding of biodiversity processes (Scholes and Biggs, 2005[44]).For instance, while the PDF reflects the percentage of species richness that could be lost due to environmental pressures, the BIM could help understand the key element in a supply chain causing biodiversity losses. When used together, these metrics deliver more granular information. Nevertheless, analysed sources do not consider the multidimensional indices as an alternative to provide a greater scope of biodiversity and possibly an approach to integrate financial considerations. Further studies are needed to determine the viability of multidimensional indices as an alternative to approach BRFR.
• Standardisation and comparability of data and outcomes: As shown in the section of biodiversity data, metrics and indicators, each metric and indicator has its own assumptions and characteristics. Considering that interested parties are invited to use different metrics simultaneously to obtain comprehensive information on different aspects on the state of biodiversity, there could be flaws in the quality of the data that drives analyses Quality checks and verification for nature-related data have been recently called for by many financial institutions to ensure comparability of data and analyses Thus, further developments are required to explore approaches of standardisation to ensure coherent and comparable data.
Modelling, Scenario and Risk approaches
Emerging and existing models and scenarios can capture some of the risks from biodiversity and ecosystems loss. However, there are some characteristics of biodiversity loss and the materialisation of economic and financial risks which are difficult or not possible to capture using these models. These partially stems from the data gaps highlighted above about the current and future condition of ecosystems. Many of the modelling challenges which are recognised for climate change, also apply to biodiversity loss. However, biodiversity loss presents additional challenges due to the additional complexity in risk characteristics (highlighted above). These include:
• Modelling granularity and scope: biodiversity loss is highly contextual and localised in nature, with significant differences depending on location. The impacts of biodiversity loss will have greater economic impacts for low- and middle-income countries (The World Bank Group, 2021[17]), with most megadiverse countries also being middle- and low-income countries (Iberdrola, 2022[96]). The direct impacts from biodiversity loss, which are highly localised is nature, need to be reconciled with the more regional and global indirect impacts through sectoral value chains. From a modelling perspective, this presents significant challenges to offer both a highly granular overview of the current and future state of ecosystems, with a globalised approach to assess the full economic impact. The former is best suited to a bottom-up modelling approach, while the latter is more aligned with a top-down approach. Additionally, the broad scope of ecosystem services which stem from biodiversity lead to a broad and complex assessment to understand the risks. Initial prioritisation of ecosystems and biodiversity-related risks will be necessary to identify, analyse, and understand the specific risks in first assessments.
| 71 ASSESSING BIODIVERSITY-RELATED FINANCIAL RISKS
• Feedback loops and contagion risks: Closely linked to the localised characteristic of biodiversity loss are feedback loops and supply chain relationships. The higher attributability of biodiversity loss, compared with climate change, implies feedback loops as interconnectedness can be mapped with greater precision. Similar to climate, feedback loops are both within the real economy and the financial sector, as well as between the financial sector and the real economy. Currently modelling approaches do not account for these feedback loops between the financial sector and the real economy. In the real economy, contagion is dependent on the level of possible substitution for natural capital, such substitutions have previously been claimed to be limited (Dasgupta, 2021[7]). Regarding modelling, accurately translating these dynamics into a model is particularly challenging because they are nonlinear, dynamic relationships, which may emerge in response to future unknown biodiversity loss. Excluding these relationships is highly likely to underestimate the true impacts on biodiversity loss on the economy and the financial sector.
• Timeframes, tipping points, and unknowns: Unlike for climate change, there are no clear global pathways for mitigating biodiversity loss, or long-term projections on the physical risks of biodiversity loss. This is because the tipping points for individual ecosystems, regions, and biomes is contextual and often highly uncertain (Scheffer, 2009[97]). Consequently, the future risks from biodiversity loss, and the timeframe over which they may occur are deeply uncertain. Moreover, the interaction between different ecosystems and their interdependence is not fully understood or assessed (IPBES, 2019[5]). Once these tipping points are surpassed, they may lead to path dependency towards higher level of biodiversity physical risks (NGFS - INSPIRE, 2022[2]). This high degree of uncertainty presents challenges for modelling. First, the most appropriate timeframe to consider biodiversity-related financial risks is not clear, and there may be discrepancy over the suitable timeframe to consider transition and physical risks. Second, the presence of such uncertainty requires a variety of modelling assumptions to be taken, which limits the ability to estimate the economic impact of biodiversity loss and may exclude the tail-end risks. This is very poignant in the major uncertainty around future pathways for biodiversity, where unlike net zero targets for climate, no such granular pathways for nature positive exists (IPBES, 2019[5])
The development of tailored models and scenarios for biodiversity needs to ensure forward-looking biodiversity scenario analysis and stress testing are compatible with climate and carefully integrated. It is necessary to integrate biodiversity analysis with climate analysis to assess the resultant financial risks. This is because of the compounding interaction effects between climate change and nature loss, leading to cascading risks which are a threat to financial stability
Next steps
While this report is meant to provide a comprehensive catalogue of existing and emerging definitions, key metrics and indicators, measurement approaches, tools and practices for measuring Biodiversity-related financial risks, it also represents the first part of a two- part reports, meant to conceptualise a supervisory framework to assess biodiversity risks in the financial system.
The report aims to serve as a resource for central banks and financial actors looking to better understand and assess biodiversity, in the lead-up to the second step of the project which entails the conceptualisation of a methodological framework to translate biodiversity risks to financial risks and analyse BRFR, impacts and dependencies in the financial system, including the designing of the associated tool to implement the methodological framework. The framework will be constructed with a view in mind for broad applicability, to be useful to different central banks and retail banks. A draft version of the methodological framework is shown below.
72 | ASSESSING BIODIVERSITY-RELATED FINANCIAL RISKS
Note: This figure presents a draft preliminary conceptual framework, which will be revised in the next deliverable of the project under Phase I.
Source: OECD authors.
The financial risks stemming from biodiversity loss are great, and so are the challenges to accurately assess them. While recent efforts have improved the ability to conceptualise and understand the risks stemming from biodiversity loss, further work is required. Progress is needed to translate the impacts and dependencies on ecosystems into financial risks. The challenges discussed above highlight the barriers to this translation process. It is therefore important in the second step of the project to collaborate with academia, central banks, other IOs and the NGFS and TNFD to develop the conceptual framework and address outstanding gaps on scenarios and modelling, as well as other issues. The OECD will endeavour to overcome these barriers, by developing new and innovative approaches to assess the financial risks stemming from biodiversity loss, in collaboration with external stakeholders.
Following the creation of the framework, the next step, which is also the overall objective of the project, carried out with funding by the European Union via the Technical Support Instrument and in cooperation with the DG REFORM, is to support Hungary in their efforts to implement reforms.
During this next step, the OECD will publish a second report presenting the conceptualisation of a methodological framework to translate biodiversity risks to financial risks and analyse biodiversity-related financial risks, impacts and dependencies in the financial system, including the designing of the associated tool to implement the methodological framework, constructed with a view in mind for broad applicability. The conceptual framework to assess such risks will need to rely on a diversity of approaches – whether micro- and macro-level, forward-looking and based on existing data – and provide careful guidance to central banks and retail banks on prioritisation process, to navigate the complex landscape of biodiversity and nature.
During the second phase of the Project, the OECD will implement the framework to the Hungarian financial system, working in cooperation with DG REFORM, MNB and other key public and private stakeholders followed by knowledge sharing and capacity building to key stakeholders, including selected banks with retail activities in Hungary, Central and Eastern European supervisory authorities as well as other European authorities.
| 73 ASSESSING BIODIVERSITY-RELATED FINANCIAL RISKS
Figure 16. Draft methodological framework
Key Ecosystem Identification • Impacts and Dependency Assessment • Spatial data on natural capital (stocks + depletion rate) Key Sector Identification • Sectoral production as a percentage of GDP • Value chain dependencies (NACE Codes) Foreign Imports Domestic Production Import Dependency FIs Foreign Exposures FIs Domestic Exposures • Geopolitics • Commodities • Values Chains • Country Risk Households Corporates Sovereigns Mortgages Loans Equities Bonds SECTORAL STRESS TEST Operational Risk - Country Risk - Industry Risk Credit + Market Risk - Probability of Default - Risk-weighted Assets - Cash flow - Leverage Ratios - Value-at-Risk Risk Identification Risk Conceptualisation Risk Assessment
References
AFD (2021), Biodiversity Degradation: 3 Risks for Finance, https://www.afd.fr/en/actualites/biodiversity-degradation-3-risks-finance (accessed on 14 November 2022).
Agarwala, M. et al. (2022), Nature Loss and Sovereign Credit Ratings
Almeida, E., C. Senni Colesanti and N. Dunz (2023), INSPIRE Sustainable Central Banking Toolbox Policy Briefing Paper - Forthcoming.
Arnika (2022), Breakthrough: Partial ban of small hydropower plants achieved in Bosnia and Herzegovina, https://arnika.org/en/news/breakthrough- partial-ban-of-small-hydropower-plantsachieved-in-bosnia-and-herzegovina (accessed on 28 November 2022).
Barker, S. (2023), Climate- Related Legal & Regulatory Risls - Module 2 Taxonomy of climate litigation, TCFD Taskforce.
Barker, S., E. Mulholland and O. Temitope (2020), The emergence of foreseeable biodiversityrelated liability risks for financial institutions. A gathering storm?, https://ccli.ouce.ox.ac.uk/wpcontent/uploads/2020/09/CCLI-Biodiversity-liability-risks-report-vFINAL.pdf
Baumstark, L. et al. (2021), “REMIND2.1: transformation and innovation dynamics of the energyeconomic system within climate and sustainability limits”, Geoscientific Model Development, Vol. 14, pp. 6571-6603.
BCG (2021), The Biodiversity Crisis Is a Business Crisis
BirdLife International (2022), The World Database of Key Biodiversity Areas. Developed by the KBA Partnership, http://www.keybiodiversityareas.org
Calice, P., F. Kalan and F. Miguel (2021), Nature-Related Financial Risks in Brazil, https://documents1.worldbank.org/curated/en/105041629893776228/pdf/Nature-RelatedFinancial-Risks-in-Brazil.pdf
Calvin, K. et al. (2019), “GCAM v5.1: representing the linkages between energy, water, land, climate, and economic systems”, Geoscientific Model Development, Vol. 12, pp. 677-698.
Capitals Coalition (2016), Natural Capital Protocol, https://capitalscoalition.org/wpcontent/uploads/2021/01/NCC_Protocol.pdf
CBD (1992), Convention on Biological Diversity, https://www.cbd.int/doc/legal/cbd-en.pdf
CISL (2021), Handbook for nature-related financial risks: key concepts and a framework for identification
CISL (2020), Measuring business impacts on nature: A framework to support better stewardship of biodiversity in global supply chains, https://www.cisl.cam.ac.uk/system/files/documents/measuring-business-impacts-on-nature.pdf
CISL and HSBC (2022), Nature-related financial risk: use case, Impact of water curtailment on the credit rating of heavy industry companies in East Asia
74 | ASSESSING BIODIVERSITY-RELATED FINANCIAL RISKS
[4]
[62]
[50]
[80]
[100 ]
[3]
[56]
[23]
[40]
[24]
[54]
[9]
[1]
[65]
[45]
[66]
CISL and NatWest Group (2022), Nature-related financial risk: use case. Land degradation, UK farmers and indicative financial risk.
Deutsche Bank, & UBP (2022), Nature-related finanical risk: use case. The EU Farm to Fork Strategy and Fertiliser Companies
(n.d.), What is CITES?, https://cites.org/eng/disc/what.php
and Co (2022), Biodiversity liability and value chain risk
(2020), Convention on the Conservation of Migratory Species of Wild Animals, https://www.cms.int/en/legalinstrument/cms
C., M.W Beck and S. Narayan (2017), 7. Financing Natural Infrastructure for Coastal Flood Damage.
B. (2008), The natural capital index of Hungary , Acta Botanica Hungarica.
P. (2021), The Economics of Biodiversity: The Dasgupta Review, London: HM.
(2020), Indebted to nature: Exploring biodiversity risks for the Dutch financial sector, https://www.dnb.nl/media/4c3fqawd/indebted-to-nature.pdf
(2022), COMMISSION DELEGATED REGULATION (EU) 2022/1288, https://eurlex.europa.eu/legal-content/EN/TXT/PDF/?uri=CELEX:32022R1288&from=EN
(2019), REGULATION (EU) 2019/2088 OF THE EUROPEAN PARLIAMENT AND OF THE COUNCIL of 27 November 2019 on sustainability ‐related disclosures in the financial services sector, https://eur-lex.europa.eu/legal-content/EN/TXT/?uri=celex%3A32019R2088
15 November 2022).
Gorelick, N. (2017), Google Earth Engine: Planetary-scale geospatial analysis for everyone, Remote Sensing of Environment., https://doi.org/10.1016/j.rse.2017.06.031
Huppmann, D. et al. (2019), “The MESSAGE Integrated Assessment Model and the ix modeling platform”, Environmental Modelling & Software, Vol. 112, pp. 143-156, https://doi.org/10.1016/j.envsoft.2018.11.012
IBAT (2021), Species Threat Abatement and Restoration (STAR) data layer, https://www.ibatalliance.org/pdf/star-business-user-guidance.pdf
Iberdrola (2022), Meagdiverse Countries [96]
IIASA (2018), Global Biosphere Management Model [57]
Inevitable Policy Response (2023), IPR: Forecast Policy Scenario + Nature (FPS+Nature) [63]
IPBES (2022), Summary for policymakers of the thematic assessment of the sustainable use of wild species of the Intergovernmental Science- Policy Platform on Biodiversity and Ecosystem [27]
| 75 ASSESSING BIODIVERSITY-RELATED FINANCIAL RISKS
[68]
[69] CITES
[73] Clyde
[93] CMS
[74] Colgan,
[31] Czúcz,
Dasgupta,
[7] DNB
[19] EU
[85] EU
[84] Finance for Biodiversity (2022),
on
measurement approaches [43] Fujimori, S., M. Kainuma and T. Masui (eds.) (2017), AIM/CGE V2.0 Model Formula, Springer. [53] GBIF.org (2021), GBIF Home Page, https://www.gbif.org [37] GLOBIO (n.d.), What is Globio, https://www.globio.info/what-is-globio (accessed on
CISL,
[99]
Guide
biodiversity
[41]
[34]
[55]
[42]
Services - ADVANCE UNEDITED VERSIONIPBES (2022), Work programme - Scenarios and Models, https://ipbes.net/scenariosmodels/what/model-methodologies.
IPBES (2019), Global assessment report on Biodiversity and Ecosystem Services - Summary for Policymakers, https://doi.org/10.5281/zenodo.3831673
IPBES (2019), Global assessment report on biodiversity and ecosystem services of the Intergovernmental Science- Policy Platform on Biodiversity and Ecosystem Services, https://doi.org/10.5281/zenodo.3831673
(2016), The assessment report on pollinators, pollination and food production
IPBES-IPCC (2021), Biodiversity and Climate Change, https://doi.org/DOI:10.5281/zenodo.4659158
(2022), The IUCN Red List of Threatened Species, https://www.iucnredlist.org
IUCN World Conservation Congress (2020), Protection of deep-ocean ecosystems and biodiversity through a moratorium on seabed mining, WCC-2020-Res-122-EN, https://portals.iucn.org/library/sites/library/files/resrecfiles/WCC_2020_RES_122_EN.pdf (accessed on 28 November 2022).
IUCN, TBC and DICE (2019), Global Inventory of Biodiversity Offset Policies (GIBOP). World View - A snapshot of national biodiversity offset policies, https://portals.iucn.org/offsetpolicy/
Johnson, J. et al. (2020), Global Futures: modelling the global economic impacts of environmental change to support policy-making. Technical Report.
Jong, H. (2021), Calls mount for Indonesian ban on new palm oil plantations to be extended, https://news.mongabay.com/2021/08/calls-mount-for-indonesian-ban-moratorium-on-newpalm-oil-plantations-to-be-extended/ (accessed on 28 November 2022).
Jong, H. (2019), Indonesia forest-clearing ban is made permanent, but labeled ‘propaganda’, https://news.mongabay.com/2019/08/indonesia-forest-clearing-ban-is-made-permanent-butlabeled-propaganda/ (accessed on 28 November 2022).
Lammerant, J. (2021), Assessment of biodiversity measurement approaches for businesses and financial institutions, EU Businessess @ Biodiversity Platform, https://ec.europa.eu/environment/biodiversity/business/assets/pdf/EU%20B@B%20Platform% 20Update%20Report%203_FINAL_1March2021.pdf
Leclère, D. et al. (2020), “Bending the curve of terrestrial biodiversity needs an integrated strategy”, Nature, Vol. 585, pp. 551-556, https://doi.org/10.1038/s41586-020-2705-y
Martini, R. and J. Innes (2018), “Relative Effects of Fisheries Support Policies”, OECD Food, Agriculture and Fisheries Papers, No. 115, OECD Publishing, Paris, https://dx.doi.org/10.1787/bd9b0dc3-en
Matthews, A. and K. Karousakis (2022), “Identifying and assessing subsidies and other incentives harmful to biodiversity: A comparative review of existing national-level assessments and insights for good practice”, OECD Environment Working Papers, No. 206, OECD Publishing, Paris, https://doi.org/10.1787/3e9118d3-en
76 | ASSESSING BIODIVERSITY-RELATED FINANCIAL RISKS
[49]
[8]
[5]
[30]
[38]
IPBES
[20]
IUCN
[78]
[90]
[51]
[81]
[82]
[32]
[60]
[91]
[92]
McKinsey & Company (2020), Valuing nature conservation
Merciai, S. and J. Schmidt (2016), Physical/Hybrid Supply and Use Tables. Methodological Report. EU FP7 DESIRE Project., http://fp7desire.eu/documents/category/3-publicdeliverables
Microsoft (2021), Microsoft Planetary Computer, https://planetarycomputer.microsoft.com/
Millenium Ecosystem Assessment (2005), Ecosystems and Human Well-being: Synthesis, Island Press, http://www.millenniumassessment.org/documents/document.356.aspx.pdf
Natural Capital Finance Alliance and UNEP-WCMC (2021), “ENCORE”, Exploring Natural Capital Opportunities, Risks and Exposure, https://encore.naturalcapital.finance/en/data-andmethodology/methodology (accessed on 2023).
(2022), NGFS Scenarios for Central Banks and Supervisors
(2022), Statement on Nature-related Financial Risks
NGFS - INSPIRE (2022), Central banking and supervision in the biosphere: An agenda for action on biodiversity loss, financial risk and system stability, https://www.ngfs.net/sites/default/files/medias/documents/central_banking_and_supervision_in _the_biosphere.pdf.
NGFS-INSPIRE (2021), Biodiversity and financial stability: building the case for action .
Obersteiner, M. et al. (2016), “Assessing the land resource-food price nexus of Sustainable Development Goals”, Science Advances, Vol. 2/9, https://doi.org/10.1126/sciadv.1501499
OECD (2022), PINE database portal, https://pinedatabase.oecd.org/
OECD (2021), “Biodiversity, natural capital and the economy: A policy guide for finance, economic and environment ministers”, OECD Environment Policy Papers, No. 26, OECD Publishing, Paris, https://doi.org/10.1787/1a1ae114-en
OECD (2021), Tracking Economic Instruments and Finance for Biodiverseity, http://www.oecd.org/environment/resources/biodiversity/tracking-economic-instruments-andfinance-for-biodiversity-2021.pdf
OECD (2019), Biodiversity: Finance and the Economic and Business Case for Action, OECD Publishing, Paris, https://doi.org/10.1787/a3147942-en
OECD (2018), OECD Due Diligence Guidance for Responsible Business Conduct, https://mneguidelines.oecd.org/OECD-Due-Diligence-Guidance-for-Responsible-BusinessConduct.pdf
OECD (2016), Biodiversity Offsets: Effective Design and Implementation, OECD Publishing, Paris, https://dx.doi.org/10.1787/9789264222519-en
OECD (2013), Scaling- up Finance Mechanisms for Biodiversity, OECD Publishing, Paris, https://doi.org/10.1787/9789264193833-en
OECD (2010), Paying for Biodiversity: Enhancing the Cost-Effectiveness of Payments for Ecosystem, OECD Publishing.
PBL (2020), IMAGE Framework Summary, [58]
| 77
ASSESSING BIODIVERSITY-RELATED FINANCIAL RISKS
[22]
[48]
[35]
[6]
[47] NGFS
[29]
[18]
NGFS
[2]
[98]
[59]
[88]
[15]
[10]
[13]
[83]
[89]
[87]
[76]
https://models.pbl.nl/image/index.php/IMAGE_framework_summary
Phelps, J. et al. (2021), “Environmental liability litigation could remedy biodiversity loss”, Conservation Letters, Vol. 14/6, https://doi.org/10.1111/conl.12821.
Pörtner, H. (2021), Biodiversity and Climate Change
Power, S., N. Dunz and O. Gavryliuk (2022), An Overview of Nature-Related Risks and Potential Policy Actions for Ministries of Finance: Bending the Curve of Nature Loss, https://www.financeministersforclimate.org/sites/cape/files/inline-files/NatureRelated%20Risks%20for%20MoFs%20%20Bending%20the%20Curve%20of%20Nature%20Loss.pdf.
Radwin, M. (2022), Honduras bans open- pit mining, citing environmental and public health concerns, https://news.mongabay.com/2022/03/honduras-bans-open-pit-mining-citingenvironmental-and-public-health-concerns/ (accessed on 28 November 2022).
Ramsar Convention (2014), The Convention on Wetlands and its Mission, https://www.ramsar.org/about/the-convention-on-wetlands-and-its-mission
Reinhard J., B. (2021), geoFootprint, Technical Documentation., https://geofootprint.com/wpcontent/uploads/2021/05/geoFootprint_TechnicalDocumentation20210504.pdf
Robeco & CISL (2022), How soil degradation amplifies the financial vulnerability of listed companies in the agricultural value chain
Rockström et al., J. (2009), “Planetary Boundaries: Exploring the Safe Operating Space for Humanity”, Ecology and Society, Vol. 14/2, https://www.ecologyandsociety.org/vol14/iss2/art32/
Scheffer, M. (2009), Critical Transitions in Nature and Society, Princeton University Press.
Scholes, R. and R. Biggs (2005), “A biodiversity intactness index”, Nature, Vol. 434, pp. 45-49, https://doi.org/10.1038/nature03289
Setzer, J. and C. Higham (2021), Global trends in climate change litigation: 2021 Snapshot, https://www.lse.ac.uk/granthaminstitute/wp-content/uploads/2021/07/Global-trends-in-climatechange-litigation_2021-snapshot.pdf
Stockholm Resilience Centre (n.d.), The nine planetary boundaries, https://www.stockholmresilience.org/research/planetary-boundaries/the-nine-planetaryboundaries.html (accessed on 18 November 2022).
Suh, S. et al. (2020), “Closing Yield Gap Is Crucial to Avoid Potential Surge in Global Carbon Emissions”, Global Environmental Change, Vol. 63/102100.
Svartzman, R. et al. (2021), A “Silent Spring” for the Financial System? Exploring BiodiversityRelated Financial Risks in France, https://publications.banquefrance.fr/sites/default/files/medias/documents/wp826_0.pdf
The World Bank Group (2021), The Economic Case for Nature. A global Earth-economy model to assess development policy pathways, https://openknowledge.worldbank.org/bitstream/handle/10986/35882/A-Global-EarthEconomy-Model-to-Assess-Development-Policy-Pathways.pdf?sequence=1&isAllowed=y
78 | ASSESSING BIODIVERSITY-RELATED FINANCIAL
RISKS
[95]
[28]
[77]
[79]
[75]
[36]
[67]
[11]
[97]
[44]
[94]
[12]
[61]
[14]
[17]
| 79 ASSESSING BIODIVERSITY-RELATED FINANCIAL RISKS TNFD (2022), The LEAP Nature Risk Assessment Approach [70] TNFD (2022), The TNFD Nature-related Risk and Opportunity Management and Disclosure Framework - Beta v0.3 Summary, https://framework.tnfd.global/wpcontent/uploads/2022/11/TNFD_Executive_Summary_v0-3_B.pdf [33] UNEP-WCMC and IUCN (2022), Protected Planet, http://www.protectedplanet.net [39] UNFCCC (2022), Integrated Assessment Models (IAMs) and Energy-Environment-Economy (E3) Models [52] United Nations et al. (2012), System of Environmental-Economic Accounting Central Framework [64] WEF (2023), The Global Risks Report 2023, https://www3.weforum.org/docs/WEF_Global_Risks_Report_2023.pdf. [16] WEF (2022), The Global Risks Report 2022, https://www3.weforum.org/docs/WEF_The_Global_Risks_Report_2022.pdf [72] WEF (2020), Nature Risk Rising: Why the Crisis Engulfing Nature Matters for Business and the Economy, https://www3.weforum.org/docs/WEF_New_Nature_Economy_Report_2020.pdf. [26] WEF (2020), New Nature Report II: The Future Of Nature And Business, https://www3.weforum.org/docs/WEF_The_Future_Of_Nature_And_Business_2020.pdf [71] World Bank (2021), Nature- Related Financial Risks in Brazil, https://documents1.worldbank.org/curated/en/105041629893776228/pdf/Nature-RelatedFinancial-Risks-in-Brazil.pdf [46] World Bank;
https://documents1.worldbank.org/curated/en/099315003142232466/pdf/P175462094e4c80c3
[25] WWF (2023), Tackling Biodiversity
biodiversity risk assessment guide [86] WWF France & AXA (2019), Into the Wild: Integrating nature into investment strategies [21]
Bank Negara Malaysia (BNM) (2022), An Exploration of Nature-Related Financial Risks in Malaysia,
0add50b4ef0fa7301e.pdf.
Risk – A
Assessing biodiversityrelated financial risks: Navigating the landscape of existing approaches

Although measurements of biodiversity-related financial risks are in their infancy, several metrics and indicators are available to assess their impacts and dependencies in the financial system, and approaches are emerging to translate biodiversity risks into financial risks. This mapping paper provides a comprehensive catalogue and literature review of existing and emerging definitions, key metrics and indicators, measurement approaches, tools and practices for central banks, financial supervisors, and financial market participants to measure biodiversity-related financial risks.
The OECD Environment Policy Paper series
Designed for a wide readership, the OECD Environment Policy Papers distil many of today’s environment-related policy issues based on a wide range of OECD work. In the form of country case studies or thematic reviews across countries, the Papers highlight practical implementation experience.
For more information:
oe.cd/biodiversity-financial-risks
Geraldine.Ang@oecd.org
Riccardo.Boffo@oecd.org
Hugh.Miller@oecd.org
@OECD_ENV | @EU_reforms
OECD Environment
Environment Directorate, May 2021 April 2023
OECD
