2 minute read
The Process


◾ Defects: Any process results the customer would deem unacceptable, such as errors, mistakes, and rework. In healthcare, this would include mislabeled specimens, hospital-acquired infections, incomplete forms, medication errors, bed sores, surgical errors, and data entry errors.
Two other forms of non-value-added activities (according to Muda) are identified as follows:
Advertisement
◾ Type I Muda: Non-value added, but necessary for the system to function. Minimize this type until it can be eliminated. ◾ Type II Muda: Non-value added and unnecessary. Eliminate this first!
The value stream map represents the current state (status quo). The next question is, how should the future look (i.e., the future state)? The VSM team gets back to work by creating an ideal value stream map that eliminates, or at least reduces, all the wastes identified in the present state. It is unlikely that the VSM team could achieve the future state in one step. One approach to accomplishing this goal is to create a series of intermediate future state maps. The organization would aim to reach these milestones at specific dates and, ultimately, realize the goal identified in the ideal state map. Since nothing is ever perfect, the process starts all over with the goal of continuous improvement. Eliminating the seven wastes can be done through the implementation of lean and the various lean tools. However, the ultimate aim of implementation should not be to identify and remove waste. Instead, it should be how to use lean principles to identify value according to the customer and make those value-adding processes flow through the organization at the customer’s pull.
1. Establish an interdisciplinary team closest to the process being studied.
The aim is to improve the value-added process. 2. Make a high-level flow chart of the process. Include all the steps required to deliver a service or product. Focus on the current process of how work is done. 3. Identify and note customers’ and suppliers’ connections for each step in the diagram. The following questions should help: – What is the customer’s need? – Who supplies what to whom?
– How does each customer make a request? – How does each supplier respond? – How does a supplier do his/her other work? 4. Describe delivery and quality requirements: Determine key quality indicators. 5. Perform a value-stream waste “observational walk” through the process steps: – Follow the movement of a patient or product. – Note the information flow (i.e., paper, verbal, electronic). – Note the inventory. – Identify how work is “triggered” in the value stream. – Identify how each step knows what to do next (sequencing). – Calculate the process time, wait time, and first-time quality for process steps and the entire value-stream cycle (percentage complete, percentage accurate, number defect-free). 6. Create the future state. Use lean principles to design an improved flow and process based on the waste identified.
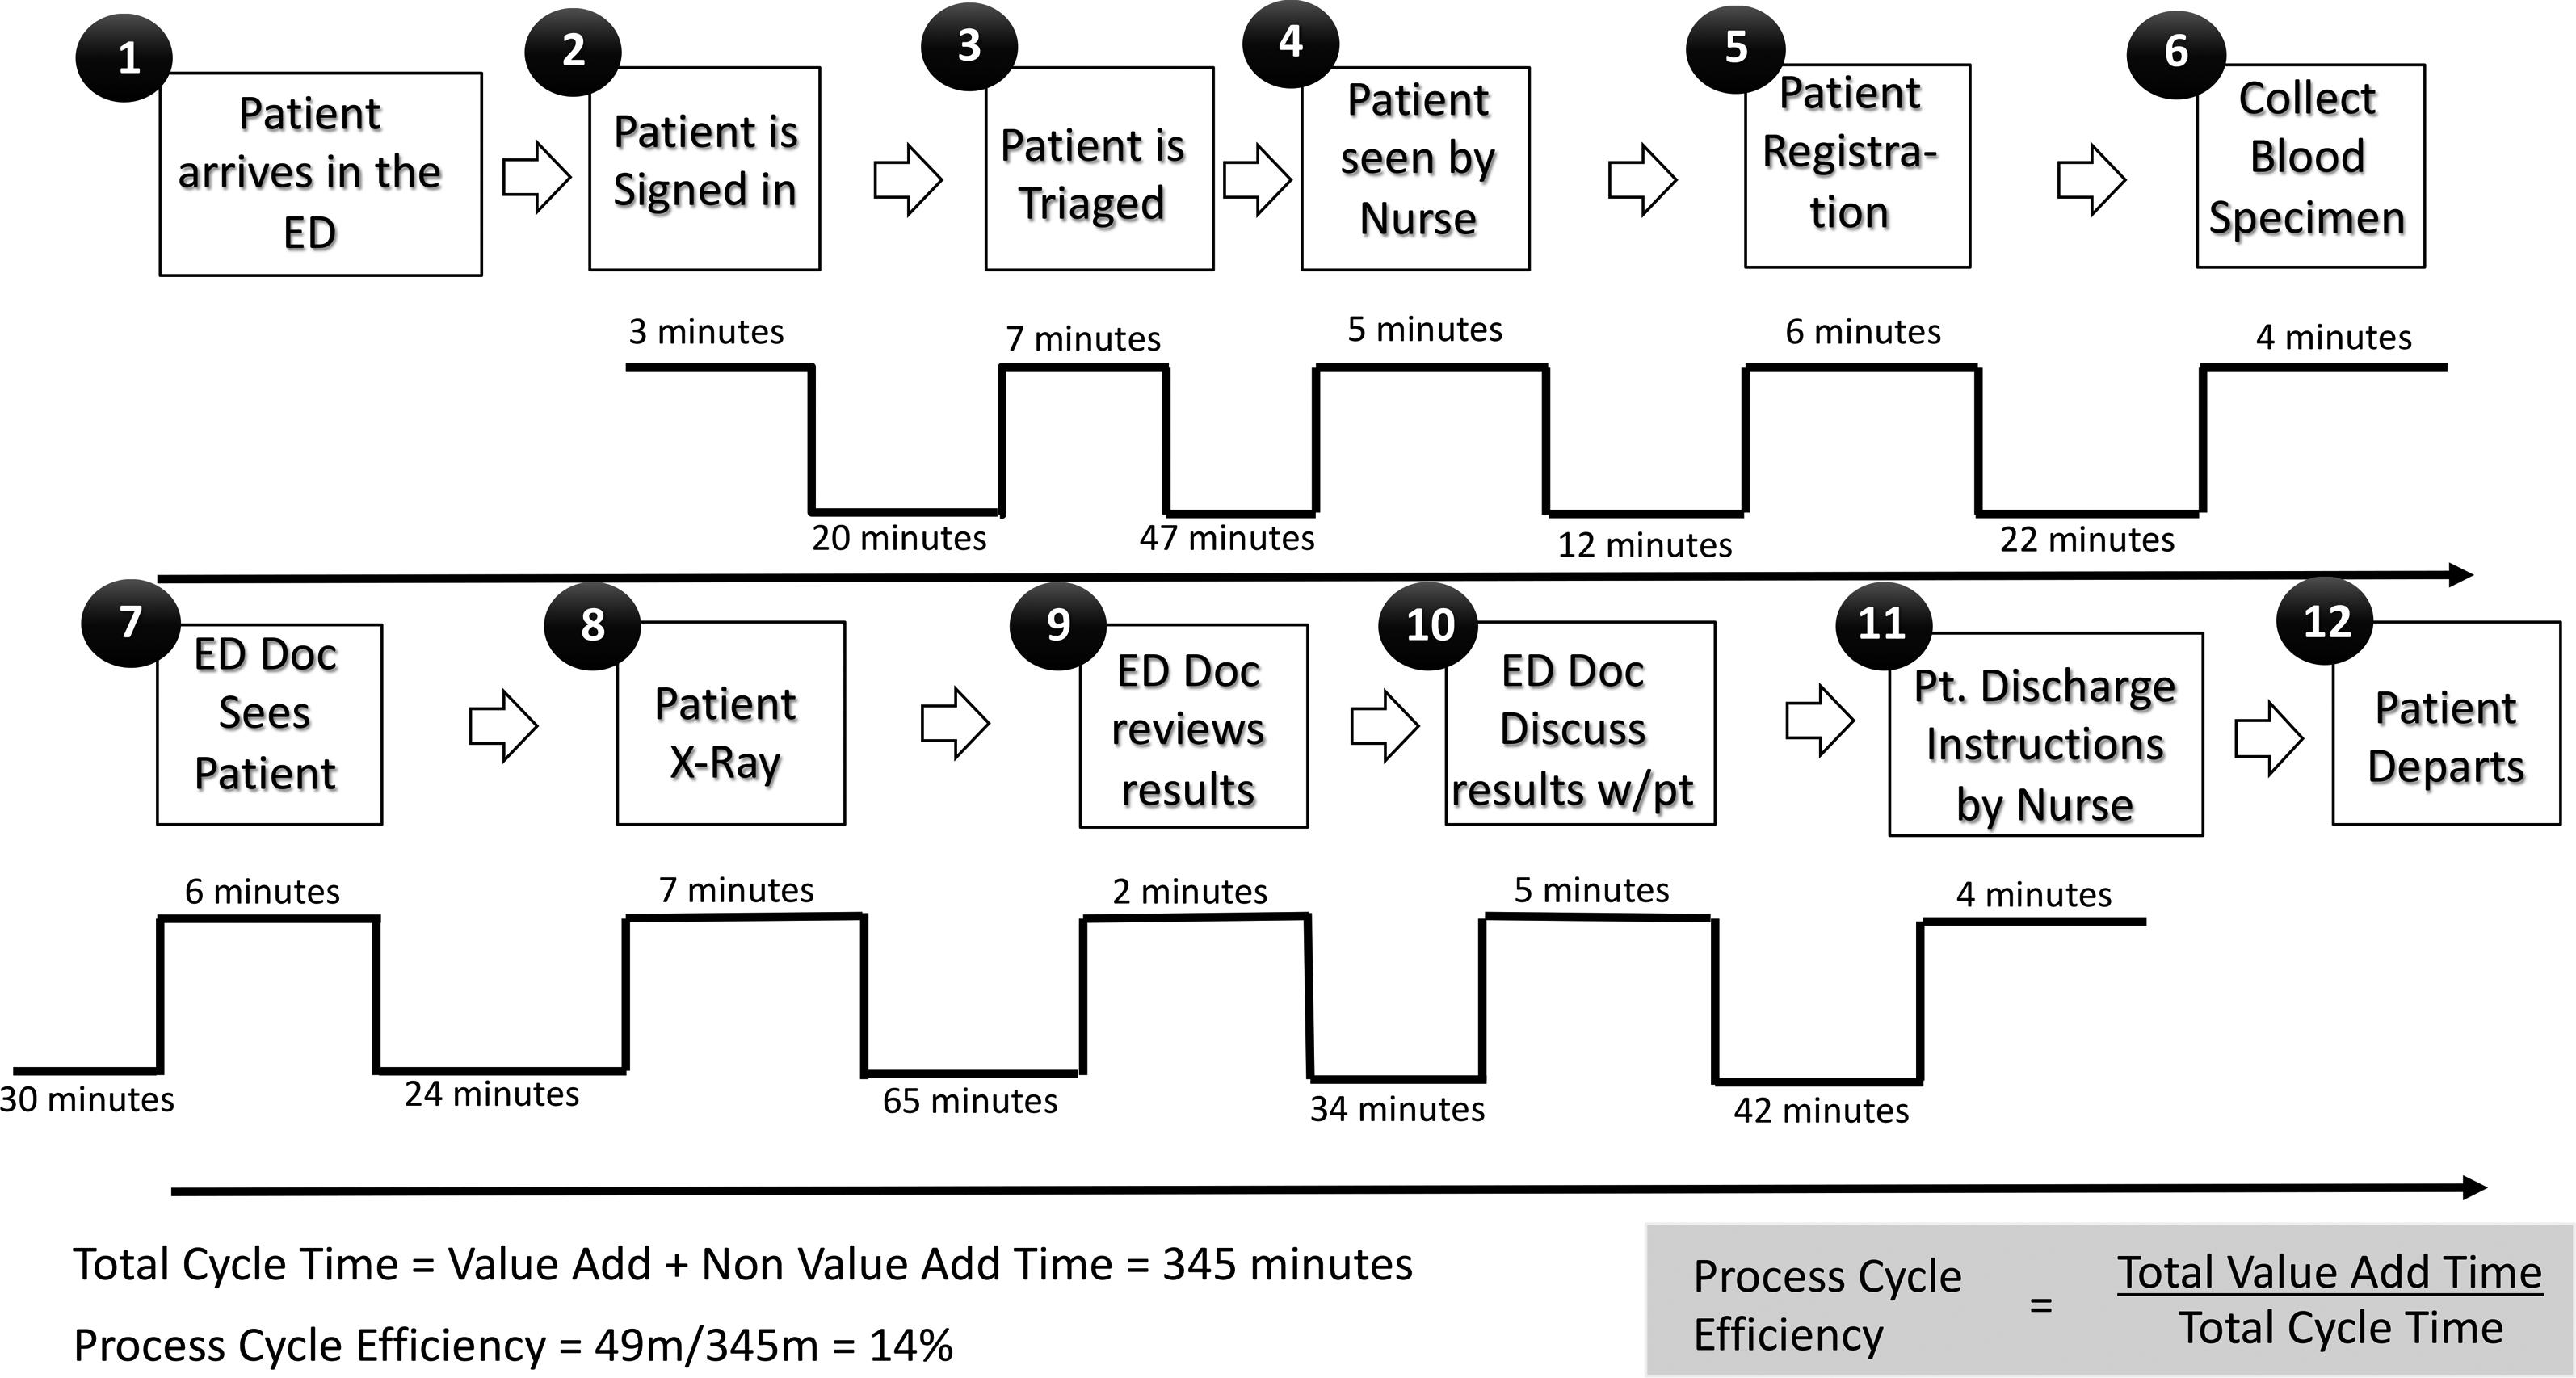
Figure 6.4 shows the flow of patients in an emergency room, with the associated process cycle efficiency.