
21 minute read
Seen Elsewhere


2020 VISION Biologist Peter Turchin, after a career using sophisticated mathematics to show how the interactions of predators and prey produce oscillations in animal populations in the wild, found himself drawn to history: could the rise and fall of human societies be captured by variables and equations? Could calculating the patterns and cycles of the past lead to an objective version of history – and help prevent a looming crisis? Human societies go through predictable periods of growth, during which the population increases and prosperity rises. Then come equally predictable periods of decline. These “secular cycles” last two or three centuries and culminate in widespread unrest – from worker uprisings to revolution. In 2010 he wrote a letter to the scientific journal Nature warning that a coming decade of dazzling technological progress risked being unravelled by mounting global political instability. This turmoil, he predicted, is due to peak in the US and western Europe around 2020. © Qlik
FREE E-BOOK ON BIG DATA A new, and free, e-book provides many useful pointers and tips to “getting more out of your business intelligence solution by super charging it with big data”. A list of “10 simple keys” includes using an agile analytics environment that can meet the needs of every user, providing access to analytics solutions anywhere, on any device and implementing a scalable solution that grows with your organization’s changing needs. It shows how to choose the right method to access data and discover hidden connections in data. It can be downloaded at: bit.ly/ downloadQLIK
SPORTS GIANT BUYS ANALYTICS FIRM Nike has acquired a company specialising in predictive analytics to improve its inventory management across different channels. The giant sports brand retailer paid an undisclosed sum for MIT start-up CEL ECT, which has a range of technologies across data science and software engineering environments. According to Erik Sprunk, Nike COO, the acquisition of CEL ECT with its consultancy connection to MIT scientists will provide a predictive capability that is insight-driven, data-optimised and highly focused on customer behaviour. Read more at: bit. ly/CELECT
THE THIRD WAVE OF ANALYTICS In a recent article, Barbara Darrow, a senior director of communications for Oracle, published on diginomica, asserted that business analytics has entered its “third wave”. She believes the analytics industry is entering a stage which combines the advantages of the IT model with the convenience and immediacy of user self-service to satisfy both constituencies. This third stage offers both central control to ensure compliance and accuracy while letting users run the reports they need when they need them. Analytics today is faster than ever before, especially when it is based on the right data, and this can help unlock new business insight quickly and thus new business opportunities faster as well.
She argues that this third wave makes full use of AI, Machine Learning (ML) and natural language processing (NLP). ML enables software to track user interactions and automate repetitive tasks thus freeing users to focus on the jobs at hand. But AI is only as good as the data that is fed to it – the more [good data] you feed to it, the better it gets. NLP also makes it easy for employees who are not data scientists or, for that matter, technologists to query their data and generate reports.
Before this third wave of analytics, it was common within companies for analytical groups to use a “patchwork of one-off analytic tools” to derive some forms of insight. There was also no standardisation of data synchronisation. If datasets cannot be synchronised companywide, there will always be a risk of insight repetition and even misuse. What is needed to avoid such eventualities is centralisation of AI systems across all enterprise datasets.
Oracle has produced an Interactive Business Analytics Assessment to enable organisations to carry out their own
peer comparisons. As a starting point to understand more about this type of technology, see the following link: bit. ly/InteractiveBAA
MACHINE LEARNING IN SUPPLY CHAINS Polly Mitchell-Guthrie, VP of Industry Outreach and Thought Leadership at Kinaxis, in her article, “How machine learning can heal a supply chain” in the September/October issue of Analytics magazine said: “The trends shaping supply chain today are global trade and tariffs, automation and labour shortages, the digital supply chain, rising consumer expectations of speed, and yes, machine learning. Machine learning opportunities in supply chain are abundant – improving forecast accuracy, inspection of physical assets, improved modelling for new product introductions, predictive asset maintenance, and great visibility across the collaborative supply chain network.” to uncertainty about product quality and seller credibility. Live chat tools allow e-vendors to communicate with customers in real time.
“Sellers with limited feedback benefit more from live chat conversations than sellers with a lot of feedback. And products with high past sales volume sell better after live chat, indicating a reinforcement effect,” continued Tan. “It is interesting that a seller can sell multiple products with varying levels of sales performance, and the seller feedback is measured based on all products.” The article can be seen at bit.ly/ChatPurchase

LIVE CHATS CAN INCREASE SALES Research published in the INFORMS journal Information Systems Research says live chats can actually increase sales and boost profits. The study, looking at data from Alibaba on consumers’ purchase decisions of Apple and Samsung tablets. “We found live chat can increase purchase probability of tablets by 15.9%,” said Xue (Jane) Tan of Indiana University. “We see that human interaction results in better sales performance.”
Jane Tan of Indiana University, Youwei Wang of Fudan University and Yong Tan of the University of Washington say the fact that sellers and buyers cannot speak in person, like brick-and-mortar stores, leads
IS AI O.R.? AI is O.R. was a claim made by not one but two plenary speakers at the OR Society conference in September 2019. John Hopes, President of the Society, drew attention to this in Inside OR (November 2019). He commented that the importance of AI to O.R. and vice versa has been a major theme of all Society events in 2019. For example, the Maths of O.R. conference showcased how leading O.R. research is right at the heart of machine learning, providing the advanced optimisation at the core of the technique. John said he had lost count of how many examples of the application of machine learning have been presented at Society events. When the technique is being applied to a management decision making problem, it very clearly falls within the remit of O.R. AI and its associated challenges are now a major area of focus for the OR Society.
THE GUARDIAN VIEW ON MACHINE LEARNING In a Guardian editorial in September 2019 (bit.ly/CleverML) concern was expressed that “it is in the nature of AI that makers do not, and often cannot, predict what their creations do”. The editorial concluded that “programmers do not understand completely the knowledge that intelligent computing acquires. If we did, we wouldn’t need computers to learn to learn. We’d know what they did and program the machines directly ourselves. They can recognise a face, a voice, be trained to judge people’s motivations or beat a computer game. But we cannot say exactly how. This is the genius and madness behind the technology. The promise of AI is that it will imbue machines with the ability to spot patterns from data, and make decisions faster and better than humans do. What happens if they make worse decisions faster? Governments need to pause and take stock of the societal repercussions of allowing machines over a few decades to replicate human skills that have been evolving for millions of years. But individuals and companies must take responsibility too”.
BUSINESS ANALYTICS MATURITY A study undertaken by Deloitte has found that most companies are not mature when it comes to business analytics. While 76% of survey respondents reported that their analytical maturity has increased over the past year, most are still using the traditional tools of spreadsheets (62%), such as Microsoft Excel, and business
intelligence programs (58%), such as Microsoft Power BI or IBM Cognos.
Analytics and Artificial Intelligence (AI) were not regarded with any level of esteem by business executives, although some 46% of executives saw AI as an important initiative over the coming years.
Thomas Davenport and his study co-authors think that data analytics is something everyone needs to build into their jobs. They argue that it is time to eliminate the idea that only highly skilled mathematicians or data scientists are the only ones responsible for business analytics and time to spread accountability broadly and train all employees about the role of analytics and AI in their respective jobs and not just rely upon spreadsheets for gaining insight. More at: bit.ly/SpreadsheetInsights are largely concerned with collecting, analysing and interpreting data of actual operations rather than of experiments made at the Institute”.
In his summary, Tippett comments that “the work does not make very much use of elaborate statistical or mathematical methods. Tests of statistical significance and simple analyses of variance are occasionally used, especially in the methodological studies, but mostly simple tabulations and averagings provide the results. The mainstay of the work is the analytical detail in which it is done, and the background of technical knowledge with which it is guided”. That was typical of O.R. at the time, but O.R. has come a long way during the last 70 years.
70 YEARS OF THE JOURNAL OF THE OPERATIONAL SOCIETY In 1950, the first volume of the Journal of the Operational Society, called at the time the OR Quarterly, was published by the Operational Research Club, as the Society was then known. The issues were very slim compared to today’s journal, with only one, short, article in each issue. In the second issue the activities of the Shirley Institute (The British Cotton Industry Research Association) were reported. The author, L. H. C. Tippett, said that the activities formed “a continuous spectrum from pure research at one extreme, through applied research to something that, in the form of special services to member firms, verges on operations. What part of this spectrum is to be termed operational research, or indeed if any part of it comes directly enough into contact with operations to be so termed, is a moot point”. The difficulty of defining O.R. is still a live issue! He continues: “The distinguishing feature of these activities is that they
AI, MACHINE LEARNING AND DATA ANALYTICS IN 2020 In an article in Analytics Magazine (bit. ly/5AIpredictions) Genpact Chief Digital Officer Sanjay Srivastava offered his top five predictions for AI, machine learning and data analytics for 2020. These included “Human in the loop”, the increasing value of judgment and reskilling. Sanjay believes that humans will play a critical role in the last mile of AI and data analytics. While machines predict and analyze, humans are needed for their judgment, empathy and creative problem-solving. In 2020, he sees the value of data decreasing while the value of human judgment increases.
AI DISCOVERS NEW ANTIBIOTIC In a Guardian article, see bit.ly/ antibioticML, Ian Sample reported that, for the first time, a powerful antibiotic has been discovered using machine learning. The research team at MIT says that halicin kills some of the world’s most dangerous drug-resistant bacteria. “In terms of antibiotic discovery, this is absolutely a first,” said Regina Barzilay, a senior researcher on the project and specialist in machine learning at MIT. “I think this is one of the more powerful antibiotics that has been discovered to date,” added James Collins, a bioengineer on the team at MIT. “It has remarkable activity against a broad range of antibiotic-resistant pathogens.”
The researchers first trained a “deep learning” algorithm to identify the sorts of molecules that kill bacteria. To do this, they created a database of the atomic and molecular features of nearly 2,500 drugs and natural compounds, and how well or not the substance blocked the growth of the bug E coli. This enabled the algorithm to learn what molecular features made for good antibiotics. Then it was set to work on a library of more than 6,000 compounds under investigation for treating various human diseases. The algorithm focused on compounds that looked effective but unlike existing antibiotics. This boosted the chances that the drugs would work in ways to which bacteria have yet to develop resistance.
The team then moved on to a massive digital database of about 1.5bn compounds and set the algorithm working on 107m of these. Three days later, a shortlist of 23 potential antibiotics was available, of which two appear to be particularly potent.
USING SIMULATION TO IMPROVE THE CUSTOMER EXPERIENCE AT EUROSTAR

WILLIAM JONES, KATHY KOTIADIS, MARIA PAOLA SCAPARRA AND JESSE O’HANLEY
EUROSTAR HAS LED THE WAY IN CROSS CHANNEL TRAVEL for the last 25 years. It is the only high-speed railway company operating international train services between London and continental Europe via the Channel Tunnel. One of its main appeals is that passengers can board trains in central London’s St Pancras International (SPI) station and reach either Paris Gare du Nord (GdN) or Brussels Midi, in the heart of the French and Belgium capitals, respectively, in just over two hours.
The popularity of the most recently launched service between London and Amsterdam shows the growing appetite among customers for international high-speed rail travel as a sustainable alternative to air travel. In addition to Paris, Brussels and Amsterdam, Eurostar further runs services to Lille, Disneyland Paris and seasonally to the south of France and French Alps.
The popularity of Eurostar’s services is, of course, an enormous boon to the company. However, this success has brought its own set of challenges. As an international service, passengers are required to pass through security screening and border controls (similar to airports) before boarding trains. Due to the growth in demand since services began in 1994, these checks became, at times, a bottleneck for passengers, occasionally resulting in queues. Terminal throughput, in turn, has constrained the number of services that can be operated and the number of tickets that can be sold. What is more, scheduling of rolling stock to carry upwards of 11 million passengers per year is no easy task. Travelling at 300km per hour back and forth to Europe each day invariably causes wear and tear on trains, which necessitates that they undergo regular maintenance. Operating across several countries and sharing infrastructure with multiple other operators while managing planned and unforeseen maintenance and coping with daily events that cause disruption to the schedule, Eurostar faces the highly complex challenge of ensuring trains are in the stations and ready to depart on time. Needless to say, this requires extensive and holistic forward planning on Eurostar’s part and the design of flexible operating procedures that are able to adapt to ever-changing conditions.
DEVELOPMENT OF STATION AND FLEETLEVEL DIGITAL TWINS Starting in 2018, Eurostar and University of Kent Business School began a 2-year Knowledge Transfer Partnership (KTP) funded by Innovate UK. The aim of the KTP was to add new simulation and analytical capabilities to Eurostar’s planning framework and use them to help tackle key strategic and operational business challenges.
Eurostar can best be thought of as a complex system of systems. The cumulative efforts of several systems operating seemingly autonomously, including each station across Europe and the UK, individual trains, maintenance depots and the control room, must interact together seamlessly in order for the service to run smoothly. Inefficiency or disruption within any one entity has ripple effects throughout the wider system.
Initial modelling efforts focussed on the London and Paris terminals, where passenger throughput is highest and improving customer experience is a top priority. Each terminal is a very complex system in its own right and understanding the causes of queues is not immediately obvious. Speak to any customer service team member who welcomes passengers as they arrive and he/she will tell you it is not just the number of travellers but the profile of a traveller that causes throughput to slow. The team in London will point to the increased time required to process a family group going on a skiing holiday compared to that of an individual business traveller off to a morning meeting in Brussels as evidence.
Working closely with frontline staff and terminal managers, detailed simulation models of SPI and GdN were developed using AnyLogic. Figures 1 and 2 show the resulting 3D visualisations of SPI and GdN respectively. In SPI passengers check in on the ground floor and proceed to the 1st floor via the escalators when their train is ready to board. In GdN, Eurostar’s border controls are on a raised mezzanine layer. Passengers proceed to the departure area and then return to the ground floor via escalators to board the trains. The simulation models combined both a discrete event type framework to represent the processing of passengers through a series of checkpoints as well as agent-based features to describe passenger profiles, their movements around the terminal, and interactions with each

FIGURE 1 3D VISUALISATION IN ANYLOGIC OF ST PANCRAS INTERNATIONAL DEPARTURE AREA
FIGURE 2 3D VISUALISATION IN ANYLOGIC OF PARIS GARE DU NORD
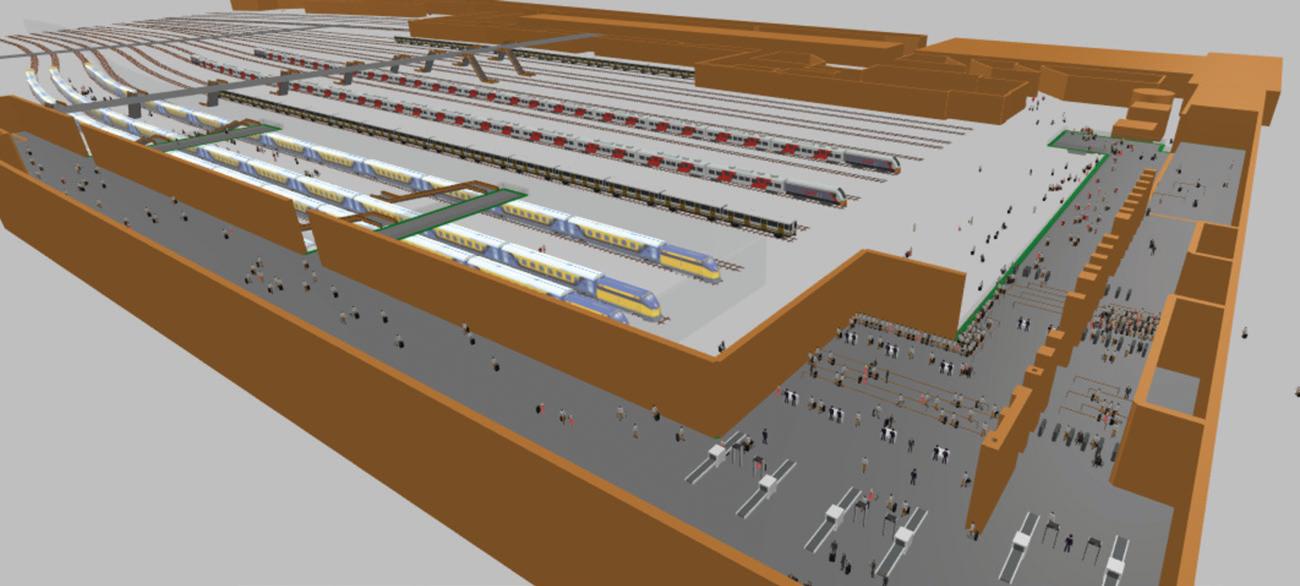
other. Ahead of any day, Eurostar can use the simulation, driven by data from their passenger bookings, to anticipate where and when bottlenecks are likely to occur in a station. That information can, in turn, be used to plan the availability and positioning of staff in the station and further adjust tensator (the retractable belt barriers on movable stanchions often seen in airports, busy department stores at check-out or anywhere there are queues) queue positions to ensure the processing of travellers can keep up with the speed of arrival. It can also be used to plan how to manage passengers in the event of foreseen or unforeseen disruption and to inform passengers how much time in advance of their service departure they need to arrive in order to check-in, clear screening and border control, and board their train. The use of simulation has been particularly useful to Eurostar by giving station staff a much better understanding of the key triggers that create queues and, in turn, adopt a much more proactive and less reactive approach to manage queues in response to varying arrival and passenger profile patterns. Besides day-to-day management, one of the more important benefits of the station simulation models has been to inform strategic level planning for addressing Eurostar’s longer-term growth objectives. A case in point was the in-depth testing of a range of proposed changes to the border control layout at GdN. Simulation helped to identify how best to position new border control stations and reorganise queue lanes in order to increase processing rates and smooth passenger flows through the station. The design ultimately adopted in May 2019 through iterative use of simulation and consultation with various companies, governments, and third-party stakeholders resulted in significantly improved throughput (c. 20%) and customer satisfaction throughout the summer peak period compared to the previous year.
Eurostar can use the simulation, to anticipate where and when bottlenecks are likely to occur in a station
At SPI, simulation has helped Eurostar to evaluate the merits of proposed plans to repurpose a portion of space used for arrivals into a new departure area. Simulation experiments provided a firm evidence base that this proposal could indeed increase departure throughput at peak times over the week and the year, without adversely affecting arrivals. Eurostar has since gone ahead with implementing the new departure area and, as a result, seen the highest ever throughput and customer satisfaction scores over the peak summer travel period.
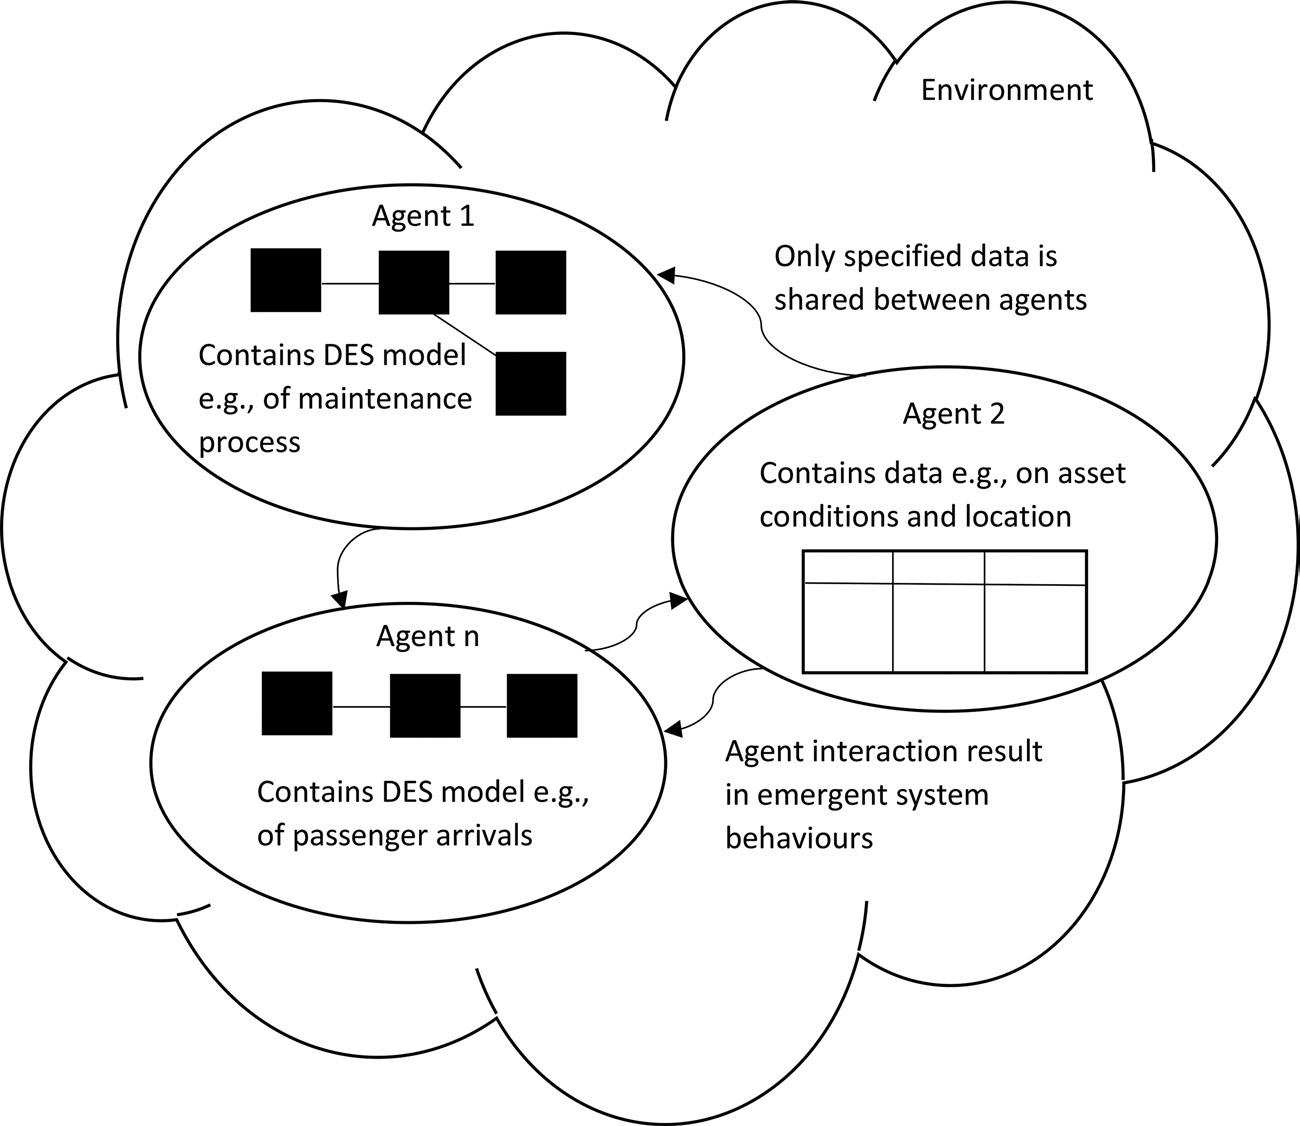
Despite the improvements, sporadic disruption on the rail network always risks spoiling the station teams’ best efforts. In an effort to mitigate against this, a second phase of the KTP project explored how simulation might be used to improve the robustness of timetables by modelling the movement and control of trains. Given the distributed nature of Eurostar’s operation, an agent-based modelling perspective was deemed the most suitable way to represent the different interacting components of the business involved with trains movement/control, including individual stations, maintenance depots, main control room and the trains themselves. Here, an agent-based architecture was implemented with individual agents defined for each sub-system being modelled (i.e., station, depot, control

room, train). The interactions of the different agents, in turn, produce emergent behaviours that effectively mimic how the overall system behaves in practice. As with the station-level simulation, the fleet-level simulation model adopts hybrid features in which discrete-event process models, contained within some agents, are used to capture the individual actions and processes of that agent. Other agents simply record data. Figure 3 shows a highly simplified illustration of the developed fleet-level simulation model structure.
The fleet-level model allows Eurostar to simulate a whole day's schedule based on the set of trains available. Simulation runs can indicate which trains are most at risk of delay and identify the source of those delays, which subsequently allows managers to propose preventative actions. This may be as simple as notifying a particular station that they are likely to be stretched during a certain period with several fast ‘turn arounds’ required to get incoming trains heading out again on time. In a more extreme case, such as when bad weather has led to significant unforeseen maintenance, resulting in a shortage of trains, preventive action involves notifying passengers that their train has been cancelled and re-allocating them to other services. Although very much a last resort, this is much better done a day in advance, rather than after
FIGURE 3 A HIGHLY SIMPLIFIED ILLUSTRATION OF THE DEVELOPED FLEETLEVEL SIMULATION MODEL STRUCTURE
passengers have arrived and are waiting in the station. For longer-term planning, the model can even be used to compare and rank proposed timetables.
EVIDENCE-BASED DECISION MAKING As well as a model to run and test out different scenarios, undertaking a simulation study provides several other ancillary benefits. Working with key

stakeholders to develop a model requires the group to agree and articulate their understanding of the impact of certain actions on the system. This logic can then be tested in the simulation and perceived wisdom challenged, perhaps leading to revised understanding. Further, the process requires a thorough exploration of available data. This can highlight gaps that need to be redressed by new data collection programmes and form the basis for improved monitoring of an organisation’s performance. Above all, for Eurostar, the simulation study has provided a sound and objective evidence base for decision making in situations where the best choice is not obvious. As the organisation continues to grow, simulation and other analytic techniques will play a key role in ensuring decisions are based on the best available information. This will help ensure the smooth flow of passengers through stations, confidence that they
will cross the channel as scheduled, and ensuring the Eurostar brand remains strong and the enthusiasm for fast, efficient, low carbon travel continues.
Philippe Mouly, Chief Operations Officer: “we have been able to take full advantage of the improvements of the station layout that we made during the spring. This is the outcome of an intensive work, mixing design thinking, staff involvement, and simulations. The result is very positive. In June, July and August we managed to accommodate through Paris Nord a record number of customers, with a record low number of delays and congestion. Consequently, customer satisfaction is at a high level, the Net Promoter Score being more than 10 points higher than last year on average for the last 3 months.”
William Jones was a Knowledge Transfer Partnership (KTP) Associate at Kent Business School, University of Kent. He worked with Eurostar International Limited to develop simulation and optimisation techniques to tackle the organisation’s key challenges and support long term strategic aims. He is now a postdoc at the University of Sydney working in the area of robotics and automation.
Kathy Kotiadis is a Reader (Associate Professor) in Management Science/

Operational Research at Kent Business School, University of Kent. Her main research interests include discrete event-simulation modelling applied to health care and simulation model development using problem structuring methods.
Maria Paola Scaparra is the head of the Management Science group at Kent Business School and a member of the Centre for Logistics and Heuristic Optimisation.
Jesse O’Hanley is a Professor of Environmental Systems Management in the Kent Business School, University of Kent and a member of the Centre for Logistics and Heuristic Optimisation. He is the winner of the 2015EURO Excellence in Practice Award for work on optimising river connectivity restoration.

