OXFORD AUSTRALIAN CURRICULUM SCIENCE SCI EN CE 7 HELENSILVESTER SECOND EDITION Sample chapter This sample chapter is provided in draft format for inspection purposes. To access a sample of the digital resources that support the series, visit: oup.com.au/ac-sci-info
No part of this publication may be reproduced, stored in a retrieval system or transmitted in any form or by any means. DRAFT
Science toolkit
Scientists work collaboratively and individually in the laboratory or the field, to plan or conduct investigations safely and ethically. Scientists make predictions, control variables and record their results accurately. Scientists communicate their results using scientific language.
Particle model
The properties of the different states of matter can be explained using the particle model. Scientists' understanding of matter has developed over thousands of years.
Mixtures
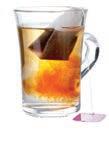
All things are made of materials. Many materials are mixtures. Some materials are not mixtures

– they consist of one pure substance. Mixtures contain a combination of pure substances that can be separated using a range of techniques.
Forces
A force is a push or pull, arising from the interaction between two objects. Change is caused by unbalanced forces acting on the object. Earth’s gravity pulls objects towards the centre of the Earth.

OXFORD SCI EN CE
Classification
Living things are called organisms. There are differences within and between groups of organisms. Classification is a system that helps organise the diversity of life on Earth. The system of classification continues to develop and change.

Ecosystems
Organisms interact with each other in their environments. Scientists use food webs and food chains to represent these interactions. Humans are part of the food chain and human activity can affect the interaction of the organisms.

Earth, Sun and Moon
The position of the Sun, Earth and Moon in the sky causes change on Earth, including seasons, tides and eclipses. Scientists can make predictions based on the relative positions of the Sun, Earth and Moon.
1
6
7
3
7
4 Experiments8
5
2 OXFORD UNIVERSITY PRESS No part of this publication may be reproduced, stored in a retrieval system or transmitted in any form or by any means. DRAFT
Introducing Oxford Science 7–10 Australian Curriculum, 2nd edition xx
Australian Curriculum: Science 7 scope and sequence .................. xx
CHAPTER 1
SCIENCE TOOLKIT ...X
1.1 Science is the study of the natural and physical world x
1.2 Scientists use specialised equipment x
1.3 Scientists take safety precautions x
1.4 Scientists use observation and inference to answer questions x
1.5 Science relies on measuring with accuracy xx
1.6 A Bunsen burner is an essential piece of laboratory equipment xx
1.7 A fair test is a controlled experiment xx
1.8 Graphs and tables are used to show results xx
1.9 Scientists analyse results and claims xx
1.10 Scientific reports communicate findings xx
1.11 Science as a human endeavour: Science skills are used to solve important problems xx
1.12 First Nations Australians use science xx
1.13 Cognitive verbs identify the tasks in a question xx Chapter 1 Review xx
CHAPTER 2
PARTICLE MODEL .. XX
2.1 There are three states of matter xx
2.2 Scientists’ understanding of matter has developed over thousands of years xx
2.3 The particle model explains matter xx
2.4 The particle model can explain the properties of matter xx
2.5 Increasing kinetic energy in matter causes it to expand xx
2.6 Science as a human endeavour: Scientists find ways to communicate xx Chapter 2 Review xx
CHAPTER 3 MIXTURES ............ XX
3.1 Mixtures are a combination of two or more substances XX
3.2 A solution is a solute dissolved in a solvent xx
3.3 Mixtures can be separated according to their properties xx
3.4 Mixtures can be separated according to their size and mass xx
3.5 The boiling points of liquids can be used to separate mixtures xx
3.6 Solubility can be used to separate mixtures xx
3.7 Science as a human endeavour: Wastewater is a mixture that can be separated xx
3.8 Science as a human endeavour: Materials recovery facilities separate mixtures xx Chapter 3 Review xx
CHAPTER 4
FORCES ................ XX
4.1 A force is a push, a pull or a twist XX
4.2 An unbalanced force causes change XX
4.3 Forces can be contact or non-contact XX
4.4 Magnetic fields can apply a force from a distance XX
4.5 Electrostatic forces are non-contact forces XX
4.6 Earth’s gravity pulls objects to the centre of the Earth XX
4.7 Friction slows down moving objects XX
4.8 Simple machines decrease the amount of effort needed to do work XX
4.9 A pulley changes the size or direction of a force XX
4.10 There are different types of machines XX
4.11 Science as a human endeavour: The forces in flight XX
4.12 Science as a human endeavour: Forces are involved in sport XX Chapter 4 Review xx
CHAPTER 5
CLASSIFICATION . XX
5.1 Classification organises our world xx
5.2 Living organisms have characteristics in common xx
5.3 Classification keys are visual tools xx
5.4 The classification system continues to change xx
5.5 Kingdoms can be used to classify organisms xx
5.6 Animals that have no skeleton are called invertebrates xx
5.7 Vertebrates can be organised into five classes xx
5.8 Plants can be classified according to their characteristics xx
5.9 The first Australian scientists classified their environment xx
5.10 Science as a human endeavour: Taxonomists classify new species xx Chapter 5 Review xxx
iv OXFORD SCIENCE 7 AUSTRALIAN CURRICULUM OXFORD UNIVERSITY PRESS
No part of this publication may be reproduced, stored in a retrieval system or transmitted in any form or by any means. DRAFT



Sample chapter OXFORD UNIVERSITY PRESS CHAPTER 6 ECOSYSTEMS ...... 101 6.1 All organisms are interdependent XX 6.2 All organisms have a role in an ecosystem XX 6.3 Energy flows through an ecosystem XX 6.4 Population size depends on abiotic and biotic factors XX 6.5 Introducing a new species may disrupt a food web XX 6.6 Ecosystems can be disrupted XX 6.7 Science as a human endeavour: Human management of ecosystems continues to change XX Chapter 6 Review xx CHAPTER 7 EARTH, SUN AND MOON .................... XX 7.1 The Earth, Sun and Moon interact with one another XX 7.2 The Moon reflects the Sun’s light XX 7.3 The Moon’s gravity causes tidal movements XX 7.4 Seasons are caused by the tilt of the Earth XX 7.5 Science as a human endeavour: Astronomers explore space XX Chapter 7 Review xx CHAPTER 8 EXPERIMENTS ................ XX STEAM projects xx Glossary xx Index xx O NT E TS T vCONTENTS No part of this publication may be reproduced, stored in a retrieval system or transmitted in any form or by any means. DRAFT
OXFORD AUSTRALIAN CURRICULUM
Oxford Science Australian Curriculum has been developed to meet the requirements of the Australian Curriculum: Science across Years 7–10. Taking a concept development approach, each double-page spread of Oxford Science represents one concept , one topic and one lesson. This new edition ensures students build science skills and cross-curriculum capabilities, paving a pathway for science success at VCE.
The series offers a completely integrated suite of print and digital resources to meet your needs, including:
> Student Book


> Student obook pro > Teacher obook pro.
> This Student Book combines complete curriculum coverage with clear and engaging design.
> Each print Student Book comes with complete access to all the digital resources available on Student obook pro. of

Focus on concept development


Chapter openers
• Every chapter begins with a clear learning pathway for students.
Reflect
• Students are encouraged to selfassess their learning against a set of success criteria in the Chapter checklist tables at the end of each chapter. If students do not feel confident about their learning, they are directed back to the relevant topic.
Concept statements

• Every topic begins with a concept statement that summarises the key concept of the topic in one sentence.
Learning intentions
• Learning intentions are clearly stated for every topic.

Key ideas

• Key ideas are summarised for each topic in succinct dot points.
Integrated links to engaging digital resources
• Where relevant, digital icons flag engaging resources that can be accessed via Student obook pro. These resources are directly integrated with the topic being covered.
Check your learning
Margin glossary terms
• Key terms are bolded in the body in blue text, with a glossary definition provided in the margin. in any form or by any means.

• Each topic finishes with a set of ‘check your learning’ questions that are aligned to the learning intentions for the topic. Questions are phrased using bolded cognitive verbs from Marzano and Kendall’s taxonomy, which state what is expected of a student and prepares them for studying senior science subjects.

vi OXFORD SCIENCE 7 AUSTRALIAN CURRICULUM OXFORD UNIVERSITY PRESS 87 Chapter checklist Now that you have completed this chapter, reflect on your ability to do the following: can do this. cannot do this yet. describe the properties of various mixtures, including solutions, suspensions, colloids and emulsions Go back to Topic 3.1 ‘Mixtures are a combination Page 62 contrast the terms ‘soluble’ and ‘insoluble’, ‘solute’ and ‘solvent’, and ‘concentrated’ and ‘dilute’ describe the properties of saturated solution explain the importance of water as solvent Go back to Topic 3.2 ‘A solution is solute dissolved in a solvent’. Page 64 describe the processes of decanting, sedimentation, flotation and magnetic separation define sediment, magnetism and flocculant explain how the properties of a substance can be used to separate them from mixture Go back to Topic 3.3 ‘Mixtures can be separated according to their properties’. Page 66 describe the processes of filtration, sieving and centrifuging explain how the size and mass of molecules of a substance relate to methods used to separate Go back to Topic 3.4 ‘Mixtures can be separated according to their size and mass’. Page 68 describe the processes of evaporation, distillation and crystallisation explain how different boiling points can be used to separate mixtures Go back to Topic 3.5 ‘The boiling points of liquids can be used to separate mixtures’. Page 70 describe the process of chromatography explain how the solubility of substance can be used to separate from a mixture Go back to Topic 3.6 ‘Solubility can be used to separate mixtures’. Page 72 describe the separation processes involved in Go back to Topic 3.7 ‘Science as human be separated’. Page 74 describe the separation processes involved in recycling at materials recovery facility Go back to Topic 3.8 ‘Science as human endeavour: Materials recovery facilities separate mixtures’. Page 76 key concepts in this chapter. Check your Teacher obook pro for these digital resources and more: Check your Student obook pro for these digital resources and more: Play Quizlet game to test your knowledge. Chapter quiz Test your understanding of this chapter with the chapter review quiz. INTRODUCING
SCIENCE 7–10
Key features
this Student Book PARTICLE MODEL 2 CHAPTER Scientists’ understanding of matter has developed over thousands of yearsDescribe how our understanding of matter has changed over time.Contrast the arrangement of particles in solids, liquids and gases. 2.2 The particle model explains matter Define the particle theory of matter and diffusion.Explain how kinetic energy effects particle movement. 2.3 There are three states of matter Describe the three states of matter and identify the processes that change substancesfrom one state to another. 2.1 150 151 Key ideas • Scientists use a food chain to show the flow of food and energy in an ecosystem. • Producers are found at the start of the food chain. • Consumers need to gain their energy from other organisms. • Food webs have many interlinking food chains. 6.1 All organisms are interdependent Food chains A food chain is way to show the direction that nutrients and energy flow between organisms. It consists of a chain of arrows that always points from the food to the animal doing the eating. For example, centipede eats wolf spider. This means the arrow points from the wolf spider to the centipede. The wolf spider provides the centipede with energy to grow and move. Retrieve Identify where producer plants get their energy. Comprehend Analyse Contrast food chains and food webs. Examine the food web in Figure 5. a Identify an animal that is both secondary and tertiary consumer. b Classify the type of consumer of the Apply Imagine that you were asked to find out how many different types of animals lived in your backyard or local park. how you would go about finding this out. Would it be possible to individually count them all?) Construct your own food web of organisms that you would find in the local park. Correctly identify producer and all the consumers. 6.1 Check your learning Figure 1 A simple food chain Figure A food chain starts with producers, such as plants, and moves through several orders of Primary consumer Secondary consumer Tertiary consumer Springtail Wolf spider Centipede Currawong Figure 2 An example of a backyard food chain Plants and plant-like organisms are always found at the start of food chains because they only need air, water, sunlight and few trace minerals to live and grow. These organisms are known as the producers of the ecosystem. Most producers convert light energy from the Sun into sugars (stored chemical energy). These sugars are known as biological molecules and are stored in the leaves, stems and roots. Animals cannot use the Sun’s energy in this way. They are and must eat other organisms to get the energy they need to survive. They use this energy to stay alive – to pump their blood, to move their muscles and to operate their nerves. The first consumers in a food chain are also referred to as first-order (primary) consumers Mountain water skink Figure chain showing the feral cat as a thirdStudying food webs Go to page In Figure the mountain water skink is first-order consumer because it eats plants. Because the noisy miner bird eats firstorder consumer, it is called second-order (secondary) consumer The feral cat eats the second-order consumer and becomes thirdorder (tertiary) consumer Most food chains only have four to five organisms in them. This is because only some of the energy is stored in and movement by the organism. Food webs Most animals, including humans, will eat more than one type of food. This can be represented in food web which shows several food chains intertwined. Some consumers will have several labels, depending on their eating habits. Figure shows food web in which there are four different producers. In this example, the mouse can be considered both a primary and secondary consumer because eats producer (wheat seeds) and primary consumers (snail and beetle). In this food web, the snail is only a primary consumer because it only eats producers (the trees). Food webs show how every living thing in the environment needs every other living thing to survive. When people talk about the ‘web of life’, they are referring to the interactions between all living things. a diagram that shows who eats whom in an ecosystem, energy are passed on plant or plant-like organism that is at the it produces its own food, an animal that can't convert the Sun's energy into sugars and instead it needs to survive an organism that eats only producers such as plants, algae and bacteria; it does not eat other consumers second-order (secondary) third-order (tertiary) primary and secondary at the top of the food chain food web extended relationships between different organisms A food web shows the extended relationships between various organisms. Eagle Spider Sparrow Snake MouseButcher bird Grasshopper Caterpillar Thistle Snail Food chains Learning intentions By the end of this topic, you will be • define ‘producer’ and ‘consumer’ and identify examples of each • construct and interpret food Once you’ve finished this topic, complete you should try next.
No part of this publication may be reproduced, stored in a retrieval system or transmitted
DRAFT
Focus on science inquiry skills and capabilities


Science toolkit


• The Science toolkit is a standalone chapter that explicitly teaches important science inquiry skills and capabilities.
Science as a human endeavour
• ‘Science as a human endeavour’ topics explore real-world examples and case studies, allowing students to apply science understanding.
Focus on practical work

Practical work appears at the back of the book

• All practical activities are organised in a chapter at the end of the book and signposted at the point of learning throughout each chapter.
Challenges, Skills labs and Experiments
• These activities provide students with opportunities to use problemsolving and critical thinking, and apply science inquiry skills.
Focus on STEAM
Integrated STEAM projects


• Take the hard work out of cross-curricular learning with engaging STEAM projects. Two fully integrated projects are included at the end of each book in the series, and are scaffolded and mapped to the Science, Maths and Humanities curricula. The same projects also feature in the corresponding Oxford Humanities and Oxford Maths series to assist crosscurricular learning.
Test your skills and capabilities
• This section provides scaffolded opportunities for students to apply their science understanding while developing skills and capabilities.
Problem solving through design thinking
• Each STEAM project investigates a real-world problem that students are encouraged to problem solve using design thinking.
Full digital support
• Each STEAM project is supported by a wealth of digital resources, including student booklets (to scaffold students through the design-thinking process of each project), videos to support key concepts and skills, and implementation and assessment advice for teachers.
viiOXFORD UNIVERSITY PRESS 196 OXFORD SCIENCE CURRICULUM OXFORD EXPERIMENT Half- the other beaker with cold tap water and add ice.Put the ball in water and leave for minutes.Keep the ring away from the iced water. 5 Try passing the ball through the ring. Record yourobservations; for example, ‘After cooling the ball in ice, it …’ Results Record your observations by describing what you did and howthe movement of the ball through the ring changed. Discussion 1 Describe how the size of the metal ball changed with:heating b cooling. Use the kinetic theory of matter to explain what washappening to the particles in the solid when heat wasapplied. 3 Describe how the size of the ball changes as the temperaturereturns to room temperature. Materials Ball and ring apparatus mL beakers Hot tap water Method 1 Look at your ball and ring. Try passing the ball through thering before heating and cooling. Record your observations;for example, ‘Before heating and cooling, the ball …’2 Half- ll 250 mL beaker with hot tap water. Place your ballin the hot water for 5 minutes. Keep the ring away from thehot water. 3 Try passing the ball through the ring. Record yourobservations; for example, ‘After heating in hot water,the ball …’ Aim To compare how introducing or removing heat affects gas. STATION 2: HEATING A LIQUID Materials mL conical ask Narrow glass tubing One-hole rubber stopper to glass tubing Food colouring Permanent marker Bunsen burner heatproof mat Gauze mat Tripod Matches Figure 1 Experimental set-up to show the expansion of a liquidon heating Method Put two drops of food colouring in the ask and ll the askto the top with water. 2 Place the stopper tted with the tube in the ask. Somewater will rise up the tube. Using the permanent marker,mark this rst level on 3 Place the ask on the gauze mat on the tripod and heat gently.4 After few minutes of heating, turn off the Bunsen burner.Mark the level of the water in the tube again. 2.5A Effect of heat STATION 1: HEATING A SOLID CAUTION! Wear safety glasses and lab coat, and tie longhair back, when using Bunsen burner. CAUTION! Make sure the apparatus is not left unattended. Thedye and water will spurt out the top of the glass tube ifallowed The flask and its contents may be hot. Allow allequipment time to cool before handling it. 5 Record how the level of the water changes as it cools. Figure Ping pong bats and ball 188 OXFORD SCIENCE VICTORIAN CURRICULUM CHAPTER 10 EXPERIMENTS 189 Aim To identify the factors that affect the horizontal movement of ball. Figure 1 Drawing scientific equipment SKILLS LAB Figure 1 Making ping pong ball bounce sideways What to do: 1 Working in pairs, use the retort stand to hold the cardboard cylinder 30 cm above the desk or table (Figure 1). Place the ping pong ball at the top end of the cylinder and let it roll through the tube to the floor. Do not throw or flick it. Measure how far the ball travels horizontally from the end of the tube to the floor. Record your result in table. Repeat steps 2 and 3 twice. This is your baseline to compare a potential change. Select one of the questions below to test it causes change in the horizontal distance travelled by the ping pong ball. Record your results in table. Write a sentence that describes the change you made and how the movement of the ball changed. What if? What if you change the colour of the ball? What if you change the type of floor covering? What if you drill holes in the ball? What if you change the angle of the tube? What if you push the ball down the tube? What if you vary the height from which the ping pong ball is dropped? CHALLENGE1.1 Sideways ping pong What you need: Ping pong ball, measuring tape or ruler, cardboard cylinder, retort stand, boss head and clamp 1.2 Drawing scientific diagrams STATION 1 What you need: Five boxes from your teacher (each containing five different pieces of equipment), grey pencil, ruler, piece of plain A4 paper What to do: 1 Share box with partner. Write down the name of each piece of equipment in the box and draw scientific diagram of the equipment in pencil. 2 When finished, return the box to the teacher and collect different box. Repeat step 1 until you have named and drawn the equipment in all five boxes. 3 Check the names and diagrams (and spelling) for the pieces of equipment from Figures and on pages 4–5. Correct any mistakes you may have made. Look at your list of equipment. Decide how you could divide the equipment into two groups. For example, you might group all pouring equipment together, all heating equipment or all safety equipment. In your notebook, write down the names of the group and the equipment that belongs in that group. STATION 2 What you need: Large flask, retort stand, boss head, clamp, funnel, small beaker (100 mL) What to do: 1 Set up the stand with the boss head and clamp, placing the boss head approximately two-thirds of the way up the stand, as shown in Figure 1. 2 Carefully place the flask neck into the clamp and tighten the clamp so that the flask is secure. (The flask should be approximately 10 cm above the bench, not resting on it.) 3 Predict how many beakers of water you think will take to fill the flask. In your notebook write: ‘Step 2 Prediction = __ beakers of water to fill the flask’. into the flask until is full. Write the answer in your notebook: ‘Number of beakers of water needed to fill the flask = __’ 5 Draw scientific diagram of the equipment that was set up. Label the equipment. 6 Take the apparatus apart and place each piece of equipment in its appropriate cupboard. Questions 1 Name the piece of equipment that was the most difficult to draw. 2 Name the piece of equipment that was the easiest to draw. 3 Name up to five pieces of equipment that you had not seen before and list their uses in laboratory. 4 Name two pieces of equipment that can be used for: holding things mixing chemicals pouring. 5 Describe where in your laboratory you could find: Bunsen burners tongs retort stands heatproof mats a rubbish bin beakers. Aim To correctly identify and draw scientific diagrams of science equipment. 14 SCIENCE 7 AUSTRALIAN CURRICULUM 15 OXFORD UNIVERSITY UNIVERSITY PRESS Kolkata, India, as in Toowoomba, Queensland.Scientists often check each other’s work byrepeating experiments to see if they get thesame results. To do this they need to usemeasurements that consistent with the original experiment. By using a standardsystem of measurement, scientists everywherecan understand and build on each other’s work.Five kinds of measurement are importantwhen you are exploring science: volume, mass,temperature, time and length. In 1790, the then king of France, Louis XVI,decided that in his country at least uniformsystem should be established. This wasultimately called the metric system. The idea of having standard for measurement soon spread, so all types ofmeasurement were included. metric system is now used by scientists worldwide. Ameasurement of 2.45 m to be the same in Cairns, Queensland, as in New York, USA.A temperature of 37°C is just as hot in Science relies on measuringwith accuracy1.5 As you discovered in the ‘Humanthermometer’ activity, your body picks upchanges in the environment, but it cannot tellyou the exact temperature of the water or air.Your body will also become used to warmertemperatures in summer and colder temperaturesin winter. What might seem like nice 18 degreesin winter, might feel cold in summer. For thisreason scientists rely on accurately measuring allthings during their experiments. Old ways of measuring For thousands of years, distances have beenmeasured by comparing them to parts of thehuman body (see Table 1). The height of a horse,for instance, is still measured in hands. Somecountries, such as the United States of America,measure distance in feet. A standard system isnow used, instead of human hands and feet. What if? Human thermometer What you need: Very warm water, ice-cream containers,room temperature water, cold water, icecubes, thermometer to do: Half fill the first container cold and add the ice cubes. 2 Half fill second container with room temperature water. Half fill the third container with very water. Place one hand in the water and the other in the warm water for minutes. 5 Remove both hands and place themboth in the room temperature water. What do you notice about how hot/cold the water is? Do both hands tell your brain thewater is the same temperature? Use thermometer to measure the temperature of the water in all threecontainers. What What if a foot was put in the waterinstead hand? Table Measurements used in ancient civilisations Old unit Civilisation Estimated equivalent today (cm)Royal foot Ancient Egypt 25.4Royal cubit Ancient Egypt 52.4Finger Ancient Mesopotamia 1.9 Ancient Mesopotamia 7.5Fathom Ancient Mesopotamia Knuckle Ancient Greece 3.9 Ancient Measuring mass andvolume Go to pageSKILLS LAB Measurement and units Using human body parts for basic measurements caused confusion and argumentsbecause everyone’s body size is different. Somany different systems were being used tomeasure things that people were often cheated,such as when buying goods by weight. units standard measurements metric system decimal system measurement; kilograms, litres and so on kilometre (km) metric unit of length, equal to 1000 metres centimetre (cm) a metric of length, equal to one-hundredth of Figure 3 Time watch or clock to the correct time tells you the time ofday. A stopwatch measures how muchtime has passed. In your experiments,measurements will often have unit called seconds (s) Figure Length Measurements of length can be shown using unit calledmetres, with the symbol ‘m’. For longdistances, kilometres (km) are used. For short distances, centimetres (cm)millimetres (mm) can be school science, the devices we use tomeasure length and distance are thetrundle wheel (pictured), metre rule andtape measure. Figure 2 Mass measures the of matter or substance object. Mass is measured in units calledgrams (g) kilograms (kg) tonnes(t) Smaller masses are measured inmilligrams (mg) Mass-measuringdevices called scales or balances.You will use an balance to mass. Figure 4 Temperature This is usuallymeasured using thermometer. Somethermometers have a digital scale.Measurements of temperature have theunit called degrees Its symbol 20 Place the measuring cylinder on a surface. Look in line with the top of Read the at the bottom the meniscus. (Here the correct measurement is 34 mL.) Meniscus level here Figure Volume This measures how much spacesomething takes up. Measurements of liquid volumescan with units called (mL) In science, beakers and measuring cylinders areused to measure the volume of liquids. Some beakershave measuring scale on them, but measuring cylindersare more accurate than beakers. Scientists usually preferto use measuring cylinders to measure volume. Liquidscling to the sides of containers, forming slightly curvedsurface. This is called meniscus read a meniscus. Measurements of the volume ofsolid objects have units such as CAUTION! Make sure it is safe to putyour hand in the water. Video Measurement, errors accuracy millimetre (mm) a metric unit length, equal to one-thousandth gram (g) kilogram (kg) unit of mass, equivalent grams tonne (t) unit of mass, equivalent to 1000 kilograms milligram (mg) of mass, equivalent to one-thousandth of a gram sixtieth of a temperature scale and unit of measurement unit of volume cubic centimetre (cm a volume equivalent to that of cube of length the curved upper surface of liquid in a tube millilitre (mL) unit of measure small quantities of liquids, equivalent to onethousandth matter anything that has space volume; matter is made up of Key ideas • Scientists use equipment to measure their results.Scientists need to compare their measurements with one another.The standard metric system is used by scientists around the world to measure distance(metres), volume (litres) and mass (grams). Learning intentions By the end of this topic, you will be able to: • understand explain how to accurately measure data using a variety of equipment. INTRODUCING OXFORD SCIENCE 7 AUSTRALIAN CURRICULUM 80 OXFORD SCIENCE AUSTRALIAN CURRICULUM 81CHAPTER MIXTURES Washing dishes or using the bathroom produces wastewater containing a mixture of vegetable matter, paper, cloth and plastics. This cannot be released directly into waterways without harming the environment. Scientists use their knowledge of separating mixtures to make the water safe. Many unusual things have been found at wastewater treatment plants, including BMX bikes, toys, false teeth and even money. One of the biggest problems currently is caused by the small stickers found on fruit. If eaten accidentally, the small plastic stickers pass through the digestive system and end up at the water treatment plants. //SCIENCE AS A HUMAN ENDEAVOUR// Wastewater is a mixture that can be separated3.7 3.7 Test your skills and capabilities Figure 1 A water treatment plant. Figure 2 Flocculation clumps together the suspended particles in wastewater. Figure 3 An algal bloom. Figure Chlorine and wastewater tanks in tertiary water treatment plant. Intake Chemical addition MixingCoagulation Sedimentation Disinfection Storage Distribution Figure Summary of the water treatment process. Primary treatment Initially, the wastewater is filtered to remove any large products. Aluminium sulfate is added to the wastewater to encourage any remaining suspended particles to coagulate (or clump together). This process is called flocculation. The small clumps are then left to sit in sediment ponds to allow the clumps to form sediment on the bottom of the pond. This sediment is called sludge and can be removed and disinfected. Many industries use the sludge Secondary treatment The remaining wastewater often contains levels of nutrients, such as nitrogen and phosphorus, When these nutrients enter waterways in large amounts, algae feed off them and grow into large blooms. The large numbers of algae use all the oxygen and nutrients in the water, leaving other aquatic life to starve. Secondary waste treatment pumps the wastewater through series of tanks where bacteria remove the excess nutrients from the water. Tertiary treatment Sometimes the water will be treated at tertiary treatment plant. Once again, the water is filtered to remove any particles that may be left in the water. Chlorine can be added (just as in swimming pool) to kill any bacteria that may still be in the water. Analysing data in graphs Scientists often gather data from the water treatment plants to help them understand how water is used, as well as the health of the population. Recording, processing and analysing data are essential skills in science. Water use is often an indication of the amount of wastewater produced per person every year. A graph of the annual water consumption per person is shown in Figure 6. Identify the city that uses the highest amount of water per person each year. b Identify the city that uses the lowest amount of water per person each year. Identify the amount of water that the average person in Canberra uses in a year. d Describe one reason why a person living in Brisbane uses more water than person living in Melbourne. Seqwater, the water supply authority in South East Queensland, encourages locals to save just L of water per day. Use Figure to identify South East Queensland used the most water. Identify the month that residents in South East Queensland used the least water. The number of people (population) of South East Queensland has continued to increase for each of the years shown on the graph in Figure 7. Use this information to explain whether South East Queenslanders have become more or less efficient with their water usage between December 2012 and March 2020. 3 The more water that is used by people living in Brisbane the greater the amount of sewage that needs to be treated. Design a poster that encourages the people in your house to use less water in their everyday activities. (HINT: Use the communication skills you learnt in Chapter 1.) Canberra Adelaide PerthMelbourneNewcastle Brisbane SydneyGoldCoast Australian cities Kilolitres of water Figure Annual water consumption per person. Figure 7 Total water use in South East Queensland. Total water use in South East Queensland (per person) Total water use in South East Queensland Consumption (litres) Dec2012May2013Dec2013Apr2014Sep2014Sep2015Apr2016Nov2017Mar2020 40 120 200 Learning intentions By the end of this topic, you will be • describe the separation processes 242 243 [STEAM project 1] How can we reduce pollution in local waterways so that biodiversity is protected? Australia is one of the driest continents in the world. But according to an Australian Government report, Australians consume more water per person than any other country, using an average of 100 000 L per person every year. Water is an important resource in Australia, so is critical to manage our waterways carefully. Australia has many waterways, including rivers, groundwater systems, wetland environments and other human-made passages for water. Waterways are vital to our existence and are valuable economic assets. Waterways play an important role in supporting biodiversity in our local areas, by providing habitats for wildlife (such as sh and turtles) and plants. Humans rely on local waterways for drinking water, irrigation of crops, industrial processes and recreational activities. But sometimes these human activities can impact waterways, endangering the biodiversity of a local area. Waterways also hold spiritual signi cance for many people. Due to the importance of local waterways to Aboriginal and Torres Strait Islander peoples, waterways are part of our cultural heritage. We must, therefore, manage our waterways to maintain their complex ecosystems. Water quality and contaminants A contaminant is substance that pollutes or poisons something. Contaminants can occur naturally, or be caused by humans – such as microplastics, pesticides and litter. Litter is an example of a physical contaminant, Figure Algal blooms occur when an oversupply of nutrients in the water allows algae populations to quickly increase, covering the water’s surface. Contaminants such as industrial fertiliser running into waterways can cause algal blooms. Algal blooms are often toxic to other aquatic life. while pesticides are examples of chemical contaminants. There are many types of contaminants, which are often more heavily concentrated in industrial, urbanised or agricultural areas. Human land-use and major weather events, such as oods and bush res, can introduce contaminants into local waterways and affect the water quality. When water becomes contaminated, it can affect the health of an entire ecosystem, leading to serious environmental issues, such as acidic soil or algal blooms. So it is important for all waterways to be managed to protect the organisms that rely on them to survive. HUMANITIES In Geography this year, you will learn about water as a resource and how connects places as it moves through the environment. You will also study the variability and scarcity of water in Australia. In History, you will investigate the importance of water in sustaining ancient civilisations. To complete this task successfully, you will need to investigate the health of a local waterway and the nearby land uses that may be introducing contaminants to the water. You will then need to research strategies that will help to reduce these contaminants. You will nd more information on this in Chapter ‘Water as resource’ and Chapter 3 ‘Valuing and managing water’ of Oxford Humanities 7 Victorian Curriculum Your task Design a device that will reduce the contaminants that are entering your local waterway, in order to protect biodiversity in the area. Figure 3 The Yarra River is known to local Wurundjeri people as Birrarung, and has great cultural significance. Figure 2 Litter is a contaminant in local waterways, such as the River Torrens in Adelaide. MATHS In Maths this year, you will consolidate your understanding of volume and capacity and different units for measuring them. You will learn to perform calculations involving fractions, decimals and percentages both with and without digital technology. To complete this task successfully, you will need to combine these mathematical skills with your understanding of chemical and physical changes. You can then determine the scale of the problem and design your prototype in detail. You may need to perform calculations that relate the concentrations of contaminants, the dimensions of your prototype, the volume of water that can and needs to be processed, and the quantity of contaminants that need to be disposed of. You will nd help for applying these maths skills in Chapter 3 ‘Fractions and ratios’, Chapter 4 ‘Decimals and percentages’, and Chapter 9 ‘Length, area and volume’ of Oxford Maths Victorian Curriculum SCIENCE In Science this year, you will learn about how particles move in solids, liquids and gases. Each of these states of matter occurs during the water cycle, which is in uenced by both nature and humans. When water is combined with other particles, forms different types of solutions and mixtures. The unique properties of each particle (including the water molecule) can allow it to be isolated and puri ed once more. To complete this task successfully, you will need to consider the properties of each contaminant, and how these properties can be used to separate the contaminants from the water. You will also need to be familiar with the scienti c method, and understand how to conduct fair test. You will nd more information on this in Chapter 2 ‘Particle model’ and Chapter 3 ‘Mixtures’ of Oxford Science 7 Victorian Curriculum
No part of this publication may be reproduced, stored in a retrieval system or transmitted in any form or by any means. DRAFT
OXFORD SCIENCE
AUSTRALIAN CURRICULUM
Key features of Student obook pro
> Student obook pro is a completely digital product delivered via Oxford’s online learning platform, Oxford Digital
> It offers a complete digital version of the Student Book with interactive note-taking, highlighting and bookmarking functionality, allowing students to revisit points of learning.
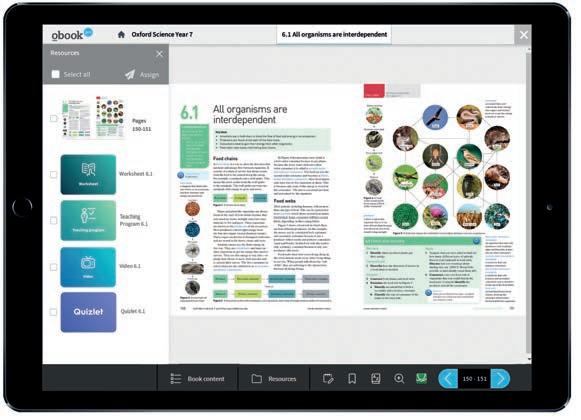
> A complete ePDF of the Student Book is also available for download for offline use and read-aloud functionality.
Focus on eLearning
Complete digital version of the Student Book
• This digital version of the Student Book is true to the print version, making it easy to navigate and transition between print and digital.
Videos
• Videos are available online to support understanding of concepts or key practical activities.
Quizlet
• Integrated Quizlet sets, including real-time online quizzes with live leaderboards, motivate students by providing interactive games that can be played solo or as a class. Quizlet can be used for revision or as a topic is introduced to keep students engaged.
Interactive quizzes
• Each topic in the Student Book is accompanied by an interactive assessment that can be used to consolidate concepts and skills.
• These interactive quizzes are autocorrecting, with students receiving instant feedback on achievement and progress. Students can also access all their online assessment results to track their own progress and reflect on their learning.
> integrated Australian Concise Oxford Dictionary look up feature
> targeted instructional videos for key concepts, practicals and worked examples
> interactive assessments to consolidate understanding
> integrated Quizlet sets, including real-time online quizzes with live leaderboards
> access to their online assessment results to track their own progress.
Benefits for students
viii OXFORD SCIENCE 7 AUSTRALIAN CURRICULUM OXFORD UNIVERSITY PRESS
INTRODUCING
7–10
No part of this publication may be reproduced, stored in a retrieval system or transmitted in any form or by any means. DRAFT
Key features of Teacher obook pro
> Teacher obook pro is a completely digital product delivered via Oxford Digital
> Each chapter and topic of the Student Book is accompanied by full teaching support. Teaching programs are provided that clearly direct learning pathways throughout each chapter, including ideas for differentiation and practical activities.
> Teachers can use their Teacher obook pro to share notes and easily assign resources or assessments to students, including due dates and email notifications.
Focus on assessment and reporting
Complete teaching support
• Teaching support includes full lesson and assessment planning, ensuring there is more time to focus on students.
Additional resources
• Each chapter of the Student Book is accompanied by additional worksheets and learning resources to help students progress.
> In addition to online assessment, teachers have access to editable class tests that are provided at the conclusion of each chapter. These tests can be used as formative or summative assessment and can be edited to suit the class’s learning outcomes.
> Teachers are provided with laboratory support through experiment answer guidance, laboratory technician notes and risk assessments to ensure safe learning experiences.
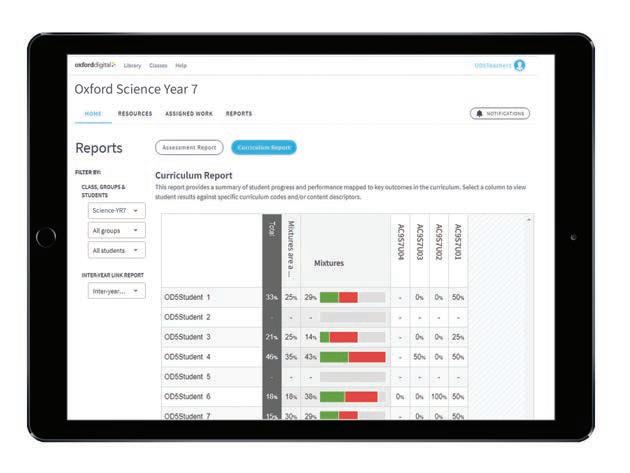
Curriculum and assessment reports
• Teachers are provided with clear and tangible evidence of student learning progress through curriculum and assessment reports.
• Assessment reports directly show how students are performing in each online interactive assessment, providing instant feedback for teachers about areas of understanding.
• Curriculum reports summarise student performance against specific curriculum content descriptions and curriculum codes.
Benefits for teachers
ixOXFORD UNIVERSITY PRESS
INTRODUCING OXFORD SCIENCE 7 AUSTRALIAN CURRICULUM
No part of this publication may be reproduced, stored in a retrieval system or transmitted in any form or by any means. DRAFT
EARTH, SUN AND MOON
7.1
The Earth, Sun and Moon interact with one another

> explain how the length of a day and a year relate to the movements of the Earth
> describe the differences between a total and partial solar eclipse.
7.2
The Moon reflects the Sun’s light
> identify and describe the phases of the Moon and lunar eclipse
> contrast a solar and a lunar eclipse.
7 CHAPTER
No part of this publication may be reproduced, stored in a retrieval system or transmitted in any form or by any means. DRAFT
7.3
The Moon’s gravity causes tidal movements
> explain how the Moon’s gravity causes tidal movements
> describe the relationship between the Moon and tides that was recognised by early First Nations Australians.
7.4
Seasons are caused by the tilt of the Earth
> define the terms ‘solstice’ and ‘equinox’
> explain how seasons are related to the position of the Sun and Earth
> describe the importance of seasons and seasonal calendars to First Nations Australians.
7.5
Science as a human endeavour: Astronomers explore space
> identify examples that show how advances in technology and scientific knowledge have improved our understanding of the solar system.
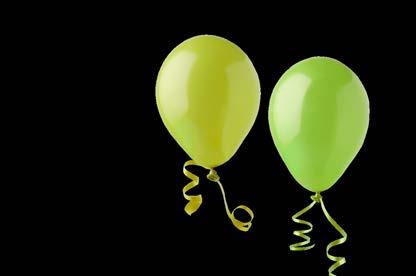
What you need: Ruler, 2 balloons
What to do:
1 Blow up one balloon until it is 20 cm in diameter. This balloon represents the Earth.
2 Blow up the other balloon to 5 cm in diameter. This balloon represents the Moon.
3 Move the two balloons until they are 5 m apart This represents approximately how far the Earth is from the Moon.
4 With your partner, discuss what effect the Moon has on the Earth. Does the Moon always appear to be the same size when viewed from Earth?
What if?
» What if the Moon was closer to the Earth? Would we notice any differences?
No part of this publication may be reproduced, stored in a retrieval system or transmitted in any form or by any means. DRAFT
7.1 The Earth, Sun and Moon interact with one another
Learning intentions
By the end of this topic, you will be able to:
• explain how the length of a day and a year relate to the movements of the Earth
• describe the differences between a total and partial solar eclipse.
star a celestial body appearing as a luminous point in the night sky solar energy energy made by atoms colliding with each other in the centre of the Sun
Key ideas
• The solar system is the collection of planets, their moons and smaller bodies (asteroids, meteors and comets) that orbit the Sun.
• The Moon orbits the Earth every 27.3 days.
• The Earth orbits the Sun every 365.25 days.
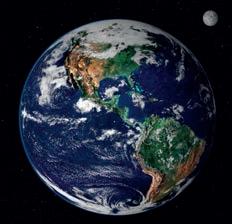
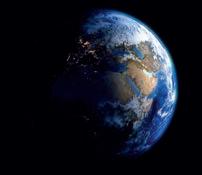
Our solar system
Our Sun is a star. It is the closest star to Earth and provides all the energy for every living thing. This solar energy is made by atoms colliding with each other in the centre of the Sun. Without the heat and light given off by the Sun, there would be no life on Earth.
Night and day
Day and night are caused by the Earth spinning on its axis, an imaginary straight line joining the North and South Poles. You can model this in your classroom. Stand facing the front of the room and turn around on the spot until you face the front once again. This is one complete rotation. The Earth takes 24 hours to complete one full rotation.
Because of its shape, only half the Earth is exposed to sunlight at any given time. The other half is in shadow. The part facing the Sun is experiencing daytime, whereas the part facing away from the Sun is experiencing night. Because the Earth rotates, all parts of the Earth experience day and night, just at different times.
In Figure 2, it is daytime for countries on the right and night-time for those on the left. Can you tell in which countries the Sun would be rising or setting?
solar system the Sun and all the planets, dwarf planets, moons and asteroids that travel around it and each other orbit the path a planet follows around the Sun or a star; the path a moon follows around a planet
leap year a year, occurring once every four years, with 366 days axis an imaginary straight line joining the North and South Poles of the Earth
Our small planet (it is the fourth smallest in the solar system) is 1 000 000 times smaller than the Sun. The solar system is made up of the Sun at the centre and all the planets, dwarf planets, moons and asteroids that travel around the Sun or each other. The path taken by a planet is called its orbit because of its oval or ‘elliptical’ shape.
A year
A year is the time it takes a planet to make one orbit around the Sun. It takes 365.25 days for the Earth to complete one orbit. This means that every four years our calendar is one full day behind (4 × 0.25 days). We account for this by adding an extra day (29 February) every leap year.
Figure 2 The half of the Earth facing the Sun experiences day and the half in shadow experiences night.
Have you ever watched the New Year’s Eve celebrations around the world on television?
The celebrations in New Zealand are always just before those in Australia. The Earth rotates west to east. or in any form or by any means.
Figure 1 The Earth is held in orbit by the Sun’s gravitational pull.
4 OXFORD SCIENCE 7 AUSTRALIAN CURRICULUM OXFORD UNIVERSITY PRESS
No part of this publication may be reproduced, stored in a retrieval system
transmitted
DRAFT
We know this because as the Earth spins toward the Sun, we see the Sun rise above the horizon in the eastern sky. Sunset occurs when the Earth rotates away from the Sun. New Zealand is east of Australia, so the Sun rises in their sky first.


Solar eclipse


One of the first scientists and mathematicians who investigated the time it took for the Moon to travel around the Earth was al-Battani (whose full name was Abu Abdallah Muhammad ibn Jabir ibn Sinan al-Raqqi al-Harrani al-Sabi al-Battani) in the tenth century. Although he was not the first astronomer to build a model of how the Moon travelled around the Earth, his was one of the most accurate. He was able to correctly calculate the cause for a solar eclipse.
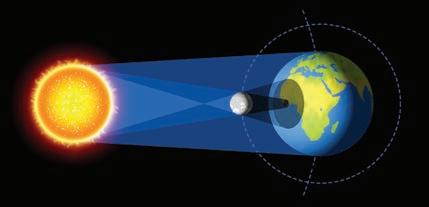
This occurs when the Moon passes between the Sun and the Earth once every 27.3 days. Occasionally, the Moon will be in a position where it blocks some of the light from the Sun. This is known as a solar eclipse (Figure 3). During a total solar eclipse , the Moon blocks the maximum amount of light from the Sun and the sky goes dark for a short time during the day. The last total eclipse of the Sun visible from northern Australia was on 13 November 2012; the next one is due on 20 April 2023 in Western Australia.


7.1 Check your learning
Retrieve
1 Define the terms ‘rotation’ and ‘orbit’. Comprehend


Figure 3 When the Moon is positioned between the Sun and the Earth, it is called a solar eclipse.

When a total solar eclipse is visible in Australia, people somewhere else in the world may only see a partial solar eclipse. This is when only some of the Sun’s light is blocked. Because the Earth and Moon are always moving around their orbits, an eclipse takes a few minutes and then gradually passes as the Earth and Moon continue their motion (Figure 4).
You should never look directly into a solar eclipse as it could damage your eyes!
total solar eclipse when the Moon blocks the maximum amount of light from the Sun, as seen from Earth


partial solar eclipse when only some of the Sun’s light is blocked by the Moon


Analyse


2 Explain why the calendar adds an extra day in February every four years (leap year).

3 Explain the difference between a total solar eclipse and a partial solar eclipse.


4 Explain why a person in Victoria and their friend in Darwin do not see exactly the same solar eclipse.


5 Figure 3 shows the shadow caused by the Moon during a solar eclipse. If people living in the region of the darkest shadow experience a total solar eclipse, describe the type of eclipse seen by the people living in the region of the lighter shadow.
6 Contrast the different time zones around the world. Describe what people in the United States of America, China, Tanzania and France might be doing while you are having lunch in Australia.
7 Connect the terms ‘day’, ‘night’ and ‘year’ with the listed explanations:
a experienced by the part of the Earth that is facing away from the Sun b the name for the rotation of the Earth over 24 hours c the time for the Earth to orbit the Sun once.


Quiz me
Complete the Quiz me to check how well you’ve mastered the learning intentions and to be assigned a worksheet at your level. or in any form or by any means.


 Figure 4 The phases of a solar eclipse solar eclipse when light from the Sun (as seen from Earth) is blocked by the Moon
Earth’s orbit
Sun Moon
Moon’s orbit Earth
CHAPTER 7 EARTH, SUN AND MOON 5OXFORD UNIVERSITY PRESS
No part of this publication may be reproduced, stored in a retrieval system
transmitted
DRAFT
The Moon reflects the Sun’s light7.2
Learning intentions
By the end of this topic, you will be able to:
• identify and describe the phases of the Moon and lunar eclipse
• contrast a solar and a lunar eclipse.
Interactive 7.2 The path of the Sun
Key ideas
• The Moon rotates as it orbits the Earth.
• The same face of the Moon always faces towards the Earth.
• The phases of the Moon are caused by the light from the Sun shining on different parts of the Moon.
Many scientists believe that a giant collision between two planetary bodies resulted in the formation of Earth and the Moon. Early astronauts collected samples from the surface of the Moon and compared them with the surface of Earth: they are almost identical.
‘seas’) because they look like dark oceans. We now know these plains to be solidified lava.
phases of the Moon changes in the shape of the Moon as seen from Earth
The first scientific description of the Moon was made in 1609 by Italian astronomer and physicist Galileo Galilei (1564–1642), based on his observations through a telescope. At the time it was believed that the Moon had a smooth surface, which explained its ability to reflect light from the Sun. Galileo knew differently. He saw the rough, mountainous terrain and vast craters that we know cover the surface of the Moon. He even described large flat plains that we call ‘maria’ (pronounced ‘MAHR-ee-ah’; Latin for
In 2020, NASA’s special SOFIA telescope mounted in an aeroplane (the Stratospheric Observatory for Infrared Astronomy) identified small molecules of water on the surface of the Moon for the first time. The amount of water found was very small (100 times less than the Sahara Desert). This will not be enough to supply all the needs of the NASA astronauts that will be landing on the Moon by 2024.
Moonlight
Unlike the Sun, the Moon does not create its own light. Instead, it reflects sunlight. The amount of light reflected varies with the different phases of the Moon, but even the full Moon only provides a faint light that appears bluish to the human eye. We always see the same side of the Moon from Earth because the Moon rotates at the same speed as it orbits. This is just like walking around a person, making sure you always face toward them. The Moon takes 27.3 days to completely orbit the Earth.
(the southern hemisphere)
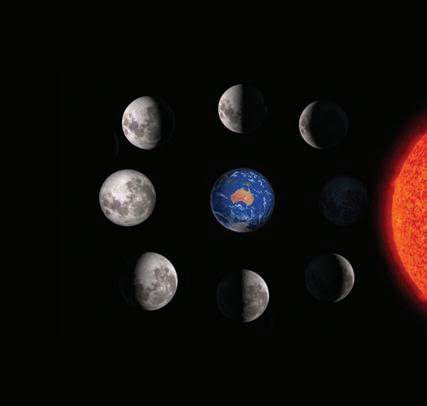
Sometimes, only a part of the Moon is visible. You might see half a Moon, a crescent or a fully round Moon. Sometimes the Moon cannot be seen at all, even though it is in the sky. These changes in the shape of the Moon are called the phases of the Moon (Figure 1). Of course, the Moon does not change shape – it is always round. What changes is the amount of the Moon that is lit by the Sun, which makes it possible for us to see the Moon from Earth. We are really looking at the ‘day’ and ‘night’ parts of the Moon. The Moon rises and sets, just like the Sun. The Moon rises approximately 50 minutes later from one day to the next. The Moon is always in the sky; however, during the day, the sky is usually so light that the Moon is hard to see.
First quarter half moon quarter half moon Waxing gibbous moon
Full moon Waxing crescent moon moon gibbous moon crescent moon
6 OXFORD SCIENCE 7 AUSTRALIAN CURRICULUM OXFORD UNIVERSITY PRESS
Third
New
Waning
Waning
No part of this publication may be reproduced, stored in a retrieval system or transmitted in any form or by any means. DRAFT
Exploring the Moon
The Moon is the only body in space on which humans have actually stepped. It has a weak gravitational pull and very little atmosphere; therefore, there is not enough oxygen to breathe. Astronauts must wear space suits fitted with breathing apparatus.
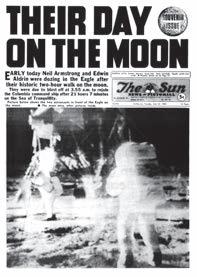
Neil Armstrong and Edwin ‘Buzz’ Aldrin were the first humans to walk on the Moon in July 1969 as part of the Apollo 11 mission (Figure 2). They found ‘kangaroo hopping’ easier than walking on the Moon. The astronauts could jump higher and further because the pull of gravity on them was only about one-sixth of Earth’s gravity.
The surface of the Moon is made of fine grains of dust that stick together like damp sand. The footprints made by the Apollo 11 astronauts should still be visible in a million years because there is no erosion to destroy them. However, the footprints may be covered with dust from meteor impacts.
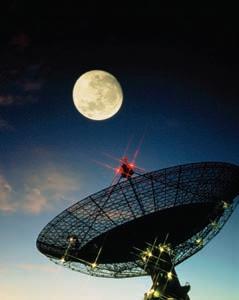
It was possible to beam images of the Moon landing around the world because of the satellite dishes located at Honeysuckle Creek in Canberra and Parkes in New South Wales (Figure 3).
Lunar eclipse

In eighteenth-century China, a young scientist called Wang Zhenyi developed a way to model a lunar eclipse. This eclipse occurs when the Earth moves between the Moon and the Sun. The Moon passes into the Earth’s shadow and appears dark (Figure 4). Wang modelled this by hanging a lamp from the roof as a Sun, above a circular table that acted like the Earth. She then used a circular mirror that acted like the Moon. By moving the Moon mirror under the ‘Earth’ table, she was able to model the lunar eclipse.
Figure 2 The first Moon landing was televised around the world and was front-page news on 21 July 1969.
7.2 Check your learning
Retrieve
1 Identify if these statements are true or false.
a The Moon creates light.
b The Moon does not supply light to the Earth.
c The Moon changes shape during different phases.
d The Moon is the closest body in space to the Earth.
e Craters are large indentations on the Moon’s surface.
f Astronomers are pseudoscientists.
g We can see both sides of the Moon from the Earth.
2 Recall why astronauts can jump higher on the Moon than on Earth.
Comprehend
3 Use Figure 1 to describe the waxing and waning of the Moon.
Analyse
4 Greek philosopher and scientist Aristotle noticed that, during lunar eclipses, the Earth’s shadow was always round. Consider how this led him to suggest the Earth was spherical in shape. Apply
5 Investigate an alternative explanation for the phases of the Moon as told by early First Nations Australians. Explain how they saw the variation in the appearance of the Moon.
Quiz me
Complete the Quiz me to check how well you’ve mastered the learning intentions and to be assigned a worksheet at your level. transmitted in any form or by any means.
Figure 3 Australian scientists at the Parkes Observatory played a critical role in the Moon landing.
7.2: Modelling the phases of the Moon
Figure 4 A time-lapse photograph of a lunar eclipse
CHAPTER 7 EARTH, SUN AND MOON 7OXFORD UNIVERSITY PRESS
Go to page 249CHALLENGE
No part of this publication may be reproduced, stored in a retrieval system or
DRAFT
7.3 The Moon’s gravity causes tidal movements
Learning intentions
By the end of this topic, you will be able to:
• explain how the Moon’s gravity causes tidal movements
• describe the relationship between the Moon and tides that was recognised by early First Nations Australians.
Key ideas
• The Earth’s pull force holds the Moon in orbit.
• The relationship between the Moon and the tides was recognised by early First Nations Australians.


• The pull force of gravity causes high and low tides.
The relationship between the Moon and the tides was recognised by early First Nations peoples in Australia. In Yolngu traditions of Arnhem Land, stories describe water filling the Moon-man (Ngalindi) as he rises. When the Moon is full in the sky, the tidal waters are full. As the tide falls, the Moon is left empty for three days before filling once more.
What causes tidal movements?
The Earth’s pull force holds the Moon in orbit. The Moon has its own pull force, even though
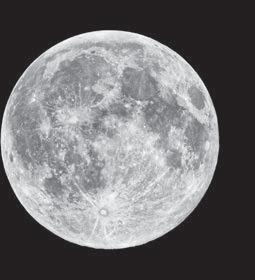
This does not mean the Moon’s pull force does not affect the Earth. The pull of the Moon causes the Earth’s oceans to bulge toward the Moon. This causes the oceans to cover slightly more land, which we see on the Earth as a high tide. The Earth is also being pulled toward the Moon (and away from the water on the opposite side), so another high tide occurs on the opposite side of the Earth. As the Moon travels around the Earth and as both bodies travel around the Sun, the combined pull force from gravity causes the world’s oceans to rise to high tides and fall to low tides. Because the Earth is rotating while this is happening, two high tides occur each day, approximately hours apart.
Spring tide: the gravity of the Sun and the Moon pull together
Neap tide: the gravity of the Moon and the Sun pull at right angles to each other
 The Moon’s pull on the oceans creates spring and neap tides. (The bulges shown here have been
Spring tide Neap tide
OXFORD UNIVERSITY PRESS
No part of this publication may be reproduced, stored in a retrieval system or transmitted in any form or by any means. DRAFT
High tides happen when the land is rotated toward the water being pulled in by the Moon or Sun. Low tides happen when the land rotates away from the water bulge.
When the Sun, Moon and Earth are aligned, the combined pull of the Moon and the Sun causes very high tides in some parts of the Earth.
Worked example 7.3: Calculating tides
Table 1 shows the times of high and low tides at Surfers Paradise, in Gold Coast, Queensland, over three days in June 2022. Calculate the difference in height between the two high tides on the Friday.
Solution
One high tide is 1.01 m at 10.17 am and the other high tide is 1.59 m at 10.38 pm.
Subtract the smaller tide from the larger tide: 1.59 – 1.01 = 0.58 m
Table 1 High tides at Surfers Paradise, Gold Coast, in June 2022
Thursday, 2 June 2022
Friday, 3 June 2022 Saturday, 4 June 2022
Time Height (m) Time Height (m) Time Height (m) 4.01 am 0.35 4.42 am 0.38 5.26 am 0.42 9.36 am 1.05 10.17 am 1.01 11.02 am 0.98 3.12 pm 0.33 3.49 pm 0.38 4.31 pm 0.44 9.58 pm 1.64 10.38 pm 1.59 11.21 pm 1.53
7.3 Check your learning
Comprehend
1 Explain why the Moon has a greater effect on the tide levels than the Sun.
Analyse
2 Referring to Table 1, identify the difference between: a the last high tide on Friday and the first one on Saturday b the first high tide and the following low tide on Saturday.
Apply
3 Use the data in Table 1 to predict the times and heights of the tides for Sunday.
4 For 1 week, graph the high and low tide levels of a beach in your state. Compare this against the times of the Moon rise and set. Discuss the relationship between the Moon’s position and tide levels.
5 Gravity is not considered a force. Instead, gravity is the distortion of space and time caused by a large object. This allows the large object to have a pull force. Evaluate the following sentence and rewrite it so that it is correct.
‘ The force of the Moon’s gravity pulls the water on Earth to cause high tides.’
spring tide when there is maximum difference between high and low tides; caused by the combined pull of the Moon and the Sun
neap tide when the difference between high and low tides is smallest; occurs during the Moon’s quarter phase, when the Sun and the Moon pull in different directions
Quiz me Complete the Quiz me to check how well you’ve mastered the learning intentions and to be assigned a worksheet at your level.
These are known as spring tides. Smaller neap tides occur during the Moon’s quarter phases. At these times, the Sun and Moon are at right angles to the Earth, causing the sea tides to be pulled in both directions at once. Spring and neap tides are shown in Figure 2. Worked example 7.3 shows how to calculate the difference in height between low and high tide. any form or by any means.
CHAPTER 7 EARTH, SUN AND MOON 9OXFORD UNIVERSITY PRESS
No part of this publication may be reproduced, stored in a retrieval system or transmitted in
DRAFT
Seasons are caused by the tilt of the Earth7.4
Learning intentions
By the end of this topic, you will be able to:
• define the terms ‘solstice’ and ‘equinox’
• explain how seasons are related to the position of the Sun and Earth
• describe the importance of seasons and seasonal calendars to First Nations Australians.
solstice either of the times when the Sun is furthest from the equator
Key ideas
• The Sun travels different paths across the sky at different times of the year.
• During summer, the days are longer and the Sun warms the ground and air.
• During winter, the days are shorter and the ground and air are cooler.
• The equinox occurs when the length of day is equal to the length of night.
• First Nations Australians use regional seasonal calendars which describe the weather, plants and animals that are common in that area at that time of the year.
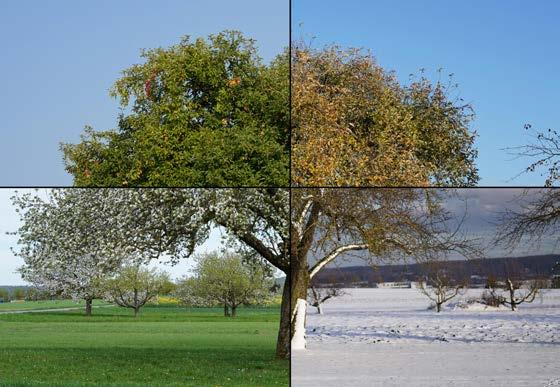
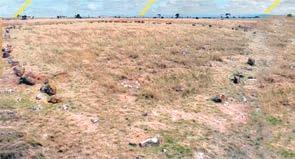
The Wurdi Youang egg-shaped arrangement of stones shown in Figure 1 was found at Little River, Victoria, by European settlers nearly 200 years ago. The layout of 100 large boulders is thought to have been set out by the Wathaurong people, the Traditional Owners of the area. It is only recently that archaeologists have discovered that the 1 m high rocks at the two ends of the egg shape mark the points where the Sun sets during the middle of winter (the winter solstice) and the middle of summer (the summer solstice).
Summer solstice Equinox Winter solstice
Figure 2 Deciduous plants change with the seasons described by Europeans.
Figure 1 The Wathaurong people who lived between Melbourne and Geelong marked the movement of the Sun with waist-high stones.
10 OXFORD SCIENCE 7 AUSTRALIAN CURRICULUM OXFORD UNIVERSITY PRESS
No part of this publication may be reproduced, stored in a retrieval system or transmitted in any form or by any means. DRAFT
Summer
The Earth does not rotate evenly. Rather, the Earth rotates around an imaginary line (the axis) that is on an angle of 23.5 degrees. This means that, for part of the year, the southern hemisphere (including Australia) is tilted towards the Sun (Figure 3). The days are longer and the nights are shorter. The Sun is higher in the sky. This allows more time for the Sun’s rays to hit the ground and therefore warm up the air. We experience summer. The Wathaurong people in Victoria knew this, and placed stones that marked the place where the Sun set during the longest day (21 December). This is called the summer solstice.
Equinox
After 21 December, the Earth continues its orbit of the Sun, slowly angling the southern hemisphere away from the Sun. Twice a year (in autumn on 20 March and in spring on 22 September), the position of the Earth allows an equal length of day and night. This is called the equinox. The Wathaurong people marked the sunset of these events with the equinox stone.
Winter
In winter, the southern hemisphere is angled away from the Sun. This means the Sun shines lower in our skies and for less time. As a result, there is less time for the Sun to warm up the ground and therefore the air is cooler. We experience winter. The shortest day (21 June), the winter solstice, was also marked by the Wathaurong people.
The Wathaurong people found a way to mark the movement of the Sun, and hence the seasons, without using telescopes or undertaking long sailing trips around the world.
The northern hemisphere’s seasons are the opposite of ours in Australia, so during a northern summer there is a southern winter.
The tilt of the Earth is more noticeable in the Antarctic. In the summer, the tilt of the Earth causes the Sun to remain in the sky for five months. The Sun does not set; instead, it sits just above the horizon for the whole time.
The reverse is true for winter in the Antarctic. The angle of the southern hemisphere away from Sun means the Sun sets in May and does not rise again until July.
equinox a day when day and night are the same length; occurs twice each year

Seasons for First Nations Australians
First Nations Australians have lived in all parts of the Australian landscape for more than 60 000 years. There are over 700 groups and most recognise the different seasons that are unique to their area. First Nations peoples in the Darwin area have seven main seasons in their Gulumoerrgin (Larrakia) year.
These seasons are divided according to the weather and the plants and animals that are common at that time of the year. The rainy season (Balnba) from November to December is when the first rains occur. Gulppula (green tree fog) is said to bring the rain. It is also the time to collect shellfish and the black plum. The monsoon season (Dalay: January–April) is when the saltwater crocodiles are laying their eggs and the barramundi are breeding.
Figure 3 The Earth’s rotation and orbit cause day and night, as well as the seasons.
CHAPTER 7 EARTH, SUN AND MOON 11OXFORD UNIVERSITY PRESS
7.4: Modelling the seasons Go to page 249CHALLENGE
No part of this publication may be reproduced, stored in a retrieval system or transmitted in any form or by any means. DRAFT
Mayilema season (March–April) overlaps the monsoon season and is when the speargrass flowers appear and the magpie goose eggs can be collected. Damibila (April–June) is the time to collect the barramundi and bush fruit, while heavy dews are on the ground in the Dinidjanggama season (June–August). During Gurrulwa (July–September) there
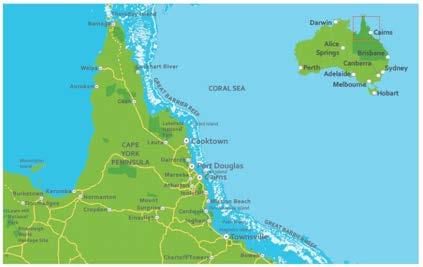
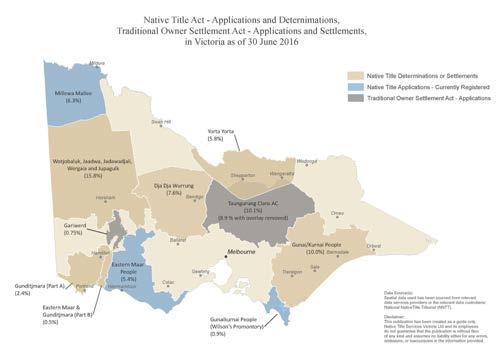
are often big winds that appear to come from all directions at once, while Dalirrgang (September–October) is very hot and humid as the weather slowly builds up to the next rainy season. Figures 4, 5 and 6 show the seaonal calendars unique to Larrakia Country in the Northern Territory, Yirrganydji Country in Far North Queensland and Gariwerd Country in Victoria.

12 OXFORD SCIENCE 7 AUSTRALIAN CURRICULUM OXFORD UNIVERSITY PRESS
The Yirrganydji calendar is used by First November October S e tpbme re tsuguA yluJ enuJ yaM pA r i l March February JanuaryDecember Balnba Da l irrg ang awlurruG amaggnajdiniD alibimaD M a y i l e m a Dalay (rainyseason) ( bu i l d up) )emitdniwgib( yvaeh(wed)emit dnaidnumarrab()emittiurfhsub ( s peargrass a n d g o o s e gge )nosaes (monsoon season) The replenishesmonsoon adrythirsty land The flowering of speargrass signifies the start of goose egg collection Theseasonofthefirst rains The hot and very humid build up to thenextrainyseason floodplainsTheareanddryingwind toseemscome from all directions Thecoldesttime of theyear areskiesThe theandclearing areclouds high N o v e m b e r Obotcre rebmetpeS tsuguA yluJ enuJ M a y April March February January December Yiwanyji (windytime) Jawarranyji(storm time) W u mb ulji(hottime) Jinjim(cooltime) Jimburralji (cyclone time) Kurrabana (wet season) Kurraminya (dry season) Larrakia Yirrganydji No part of this publication may be reproduced, stored in a retrieval system or transmitted in any form or by any means. DRAFT
The traditional lands and waters of the Yirrganydji people covers the Queensland coast from Cairns to Port Douglas. Their seasonal calendar shows two major seasons: Kurrabana (wet season) and Kurraminya (dry season). The Kurrabana wet season is divided into a time of storms (Jawarranyji) and a time of cyclones (Jimburralji). The dry season is divided into the cool time (Jinjim), the windy time (Yiwanyji) and the hot time (Wumbulji).
Each of the First Nations peoples used their observations of the local environment to create a unique calendar. This is different to the European approach that recognises the same four seasons in all parts of the world from the Antarctic to the tropics, despite the very different climate and conditions.
Figure 6 The Gariwerd calendar is used by First Nations peoples in the Gariwerd (Grampians) region in Victoria.
7.4 Check your learning
Retrieve
1 Identify the four seasons experienced in Australia, marked with the letters a, b, c and d on Figure 7.
four European seasons next to the appropriate months. In the third column, write the names of the seven Gulumoerrgin (Larrakia) seasons.
Analyse
4 Compare the winter solstice with the summer solstice.
5 Use the motion of the Earth around the Sun to consider why January is hotter than July in Australia.

6 Compare the Gulumoerrgin (Larrakia), Yirrganydji and Gariwerd calendars.
Apply
2 Recall the angle of the Earth’s rotational tilt away from the Sun.
Comprehend
3 Represent the seasons in a table. Draw a table with three columns. In the first column, write the months of the year. In the second column, write the names of the
7 Create a paragraph for year five students that discusses how the Wathaurong people gathered and recorded data over many years before placing stones to represent the solstice and equinox.
Quiz me
Complete the Quiz me to check how well you’ve mastered the learning intentions and to be assigned a worksheet at your level.
Gariwerd
Figure 7 Four seasons in Australia d ac Sun
CHAPTER 7 EARTH, SUN AND MOON 13OXFORD UNIVERSITY PRESS
b
December November October S e tpbme e r tsuguA yluJ enuJ yaM pA r li March February January (seasonofthebutterflies) Ballambar P e t y a n (nosaes fo t h e w i l d f lowers) kuenraL punnuhCehtfonosaes()sootakcoc G w a n g a l m o r o nn (season of t h e h o n e yb see ) Kooyang(season oftheeels) nosaes(dribgnitsenehtfo)s Hottest and driest time of the year Warm day; cooler mornings Coldest time of the year Wettest time of the year Summer days; bush bursts into life Hot and dry days No part of this publication may be reproduced, stored in a retrieval system or transmitted in any form or by any means. DRAFT
Astronomers explore space7.5

Learning intentions
Astronomy
Astronomy is one of the oldest sciences. Ancient astronomers believed that stars were permanently fixed to a heavenly sphere and never changed. Both First Nations and European astronomers tracked the movement of the planets against these heavenly lights, which they grouped into constellations, and used these observations to calculate time and develop calendars. From this they determined the seasons and calculated the best time to plant their crops or gather their foods. They observed solar and lunar eclipses and used the positions of the stars and planets to navigate the oceans.
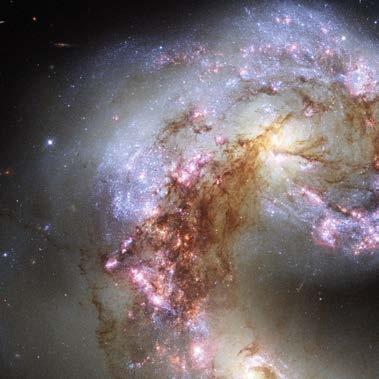
Figure 2 The Antennae galaxies are about 45 million light-years away from the Milky Way.
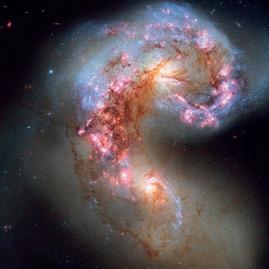
collect and then focusing this light using lenses or mirrors. A distant object viewed through an optical telescope becomes brighter and magnified (Figure 2).
THE HUBBLE AND JAMES WEBB SPACE TELESCOPES
In 1990, NASA launched the Hubble Space Telescope which orbits the Earth at 569 km above our atmosphere. This has given scientists a view of our universe far beyond that of any ground-based telescope because different forms of electromagnetic radiation, such as gamma rays, X-rays and ult raviolet radiation , are available for observation.
From the images beamed back to Earth from the Hubble Space Telescope, astronomers have been able to make an enormous number of new observations and have estimated the age of the universe more accurately at around 13–14 billion years. NASA launched the more advanced James Webb Space Telescope on 25 December 2021. It orbits the Earth at 1.5 million km above Earth’s atmosphere!
Telescopes
Telescopes have been used since the seventeenth century to view distant objects. The most common type of telescope used in astronomy is the optical telescope. This works by collecting more light than the human eye can telescope an optical instrument that uses lenses and mirrors to make distant objects appear closer and larger
The Webb looks primarily at infrared radiation, allowing it to see a greater variety of things than the Hubble. The Webb can see things more clearly than the Hubble because it has a bigger mirror that reflects more light than the Hubble. The newer space telescope will help astronomers build on the knowledge about the universe that they gained from images taken by the Hubble. The first images from the Webb were released to the public in July 2022. Figure 3 shows the difference in the images taken by the Hubble and the Webb.
It can take many years of travel for a rocket to land on another planet. Scientists therefore need to rely on other methods to learn about space.
ultraviolet radiation invisible rays that are part of the energy that comes from the Sun infrared radiation invisible light that has longer wavelengths than visible light
By the end of this topic, you will be able to:
• identify examples that show how advances in technology and scientific knowledge have improved our understanding of the solar system.
Figure 1 Emu in the sky, a constellation seen by First Nations Australians in the dark areas of the Milky Way. Depending on its position in the night sky, it informs people about the different behaviours of the bird.
14 OXFORD SCIENCE 7 AUSTRALIAN CURRICULUM OXFORD UNIVERSITY PRESS
//SCIENCE AS A HUMAN ENDEAVOUR//
No part of this publication may be reproduced, stored in a retrieval system or transmitted in any form or by any means. DRAFT
Mars mission
NASA is already planning a crewed mission to Mars. But could humans live on Mars?
The Mars exploration rovers Spirit and Opportunity were launched in 2003 and landed on Mars in 2004 to find out more about the ‘red planet’.
In 2008, the Phoenix Mars lander touched down on an ice sheet on the Martian surface. Operated from Earth, its instruments took photographs of ice that was melting. The lander’s robotic arm scooped up soil samples and analysis from the lander’s instruments revealed traces of magnesium, sodium, potassium and, importantly, water. NASA scientists described this discovery as a ‘huge step forward’.
In 2021, NASA’s Mars 2020 Perseverance rover landed on Mars. The rover’s mission is to seek signs of ancient life on Mars and to collect rock samples for scientists to study.
7.5 Test your skills and capabilities
Understanding the impact of science
In 1967 an Outer Space Treaty that offered a series of guidelines for how countries should explore space was signed by countries in the United Nations. After many more years of negotiations, the Agreement Governing the Activities of States on the Moon and Other Celestial Bodies (also called the Moon Treaty) was created by a group of different nations. It sets out a list of rules for all celestial bodies that countries must follow, including ownership and
The Perseverance rover is taking photos of the surface of Mars (Figure 4) and has even sent back the first audio recordings of Mars.
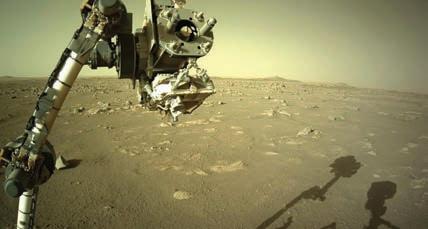
Space probes
Humans are also able to gather new information about space by using space probes. Typically, space probes are controlled remotely and can be launched into space to measure properties of Earth, the solar system or the universe around us.
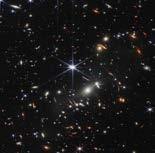
The space probe New Horizons was launched by NASA in 2006. After a gravity boost from Jupiter in 2007, its six-month flyby of Pluto in 2015 produced an enormous amount of data on the dwarf planet’s surface properties, geology and atmosphere, which was still being analysed one year later.
mining. It is yet to be signed by the countries who are currently exploring space.
Science is not just about experiments and making discoveries. Scientists must also develop an understanding of the consequences of their discoveries. Australia is currently building its capacity for space research. Develop a set of guidelines for these scientists to follow.
Consider the following to help.
1 Identify whether you would own the section of the Moon you land on or explore.
2 Explain what you would do if you discovered a valuable metal or mineral on the Moon. (Note: If you do not mine it, how would you pay for the research?)
3 Describe what you would do if another country claimed the same section of the Moon.
4 Describe the consequences you should face if your rocket crashed into a city in another country.
5 Compare your opinions with others in your class.
Figure 3 Images of the same galaxy cluster taken by a the Hubble Space Telescope and b the James Webb Space Telescope
Figure 4 NASA’s Mars Perseverance rover took this photo using one of its onboard cameras.
15OXFORD UNIVERSITY PRESS CHAPTER 7 EARTH, SUN AND MOON
a b No part of this publication may be reproduced, stored in a retrieval system or transmitted in any form or by any means. DRAFT
CHAPTER REVIEW
EARTH, SUN AND MOON
Retrieve
1 Identify which of the following best describes the equinox.
A the longest day of the year
B a day and night of equal length
C a lunar eclipse that occurs every year
D the shortest day of the year
2 Recall that a total solar eclipse occurs when:
A the Moon blocks out the maximum amount of light from the Sun
B the Earth blocks out the light on the Moon from the Sun
C the Sun blocks out the view of the Earth from the Moon
D a comet blocks out light from the Sun.
3 Identify which of the following statements is true.
A The Earth orbits the Sun.
B The planets orbit the Moon.
C The Sun orbits the planets.
D The Earth orbits the Moon.
4 State the name for one revolution of the Earth around the Sun.
5 Identify the season in Norway when it is summer in Australia.
6 Recall the name of the event that occurs when the Moon totally blocks the light from the Sun.
Comprehend
7 Explain what causes day and night.
8 Describe how the Sun affects day and night and seasons at the Antarctic.
9 Describe the seven seasons identified by the Gulumoerrgin (Larrakia) people.
10 Describe the phases of the Moon.
11 Explain why 29 February only occurs every four years.
12 A student claims that the Moon is a mini Sun that shines at night. Explain why they are incorrect.
13 Explain the purpose of the Hubble and James Webb Space Telescopes.
Analyse
14 Compare a solar eclipse and a lunar eclipse.
15 Compare astronomy and astrology.
16 Figure 1 shows how the seasons occur. Answer ‘A’ or ‘B’ to each question.
a Identify the drawing that represents summer.
b If the piece of card was the Earth, identify which drawing would represent winter.
c If the piece of card was the Earth, identify which drawing would represent the warmest day.
17 Figure 2 shows the average number of sunlight hours across Australia in January and June. Analyse the two maps and use the data to explain why Australian summers have higher temperatures than Australian winters. Figure 1 How the seasons occur
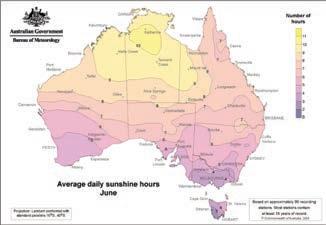
Figure 2 The average amount of sunlight in January and June
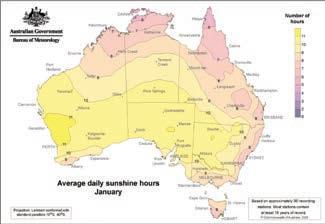

A B in any or by any means.

16 OXFORD SCIENCE 7 AUSTRALIAN CURRICULUM OXFORD UNIVERSITY PRESS
7
No part of this publication may be reproduced, stored in a retrieval system or transmitted
form
DRAFT
18 Study Figure 3 and answer the following questions.
a Identify the season that has the longest shadows.
b Identify the season that gives the least opportunity for solar heating.
c Identify the season where the Sun travels furthest across the sky.
d Identify which side of the house is best to grow plants that like sunlight.
e If a plant is growing on the eastern side of a house, describe the amount of sunlight it receives in the morning.
20 The Persian calendar celebrates the New Year at the moment the Sun crosses the celestial equator on approximately 21 March each year. In 2014 it was celebrated at 4 am on the east coast of Australia. In 2015 it was celebrated at 10 am. Discuss why the exact time of the New Year changes from one year to the next.
21 Visit NASA’s website for the 2020 Perseverance rover mission (the link is on your obook pro). Navigate to the gallery of ‘Raw images’ showing recent pictures taken by the rover. Select one image and make five scientific observations about what you can see in the image. Discuss what you know about Mars from looking at this image.
22 Gravity is not considered a force. Instead, gravity is the distortion of space and time caused by a large object. This allows the large object to have a pull force. Evaluate the following sentence and rewrite it so that it is correct.
‘The force of the Moon’s gravity pulls the water on Earth to cause high tides.’
Social and ethical thinking
23 Some nations are planning to develop human settlements on the Moon. Discuss an argument for and against this decision. Decide if you do or do not support this plan. Justify your decision (by comparing the arguments for and against this decision and describing why one argument is more important).
24 Many early European settlers claimed that First Nations Australians did not use any of the sciences. Provide evidence that refutes this claim.
25 Scientists are continuously exploring space, including Mars. Discuss the ethical implications of finding life on one of these planets.
Apply
19 Look at Figure 4, which shows a total eclipse of the Sun as it would be seen in the middle of the day from Earth. Create and label a diagram to illustrate a: a solar eclipse b lunar eclipse.
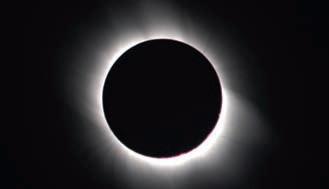
Critical and creative thinking
26 Find data for the sunrise and sunset times over seven days in summer and winter. From this information, calculate the length of the day and the length of the night. Present your findings in a table. Discuss what you notice about the lengths of the days and nights for each season. Explain why this difference occurs.
27 In May 2021 there was a lunar eclipse visible in Australia. The Moon was referred to as a ‘supermoon’. Investigate what the criteria for a supermoon are, and explain why a lunar eclipse may be a supermoon.
Research
28 Choose one of the following topics on which to conduct further research. Present your findings in a format that best fits the information you have found and understandings you have formed.
CHAPTER 7 EARTH, SUN AND MOON 17OXFORD UNIVERSITY PRESS
Figure 4 Total eclipse of the Sun 8 am, midsummer8 am, midwinter Noon, midsummerNoon, midwinter 4 pm, midsummer4 pm, midwinter E W S N E W S N E W S N E W S N E W S N E W S N Figure 3 The path of the Sun across the sky in winter and summer No part of this publication may be reproduced, stored in a retrieval system or transmitted in any form or by any means. DRAFT
» Search for extraterrestrial intelligence
Astronomers are involved in a Search for Extraterrestrial Intelligence (SETI).
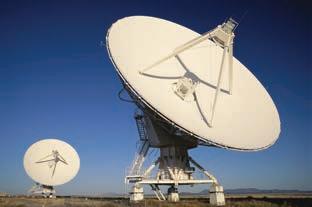
» Find out what instruments the astronomers are using in this search.
» Describe how these instruments will help them to find extraterrestrial intelligence.
» Describe what they may expect to find. You, too, can use your computer to become a part of this search.
» Mission to the Moon
The huge Saturn rocket that took Apollo 11 to the Moon was an extremely powerful system in its day. The rocket had three ‘stages’; each carried its own fuel and dropped off as the rocket went higher into the sky. The rocket carried the ‘lunar lander’, which was itself a very complicated piece of technology.
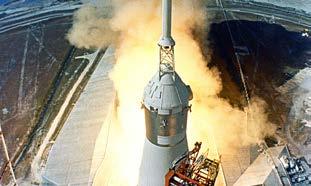
» Build a model of the Saturn rocket and explain the role of each stage and how it performed.
Figure 5 The Search for Extraterrestrial Intelligence (SETI) Institute is America’s only organisation entirely dedicated to searching for life in the universe.
» Science communication
Investigate what it means to be a science communicator.
» Research the work of Wiradjuri astrophysicist and science communicator, Kirsten Banks.
» Describe how she combines First Nations astronomy knowledge with her current work.
» The far side of the Moon
The Moon rotates at the same rate as the Earth, so we never see the far side of the Moon from Earth. So what is it like? Is it the same as the near side of the Moon? Some astronauts have flown over the surface of the far side, but only one has landed a ship.
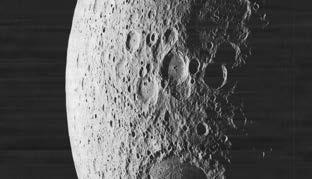
» Identify how many people have seen the far side of the Moon.
» Identify which country landed a probe on the far side and brought back material from the Moon’s surface.
» Compare the far side of the Moon to the side that faces Earth.
» Describe the complexities of living on the surface of the Moon.
Figure 6 Kirsten Banks
Figure 8 A section of the far side of the Moon
Figure 7 The launch of the Saturn rocket
18 OXFORD SCIENCE 7 AUSTRALIAN CURRICULUM OXFORD UNIVERSITY PRESS
No part of this publication may be reproduced, stored in a retrieval system or transmitted in any form or by any means. DRAFT
Chapter checklist
Now that you have completed this chapter, reflect on your ability to do the following:
I can do this.
• describe the differences between a total and partial solar eclipse
• explain how the length of a day and a year relate to the movement of the Earth.
• identify and describe the phases of the Moon and lunar eclipse
• contrast a solar and a lunar eclipse.
• explain how the Moon’s gravity causes tidal movements
• describe the relationship between the Moon and tides that was recognised by early First Nations Australians.
• define the terms ‘solstice’ and ‘equinox’
• explain how seasons are related to the position of the Sun and Earth
• describe the importance of seasons and seasonal calendars to First Nations Australians.
• identify examples that show how advances in technology and scientific knowledge have improved our understanding of the solar system.
I cannot do this yet.
Go back to Topic 7.1 ‘The Earth, Sun and Moon interact with one another’.
Page 4
Go back to Topic 7.2 ‘The Moon reflects the Sun’s light’.
Page 6
Go back to Topic 7.3 ‘The Moon’s gravity causes tidal movements’.
Page 8
Go back to Topic 7.4 ‘Seasons are caused by the tilt of the Earth’.
Page 10
Go back to Topic 7.5 ‘Science as a human endeavour: Astronomers explore space’.
Page 14
Check your Student obook pro for these digital resources
Chapter quiz
Play a Quizlet game to test your knowledge.
Test your understanding of this chapter with the chapter review quiz.
Check your Teacher obook pro for these digital resources and more:
Launch a live team or individual quiz for your students on key concepts in this chapter.
CHAPTER 7 EARTH, SUN AND MOON 19OXFORD UNIVERSITY PRESS
and more:
No part of this publication may be reproduced, stored in a retrieval system or transmitted in any form or by any means. DRAFT
8 EXPERIMENTS CHAPTER No part of this publication may be reproduced, stored in a retrieval system or transmitted in any form or by any means. DRAFT
7.2Modelling the phases of the Moon
Aim
To model the different phases of the Moon.
What you need:
Torch or lamp with exposed light bulb, globe or basketball, tennis ball, small foam ball, black permanent marker
What to do:
1 In small groups, use a torch or light bulb in a fixed position to represent the Sun. One person should then hold a globe or basketball to represent the Earth, and a second person should hold a tennis ball to represent the Moon.
2 Begin by rotating the Earth as it orbits the Sun. Try to work out how the Moon would orbit the Earth as the Earth orbits the Sun.
3 Use a black permanent marker to colour half of the foam ball. Face the white side of the foam ball towards you. This represents the fully lit face of a full Moon. Slowly rotate the foam ball so that the Moon appears to be getting smaller. (You will gradually see more of the darkened side of the Moon.)
4 Shine the light from a torch on the white section of the Moon. Pass the tennis ball between the light and the foam ball.
Questions
1 Explain why people on Earth only see one side of the Moon.
2 Draw each phase of the Moon as you saw it on the foam ball in step 3.
3 Describe and identify the phenomenon that you modelled in step 4.
4 Explain why the statement ‘the dark side of the Moon’ does not refer to the side of the Moon away from Earth.
7.3 Modelling the seasons
Aim
To model how the movement of the Earth can generate different seasons.
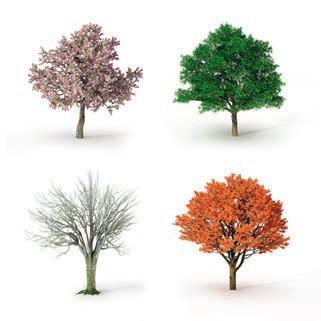
What you need:
Torch or lamp with exposed light bulb, globe or basketball
What to do:
1 Use a torch or light bulb in a fixed position to represent the Sun. One person should then hold the globe or basketball to represent the Earth.
2 The Earth is tilted as it orbits the Sun. Hold your model Earth so that it is tilted slightly. Imagine that the axis is tilted to point towards the numbers 1 and 7 on a clock face. Do not change this tilt during the activity.
3 Walk slowly in a circle around the lamp, at the same time rotating the model Earth. Make sure the tilt always points in the same direction. When it is summer in Australia, the Sun is almost overhead. In winter, the sunlight arrives at an angle and is more spread out.
Questions
CHALLENGE
1 When you have walked half a circle around your Sun, stop and look at the model Earth. Describe which part of the basketball would be experiencing summer.
2 Describe how the seasons changed on one point of the basketball as it moved around the Sun.
3 A student claimed it is hotter in summer because Australia is closer to the Sun. Evaluate the truth of this statement using your model as evidence.
Figure 1 Modelling the seasons
CHAPTER 7 EARTH, SUN AND MOON 21OXFORD UNIVERSITY PRESS
CHALLENGE
No part of this publication may be reproduced, stored in a retrieval system or transmitted in any form or by any means. DRAFT
Northern Territory
Adam Jovanou
State Sales
E:
M: 0437
Western Australia
Adam Jovanou
State Sales Manager WA | SA | NT
E: adam.jovanou@oup.com
M: 0437 997 146
South Australia
Renee Kennedy
Secondary Education
E: renee.kennedy@oup.com
M: 0418 857
Victoria
John Purnell
State 0403
Alicia
Secondary
Caitlin
Paul
Secondary Education Consultant
E: paul.mccallum@oup.com
M: 0423 241 455
Tasmania David Griffiths Secondary Education Consultant
E: david.griffiths@oup.com
M: 0427 225 891
Our
To
Queensland
John Figliano
State Sales Manager QLD
E: john.figliano@oup.com
M: 0499 114 429
Chris Lowcock
Secondary Education Consultant
E: christopher.lowcock@oup.com
M: 0428 949 935
Melissa Wearne
Secondary Education Consultant
E: melissa.wearne@oup.com
M: 0447 557 931
New South Wales
Catherine Stephenson
State Sales Manager NSW | ACT
E: catherine.stephenson@oup.com
M: 0404 021 237
Sue Dowd
Secondary Education Consultant
E: sue.dowd@oup.com
M: 0411 759 608
Caly James
Secondary Education Consultant
E: caly.james@oup.com
M: 0413 745 855
Australian Capital Territory
Caly James
Secondary Education Consultant
E: caly.james@oup.com
M: 0413 745 855
Contact us For more information about this series please contact a Secondary Education Consultant in your state or territory:
Privacy Policy sets out how Oxford University Press handles your personal information, and your rights to object to your personal information being used for marketing to you or being processed as part of our business activities.
view our Privacy Policy go to oup.com.au/privacy oup.com.au @OxfordAustralia facebook.com/oupanz linkedin.com/showcase/oxforduniversity-press-australia-new-zealand Visit us at oup.com.au or contact customer support at oup.com.au/help
Manager WA | SA | NT
adam.jovanou@oup.com
997 146
Consultant
546
Sales Manager VIC E: john.purnell@oup.com M:
043 584
Giaquinta
Education Consultant E: alicia.giaquinta@oup.com M: 0411 759 611 David Griffiths Secondary Education Consultant E: david.griffiths@oup.com M: 0427 225 891
Hansford Secondary Education Consultant E: caitlin.hansford@oup.com M: 0411 759 659
McCallum
No part of this publication may be reproduced, stored in a retrieval system or transmitted in any form or by any means. DRAFT
