
11 minute read
Let’s Get Digital








DIGITAL


Dr Katja Poschlad and Dietmar Wagner, thyssenkrupp Uhde, Germany, Dr Katja Poschlad and Dietmar Wagner, thyssenkrupp Uhde, Germany, and Dr Stephan Körner and Dr Sophie Wei, thyssenkrupp Analytics and Dr Stephan Körner and Dr Sophie Wei, thyssenkrupp Analytics & AI, Germany, explore the digital solutions available to fertilizer plants.& AI, Germany, explore the digital solutions available to fertilizer plants.

ne key issue concerning the changing of the world that is under focus, apart from climate change, is the move towards a much more digitalised world. To help with this transition, thyssenkrupp Uhde (tk Uhde) has been developing several digital products. There are two major areas that these solutions address: handling of big data and using a digital copy of a real plant in order to help continuously improve the performance of the plant. The benefi ts of such digital solutions for the performance of the plant are explained in this article.


Data analysis

Data analysis consists of four main steps, each of increasing complexity.
The fi rst step is descriptive; it summarises the condition of the plant and events that occurred. To achieve this, data from various sources has to be integrated and processed. This includes operating data, e.g. from a distributed control system (DCS), maintenance information and laboratory analysis. The company’s digital infrastructure allows for the integration and processing of data from these sources by transferring it into the thyssenkrupp Industrial Internet of Things (IIoT) cloud, using its data logger and a secure internet connection. Typical tools in the fi rst step of data analysis are statistical analysis and applications for data visualisation.
The second step is a diagnosis: why did a specifi c event happen in the plant? In this step, the company determines the root causes, fi nds hidden correlations or identifi es characteristic patterns in the operating data.
The objective of the next step is to predict what will happen in the plant in case no action is taken. Predictive models for forecasting and preemptive failure diagnosis are important for this step. Advanced data analysis tools and machine learning can also be applied.

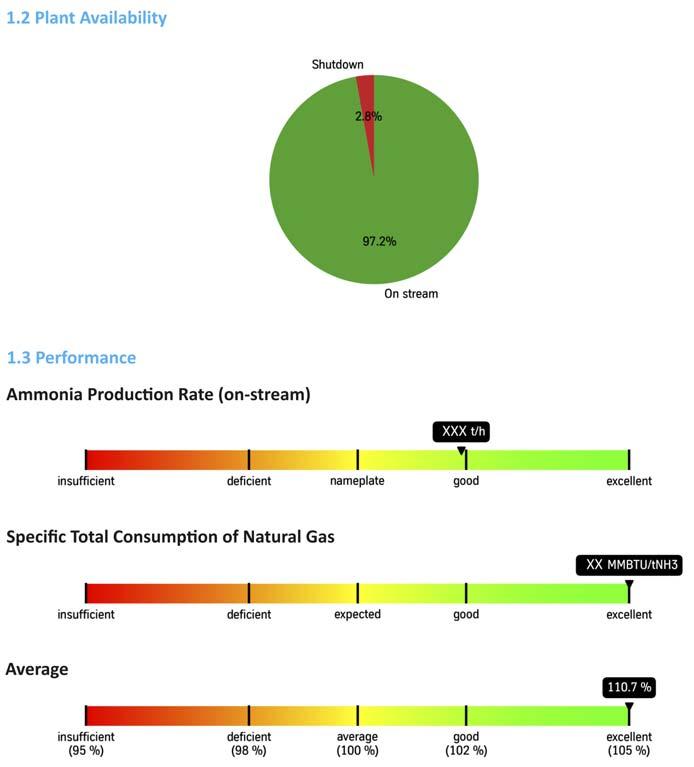
Figure 1. Anonymised example of a report of an ammonia plant.
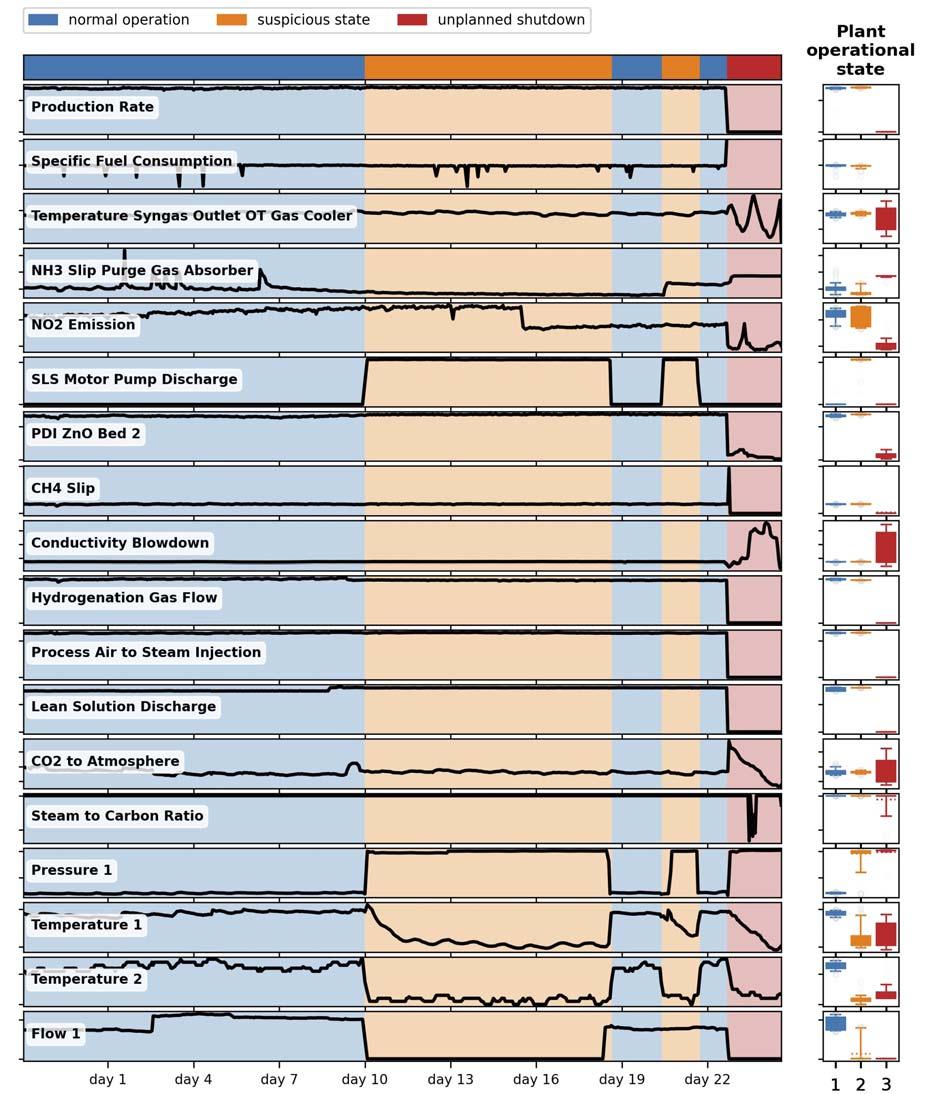
Figure 2. Plant operational states identified by the condition monitoring model for an ammonia plant. What happens may be something that requires a response. Therefore, the fourth and fi nal step is prescriptive: what to do about the situation? Optimisation models and simulations are required. The aim is to improve plant operation and performance, which can be achieved using applications, methods, algorithms and tools to cover all these four steps of data analysis. The results of this analysis by the company are summarised in regular reports, including recommendations for operation and maintenance. Report content will be explained to the client in regular meetings or calls. As an example, Figure 1 shows one page of a report for an ammonia plant that visualises key performance indicators determined in cooperation with the client. Additional performance indicators are given in more detail on the next pages of the report. The client will receive full process transparency through remote monitoring and analysis of performance and operation. Deep process insights will be given by pinpointing infl uential processes. Potentially ineffi cient process areas, otherwise hidden, will be uncovered. The client will be alerted to critical conditions, while root causes of issues will be pinpointed and recommendations for corrective action will be given.
The next section shows how cluster analysis is one example of digital analysis that offers greater detail.
Cluster analysis
Condition monitoring of plant operational states is a powerful tool for identifying signifi cant changes that are indicative of an unexpected plant behaviour or an operating error that would lead to failure of equipment and unplanned shutdowns if not addressed.
The huge number of sensors in a chemical plant and the complex relationships in chemical processes means it is unfeasible to solely rely on supervision by plant operators. Data-driven condition monitoring applies machine learning algorithms to learn the complex multivariate correlations from historic plant data. They can either be applied in real-time to detect anomalies and deviations from stable plant operation (and hence prevent trips in a timely manner), or they can be employed for root cause analysis of unexpected plant behaviour by identifying patterns usually obscured from the plant operator.
Figure 2 shows an exemplary dataset of plant parameters and setpoints for an ammonia plant equipped with more than 1500 pressure, fl ow, temperature and
chemical sensors. In total, the dataset comprises measurements from over 250 days, of which a period of approximately 30 days has been examined more closely. During this period, the plant experienced an unplanned shutdown that has been studied by thyssenkrupp’s condition monitoring model. By grouping similar patterns of sensor correlations into clusters, the model can identify distinct plant operational states. Three such characteristic states are identifi ed around the time period of the shutdown event, indicated by the coloured background.
The blue state corresponds to normal plant operation, whereas the red state represents the shutdown. Interestingly, the data-driven condition monitoring model automatically detects a distinctively different third state (orange), days in advance of the shutdown. This state is characterised by sudden fl uctuations in various sensors. Furthermore, the operating mode becomes unstable, switching between the blue and orange state. These indications render the orange state suspicious and potentially connected to the subsequent shutdown, which justifi es further analysis.
Digital twin
A digital twin is a virtual representation of a real-world object. It is used to understand and predict the physical counterpart’s performance characteristics. The benefi ts for the user are an increase in the transparency of the plant, a reduction in unwanted fl uctuation, an increase in process stability or fl exibility and the enhancement of operation in a dynamic and adaptive way. Accurate information about actual plant performance is provided in near real-time, at any time, from all the processes. There is a reduction in variability in process outcomes – including product quality and product throughput – through the identifi cation of the process conditions for the best output and making timely adjustments to the process. The digital twin assists the operator to identify different operational conditions, even with multi-dimensional interdependencies. Additionally, the digital twin may provide virtual sensors for data that is not measured and the possibility to improve the preparation of future revamp studies.
Digital twins can be based on fi rst principle models (white box), statistical (black box) approaches or a combination thereof. They require plant information as input variables and calculate process sensory data, which may have been measured or which are unknown.
The digital twin consists of multiple elements that are virtual representations of various plant sub-units or single devices comprising, for example, ammonia, urea, ammonium nitrate, calcium ammonium nitrate and nitric acid processes and utilities. The extent of implementation of the digital twin for each sub-unit or device is determined according to the level of importance and complexity of the unit or device. It will be continuously updated with measured data from the plant. The digital twin will process this data in near real-time and run in parallel to the actual plant, providing virtual monitoring, prediction and optimisation functions. Typical results are the continuous reporting and visualisation of performance-related sensor information (real or virtual), such as fl ows, concentration/analysers, pressures, temperature levels, etc. Additionally, description and
Helping improve your fertilizer quality
SK FERT ® URESOFT
Anti-caking agents Anti-dust additives Hydrophobic additives Corrosion inhibitors Eco-products

Kao Chemicals Europe
FERTILIZERS
visualisation of operation monitoring fl uctuations – using statistics, derivatives and integrals for information such as averages, minimum and maximum ranges, internal profi les, short variance and long-term trends – can be given. Finally, key performance indicators are calculated and displayed. This enables staff to receive timely warnings of abnormal plant behaviour and to make data-based decisions, enriched by calculated process parameters that cannot be measured directly.
Operator training system
One notable example of a digital twin application is its use as a training tool. As operators and staff can be trained with it, it is called an operator training system (OTS). The OTS used by tk Uhde describes the plant with physical equations dynamically, and has both monetary and safety benefi ts.
Managing a plant is always a challenge; conditions must be optimal in order to achieve a good performance. Although there are many factors that affect safety and profi tability, the human element is critical. A plant running within optimal conditions and without deviations is the perfect scenario. The fact is, however, that high annual losses are due to employee misunderstanding in various types of business. They are in general caused by actions (or lack thereof) taken due to misunderstandings, misinterpretations and a lack of confi dence or understanding. Therefore, tk Uhde trains its employees and clients’ staff prior to commissioning. This increases the safety of staff, as well as the safety of everyone on-site. To help the operator to react correctly with greater confi dence and knowledge, training of staff is indispensable. The OTS offers an up-to-date way of educating all employees to the desired standard.
The benefi ts of trained staff for the operating company can be divided into two parts: economic advantages and safety advantages. As trained staff can keep the plant closer to the optimal condition and human mistakes are reduced, the plant will be more effi cient and will have a higher on-stream factor. As risky and unfamiliar scenarios have been trained for in advance, the operator can react faster and the frequency of dangerous situations can be reduced.
The training sessions offered by tk Uhde have different levels of complexity, starting with an easy level for beginners and progressing to highly complex sessions for veterans. With the training simulator several scenarios can be simulated, such as: Start-up (cold and hot). Normal operation. Load change. Shutdown (planned and unplanned). Various failure scenarios.
After signing in, a trainee can interact with the simulated plant in a similar way to a real plant. Any change will lead to a time-dependent behaviour from the plant, including changes in operating parameters such as temperature or pressure.
The trainee can switch between two different views. In the DCS view, the trainee works like a control room operator. Setpoints or valve positions can be changed and the alarm list and trip schedule can be shown. The second possible view is the so-called ‘fi eld view’. By switching to the fi eld view, the trainee can see all fi eld instruments and operate all hand valves.
These two different visualisations are shown in Figure 3, using an ammonia synthesis loop as an example. As only DCS connected valves are visible in the DCS view, there are fewer valves shown in the left-hand side picture, whereas all valves can be seen in the fi eld view.
The training can be performed individually or several trainees can connect with their electronic device to one plant simulation. Consequently, tasks can be split among the group of trainees and communication between the fi eld operator and the operator in the control room can be practiced as well.1
Conclusion
Digital products and services, such as those provided by tk Uhde, combine the engineering and process expertise gathered as an EPC contractor during commissioning of process plants worldwide with data-driven methods and artifi cial intelligence. Such digital services help companies to analyse, stabilise and optimise a plant during its lifetime and support a safe operation. Avoiding an emergency shutdown of one day can save hundred of thousands of dollars; conversely, the cost of not operating under the optimal conditions quickly rises above several million dollars per year. Avoiding these situations will quickly pay off the initial expense of installing digital solutions. Ecological and safety parameters can also be optimised, allowing operators to fulfi ll their purpose to create a liveable planet.
Reference
1. POSCHLAD, K., and WAGNER, D., ‘Digital Solutions For Fertilizer
Plants’, Nitrogen + Syngas Virtual Conference 2021.
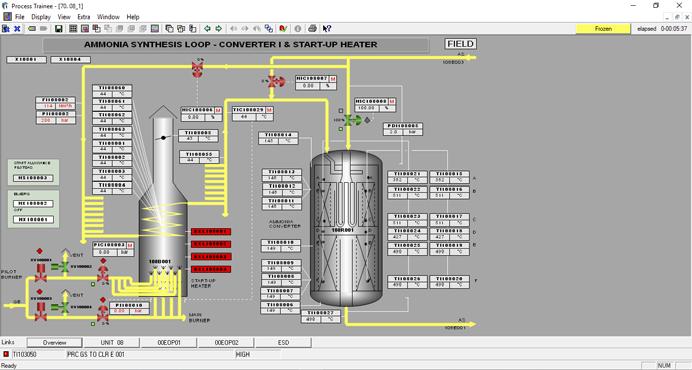
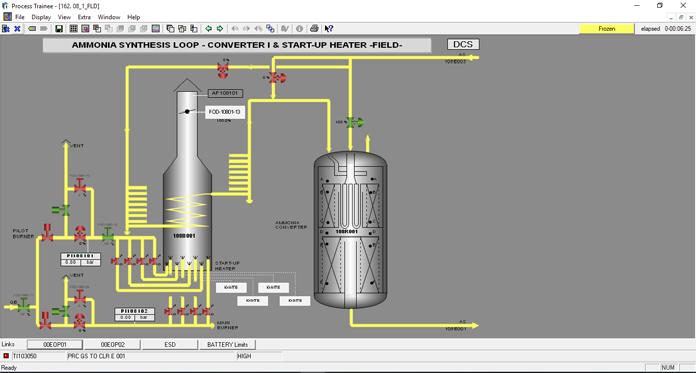
Figure 3. Surface of training simulator for ammonia synthesis loop for DCS view (left) and field view (right).


