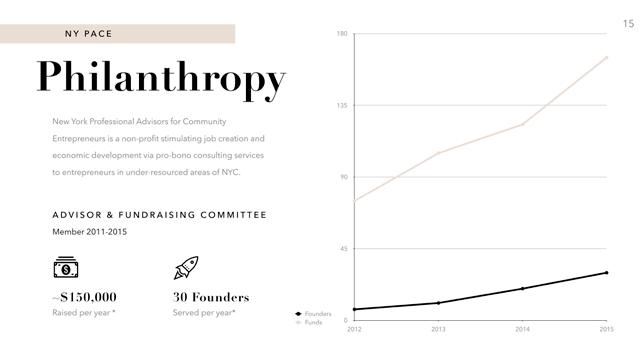
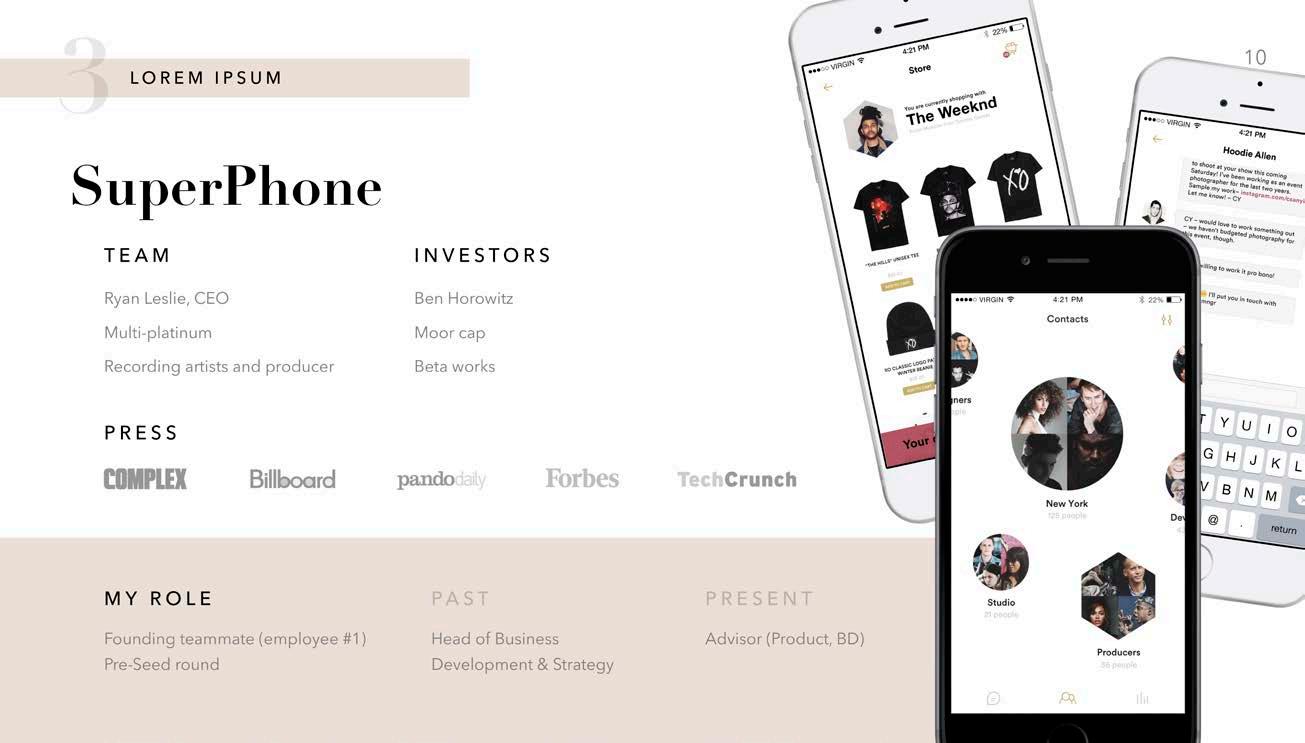
PORTFOLIO PITCH DECKS
01. Arts 03. Fashion 05. Retail 07. Sports & Fitness 08. Tech 02. Health 04. Finance 06. Social


LED BY STEPSTONE ART RESOURCES , LLC (STAR) TO ACQUIRE MCGAW GRAPHICS, INC. 1 2 POSITIONED TO BECOME PLATFORM COMPANY AND ROLL-UP CATALYST IN THE ART/TECHNOLOGY AND FINE ART PRODUCTS MARKET 3 STAR NEGOTIATED DEAL, CONDUCTED DUE DILIGENCE, RAISED INITIAL CAPITAL AND BANK FINANCING 4 RAISING $800,000 OF ADDITIONAL EQUITY FOR 30% - TERMS TBD $400K EBITDA $500K cash $500K AR & other current assets $1M of debt 5 IN-PROGRESS 9 IN-PROGRESS 2 PROJECT WARHOL IS A 30 YEAR OLD ESTABLISHED COMPANY in the wall décor world with deeply established distribution relationships, selling through galleries, museum stores, mass-market retailers and internet retail channels
THE ORIGINAL FOUNDING COMPANY Used to have revenues in excess of $25M Still relies heavily on print catalogs for marketing and advertising No consumer focus or experience in turning digital into actual growth channel THE IMMEDIATE OPPORTUNITY STRATEGIC
ROLLUP
WALL DECOR Typically run by older entrepreneurs without digital savvy or access to capital
niche focused
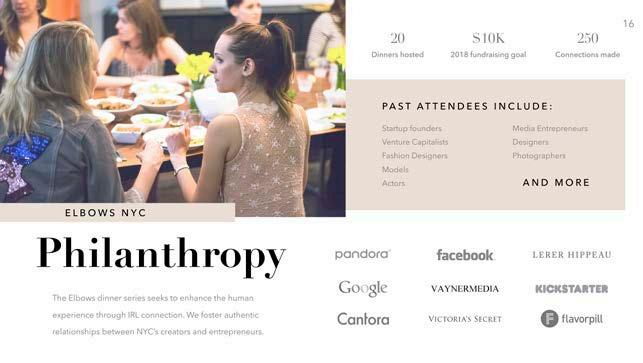
exit opportunities Many $2-6M players without the scale to be consolidators WARHOL HAS AMPLE FOUNDATION TO BUILD ON AND IS A NATURAL AGGREGATION PLATFORM 1000 | MUSEUMS AND PROJECT WARHOL A PERFECT MATCH PROSPECTIVE ACQUISITION THE COMBINED COMPANIES would become a fully integrated end to end art publishing powerhouse PROJECT WARHOL would continue to operate, focusing on its B2B channel sales and generating stable cash flow 1000 MUSEUMS an leverage the strategic relationships and assets of Project Warhol to invest in expanding its print on demand business for consumers B2B B2C ■ ARTS
DEAL STRUCTURE
THE PROSPECT
OPPORTUNITY
IN
Very
Non-obvious
Doctors can make an additional procedure without any


Using our platform, Doctors can choose to finance 0%, 50%, or 100% of their patients loans. We manage the
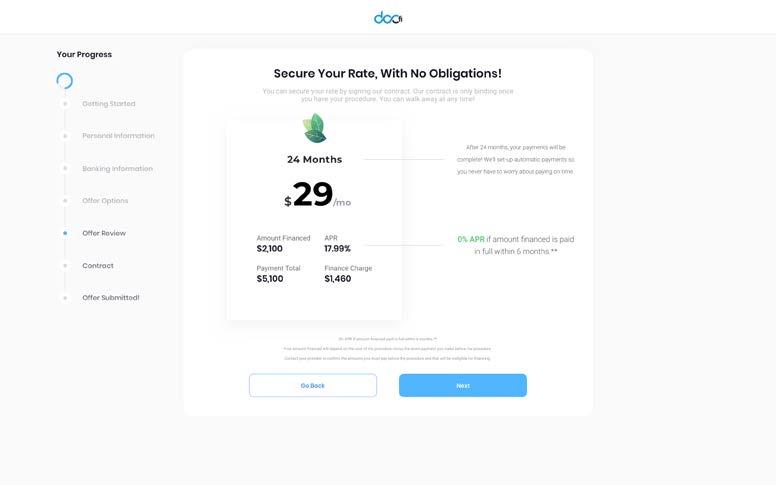


6
WE FUND THE ENTIRE LOAN AND PAY
ON A 30-DAY CYCLE. WE FUND HALF OF THE LOAN AND SPLIT 50% OF THE INTEREST. THE DOCTORS FUND THE LOAN AND RECEIVE 100% OF THE INTEREST. money “out of pocket”. Value of Procedures Financed Financing Principal Financing Interest $59,082,000 We plan to acquire 200+ Practice Partners and finance 9,160 Procedures in Y1. Lending Projections Avg. Financing Amount Avg. Lending Term Avg. APR 24 months 5,000 $ 14.5 12 $45,800,000 $13,282,000 Our platform and how it works Any patient can access our platform online directly through our website and complete an application for financing. their approved, we’ll pay the doctor directly. ONLINE (DTC) 2 We partner with medical practices and provide point of sale tablets, where patients can check financing options in-office and receive financing the same day. IN-OFFICE (B2B) 1 With our platform, everyone wins Lowest financing rates Flexible payment terms Highest approvals rates Our platform streamlines the process for everyone. We make it simple to make payments and get paid faster. PATIENTS DOCTORS
process, administrative work, and patient collections
DOCTORS
DocFi simplifies patient financing by providing the medical industry with turnkey infrastructure
a management tool for online and point of sale patient financing. APPLICATION PROCESSING PAYMENTS SERVICING APPROVALS 2 Patient Financing Optimized CONFIDENTIAL INFORMATION INVESTMENT BRIEF 2019 ■ HEALTH
Doctors fix patients, we fixed patient financing
and


NOTE: “Other” Includes respondents who said the primary reason was “some other reason”, respondents the process signing insurance, and respondents who didn’t know/ refused to respond. SOURCE: Kaiser Family Founda on Health Tracking Poll (conducted December 1-7, 2015) Cost is the primary reason for remaining uninsured Would rather pay the fine Tried to get coverage but was unable 7% 9% 11% 13% Other Tried to get coverage but too expensive 46% 14% Didn’t know about requirements Target Market Postponed seeking care Postponed or did 24% 20% The uninsured popula3on postpones or goes without care altogether because of costs... The impact is felt across the system 5% 11 UMA Receives: 15% of the procedure cost as commission Pays: 5% of the procedure cost to the pa1ent in UMA credits The breakdown of a visit 3 1ents Providers Pay: $0 ini1 1on or monthly/ annual fees Receive: 85% of the procedure costs Cost of the procedure Receive: 5% of the procedure cost in UMA credits for their next booking 6 Difficulty paying or unable to pay medical bills Using up all or most savings Difficulty paying for basic necessi1es Borrowing money Being contacted by collec1on Leading to more expensive care that they can’t afford when it’s too late 53% 27% 27% 21% 22% NOTE: Includes adults ages 18-64. All differences between uninsured and insured groups are staJsJcally significant (p<0.05). SOURCE: Kaiser Family FoundaJon/New York Times Medical Bills Survey (conducted August 28-September 28, 2015.) Among insured and uninsured non-elderly adults, over the last 12 months, 2015 Problems Paying Medical Bills by the Uninsured 8 Pa1ent logs onto UMA to easily nd and lter doctors according to cost, distance, ra ngs and availability. 01 Pa1ent sees the price of visit upfront and books the doctors that suits their needs. 02 Appointment is secure upon credit card processing 03 VIEW CREDITS Visit Complete! Visit complete and pa1ent receives survey to get 5% back to use on future bookings through UMA. 04 How it works


PAIN
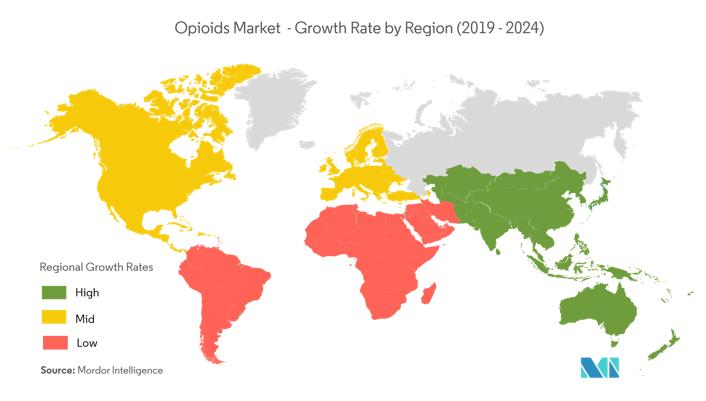
MARKET
Market in 2018
How FINDMINE® Works


Retailers


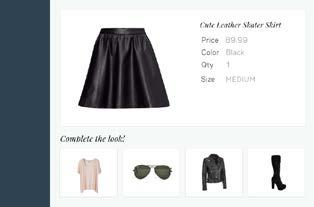


3 With so much data, couldn’t product curation be simpler? “How do I wear this?” ? ? ? ? ? ? ? ? The Problem Merchandisers are overwhelmed Shoppers demand complementary products Lacking technology, merchandisers are manually sifting through thousands of products. Retailers are wasting time. This is Retail, Made Smarter… Machine learning helps us group products that can be used together in real life Because “Joe” In Iowa bought a TV and golf clubs based on other shoppers’ purchases Before FINDMINE® With FINDMINE® products that can be used together You bought… We recommend… You bought… We recommend… Because these products actually go with your TV 12 Source: US Census Bureau, E-Marketer US E-Commerce Total Global Retail Current Revenue Current Revenue $22.3T $2.3T Missed Opportunity 10% Increase $230B Our Long-term Global Market Potentail FINDMINE® revenue $3B Missed Opportunity $300B 10% $30M Starting Point Potential FINDMINE® revenue Our Market FINDMINE® helps retailers capture revenue their competitors are leaving on the table We’ve identified 85k global ecommerce retailers in immediate need of our technology
FINDMINE ® integrates directly with the retailer, pulling product data from their public site into the FINDMINE® database 1
automated M atches
created automatically
Tools
can choose how automated they want customers to be targeted Fully
are
Assistive
Use insights to curate matches manually
7
is simple,
a
of code, the solution goes live
a retailer sells. 3
machine learning technology analyzes their products to match them with contextually relevant products 2 Machine Learning for Smarter Retail Michelle Bacharach, Co-Founder & CEO michelle@findmine.us 925.787.6181 www.findmine.us Thank You ® Customers need guidance Consumers look for product advice and inspiration online, generating over 600M queries/day Consumers have never had so many choices, making the experience more confusing than ever Mike lands on barneys.com looking for the perfect fall boots He finds Varvatos Chelsea Boots "What jeans do wear with these with?" Mike leaves barneys.com to search “men’s fall fashion trends” on Pinterest On Pinterest, Mike jumps to neimanmarcus.com and Barney’s ends up losing valuable time with Mike 1 2 Vintage Brown Suede 4 3 ■ FASHION
Partially automated Retailer can review and approve matches
Implementation
with just
snippet
anywhere
Proprietary

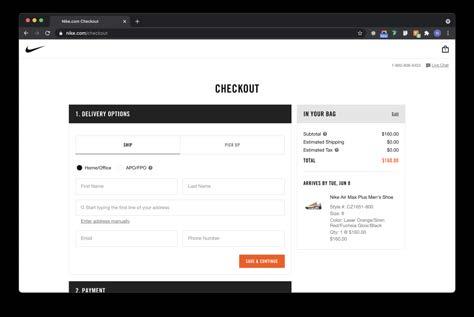


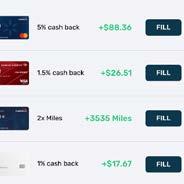

It has become an overcomplicated game stacked against the consumer. We all need to play, but we don’t know the rules. Consumer credit is essential to American living. But credit is no longer serving its original purpose. Americans paid $121B interest in 2019 40% of Americans have credit card debt They have little visibility into their entire nancial lives Americans have 4-7 credit cards $154 billion in rewards sleep on member accounts BACKGROUND 4 Consumers can't e!ectively use these cards to get what they were promised. THE PROBLEM NOT ENOUGH TIME AT THE POINT OF SALE OVERLY COMPLICATED RULES ARE ALWAYS CHANGING WHY? HARD TO TRACK Lever's unique position creates several revenue streams. BUSINESS MODEL SCALABLE MONETIZATION WITH REVENUE STREAMS MARKET ESTABLISHMENT MARKET PENETRATION AQUIRE USERS Bank and Merchant Partnerships $ $$ $$$ 13 9 Step 1 Step 2 Step 4 Step 3 Lever will tell you which card o!ers the best rewards THE MVP $4T+ Credit card market 83% US adults own a credit card 75% consumers with rewards program card 0,5 1 1,5 2018 2023 NUMBER OF CREDIT CARDS 1.12B 1.25B 150 175 200 2018 2023 182M 193M NUMBER OF CARDHOLDERS $900B+ E-commerce Market Large, growing, and disrupted market. Everyone's involved. THE MARKET 12 >250 Neobanks worldwide 80% consumers prefer cards over cash A smart wallet platform helping consumers control the credit card game and get what they deserve. THE SOLUTION Automatically use the best card for each transaction at the point of sale AUTOMATED SELECTION Lever's algorithm selects the best card to charge based on the users' speci reward and financial goals PERSONALIZED ALGORITHM New credit card suggestions that the users spending habits and nancial situation TAILORED BANKING Helps improve credit scores by paying o! debt automatically at optimal credit CREDIT BOOSTER 5 ■ FINANCE


25 Fund I: Portfolio Data 2017 Average Annual Revenue $ 5,165,000 2018 Forecasted Average Annual Revenue $ 3,154,295 $ 17,025,000 Average Valuation of Last Capital Raise 30 Average Number of Full Time Employees Fund I Our Team Brad Harrison Managing Partner United States Military Academy MIT Sloan, Airborne Ranger, AOL John Ryu Venture Partner Yale University Berkeley Haas Co-Founder, 310Labs, AOL Wes Blackwell Partner United States Naval Academy UVA Darden, Naval Aviator, DataTribe Brendan Syron Principal Boston College Carroll Boston College MBA, Kekst Co. Bill Perilli CFO CPA; 10 years VC/PE Cardinal Partners, E&Y 23 Fund I: Overview 462 Fund Employees 41 Limited Partners 24 Checks Signed 7 Fund Exits $4.2M Raised $3.8M Invested $2.1M Capital Returned $41M 2017 $56.8M 2018 + 97,820,833 $ REVENUE A
In this report, we will review the fund activities for all four funds: BHV Entrepreneurship Fund, L.P. (“Fund I”), BHV Entrepreneurship Fund, IA L.P. (“Fund IA”), Scout Ventures Fund II, L.P. (“Fund II”), and our third flagship fund, Scout Ventures Fund III, L.P. from January 2017 through the first half of 2018. We have had a active and exciting year at Scout Ventures as our top performing portfolio companies continue to raise large follow-on rounds and begin to explore exit opportunities through both M&A and IPOs. We have achieved material exits across our first three funds, enabling us to return 50% of the capital in Fund I, 130% of the capital in Fund IA, and 10% of the capital in Fund II. While Fund III is only in its first full active year, we’ve already seen multiple companies raise follow-on capital at up-round valuations. Further we have achieved a lifetime blend IRR of 18.4% across our funds, and our top performers have yet to exit. FUND I: Fund completed its first close on June 15, 2011 and recorded the final close on June 15, 2012. We raised a total of $4.2M and successfully deployed $3.83M across 24 companies in New York, Los Angeles, Silicon Valley, Austin, and Washington, D.C. Seven of our portfolio companies: Olapic, inSparq, Kanvas, Social Weekend, GateGuru, Plyfe, and AvCom have been acquired. Top performers such as Signpost, Bespoke Post and LeagueApps continue to ramp up revenue and raise follow-on rounds, driving the overall book value of the fund to 3.1X. FUND IA: In June 2013, we launched Fund IA to enable Scout to invest in its pro-rata opportunities for select Fund investments. We raised a total of $1.70M, and invested $2M across eleven Fund portfolio companies. These financings include seed-extension, Series A, Series B, and Series C financings. The acquisitions of Olapic, Kanvas, and insparq have enabled us to return 130% of invested capital to limited partners. Our top performing portfolio companies across Fund IA continue to raise large growth rounds and up-round valuations. According to our valuation methodology, we expect Fund IA to return at least 3X invested capital. FUND II: In March 2013, we launched our second fund, Scout Ventures Fund II. On June 30, 2015 we recorded the final close for Fund II. In total, we raised $10.84M from a diverse base of investors including angels, high net worth individuals, family offices, and institutional investors.
date, Fund has invested in 39 companies and deployed $9.37M in capital. Several of these portfolio companies have gone on to raise large follow-on rounds at significantly higher valuations, including ID.me, Nestio, Everplans, and SeedInvest, among others. These up-round financings have driven the overall book value of the fund to 1.5X. To date, we've achieved 8 exits: RedOwl, Cody, Kanvas, HealthyOut, Sverve, Voyat, FreshTemp, and LiveNinja. These exits enabled us to make our first distribution to investors in September 2017 as we returned 10% of committed capital. We are very optimistic about the outlook for the portfolio as our top performers remain on track to achieve large exits and drive outsized returns for the fund as whole. FUND III: In 2018 we held our first close for Fund III. To date, we’ve invested in eight companies out of our third fund: Visual Vocal, Synapse Corp, Sustainitech, De-Ice, Deepsig, Cyr3con, TrueFace.ai, and Tomahawk Robotics. These investments highlight our strong focus on Frontier-Technologies assembled by seasoned teams building and using proprietary technology. TEAM: In January of 2018 we added Wes Blackwell as a full-time Partner. Wes brings a shared military background, as well as his own unique relationships to our firm and portfolio companies. Wes is graduate of the United States Naval Academy and University of Virginia's Darden School of Business. He was a naval aviator, private equity operator, and leadership professor. His previous work scaling startups and businesses will provide a material impact on our current and future companies. As an active angel investor, he has built an impressive portfolio. Wes is based in the greater DC area and is focusing on hard to access founders from the military, intelligence, and research communities. IN SUMMARY: The past year has been one of tremendous progress and growth at Scout as we continued to solidify our reputation as one of the top seed funds, investing in geographies across the country from California to our home base in New York. With the addition of Wes, we have refined our focus on investing in standout Frontier Technologies built by hard to access founders. With our proprietary network, we continue to identify and invest in entrepreneurs that are utilizing technologies at the forefront of their industries to disrupt established business models and enhance efficiencies to make the world better safer place. The following pages include more information about our portfolio companies, the funds, and Scout Ventures as a firm. hope that you will enjoy reviewing the commentary and performance data included in this report. As always, we welcome any and all feedback. Brad@ScoutVentures.com We are proud to release Scout Ventures’ Sixth Annual Report BRADLEY C. HARRISON Founder & Managing Partner 4 NY DC LA TX 24 Fund I: Statistics 4 Advertising & Monetization 15 Cloud Infrastructure 2 Mobile and Digital Payments 6 Big Data Analytics 2 Commerce and Services Areas we have invested Where we have invested 6 Social Content Top Performer Acquired Company Board Seat Write-down 70 Company Description Sector CEO/Founder Location of Employees Details Mayvien tablet-based wholesale and PR management solution for clients fashion industry. Commerce Services Shuang Wang, Izzy Johnston New York, NY Fund $250,000, May 2013 Nestio residential leasing and marketing platform, providing cloud-based software for multifamily landlords and brokers. Since launch four years ago, Nestio has quickly become dominant residential leasing and marketing software for multi-family landlords and brokers, with nearly half New York’s rental listings originating platform. Commerce Services Caren Maio, Michael O’Toole New York, NY 30 FT Fund $307,941, June 2013 PortfolioWatch, launched Novermber 2014, dynamic online tool that provides LPs an inside view the performance Scout’s funds and their underlying portfolio companies real time. Through quantitative and qualitative analysis of each fund and portfolio companies, PortfolioWatch provides LPs with clear and detailed picture the funds’ investments, their current book values and scenarios for projected exit values. Big Data Analytics Brad Harrison New York, NY N/A (In-House Project) Fund $100,000, March 2014 Pushspring data analytics firm that provides audience composition data advertisers and publishers optimally segment their target customers. Its database currently stores 200 million mobile device IDs and provides 120 target personas for audience composition analysis. using their service, clients can uncover unique audience traits of their target customers. Advertising Monetization Steve Dossick, Tyler Davidson Seattle, 23 FT Fund $225,000 July 2015 rFactr SaaS platform that quantifies and accelerates social media sales enterprise clients. SocialPort, the Company’s primary product, social media communication system that helps sales organizations generate new channel inbound leads, making social sales more efficient and allowing marketers maximize the impact their content beyond traditional channels. Big Data Analytics Richard Brasser Charlotte, NC 10 FT Fund $125,000, February 2013 Fund II: Company Summaries Top Performer Acquired Company Board Seat Write-down 41 Fund II: Portfolio Companies Vengo next-generation marketing and vending platform for physical products. Vengo's mini vending machine has wall-mounted, flat-screen, touchoperated computer display for advertisements and customer interactions. couples the physical point-of-purchase with immersive digital content in gyms, colleges and hotels. This past year was extremely exciting for Vengo, as the company had many location expansions for its vending platforms. In May 2018, Vengo received the greenlight deploy 1,000 additional machines Planet Fitness gyms and deploy all corporate-owned NYC Blink Fitness locations. Additionally, the company partnered with Unilever distribute the St. Ives brand its machines. 2017, Vengo grew its revenue 100% year-over-year just over $3M. The team has 15 full-time employees, and expecting earn $9M revenue 2018. Virtuix virtual reality hardware developer that created the Virtuix Omni, the first ever virtual reality motion platform for moving freely and naturally in virtual worlds. The device lets you walk, run, sit and strafe with 360-degree freedom of movement, allowing you control your avatar in VR without restraints. Virtuix has had an exciting year, transitioning B2B hardware business, with high margins (6x markup), high volumes, and recurring revenues from gameplay. They had their first profitable month in November 2017. The company has phased out their original low-volume direct sales model, and replaced with global distribution network that includes 12 distributors on different continents. Omni production continues steady pace, with more than 2,500 units shipped out to more than 500 commercial operators. Virtuix’s focus has shifted filling their distributor network and expanding the Omniverse platform adding more games and features. Given the company’s recent profitability and robust sales growth, they are starting preparations for Series round 2019. In May 2018, the company raised $3M convertible note round with current investors to help strengthen its balance sheet and to support sales and marketing new project, Voyager. We followed this round with our pro-rata. The company currently has 24 full-time employees and part-time employee. 2017, Virtuix had $4M revenue. Virtuix expects have $10M in sales in 2018 and remain profitable. vengolabs.com April 2014 FUND II: $320,744 virtuix.com April 2014 FUND II: $135,776 Hard to Access Founders Through our networks we have proprietary access to technical founders coming out of the Department of Defense, intelligence communities and national research labs. Our leadership team has unique combination of investor, military, and front-line tech experience. This allows us to build rapport with hard-to-access founders by breaking through skepticism towards traditional investors. Because their underlying technology or intellectual property has often been tested in laboratories or government organizations, much of the product and technical risk is mitigated at the time of investment. We are investing in technology that is virtually “no strings attached” from these places. We know how government usage rights work and through our diligence process ensure that there won’t be restrictions to us commercializing these technologies and scaling them. Technology Developed Seasoned Entrepreneurs We are focused on founders that come to us with proven technical and leadership experience; entrepreneurs who have experience developing innovative products elsewhere or have core underlying IP. These founders have mature interpersonal skills developed while leading, recruiting, and building teams other high-performing organizations. Scout invests companies that can become capital efficient with under $5M paid-in capital. We believe that investing in and building sustainable companies ultimately generates the best returns for investors. Although many of our companies raise more than $5M, we believe important for companies to demonstrate the ability become break-even early their life cycle, protecting them from market volatility and enabling them to succeed in boom and bust cycles. Capital Efficiency Investment Focus
Letter From Brad
To


METHODOLOGY ALIGNMENT ITERATION ORGANIC FARM Perfected through core supply chain advantages One of only three USDA organic certi ed farms in the country Proprietary patentpending extraction methodology Largest shareholder is manufacturer. Consignment terms Lean & agile product development process for continual improvement driven by science PROBLEM 6 Scaling up three rapidly growing markets CBD 2019: $2.3B 2023: $10B Athletic Recovery 2019: $10B 2023: $17.8B Health & Wellness $4.7 Trillian Dollar Market 10% CAGR Win CBD on USDA Certification Leverage CBD as an entry point into Athletic Recovery Expand the ‘Recovery’ definition in the wellness category 2 3 PROBLEM MIND BODY SLEEP So we're designing products & experiences to help people stress less SOLUTION Gross Revenue 108,160 289,510 419,185 494,130 571,545 Net Revenue 95,181 354,769 368,883 434,834 502,960 (-) COGS 53,507 140,297 171,803 196,614 224,503 Gross Profit 41,674 114,472 197,080 238,220 278,457 Gross Margin 44% 45% 53% 55% 55% Personel 12,500 32,500 32,500 32,500 32,500 Ad Spend 60,000 130,000 150,00 150,00 155,00 Other Overhead 59,711 69,286 76,133 80,090 84,178 Total Operating Expenses 132,211 231,786 258,633 262,590 271,678 Operating Income 90,537 117,314 61,553 24,370 6,779 Operating Margin 95% 46% 17% 6% 1% Total Transactions 1,664 4,454 6,449 7,602 8,793 AOV (end of period) 65.00 65.00 65.00 65.00 65.00 CAC (end of period) 43.23 43..33 43..33 43..33 43..34 LTV (end of period) 140 145 176 178 181 LTV/CAC (end of period) 3.24x 3.34x 4.05x 4.10x 4.17x Financial Projections QUARTERLY SUMMARY 2019 2020 Q4 Q1 Q2 Q3 Q4 FINANCIALS 11 INTENSE FITNESS ALWAYS ON WORK POOR SLEEP SOCIAL PRESSURE People are burning themselves out PROBLEM MODERNIZING SELF-CARE ■ RETAIL


We bootstrapped our way to fast, profitable growth in New York City Local college events Gorilla marketing techniques College ambassador programs Grit 2017 REVENUE GROWTH Profitable and growing Blog, videos, and case studies 2017 PROFITS MARGIN We’ve done very little marketing. And our team is lean. 28% 40% How our process works Jen says “Yes” to apartment We prequalify Jenny for the apartment and matchmaking begins Jen and Mike each separately take roommate compatibility tests We find Jen great apartment based on survey criteria Roommates meet We facilitates real-time discussion between potential roommates, in person or on video chat Our staff handles the entire brokerage process from end-to-end It’s match! STEP 1 STEP 2 STEP 3 STEP 4 STEP STEP STEP STEP 1 2 3 4 5 6 7 8 10 16 Our Financial Model 3Q18 4Q18 1Q19 2Q19 2018 2019 2020 2021 2022 Sales commision $120.0 $165.0 $487.5 $1,375.0 $566.9 $6,246.0 $28,553.2 $160,611.8 $356,915.0 Application revenue 7.5 10.0 23.3 63.0 29.8 328.7 1,502.8 8,453.3 18,785.0 Total revenue 127.5 175.0 510.8 1,438.0 596.7 6,574.8 30,056.0 169,065.0 375,700.0 Commission paid 60.0 82.5 135.0 432.0 212.5 1,577.9 7,213.4 40,575.6 90,168.0 Gross profit 67.5 92.5 375.8 1,006.0 384.2 4,996.8 22,842.6 128,489.4 285,532.0 Operating expenses 36.0 142.0 270.0 422.0 248.0 2,038.2 9,317.4 52,410.2 116,467.0 Operating profit 31.5 -49.5 105.8 584.0 136.2 2,958.6 13,525.2 76,079.3 169,065.0 Ratios key data Sequential growth Revenue 38% 195% 182% 44% 1002% 357% 463% 122% Operating profit -257% -314% 452% 37% 1002% 357% 462% 122% Margin Gross margin 52.9% 52.9% 73.6% 70.0% 64.4% 76% 76% 76% 76% Operating margin 24.7% -28.3% 20.7% 40.6% 22.8% 45% 45% 45% 45% Drivers Roommmate matchmakers 4.0 9.0 14.0 29.0 9.0 50.0 200.0 1,000.0 2,000.0 Applications matchmaker 22.5 21.7 33.2 43.9 60.0 140.0 160.0 180.0 200.0 Revenue per matchmaker $31.9 $19.4 $36.5 $49.6 $66.3 $131.5 $150.3 $169.1 $187.9 Applications clients 55.6% 69.2% 87.1% 89.9% 85% 85% 85% 85% 85% Applications 90.0 195.0 465.0 1,273.0 540.0 5,950.0 27,200.0 153,000.0 340,000.0 Clients 50.0 135.0 405.0 1,145.0 459.0 5,057.5 23,120.0 130,050.0 289,000.0 Average revenue per client $2.6 $1.3 $1.3 $1.3 $1.3 $1.3 $1.3 $1.3 $1.3 Perfect Strangers is all about high quality matches Lifestyle Budget range Move-in date Cleanliness level Guests OK? Work hours We lease only if there’s a highsuccess rate match An in-depth discovery process, facilitated by us, helps us determine the likelihood of success Smoking Pets 11 Landlords love us, too Perfect experience for landlords... Reduced tenant turnover / longer leases Highly qualified, happy tenants A trusted partner and process ...Means we get: Exclusive listings First access to showings 13 We’re are full-service brokerage, focused on user experience Focusing on tenant happiness leads to greater customer lifetime value Jen leases first apartment from Perfect Strangers We find Jen a studio apartment too Jen buys a house from Perfect Strangers Real Perfect Strangers Customer Example 6 - 25K+ IN POTENTIAL CUSTOMER LTV $2,600 $3,000 $20,000 2 Finding a compatible roommate and first apartment is an antiquated process with poor UX No reliable, central resource for neighborhood and apartment information Poor UX - No central spot for documents, paperwork, credit score, and more
search process. Craigslist is NOT dependable for roommate matching Isn’t moving to a new city challenging enough, as is? We make finding your perfect home and roommate easy and enjoyable Perfect roommate Perfect neighborhood Perfect home Our matchmakers are full-service brokers that handle the entire search and lease process from end-to-end Initial screen ensures users find the best neighborhood for their preferences We use an in-depth, sophisticated process to find our users roommates that become best friends 3 Thank you Sarah Hill Founder & CEO
(585) 474 5836 www.perfectstrangersofnyc.com ■ SOCIAL
Scattered
sarah@psofnyc.com


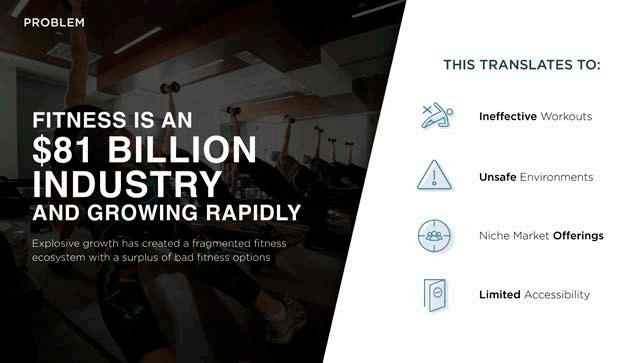
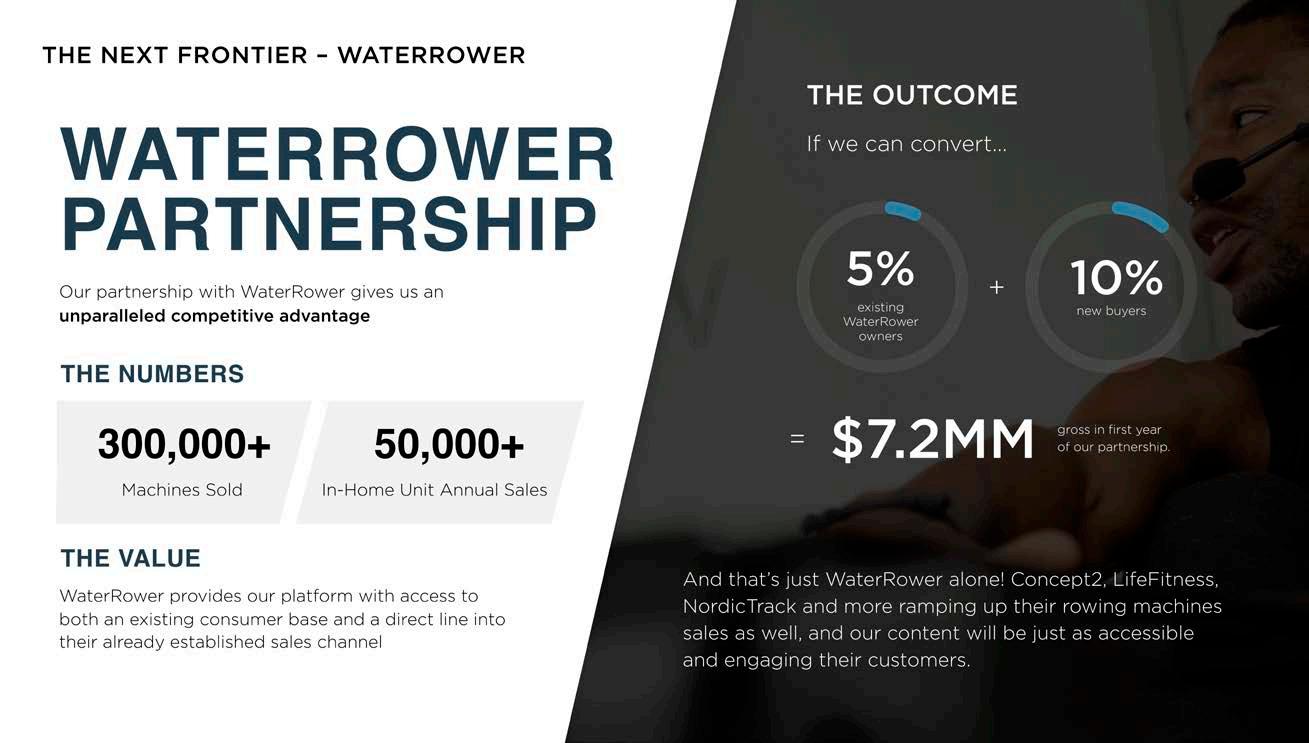
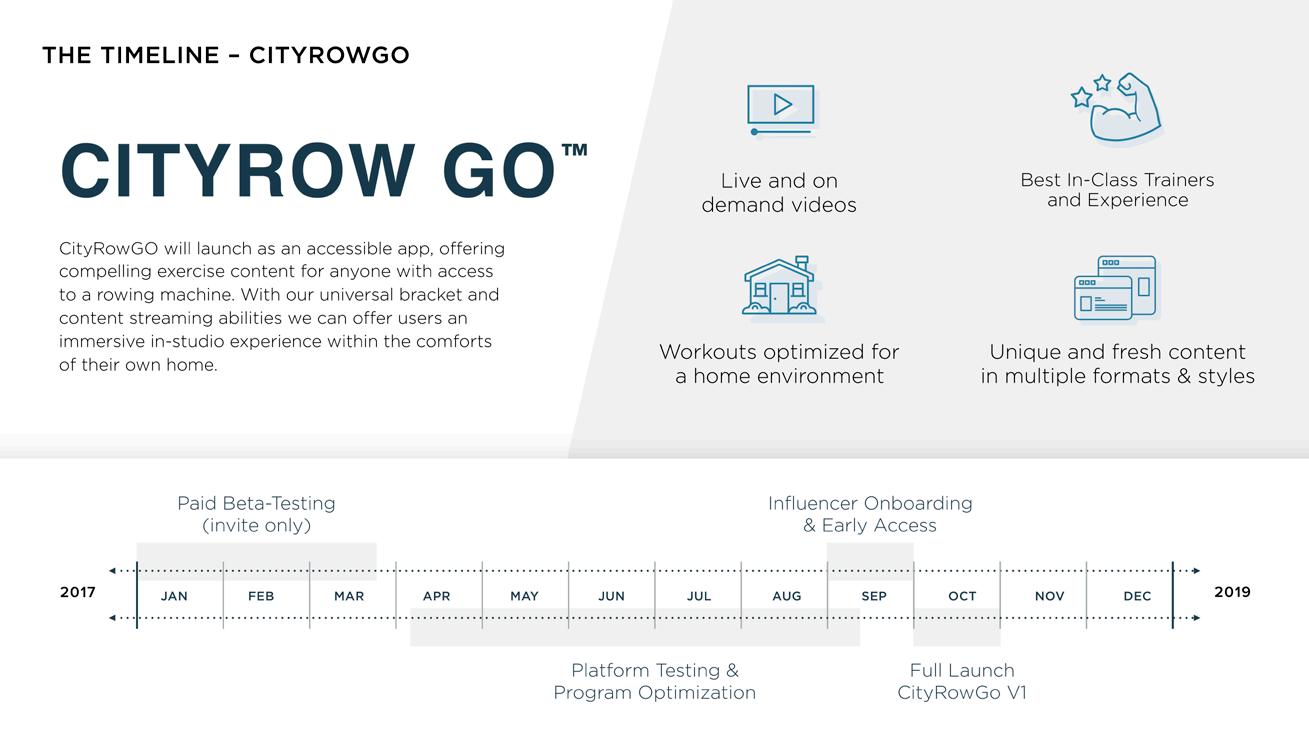
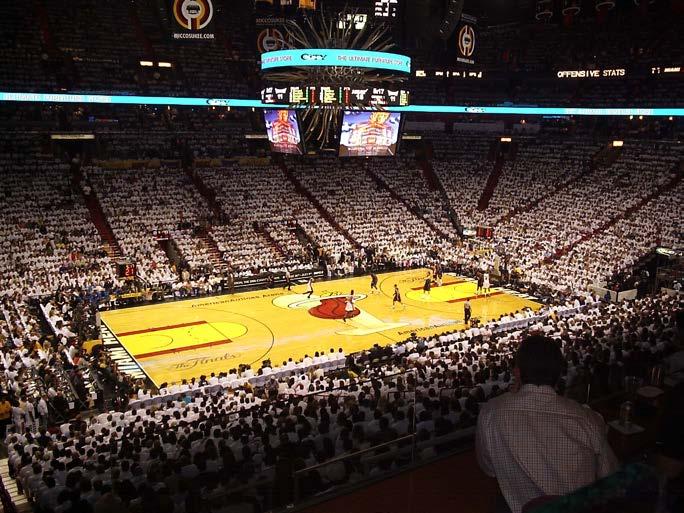
A Workout Experience That Delivers CONFIDENTIAL MATERIAL ENCLOSED INVESTMENT BRIEF 2017 WWW.CITYROW.COM ANYONE, ANYTIME, ANYWHERE ■ SPORTS & FITNESS