COLLECTIVE VOICE
A framework for data collection in the implementation of collaborative design.

A framework for data collection in the implementation of collaborative design.
A welcome message from the creators.
Thank you for being here. We hope you find this community-based tool useful, whether you’re an architect, urban planner, academic, citizen, member of an institution or organization, inside or outside Perkins&Will.
We encourage you to use this tool to take constructive and informed action for the benefit of your community.
The Monterrey StudioEvery project, effort, and initiative has the potential to collaborate with the community to design hand in hand with them. Question yourself about the challenges society faces and let this guide answer them.
The guide is divided into two main phases: the theoretical framework and the methodology it supports. The theoretical section provides relevant information about the concepts and case studies that inspired the framework. This work will teach you each step of the framework and provide recommendations for effective use.
Now you are ready to conduct a data collection project using the framework process and the tools you have learned to engage with your community. Follow along the methodology step by step, and you’ll be amazed at the interesting results of each response.
Technology, economics, sustainability, accesibility, a few of the challenges experts face in modern society.
In every problem-solving situation, the search and analysis of information is one of the first approaches to start working towards a solution. Diving into design purposes, information can be gathered from a diversity of tools to know about the context, site, and its users. However, only a
few of them are accessible to the public and most of the information recorded doesn’t come from a people’s approach perspective. Extreme non predictable scenarios are challenging today’s society, and a tool that facilitates data collection in a more rapid way is essential to start facing these.
What drives these experts solutions?

The use of data has become an essential tool for measuring and improving processes. Meeting and listening to people is not only a tool, is an opportunity.
There’s an opportunity to analyze qualitative information with the same certainty a quantitative investigation can give. The main factor of this qualitative data collection is to focus on a constructive way of thinking towards everyone’s needs, opinions, and ideas. We will question ourselves about areas of opportunity but also about what is the what makes us feel part of the space and how we make use of it.
Integrating quantitative information and qualitative information is the core of this methodology, since it guides us through the user’s desires, thoughts, and insights that can’t be measured. Thus, this approach yields new information that is often not questioned. Gathering all this information provides a broad perspective on the city’s needs, serving as an initiative to encourage institutions and organizations to consider citizens’ voices in decision-making.

Focusing
on the positive way of viewing life challenges.
Our objective
By the creation of an easily replicable framework for collecting information from community voices.


Transform qualitative information into quantitative measurable data for analysis with a higher level of confidence.
Implement a scalable framework to promote information accessibility for the community, private institutions, social organizations, and government departments.
Graph and analyze information at different scales: from a small community to an entire city.
The Innovation Driver The methodology’s differentiating factor is its sampling process, which focuses on people.
Additionally, encouraging individuals to express positive ideas and outcomes offers an innovative approach to problem-solving.
Where we were
Where we are
Where we are going


During the planning of the yearly action plan for the ResilientSEE Mexico group, questions arise as to which sector and issue should be addressed.

To answer the group’s question and act on a specific issue, an urban activity was developed with the purpose of talking and listening to people’s opinions. Submission of our initiative to the Innovation Incubator to expand and improve our idea and obtain the necessary resources to continue.

We gather more information for our Innovation Incubator’s project, a second urban activation was conducted.


Publish and graphically display the results of the urban activations in an online dashboard, in this case PowerBi, to make them accessible to all interested parties.
Share information and the framework basis with institutions and organizations so they can incorporate them into their decisionmaking process.
Implementation as an Additional Service
Replicate the urban activation and data collection in new areas of the city.
Begin offering this process as an additional service on studio projects. Teams can customize and adapt this tool to meet their project research needs.


Resilience is the capacity to withstand and overcome adversity, emerging stronger and more adaptable from challenging situations.
Resilience goes beyond traditional methods of mitigating disasters. Whereas Disaster Risk Reduction is based on a deterministic (predictive and avoid) approach, resilience focuses on the ability of a system to function and develop in the face of a variety of stresses and shocks. Uncertainty and
change are understood to come from within the system and the environment (endogenous) as well as from outside the system (exogenous). The concept of evolutionary resilience recognizes the complexity of resilience in systems and their continuous adaptation.
Strengthened Flexibility
Responsiveness and, what makes a city “ resilient”?
Resilient City
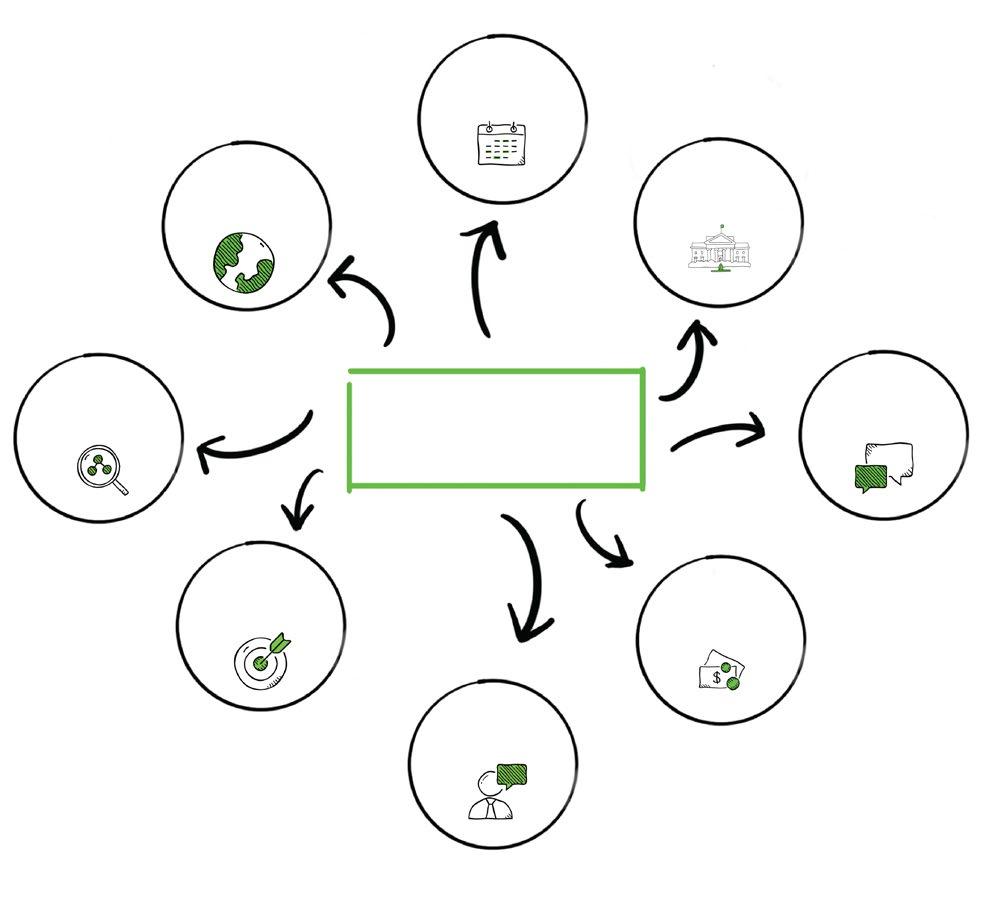
Cohesion
Resilient cities are cities that have the capacity to absorb, recover and prepare for future shocks (economic, environmental, social and institutional). Resilient cities promote sustainable development, well-being and inclusive growth.
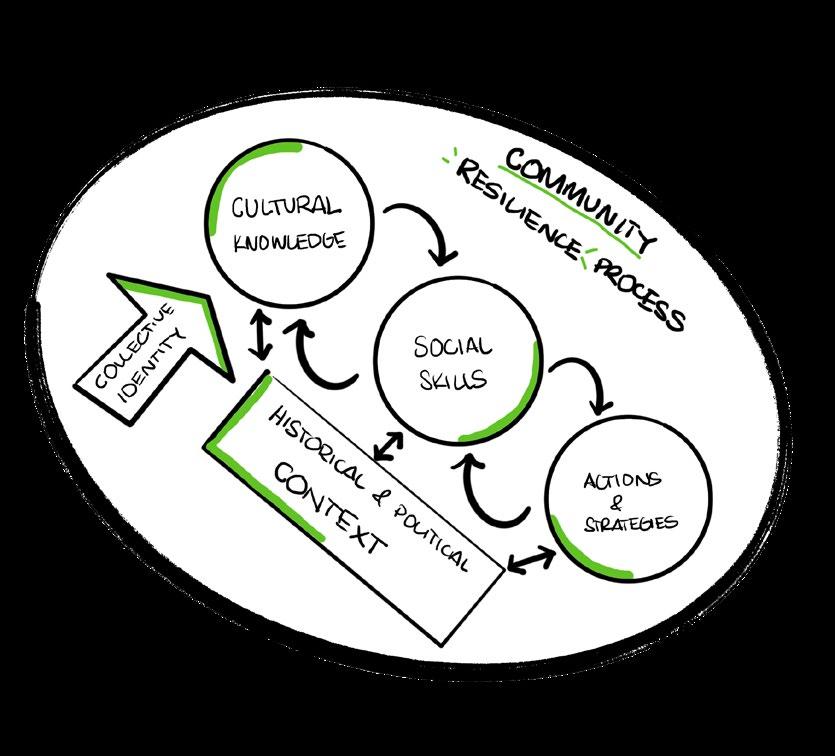
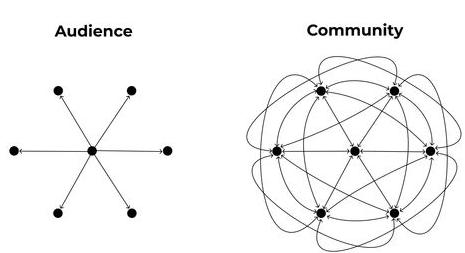
A community transcends mere population density within a specific geographic boundary. It comprises individuals united by shared interpretations, interpersonal and economic ties, traditions, beliefs, aspirations, and diverse organizational structures. In urban settings, communities often adopt institutional frameworks to address the needs and conflicts of their constituents.
Consequently, a multitude of variables originating from various sources and operating at different scales influence the resilience and vulnerabilities of communities. These factors collectively determine their ability to address concurrent challenges and shape their progress within tangible circumstances.
A resilient community exhibits a robust social framework capable of navigating adversity and restructuring itself to preserve functionality, communal spaces, and identity, enabling growth. However, this is not a spontaneous quality; the resilience of a community is built up day by day as the members of the community work to enhance environmental conditions, identify and mitigate challenges, all within a framework of human rights and social equity.
It is not enough for people to learn, to adapt, to unforeseen events beyond their control. Addressing the root causes of crises necessitates systemic changes across environmental, economic, political, and cultural spheres.
Individuals and societies that have high collective self-esteem would recover sooner from adversities.
- Uriarte Arciniega, J.D.

At the heart of community dynamics is the shared acknowledgment and commitment to collective wellbeing. The cognitive framework of any community is forged over time and persists through ongoing interactions.
Unlike individual knowledge, which can be acquired over a
lifetime, community-generated knowledge is rooted in context and imbued with communal perspectives. Recognizing that a community is made up of diverse individuals with diverse knowledge enriches its study. It is in this diversity that the true value of shared knowledge emerges.
To foster community resilience, it’s essential to translate community skills and insights into tangible initiatives. This requires strategic organizational approaches that drive progress. Communities don’t operate in isolation; they interact with both formal and informal authorities, requiring negotiation.
Despite the value of community participation, it remains underutilized. While various methods of participation exist, their effectiveness varies based on each community’s unique context.

Methods must ensure relevance, timeliness, inclusiveness, knowledge sharing, and accessibility. This ensures alignment between available techniques and tools and the practical realities face by communities.


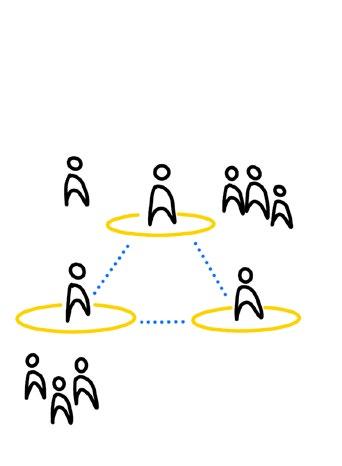
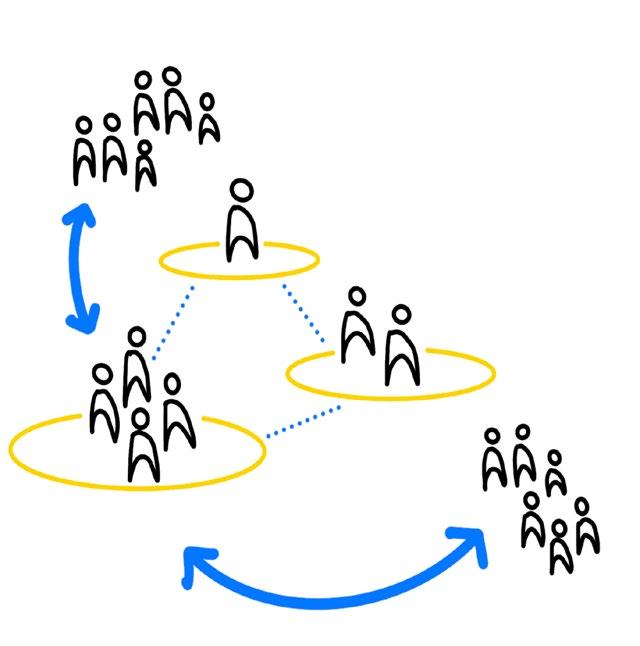
People as object, not a subject.
A process by which people are enabled to become actively and genuinely involved in defining the issues of concern to them and taking action to achieve change.
A resilience framework is a structured approach or methodology designed to help individuals, organizations, or systems adapt and recover effectively from adversity or stressors. It provides a set of principles, strategies, and tools to enhance resilience.
Resilience frameworks can be applied at various levels, including individual, organizational, community, and societal levels, and can be tailored to specific contexts, such as disaster preparedness, mental health promotion, or business continuity planning.
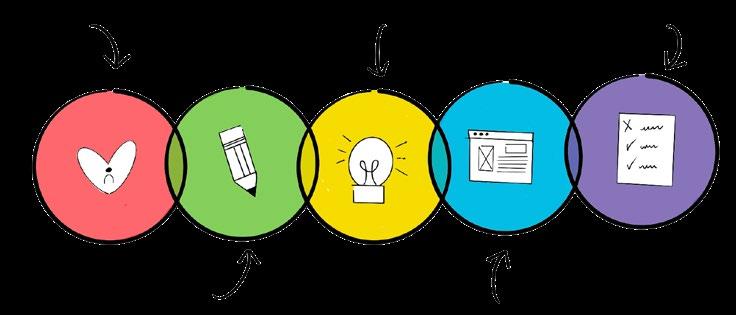
Resilience frameworks and tools share similarities in their objectives, as both aim to enhance resilience in individuals, organizations, or systems. While resilience frameworks offer a broader conceptual framework and guiding principles, resilience tools are often specific instruments or techniques used within the framework to assess, measure, or enhance resilience in a more targeted manner.
Applying a resilience framework to cities involves adapting its principles and strategies to the unique challenges, characteristics, and dynamics of urban environments.
Monterrey, Mexico
Our City A Resilience Journey
Monterrey, the second largest metropolitan area in Mexico and a key economic hub in the northern region, faces both prosperity and challenges. It hosts major Mexican enterprises, industries, and is a hub for innovation. However, the city grapples with water scarcity exacerbated by climate change, along with increasing heat waves.
Recognizing this, the city aims to adopt resilience initiatives for better coordination. Led by its Planning Institute and collaborating with Nuevo Leon authorities, Monterrey is developing a resilience strategy to address its vulnerabilities and enhance its overall resilience.


Indicators and Variables Connection
Indicators Defined by the Conceptual Framework
Variables and indicators are essential for resilient cities frameworks and plans. They enable cities to measure and assess their current level of resilience, monitor progress over time, compare performance with other cities, inform policy development and decisionmaking, and communicate the importance of resilience to various stakeholders. Overall, variables and indicators enhance the effectiveness, accountability, and sustainability of resilience-building efforts in urban environments. Include
Dimensions for the Urban Resilience Plan of Monterrey
planning and promote a more inclusive and fair society.




1
Activating the Tool

Identify and begin researching possible topic opportunities.
3

Set an action plan through a question. Preparation “on site”
Understand community life and formulate a question that will collect data into variables.
?
2

5

4
Gather people to form teams by defining roles and time slots.
7
Quantification and Categorization
Evaluate results through graphical and interactive tools.
Categorize the responses collected.
8 Questioning
6
Sample Size Calculation Working Together

Deliver Findings
Initiating research focused on the community perspective requires careful selection of optimal tools for gathering reliable, timely, and pertinent information. The existing literature review outlines conventional methods of information collection that have proven effective over time. Despite the apparent dichotomy between qualitative and quantitative paradigms in the selection process, in recent years researchers have recognized the benefits of integrating both approaches. This integration aims to produce conclusions that allow for the recognition of narratives alongside affirmative data, thereby effectively shaping hypotheses.
Does this tool meet the needs of my research?
Determining the suitability of this tool for your research involves defining the scope and assessing the feasibility of conducting fieldwork with available team members and resources. It’s important to consider the need to quantify and categorize information, especially if the study involves a large, randomly selected population. In such cases, this tool may be more appropriate.
What is the justification for selecting this tool?
The use of a mix of selected qualitative and quantitative tools allows us to capture a shared perspective, while acknowledging the unique stories of the target population. To illustrate this approach, we present a case study conducted in Monterrey, Mexico, where only 3.33% of collective and civic organizations were included in 100% of the interviews for the city’s resilience plan (see APPENDIX C).
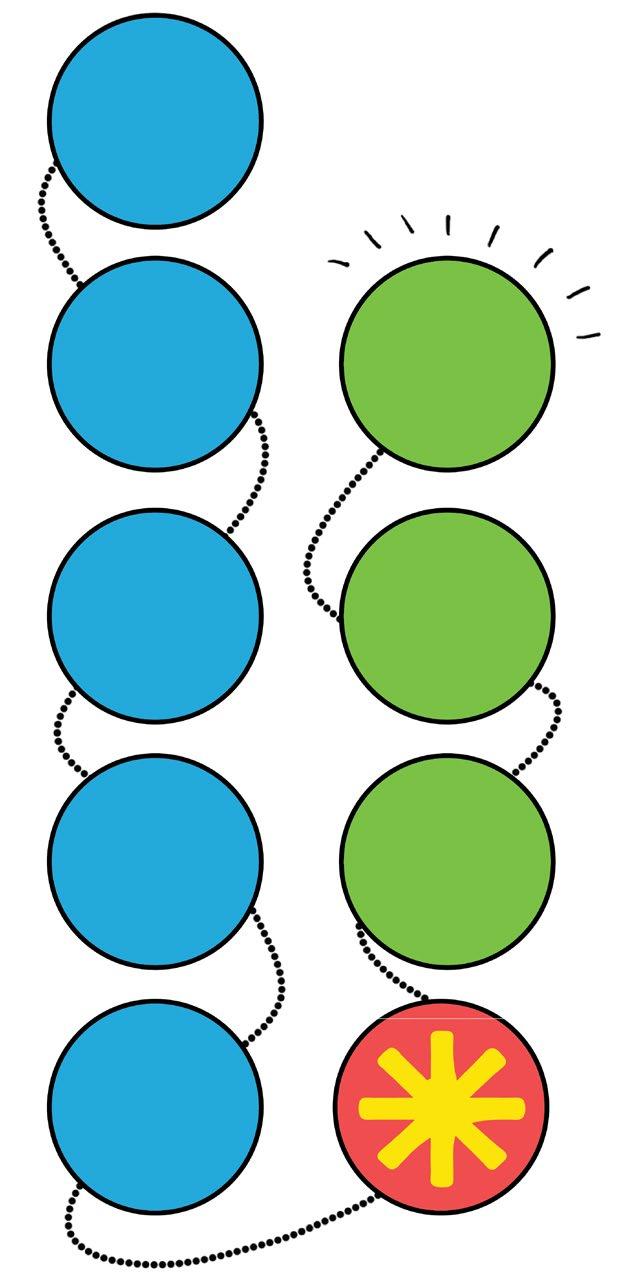
The
- Robert E. ParkWhen discussing resilience, the focus is typically on understanding the resilience of “what to what”. This means understanding the resilience of a particular system or process (such as crop production, food distribution, agriculture, or culinary knowledge) to a particular threat or shock (such as drought, war, or plant disease).
Recognizing the system within which urban life unfolds is arguably the most important step in initiating research. This recognition, based on observations and available information, marks the first attempt to articulate a problem or topic of interest and to formulate the question that will guide subsequent efforts to gather information.
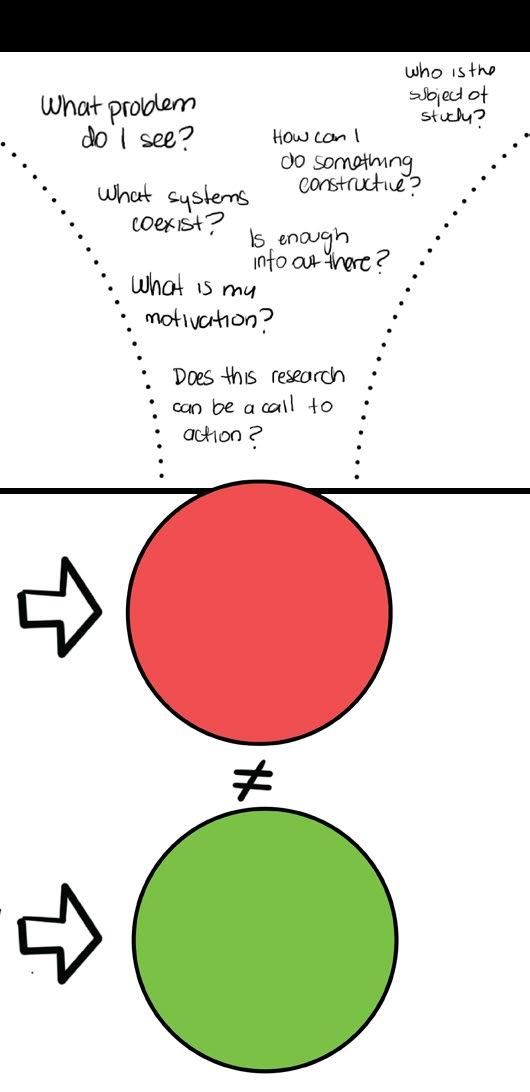

Start with the question, “What key components require attention and enhancement within our city?”.
This question leads to more inquiries: Do the current initiatives adequately address the community’s needs and concerns?
How can we build a more positive and constructive narrative of our city?
Expressing your motivation not only serves as a compass for you and your team during the research journey, but also provides guidance on how to draw meaningful conclusions that are aligned with the desired impact. The primary goal of gathering community perspectives is to disseminate them to decision-makers or other stakeholders interested in further exploration and deliberation.
In the Monterrey case study, it was observed that government authorities had conducted a comprehensive assessment of threats and weaknesses to prepare the city for potential future shocks. However, it became clear that there was a lack of quantifiable and qualitative data on the strengths and characteristics of the city, particularly regarding its social structure.
For example, the motivation behind the Monterrey case study was to “promote a positive collective perception of the city. In addition, it seeks to promote initiatives that strengthen the aspects most valued by the community”.
Some initial exploration using publicly available data or collected individual experiences can help understand the target audience, especially if it’s outside your usual environment. We will deliberately identify optimal communication methods and factors to consider when engaging with individuals. This will help us formulate appropriate questions in the field and identify relevant variables to analyze the information gathered from different perspectives.
Choosing a straightforward and sufficiently openended question may be appropriate to elicit a wider range of responses, with the goal of reducing interviewer bias. Categorization of responses can be addressed at a later stage. However, it is CRITICAL to ensure that the question is precisely worded so that all responses can be classified according to the predetermined criteria. Conducting preliminary tests can help confirm the effectiveness of the question and its applicability to eliciting information.
Make sure the person you are interviewing is in the age range you specified.
Identify variables that align with available public data to ensure that the information obtained is both valuable and compatible with other datasets and research. In the Monterrey case study, the leading variable was age group, followed by the location and timeframe of the sample collection
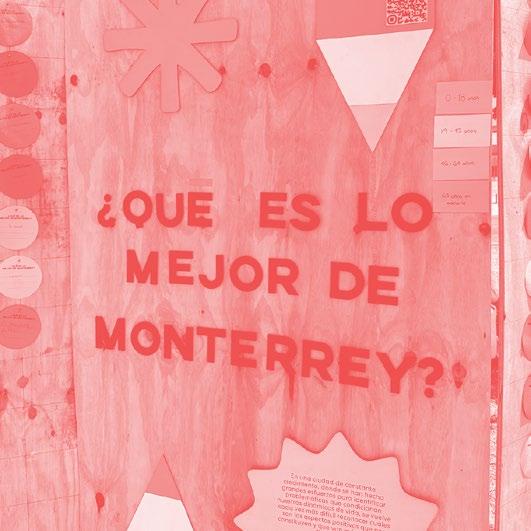
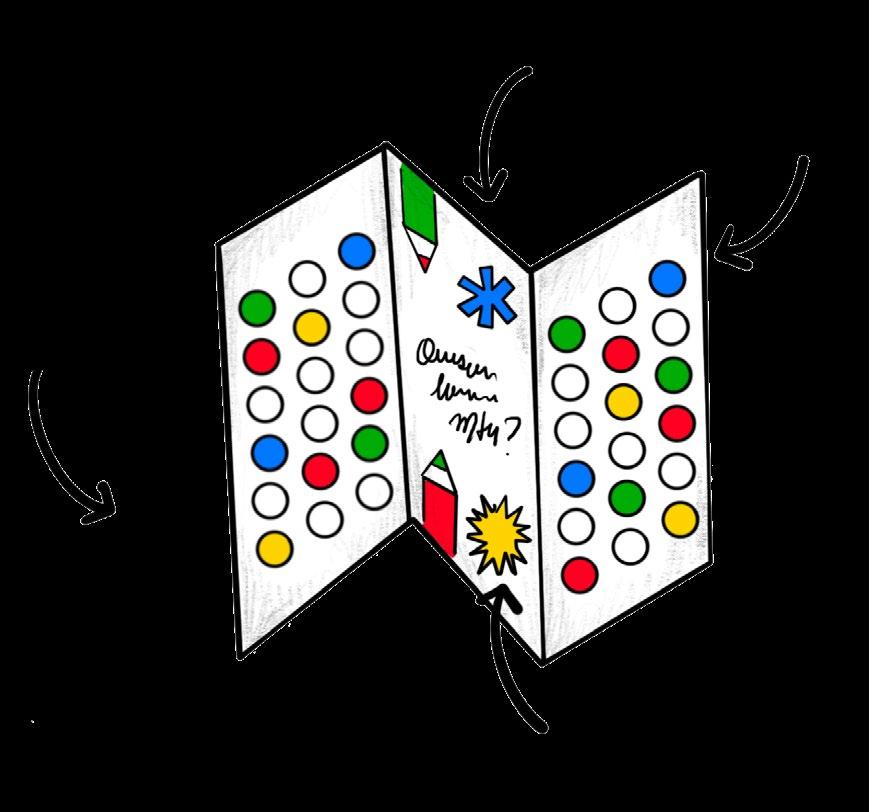
Typically, during on-site interactions, you have a limited amount of time to ask your question. In the Monterrey context, we found that simplifying the question to “WHAT DO YOU LIKE MOST ABOUT MONTERREY?” helped bridge the gap with the community, resulting in more concise responses that were easier to categorize. Main Question for the People
Panels at Human Scale
To ensure the reliability of the gathered information, it’s important to measure the confidence level of the results. You can utilize a sample size formula applicable to infinite populations to calculate the sample size, especially when the sampled individuals are randomly selected from a population exceeding 100,000.
Recognize the importance of sampling location as a variable in the research process. Choosing a well-known location with high traffic and a diverse population can be advantageous. However, selection is not limited to specific characteristics; it depends on the desired outcomes to determine the ideal location.
If sampling occurs on different days and times (or within a specified time frame), be careful to document this information. Using it as an additional variable can enrich data analysis, provide another dimension for examination, and reveal notable variations in responses.
z = Confidence level = 95% (The more precise you want it to be, the larger the sample size will be)
p = success probability unknown (no existing references) = 50% = 0.50
q = failure probability unknown (no existing references) = 50% = 0.50
c = Margin of error = 5%
You can also use an online sample size calculator. For smaller samples, consider conducting a census or using a sample size formula designed for finite populations.

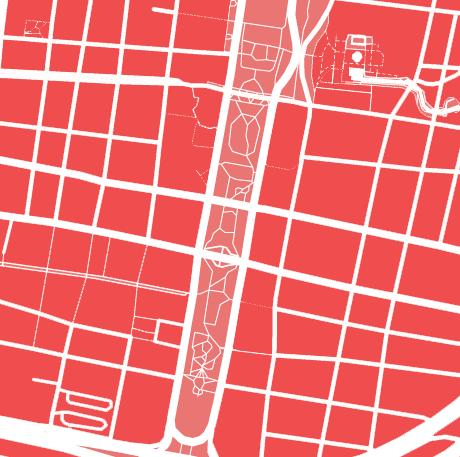
When selecting data collection sites, think strategically about where to sample. In the Monterrey case study, alternative options (such as options A, B, and C) were considered in case the initial site proved inappropriate or there were significant obstacles that could introduce bias.
Community engagement is an invaluable opportunity that should not be missed. Using a combination of information-gathering tools can be done simultaneously in the same location, depending on the equipment and resources available.
Observation allows us to gain insight into the context in which responses are given and provides a descriptive perspective from the researcher’s perspective on the study community and its individuals.
As an essential research method, the process of collecting qualitative information through sampling interviews requires careful planning to facilitate a coherent transition from qualitative to quantitative data.
Before beginning the sampling process, the Monterrey sampling team categorized each age group with a color code:
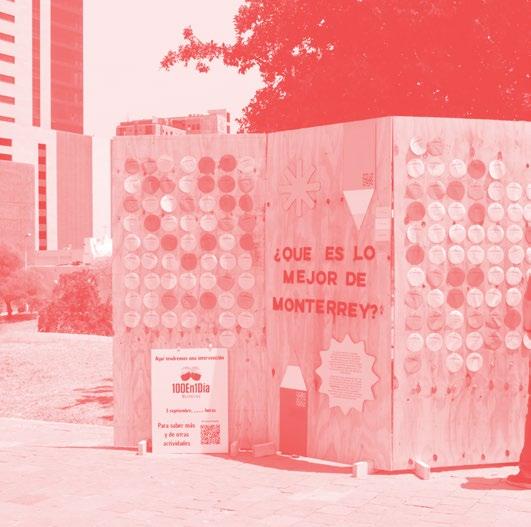
These age groups were defined according to the Mexican National Institute of Geography and Geostatistics (INEGI).
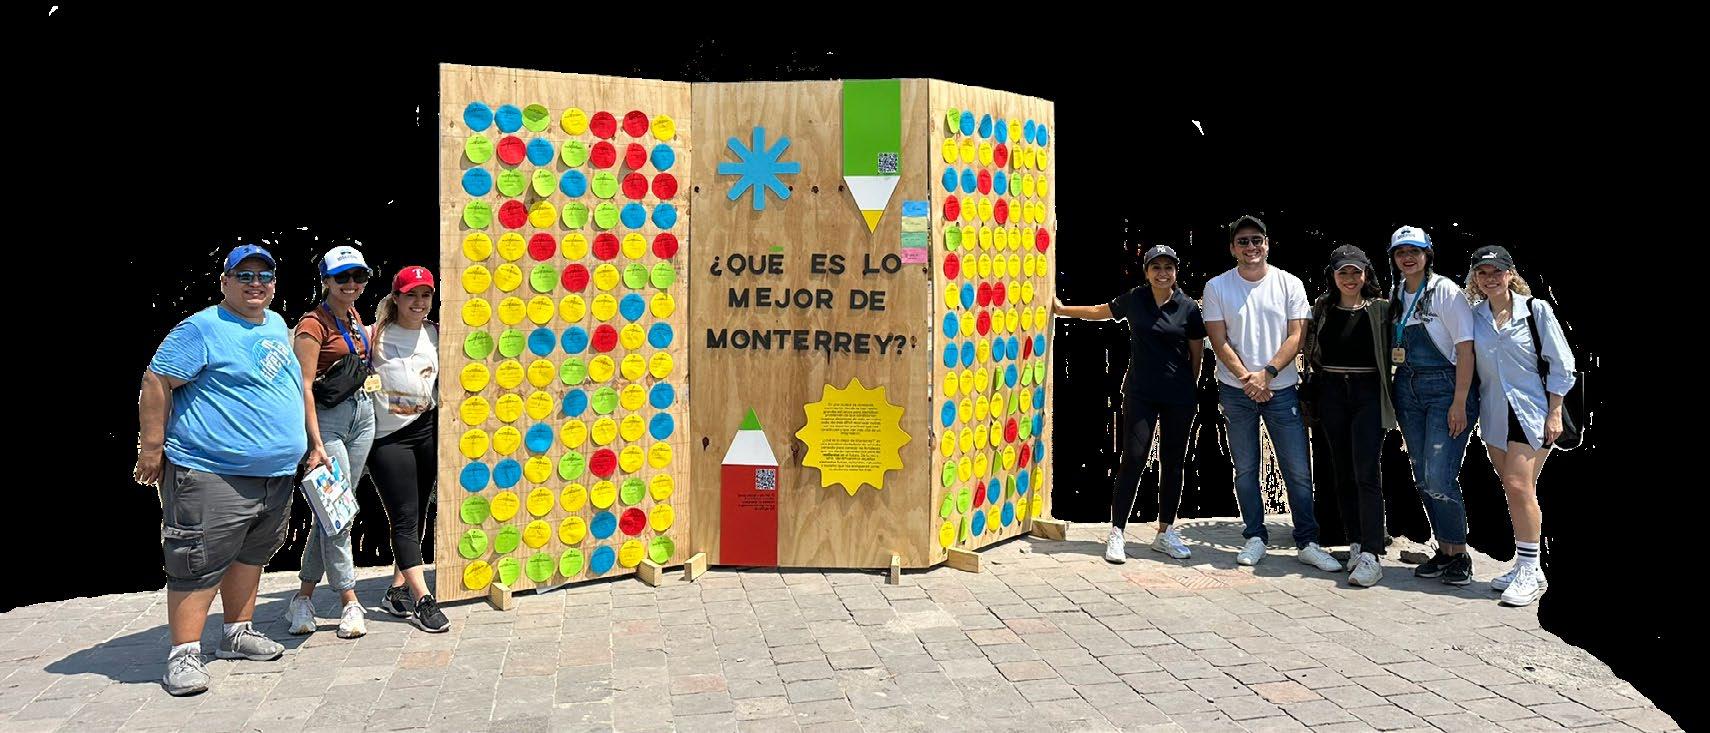
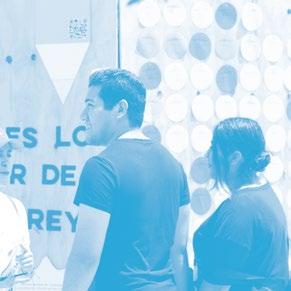
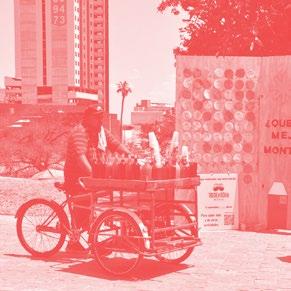
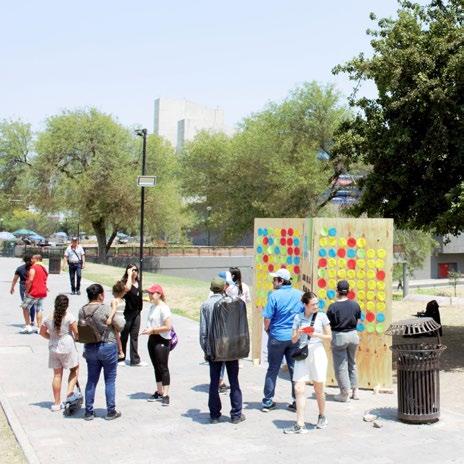
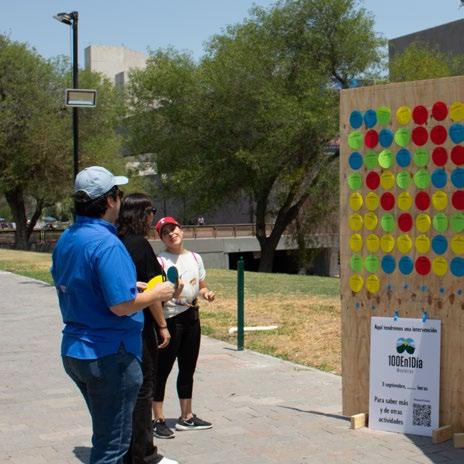
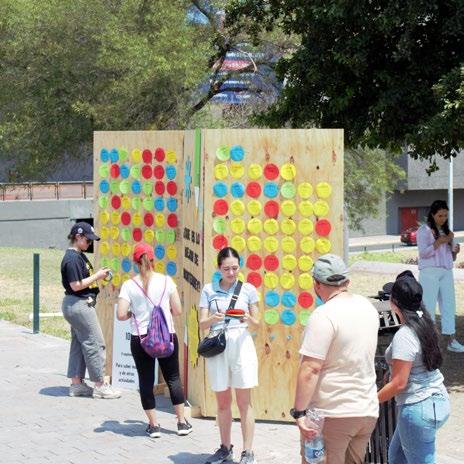
In the Monterrey case, a portable wooden wall was constructed, on which participants could write draw to provide their responses. Each person was allowed to provide only one response. In addition, digital interaction features such as QR codes were incorporated to direct participants to the same survey in a virtual format.
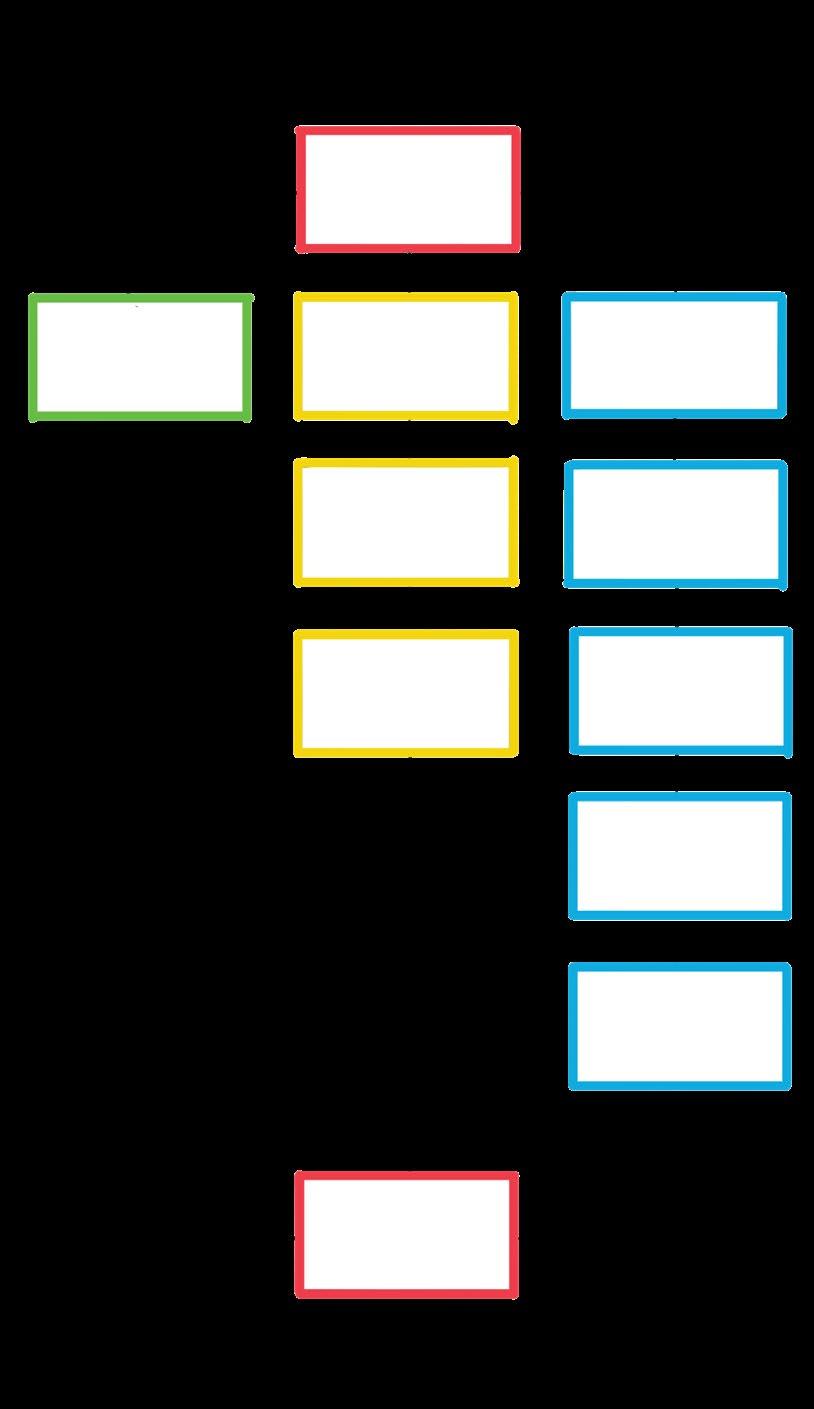
Develop the interview in a personalized and organic manner.
Document the narrative of their own experience as an inhabitant of the site of study.
Obtain a single and direct answer to the site’s question. Classify the answers based on the established criteria of categories and subcategories. Quantify the total number of sampled answers. Graph the total number of sampled answers that have been classified.
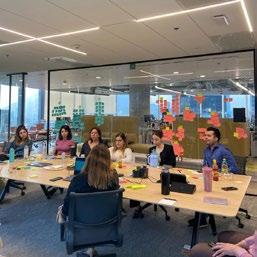
Form teams with members assigned different responsibilities for the sampling process. One member should ensure that materials are prepared for writing and collecting information, while another team will conduct interviews. Another member should observe and gather information, while someone else documents narratives and experiences that go beyond the specific questions asked of participants.
When setting up teams, the number of which depends on available resources, time constraints, and sample size, it’s critical to maintain a structured agenda with defined shifts and responsibilities. This will ensure that activations are conducted in an organized manner, with the overall goal of collecting pertinent and valuable information for the research.
Set a specific goal and establish cutoff points between shifts to assess whether enough responses have been collected to meet the sample requirements. This allows for evaluation and possible adjustments to optimize time and resources, or to verify that operations are proceeding as planned.
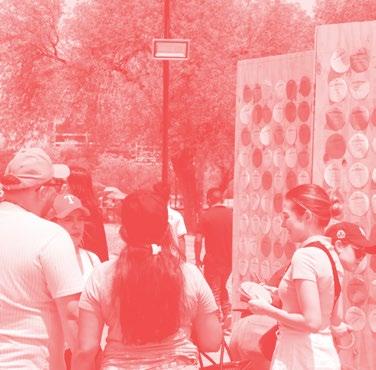
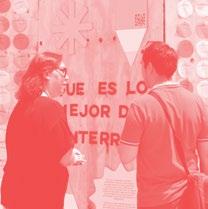
In the Monterrey case study, we assembled a team of 12 people divided into two shifts of 2 hours each, effectively covering 60% of the total sample. In addition, we allowed one hour for setup and one hour for teardown. During both shifts, three organizers were always present to
The first step in quantifying the qualitative data collected is to categorize the responses. To accomplish this, the methodology developed the following categories and subcategories with the goal of fully capturing the community’s perspectives:
Physical Elements
Cultural Elements
• Architecture and Buildings: As the name implies, all structures that are specifically designed, planned, and constructed for a particular purpose, either individually or collectively.
• Mobility and Transportation: Refers to the current systems that facilitate the daily movement of people within the city.
• Museums and Centers: Any building designed to display and promote art and history, as well as facilities that facilitate communication and social interaction.
• Arts and Traditions: The collection of disciplines, knowledge, perspectives, and forms of expression that characterize the different communities within the city.


Natural Elements
Social Elements
• Sustainability and Regeneration: A representation of actions or circumstances that foster a healthy interaction between people and the environment, promoting their harmonious development.
• Parks, Mountains, and Rivers: Natural and semi-natural open spaces with which it is possible to interact.
• Government and City: Responses to the management, administration, and organization of various sectors whose decisions affect the social development of individuals.
• Equity, Diversity, and Inclusion: Ideas relevant to the social context that promote more equitable interaction and organization of local groups at different scales.
Common digital tools such as Excel can be used to classify and measure responses. To accurately visualize the data, ensure that each row documents the sampled response, while the columns correspond to the selected variables.


Make sure the person you are interviewing is in the age range you specified.
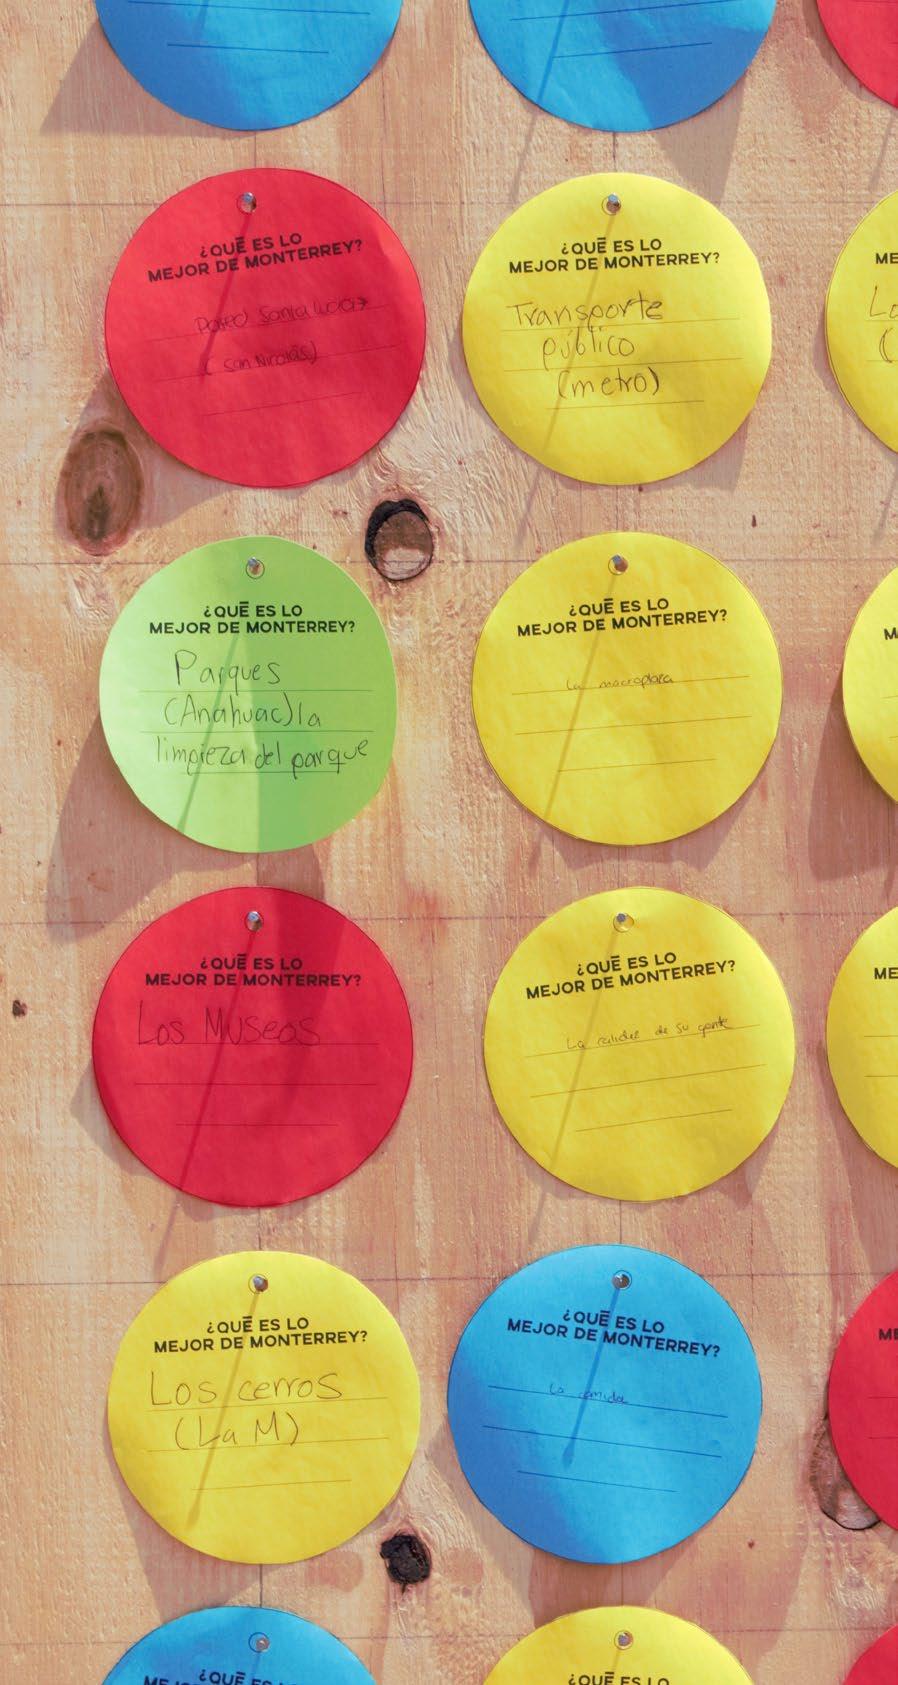
Once the responses have been quantified and assigned to the appropriate categories and subcategories, it’s highly beneficial to evaluate the results through graphical and interactive means. This approach can inspire new interpretations of the information gathered throughout the research process, while also allowing for a clear evaluation of various variables.
The goal of visualization is communication. Since the ultimate goal of this methodology is to share and disseminate information with different audiences, the data should be presented in a way that is understandable to all. Adopting a simple and consistent graphical language can greatly facilitate this function. There are simple and handy tools that can facilitate the presentation, especially digitally, such as Excel or Power BI.
Beyond simply quantifying the popularity or frequency of certain responses, it is the correlation of variables that produce quantifiable results, combined with the qualitative information gathered (narratives and observations), that allows us to infer and understand what the community is trying to communicate. By categorizing responses according to variables, we gain insight into people’s perceptions for each response. In the case of Monterrey, variations in responses are due to factors such as age group, day, category, and subcategory. This allows us to assess multiple layers of overlap to formulate conclusions, as well as identify potential influencing factors behind the responses.

After the information has been graphically presented and interpreted based on all the material collected, the next step is to formulate and develop conclusions. For this important undertaking, it is wise to revisit the original question. Is the research question still relevant? Have the results changed my hypotheses in any way? What role did the variables play in the overall analysis? What actions should be taken based on this information? What insights does it provide? What course of action does it suggest?
The consistent use of the same colors and labels for the variables assessed in the field allows us to maintain a consistent graphic language.


Ideally, indicators would rely on quantitative metrics to streamline data aggregation, ensure objectivity, and improve comparability over time. Quantitative metrics not only enable the setting of performance improvement targets, but also serve as a foundation for measurement consistency. However, there are instances where certain indicators pose challenges for quantitative measurement and require the inclusion of qualitative approaches for full integration and discussion of conclusions, particularly in the area of social studies.
Subjectivity is inherent in the separation of information. Categorizing data involves interpretation influenced by personal perspectives, cultural norms, and institutional biases. To promote transparency, fairness, and accuracy in decision-making processes, it is essential to recognize and mitigate subjectivity in this context. However, established criteria that define categories can serve as an additional measure to mitigate subjectivity, as addressed in this work. They provide a structured framework for separating and interpreting information.


Our work is an ongoing process that can evolve and improve as we deepen our understanding of how to integrate collective voices into decisionmaking processes. We recognize the complexity and dynamism of societal interactions and acknowledge that there is always room for refinement and improvement in our approach. Through continuous learning and engagement, we seek to refine our methodology and draw insights from diverse perspectives and experiences to promote more inclusive and effective decisionmaking frameworks. This journey of growth and discovery enriches our understanding of the challenges and opportunities inherent in integrating diverse voices and underscores our commitment to advancing equity, diversity, and inclusion in decision-making contexts.

The Intervention
In an ever-expanding urban environment, where great efforts have been made to identify the problems that shape urban development and our well-being, it becomes increasingly difficult to recognize the positive aspects that make us who we are and go beyond and institutional diagnosis.
It’s an initiative driven by “RESILIENSEE MX” Perkins and Will citizens group designated to make us aware of the strengths that will give us tools to become more resilient in the times ahead. Through the authentic expressions and handwriting of residents, we are identifying the physical, cultural, natural, and social aspects that enhance our daily experience.
We created a removable physical wall of biodegradable materials. Here, we provided participants with writing and drawing tools with the goal of collecting as many responses as possible within a 12hour timeframe. These responses will be displayed throughout the day as part of the initiative.


The Site 2
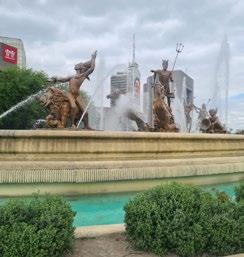
“La Macroplaza” or “Gran Plaza” is a plaza in the city of Monterrey in Nuevo Leon, Mexico. It is named after the central part of Monterrey, which occupies 40 hectares and serves as the focal point of the city. It is considered the largest plaza in Mexico and the fifth largest in the world. It features a mix of commercial outlets, recreational facilities, pedestrian areas and green spaces.
We chose “La Macroplaza” because of its privileged location in the city center and the flow of people who visit it for recreational Sunday walks or as tourists.
To obtain the number of responses required by the formula, 2 samples/interventions were needed, carried out on 2 different days. The climatological variants of two days are analyzed and presented:
Intervention 01:
Date: September 03, 2023
Time frame: 9:00am - 16:00pm
Number of participants: 12
Temperature: Max. 40°C, Min 24°C
Humidity: 0%
Rainfall Forecast: 0%
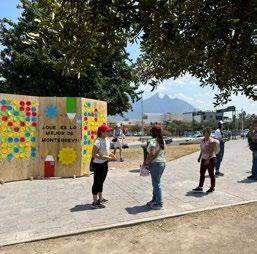
Intervention 02:
Date: September 03, 2023
Time frame: 9:00am - 16:00pm
Number of participants: 12
Temperature: Max. 40°C, Min 24°C
Humidity: 0%
Rainfall Forecast: 0%
One immediate observation is that on the hot day, dubbed “Intervention 01,” the Macroplaza, with its limited shaded areas, attracted visitors with specific purposes rather than those seeking a leisurely stroll. The number of visitors varied from day to day. Conversely, on the second day, with more pleasant temperatures, the site saw an increase in the number of people who wanted to enjoy the public space. We were able to collect the required number of responses for sampling in a shorter period of time.
Responses from the first sample were predominantly from the yellow and green age groups (19-64), while responses from the second sample were predominantly from children and individuals over the age of 65. It was noticeable that more families visited the room together. During the second sampling, we observed an increased interest in participating and learning about the subject matter. Participants asked questions such as “What is resilience?”, “What is the purpose of our answers?”, and “Will our opinions be taken into account?
In summary, the older age group of users has a more positive perspective on their city compared to the younger age group (19-64 years). The younger demographic tends to highlight the negative aspects of the city and focus on what is lacking. As facilitators, we adjusted our approach to encourage more positive responses. Some participants responded immediately, while others needed more time. However, some may choose not to respond at all. Interestingly, when users do not have an answer, they often ignore the question altogether.
In both interventions, eliciting responses from participants was initially a challenge. However, as the sampling progressed and more responses were collected and displayed, people became more receptive and engaged with the space.
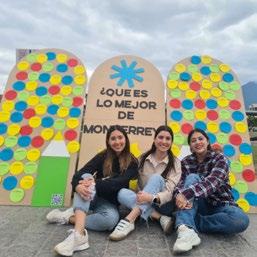
People’s responses may vary depending on their stage of life and social circumstances. Overall, it appears that nature is the most important value for most people. However, it’s important to recognize that different age groups may have different perspectives and priorities. The dynamic chart is essential for uncovering relevant data and refining interpretations. For example, responses tend to fluctuate between interventions, even when the location, day of the week, hours, and methodology remain consistent, although the primary trend remains stable.
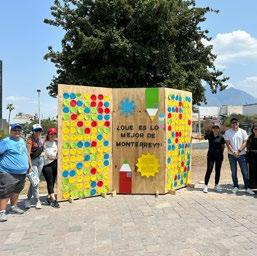
The greatest variation is observed between the 0-18 and 65+ age groups. In the younger demographic, natural and physical elements take precedence, while social interests become more prominent with age. Similarly, the 65+ age group showed the greatest willingness to contribute by documenting their personal narratives and experiences, with conversations primarily revolving around political and governmental issues.

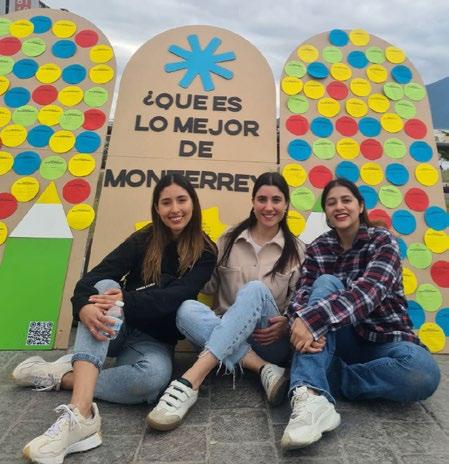
“In times of crisis, people come together to help each other. We will help each other because we are human and this is our land.”

“I see that you take older people and their experience into account. We may not have the same strength, but young people do.”
“People are the best. They see you down and give you a hand. We are hard workers. The city never sleeps. We are people who do not know how to give up.”
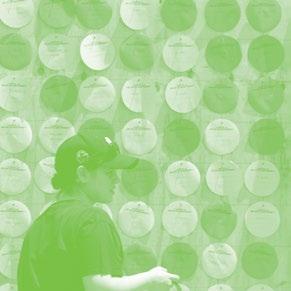
“If you plan to share this work with the community, they should know that we want to be consulted on areas that need improvement.”

The results of the Monterrey case study are presented in an online dashboard. The Power Bi tool is used to graphically display the information. By exploring the dashboard, viewers will find the results for both interventions in a dynamic graph. It is an interactive tool where they can choose what information they want to analyze, whether it be by age group, category, or subcategory.

Deliver information in an interactive way by using technology tools to engage viewers.
Similarities:
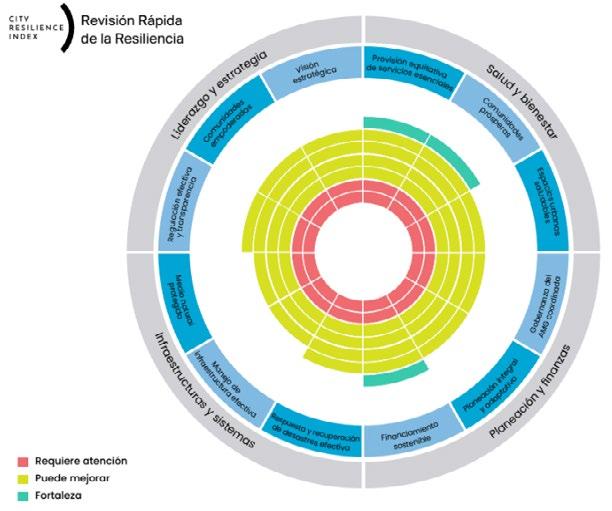
The most effective indicators identified in municipal policy were sustainable financing, categorized under planning and finance, along with indicators for equitable access to environmental services and thriving communities, falling under health and wellbeing. On the other hand, the least effective indicators in municipal public policy were found in the categories of protected natural environment and efficient infrastructure management, both showing poor performance perception
• Both plans foresee promising job opportunities.
Contrast:
• In contrast to our findings, the natural elements exhibit the most positive “collective voice”, which contrasts with the Monterrey plan’s identified weakest performance.
• While the intervention indicates a 19% response rate regarding cultural elements, the Plan does not reference any cultural activities or sites.
• A significant category in the Resilience City Index is leadership and governance, whereas citizen perception of governance participation in our responses is minimum.
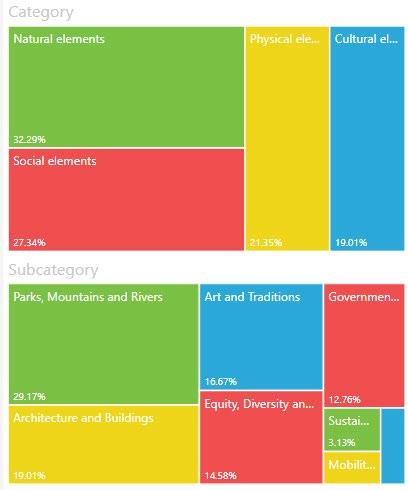
The most important indicators from people’s answers are those related to natural elements. Most of the community see parks and mountains from the city, a great source of opportunity and development. Last but not least, cultural elements such as arts and traditions are still important for people to have a great experience while living in the city. Each result is essential to pinpoint the opportunities and preferences that people see in their city.
As a local group :
• Publish the brochure with the framework content.
• Bring the PowerBi information into a more accessible tool by creating an app.
• Conduct workshops with the community, studios, and community leaders to share the guidelines.
• Continue to develop city activations to gather more information from different areas of the city.
As a community :
• Actively participate in city activities.
• Think about the positive aspects that are valuable for the city.
• Work with all types of organizations.
As a global group :
• Start implementing the framework in projects.
• Share the guidelines with other studios and partners.
• Offer an add-on service that follows the Collective Voice methodology.
As leaders :
• Reflect and analyze information from community activations.
• Incorporate people’s voices into future solutions and plans.

• Take action to improve people’s experience in the city.
• Perkins&Will: Resilience Workbook
Combines a comprehensive list of Resilient Design Criteria with the Latest in proven integrative process for developing next generation communities, neighborhoods, buildings and infrastructure.
• Perkins&Will: Procede
The “Public Repository to Engage Community and Enhance Design Equity”, or PRECE, centralized demographic, environmental, and health data from across the U.S. into a geospatial database, making it easier for designers to acquire insights that will empower them to create a healthier built environment.
• Resilient Cities Network: City Resilience Framework
Conceptual Framework, offering a common reference point for understanding what we mean when we talk about cities resilience. It offers an evidence-based, holistic articulation of city resilience structure around four categories: Health and wellbeing of individuals (people), Urban systems and society (organization), Economy and society (organization), & Leadership and strategy (knowledge).
• IFC: Building Resilience Index
Building Resilience Index provides the building sector a web-based hazard mapping and resilience assessment framework. All sector stakeholders -construction developers, banks, insurers, governments, and others- can use Building Resilience Index to assess, improve, and disclose the resilience of their projects or portfolios.
The Monterrey Urban Resilience Plan led by the Municipality of Monterrey through the Municipal Institute of Urban Planning and Coexistence of Monterrey (IMPLANc) in collaboration with the Resilient Cities Network (R-Cities) is a multi-stakeholder process that aims to define axes, objectives and implementable actions to build a more resilient Monterrey.
The plan is currently in Phase 1: Diagnosis. The joint effort of Phase 1 resulted in the preliminary description of four dimensions. These thematic areas allow to outline the strategic direction towards which Monterrey should develop. The four identifies dimensions are:
1. Social: which addresses inequality of opportunities, migration, poverty and insecurity, among others.
2. Governance: focused on the challenges of metropolitan governance.
3. Environmental: covering natural resource management and climate change adaptation and risk management.
4. Territorial: which includes land management and urban planning with the themes of urban density and affordable housing as well as sustainable mobility.
These themes will be validated and addressed in depth during Phase 2 of the Monterrey Urban Resilience Plan.
As a group, we identified a notable area for improvement: the low level of participation among collectives and citizens. We perceive this as a promising opportunity that we thoroughly explored during our investigation.
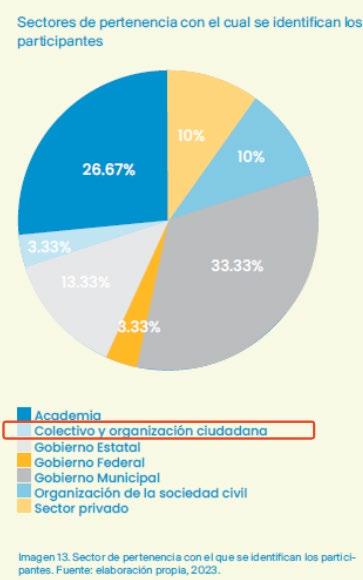

Only 3.33% of the interview were part of the collective and citizens.
Books
Abbott, J. (2013). Sharing the City: Community Participation in Urban Management. Routledge.
Buheji, M. (2020b). Visualising resilient communities.
Community engagement: a health promotion guide for universal health coverage in the hands of the people. (2020). World Health Organization.
Cook, T. D. (2000). Métodos cualitativos y cuantitativos en investigación evaluativa. Ediciones Morata.
Park, R. E. (1952). Human communities: The City and Human Ecology.
Skidmore, P., Bound, K., & Lownsbrough, H. (2006). Community participation: Who Benefits?
Who community engagement framework for quality, people-centred and resilient health services. (2022). World Health Organization.
Articles
Ansell, C., & Gash, A. (2007). Collaborative Governance in Theory and Practice. Journal Of Public Administration Research And Theory, 18(4), 543-571. https://doi.org/10.1093/jopart/mum032
Attree, P., French, B., Milton, B., Povall, S., Whitehead, M., & Popay, J. (2010). The experience of community engagement for individuals: a rapid review of evidence. Health & Social Care In The Community (Print), 19(3), 250-260. https://doi.org/10.1111/j.1365-2524.2010.00976.x
Briceño-León, R. (1998). El contexto político de la participación comunitaria en América Latina. Cadernos de Saúde Pública (Impreso), 14(2), 141-S147. https://doi.org/10.1590/s0102-311x1998000600013
Bronfman, M. (1994). Participación Comunitaria: ¿Necesidad, excusa o estrategia?: o de qué Hablamos Cuando Hablamos de Participación Comunitaria. Cad. Saúde Pública, 10(1), 111-122. https://doi.org/10.1590/ S0102-311X1994000100012
Gutiérrez, E. M. M. (2013). ROBERT E. PARK: Sociología, comunidad y sociedad (Presentación: Emilio M. Martínez Gutierrez). EMPIRIA: Revista de Metodología de Ciencias Sociales, 0(25), 173. https://doi. org/10.5944/empiria.25.2013.3802
Haldane, V., Chuah, F. L. H., Srivastava, A., Singh, S., Koh, G. C., Seng, C. K., & Legido-Quigley, H. (2019). Community participation in health services development, implementation, and evaluation: A systematic review of empowerment, health, community, and process outcomes. PloS One, 14(5), e0216112. https://doi. org/10.1371/journal.pone.0216112
Heritage, Z., Dooris, M. (2009). Community participation and empowerment in Healthy Cities. Health Promotion International, 24(1), 45-i55. https://doi.org/10.1093/heapro/dap054
Longstaff, P. H., Armstrong, N. J., Perrin, K., Parker, W. M., & Hidek, M. A. (2010b). Building Resilient Communities: A Preliminary Framework for Assessment. Homeland Security Affairs, 6(3). http://insct.syr.edu/ wp-content/uploads/2014/02/Building_Resilient_Communities_Framework.pdf
López-Bracamonte, F. M., & Aguirre, F. L. (2017). Componentes del proceso de resiliencia comunitaria: conocimientos culturales, capacidades sociales y estrategias organizativas. Psiencia: Revista Latinoamericana de Ciencia Psicológica, 9(3), 2. https://doi.org/10.5872/psiencia.v9i3.236
López-Sánchez, M., Alberich, T., Aviñó, D., García, F. J. F., Ruiz-Azarola, A., & Villasante, T. R. (2018). Herramientas y métodos participativos para la acción comunitaria. Informe SESPAS 2018. Gaceta Sanitaria (Barcelona. Ed. Impresa), 32, 32-40. https://doi.org/10.1016/j.gaceta.2018.06.008
Mayo, M., Shukra, K., Gidley, B., Blake, G., Foot, J., Yarnit, M., & Diamond, J. (2008). Community engagement and community cohesion. https://www.jrf.org.uk/sites/default/files/jrf/migrated/files/2227-governancecommunity-engagement.pdf
Montes-Iturrizaga, I. (2021). La tensión entre los métodos cuantitativos y cualitativos en educación: el papel de las revistas científicas. Revista Educación y Sociedad, 2(4), 1-3. https://doi. org/10.53940/reys.v2i4.69
Pita-Fernández, S., Pértegas-Díaz, S. (2002). Investigación cuantitativa y cualitativa. Coruña: Unidad de Epidemiología Clínica y Bioestadística. Complexo Hospitalario-Universitario Juan Canalejo. 9(2) 76-78. ISSN-e: 1134-3583
Salazar, F., & Anselmo, F. (2019). Fundamentos epistémicos de la investigación cualitativa y cuantitativa: consensos y disensos. Docencia Universitaria, 101-122. https://doi.org/10.19083/ridu.2019.644
Sánchez, E. (1999). Todos para todos: La continuidad de la participación comunitaria. PSYKHE 8(1), 135-144. ISSN: 0717-0297
Stokols, D., Lejano, R. P., & Hipp, J. R. (2013). Enhancing the Resilience of Human Environment Systems: a Social Ecological Perspective. Ecology And Society, 18(1). https://doi.org/10.5751/es-05301-180107
Uriarte Arciniega, J. D. (2013). La perspectiva comunitaria de la resiliencia. Psicología Política, 47, 7-18. https://dialnet.unirioja.es/servlet/articulo?codigo=4728958
Villarreal Martínez, M. T. (2009). Participación ciudadana y políticas públicas. Eduardo Guerra, Décimo Certamen de Ensayo Político, 31-48.
Wiesenfeld, E. (2015). Las intermitencias de la participación comunitaria: Ambigüedades y retos para su investigación y práctica. Psicología, Conocimiento y Sociedad, 5(2). ISSN: 1688-7026
Zakus, J. D. L., & Lysack, C. (1998). Revisiting community participation. Health Policy And Planning, 13(1), 1-12. https://doi.org/10.1093/heapol/13.1.1
Website
Rodríguez, R. J. (2020, 5 mayo). Cómo analizar cuantitativamente datos cualitativos. Gestiopolis. https:// www.gestiopolis.com/como-analizar-cuantitativamente-datos-cualitativos/

Thank you!
The Monterrey Studio Marta Ortega Valeria Salazar Yaressi Treviño