“Instead of being ‘data-driven,’ companies should be ‘data-informed,’ using it to challenge preconceptions.”
LINDA HILL, PROFESSOR, HARVARD BUSINESS SCHOOL
These needs, and a host of others, are driving organizations to leverage new tools and platforms to better understand their buildings, their campus, and their real estate portfolio.
Our team of specialists—including strategists, planners, user experience experts, data scientists, and analysts—can help structure and organize your data so that you can visualize it and easily sort through it for insights.
We start with what you have, then connect it with external data sources to give you an accurate picture: what is inside your buildings, how they are being used, how they are perceived by occupants, how are they performing, and possible scenarios to accommodate future needs.
Sometimes we build these tools as part of a design project or master plan and other times clients ask us to do this work as a stand-alone assignment. Regardless, our goal is to give you tools that are intuitive, informative, and help you communicate with stakeholders.
― Digital Advisory Services
Our tools and process
Our tools
― Occupancy & Scenario Planning
Creating blocking, stacking, space use diagrams to explain the mix of factors that drive demand and space use.
― Benchmarking & Modeling
Leveraging our sector-specific benchmark data, your own historic data, and machine learning/predictive modeling to forecast and plan.
― Integrating People & Place Data
Uncovering insights from the intersection of occupant experience data (POEs, surveys) and building performance data.
― Capturing Insights & Weighing Priorities
Helping decision-makers visualize their priorities (growth, flexibility, cost, sustainability) and to weigh major decisions and investments.
― Tracking Sustainability
Measuring and cataloging social and environmental impacts for internal planning and public dissemination.
― Jumpstarting a Database
Creating a framework for your space data to capture the right inputs and display the right outputs.
Our process
― Goal Setting
What are you trying to measure? How do these metrics tie to organizational KPIs? What is most important to your leadership or stakeholders?
― Data Assessment
What source data is available now? How accurate is it? How accurate do we need it to be? Is field verification required?
― Data Set Correlation
Are buildings, rooms, occupancy consistently labelled? Does your organization have standards for capturing or reporting space data?
― Platform Design
Need a dashboard? Would you connect organizational data to GIS? Do you prefer a server or can it be securely located in the cloud?
― Testing & Roll-out
What are the different user groups and what level of access do they need?
― Data Maintenance
Do you need help periodically updating your space data to accommodate new data sources or changes over time?
How our models work.
We co-create custom tools with our clients based on your specific needs, building on previous examples and adding new features
Our models can be a stand-alone consulting service or part of a larger design project, ranging from a single floor to a building portfolio
(e.g. Excel) or
and can be built to
with your existing
Source data
We take your space and operational data and tie it to publicly available data
Variables/toggles
We build a menu that allows you to model “what if” scenarios such as growth, headcount, space types, planning ratios, portfolio changes, etc.
Dynamic reporting
We customize graphics, tables, dashboards, and maps to help you visualize space requirements, shortfall/surplus, costs, carbon emissions, or other KPIs important to you
― Digital Advisory Services
Selected projects
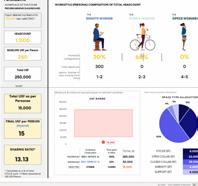
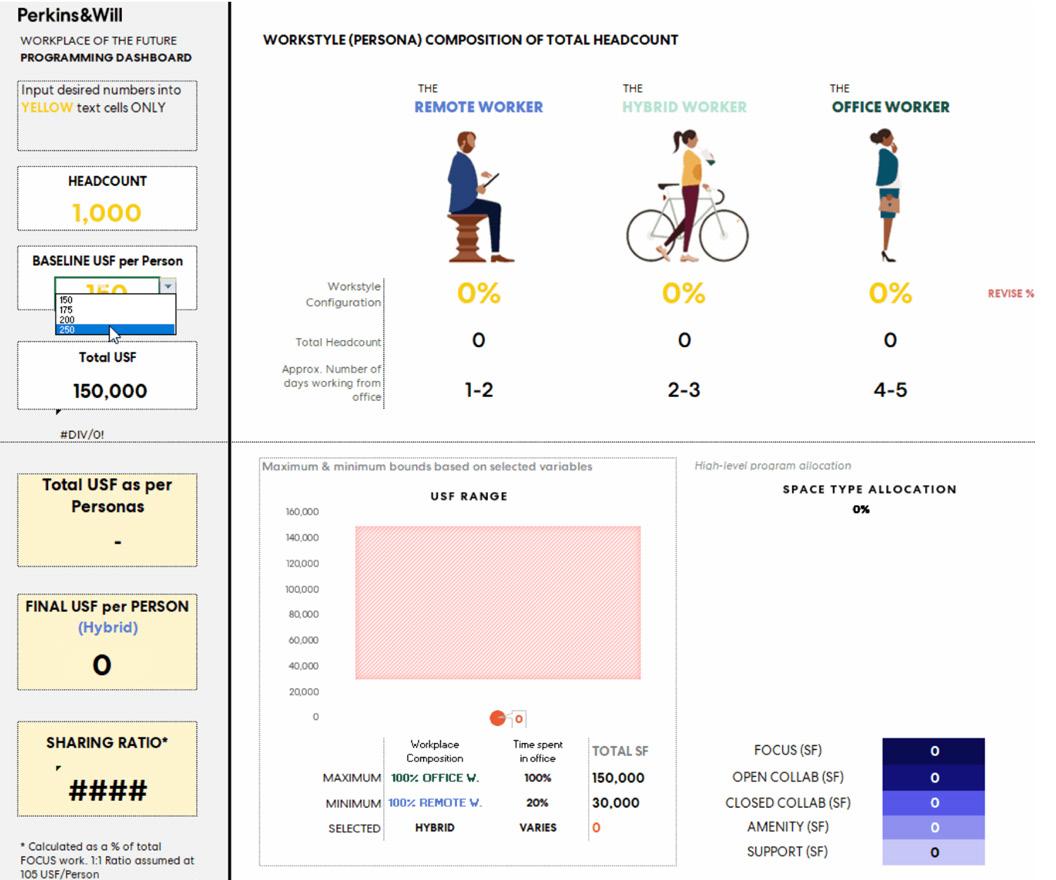
Space Budgeting Dashboard
Programming Tool
TOOL FEATURES
nj Estimate program requirements based on headcounts of different workstyle “personas” with detail breakdowns for focus, collaboration, amenity, and support space.
nj Calculate the total square footage requirements based on headcounts and work styles.
― WHAT IT IS Calculates the total square footage requirement based on headcounts and work styles.
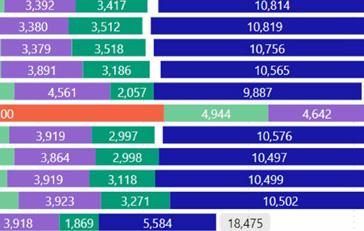
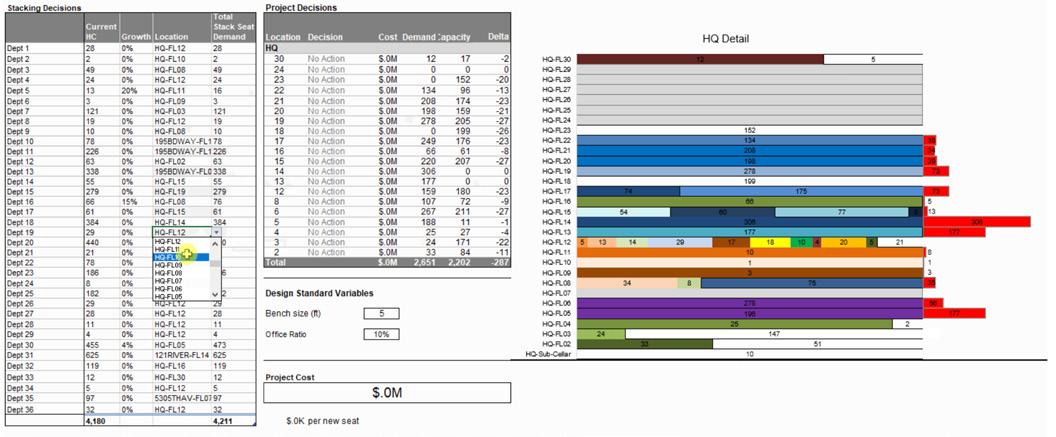
Restack Dashboard
Adjacency Planning Tool
TOOL FEATURES
nj Select “Stacking” like Current HC, Growth, Location, and Total Stack Seat Demand.
nj Select “Project” for Location, Decision, Cost, Demand, Capacity, and Delta.
nj Select department locations, select scope of work for each floor, view resulting cost and space occupancy metrics.
Quickly tests stacking scenarios and assesses cost implications.
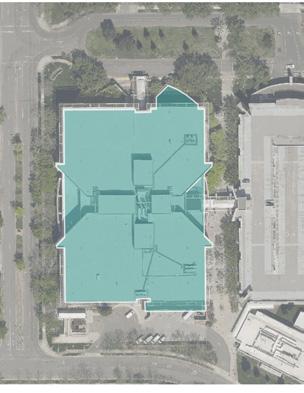
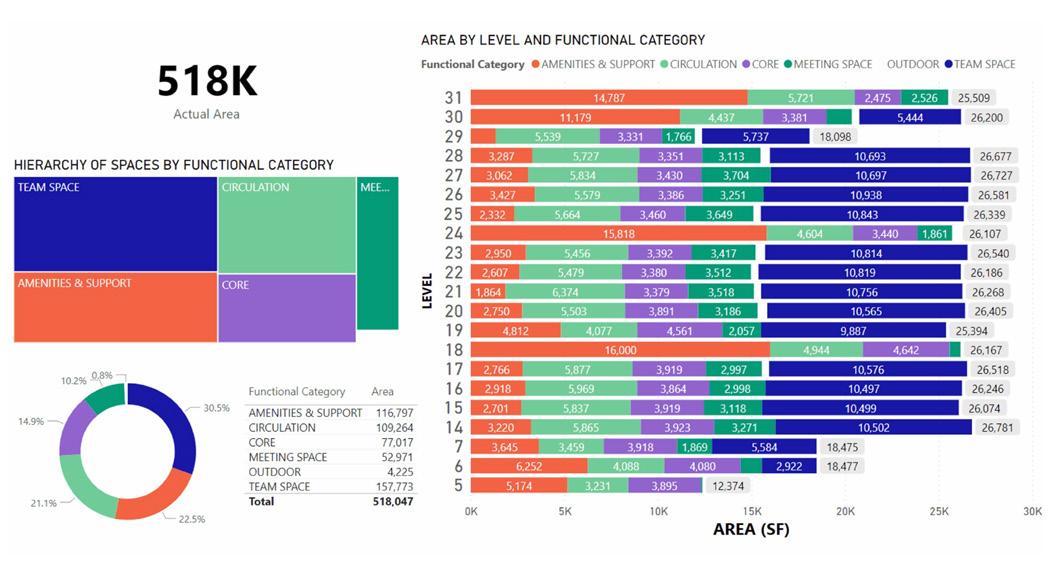
Space Use Dashboard
Building Occupancy Tool
TOOL FEATURES
nj Data pulled from Revit using AreaSync, a custom Perkins&Will tool.
nj Select “Project” for Location, Decision, Cost, Demand, Capacity, and Delta.
nj Select space by floor, department, or space type, update space changes quickly.
― WHAT IT IS
Captures changes in building occupancy over time. Pulls data from REVIT file on periodic basis to capture any changes in space assignment or use.
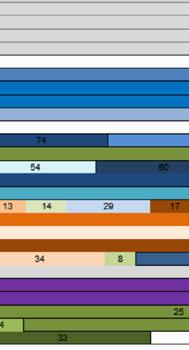
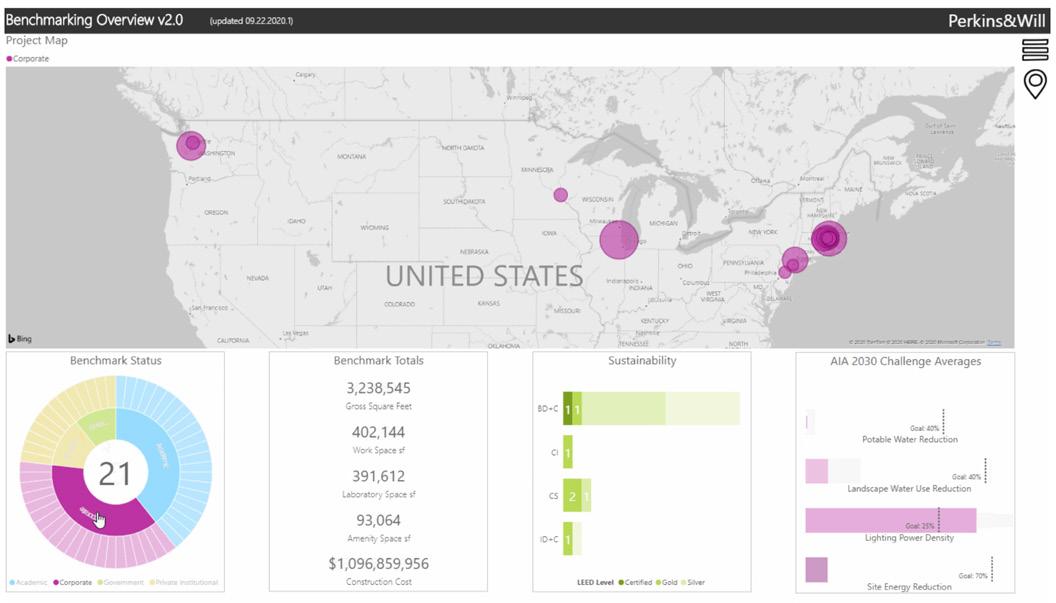
Benchmarking Dashboard
Cost Modeling Tool
TOOL FEATURES
nj Select “Stacking” for Current HC, Growth, Location, and Total Stack Seat Demand.
nj Select “Project” for Location, Decision, Cost, Demand, Capacity, and Delta.
nj Select department locations, select scope of work for each floor, view resulting cost and space occupancy metrics.
― WHAT IT IS
Compares space and cost metrics across projects and peers to understand best practices.
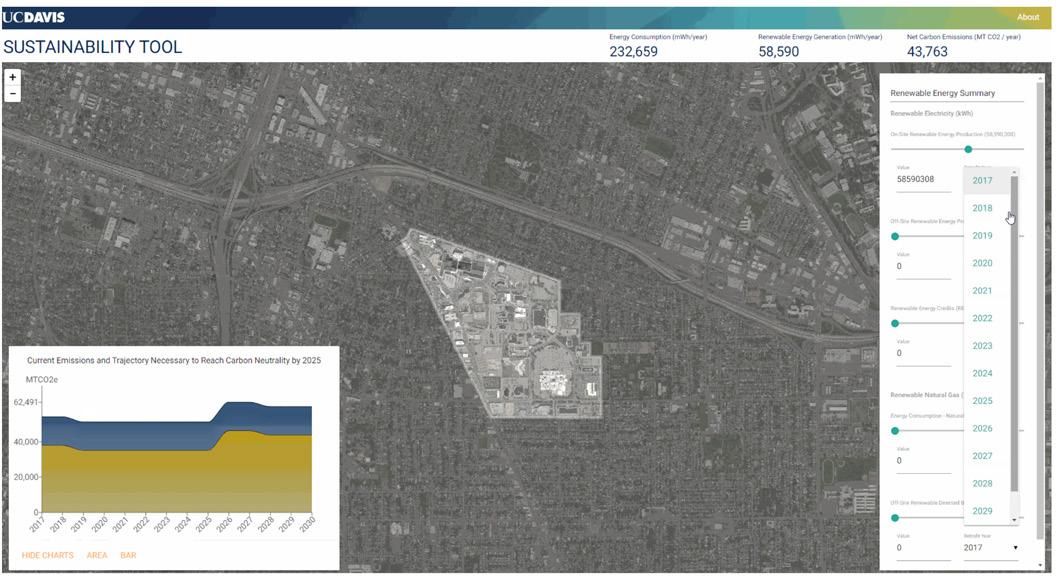
Carbon Emissions Dashboard
Sustainability Tool
TOOL FEATURES
nj Key functions include reporting key metrics at the campus level, i.e. energy consumption, renewable energy generation, and carbon emissions.
nj View carbon reduction over time based on the proposed projects and energy conservation measures.
nj Custom-built web application.
― WHAT IT IS Evaluates energy conservation measures and projects through multiple scenarios across multiple buildings.
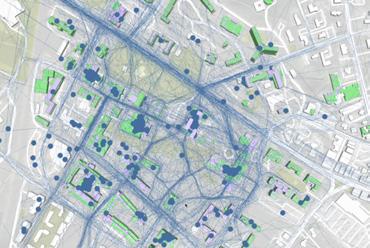
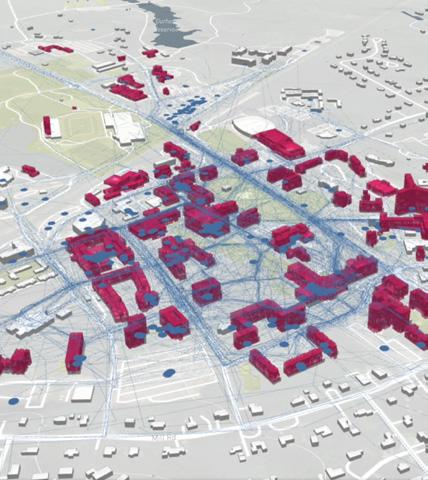
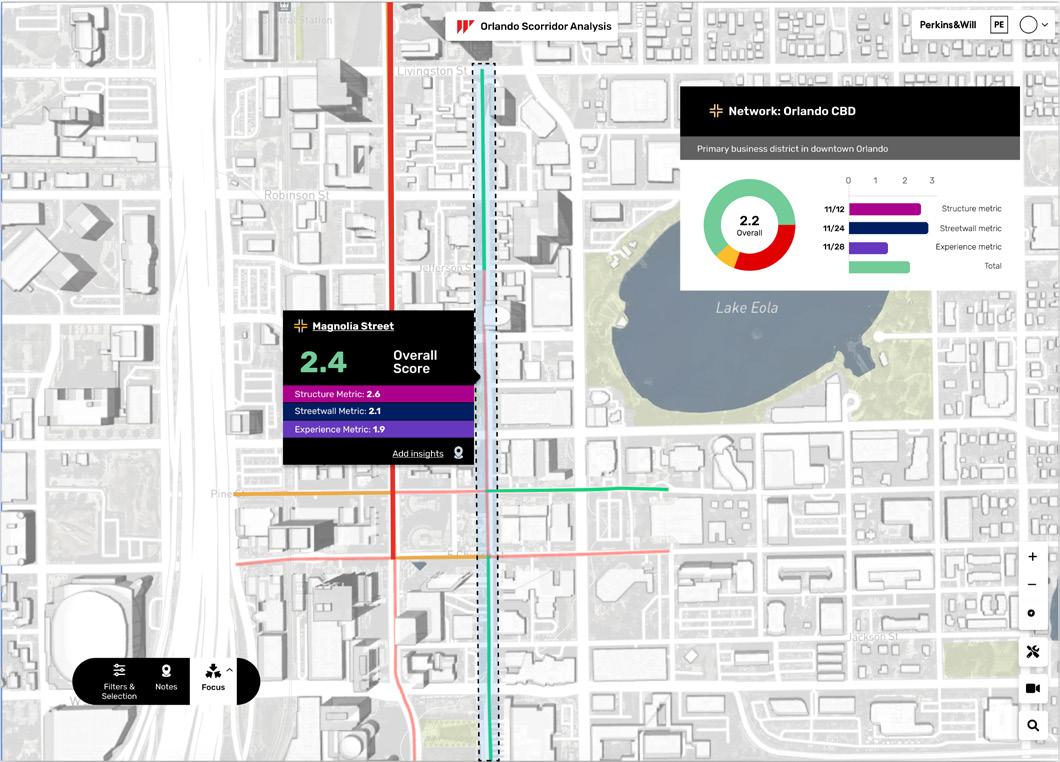
Street “Vibrancy” Program
Urban Planning Tool
TOOL FEATURES
nj Visualize thousands of data points including field analysis and external data.
nj Measure urban fabric connectivity and integrity, street wall and building/sidewalk interface activity, and public realm quality and comfort.
nj This program and the platform it sits on are custom Perkins&Will tools.
― WHAT IT IS Helps cities evaluate the vibrancy of their streets—safety, walkability, and structure—in order to prioritize investments.
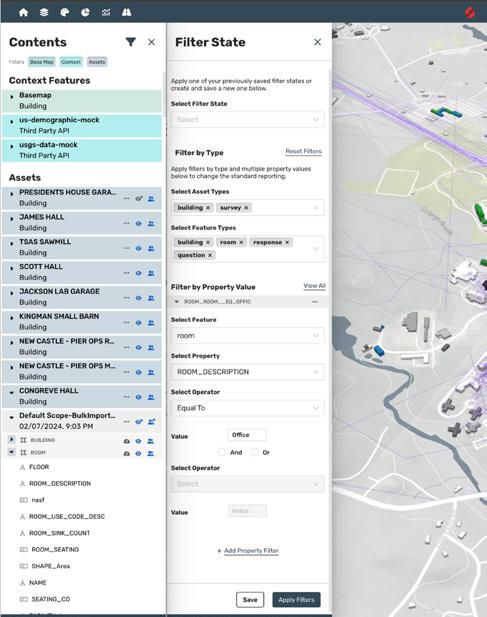
Campus Portfolio Planning Platform
A 3D Mapping & Data Visualization Tool
TOOL FEATURES
nj Filter based on assets, features, timestamps, styling, and saved filter states
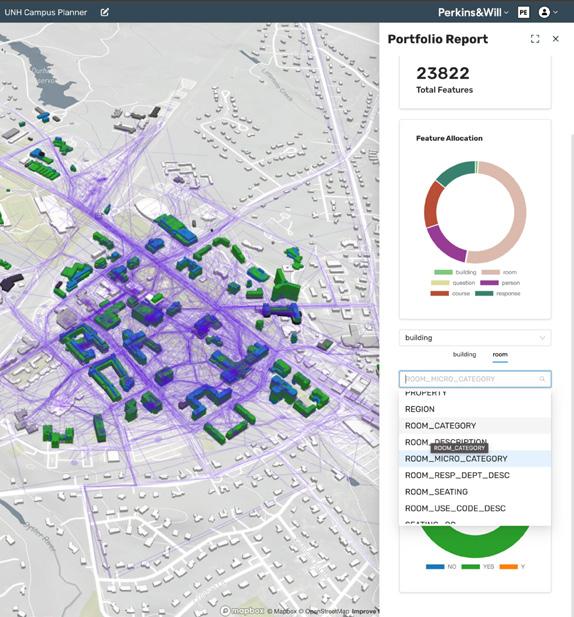
nj 3D map of a campus or portfolio
nj Data visualizations
nj Custom Perkins&Will tool
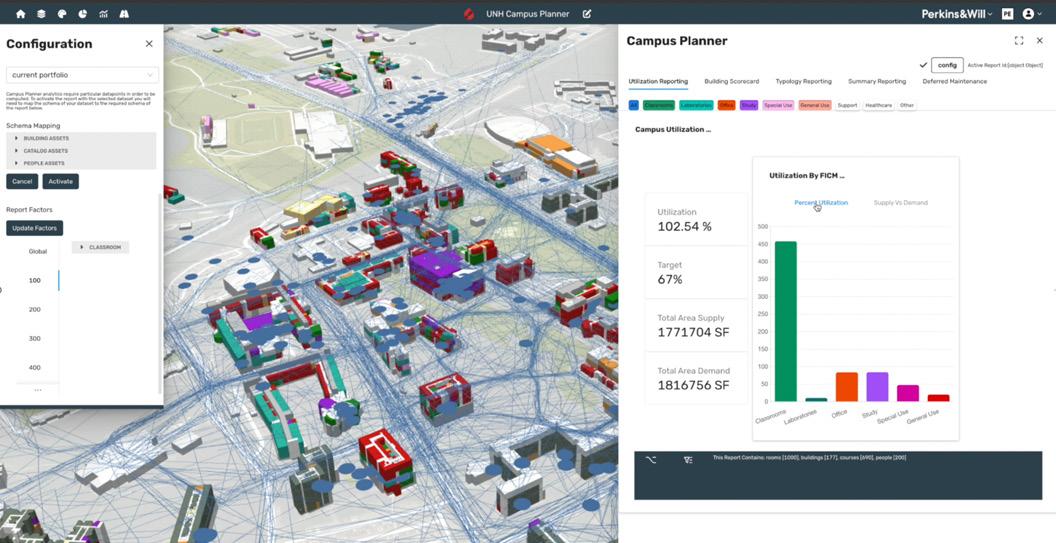
nj Calculations of each typology usage is adjusted by parameters you can control
nj Compare supply and demand relative to target utilization and industry standards
nj Understand how portfolio of assets rank across key buildings
nj Create hypothetical scenarios for the long-term planning of asset creation, modification, or removal, and the related impact on capacity/production
nj Track metrics informing overall facility and land planning strategy
nj Platform is a custom Perkins&Will tool.
―
Synthesizes large amounts of data to assist with decision making and to communicate the data-driven reasoning behind inspiring planning solutions.
― WHAT IT IS Thematically renders data with synchronized map and chart-based visualization.