
11 minute read
Population and Household Characteristics


In 2022, the Primary Market Area had an estimated population of 987 people and 474 households. According to the most recent data, all households in the Primary Market Area live in multifamily housing, and about 9 out of 10 households rent. 3 Residents live in both subsidized affordable and market rate housing. The Primary Market Area has a large share of subsidized affordable housing, which contributes to a disproportionately high share of very low-income households to the area (see Exhibit 6). There have been only marginal increases in population during the most recent post-2008 recession development cycle due to the limited amount of new residential development that has occurred in the area.
The Primary Market Area’s limited population growth and high concentration of lowerincome renter households underscores the need for a more balanced mix housing units, employees, and visitors to support a diversified retail environment.
Exhibit 2. Population, Northeast Pioneer Square Primary Market Area, 2010, 2020, and 2022
Source: ESRI Business Analyst
The Primary Market Area’s population increased 19.4 percent between 2010 and 2022. The district’s estimated population for 2022 is slightly higher than it was in 2020.
Exhibit 3. Housing Units, Northeast Pioneer Square Primary Market Area, 2010 and 2022
Source: ESRI Business Analyst
The number of housing units in the Primary Market Area increased 7.8 percent between 2010 and 2022 from 507 units to 547 units.

Exhibit 4. Total Housing Units by Housing Type, Northeast Pioneer Square area, 2022

Source: MIG
Housing in the Northeast Pioneer Square area is comprised of a mix of subsidized affordable housing, market rate apartments, and condos (owner occupied). The large number of subsidized affordable housing units has led to a high concentration of low-income households in the market area. About 75 percent of housing units in the area are subsidized units, demonstrating the need for more diverse housing types in the area.
Exhibit 5. Housing Tenure, Northeast Pioneer Square Primary Market Area, 2010 and 2022
Source: ESRI Business Analyst
The majority of households in the Primary Market Area rent. This percent as a share of occupied housing units declined somewhat from 2010 to 2022, falling from 93 percent of renteroccupied units in 2010 to 88 percent of renteroccupied units in 2022.
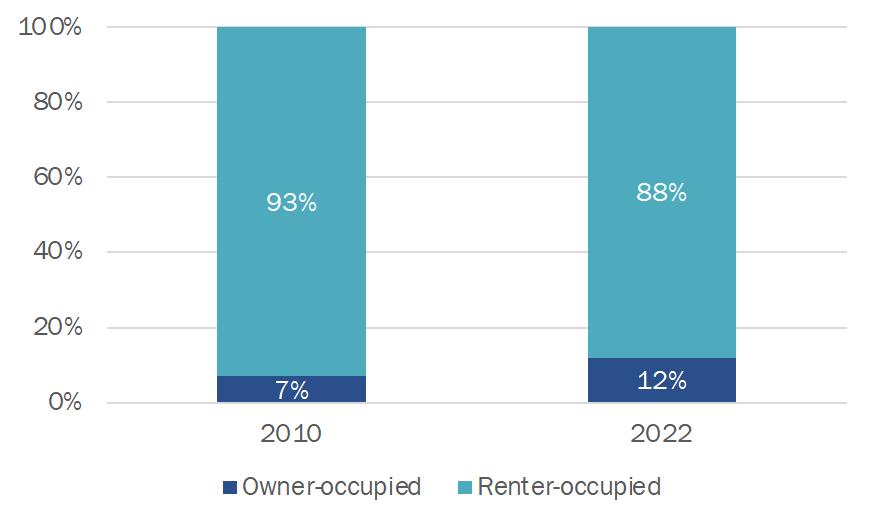
All households lived in multifamily housing.
Approximately 89 percent of households in the Northeast Pioneer Square Primary Market Area earn less than the median household income of Seattle which was $110,781 in 2021. Nearly a third of households in the Primary Market Area are very low-income, earning less than $15,000 per year.
Exhibit 6. Median Household Income by Income Bracket, Northeast Pioneer Square Primary Market Area, 2022
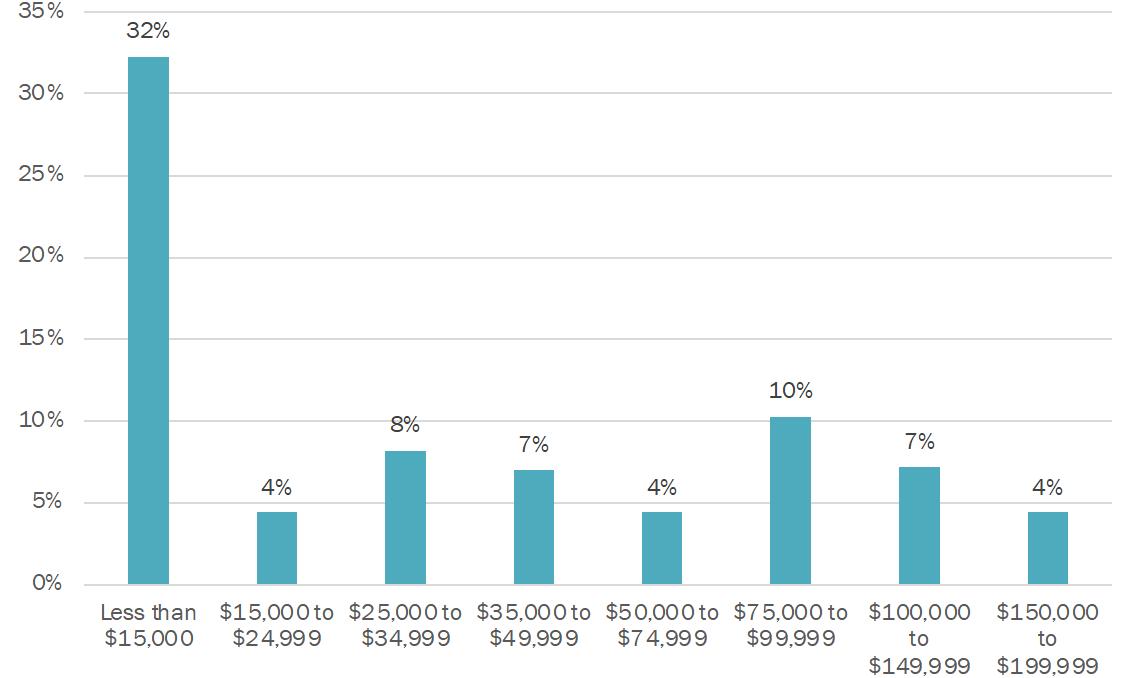
Source: ESRI Business Analyst
Employment Trends
Employees working in the Secondary Market Area work predominantly for the government, with slightly over half of employees working in this sector. Most of these workers are employed on the King County Civic Campus. The remainder of employees in the Secondary Market Area work mostly in the Services sector a broad category including occupations from engineers to food service workers. We estimate about half of service workers worked in more highly paid professional services occupations. In all, the Secondary Market Area has just over 15,800 employees with an estimated average annualized wage of $103,541 (using King County as a proxy; see Exhibit 8).
Exhibit 7. Number of Employees by Sector, Pioneer Square Secondary Market Area, 2021
Source: ECONorthwest analysis of PSRC’s 2021 Covered Employment Estimates
Exhibit 8. Annualized Income by Sector, King County, 2022 Q1
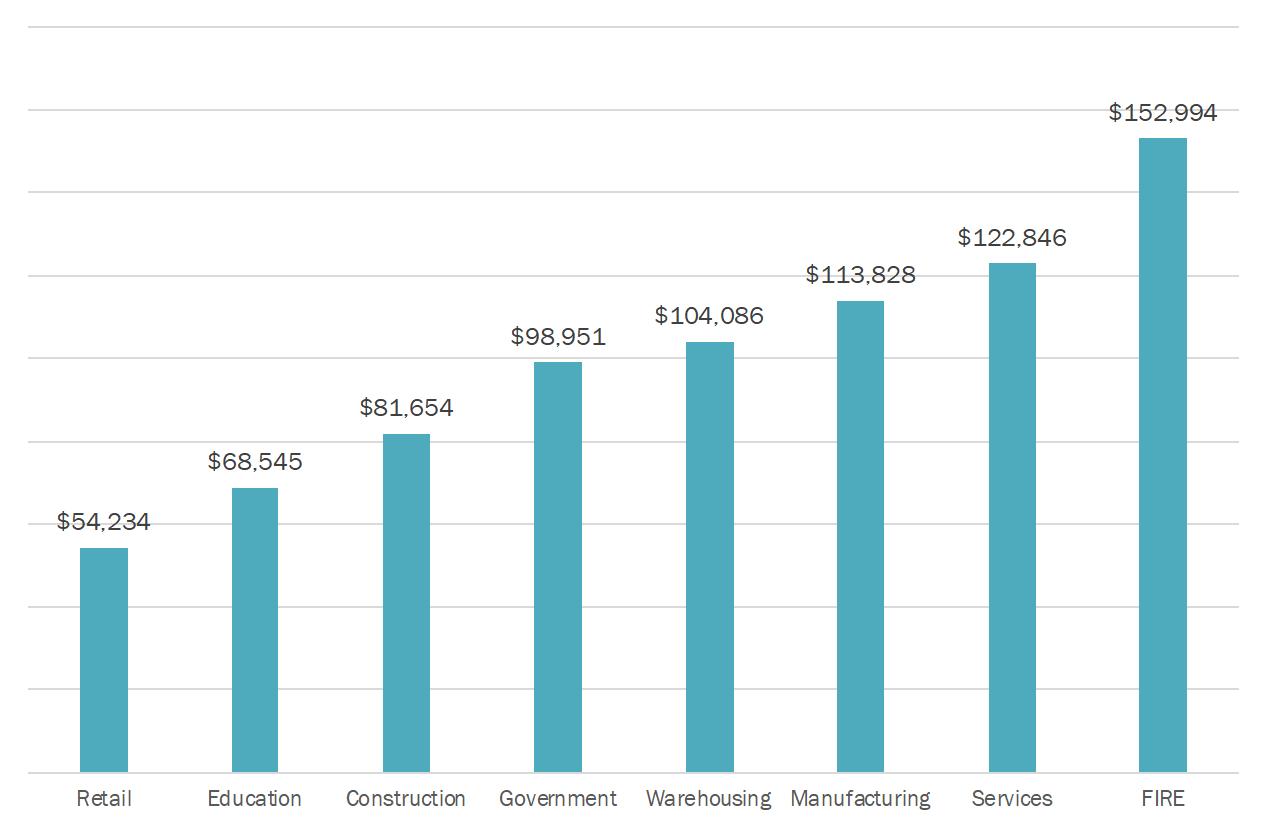
Source: BLS county-level Q1 2022 QCEW data
The market area’s current retail environment is dependent on employee presence, but since the onset of the COVID-19 pandemic, the return to office has been slower to materialize than some expected, and workers may never be in the office at the same rates as they were prepandemic. Employers are still figuring out the right balance of in-person to remote work. Approximately 27 percent of workers have returned to the Northeast Pioneer Square area, which is substantially lower than the 40 percent of workers that have return to Seattle’s Downtown.
Exhibit 9 below shows employee presence in the Secondary Market Area using cell phone data compared to January of 2019. Even as the COVID-19 pandemic has wound down, the return to office recovery has been slow. Since the beginning of 2022, employee foot traffic has hovered around 25 to 30 percent of pre-pandemic levels in 2019. This means that a crucial population for driving daytime retail demand is largely absent. Restaurants are no longer able to rely on lunch rushes of office workers. This means that there are less employees in the area to purchase haircuts and other goods and services. Overall, a reduced employee presence leads to a reduction in retail demand and sales to the area. Public safety concerns in the area have also hindered return to the office. All this suggest that addressing public safety and incentivizing return to the office will be key to supporting the retail market.
Exhibit 9. Share of January 2019 Employee Foot Traffic, Pioneer Square Secondary Market Area, 2019-2022
Source: Place.ai
Visitation and Tourism
Visitors and tourists are also important drivers of retail demand. Using cell phone data from Placer.ai, ECONorthwest was able to understand trends across time in visitors and employees in the Northeast Pioneer Square Secondary Market Area (see Exhibit 10). Two and a half years after the COVID-19 pandemic hit, tourism has returned to somewhat of a “normal” state in the Northeast Pioneer Square area, where total visitors have exceeded January 2019 numbers. Approximately 568,000 people visited Northeast Pioneer Square in June 2022, which was the first month where visitor count surpassed January 2019 visitor counts. Leveraging visitation and tourism to Northeast Pioneer Square will be crucial, particularly in light of reduced employee presence in the area. Capitalizing on the area’s active arts and culture scene with public art installations, gallery showings, and other outdoor art events will not only support the arts community but will also help to draw in visitors and increase the time they spend visiting Pioneer Square.
In addition, large events at Lumen Field (such as Seattle Seahawks games) and Mariner’s games at T-Mobile Park draw large crowds of visitors to the Northeast Pioneer Square area. During conversations with stakeholders, interviewees indicated that attendees of these large events often park in or near the Pioneer Square area and walk to the event location. Capitalizing on these visitors with temporary pop-ups and programming in public spaces may help boost retail sales and draw additional visitors to the Northeast Pioneer Square area in the future.

Exhibit 10. Percent of January 2019 Visitor Foot Traffic, Northeast Pioneer Square Secondary Market Area, 2019-2022
Source: Place.ai
4. Northeast Pioneer Square Market Conditions and Trends Retail Trends
Generally, Seattle’s retail rents have seen steady year-over-year growth and have grown 47 percent or $8.87 per square foot since 2010. Both Northeast Pioneer Square’s Primary and Secondary Market Areas have seen similar rent growth to Seattle’s; however, rents have fluctuated more intermittently in the past decade. This is likely due to the volatility of the retail submarket where new stores and restaurants failed in the long-term.

Between 2010 and 2022 Q2, the Primary Market Area saw the greatest rent growth of 77 percent or $9.64 per square feet, while the Secondary Market Area saw a growth of 40 percent or $6.56 per square feet. It is likely that we will see decreases in observed rents in the nearterm as rents are adjusted downward in response to escalating vacancy rates occurring in the post-pandemic commercial real estate environment.
Despite high retail vacancies in the area, the City of Seattle and the Alliance for Pioneer Square have responded well with activating vacant store fronts with pop-up art galleries and exhibits that draw in visitors and pedestrians to the area. These type of art and cultural activities that are well represented in Northeast Pioneer Square can become a pivotal focus point that can draw crowds form within and around the community to support existing and new retail businesses.
Exhibit 11. Average Retail Direct Annual Rent per Square Foot, Northeast Pioneer Square Primary and Secondary Market Areas and Seattle, 2010 to 2022 Q2
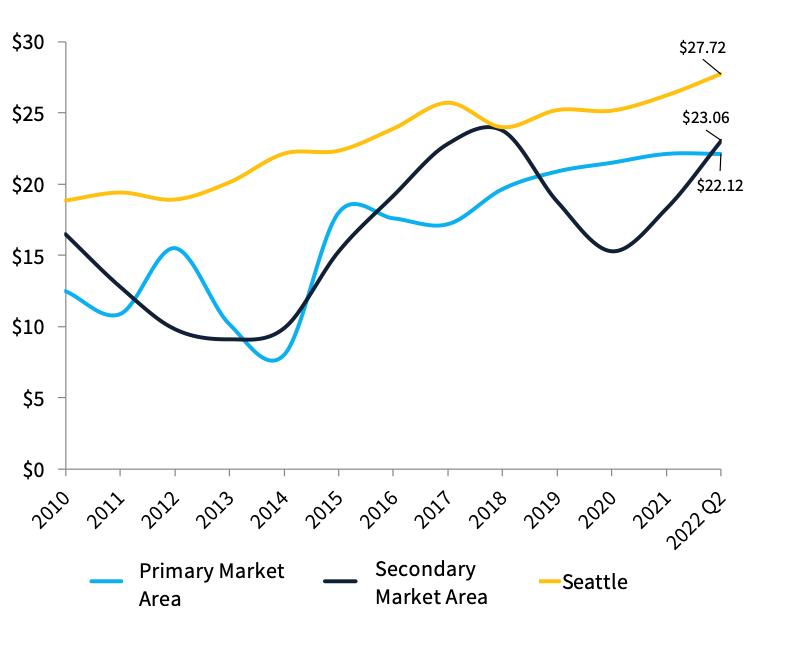
Source: CoStar
Retail Vacancy Trends
Since 2010, retail vacancy rates have decreased steadily in Seattle and the Northeast Pioneer Square Primary and Secondary Market Areas. However, both market areas saw spikes in vacancies after the COVID-19 pandemic that were not observed in Seattle as a whole, which indicates the pandemic impacted (and continues to impact) the Northeast Pioneer Square area more severely. The absence of mixed-income residential likely contributes to the region’s lack of economic resilience
Data on retail vacancy rates also likely undercount actual retail vacancy rates across the Northeast Pioneer Square area due to business closures that might still have active leases, increases in sub-lease activity, and smaller property owners that lease up their own properties without traditional broker engagement. The most important aspect of this retail vacancy data is the direction and the velocity of changes, which indicates less demand for retail in a post-pandemic environment.
Exhibit 12. Average Retail Vacancy Rate, Northeast Pioneer Square Primary and Secondary Market Areas and Seattle, 2010 to 2022 Q2

Source: CoStar
Retail Absorption Trends
Net absorption in both the Primary and Secondary Market Areas has tracked a cyclical pattern of positive net absorption followed by negative net absorption. Trends in net absorption indicate that most leasing activity is for smaller retail spaces (2,000 square feet in size or smaller). In 2021 and 2022, both market areas saw negative net absorption indicating that more commercial space was vacated than was leased by retail tenants.
In the second quarter of 2022, the Secondary Market Area saw the largest amount of retail space vacated in a single year approximately 26,000 square feet. About 7,500 square feet of retail space has been vacated in the Primary Market Area In the past two years.
Exhibit 13. Retail Net Absorption, Northeast Pioneer Square Primary and Secondary Market Areas and Seattle, 2010 to 2022 Q2

Source: CoStar
Office Trends
Historically, office rents across the Primary Market Area, the Secondary Market Area, and Seattle saw remarkable rent growth between 2010 and 2018. For a short period, average office rents in both market areas were above citywide averages. In 2019, office rents began to decline across the city and both market areas. Between 2019 and 2022 Q2, the Primary Market Area had the greatest decline in rents of 8 percent or $2.72 per square feet, followed by Seattle and the Secondary Market Area at 6 percent and 3 percent, respectively.
Between 2010 and 2022 Q2, the Primary Market Area saw its largest rent growth of 44 percent or $10.87 per square feet. Both the Primary Market Area and Seattle saw similar increases of $9.69 and $9.88 per square feet, respectively.
The Primary Market Area has office rents of $33.52 per square feet in 2022 Q2 which is just below citywide average office rents. High observed office rents in the Primary Market Area reflect the fact that office users in the district are predominantly government agencies who often support higher rents along with longer term tenant stability due to longer leases. It is also important to acknowledge that office vacancy rates have increased sharply since 2020 and are likely to put downward pressure on achievable rents over the near-term.
Exhibit 14. Average Office Direct Annual Rent per Square Foot, Northeast Pioneer Square Primary and Secondary Market Areas and Seattle, 2010 to 2022 Q2
Source: CoStar
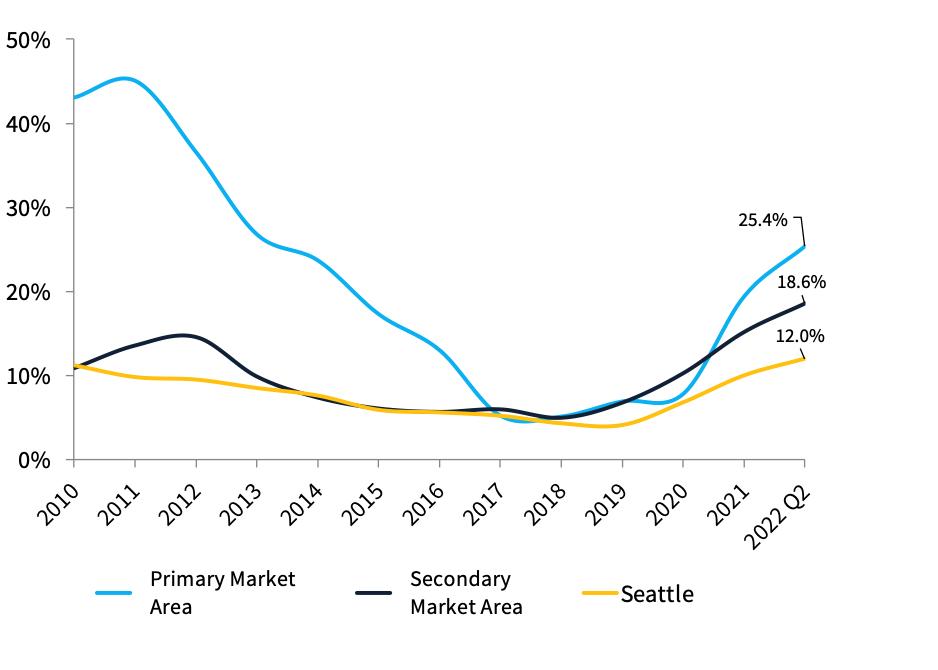
Office Vacancy Trends
The pandemic had a dramatic effect on the Pioneer Square area’s office market and the area saw sharper pandemic impacts than Seattle as a whole. In addition, it is likely that we will not know the full impact to office demand from shifting business and employee preferences until 2025 when all the pre-pandemic leases have ended. Office vacancy rates may increase through 2025. Although, Northeast Pioneer Square’s office users are somewhat different from the rest of Downtown Seattle which could lessen the impact of future vacancies, there are some repositioning strategies that Northeast Pioneer Square could take advantage of which will be covered in detail in the Phase 2 report.
Historically, the Primary Market Area office market has seen relatively high rates; however, its prime location next to the central business district, proximity to a robust transportation network, and institutional office tenants have allowed the area to maintain competitive rents.
Between 2010 and 2018, the Primary Market Area and Seattle observed sharp decreases in vacancy rates. Over this same period, the Primary Market Area saw sharp increases in occupancy, but the pandemic impacts to the office market have hit the area hard. In 2022 Q2, the Primary Market Area had a high vacancy rate of 25.4 percent, followed by the Secondary Market Area (18.6 percent), and Seattle (12.0 percent). Despite the Primary Market Area having the highest vacancy rate out of the two comparison market areas, rents have remained comparable to that of citywide averages in 2022 Q2, likely due to government and other institutional tenants.

It is also likely that we have not yet seen the bottom of the pandemic impact to office vacancy rates in Seattle or the Northeast Pioneer Square area.
Exhibit 15. Average Office Vacancy Rate, Northeast Pioneer Square Primary and Secondary Market Areas and Seattle, 2010 to 2022 Q2
Source: CoStar
Office Absorption Trends
Office absorption in the Northeast Pioneer Square area is reflective of Seattle’s office demand dynamics. In recent years, net absorption has been negative, which means that more office space was vacated than was leased. A negative net absorption and rising vacancy rates are indicative that office rents are likely to decline soon.
Since 2010, the Primary Market Area has not experienced any new office space construction. On the other hand, the Secondary Market Area had two large office developments in 2016 and 2018 totaling almost 700,000 square feet. In comparison, the Seattle office market has been building substantial office space to accommodate its growing tech industry. Since 2010, Seattle has built approximately 26.5 million square feet of office space.
Return-to-office has remained slow to materialize and employers are still figuring out the right balance between remote and in-person work. Until there is more certainty, short-term office leases will remain the preference of tenants as they figure out their right office needs for their employees post COVID-19. In the meantime, long-term office leases will likely be less desirable by tenants and property manages and property owners alike will need to adjust to the leasing preferences of the majority of tenants.
Exhibit 16. Office Net Absorption, Northeast Pioneer Square Primary and Secondary Market Areas and Seattle, 2010 to 2022 Q2

Source: CoStar
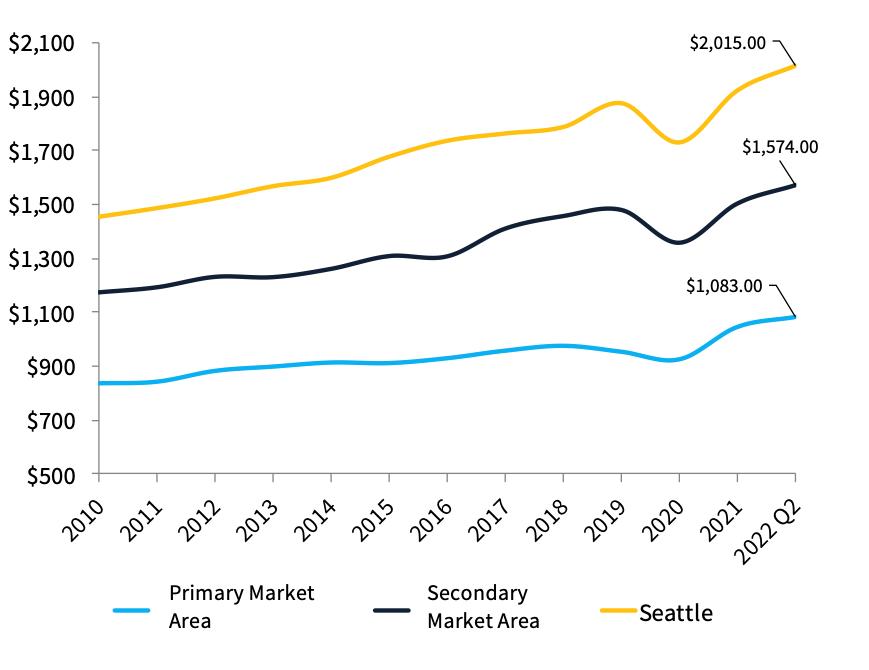
Multifamily Rent Trends
Historically, market rate multifamily rents in Seattle and both Northeast Pioneer Square market areas have increased at a steady rate. Since 2010, rents in the Primary Market Area have increased $246 per month, or about 29 percent, compared to $559 per month in Seattle or 38 percent. Since the onset of COVID-19 in 2020, rents have increased even further, increasing by 17 percent in the Primary Market Area and 16 percent in Seattle.
Exhibit 17. Average Multifamily Rent Per Unit, Northeast Pioneer Square Primary and Secondary Market Areas and Seattle, 2010 to 2022 Q2
Source: CoStar
The average per square foot rents for market rate units in the Primary Market Area have increased 29 percent ($0.53) from $1.81 in 2010 up to $2.34 in 2022 Q2.
In Seattle, the average per square foot rents have increased 39 percent ($0.83) from $2.13 in 2010 up to $2.96 in 2022 Q2. Similarly, the Secondary Market Area has seen modest rent growth of 34 percent ($0.74) from $2.17 in 2010 up to $2.91 in 2022 Q2.
On a per square foot basis, rents in the Secondary Market Area have closely mirrored Seattle’s rents; however, Seattle’s apartments tend to be smaller in size than apartments in the Secondary Market Area.
Source: CoStar
Housing is in great demand in Seattle and both Pioneer Square market areas. Vacancy rates in the Primary Market Area have fallen rapidly in the last decade and were at 4.9 percent in the summer of 2022, while vacancy in Seattle and Pioneer Square were 6.3 and 5.7 percent, respectively. Overall, residential demand exists in both Pioneer Square market areas. Very low vacancy rates coupled with continued rent growth year-over-year indicates upward pressures on rents and future demand for new construction at all income levels.
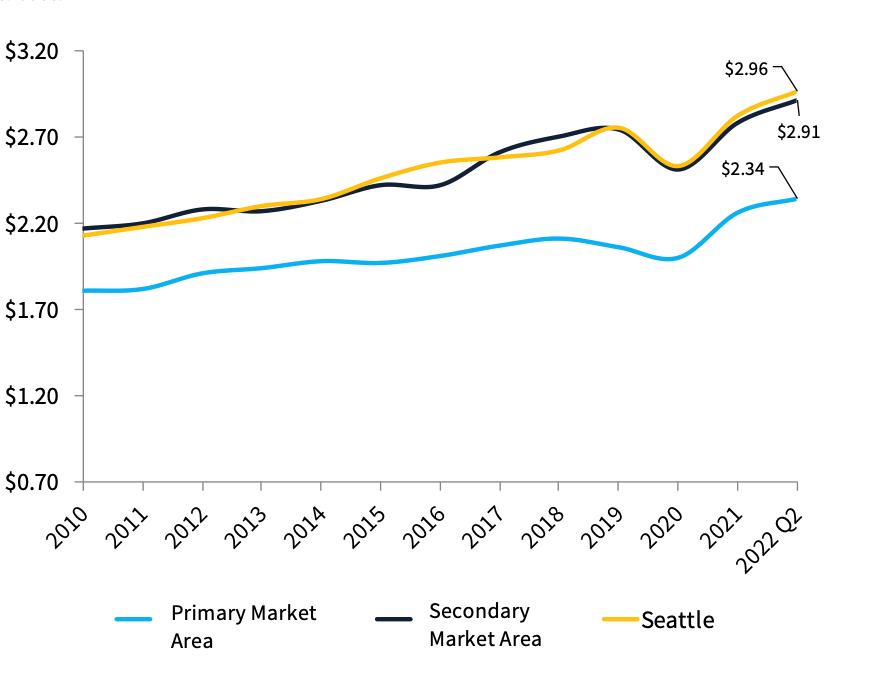
Exhibit 19. Multifamily Vacancy Rate, Northeast Pioneer Square Primary and Secondary Market Areas and Seattle, 2010 to 2022 Q2
Source: CoStar


