HSE & CSR Committee 2017 IPLOCA HSE Statistics Report Health & Safety (H&S)
Health & Safety (H&S)
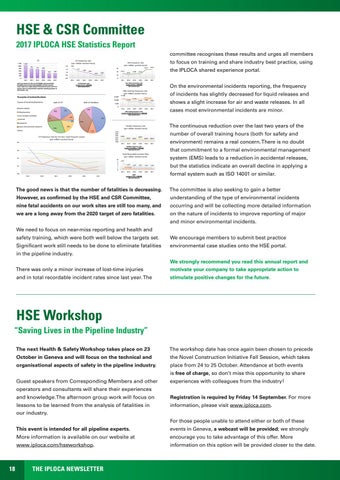
Lost Time Injury Cases (LTI)
1 200
1 038
1 000 800 1 200 600 1 000 400 800 200 600 0 400
2017
762 1 038
2012
LTI frequency rate (per millionNear Misses (NM) worked hours)
LTI
722
2.0 30 000 1.66
683
1.5 383
762
722
683
2013
2014
2015
396
2.0 1.0 1.5 0.5
383
396
2016
2017
Causes of Incidents/Accidents Description of Incidents/Accidents
Lifting Operations Vehicle accidents Work at height / scaffolding Lifting Operations Hand tool Work at height / scaffolding Involving fall Hand tool Impact with construction equipment Involving fall Others Impact with construction equipment Others
0.013 2017
16%
18%
16%
0.56
0
4.641
5.072
2013
2014 11%
2015
6.000
0
2013
3 000 2 000
11
2015
2016
2017
4 000 2 124
2 000
1 899
2 341
1 924
1 620
2017 2016
2017
1 000
2012
2013 2013
2014
2015 0
2014
Total Recordable Incident cases are calculated with number 2015 2016 2017 (MTC), of Lost Time Injuries (LTI), Medical Treatment Cases and Restricted Work Cases (RWC).
2012
2016 2013 2014
2015
3
292
2020 target 7 099 5 962
2015 2015
762
2015
2016
2016
16.21
2016
722
2017
2.0
683
1.66 1.21
1.5 383
396
1.0
2017
200
0.5
0
0.0
1.00
0.82
2012
2013
2014
2015
2016
(per million worked hours)
2017
2012
0.51
0.4
0.50
0.39
0.44
0.37
0.0
2012 2013 2014 2015 Causes of Incidents/Accidents
2015
0.45
0.56
2016
2017
0.41
2016
2017
Split of LTI
Split of Fatalities
cases most environmental incidents are minor. 18%
Lifting Operations Work at height / scaffolding
MTC frequency rate 9% worked hours)
11%
16%
9%
Hand tool(per million
3%
4 2 0
45%
The continuous reduction over the last two years of the
4.75 6 Involving fall
TRIR: number of TRI x 1 000 000 total worked hours
2014
shows a slight increase for air and waste releases. In all
0.2
Vehicle accidents
1 229
2013
of incidents has slightly decreased for liquid releases and
0.6
2017
2 965
Fatality frequency rate (per million worked hours) 1 291
20.24
OnRWC frequency the environmental incidents reporting, the frequency rate
1,271 1 400 1 200 1 000 655 800 595 10 6006.92 8 400 6 200 3.28 2.82 2.63 2.29 2.28 4 0 2020 target 2 2012 2013 2014 2015 2016 2017 0 2012 2013 2014 2015 2016 2017
4 321
3 000
2014 2014
30.10
2014
400
RTA Total Recordable Incident Rate 992 (per million worked hours) 800 792
Total Recordable Incidents
2.29
2013 2013
6 101
36.01
600
Fatalities frequency rate: number of fatalities x 1 000 000 total worked hours
A fatality is a death resulting from a work injury or occupational illness, regardless of the time intervening between injury and death.
5 000
800
2017
1 037 932 893 0.101 000 0.08 0 0.06 2013 2014 2016 2017 0.0342012 0.0292015 0.04 0.017 0.012 0.013 0.013 0.02 0.00 2012 2013 2014 2015 2016 2017
9
2020 target 2014
2016
0 1 20020121 0382013 1 000
MTC 4 000
24 11% 9
2015
2017
28.95
LTI LTI frequency rate the IPLOCA shared experience portal. (per million worked hours)
20
H&S Training frequency rate: number of H&S training hours x 1 000 000 total worked hours
11% Fatalities (FTL)
2012
2012 2012
8 799
45%
30
0
7 162
5 000 0
2017
33% Lagging Indicators
11
2014
2016
RWC 367rate H&S Training frequency 325 318 312 284 (per million worked hours)
10 000100
4.226
2016
33%
16%
29%
2013
49.98
40
Near Misses frequency rate: number of NM x 1 000 000 total worked hours
9%Training Hours are the number of hours spent by personnel to H&S 45%by all the get trained to H&S standards (includes all the hours spent personnel 3% to get trained).
LTI frequency rate for the four most10frequent causes (per million worked hours)
2012
2012
400
11%
2012
14.06 13.74 10.91 2012 2013 2014 2015
to focus on training and share industry best practice, using
60
26.5211 491
26.22
300 13 700 15 000200
Split of Fatalities
5 0
6.347
(per million worked hours)
NM frequency 25 975rate 25 027 18 759worked hours) 17 106 (per million
10
Split of Fatalities
8.554
16% 3%
29%
0.2 0.1
0.0
18 796
0.82 0.56 0.45 2013 2013 2014 2014 2015 2015 2016 2016 2017 2017 2012
9%
9%
0.3 0.2
0.1 0.0
10
committee recognises these results and urges all members LWD severity rate
31 206
20 000 30 10 000 15.21 20 0
15
18%
0.4 0.3
2017
0.82 10 142 11 424 0.45
LTI frequency rate for the four most frequent causes 21 20 (per million worked hours)
0.4
30 000
2020 target 22 159
H&S Training Hours
Split of LTI
9%
7 068 1.00
40 000
Near Miss: Any event which had the potential to cause injury and/or frequency rate: 0.0 damage and/orLTI loss of butLTIwhich was000 avoided by circumstances. number x 1 000 2013 2014 hours 2015 2017 The2012 term “incident” includes “near misses”.2016 total worked
Split of LTI
Causes of Incidents/Accidents Vehicle accidents 2017
9 497 1.21
0 2012
0.5
Injuries, then it is accounted for corporate reporting purposes as 20 LTIs (not 1 LTI).
5 962
1.66 10 000
1.0 0.0
200 Lost Time 0 Injuries are the sum of fatalities, permanent total disabilities, permanent partial disabilities and lost workday 2013incident 2014 2015 receive 2016 Lost2017 cases. Note:2012 if in a single 20 personnel Time
et
LTI frequency rate 1.21 (per million worked hours) 20 000 1.00
millions
26.52
LWD
Leading Indicators
LTI
Impact with construction equipment 1.60 1.55 1.24
1.45
1.31 29%
2016
2017
33%
16%
number of overall training hours (both for safety and
Others
2012
2013
2014
2015
11%
LTI frequency rate for the four most frequent causes (per million worked hours)
0.4
0.3
2.0 1.5 0.2 1.0 0.5 0.0 0.1
0.0
environment) remains a real concern. There is no doubt thatRTA frequency commitment to a formal environmental management rate (per million worked hours)
system (EMS) leads to a reduction in accidental releases, 0.95
1.01
1.10
1.19
1.79
0.95
but the statistics indicate an overall decline in applying a 2012
2013
2014
2015
2016
2017
formal system such as ISO 14001 or similar. 2012
2013
2014
2015
2016
2017
2
The good news is that the number of fatalities is decreasing.
The committee is also seeking to gain a better
However, as confirmed by the HSE and CSR Committee,
understanding of the type of environmental incidents
nine fatal accidents on our work sites are still too many, and
occurring and will be collecting more detailed information
we are a long away from the 2020 target of zero fatalities.
on the nature of incidents to improve reporting of major and minor environmental incidents.
We need to focus on near-miss reporting and health and safety training, which were both well below the targets set.
We encourage members to submit best practice
Significant work still needs to be done to eliminate fatalities
environmental case studies onto the HSE portal.
in the pipeline industry. We strongly recommend you read this annual report and There was only a minor increase of lost-time injuries
motivate your company to take appropriate action to
and in total recordable incident rates since last year. The
stimulate positive changes for the future.
HSE Workshop “Saving Lives in the Pipeline Industry” The next Health & Safety Workshop takes place on 23
The workshop date has once again been chosen to precede
October in Geneva and will focus on the technical and
the Novel Construction Initiative Fall Session, which takes
organisational aspects of safety in the pipeline industry.
place from 24 to 25 October. Attendance at both events is free of charge, so don’t miss this opportunity to share
Guest speakers from Corresponding Members and other
experiences with colleagues from the industry!
operators and consultants will share their experiences and knowledge.The afternoon group work will focus on
Registration is required by Friday 14 September. For more
lessons to be learned from the analysis of fatalities in
information, please visit www.iploca.com.
our industry. For those people unable to attend either or both of these
18
This event is intended for all pipeline experts.
events in Geneva, a webcast will be provided; we strongly
More information is available on our website at
encourage you to take advantage of this offer. More
www.iploca.com/hseworkshop.
information on this option will be provided closer to the date.
THE IPLOCA NEWSLETTER


