

Prof. Ailton de Souza Gomez
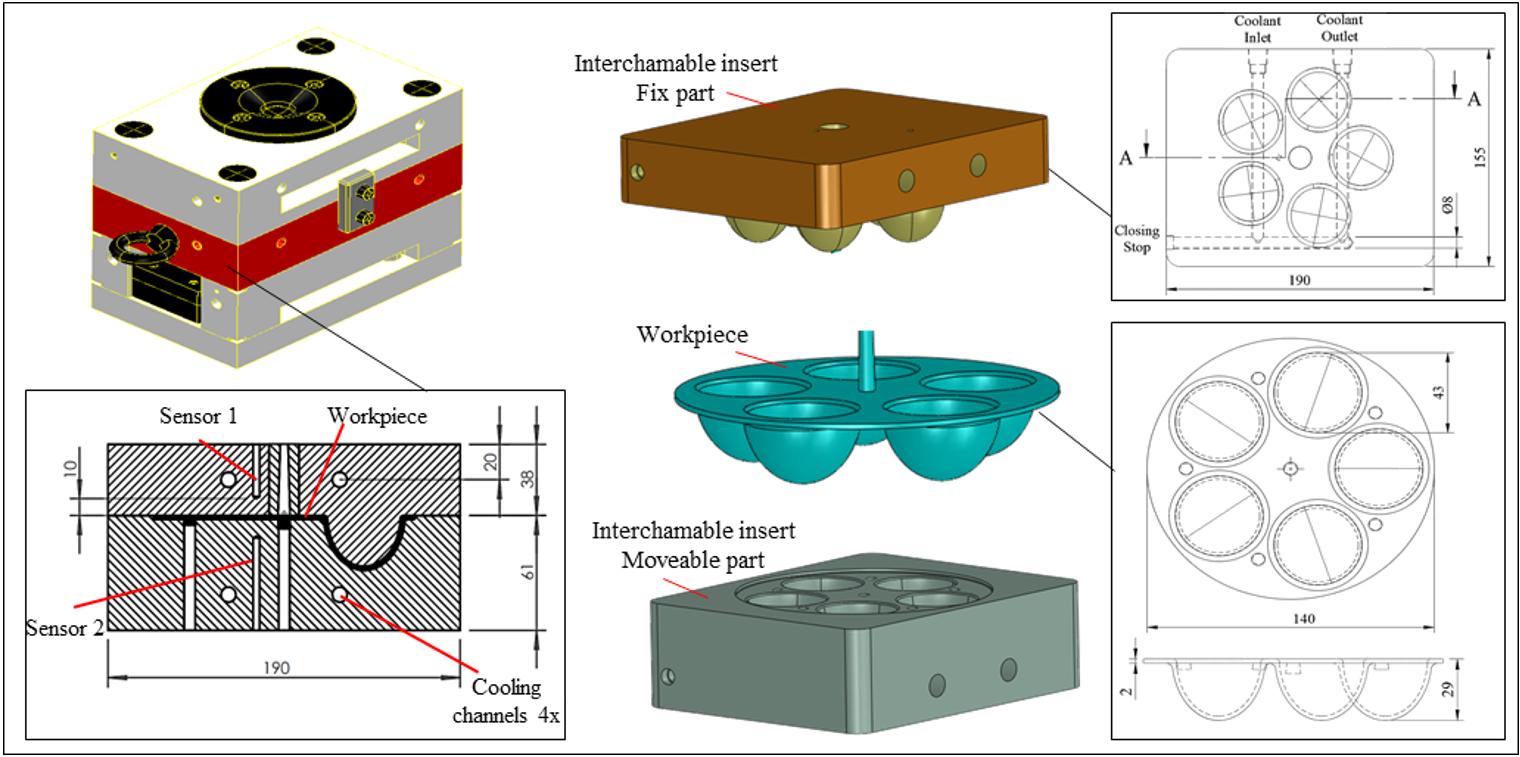
Workpiece geometry, inserts, entire mold, and position of the thermocouples (sensor 1 and sensor 2)

P olímero S
e d I tor I al C ou NCI l
Antonio Aprigio S. Curvelo (USP/IQSC) - President m ember S
Ailton S. Gomes (UFRJ/IMA), Rio de Janeiro, RJ (in memoriam)
Alain Dufresne (Grenoble INP/Pagora)
Artur José Monteiro Valente (UC/DQ)
Bluma G. Soares (UFRJ/IMA)
César Liberato Petzhold (UFRGS/IQ)
Cristina T. Andrade (UFRJ/IQ)
Edson R. Simielli (Simielli - Soluções em Polímeros)
Edvani Curti Muniz (UEM/DQI)
Elias Hage Jr. (UFSCar/DEMa)
José Alexandrino de Sousa (UFSCar/DEMa)
José António C. Gomes Covas (UMinho/IPC)
José Carlos C. S. Pinto (UFRJ/COPPE)
Júlio Harada (Harada Hajime Machado Consutoria Ltda)
Luiz Antonio Pessan (UFSCar/DEMa)
Luiz Henrique C. Mattoso (EMBRAPA)
Marcelo Silveira Rabello (UFCGU/AEMa)
Marco Aurelio De Paoli (UNICAMP/IQ)
Nikos Hadjikristidis (KAUST/ PSE)
Osvaldo N. Oliveira Jr. (USP/IFSC)
Paula Moldenaers (KU Leuven/CIT)
Raquel S. Mauler (UFRGS/IQ)
Regina Célia R. Nunes (UFRJ/IMA)
Richard G. Weiss Washington (GU/DeptChemistry) (in memoriam)
Roberto Pantani, (UNISA/DIIn)
Rodrigo Lambert Oréfice (UFMG/DEMET)
Sebastião V. Canevarolo Jr. (UFSCar/DEMa)
Silvio Manrich (UFSCar/DEMa)
Financial support:
Available online at: www.scielo.br

e d I tor I al C omm I ttee
Sebastião V. Canevarolo Jr. – Editor-in-Chief
a SS o CI ate e d I tor S
Alain Dufresne
Artur José Monteiro Valente
Bluma G. Soares
César Liberato Petzhold
José António C. Gomes Covas
José Carlos C. S. Pinto
Marcelo Silveira Rabello
Paula Moldenaers
Richard G. Weiss (in memoriam)
Roberto Pantani
Rodrigo Lambert Oréfice
d e S kto P P ubl IS h IN g www.editoracubo.com.br
“Polímeros” is a publication of the Associação Brasileira de Polímeros
São Paulo 994 St. São Carlos, SP, Brazil, 13560-340 Phone: +55 16 3374-3949
emails: abpol@abpol.org.br / revista@abpol.org.br http://www.abpol.org.br
Date of publication: June 2024
Polímeros / Associação Brasileira de Polímeros. vol. 1, nº 1 (1991) -.- São Carlos: ABPol, 1991-
Quarterly v. 34, nº 2 (June 2024)
ISSN 0104-1428
ISSN 1678-5169 (electronic version)
1. Polímeros. l. Associação Brasileira de Polímeros.

Website of the “Polímeros”: www.revistapolimeros.org.br
E E E E E E E E E E E E E E
o r I g IN al a rt IC le
Biodegradation of poly(lactic acid) waste from 3D printing
Virginia Mendonça Lourenço Benhami, Silvia Maria de Oliveira Longatti, Fatima Maria de Souza Moreira and Alfredo Rodrigues de Sena Neto ..................................................................................................................................................e20240013
New bioresorbable filaments for scaffolds intending local sodium alendronate release
Olivia Deretti, Guilherme Tait, Lucas Werner, Luana Engelmann, Denise Abatti Kasper Silva and Ana Paula Testa Pezzin e20240014
Effect of process parameters on the properties of LDPE/sepiolite composites
Priscila da Silva e Souza, Ana Maria Furtado de Sousa and Ana Lúcia Nazareth da Silva e20240015
Chemical and mechanical resistance of waterborne polyurethane/graphene (WPU/GO) nanocomposite coatings
Pietro Paolo de Oliveira e Silva, Enderson José Dias de Melo, Arthur Israel Carneiro Espíndola, Marcus Vinicius Fernandes Florentino, Ana Paula Lima da Silva, Elinaldo Neves dos Santos e20240016
Thermal evaluation of the calcium stearate influence on polystyrene by in-line colorimetry
Felipe Bernardo and Sebastião Vicente Canevarolo Junior e20240017
Physicochemical characterisation and bioactive potential of microcapsules of Moringa oleifera leaf extract
Rosely de Jesus Nascimento, Carlos Renato Vieira Nascimento, Paula Ribeiro Buarque and Luciana Cristina Lins de Aquino Santana e20240018
Pyriproxyfen-based Rumino-Reticulum Device for horn fly control in cattle: development and characterization
Melina Cardilo Campos Alves, Renata Nunes Oliveira, Gabriela Ferreira de Oliveira, Thais Paes Ferreira, Antonieta Middea, Maria Inês Bruno Tavares, Hugo Sabença, Bruno de Toledo Gomes, Luiz Henrique Guerreiro Rosado, Fábio Barbour Scott and Yara Peluso Cid e20240019
Processing and characterization of biocomposites based on polylactic acid and coconut by-products
Yulinali Valente Morales, Luz del Carmen Montoya-Ballesteros , Luis Enrique Robles-Ozuna, Yesica Yudith Martínez Núñez, Judith Fortiz Hernández, José Carmelo Encinas-Encinas and Tomás Jesús Madera-Santana e20240020
Alternative production of bacterial cellulose by Komagataeibacter hansenii and microbial consortium
Izabel Cristina Nóvak, Bruna Segat, Michele Cristina Formolo Garcia, Ana Paula Testa Pezzin and Andréa Lima dos Santos Schneider e20240021
Synthesis and characterization of BC-ZnO and antibacterial activity test
Hermawan Purba, Marpongahtun Marpongahtun, Tamrin Tamrin and Athanasia Amanda Septevani ............................................e20240022
Alternative materials to shorten injection mold manufacturing and molding cycles
Adriano Fagali de Souza, Janaina Lisi Leite Howarth, Bruno Edu Arendarchuck, Alexandre Mateus Popiolek, Claudio Antonio Treml Junior and Crislaine Kavilha e20240023
The role of thermoactive binders in the structuring of composites
Meiyu Shao, Andrii Bieliatynskyi, Viacheslav Trachevskyi, Shilin Yang and Mingyang Ta e20240024
Plastic pollution crisis: Indian researchers develop polymers that can self-heal
By harnessing elemental sulphur from petroleum refining industries and cardanol extracted from cashew nut industry waste as raw materials, these polymers offer a sustainable alternative.
In an effort to combat the global plastic pollution crisis, researchers at Shiv Nadar University have pioneered an innovative solution – developing sustainable polymers derived from industrial waste.
Professor Bimlesh Lochab and Dr Sangeeta Sahu from the Department of Chemistry have introduced a novel category of waste-derived polymers with the ambitious aim of achieving carbon neutrality. By harnessing elemental sulphur from petroleum refining industries and cardanol extracted from cashew nut industry waste as raw materials, these polymers offer a sustainable alternative to conventional petrochemical-based plastics. Remarkably, their synthesis requires minimal technical complexity, making it easier to adopt across various industries.
The team said that these polymers belong to the emerging class of vitrimers, characterized by their ability to be reshaped and reused without disposal, similar to the regenerative properties observed in human skin. They showcase the ability to self-heal when exposed to specific temperatures, mimicking temperature-responsive wound healing processes. Guided by the principles of green chemistry, the research team envisions a myriad of applications for these waste-derived polymers, ranging from flexible coatings to robust adhesives and flameresistant materials for battery technology.
The hallmark attributes of the developed cardanol benzoxazine-sulphur polymer—Recycling, Reprocessing, Self-Healing, and Shape Recovery (R2S2)—underscore its versatility and transformative potential across diverse industries. Notably, its rebondable adhesive properties, impressive load-bearing capacity, and shape recovery highlight the revolutionary impact these polymers could have in addressing sustainability challenges. “The material demonstrates excellent adhesion to metal surfaces, such as aluminium-aluminium, steel-steel, and aluminium-steel hybrid substrates, with remarkable strength,” Dr Bimlesh Lochab said.
Upon application and subsequent use of the respective adhesive, these metal substrates are retrieved undamaged, minimizing waste and enhancing reuse potential. Professor Lochab pointed to the urgency of embracing innovation and reimagining traditional approaches to meet the evolving needs of society. By investing in sustainable solutions and fostering collaboration among academia, industry, and policymakers, we can chart a course towards a more resilient and eco-friendly future.
Source: India Today Science – indiatoday.in
University to be part of new Hub to make the chemical and polymer industry more sustainable
The University of York is to be part of a major EPSRC-funded research initiative to make chemical and polymer production more sustainable.
The £11m Sustainable Chemicals and Materials Manufacturing Hub (SCHEMA) will bring together six Universities from across the UK to transform how chemicals and polymers are designed, made and then recycled with the intention of moving away from virgin petrochemical use and to boost recycling rates. The key focus of the research will be on designing process to harness biomass, carbon dioxide and even industrial waste, in the production of chemical and polymers.
The University of York’s Green Chemistry Centre for Excellence (GCCE) will work alongside the Universities of Oxford, Bath, Liverpool, Cardiff and Cambridge. The Hub will be led by Professor Charlotte Williams OBE FRS at the University of Oxford. Professor Antoine Buchard, of the GCCE, says his team’s expertise in research related to the development of bio-derived polymers towards more sustainable commodity plastics and speciality ingredients will be a key part of the Centre’s participation on the Hub. It will also lead on efforts to integrate digital technologies into chemicals and materials manufacturing. He explains why the work of the Hub is so important. “The chemical industry is one of the key blind spots in the global net zero energy debate, yet so many essential downstream industries depend upon it,” he says.
“The Hub will bring together academic experts and industry users across the supply chains, to make the manufacture of sustainable chemicals and materials a commercial reality. Developing processes that operate with sustainable raw materials from waste, air and water, and are powered by renewable electricity, is an incredible challenge but our team is well placed to tackle it.”.
Source: University of York – york.ac.uk
G E N D A
6th Int’l Conference on Polymer Chemistry (ICPC 2024)
Date: July 19-21, 2024
Location: Xi’an, China
Website: www.academicx.org/ICPC/2024/ Polymer Engineering & Science International 2024
Date: July 21-25, 2024
Location: Tokyo, Japan Website: www.pesi.tw/ August
Plastic Technology Integration Exhibition & Congress –Interplast 2024
Date: August 13-16, 2024
Location: Joinville, Santa Catarina, Brazil Website: www.interplast.com.br/en_us/home-eng/ International Composites, Polyurethane and Engineering Plastics Fair and Congress 2024
Date: August 20-22, 2024
Location: São Paulo, Brazil Website: feiplar.com/Presencial/ September
15th International Symposium on Ionic Polymerization (IP’24)
Date: September 1-5, 2024
Location: Mainz, Germany Website: www.ip-24.org
PFAS Workshop
Date: September 10, 2024
Location: Brussels, Belgium
Website: ami-events.com/event/05535392-3ff0-4f87-a598c96f5f052a0c/summary?RefId=Website_AMI Polymer Markets Outlook
Date: September 10-11, 2024
Location: Brussels, Belgium
Website: go.ami.international/polymer-markets-outlook/ Plastics Extrusion World Expo Europe
Date: September 11-12, 2024
Location: Brussels, Belgium
Website: eu.extrusion-expo.com/home Bioplastics
Date: September 17-18, 2024
Location: Cincinnati, Ohio, United States of America
Website: ami-events.com/event/41eb4892-9e9a-4557-9a8f09f0f57e5827/summary?Refid=Website_AMI
Advances in Polyolefins
Date: September 29 – October 2, 2024
Location: Rohnert Park, California, United States of America
Website: www.polyacs.net/24apo European Regional Meeting of the Polymer Processing Society
Date: September 30 – October 3, 2024
Location: Ferrol, Galicia, Spain
Website: https://pps2024ferrol.com/ October
Polyolefin Additives
Date: October 8-9, 2024
Location: Barcelona, Spain
Website: www.ami-events.com/event/34b50abd-c009-4f50-b5429ab68f17095f/summary?RefId=Website_AMI
International Conference on Polymers and Advanced Materials - Polymat 2024
Date: October 20-25, 2024
Location: Huatulco, Oaxaca
Website: iim.unam.mx/polymat Plastics Recycling Technology
Date: October 23-24, 2024
Location: Vienna, Austria
Website: ami-events.com/event/bc7e919f-830f-4c9b-9963e5ca9f7f7b47/summary?RefId=Website_Home
Global Research Conference on Polymer Science, Composite Materials and its Application
Date: October 24-26, 2024
Location: Barcelona, Spain
Website: https://polymerresearch2024.com/
November
Performance Polyamides
Date: November 12, 2024
Location: Cleveland, Ohio, United States of America
Website: ami-events.com/event/41d53af0-26aa-44f2-b060a2304697f534/summary?RefId=Website_AMI Plastics Extrusion World Expo North America
Date: November 13-14, 2024
Location: Cleveland, Ohio, United States of America Website: na.extrusion-expo.com/ 5th World Expo on Biopolymers and Bioplastics
Date: November 13-14, 2024
Location: Dubai, United Arab Emirates Website: biopolymers.materialsconferences.com/ 25th Brazilian Congress of Materials Engineering and Science - 25th CBECiMat
Date: November 24-28, 2024
Location: Fortaleza, Ceará, Brazil Website: cbecimat.com.br
December
Polymer Engineering for Energy
Date: December 3-4, 2024
Location: London, United Kingdom Website: ami-events.com/event/535774b9-c2a2-432d-be1fb7864beed551/summary?RefId=Website_AMI
Polymers in Hydrogen and CCUS Infrastructure
Date: December 5-6, 2024
Location: London, United Kingdom Website: ami-events.com/event/a90b3d2c-b31f-4ffa-91a80dd7dddca53b/summary?RefId=Website_AMI
Polymers — 5th International Congress and Exhibition
Polymers Azerbaijan: Construction and modernisation of plants
Date: December 11-13, 2024
Location: Baku, Azerbaijan
Website: https://polymerscongress.com/ 2025
January
Thermoplastic Concentrates Forum
Date: January 20-22, 2025
Location: Tampa, Florida, United States of America
Website: ami-events.com/LXL0m2?locale=en&Refid=Website_ AMI
February
Polyethylene Films
Date: February 17-19, 2025
Location: Tampa, Florida, United States of America
Website: ami-events.com/event/44f91be8-b556-4ec1-8fc208ce6f94dcbf/websitePage:8ce5942f-1379-4ec2-92e6db27048f1d3a?Refid=Website_AMI
March
ANTEC® 2025
Date: March 3-6, 2025
Location: Philadelphia, Pennsylvania, United States of America Website: 4spe.org/antec
National Graduate Research Polymer Conference
Date: March 18-21, 2025
Location: Arizona State University, Tempe, Arizona, United States of America Website: 2025ngrpc.asu.edu/
April
40th International Conference of the Polymer Processing Society
Date: April 22-25, 2025
Location: Auckland, New Zealand Website: www.pps-40.org/
May
Polymer Sourcing and Distribution
Date: May 19-21, 2025
Location: Malaga, Spain
Website: ami-events.com/event/f82e6fcc-bfc5-4deb-b4814f20b4c03717/summary?RefId=Website_AMI
Sponsoring Partners
Biodegradation of poly(lactic acid) waste from 3D printing
Virginia Mendonça Lourenço Benhami1* , Silvia Maria de Oliveira Longatti2 , Fatima Maria de Souza Moreira2 and Alfredo Rodrigues de Sena Neto1
1Programa de Pós-graduação em Engenharia Ambiental, Universidade Federal de Lavras – UFLA, Lavras, MG, Brasil
2Departamento de Ciência dos Solos, Universidade Federal de Lavras – UFLA, Lavras, MG, Brasil *virginiamlbenhami@gmail.com
Obstract
One of the most widespread applications of poly(lactic acid) (PLA) is as a raw material in the form of filaments for 3D printing. To improve final disposal alternatives and minimize their effects on the environment, the aim of this study is to determine the biodegradability of 3D-printed PLA waste composted in a landfill with leachate soil and garden soil for 90 days and 180 days. The soil characteristics and material properties were evaluated by laboratory analyses. Changes in soil chemical composition and the loss of microorganisms were recorded. The thermal and mechanical properties of PLA did not change significantly, but fungal colonies, encrustation, and changes in the original colour were found, indicating the onset of surface biodegradation of the samples. Controlled conditions or longer periods would be needed to maintain an ecosystem favourable to biodegradation; otherwise, PLA could accumulate in the environment, causing future pollution problems.
Keywords: 3D printing, PLA, biodegradable polymers, waste, sustainability.
How to cite: Benhami, V. M. L., Longatti, S. M. O., Moreira, F. M. S., & Sena Neto, A. R. (2024). Biodegradation of poly(lactic acid) waste from 3D printing. Polímeros: Ciência e Tecnologia, 34(2), e20240013. https://doi.org/10.1590/0104-1428.20230058
1. Introduction
Petrochemical-based polymers are present in multiple sectors of the economy, as they are relatively cheap and easy to process. However, when discarded, they can take years to decompose in the environment, accumulate in landfills, or even be inappropriately released into nature, generating environmental impacts[1]
In response to these issues, biodegradable polymers have emerged, produced mostly from renewable resources, such as the raw material sugarcane, corn, wheat and potato, thus avoiding the impacts caused by the extraction and refining of oil[2,3] .
Among the most commercialized biodegradable polymers in the world, poly(lactic acid) (PLA) is produced mainly from natural sources by the fermentation of carbohydrates, where each process varies according to the type of bacteria used[2,4] PLA in the form of filaments has been essential for the manufacture of parts in additive manufacturing (AM), i.e., 3D printers, being considered a fast, economical alternative because there is almost no wasted material, and highly complex and lightweight parts can be manufactured due to its high rate of surface hardness, gloss, low toxicity and desirable mechanical properties[5-7]
Notably, the use of AM technology using PLA became even more widespread during the COVID-19 pandemic. Shortages in the supply of several medical products and interruptions of industries and transportation made this technology essential for the production of basic equipment
such as face masks, visors, testing devices and personal protective equipment (PPE)[8]
The biodegradation of PLA occurs through hydrolysis, accompanied by the release of lactic acid and, consequently, a decrease in the pH of the medium[9]. This biodegradation process is considered a type of natural composting because there is no need for the use of specific equipment or energy resources[10]
The factors that affect biodegradation are related to the microorganisms present by enzymatic action[11]. For a colony of microorganisms to grow and develop, adequate humidity, temperature, pH, necessary oxygen, and enzymes specific to aerobic or anaerobic conditions are needed[12]. Humidity is essential, as it provides the environment with favourable conditions for microorganisms to grow and reproduce and contributes to the hydrolysis process, especially since polymers degrade more in humid environments than in low or no humidity conditions. Changes in pH from acidic to basic can also affect the growth of microorganisms and the rate of hydrolysis. Temperature influences the microbial environment and is a parameter that should be controlled because the rate of biodegradation increases with increasing temperature, but at too high a temperature, the microbial activity decreases[13,14]
The biodegradation process results in changes in the mechanical, optical or electrical properties of the materials, causing the appearance of cracks, fractures, and changes in
Benhami, V. M. L., Longatti, S. M. O., Moreira, F. M. S., & Sena Neto, A. R.
surface aspects such as colour fading, chemical transformation, and decreases in viscosity and molar mass, consequently reducing their shelf life[1,3,15]
As a consequence of the increasing use of PLA, a large amount of this discarded material has been inserted into the management system of urban and industrial solid waste. When PLA is discarded under favourable natural composting conditions, biodegradation occurs. However, its degradation mechanism under certain circumstances is still unclear, raising uncertainties about the conditions of the environment, the influence of microorganisms, the characteristics of the material, and the time needed, among others[9,14-16]
Thus, to improve alternatives for the final disposal of PLA and minimize its effects on the environment, it is important to know the biodegradability behaviour of this material when discarded, either through the natural composting process that occurs in landfills or if incorrectly discarded in the soil, observing its physical and chemical characteristics, to assist in decision making concerning the use of PLA, in addition to contributing to waste management.
2. Materials and Methods
2.1 Materials and experimental procedure
For this study, we analysed 3D-printed visors made from PLA filaments that were manufactured as personal protective equipment during the COVID-19 pandemic
but then discarded when they deformed during printing (Figure 1a). For the experiment, the PLA material was divided into equivalent parts according to the type of analysis to be carried out, the exposure time in the soil and the type of soil (Figure 1b, 1c).
The biodegradation process was performed with two types of soils:
● Landfill soil with leachate: taken from the landfill of a municipality in Minas Gerais, Brazil, geographical coordinates -20.99321 S and -42.82450 W. The leachate was taken from the garbage collection truck, and approximately 10 mL of leachate was added to the landfill soil to ensure a diversified microbiota, with the purpose of exploiting the natural microorganisms of a final waste disposal site[17];
● Garden soil used for planting flowers and vegetables was taken from a residence in Minas Gerais, Brazil, geographical coordinates -21.74897 S and -43.36530 W.
Approximately 10 kg of each soil type was collected. Part of the PLA samples were buried in soil for 90 days, a period when the anaerobic process occurs and the aerobic process may occur, known as biostabilization or active degradation. The other samples were buried for 180 days, which is the period when the maturation process occurs, with humification and extraction of organic matter[18]. Soil temperature, pH and moisture parameters were monitored
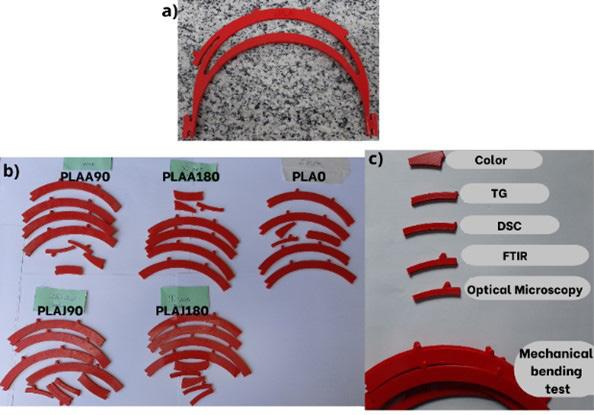
Figure 1. PLA residue printed on the 3D printer.
periodically using a digital measuring equipment model Soil Survey Instrument, CE brand. Water was added whenever necessary to maintain an ideal environment for the microorganisms, with approximately 60% humidity[19].At the end of the determined times, 90 days and 180 days, the PLA samples were removed, washed in running water, and stored. The soils were stored in a refrigerated environment for analysis. Table 1 identifies the nomenclature used during the experiment for each type of soil and PLA sample used for analysis:
2.2 Analysis and testing
2.2.1
Analysis of the soil samples
Microbial biomass carbon (MB-C) was determined by the fumigation-extraction method[20], which consists of oxidation of microbial carbon by K2Cr2O7 in fumigated and nonfumigated soil types by chloroform, and the microbial C of each sample was extracted by K2SO4 solution (0.5 mol/L). In the presence of H2SO4, the microbial carbon present in the soil type was oxidized, and the residual K2Cr2O7 was quantified by titration with Fe(NH4)(SO4)2·6H2O. The results were expressed as mg of C per kg of dry soil. Basal respiration (RB) was determined according to the method of capturing and quantifying the CO2 released by the microbial respiration process over a 72 h incubation period[21]. Samples of 20 g were taken from each soil type (J0, J180, A0, A180), and these samples were transferred to hermetically sealed bottles. These bottes contained vials with 20 mL of 0.05 mol/L NaOH. The samples were mixed with NaOH (which did not react with CO2) plus the addition of 5 ml of BaCl2.2 H2O (0.5 M) and three drops of the phenolphthalein indicator (0.1%), titrated with HCl (0.5%). The results were expressed as mg C-CO2 kg dry soil-1 day-1. From the results of microbial biomass carbon and basal respiration, the metabolic quotient (qCO2) was calculated, representing the amount of C-CO2 evolved per unit of microbial C[22]. The results were expressed as mg C-CO2/mg C-BM.day-1 .
2.2.2 Analysis of PLA samples
Three-point bending mechanical tests were performed based on the technical standard ASTM International
D790, Standard Test Method for Bending Properties of Unreinforced Plastics and Electrical Insulation Materials[23]
An MC universal testing machine was used, model WDW - 20E. The distance between the lower support points was 75 mm, and the speed was 2 mm/minute. Properties such as maximum strength, modulus of elasticity and flexural deformation were determined by means of stress x strain curves using WinWdw-F020 software. The samples were taken in quadruplicate, the means and standard deviation for each sample were determined, and a one-way ANOVA was carried out without repetition, with a significance level of 0.05 (5%) to analyse the variability between the results.
The differential scanning calorimetry (DSC) technique allowed measuring the processes of enthalpy (ΔH) changes and temperatures of the thermal events of the samples. The crystallinity was calculated by Equation 1[24]:
Nomenclature Description
J0 Garden soil without contact with the PLA samples
J180 Garden soil that was left for 180 days with the PLA samples
A0 Landfill soil with leachate without contact with PLA samples
A180 Landfill soil with leachate that was left for 180 days with the PLA samples
PLA0 PLA samples without contact with soils
PLAJ90 PLA samples buried 90 days in garden soil
PLAJ180 PLA samples buried 180 days in garden soil
PLAA90 PLA samples buried 90 days in landfill soil with leachate
PLAA180 PLA samples buried 180 days in landfill soil with leachate
ΔH2: is enthalpy referring to the melting peak (Tm); ΔH1: enthalpy of the cold crystallization peak; ΔH0: melting enthalpy of 100% crystalline PLA: 93.7 J/g[21] .
A DSC-60 calorimeter was used with a flow rate of 50 mL/min nitrogen, a sample weight of approximately 6.0 mg, and a temperature increase from 25 °C to 210 °C with a heating rate of 10 °C/min.
Fourier transform infrared spectroscopy (FTIR) was used to evaluate the chemical structures of the PLA samples. The spectrum ranged from 4000 to 400 cm-1, the resolution was 2 cm-1, and the number of scans per sample was 32 times/min.
A Motic microscope, model BA210E, was used for the analysis by optical microscopy of several different parts of the PLA samples, providing images magnified at 100x. The software used for generating the images was Moti Connect.
The colour analysis was performed using a Color Muse 9600 spectrophotometric colorimeter. The samples were evaluated as to their visual aspect, following the biodegradation evolution through colour alteration, according to the CIELab 1976 colour evaluation standard, based on the elements luminosity, hue and saturation, where the parameter L indicates the luminosity scale, and the parameters a* and b* are the opposite axes for the colours green to red versus yellow to blue, were automatically calculated by the equipment.E delta and (ΔE) is the difference between the standard colour and the altered colour, calculated using Equation 2[25,26]. For each type of sample, an average of three readings were taken.
3. Results and Discussions
The temperature of the soil during the study varied according to the ambient temperature of the region, with an average of 24 °C. This temperature had little influence on the rate of biodegradation of the material. Higher temperatures or
Table 1. Nomenclature used for the soil and PLA samples.
Benhami, V. M. L., Longatti, S. M. O., Moreira, F. M. S., & Sena Neto, A. R.
artificial means of control may have possibly lead to greater biodegradation, as demonstrated in a study that evaluated the degradation of PLA at different temperatures, showing that microorganisms have a direct role in the degradation of PLA only at temperatures close to 50 °C with a humid environment[9]
For the landfill soil, we found neutral values, starting at pH 7.0, and throughout the experiment, did not become as acidic as those in the garden soil. In the garden soil, pH values started at 6.5, and gradually decreased, reaching a minimum of 5.1. This pH reduction may be related to PLA biodegradation, since biodegradation is accompanied by the release of lactic acid and this result was also observed in studies evaluating PLA biodegradation[9,27] Table 2 shows the monthly average (measured daily) of the temperatures and pH obtained over the 90 days and 180 days. The humidity was maintained at 60%.
3.1 Biological indicators of soil quality
According to Moreira and Siqueira[28], microbial biomass carbon is a sensitive indicator of changes in the ecosystem and is related to the amount of carbon received over a given time. Usually the lowest values are found in degraded areas, and in this case, the lowest values were found in areas that were most disturbed over the time of the experiment: the garden soil that was in contact with PLA samples for 180 days (J180) had half the microbial biomass carbon compared to the PLA-free garden soil (J0). The Landfill soil (A180) could not be evaluated the same way, since leachate was added. Since leachate was not present in the Zero-PLA Landfill (A0), this may have influenced the soil characteristics, changed its microbial composition, resulting in an increase in the biomass carbon[29].The results for basal respiration (Table 3) were similar to those found for the biomass carbon tests; again, the Zero-PLA Garden sample (J0), which was not affected by the time of the experiment,
obtained the highest value, while the other samples (J180 and A180) obtained lower values. In other words, the lowest RB values occurred in the samples with the lowest levels of organic carbon.The results of the qCO2 (Table 3) were higher in the zero-PLA soil samples (J0 and A0), which may be related to the higher organic carbon values.
When microorganisms are in soils exposed to stress for a long period, even at low concentrations, they are not able to maintain biomass stability[28]. Thus, it was shown that even leaving the soil in favourable conditions was not enough to maintain its natural conditions and that the lack of vegetation cover may also have influenced stability, resulting in a considerable loss of microorganisms in these soil ecosystems.
3.2 Analysis of PLA samples
3.2.1 Mechanical bending test
The flexural strength was slightly higher in the PLA0 samples compared to the others that were exposed to the soil. In[27], a decrease in the strength of PLA exposed to soil was also found; however, for this study, these were very small changes, with no significant differences. For the elasticity modulus results, we found that the PLA0 samples obtained lower values than the other samples. For the samples that were exposed to soil, we could not see any differences in the elastic modulus values; they all showed very similar results. A feature of PLA is its inability to resist deformation under stress[30]. In the maximum deformation results (Figure 2), we also found no significant differences between the samples. According to Eutionnat-Diffo et al.[31] , PLA deforms less due to the material’s high modulus.
The mechanical bending results were used to check for parameters that could explain the biodegradability of the material; however, no relevant standard values were found;
Table 2. Average results of temperature and pH measured during the experiment.
Table 3. Results of Microbial Biomass Carbon, Basal Respiration and Metabolic quotient.
in general, the mechanical properties of PLA did not change throughout the experiment. These results were confirmed by the single-factor statistical analysis ANOVA, without repetition, significance equal to 0.05 (5%), to compare the variances between the sample means, in which the value of F = 0.308 was found, lower than the critical F value = 2.866. In addition, the P value was equal to 0.869, i.e., greater than 0.05, so we no significant difference between the average results found for the samples in the mechanical bending test analyses.
3.2.2 Thermogravimetric analysis (TG)
The results for volatiles at 100 °C were similar and cannot be considered different for this temperature range (Table 4). The samples showed a stage of mass loss close to 270 °C,
with a peak at approximately 360 °C (Figure 3a and 3b). For the onset temperature, the values did not differ since thermogravimetric analysis has a margin of error of 2 °C. An ash content greater than zero is indicative of inorganic contamination (sand, clay, etc.), which was observed mainly in sample PLAJ180, where residues of inorganic soil material may have been adhered to the surfaces of the samples. In general, the TG thermograms obtained showed very similar behaviour for all the samples, and the curves showing the PLA characteristics were also similar to other works[32] .
3.2.3 Differential scanning calorimetry (DSC)
The DSC results, identified by the second heating curves, are shown in Figure 4 and Table 5. The first curve,
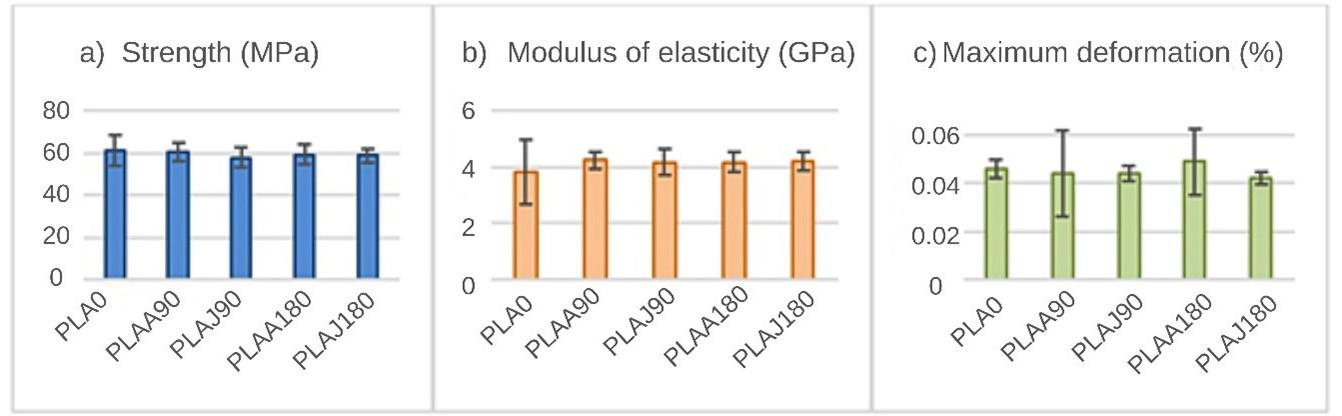
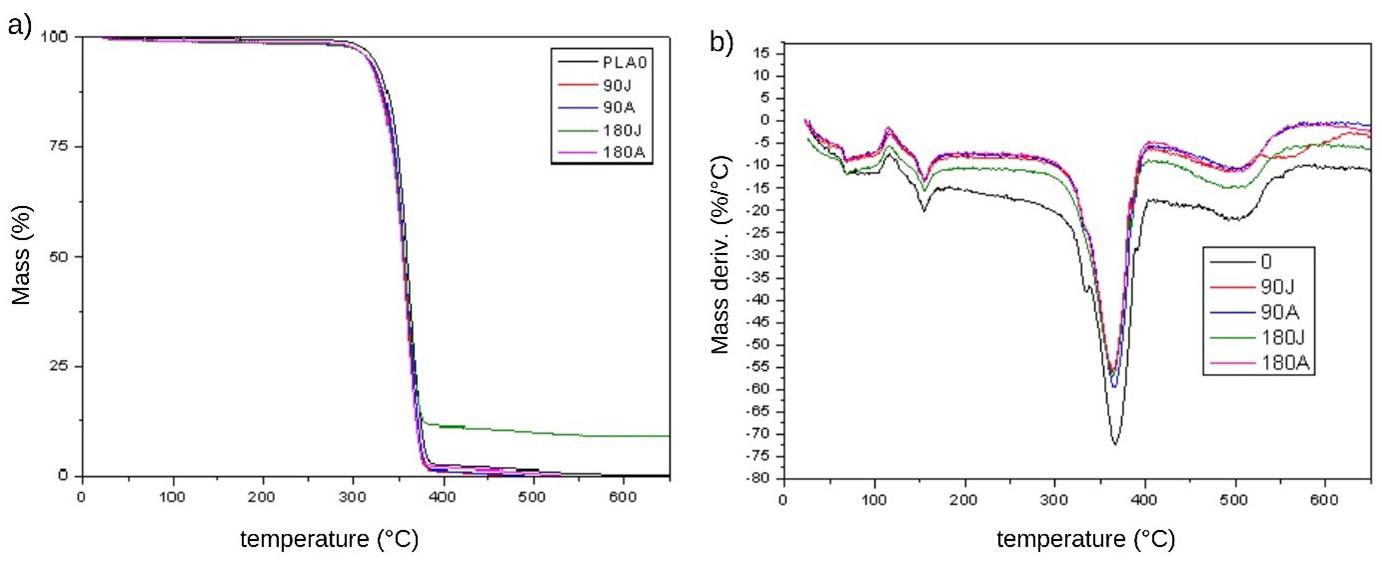
Figure 2. Results of mean and standard deviation for the mechanical tests: (a) Strength; (b) Modulus of elasticity; (c) Maximum deformation.
Table 4. Thermogravimetry results.
Figure 3. TG (a) and DTG (b) curves.
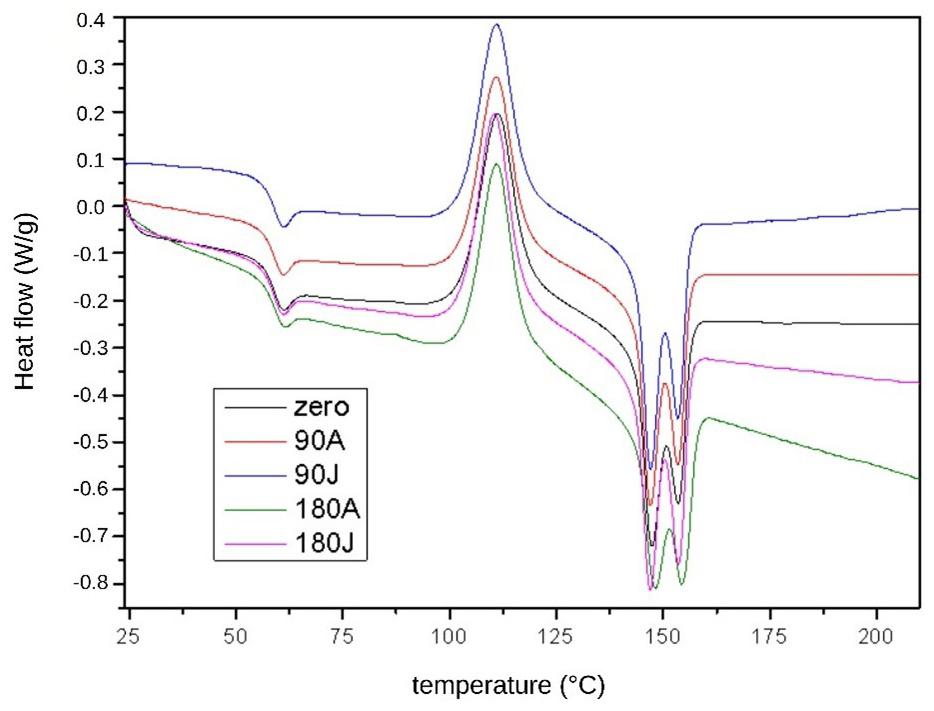
close to 58 °C, refers to the glass transition temperature (Tg) of the samples. The exothermic peak at approximately 110 °C is attributed to cold crystallization, which is typical of PLA[33]. Finally, two melting peaks, close to 150 °C, represents two melting peaks due to lamellar crystalline structures (crystallites) with different sizes, which is the characteristic behaviour of PLA. All the DSC curves obtained for the PLA samples showed similarity in their profiles[6,34]
3.2.4
Fourier transform infrared spectroscopy (FTIR)
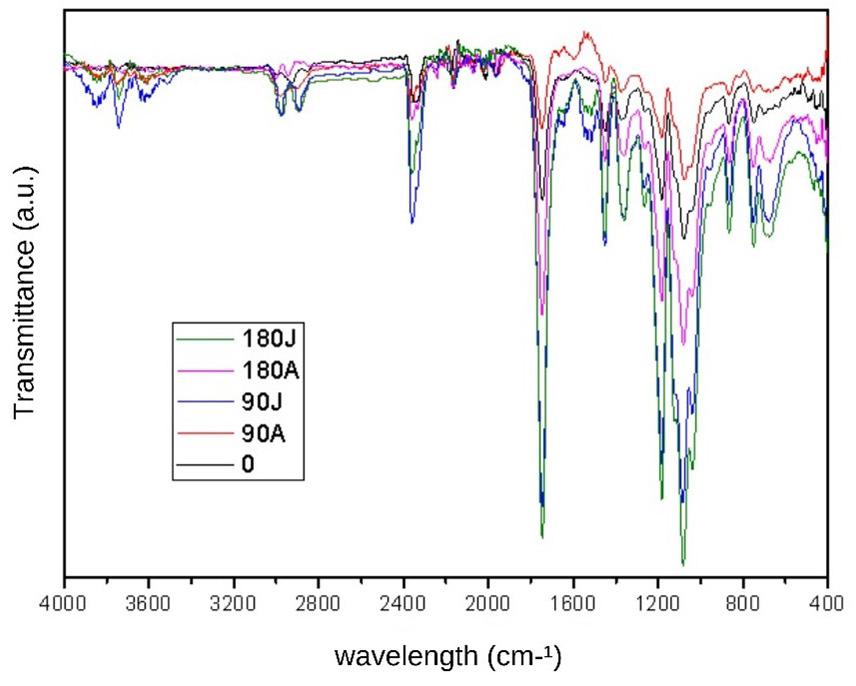
The characteristic spectrum of pure PLA is represented in this case by PLA0, the black line (Figure 5). Notably, the effect observed around the 3700 cm-1 bands, which refers to the OH bond, in the samples that remained in the soil can be an indicator of degradation through the formation of carboxylic acid, i.e., the degradation of the chain causes an increase in the number of ends of the carboxylic chain, which is a characteristic behaviour of PLA. The soluble lactic acid near the surfaces tends to leach out before complete degradation, and the lactic acid inside is retained and contributes to the autocatalytic effect, which may explain the steeper curves, from 2400 cm-1 , in the samples that were exposed to soil compared to the Zero-PLA samples (PLA0). The band near 1750 cm-1 is associated with the C=O bond; we observed an increase in the intensity of this band for both garden samples (PLAJ180 and PLAJ90). The same samples stood out from the others, with a reduction in the intensity of the 1200 cm-1 to 1000 cm-1 bands, while after 900 cm-1, more pronounced bands were observed. This behaviour has also been observed in other PLA studies[35]
3.2.5 Optical microscopy (OM)
The use of optical microscopy helped to visualize characteristics such as the formation of fungal colonies and incrustations on the PLA surfaces. The images made it possible to see the areas most affected by the action of the microorganisms. All the samples exposed to the soil for 90 and 180 days (PLAJ90, PLAA90, PLAJ180 and PLAA180) showed the presence of orange and black pigments, typical of bacteria and fungi, as well as surface perforations, irregular and fragmented edges, cracks and superficial peeling, leaving the material with a whitish colour (Figures 6b, c, d, e), while the PLA0 samples maintained uniform and unchanged surfaces (Figure 6a). Regardless of the type of soil and the biodegradation time, the samples did not differ significantly; they all had similar aspects, but the samples that were left in the soil for 180 days (PLAJ180 and PLAA180) had whiter surfaces than the 90-day samples (PLAJ90 and PLAA90). In his research[23], similar degradations on the surface of PLA were observed.
3.2.6 Colour analysis
A bleaching trend was observed in the PLAA90, PLAJ90, PLAA180 and PLAJ180 samples, confirmed by the increase in clarity values (L*); the closer the L* values were to 100, the more they tended towards absolute white. In addition, there was a decrease in the values of the a* and b* coordinates, explained by the reduction in PLA colour pigments. The greater the fading of the sample that remained in the soil, the greater the ΔE[25] , with the highest value observed in the PLAJ180 sample[26] In this context, it was possible to observe a variation in the original colour (PLA0) compared to the PLA samples that remained in the different types of soil, as shown in Table 6
V. M. L., Longatti, S. M. O., Moreira, F. M. S., & Sena Neto, A. R.
Table 5. Differential Scanning Calorimetry results.
Figure 4. DSC curves for PLA samples.
Figure 5. FTIR spectra obtained for the different PLA samples.
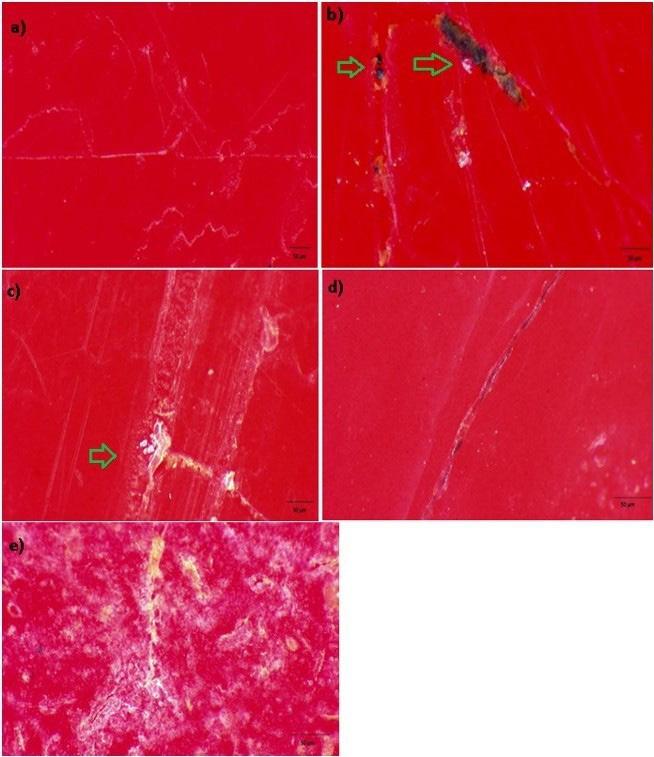
Images obtained by optical microscopy for the PLA samples. (a) PLA0 sample; (b) PLAJ90 sample; (c) PLAA90 sample; (d) PLAJ180 sample; (e) PLAA180 sample. The arrows indicate the points that stood out, indicating fouling, microorganism colony formation, and surface scaling.
Table 6. Mean and standard deviation of delta (L, a, b and E) results.
Figure 6.
4. Conclusions
The highest rates of biodegradation of PLA in this study were observed on the surfaces of the material through the appearance of fissures, cracks, flaking and colour change, as well as greater functional groups that indicated surface degradation. Within the terms and conditions of this work, samples buried in different soils did not have significant changes in thermal and mechanical properties. This indicates that there was no significant biodegradation in the internal structures of the samples.
Under conditions of an average ambient temperature of 24 °C, humidity of approximately 60%, pH between 5.1 and 7.0 and the types of soil in which the experiment was carried out, greater biodegradation did not occur. Greater degradation may occur under more controlled conditions of temperature and humidity, in the presence of biological indicators of soil quality, or especially, over a longer period.
Therefore, PLA needs favourable composting conditions and a longer period when discarded in landfills or in inappropriate places. As a possible recommendation, recycling or disposal should be carried out in suitable environments; otherwise, PLA waste can accumulate in the environment, causing future pollution problems.
5. Author Contribution
● Conceptualization – Alfredo Rodrigues de Sena Neto.
● Data curation – Virginia Mendonça Lourenço Benhami; Alfredo Rodrigues de Sena Neto.
● Formal analysis – Virginia Mendonça Lourenço Benhami; Alfredo Rodrigues de Sena Neto; Silvia Maria de Oliveira Longatti; Fatima Maria de Souza Moreira.
● Funding acquisition: Alfredo Rodrigues de Sena Neto.
● Investigation – Virginia Mendonça Lourenço Benhami; Alfredo Rodrigues de Sena Neto.
● Methodology – Virginia Mendonça Lourenço Benhami; Alfredo Rodrigues de Sena Neto; Fatima Maria de Souza Moreira; Silvia Maria de Oliveira Longatti.
● Project administration – Virginia Mendonça Lourenço Benhami; Alfredo Rodrigues de Sena Neto.
● Resources – Virginia Mendonça Lourenço Benhami; Fatima Silvia Maria de Oliveira Longatti; Alfredo Rodrigues de Sena Neto.
● Software – Virginia Mendonça Lourenço Benhami; Alfredo Rodrigues de Sena Neto.
● Supervision – Virginia Mendonça Lourenço Benhami; Alfredo Rodrigues de Sena Neto.
● Validation – Virginia Mendonça Lourenço Benhami; Alfredo Rodrigues de Sena Neto; Silvia Maria de Oliveira Longatti; Fatima Maria de Souza Moreira.
● Visualization – Virginia Mendonça Lourenço Benhami; Alfredo Rodrigues de Sena Neto; Silvia Maria de Oliveira Longatti; Fatima Maria de Souza Moreira.
● Writing – original draft – Virginia Mendonça Lourenço Benhami.
● Writing – review & editing – Virginia Mendonça Lourenço Benhami; Silvia Maria de Oliveira Longatti; Alfredo Rodrigues de Sena Neto.
6. Acknowledgements
The authors acknowledge the support provided by FAPEMIG (APQ-00516-22); CNPq (425327/20183); CAPES, the Graduate Program in Environmental Engineering; Soil Microbiology Laboratory, in the Soil Science Department, Nanotechnology Laboratory, Wood Technology Laboratory, in the Biomaterials Engineering Department, all located at UFLA.
7. References
1 Silva, M. W. S. (2012). Desenvolvimento de compostos biodegradáveis EVA/resíduo de EVA/amido (Doctoral Dissertation). Universidade Federal de Campina Grande, Campina Grande.
2 Xiang, S., Feng, L., Bian, X., Li, G., & Chen, X. (2020). Evaluation of PLA content in PLA/PBAT blends using TGA. Polymer Testing, 81, 106211 http://doi.org/10.1016/j. polymertesting.2019.106211
3 Taib, N.-A. A. B., Rahman, M. R., Huda, D., Kuok, K. K., Hamdan, S., Bakri, M. K. B., Julaihi, M. R. M. B., & Khan, A. (2023). A review on poly lactic acid (PLA) as a biodegradable polymer. Polymer Bulletin, 80(2), 1179-1213 http://doi. org/10.1007/s00289-022-04160-y
4 Auras, R., Harte, B., & Selke, S. (2004). An overview of polylactides as packaging materials. Macromolecular Bioscience, 4 (9), 835-864 http://doi.org/10.1002/mabi.200400043 PMid:15468294.
5 Oladapo, B. I., Daniyan, I. A., Ikumapayi, O. M., Malachi, O. B., & Malachi, I. O. (2020). Microanalysis of hybrid characterization of PLA/cHA polymer scaffolds for bone regeneration. Polymer Testing , 83 , 106341 . http://doi. org/10.1016/j.polymertesting.2020.106341
6 Reis, I. A., Claro, P. I. C., Marcomini, A. L., Mattoso, L. H. C., Silva, S. P., & Sena Neto, A. R. (2021). Annealing and crystallization kinetics of poly (lactic acid) pieces obtained by additive manufacturing. Polymer Engineering and Science, 61(7), 2097-2104 http://doi.org/10.1002/pen.25737
7 Wang, X., Jiang, M., Zhou, Z., Gou, J., & Hui, D. (2017). 3D printing of polymer matrix composites: A review and prospective. Composites. Part B, Engineering, 110, 442-458 http://doi.org/10.1016/j.compositesb.2016.11.034
8 Choong, Y. Y. C., Tan, H. W., Patel, D. C., Choong, W. T. N., Chen, C.-H., Low, H. Y., Tan, M. T., Patel, C. D., & Chua, C. K. (2020). The global rise of 3D printing during the COVID-19 pandemic. Nature Reviews. Materials, 5(9), 637-639 http:// doi.org/10.1038/s41578-020-00234-3 PMid:35194517.
9 Karamanlioglu, M., & Robson, G. D. (2013). The influence of biotic and abiotic factors on the rate of degradation of poly (lactic) acid (PLA) coupons buried in compost and soil. Polymer Degradation & Stability, 98(10), 2063-2071 http:// doi.org/10.1016/j.polymdegradstab.2013.07.004
10. Andrade, M. F. C., Souza, P. M., Cavalett, O., & Morales, A. R. (2016). Life cycle assessment of poly (lactic acid) (PLA): comparison between chemical recycling, mechanical recycling and composting. Journal of Polymers and the Environment, 24(4), 372-384 http://doi.org/10.1007/s10924-016-0787-2
11 Bher, A., Mayekar, P. C., Auras, R. A., & Schvezov, C. E. (2022). Biodegradation of Biodegradable Polymers in Mesophilic Aerobic Environments. International Journal of
Biodegradation of poly(lactic acid) waste from 3D printing
Molecular Sciences, 23(20), 12165 http://doi.org/10.3390/ ijms232012165 PMid:36293023.
12 Devi, R. S., Kannan, V. R., Natarajan, K., Nivas, D., Kannan, K., Chandru, S., & Antony, A. R. (2016). The role of microbes in plastic degradation. In R. Chandra (Ed.), Environ waste manage (pp. 341-370). USA: CRC Press
13 Kale, G., Kijchavengkul, T., Auras, R., Rubino, M., Selke, S. E., & Singh, S. P. (2007). Compostability of bioplastic packaging materials: an overview. Macromolecular Bioscience, 7(3), 255277. http://doi.org/10.1002/mabi.200600168. PMid:17370278.
14 Haider, T. P., Völker, C., Kramm, J., Landfester, K., & Wurm, F. R. (2019). Plastics of the future? The impact of biodegradable polymers on the environment and on society. Angewandte Chemie International Edition in English, 58(1), 50-62 http:// doi.org/10.1002/anie.201805766 PMid:29972726.
15 Shah, A. A., Hasan, F., Hameed, A., & Ahmed, S. (2008). Biological degradation of plastics: a comprehensive review. Biotechnology Advances, 26(3), 246-265. http://doi.org/10.1016/j. biotechadv.2007.12.005 PMid:18337047.
16 Nofar, M., Sacligil, D., Carreau, P. J., Kamal, M. R., & Heuzey, M.-C. (2019). Poly (lactic acid) blends: Processing, properties and applications. International Journal of Biological Macromolecules, 125, 307-360 http://doi.org/10.1016/j. ijbiomac.2018.12.002 PMid:30528997.
17 Campos, A., Marconato, J. C., Martins-Franchetti, S. M., Agnelli, J. A. M., & Monteiro, M. R. (2007). Biodegradation of blend films in soil and soil with chorume. I. PVC/PCL. Research Journal of Biotechnology, 2(4), 20-25
18 De Carvalho, J. C., Woiciechowski, A. L., Sanchuki, C. E., Walter, A., Letti, L., & Soccol, C. (2006). Compostagem de resíduos agroindustriais. In J. L. Bicas, M. R. Maróstica Júnior, & G. M. Pastore (Eds.), Biotecnologia de alimentos (pp. 91-118). São Paulo: Atheneu http://doi.org/10.13140/ RG.2.1.2033.0405.
19 Luzi, F., Fortunati, E., Puglia, D., Petrucci, R., Kenny, J. M., & Torre, L. (2015). Study of disintegrability in compost and enzymatic degradation of PLA and PLA nanocomposites reinforced with cellulose nanocrystals extracted from Posidonia Oceanica. Polymer Degradation & Stability, 121, 105-115 http://doi.org/10.1016/j.polymdegradstab.2015.08.016
20 Vance, E. D., Brookes, P. C., & Jenkinson, D. S. (1987). An extraction method for measuring soil microbial biomass C. Soil Biology & Biochemistry, 19(6), 703-707 http://doi. org/10.1016/0038-0717(87)90052-6
21 Alef, K. (1995). Enrichment, isolation and counting of soil microorganisms. In P. Nannipieri, & K. Alef (Eds.), Methods in applied soil microbiology and biochemistry (pp. 123-191). UK: Academic Press http://doi.org/10.1016/B978-0125138406/50019-7
22 Anderson, T.-H., & Domsch, K. H. (1993). The metabolic quotient for CO2 (qCO2) as a specific activity parameter to assess the effects of environmental conditions, such as pH, on the microbial biomass of forest soils. Soil Biology & Biochemistry, 25(3), 393-395 http://doi.org/10.1016/00380717(93)90140-7
23 ASTM International ASTM D790-17 - Standard Test Methods for Flexural Properties of Unreinforced and Reinforced Plastics and Electrical Insulating Materials. West Conshohocken: ASTM International; 2017
24 Garlotta, D. (2001). A literature review of poly (lactic acid). Journal of Polymers and the Environment, 9(2), 63-84 http:// doi.org/10.1023/A:1020200822435
25 Ferreira, M. D., & Spricigo, P. C. (2017). Colorimetriaprincípios e aplicações na agricultura. In M. D. Ferreira (Ed.), Instrumentação pós-colheita em frutas e hortaliças (pp. 208-220). São Carlos: Embrapa Instrumentação. Retrieved in 2023, October 17, from http://www.alice.cnptia.embrapa.br/ alice/handle/doc/1084379
26 França, G., Mendoza, Z., Borges, P., Mata, V., & Souza, E. (2019). Parâmetros colorimétricos no sistema CIELab para madeiras de florestas naturais. Enciclopédia Biosfera, 16(30), 140 http://doi.org/10.18677/EnciBio_2019B43
27 Janczak, K., Dąbrowska, G. B., Raszkowska-Kaczor, A., Kaczor, D., Hrynkiewicz, K., & Richert, A. (2020). Biodegradation of the plastics PLA and PET in cultivated soil with the participation of microorganisms and plants. International Biodeterioration & Biodegradation, 155, 105087 http://doi.org/10.1016/j. ibiod.2020.105087.
28 Moreira, F. M. S., & Siqueira, J. O. (2006). Microbiologia e bioquímica do solo Viçosa: Editora UFLA
29 Azim, K., Soudi, B., Boukhari, S., Perissol, C., Roussos, S., & Alami, I. T. (2018). Composting parameters and compost quality: a literature review. Organic Agriculture, 8(2), 141-158 http://doi.org/10.1007/s13165-017-0180-z
30 Zou, F., Sun, X., & Wang, X. (2019). Elastic, hydrophilic and biodegradable poly (1, 8-octanediol-co-citric acid)/polylactic acid nanofibrous membranes for potential wound dressing applications. Polymer Degradation & Stability, 166, 163-173 http://doi.org/10.1016/j.polymdegradstab.2019.05.024
31 Eutionnat-Diffo, P. A., Chen, Y., Guan, J., Cayla, A., Campagne, C., Zeng, X., & Nierstrasz, V. (2019). Stress, strain and deformation of poly-lactic acid filament deposited onto polyethylene terephthalate woven fabric through 3D printing process. Scientific Reports, 9(1), 14333 http://doi.org/10.1038/ s41598-019-50832-7 PMid:31586147.
32 Fu, Y., Wu, G., Bian, X., Zeng, J., & Weng, Y. (2020). Biodegradation behavior of poly (butylene adipate-coterephthalate) (PBAT), poly (lactic acid) (PLA), and their blend in freshwater with sediment. Molecules, 25(17), 3946 http://doi.org/10.3390/molecules25173946 PMid:32872416.
33 Arrigo, R., Bartoli, M., & Malucelli, G. (2020). Poly (lactic acid)–biochar biocomposites: effect of processing and filler content on rheological, thermal, and mechanical properties. Polymers, 12(4), 892 http://doi.org/10.3390/polym12040892 PMid:32290601.
34 Kalita, N. K., Nagar, M. K., Mudenur, C., Kalamdhad, A., & Katiyar, V. (2019). Biodegradation of modified Poly (lactic acid) based biocomposite films under thermophilic composting conditions. Polymer Testing, 76, 522-536 http:// doi.org/10.1016/j.polymertesting.2019.02.021
35 Gupta, A. P., & Kumar, V. (2007). New emerging trends in synthetic biodegradable polymers–Polylactide: a critique. European Polymer Journal, 43(10), 4053-4074 http://doi. org/10.1016/j.eurpolymj.2007.06.045
Received: Oct. 17, 2023 Accepted: Mar. 06, 2024
New bioresorbable filaments for scaffolds intending local sodium alendronate release
Olivia Deretti1*
, Guilherme Tait2 , Lucas Werner3 , Luana Engelmann2 , Denise
Abatti Kasper Silva1
and Ana Paula Testa Pezzin1
1 Laboratório de Materiais, Programa de Mestrado em Engenharia de Processos,Universidade da Região de Joinville – UNIVILLE, Joinville, SC, Brasil
2 Laboratório de Materiais, Departamento de Engenharia Química, Universidade da Região de Joinville – UNIVILLE, Joinville, SC, Brasil
3 Laboratório de Materiais, Departamento de Engenharia Mecânica, Universidade da Região de Joinville – UNIVILLE, Joinville, SC, Brasil
*oliviaderetti@hotmail.com
Obstract
Scaffolds with osteoconductivity, biocompatibility and good mechanical properties are promising for local drug release of sodium alendronate (ALN), a first-choice drug for treatment of bone tissue diseases, with low bioavailability. The viability to manufacture poly (L-lactic acid) (PLLA)/poly (methyl methacrylate) (PMMA) filaments containing ALN in different proportions, through extrusion, followed by scaffolds using 3D printing by fusion deposition modelling (FDM) and to investigate the influence of processes in mixtures drove this study. Differential scanning calorimetry (DSC), spectroscopy in the infrared region with Fourier transform (FTIR/ATR), and X-ray diffractometry (XRD) analysis indicated that PMMA decelerates crystallinity and confers malleability to PLLA/ALN mixture, besides its good processability and miscibility with PLLA and no relevant changes in physicochemical properties of components. Field emission scanning electron microscopy (SEM/FEG) showed good interfacial compatibility between PLLA/PMMA and homogeneously dispersed drug crystals in matrix. PLLA-PMMA-ALN scaffolds were manufactured by accurate with interesting properties for bone tissue engineering.
Keywords: filaments characteristics, polyesters, second generation bisphosphonate.
How to cite: Deretti, O., Tait, G., Werner, L., Engelmann, L., Silva, D. A. K., & Pezzin, A. P. T. (2024). New bioresorbable filaments for scaffolds intending local sodium alendronate release. Polímeros: Ciência e Tecnologia, 34(2), e20240014. https://doi.org/10.1590/0104-1428.20230061
1. Introduction
Sodium Alendronate (ALN) is used to various bone tissue disorders such as osteoporosis, Paget disease, bone cancer and bone metastases[1]. This drug has a great affinity for the human bone matrix and can inhibit resorption and increase bone formation[1]. However, the ALN has low bioavailability (<1%) and requires high doses via oral or intravenous administration generating side effects.
The administration of medication at the local level can minimize negative effects[2], reduce the dosages to required therapeutic levels, increase patient compliance, and improve the patient’s quality of life[3]. Scaffolds with osteoconductivity and osteoinductivity are promising alternatives to perform this function and solve challenges such as complex bone geometry, surgery needs, and risks of infection. The scaffolds must possess strong mechanical properties, biocompatibility, and degrade gradually while new tissue and extracellular matrix are formed and must have high porosity and interconnected pores[4]. They are a kind of implantable system that acts as a means of efficacy local drug administration resulting in high drug concentrations
at the site of interest, reducing systemic drug exposure[5] been classified as a pharmaceutical dosage forms and medical devices[6]
Three-dimensional printing (3DP) is a modern way to produce scaffolds incorporating drugs and the fusion deposition modeling (FDM) method, a regular process that allows fabricate different structures design with interconnected macropore sizes according to demands[2] This method dispenses solvents and is low-cost[7]. For the 3D printer, filaments produced from pure, or a mixture of materials feed the printer and enable continuous process but can also degrade the components[8]. A key point is to select appropriate parameters[8,9] such as screw speed, extruder feed, and temperature are crucial, as well as incorporating flow agents to increase the component fluidity index[10,11] .
PLLA is one of the most used materials in FDM-3DP due to its easy-to-process properties by extrusion, high mechanical resistance, and low thermal expansion coefficient[12]. It has been approved by the American regulatory agencies (FDA) and European Medicine Agency (EMA) for application in
Deretti,
O., Tait, G., Werner, L., Engelmann, L., Silva, D. A. K., & Pezzin, A.
pharmaceutical and medicinal areas, notably because it is bioresorbable, biocompatible, and has low immunogenicity[13,14]
To improve thermomechanical and flow properties and regulate PLLA crystallization, poly (methyl methacrylate) (PMMA) is an alternative due to the compatibility between them and because its mixture can structure a mechanical entanglement of molecular chains after fusion[15]. The PMMA is hydrophobic, resistant to hydrolysis and is excreted without harmful effect to the human body. Due to its good mechanical properties, low cost, excellent biocompatibility and processability, PMMA has been widely adopted as bone cement. Moreover, PMMA deposition on orthopedic implants improves mechanical fixation and biological performance[16] .
This work aimed to develop PLLA-PMMA-ALN filaments by extrusion and test the production of scaffolds via FDM-3DP. Seeking to understand the behavior of the blends and the influence of melting processing on the thermal stability of the mixtures, the filaments and scaffolds were characterized. The effort was to produce a dosage form for local administration of ALN, using relatively simple and innovative techniques such as extrusion and 3DP. As far as research has been carried out, there is no study using PLLA-PMMA-ALN blend in extrusion processing and 3DP.
2. Materials and Methods
PLLA was obtained from Nature Works 3D850 (0.5% of isomer D; density of 1.24 g/cm3; 176 °C melting point; 9 g (10 min-1) to 210 °C with a load of 216 kg; average diameter of 2.8-2.9 mm), ALN trihydrate form was obtained from Alpex Healthcare Limited (Mw = 326,13 g/mol; 245 °C melting point) and PMMA was obtained from Sigma Aldrich (Mw = 15,000 g/mol; density 1.2 g/cm3).
In order to use all materials as a powder, PLLA was previously immersed in liquid nitrogen by 20 min and then inserted in a knife grinder per 5 min to obtain a thin powder[17] In regard to limit PLLA degradation by hydrolysis in the mixtures, ALN trihydrate form was dry at 150 °C by 1 h in a vacuum oven at 350 mmHg to remove its hydration waters and, consequently, conversion into its anhydrous form[18]
2.1 Extrusion
Previously with each filament production, the samples were dried at 60 °C in a vacuum oven at 350 mmHg by 1 h for moisture removal and then inserted in a simply threaded mini extruder (Filmaq 3D CV). To produce the filaments. screw speed and nozzle temperature were maintained at 30 rpm and 185°C, respectively, for all the samples.
2.2 3D printing
The object model to be printed was obtained through 3D modeling software (Fusion 360, USA) and stored in STL file format. Slicing software (Ultimaker Cura, Netherlands) was used to plan the printing procedure; the file was saved to “G code” and imported into the 3D printer. A porous disc scaffolds were made on a 3D Printer (Creality CR-10S Pro brand) using the following print parameters: diameter: 25 mm, Mesh size: 1.5 mm and thickness:0.8 mm, at 180 °C
P. T.
print temperature, 80 mm/s printing speed, 55 °C table temperature and 100% flow.
2.3
Techniques used for characterization
Filament and scaffolds samples were previously ground in a knife grinder, were analyzed by attenuated total reflectance infrared region with Fourier transform (ATR-FT-IR) (Frontier, Perkin Elmer) in the range of 4000400 cm-1, with a resolution of 4 cm-1 and were an average of 32 repeated scans at room temperature.
Differential exploratory calorimetry (DSC) (DSC Q20, TA Instruments) curves were obtained under N2 flow, employing sealed aluminum capsules containing about 5 mg of sample that were kept under heating from 25 to 200 °C, 1 min isotherm, a slow cooling up to -70 °C and a new heating up to 200 °C at a rate of 10 ° C min-1. Given that PMMA possesses an amorphous structure and PLLA represents the principal component of mixtures, Equation 1[19] was employed to calculate the degree of polymer crystallinity (Xc) in the samples:
where ∆H m is the melting enthalpy, ∆Hm ° is the fusion enthalpy standard of a crystallinity sample of 100% and φ is the mass fraction of the polymer in the samples. PLLA standard melting enthalpy (∆Hm) is 93.7 J/g[20]. Samples presenting more than one melting enthalpy, the total value in the equation (∆Hm 1+∆Hm2+∆Hm3+∆Hm4) is inserted.
Previously cut into small pieces, were analyzed by X-ray diffractometry (DRX) (D8 Advance Eco, Bruker) in the two theta 2θ range from 2 to 50° range using an increase step 0.1 and permanence time of 1 sec at each step, in steps of 0.01°, at an accelerating voltage of 40 kV and a current of 25 mA under speed of 2° min-1
The filaments and scaffolds were cut into small pieces and prepared on carbon tape with gold deposition on their surface, creating a conductive film of electrons. The recovered samples were analyzed in the Scanning Electron Microscope with Field Emission (SEM-FEG) (Jeol, SM-71510 model) with a 10 kV electron-emitting beam. Measure of the pore size of the scaffolds occurred through the ImageJ software. Each mean diameter and standard deviation of filaments were obtained from the arithmetic average (5 measurements) in diameter at distant locations along the filaments with a digital caliper. To determine the average diameter of scaffold pores, Scaffold 1 took two measurements in each of the six pores visible in SEM-FEG image in 3 different micrographs; Scaffold 2 took two measurements in each of the two pores of 3 different photos.
3. Results and Discussions
A previous study found evidence of compatibility among binary and ternary physical mixtures of PLLA, PMMA, and drug polymers[21]. It showed the viability of producing filaments.
Table 1 shows that pure PLLA filament and Filaments 1, 5, and 9 have the lowest standard deviation values, indicating
New bioresorbable filaments for scaffolds intending local sodium alendronate release
a more constant diameter when compared to the filaments containing ALN, resulting from the favorable processability and miscibility of the PLLA-PMMA mixture.
The filaments containing ALN exhibited greater diameter measurement amplitudes and a mean value deviation of up to 0.29 mm from the standard extruder nozzle diameter (1.75 mm). It suggests that the extruder model utilized, with only one heating and feeding zone, may not be the most appropriate for these blends. The drug, with a Tm of 262 °C, higher than the processing temperature of 185 °C, is not melted with the other components, resulting in solid domains that increase shear stresses[22], making flow challenging during extrusion.
Significant variations in filament diameter can influence the subsequent 3D printing process of scaffolds, causing inconsistencies in the printed scaffold[23]. Concerning images of the manufactured filaments, Figure 1, the PLLA pure filament has an opaque white surface while PLLA-PMMA filaments have a lighter and more transparent appearance, suggesting miscibility, which is consistent with the diameter analysis of filaments. The presence of ALN turns the filaments whiter and opaque (trend of red arrows) as the amount of the drug increases. Filaments containing 20% and 25% of PMMA showed greater flexibility than other wires.
To monitor the impact of processing on filament degradation, Figure 2 in analysis demonstrated that the
870 cm-1 band, representing the crystalline area of PLLA[24] , declined with a percentual increase of PMMA into the filaments (Figure 2A). Therefore, this polymer plays a role in decreasing the crystallinity of PLLA.
Most bands in the polymeric matrix remained in similar regions with no changes in chemical structure. However, the intensity of PLLA bands at 1750, 1128, and 1047 cm-1 (C=O) [18] and 1084 cm-1 (C-O-C)[25] (Figures 2B, 2C, and 2D) tend to increase with the incorporation of ALN. It is due to the presence of water molecules in the drug, which induces hydrolysis polymer degradation, and the contribution of thermal degradation during processing, which induces PLLA depolymerization[22]. Shortening polylactide molecules results in the formation of new carboxylic acid groups and affect the relative contributions of carbonyl (C=O), carboncarbonyl-oxygen (C-CO-O), and oxygen-carbon-carbonyl (O-C-CO) groups. It was an effect observed in a preliminary compatibility study of the PLLA-ALN mixture[21]
The PMMA’s typical bands at 1239 cm-1 (C-O), 1063, 987 and 841 cm-1 (C-C) and 1147 cm-1 (C-O-C)[24] were not observed in filaments (Figure 2B, 2C and 2D), partly due to the low intensity of these bands and the percentage of polymer in the filament (15-25%), and overlapping the intense PLLA band at 1084 cm-1 (C-O-C)[25]. Related to the stretching of the symmetric angular deformation group of
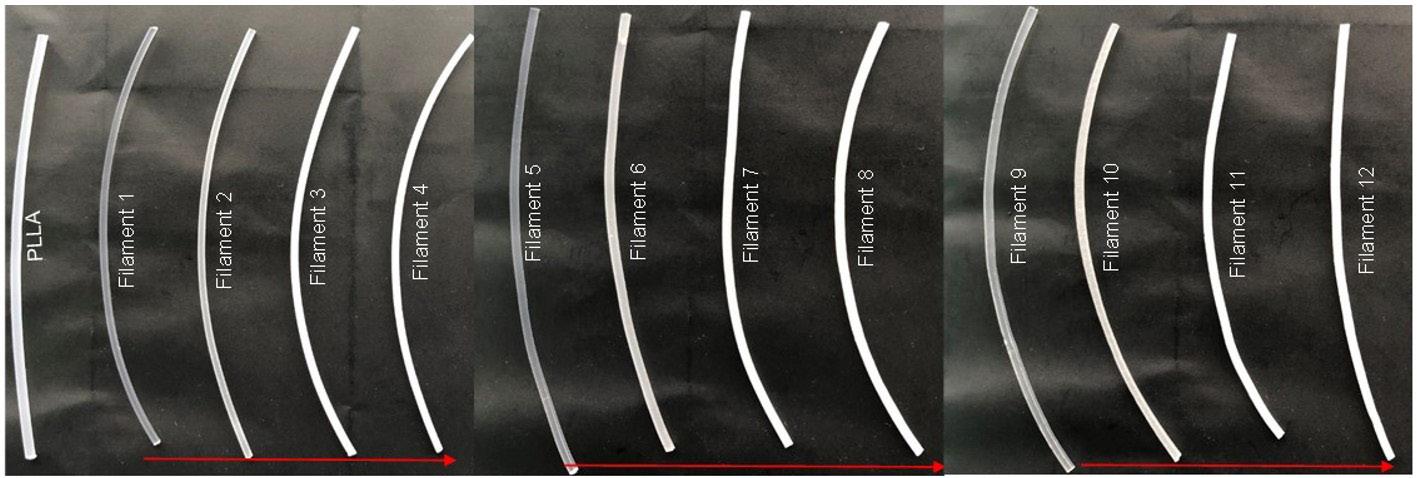
Figure 1. Images of the PLLA-PMMA filaments produced without and with ALN.
Table 1. The filaments nomenclature, composition, and mean diameter.
Deretti, O., Tait, G., Werner, L., Engelmann, L., Silva, D. A. K., & Pezzin, A. P. T.
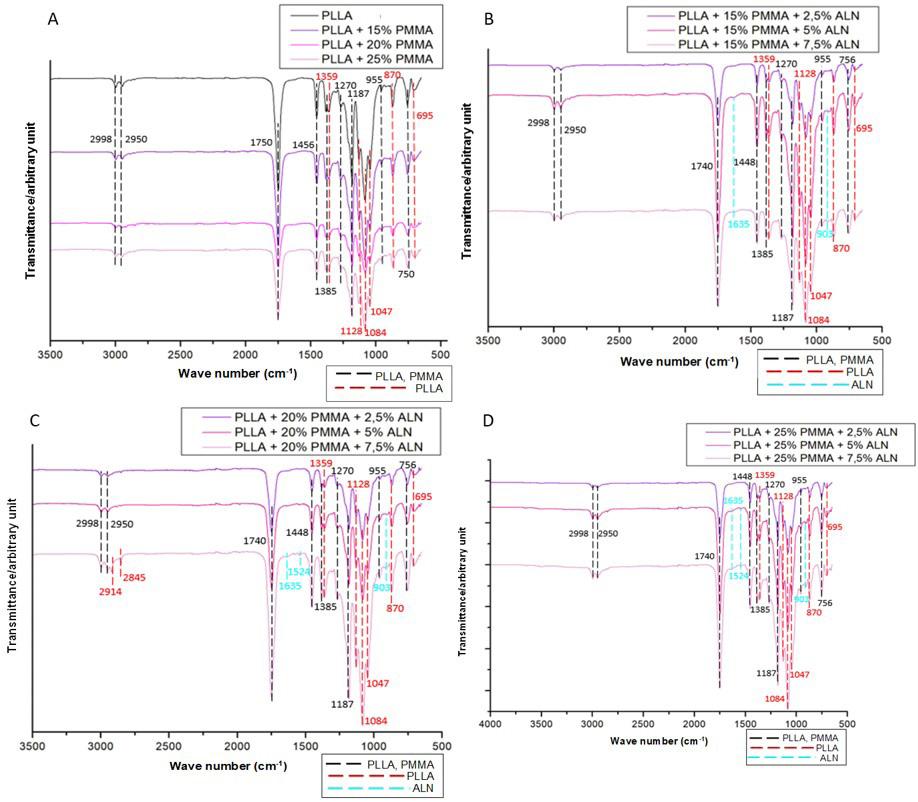
Figure 2. FTIR spectra obtained for the filaments produced. FTIR spectra of filaments: (A) PLLA containing 15, 20 and 25% of PMMA; (B) PLLA containing 15% of PMMA and different amounts of ALN; (C) PLLA containing 20% of PMMA and different amounts of ALN; (D) PLLA containing 25% of PMMA and different amounts of ALN.
PLLA are the bands at 2914 and 2845 cm-1 (Figure 2C)[25,26] Based on this, the extruded did not show any blunt effects on the main functional groups of polymers, especially on PLLA.
In the filaments containing 5 and 7.5% ALN presented low absorption bands at 1635, 1524, and 903 cm-1 [27] (Figure 2B, 2C, and 2D), indicating the presence of drug crystals on their surface. These PLLA bands at 870 cm-1 are different from bands identified in the presence of PMMA. In this case, it increases with the incorporation of ALN, indicating its role as a nucleating agent[27]. Regarding the impact of extrusion on the filaments, Table 2 presents the data obtained from the DSC curves.
Pure PLLA filament exhibited T m and T g values (176.7 °C and 59.2 °C) that were like those observed for the untreated polymer (175.5 °C and 58.4 °C), suggesting that extrusion processing had insignificant effects on the thermal properties of PLLA. The filament with 25% PMMA exhibited the lowest melting point, resulting in a higher flow rate and facilitating melting processing[28].
The degree of crystallinity of the pure PLLA filament (19.4%) was slightly above the one found for gross material (13.4%), suggesting a favorable condition for crystal grow[29]
A progressive PMMA incorporation reduces the ∆Hm, and for filaments containing 20 and 25% of PMMA the
second exothermic peak disappeared, which can be explained by PMMA’s effect of restricting PLLA crystallization[30] . This result corroborates the reduction in T g and the greater flexibility that these filaments showed. PLLA and Diphenylisocyanate (MDI) composites, processed by injection, showed similar T g results[25]
The filament containing 15% PMMA and 5% ALN showed a decrease in crystallinity (20.9%) to the filament with 15% PMMA and 7.5% ALN (14.5%), despite the higher drug content. The domains of solid ALN’s particles in the matrix may explain this reduction due to the formation of PLLA shapeless crystallites[31]. Filaments containing 25% PMMA and ALN also showed a slight decrease in crystallinity and melting enthalpy compared to filaments without ALN. A similar phenomenon was observed with the interfacial interaction of E-44 with the polymeric matrix (PET/PA-6), favoring nucleation but decreasing crystal growth[32]
Filaments containing 20% PMMA and either 5% or 7.5% ALN presented an increase in both crystallinity and ∆H m relative to the filament that contained only PMMA. This outcome is expected with higher drug content; as higher crystallinity requires more energy during crystal fusion[18]. Filaments containing 15%, 20%, and 25% PMMA, with an increasing incorporation of ALN, exhibited
New bioresorbable filaments for scaffolds intending local sodium alendronate release
comparable Tm and T g values. The lack of significant changes in Tm and T g suggests no molecular interactions between the components during the extrusion process[13] , and the drug had no direct effect on the thermal stability of the polymeric matrix.
The diffractograms obtained for the filaments (Figure 3) show for pure PLLA filament prominent peaks at 16° and 19°, with less intense peaks at 15° and 22°, similar to another study for PLLA/nHA filaments[33]. This result suggests increased crystallinity relative to the pure PLLA
Table 2. Summary of Tg, Tm, Tc, ∆Hm, ∆Hc and X c values obtained from the DSC curves of the filaments produced.
Filament
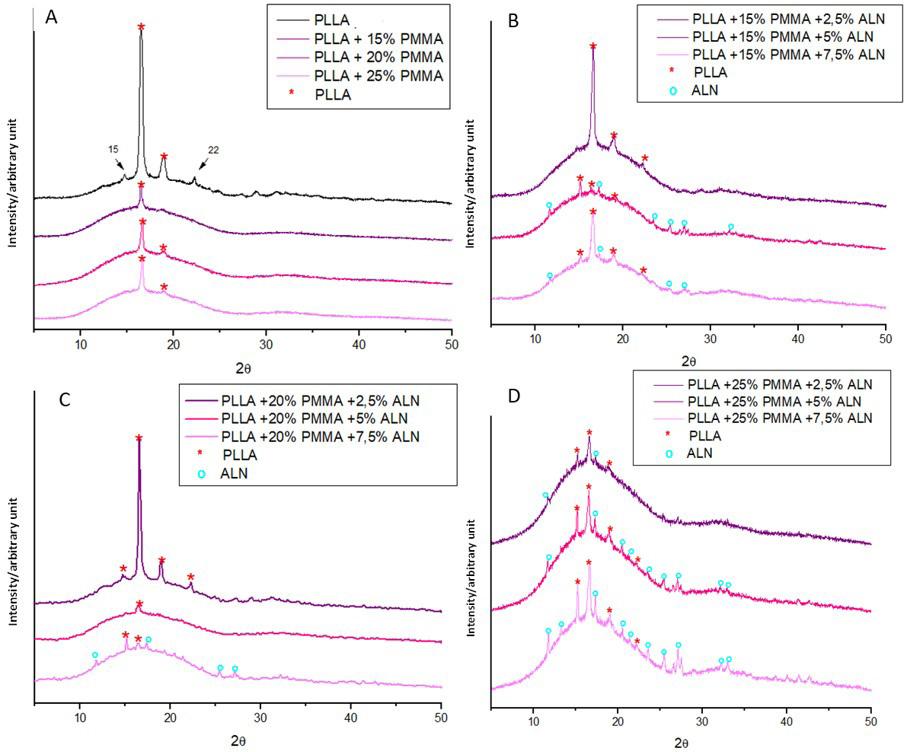
Figure 3. Diffractogram obtained for the produced filaments. *Diffractogram of filaments: (A) PLLA containing 15, 20 and 25% of PMMA; (B) PLLA containing 15% of PMMA and different amounts of ALN; (C) PLLA containing 20% of PMMA and different amounts of ALN; (D) PLLA containing 25% of PMMA and different amounts of ALN.
Deretti, O., Tait, G., Werner, L., Engelmann, L., Silva, D. A. K., & Pezzin, A. P. T.
presented in the DSC analysis. The presence of PMMA in filaments increases the amorphous halo, keeping in line with the FTIR and DSC results. All filaments exhibited a semi-crystalline nature (figures-3B, 3C, and 3D) with the presence of ALN peaks in the filaments containing 5 and 7.5% of the drug and 15% PMMA. The lack of these peaks in the filament with only 2.5% of ALN can be explained by the low concentration of the drug, with its crystalline region below the detection limits of the assay[9].
Filaments with 20% PMMA exhibit ALN peaks exclusively in the filament containing 7.5% ALN. The filament with 5% ALN did not show these peaks, even though the FTIR spectrum and SEM-FEG images suggested the presence of the drug. These results indicate that there were no drug crystals on the surface in the analyzed sample, as XRD analysis lacks the ability to detect crystals in the sample’s penetration depth[34] Filaments containing 25% PMMA show a notable rise in PLLA characteristic peaks as drug concentration increases. ALN, a nucleation agent, hindering molecular chain movement and inducing polymeric matrix crystallinity[35]. These results contradict the crystallinity found in the DSC analysis.
Through visual analysis and in SEM-FEG, Figure 4 (red arrows), white crystals ALN were observable in the 5 to 7.5%
ALN filaments, confirming its homogeneous dispersion on those surfaces and by results where ALN bands appear on the filaments. As the concentration of ALN increases, the roughness and deformations (highlighted in red) also increase. This finding aligns with the results obtained from visual and diameter analyses of the filaments.
Pure PLLA filament exhibits a smooth surface without substantial deformation (figure -4A), observed during the PLA/F68 implant production[4]. Furthermore, the surface of PLLA-PMMA filaments becomes smoother and without roughness as the percentage of PMMA increases, showing good interfacial compatibility[30]. The ability of PMMA to facilitate flow during extrusion and the miscibility of the PLLA/PMMA blend are the answers.
Considering that filaments containing 25% PMMA showed: i) more constant diameter facilitating 3DP processing; ii) greater material flexibility and processability and iii) lower crystallinity degree when compared to other ALN filaments, which positively impacts the mechanical properties and the degradation rate of the polymeric matrix, filament 10 (25% PMMA+2.5% ALN) and filament 12 (25% PMMA+7.5% ALN) were selected for scaffolds 3DP, Figure 5
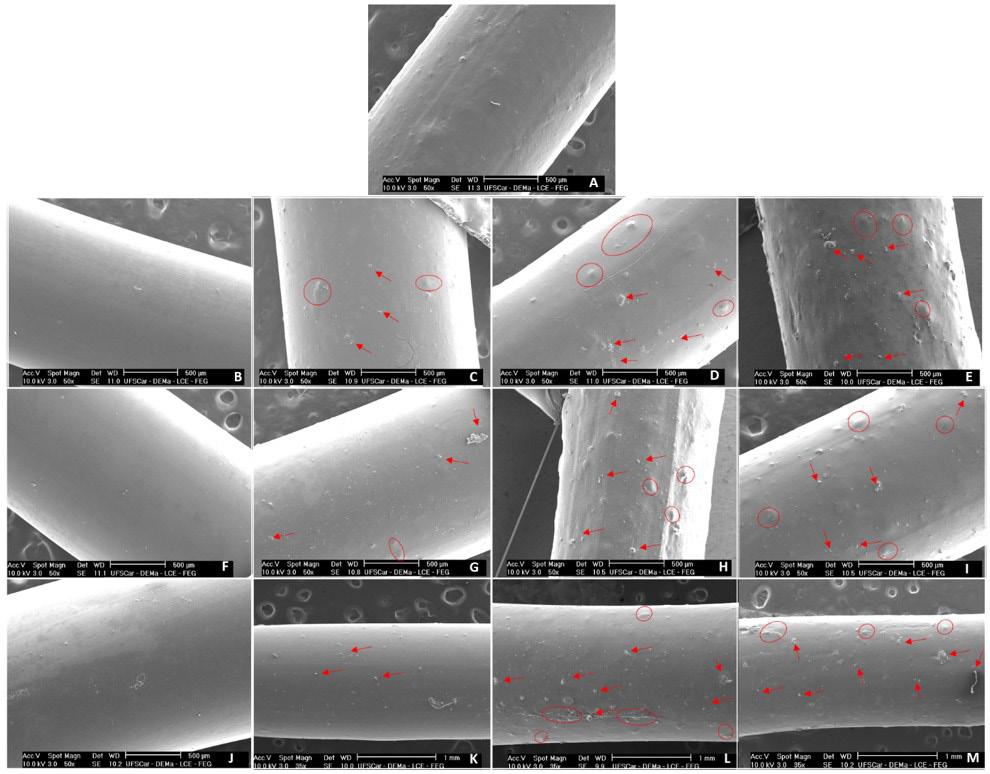
(A) PLLA; (B) PLLA+15%PMMA; (C) PLLA+15%PMMA+2.5%ALN; (D) PLLA+15%PMMA+5%ALN; (E) PLLA+15%PMMA+7.5%ALN; (F) PLLA+20%PMMA; (G) PLLA+20%PMMA+2.5%ALN; (H) PLLA+20%PMMA+5%ALN; (I) PLLA+20%PMMA+7.5%ALN; (J) PLLA+25%PMMA; (K) PLLA+25%PMMA+2.5%ALN; (L) PLLA+25%PMMA+5%ALN; (M) PLLA+25%PMMA+7.5%ALN.
Figure 4. Micrographs of the PLLA-PMMA filaments obtained by SEM-FEG. SEM images of filaments:
New bioresorbable filaments for scaffolds intending local sodium alendronate release
Scaffolds presented geometry according to the design. Scaffold 1 has a stable structure without deformations, while scaffold 2 shows remnants of the polymer adhered to its surface. The filament diameter variation was responsible for printing inconsistencies[23]
From the SEM images in Figure 6, it is possible to observe that the scaffolds have a porous structure (arrows in Figure 6A and 6C) regular and connected, and drug crystals (arrows in Figure 6B and 6D) dispersed relatively homogeneously in both scaffolds. A homogeneous dispersion
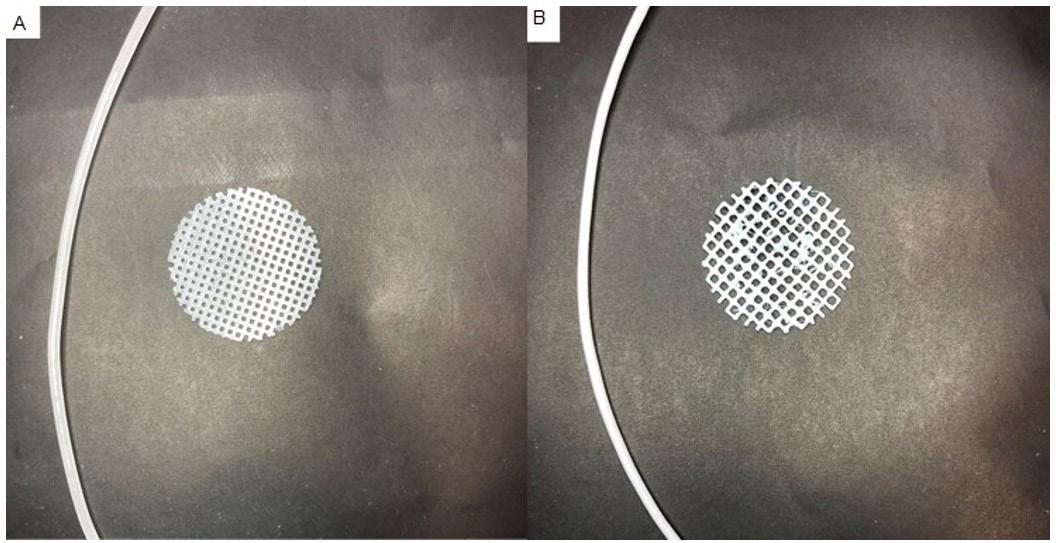
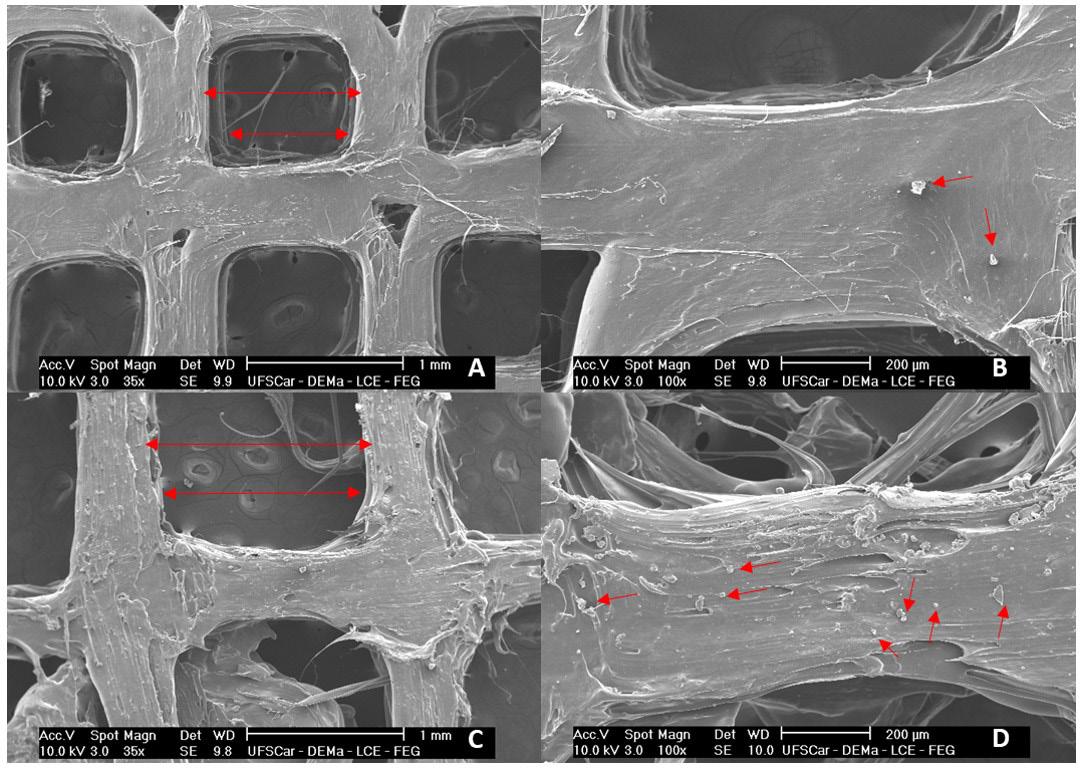
Figure 5. Scaffolds images produced from filament 10 containing 25% PMMA and 2.5% ALN (A) and filament 12 containing 25% PMMA and 7.5% ALN (B).
Figure 6. The SEM-FEG micrographs from scaffolds 1 and 2. SEM images of scaffolds: scaffold 1 (PLLA+25%PMMA+2.5%ALN) with bar = 1mm (A) and bar = 200 µm (B); scaffold 2 (PLLA+25%PMMA+7.5%ALN) with bar = 1 mm (C) and bar = 200 µm (D).
Deretti, O., Tait, G., Werner, L., Engelmann, L., Silva, D. A. K., & Pezzin, A. P. T.
of crystals is important because the presence of crystal clusters can concentrate tension points on the structure which leads to fragility of material[17]. Scaffold 2 showed increased surface roughness and deformations due to its higher drug concentration.
Considering the diameter of the pores, scaffold 1 showed an average diameter of 0.84 mm (840 µm), a value relatively close to the one determined (1 mm). For scaffold 2, the mean diameter obtained was 1.37 mm (1370 µm), short of the desired 1.5 mm. Both scaffolds presented micropores larger than 200 µm, that are considered ideal for bone regeneration[36]. Since a porous scaffold structure provides a biological environment that promotes cell adhesion, tissue proliferation and growth, and allows nutrient flow[37]
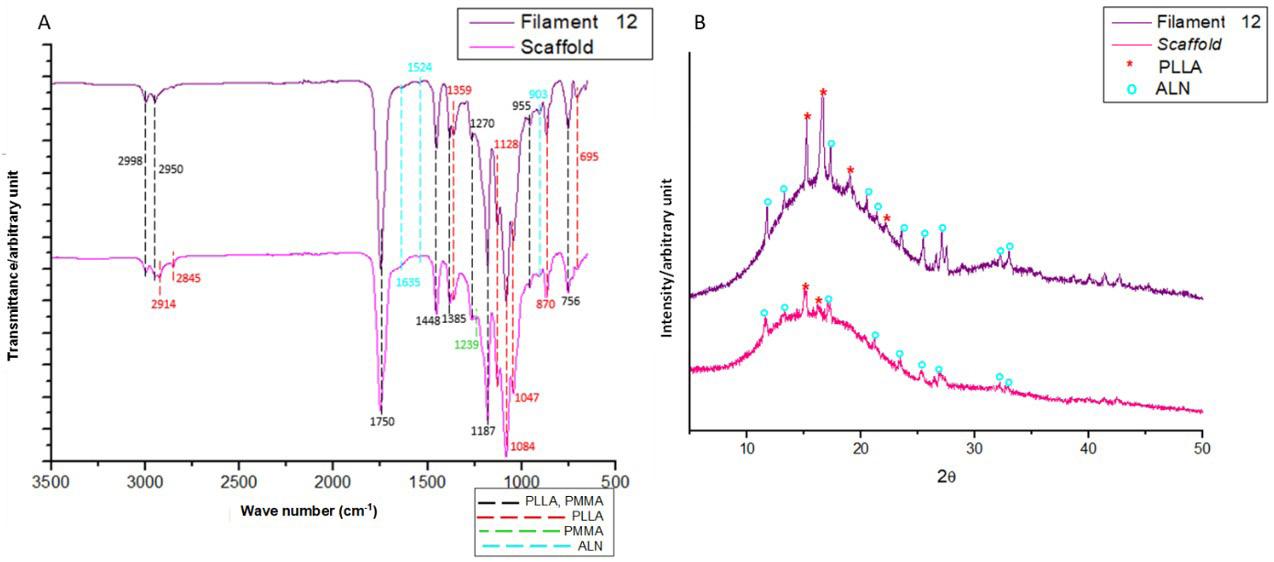
The scaffold results suggest that the amount of API used influences the 3DP process, which agrees with literature[38] . Applying porous diameter as a parameter, scaffold 2 is a more exciting alternative, being selected for investigation in the following analysis. Besides, the higher ALN content helps to analyze the effect of the FDM-3DP on the chemical, physical, and thermal material stability. Figure 7 presents the FTIR spectra and diffractograms obtained for filament 12 and scaffold 2.
The spectrum indicates that filament and scaffold exhibited similar behavior (Figure 7A). Notably, the PMMA band at 1239 cm-1 (C-O), absent in the filament, was visible in the scaffold at a low intensity. The appearance of this band might be related to the alteration in the intensity of PLLA bands at 1750 cm-1 (C=O), 1084 cm-1 (C-O-C), 1128, and 1047 cm-1 (C-O) in the scaffold. These bands are susceptible to change due to polymer degradation[26], probably caused by subsequent thermal degradation after extrusion and 3DP.
The scaffold presents bands at 2914 and 2845 cm-1 attributed to the stretching of PLLA symmetrical angular deformation group[25,26]. Furthermore, PLLA and ALN peaks are visible in both the scaffold and the filament (Figure 7B), wherein the reduction of these peaks indicates a relative decrease of crystallinity in the scaffold, contradicting the DSC analysis. From the DSC results, Table 3, filament and scaffold showed similar T m and T g values, suggesting no molecular interactions during 3D printing processing[13]. An increase from 7.1 to 11.6% in crystallinity was observed, indicating favored crystallinity in 3DP[29], as observed in extrusion. Composites of PLA and tricalcium phosphate processed by extrusion[39] with a similar behavior presented adequate mechanical properties for scaffolds. There was also an increase in ∆H m of 22.5 J/g in filament to 35.7 J/g in scaffold, an expected result because the bigger the crystallinity, more energy is consumed in the fusion of crystals, making it challenging to change the phase of polymeric matrix[17]
4. Conclusions
During extrusion, the properties of the components were maintained. The presence of ALN as solid crystals, attributed roughness, and deformations in filaments. It was also found that PMMA reduced crystallinity in the PLLA matrix and improved flow during processing and malleability to filaments. This result may positively influence the polymeric matrix’s mechanical properties and degradation rate in human body and assist in later 3DP processing. Based on set of results, the filaments containing 25%PMMA and 2.5% and 7.5% of ALN were selected to produce scaffolds.
Figure 7. FTIR (A) and diffractogram spectra (B) obtained for Filament 12 and Scaffold 2.
Table 3. Data obtained from DSC curves for filaments 12 and scaffold produced from it.
New bioresorbable filaments for scaffolds intending local sodium alendronate release
In the second part of the study, it was possible to produce PLLA/PMMA/ALN filaments by extrusion and scaffolds by accurate 3DP, mainly the PLLA+25%PMMA+7.5%ALN with good physicochemical properties for bone tissue engineering aiming at local drug release. Drug release studies from the mixtures presented here will be conducted in further papers.
5. Author’s Contribution
Conceptualization – Olivia Deretti; Denise Abatti Kasper Silva; Ana Paula Testa Pezzin.
Data curation – Olivia Deretti; Denise Abatti Kasper Silva; Ana Paula Testa Pezzin.
Formal analysis – Olivia Deretti; Lucas Werner; Luana Engelmann; Denise Abatti Kasper Silva; Ana Paula Testa Pezzin.
Funding acquisition – Denise Abatti Kasper Silva; Ana Paula Testa Pezzin.
Investigation – Olivia Deretti; Guilherme Tait; Lucas Werner.
Methodology – Olivia Deretti; Denise Abatti Kasper Silva; Ana Paula Testa Pezzin.
Project administration – Denise Abatti Kasper Silva; Ana Paula Testa Pezzin.
Resources – Lucas Werner; Denise Abatti Kasper Silva; Ana Paula Testa Pezzin.
Software – Lucas Werner.
Supervision – Olivia Deretti; Denise Abatti Kasper Silva; Ana Paula Testa Pezzin.
Validation – Olivia Deretti; Denise Abatti Kasper Silva; Ana Paula Testa Pezzin.
Visualization – Olivia Deretti; Denise Abatti Kasper Silva; Ana Paula Testa Pezzin.
Writing – original draft – Olivia Deretti.
Writing – review & editing – Olivia Deretti; Denise Abatti Kasper Silva; Ana Paula Testa Pezzin.
6. Acknowledgements
This research work was funded by the Coordination of Development of Higher-Level Personnel (CAPES). The authors are grateful to Department of Materials Engineering, Federal University of São Carlos, for help in performing XRD and SEM-FEG analysis.
7. References
1. Tarafder, S., & Bose, S. (2014). Polycaprolactone-coated 3D printed tricalcium phosphate scaffolds for bone tissue engineering: in vitro alendronate release behavior and local delivery effect on in vivo osteogenesis. ACS Applied Materials & Interfaces, 6(13), 9955-9965 http://doi.org/10.1021/ am501048n PMid:24826838.
2 Posadowska, U., Parizek, M., Filova, E., Wlodarczyk-Biegun, M., Kamperman, M., Bacakova, L., & Pamula, E. (2015). Injectable nanoparticle-loaded hydrogel system for local delivery of sodium alendronate. International Journal of Pharmaceutics, 485(1-2), 31-40 http://doi.org/10.1016/j. ijpharm.2015.03.003 PMid:25747455.
3 Mir, M., Ahmed, N., & Rehman, A. (2017). Recent applications of PLGA based nanostructures in drug delivery. Colloids and Surfaces. B, Biointerfaces, 159, 217-231. http://doi.org/10.1016/j. colsurfb.2017.07.038 PMid:28797972.
4 Li, D., Guo, G., Deng, X., Fan, R., Guo, Q., Fan, M., Liang, J., Luo, F., & Qian, Z. (2013). PLA/PEG-PPG-PEG/Dexamethasone implant prepared by hot-melt extrusion for controlled release of immunosuppressive drug to implantable medical devices, part 2: in vivo evaluation. Drug Delivery, 20(3-4), 134-142 http:// doi.org/10.3109/10717544.2013.801049 PMid:23745720.
5. Wang, Y., Sun, L., Mei, Z., Zhang, F., He, M., Fletcher, C., Wang, F., Yang, J., Bi, D., Jiang, Y., & Liu, P. (2020). 3D printed biodegradable implants as an individualized drug delivery system for local chemotherapy of osteosarcoma. Materials & Design, 186, 108336. http://doi.org/10.1016/j. matdes.2019.108336
6 Awad, A., Fina, F., Goyanes, A., Gaisford, S., & Basit, A. W. (2021). Advances in powder bed fusion 3D printing in drug delivery and healthcare. Advanced Drug Delivery Reviews, 174, 406-424 http://doi.org/10.1016/j.addr.2021.04.025 PMid:33951489.
7 Jamróz, W., Kurek, M., Łyszczarz, E., Brniak, W., & Jachowicz, R. (2017). Printing techniques: recent developments in pharmaceutical technology Acta Poloniae PharmaceuticaDrug Research, 74(3), 753-763 PMid:29513944.
8 Goole, J., & Amighi, K. (2016). 3D printing in pharmaceutics: a new tool for designing customized drug delivery systems. International Journal of Pharmaceutics, 499(1-2), 376-394 http://doi.org/10.1016/j.ijpharm.2015.12.071 PMid:26757150.
9 Goyanes, A., Allahham, N., Trenfield, S. J., Stoyanov, E., Gaisford, S., & Basit, A. W. (2019). Direct powder extrusion 3D printing: fabrication of drug products using a novel single-step process. International Journal of Pharmaceutics, 567, 118471 http://doi.org/10.1016/j.ijpharm.2019.118471 PMid:31252147.
10 Danda, L. J. A., Batista, L. M., Melo, V. C. S., Soares Sobrinho, J. L., & Soares, M. F. L. R. (2019). Combining amorphous solid dispersions for improved kinetic solubility of posaconazole simultaneously released from soluble PVP/VA64 and an insoluble ammonio methacrylate copolymer. European Journal of Pharmaceutical Sciences, 133, 79-85 http://doi.org/10.1016/j. ejps.2019.03.012 PMid:30890364.
11 Sayanjali, S., Sanguansri, L., Ying, D., Buckow, R., Gras, S., & Augustin, M. A. (2019). Extrusion of a curcuminoid-enriched oat fiber-corn-based snack product. Journal of Food Science, 84(2), 284-291 http://doi.org/10.1111/1750-3841.14432 PMid:30648743.
12 Domínguez-Robles, J., Martin, N. K., Fong, M. L., Stewart, S. A., Irwin, N. J., Rial-Hermida, M. I., Donnelly, R. F., & Larrañeta, E. (2019). Antioxidant PLA composites containing lignin for 3d printing applications: a potential material for healthcare applications. Pharmaceutics, 11(4), 165. http://doi. org/10.3390/pharmaceutics11040165 PMid:30987304.
13 Boetker, J., Water, J. J., Aho, J., Arnfast, L., Bohr, A., & Rantanen, J. (2016). Modifying release characteristics from 3D printed drug-eluting products. European Journal of Pharmaceutical Sciences, 90, 47-52 http://doi.org/10.1016/j.ejps.2016.03.013 PMid:26987609.
14 Tyler, B., Gullotti, D., Mangraviti, A., Utsuki, T., & Brem, H. (2016). Polylactic acid (PLA) controlled delivery carriers for biomedical applications. Advanced Drug Delivery Reviews, 107, 163-175 http://doi.org/10.1016/j.addr.2016.06.018 PMid:27426411.
15 Anakabe, J., Orue, A., Huici, A. M. Z., Eceiza, A., & Arbelaiz, A. (2018). Properties of PLA/PMMA blends with high polylactide content prepared by reactive mixing in presence
Deretti, O., Tait, G., Werner, L., Engelmann, L., Silva, D. A. K., & Pezzin, A. P. T.
of poly (styrene-co-glycidyl methacrylate) copolymer. Journal of Applied Polymer Science, 135(43), 46825 http:// doi.org/10.1002/app.46825
16 Camargo, E., Serafim, B. M., Cruz, A. F., Soares, P., Oliveira, C. C., Saul, C. K., & Marino, C. E. B. (2021). Bioactive response of PMMA coating obtained by electrospinning on ISO5832-9 and Ti6Al4V biomaterials. Surface and Coatings Technology, 412, 127033 http://doi.org/10.1016/j.surfcoat.2021.127033
17 Siqueira, A. (2018). Obtenção de scaffolds poliméricos baseados em poli (ácido láctico), hidroxiapatita e óxido de grafeno utilizado o método de manufatura aditiva por “fused deposition modelling” (Master’s dissertation). Universidade Presbitariana Mackenzie, São Paulo
18 Asnani, M., Vyas, K., Bhattacharya, A., Devarakonda, S., Chakraborty, S., & Mukherjee, A. K. (2009). Ab initio structure determination of anhydrous sodium alendronate from laboratory powder X-ray diffraction data. Journal of Pharmaceutical Sciences, 98(6), 2113-2121 http://doi.org/10.1002/jps.21561 PMid:18781644.
19 Silva-Buzanello, R. A., Souza, M. F., Oliveira, D. A., Bona, E., Leimann, F. V., Cardozo, L., Fo., Araújo, P. H. H., Ferreira, S. R. S., & Gonçalves, O. H. (2016). Preparation of curcuminloaded nanoparticles and determination of the antioxidant potential of curcumin after encapsulation. Polímeros, 26(3), 207-214 http://doi.org/10.1590/0104-1428.2246
20 Garlotta, D. (2001). A literature review of poly (lactic acid). Journal of Polymers and the Environment, 9(2), 63-84 http:// doi.org/10.1023/A:1020200822435
21 Deretti, O. (2022). Novos filamentos biorreabsorvíveis para scaffolds visando a administração local de alendronato de sódio (Master’s dissertation). Universidade da Região de Joinville, Joinville
22 Cifuentes, S. C., Lieblich, M., Lopez, F. A., Benavente, F., & Gonzáles-Carrasco, J. L. (2017). Effect of Mg content on the thermal stability and mechanical behaviour of PLLA/Mg composites processed by hot extrusion. Materials Science and Engineering C, 72, 18-25 http://doi.org/10.1016/j. msec.2016.11.037 PMid:28024575.
23 Water, J. J., Bohr, A., Boetker, J., Aho, J., Sandler, N., Nielsen, H. M., & Rantanen, J. (2015). Three-dimensional printing of drug-eluting implants: preparation of an antimicrobial polylactide feedstock material. Journal of Pharmaceutical Sciences, 104(3), 1099-1107 http://doi.org/10.1002/jps.24305 PMid:25640314.
24. Yuniarto, K., Purwanto, Y. A., Purwanto, S., Welt, B. A., Purwadaria, H. K., & Sunarti, T. C. (2016). Infrared and Raman studies on polylactide acid and polyethylene glycol-400 blend. AIP Conference Proceedings, 1725(1), 020101. http://doi. org/10.1063/1.4945555
25 Bitencourt, S. S., Batista, K. C., Zattera, A. J., Silva, D. A. K., & Pezzin, A. P. T. (2017). Development of poly (L-lactic acid PLLA) biocomposites with waste wood. Revista Matéria, 22(4), e11899
26 Ferrández-Montero, A., Lieblich, M., Benavente, R., GonzálesCarrasco, J. L., & Ferrari, B. (2020). Study of the matrix-filler interface in PLA/Mg composites manufactured by material extrusion using a colloidal feedstock. Additive Manufacturing, 33, 101142. http://doi.org/10.1016/j.addma.2020.101142.
27 Oz, U. C., Küçüktürkmen, B., Devrim, B., Saka, O. M., & Bozkir, A. (2019). Development and optimization of alendronate sodium loaded PLGA nanoparticles by central composite design. Macromolecular Research, 27(9), 857-866 http://doi. org/10.1007/s13233-019-7119-z
28 Wang, S., Capoen, L., D’Hooge, D. R., & Cardon, L. (2018). Can the melt flow index be used to predict the success of fused deposition modelling of commercial poly (lactic acid) filaments into 3D printed materials? Plastics, Rubber and Composites, 47(1), 9-16. http://doi.org/10.1080/14658011.2 017.1397308
29 Silveira, E. (2015). Estudo da tenacificação do PLA pela adição de elastômero termoplástico EMA-GMA (Master’s dissertation). Escola Politécnica, Universidade de São Paulo, São Paulo
30. Ju, J., Peng, X., Huang, K., Li, L., Liu, X., Chitrakar, C., Chang, L., Gu, Z., & Kuang, T. (2019). High-performance porous PLLA-based scaffolds for bone tissue engineering: Preparation, characterization, and in vitro and in vivo evaluation. Polymer, 180, 121707 http://doi.org/10.1016/j.polymer.2019.121707
31 Agüero, Á., Garcia-Sanoguera, D., Lascano, D., Rojas-Lema, S., Ivorra-Martinez, J., Fenollar, O., & Torres-Giner, S. (2020). Evaluation of different compatibilization strategies to improve the performance of injection-molded green composite pieces made of polylactide reinforced with short flaxseed fibers. Polymers, 12(4), 821 http://doi.org/10.3390/polym12040821 PMid:32260439.
32 Huang, Y., Liu, Y., & Zhao, C. (1998). Morphology and properties of PETE/PA-6/E-44 blends. Journal of Applied Polymer Science, 69(8), 1505-1515 http://doi.org/10.1002/ (SICI)1097-4628(19980822)69:8<1505::AID-APP4>3.0.CO;2-G
33. Delabarde, C., Plummer, C. J. G., Bourban, P.-E., & Manson, J.-A. E. (2010). Solidification behaviour of PLLA/nHA nanocomposites. Composites Science and Technology, 70(13), 1813-1819. http://doi.org/10.1016/j.compscitech.2010.04.024.
34 Haser, A., Huang, S., Listro, T., White, D., & Zhang, F. (2017). An approach for chemical stability during melt extrusion of a drug substance with a high melting point. International Journal of Pharmaceutics, 524(1-2), 55-64 http://doi.org/10.1016/j. ijpharm.2017.03.070 PMid:28359810.
35 Srivastava, A., Ahuja, R., Bhati, P., Singh, S., Chauhan, P., Vashisth, P., Kumar, A., & Bhatnagar, N. (2020). Fabrication and characterization of PLLA/Mg composite tube as the potential bioresorbable/biodegradable stent (BRS). Materialia, 10, 100661 http://doi.org/10.1016/j.mtla.2020.100661
36 Wu, W., Zheng, Q., Guo, X., & Huang, W. (2009). The controlledreleasing drug implant based on the three-dimensional printing technology: fabrication and properties of. Journal Wuhan University of Technology-Materials Science Edition, 24(6), 977-981 http://doi.org/10.1007/s11595-009-6977-1
37 Rosiak, P., Latanska, I., Paul, P., Sujka, W., & Kolesinska, B. (2021). Modification of alginates to modulate their physicochemical properties and obtain biomaterials with different functional properties. Molecules, 26(23), 7264 http://doi. org/10.3390/molecules26237264 PMid:34885846.
38. Tidau, M., Kwade, A., & Finke, J. H. (2019). Influence of high, disperse API load on properties along the fused-layer modeling process chain of solid dosage forms. Pharmaceutics, 11(4), 194. http://doi.org/10.3390/pharmaceutics11040194. PMid:31013578.
39 Drummer, D., Cifuentes-Cuélar, S., & Rietzel, D. (2012). Suitability of PLA/TCP for fused deposition modeling. Rapid Prototyping Journal, 18 (6 ), 500 -507 http://doi. org/10.1108/13552541211272045.
Received: Aug. 10, 2023
Revised: Dec. 10, 2023
Accepted: Mar. 06, 2024
Effect of process parameters on the properties of LDPE/ sepiolite composites
Priscila da Silva e Souza1 , Ana Maria Furtado de Sousa2 and Ana Lúcia Nazareth da Silva1,3*
1Instituto de Macromoleculas Professora Eloisa Mano – IMA, Universidade Federal do Rio de Janeiro –UFRJ, Rio de Janeiro, RJ, Brasil
2Instituto de Química – IQ, Universidade do Estado do Rio de Janeiro – UERJ, Rio de Janeiro, RJ, Brasil
3Programa de Pós-graduação em Engenharia Ambiental – PEA, Universidade Federal do Rio de Janeiro –UFRJ, Rio de Janeiro, RJ, Brasil
*ananazareth@ima.ufrj.br
Obstract
This study examines the effect of processing parameters and reactive extrusion on the mechanical, thermal, morphological, and rheological properties of low-density polyethylene (LDPE) and sepiolite composites (LDPE/sepiolite: 95/5 wt/wt) produced by in situ reactive extrusion in a twin-screw extruder. Using a design of experiments, the contribution of the factors reverse mixing elements (RE), maleic anhydride (MA), and dicumyl peroxide (DCP) was determined. The results showed that a better interaction between LDPE and sepiolite phases occurred when reactive extrusion was carried out, leading to a satisfactory balance between mechanical properties and thermal stability behavior. The rheology analysis revealed that a more pronounced solid-like behavior was achieved in the composite prepared by reactive extrusion and in the presence of the filler. The SEM micrographs showed the appearance of a network-like morphology in the composite processed in the presence of additives and sepiolite filler.
Keywords: low density polyethylene, sepiolite, cross-linking, reactive extrusion, composites.
How to cite: Souza, P. S., Sousa, A. M. F., & Silva, A. L. N. (2024). Effect of process parameters on the properties of LDPE/ sepiolite composites. Polímeros: Ciência e Tecnologia, 34(2), e20240015. https://doi.org/10.1590/0104-1428.20230059
1. Introduction
Low-density polyethylene (LDPE) is extensively used in consumer goods and packaging due to its desired properties, such as toughness, high flexibility, and easy processability[1,2] However, according to Liang[2], some applications are not met solely by neat polymers. In this sense, the addition of nanofillers to the LDPE matrix can enlarge the application window by improving, for instance, its barrier and mechanical properties. Zhang et al.[3] revealed that these improvements are strongly dependent on the interfacial effect between the nanofiller and polymer matrix. The addition of inorganic nanofillers into a polymer matrix to produce a nanocomposite has been found to be an interesting possibility for improving some properties of a polymeric material[4]. In this regard, many types of nanofillers, such as graphene, carbon nanotubes, natural inorganic minerals, and layered double hidroxides, have been used in polymeric nanocomposite developments due to their significant impact on microscale properties, resulting in improved mechanical, thermal, flame retardancy, and barrier properties[5-8] .
According to Ballesteros et al.[9], research efforts are still necessary to better understand the interaction between nanoparticles and polymeric matrix to achieve a suitable dispersion and, consequently, desired properties. In particular, lamellar silicate fillers, such as clays (hydrophilic fillers), have low compatibility with nonpolar matrices. One of the
most common strategies to reinforce interfacial interactions between clay and nonpolar polymers is to add modified polyolefins bearing polar groups, namely compatibilizers or interfacial agents. For this purpose, maleic anhydride-grafted polyolefins have been widely used as interfacial agents[8,10] . Regarding mineral fillers, such as inorganic clays (e.g., bentonite, halloysite nanotubes, organically modified nanoclays, and sepiolite), these materials have been used as plastic additives to improve mechanical, thermal, and barrier properties[8,11,12]. According to Fashchi and Ostad[13] , sepiolite is a fibrous nanofiller with a 2:1 phyllosilicate with a crystalline structure in a needle-like morphology. This nanoparticle has open channels extended along the fiber direction and presents the following theoretical unit cell formula: Si12Mg8O30(OH)4(OH2)4.8H2O[13,14]. Sepiolite has fiber sizes varying between 0.2 μm to 2 μm in length, 100 nm to 300 nm in width, and 50 nm to 100 nm in thickness[14] Its porosity and specific area are 0.4 cm3.g-1 and 350 m2.g-1, respectively. As reported by Ajmal et al.[15] this nanofiller has been widely used to improve the thermal and mechanical properties of different polymers, such as polyethylenes, poly(lactic acid) and polyamides.
Composites based on polyolefins and sepiolite have been developed[6,16-18].Within this context, Li et al.[6] studied the effect of the addition of a flame retardant-modified sepiolite
Souza, P. S., Sousa, A. M. F., & Silva, A. L. N.
on thermal degradation and fire retardant properties of LDPE matrix. Initially, the sepiolite fiber was acidified and then the flame retardant was added, interacting with the fiber. Next, in an extruder, the modified fiber was blended with the PE.The results of the thermal degradation kinetics analysis and the combustion test showed that the incorporation of the modified fiber with the flame retardant improved the thermal stability and flame retardant property of the final composite.
Singh et al.[12] evaluated the addition of different contents of sepiolite (1 – 10 wt.%) in high-density polyethylene (HDPE) matrix. PE-graf-maleic anhydride (PE-g-MA), varying molar mass and MA content, was used as compatibilizer agent. The results showed that the addition of sepiolite into HDPE matrix up to 10 wt.% increased the complex viscosity values and the viscoelastic behavior as compared to neat HDPE. In the presence of the PE-g-MA, the viscoelastic behavior decreased as compared to uncompatibilized systems at the same filler content. The reduction in the viscoelastic properties was more pronounced in composites with compatibilizer of lower molar mass.
Nuñes et al.[17] studied nanocomposites based on poly(lactic acid) (PLA), low-density polyethylene (LDPE) and sepiolite (SEP). The systems were prepared by corotating twin-screw extruder and using two grafted polymers as compatibilizer agents – a styrene/ethylene-butylene/styrene rubber (SEBSg-MA) and a grafted polyethylene (PE-g-MA). The addition of sepiolite clay reduced the thermo-oxidative degradation of the neat PLA. The presence of SEP at the PE interface and in the PLA matrix phase reduces the effectiveness of these compatibilizer agents, resulting in lower elongation at break than those of the blends without clay.
García et al.[18] compared the effect of different nanofillers (sepiolite, silica nanoparticles and montmorillonite) as thermal stabilizers in LDPE matrix. The nanocomposites were prepared in a Haake mixer chamber by using a concentrated masterbatch procedure. The results showed a strong stabilization effect for both fibrous (sepiolite) and laminar silicate (montmorillonite), but not for the spherical silica nanoparticles. According to the authors, these results suggested the occurrence of a protective layer against thermos-oxidation on the film surface when sepiolite and montmorillonite were added on LDPE matrix.
Although composites based on polyolefins and sepiolite have been developed, research concerning the effect of reactive
extrusion on the compatibility of this nanoclay with LDPE matrix is still limited. Therefore, the goal of this research is to determine whether the amount of grafting additives in reactive extrusion and shear rates during processing influence the LDPE interaction with sepiolite. The factors screw profile and dicumyl peroxide (DCP) and maleic anhydride (MA) contents were investigated using a Factorial 23 design. Furthermore, extra experiments were performed to compare the conventional with reactive extrusion. The mechanical, thermal, morphological, and rheological properties of LDPE/ Sepiolite composites were assessed, with a particular emphasis on their potential for packaging processing.
2. Materials and Methods
2.1 Materials
Low-density polyethylene (LDPE) commercial-grade 352E is produced by Dow Chemical Company. Sepiolite with a surface area of 300 m2.g-1, an average length of 1–2 μm, and channels with dimensions of 3.6 x 10.6Å was donated by TeaditIndustria e Comércio Ltda. Maleic anhydride (MA), grade STBH9257, and dicumyl peroxide (DCP), grade Retilox 40 SAP, both used as additives for in situ reactive extrusion, were purchased in the local market.
2.2 Design of Experiments (DOE)
The experimental design matrix is shown in Table 1 The experimental code used is A/B/C, where A, B, and C represent, respectively, the actual values of MA, DCP, and RE (the number of reverse elements in zone 4 of the extruder). The amounts of MA (0.5 – 1.0%w) and DCP (0.05 – 1.0%w) were defined based on previous tests. Figure 1 shows the screw extruder used, in which three screw profiles were evaluated in the Zone 4 (compression zone): (i) four KB45 kneading elements (RE:0), (ii) three KB45 kneading elements and one reverse element (RE:1), and (iii) two KB45 kneading elements and two reverse elements (RE:2).Furthermore, neat-LDPE and LDPE with 5% wt/wt sepiolite were processed using a traditional extrusion process so that they could be used as control materials and provide more information for comparison with the reactive extrusion experiments. As shown in Table 2, these additional experiments were coded as LDPE-X and LDPE-SEP-X, where X is the actual value of RE related to levels 0 (level -1) and 2 (level 1), respectively.
(*) center point: replicates three times. All experiments have LDPE: Sepiolite:95:5 ratio (wt.%).
Table 1. Design of experiment matrix of Simple Factorial 23
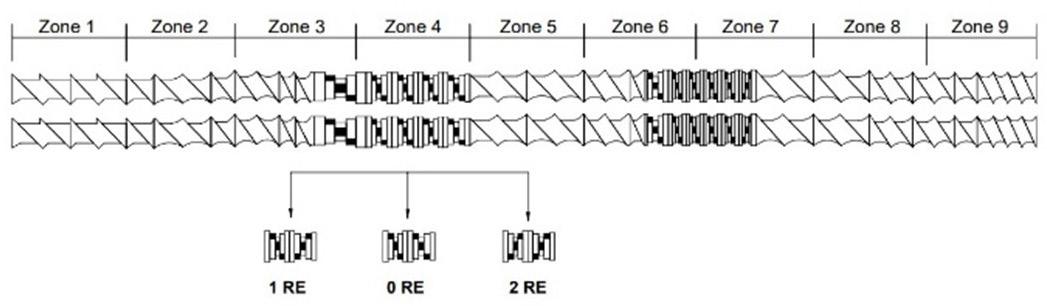
LDPE-0 0 100 -
LDPE-2 2 100 -
SEP-0 0 95 5
SEP-2 2 95 5
gLDPE-2* 2 100 0
* LDPE grafted with 0.5 (wt.%) of MA and 0.10 (wt.%) of DCP.
2.3 Composite preparation
Before extrusion, neat-LDPE and sepiolite were dried for 20 hours in a forced-air oven at 60°C. The neat polymer and all composites were extruded in a Tecktril DCT-20 corotating twin screw extruder (L/D: 36 and D:20 mm) at a screw speed of 400 rpm, temperature profile of 90/120/18 0/185/190/195/200/200/200°C, and feed rate of 18 kg.h-1 The raw materials were added simultaneously to the main feeder.
All test specimens were prepared using an Arburg injection-molding machine, model 270S. The temperature profile of the barrel was set at 160/175/185/195/205 °C from feed section to nozzle. The injection pressure and holding pressure were set at 1200 and600 bar, respectively. The cooling time 30 s, and mold temperature of 30°C.
2.4 Characterizations
ATR-FTIR (Attenuated Total Reflection Fourier Transform Infrared) was performed on a Perkin Elmer spectrometer
Spectrum One in the 4000 - 400 cm-1 range. The purpose of this analysis was to confirm the presence of sepiolite filler in the composites and determine the carbonyl index (CI) (Equation 1) in the LDPE matrix[19]:
TRIOS Discovery HR-1 Rheometer, using 25 mm-diameter parallel plates) operating at 200 ºC. The gap between the parallel plates was 1 mm. First, a stress sweep test was conducted to determine the linear viscoelastic region of the material. Next, dynamic frequency sweep tests (oscillatory stress: 100 Pa; frequency range: 0.03 to 600 rad/s) were performed to determine the dynamic properties of the material. The rheological behavior of the samples was evaluated based on their complex viscosity (η*) and storage modulus (G’) as a function of frequency (ω).
The cryofractured surface morphology of composites was analyzed by JEOL-1200 scanning electron microscope (SEM). The elements (Mg and Si) from sepiolite were mapped by using the EDS (energy-dispersive X-ray spectroscopy) accessory, Thermo Scientific model 5225 Verona Road, coupled to the SEM microscope.
Tensile tests were performed using a universal testing machine (EMIC, model DL3000) following ASTM D638 (Type I). The crosshead speed was 50 mm.min-1 The results were also averaged over five replicates of each composition.
Thermal stability was evaluated by thermogravimetric analysis (TGA) using a Q500 analyzer (TA Instruments). About 15 mg of sample was analyzed at a heating rate of 10 °C.min-1 from 25 to 900 °C under N2 atmosphere. The temperatures at weight loss onset (TONSET) and maximum degradation rate (TMAX) were determined.
3. Results and Discussions
3.1 Fourier-transform infrared spectroscopy (ATR-FTIR)
Where CI is carbonyl index; ( ) 18501670 A is referred to range of carbonyl group and ( ) 15001420 A is related to the range of -CH2 group[19]
The areas under the bands were calculated through the Perkim Elmer software options, using the peak analysis tool.
Dynamic rheological properties of the material were analyzed using an oscillatory rheometer (TA Instruments
Sepiolite is a 2:1 microfibrous tri-octahedral silicate mineral with the formula Si12Mg8O30(OH)4(OH2)4.nH2O. It is composed of polysomes and channels that extend along the direction of the fiber. The polysomes are composed of an octahedral sheet containing Mg and linked by inversion of tetrahedrons through Si-O-Si bonds, called siloxane bridges, surrounded by two silica tetrahedral sheets, which form continuous tetrahedral sheets with the apices on adjacent polysomes pointing in opposite directions. The absorption bands at 976, 1010 and 1210 cm-1 in the ATR-FTIR spectra (Figure 2) are ascribed to the siloxane bridges (Si-O-Si) of sepiolite[19]
Further, the bands around 3640 and 1620 cm-1 are attributed to the stretching and bending vibrations of water molecules, respectively. In the range of 900–600 cm–1 ,
Table 2. Extra experiments.
Figure 1. Screw profiles used in the experimental design.
P. S., Sousa, A. M. F., & Silva, A. L. N.
the absorption bands can be attributed to the vibrations of hydroxyl groups associated with octahedral Mg2+and water molecules of the bound type. The bands with shoulders at 535 and 500 cm–1are related to the deformation vibrations in tetrahedral sheets[18]. According to Zhang et al.[3], there are three types of water in sepiolite: zeolitic water within the channels varying with relative humidity, coordinated water molecules binding to the terminal Mg atoms, and structural water referring to the OH- groups of the octahedral sheet as phyllosilicate.
The superposition of the LDPE and g-LDPE spectra and the integrating areas are shown in Figure 3 Table 3 shows the CI calculated using Equation 1.
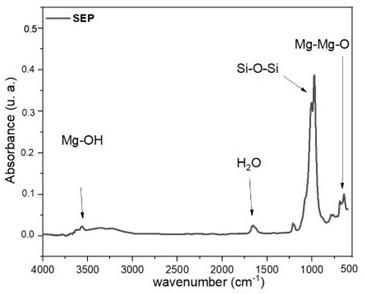
According to Almond et al.[19], the CI index was determined from the ratio between the integrated band absorbance of the carbonyl (C=O) peak (1850 –1670 cm-1) and of methylene (CH2) scissoring peak (1500 – 1420 cm-1). As can be seen in Figure 3b, the peak which appears in the range 18501670 cm-1is very small, almost non-existent. In Figure 3c it is already possible to identify characteristic carbonyl bands. On the other hand, in the FTIR of the gLDPE-2 sample, the absorbance intensity at wavenumber of 1466 cm-1 (related to CH2 band) is smaller than that of LDPE-2, which leads to a higher CI value for the gLDPE-2 sample, signaling the occurrence of a grafting process.
Figure 3b exhibits a peak at around 1640 cm-1, associated with amines incorporated into polyethylene resins as UV stabilizers as HAS (Hindered Amine Stabilizers)[20]. This peak is not present in the material after reactive extrusion. A possible reason for this finding is that the grafting additives underwent a reaction with the amine groups during the reactive extrusion, thereby shielding the amine groups.
3.2 Oscillatory rheology and SEM microscopy
The frequency dependency of the storage modulus (G’) and loss modulus (G”) of the materials determined from frequency (ω) sweep analysis is shown in Figure 4, which
Sample Code Integrated area of Carbonyl index (CI) 1850 – 1670 cm-1 1500 – 1420 cm-1
LDPE 0.06 2.91 0.026 g-LDPE 0.19 2.30 0.083
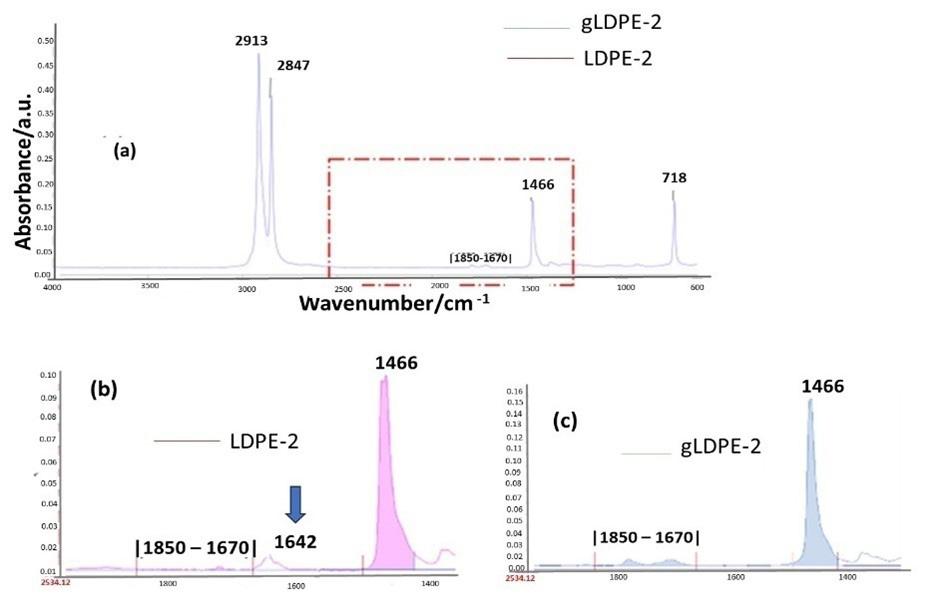
Figure 2. ATR-FTIR spectra of sepiolite (SEP).
Table 3. Carbonyl index of LDPE and g-LDPE.
Figure 3. ATR-FTIR spectra of (a) LDPE-2 and gLDPE-2; (b) LDPE-2 (zoom at 2500– 1300 cm-1) and (c) gLDPE-2 (zoom at 2500 –1300 cm-1).
also shows the micrographs from SEMand the EDS images (scoring the Si element).
Table 4 shows the values of the crossover point, at which G’ = G”, determined from G’ and G” versus the frequency curves. The decrease in both G’=G” and ω c values of SEP-2 relative to LDPE-2 shows that the addition of sepiolite filler led to an increase in the elastic behavior, signaling the reinforcing effect of the clay in the LDPE matrix.
Further, comparing LDPE-2 to LDPE processed by reactive extrusion (gLDPE-2), it can be seen that gLDPE-2 presented higher elastic behavior in the whole frequency range analyzed, confirming the occurrence of the grafting reaction during processing. When sepiolite was added in the presence of MA/DCP additives, a composition with a more pronounced elastic behavior was produced, showing the effect of the
grafting reaction in the interaction of LDPE and filler phases. These results corroborate the findings shown in the SEM micrographs and EDS images (Figure 4). As can be seen, LDPE-SEP-2 and 0.5/0.10/2 composite have different morphologies. The 0.5/0.10/2 composite shows a different morphology, conforming the occurrence of the grafting reaction in the LDPE matrix. In addition, it is also possible to observed that the dispersion of the sepiolite (indicated by Si element, marked with red points) was more efficient in the composition processed by reaction extrusion (see Figure S1 in Supplementary Material).The improved dispersion was confirmed by EDS images, which show that sepiolite dispersion increases in samples from reactive extrusion. It is important to highlight the role of reverse elements in the dispersion/distribution mechanism of sepiolite in the LDPE matrix. The greater residence time achieved due to the presence of these mixing elements allowed greater efficiency in the grafting process and, consequently, leading to better dispersion of the filler in the LDPE matrix.
Sample
0.5/0.10/2
According to Jian et al.[21], the dependence of G’ on frequency can indicate the dynamics of the polymer chain structure. For instance, a homopolymer with a narrow molecular weight will present the terminal behavior of the G’α ω2 curve. Based on the present experimental data, neat LDPE (processed without the presence of MA/ DCP additives) deviated from standard terminal behavior, showing G’ α ω0.60 (R2=0.98). When sepiolite was added to
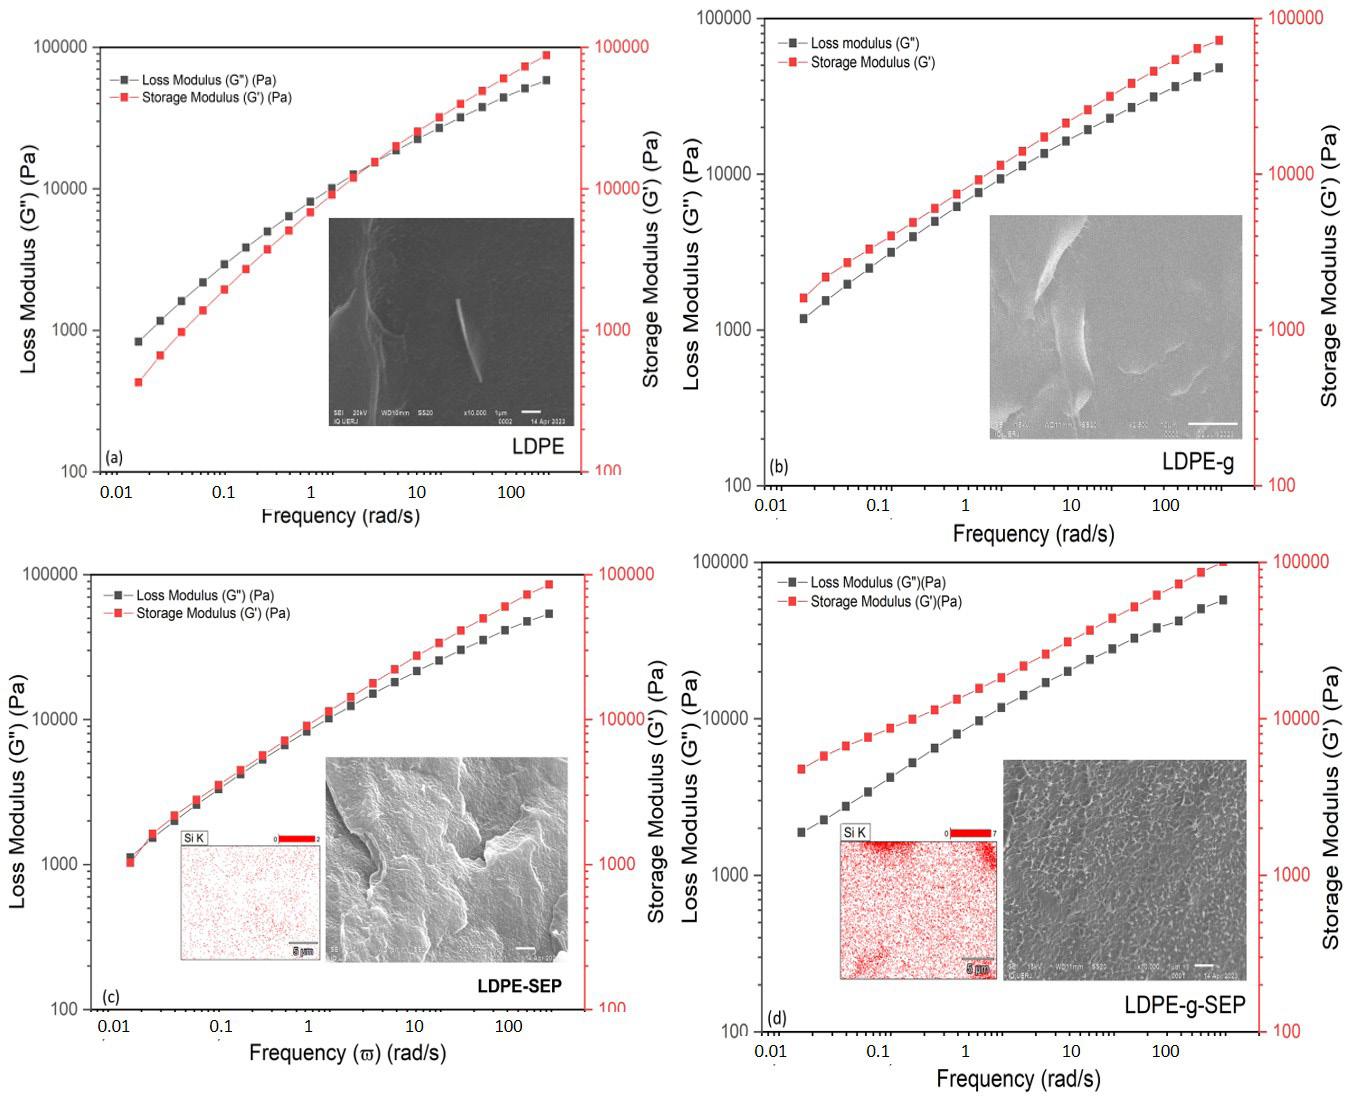
Table 4. Dynamic modulus and frequency values at the G’/G” crossover point for neat LDPE and LDPE compositions.
Figure 4. Storage modulus (G’) and Loss modulus (G”) as a function of frequency a) LDPE-2, b) gLDPE-2, c) SEP-2 and d) 0.5/0.10/2 composite.SEM micrographs and EDS (Si element) images.
Souza, P. S., Sousa, A. M. F., & Silva, A. L. N.
the LDPE matrix, the relationship between G’ and ω was G’ α ω0.49 (R2=0.99), indicating an increase in the elastic behavior of the LDPE-SEP composition. When LDPE was processed by reactive extrusion (gLDPE-2), the relationship between G’ and ω was G’ α ω0.44 (R2=0.99), showing a more pronounced elastic behavior. The 0.5/0.10/2 composite showed the relationship G’ α ω0.35 (R2=0.99), indicating that this sample presented a more pronounced improvement in solid-like behavior compared to others, probably due to the higher interaction between the LDPE matrix and sepiolite phases achieved[22,23] .
Figure 5 shows the complex shear viscosities (η*) as a function of the frequency forLDPE-2, SEP-2,gLDPE-2, and 0.5/0.10/2 samples.
LDPE exhibits the lowest viscosities at low frequencies. When sepiolite filler is added to the LDPE matrix (SEP2), higher viscosity values are achievedat low frequencies comparedto LDPE, signaling the reinforcing effect of the filler in the matrix. The reactive extrusion processing of neat LDPE (gLDPE-2) led to higher viscosity values compared to LDPE, demonstrating the occurrence of the grafting reaction. The reactive extrusion of LDPE with sepiolite led to a pronounced increase in the viscosity values, showing again the effect of the
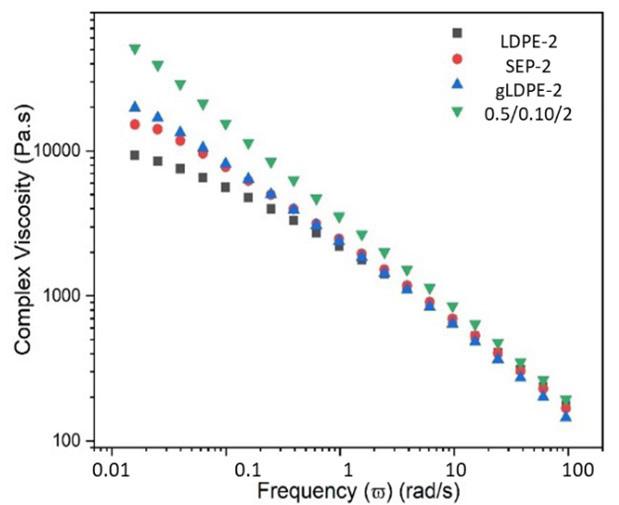
grafting process in the interaction between LDPE matrix and sepiolite filler. In addition, although higher viscosity values are achieved at lower frequencies in 0.5/0.10/2 composition, a shear thinning behavior is observed as frequency was raised. This signals that the composition has an elastic behavior at low frequencies, but as shear rate increases, a decrease in the elastic behavior starts to appear, increasing the flow property of the material. This behavior indicates the potential of use of 0.5/0.10/2 composition in packaging processing. Almeida et al. [24] revealed that high polymer melt strength ensures good bubble stability required by the film blowing process. On the other hand, the material must be sufficiently deformable so that it is able to expand into the formation of the bubble. Thus, the rheological behavior of 0.5/0.10/2 composition indicates its potential use in packaging processing.
3.3 Mechanical and thermal properties
Table 5 shows the elastic modulus, yield stress, and strain at break for the LDPE composites and the control experiments.
Figure 6 shows the graphics produced by the analysis of DOE for elastic modulus. According to the Pareto chart
5. Mechanical properties of neat LDPE and LDPE compositions.
Extra Experiments used as
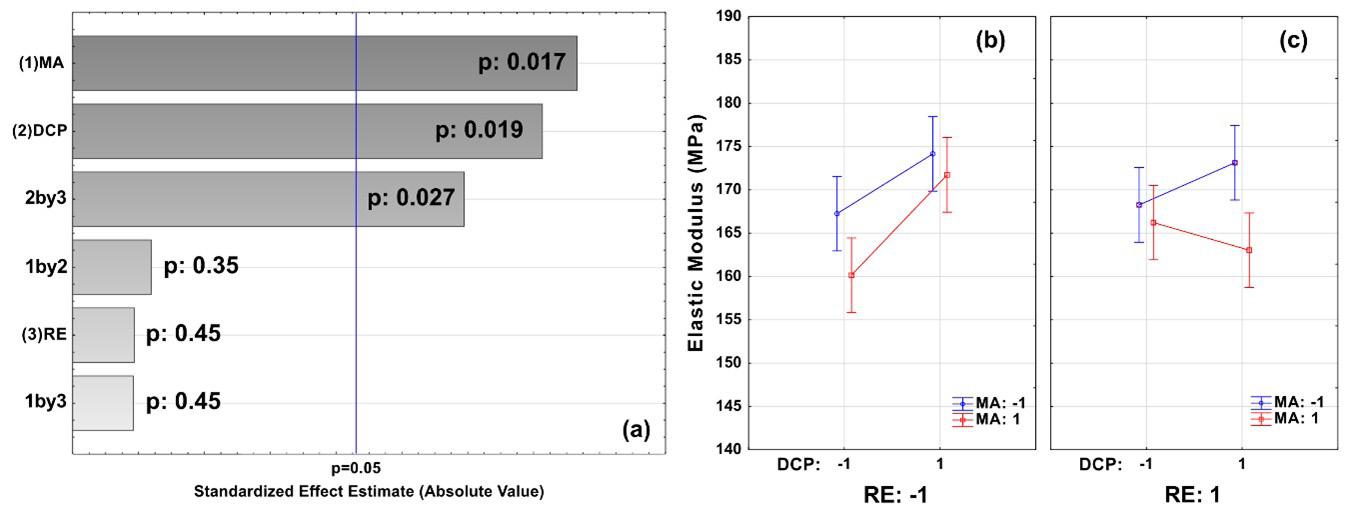
Figure 5. Complex viscosity (η*) as a function of frequency.
Table
Figure 6. Plots of Simple Factorial 23 design of Elastic modulus (a) Pareto Chart and (b-c) Means and Confidence intervals.
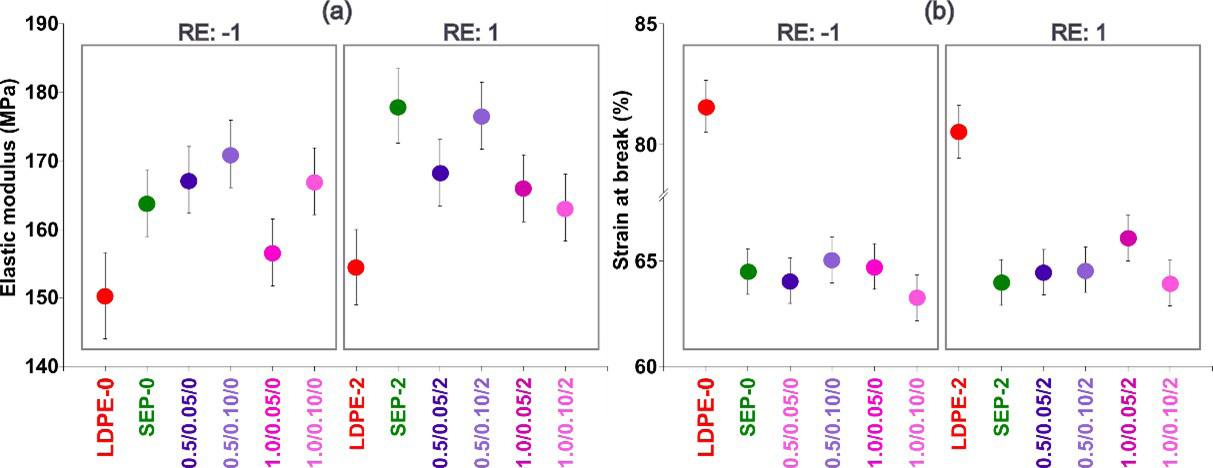
(Figure 6a), MA affects the elastic modulus first, followed by DCP and the interaction between DCP with RE (2by3). At a RE level of -1 (Figure 6b), there is a slight boost in elastic modulus when the DCP content is increased from -1 to 1. However, a opposing finding is observed when the RE level is +1 (Figure 6c), where the increase in DCP only leads to a rise in the elastic modulus at the MA level of 0.5%wt (level:-1).
Different from what is observed for elastic modulus, the yield stress and strain at break of the LDPE/sepiolite composite produced via reactive extrusion are not impacted by any of the factor tested (MA, DCP, and RE) or their interactions since all p-values are higher than 0.05.
Figure 7 shows the comparison the elastic modulus and strain at break for all composites, with the intervals based on Fisher’s least significant difference (LSD) procedure. If two composites have the same property, their intervals will overlap 95% of the time.
The elastic modulus of neat-LDPE (LDPE-0 and LDPE-2) are unaffected by ER, as shown in Figure 7. Adding sepiolite to LDPE via conventional extrusion (SEP-0 and SEP-2) increases the elastic modulus compared to neat-LDPE, regardless the number of reverse elements, signalling the reinforcing effect of sepiolite in the LDPE matrix. When comparing composites processed through reactive extrusion with those processed through conventional extrusion, it is evident that the increase in the elastic modulus is not substantial. Regardless of the extrusion process, all composites exhibited a reduction in strain at break compared to LDPE, indicating a decrease in ductility. Thus, it can be inferred that the changes in the these mechanical properties of LDPE composites are a result of the reinforcement provided by sepiolite, while the modification of LDPE with MA/DCP does not have a substantial impact on these changes.
DOE analysis revealed that process parameters RE (p-value: 0.6), MA content (p-value: 0.4), and DCP content (p-value: 0.4) had no influence on TMAX, i.e., the range of analyzed process parameters had no significant impact on the thermal stability of the composites produced (TGA curvesare presentedin Figure S3 in Supplementary Material). Figure 8 shows a bar chart
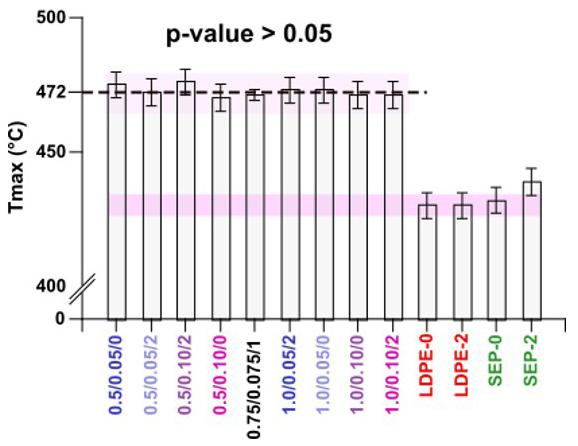
Figure 8. Temperature at maximum degradation rate (TMAX) - Bar Chart Plot, where SEP-0 is LDPE-SEP without reverse elements and SEP-2 is LDPE-SEP processed with 2 (two) reverse elements.
of the temperature at maximum degradation rate (TMAX) of the LDPE/sepiolite composites and the control experiments. The TMAX values of SEP-0 and SEP-2 composites (Figure 8) are observed to be at around 472 °C on average (the standard error of each predicted value is 2 °C), which is nearly 30 °C higher than the TMAX of neat-LDPE (LDPE-0 and LDPE-2). In addition, the grafting composites also present higher TMAX values comparing to composites without AM/DCP (SEP-0 and SEP-2). This behavior can be attribute to the grafting reaction produced during reactive extrusion. It is important to highlight that the 0.5/0.10/2 composite tends to present a slightly higher thermal stability in relation to the other composites processed in the presence of the additives.
From DOE analysis, it was defined that the better experimental conditions that lead to a composition with an optimum balance between mechanical and thermal properties are a higher amount of DCP and lower MA content, using a higher number of RE in the screw profile.
Figure 7. The means and 95% confidence intervals for (a) the elastic modulus and (b) the strain at break of the reactive extrusion experiments and the control experiments.
4. Conclusions
This study revealed that the contents of grafting additives and screw profile affected the interaction between the LDPE and sepiolite phases. According to the Fatorial 23 design, the optimum balance between mechanical and thermal stability behavior was achieved for the 0.5/0.10/2 composition.
The comparison of 0.5/0.10/2 composition with extra experiments by ATR-FTIR analysis showed that the occurrence of the grafting reaction was efficient, and that the presence of sepiolite filler did not inhibit the grafting mechanism in the LDPE matrix. The micrographs obtained through scanning electron microscopy (SEM) and EDS imagens showed different morphologies between the compositions prepared with and without grafting additives.
The EDS images showed a better dispersion of the sepiolite in the composition prepared by reactive extrusion. Beyond this, the oscillatory rheology test showed a more pronounced elastic behaviour in 0.5/0.10/2 composition, signaling the effect of the grafting reaction in the interaction between LDPE and filler phases. The 0.5/0.10/2 composite presented suitable rheological characteristics to be used in blow process, signaling its potential use in packaging processing.
5. Author’s Contribution
• Conceptualization – Priscila da Silva e Souza; Ana Maria Furtado de Sousa; Ana Lúcia Nazareth da Silva.
• Data curation – Priscila da Silva e Souza.
• Formal analysis – Priscila da Silva e Souza;
• Funding acquisition – Ana Maria Furtado de Sousa; Ana Lúcia Nazareth da Silva.
• Investigation – Priscila da Silva e Souza.
• Methodology – Ana Maria Furtado de Sousa; Ana Lúcia Nazareth da Silva.
• Project administration – Priscila da Silva e Souza; Ana Maria Furtado de Sousa; Ana Lúcia Nazareth da Silva.
• Resources – Priscila da Silva e Souza; Ana Maria Furtado de Sousa; Ana Lúcia Nazareth da Silva.
• Software – NA.
• Supervision – Ana Maria Furtado de Sousa; Ana Lúcia Nazareth da Silva.
• Validation – Priscila da Silva e Souza; Ana Maria Furtado de Sousa; Ana Lúcia Nazareth da Silva.
• Visualization – Priscila da Silva e Souza.
• Writing – original draft – Priscila da Silva e Souza.
• Writing – review & editing – Ana Maria Furtado de Sousa; Ana Lúcia Nazareth da Silva.
6. Acknowledgements
This work was supported by Conselho Nacional de Desenvolvimento Científico e Tecnológico – CNPQ [09461/2021-9 and 307889/2022] Fundação de Amparo à Pesquisa do Estado do Rio de Janeiro – FAPERJ [E26/010.002212/2019 and E-6/010.001927/2019] and
Coordenação de Aperfeiçoamento de Pessoal de Nível Superior - CAPES [Financing code 001]. The authors acknowledge Nitriflex and Lapinus for donating the rawmaterials. The Conselho Nacional de Desenvolvimento Científico e Tecnológico (CNPQ) and Fundação de Amparo à Pesquisa do Estado do Rio de Janeiro (FAPERJ) for research supporting.
7. References
1 Dintcheva, N. T., Alessi, S., Arrigo, R., Przybytniak, G., & Spadaro, G. (2012). Influence of the e-beam irradiation and photo-oxidation aging on the structure and properties of LDPE-OMMT nanocomposite films. Radiation Physics and Chemistry, 81(4), 432-436 http://doi.org/10.1016/j. radphyschem.2011.12.018
2 Liang, J. (2019). Melt strength and drawability of HDPE, LDPE and HDPE/LDPE blends. Polymer Testing, 73, 433-438 http://doi.org/10.1016/j.polymertesting.2018.12.007
3 Zhang, Q., Li, S., Hu, X., Wang, P., Zeng, J., Wang, X., & Wang, Y. (2017). Structure, morphology, and properties of LDPE/ sepiolite nanofiber nanocomposite. Polymers for Advanced Technologies, 28(8), 958-964 http://doi.org/10.1002/pat.3703
4 Anh, T. T., Fréchette, M., David, É., Veillette, R., & Moraille, P. (2018). Effect of POSS-grafted titanium dioxide on the electrical and thermal properties of LDPE/TiO2 polymer nanocomposite. Journal of Applied Polymer Science, 135(14), 46095 http://doi.org/10.1002/app.46095
5 Tabatabaei-Yazdi, Z., & Mehdipour-Ataei, S. (2015). Poly(etherimide) and related sepiolite nanocomposites: investigation of physical, thermal, and mechanical properties. Polymers for Advanced Technologies, 26(4), 308-314 http://doi.org/10.1002/ pat.3444
6. Li, W., Li, S., Cheng, Z., Hu, X., Yang, W., & Yao, Y. (2019). The effect of flame retardant-modified sepiolite nanofibers on thermal degradation and fire retardancy of low-density polyethylene. Journal of Thermal Analysis and Calorimetry, 138(2), 1011-1019 http://doi.org/10.1007/s10973-019-08162-3
7 Delva, L., Ragaert, K., Degrieck, J., & Cardon, L. (2014). The effect of multiple extrusions on the properties of montmorillonite filled polypropylene. Polymers, 6(12), 2912-2927 http://doi. org/10.3390/polym6122912
8. Sarifuddin, N., Ismail, H., & Ahmad, Z. (2014). Influence of halloysite nanotubes hybridized with kenaf core fibers on the physical and mechanical properties of low density polyethylene/ thermoplastic sago starch blends. Polymer-Plastics Technology and Engineering, 53(2), 107-115 http://doi.org/10.1080/036 02559.2013.820758
9. Ballesteros, A., Laguna-Gutierrez, E., Puertas, M. L., EstebanCubillo, A., Santaren, J., & Rodriguez-Perez, M. A. (2021). Polystyrene/sepiolites nanocomposite foams. relationship between composition, particle dispersion, extensional rheology, and cellular structure. Materials Today. Communications, 29, 102850 http://doi.org/10.1016/j.mtcomm.2021.102850
10. Julinawati, W., Wirjosentono, B., Eddiyanto, E., Gea, S., & Ramli, I. (2020). Morphology and thermal properties of polypropylene-montmorillonite nanocomposite using modified bentonite of Bener Meriah Aceh. Journal of Natural, 20(3), 56-60 http://doi.org/10.24815/jn.v20i3.15073
11 Rathnam, V., Kichu, A., Dutta, N., Maji, T. K., & Devi, N. (2022). Influence of organically modified nanoclay and TiO2 nanopowder on the properties of Azadirachta indica wood flourreinforced high-density polyethylene, low-density polyethylene, polypropylene, and polyvinyl chloride nanocomposite. Journal of Thermoplastic Composite Materials, 35(10), 1468-1487 http://doi.org/10.1177/0892705720935968
12 Singh, V. P., Vimal, K. K., Sharma, S., Kapur, G. S., & Choudhary, V. (2017). Polyethylene/sepiolite clay nanocomposites: effect of clay content, compatibilizer polarity, and molar mass on viscoelastic and dynamic mechanical properties. Journal of Applied Polymer Science, 134(33), 45197 http://doi.org/10.1002/ app.45197
13 Farshchi, N., & Ostad, Y. K. (2020). Sepiolite as a nanofiller to improve mechanical and thermal behavior of recycled high-density polyethylene. Progress in Rubber, Plastics and Recycling Technology , 36 (3 ), 185 -195 http://doi. org/10.1177/1477760620918596
14 Chen, H., Zheng, M., Sun, H., & Jia, Q. (2007). Characterization and properties of sepiolite/polyurethane nanocomposites. Materials Science and Engineering A, 445–446, 725-730 http://doi.org/10.1016/j.msea.2006.10.008
15. Ajmal, A. W., Masood, F., & Yasin, T. (2018). Influence of sepiolite on thermal, mechanical and biodegradation properties of poly-3-hydroxybutyrate-co-3-hydroxyvalerate nanocomposites. Applied Clay Science, 156, 11-19 http://doi. org/10.1016/j.clay.2018.01.010.
16 Rehman, S. U., Javaid, S., Shahid, M., Gul, I. H., Rashid, B., Szczepanski, C. R., Naveed, M., & Curley, S. J. (2022). Polystyrene-sepiolite clay nanocomposites with enhanced mechanical and thermal properties. Polymers, 14(17), 3576 http://doi.org/10.3390/polym14173576 PMid:36080650.
17 Nuñes, F. C., Ribeiro, K. C., Martini, F. A., Barrioni, B. R., Santos, J. P. F., & Carvalho, B. M. (2021). PBAT/PLA/cellulose nanocrystals biocomposites compatibilized with polyethylene grafted maleic anhydride (PE-g-MA). Journal of Applied Polymer Science, 138(45), 51342. http://doi.org/10.1002/ app.51342
18 García, N., Hoyos, M., Guzmán, J., & Tiemblo, P. (2009). Comparing the effect of nanofillers as thermal stabilizers in low density polyethylene. Polymer Degradation & Stability, 94(1), 39-48 http://doi.org/10.1016/j.polymdegradstab.2008.10.011
19 Almond, J., Sugumaar, P., Wenzel, M. N., Hill, G., & Wallis, C. (2020). Determination of the carbonyl index of polyethylene and polypropylene using specified area under band methodology with ATR-FTIR spectroscopy. E-Polymers, 20(1), 369-381 http://doi.org/10.1515/epoly-2020-0041.
20 Gulmine, J. V., Janissek, P. R., Heise, H. M., & Akcelrud, L. (2002). Polyethylene characterization by FTIR. Polymer Testing, 21(5), 557-563 http://doi.org/10.1016/S0142-9418(01)00124-6
21 Jiang, L., Zhang, J., & Wolcott, M. P. (2007). Comparison of polylactide/nano-sized calcium carbonate and polylactide/ montmorillonite composites: reinforcing effects and toughening mechanisms. Polymer, 48(26), 7632-7644 http://doi.org/10.1016/j. polymer.2007.11.001.
22 Ogorodova, L. P., Kiseleva, I. A., Vigasina, M. F., Kabalov, Y. K., Grishchenko, R. O., & Mel’Chakova, L. V. (2014). Natural sepiolite: enthalpies of dehydration, dehydroxylation, and formation derived from thermochemical studies. The American Mineralogist, 99(11–12), 2369-2373 http://doi.org/10.2138/ am-2014-4804
23 Elbourne, A., Truong, V. K., Cheeseman, S., Rajapaksha, P., Gangadoo, S., Chapman, J., & Crawford, R. J. (2019). The use of nanomaterials for the mitigation of pathogenic biofilm formation. In V. Gurtler, A. S. Ball, & S. Soni (Eds.), Methods in Microbiology: Nanotechnology (pp. 61-92). UK: Academic Press http://doi.org/10.1016/bs.mim.2019.04.002
24. Almeida, K. M., Sousa, A. M. F., Souza, F. G., Jr., Bertolino, L. C., Rocha, M. C. G., Peres, A. C. C., Ossig, A., & Silva, A. L. N. (2017). Melt rheology and morphology of binary and ternary PS/HIPS blends for blown film extrusion applications. Polymer Testing, 64 , 277-286 http://doi.org/10.1016/j. polymertesting.2017.10.016
Received: Aug. 16, 2023
Revised: Mar. 02, 2024
Accepted: Mar. 22, 2024
P. S., Sousa, A. M. F., & Silva, A. L. N.
Supplementary Material
Supplementary material accompanies this paper.
Figure S1: Distribution of chemical elements map a) SEP-2:simples sample both with sepiolite b) 0.5/0.10/2: grafting sample both with sepiolite.
Figure S2: Photographs from SEM of LDPE-2 composition.
Figure S3: Photographs from SEM of gLDPE-2 composition
Figure S4: Photographs from SEM of SEP-2 composition.
Figure S5: Photographs from SEM of 0.5/0.10/2 composition.
Figure S6: Tensile versus strain curve – median sample.
Figure S7:TGA/DTG curves of 0.5/0.05/0 composition.
Figure S8:TGA/DTG curves of 0.5/0.05/2 composition.
Figure S9:TGA/DTG curves of 0.5/0.10/2 composition.
Figure S10: TGA/DTG curves of 0.5/0.10/2 composition.
Figure S11: TGA/DTG curves of 0.75/0.075/1 composition.
Figure S12: TGA/DTG curves of 1.0/0.05/2 composition.
Figure S13: TGA/DTG curves 1.0/0.05/0 composition.
Figure S14: TGA/DTG curves 1.0/0.10/0 composition.
Figure S15: TGA/DTG curves 1.0/0.10/2 composition.
This material is available as part of the online article from https://doi.org/10.1590/0104-1428.20230059
Souza,
Chemical and mechanical resistance of waterborne polyurethane/graphene (WPU/GO) nanocomposite coatings
Pietro Paolo de Oliveira e Silva1* , Enderson José Dias de Melo1 , Arthur Israel Carneiro Espíndola2 , Marcus Vinicius Fernandes Florentino3 , Ana Paula Lima da Silva2 , Elinaldo Neves dos Santos3
1Departamento de Física, Instituto Federal de Pernambuco – IFPE, Recife, PE, Brasil
2Departamento de Engenharia Civil, Instituto Federal de Pernambuco – IFPE, Recife, PE, Brasil
3Departamento de Engenharia Mecânica, Instituto Federal de Pernambuco – IFPE, Recife, PE, Brasil
*pietropaolo@recife.ifpe.edu.br
Obstract
Waterborne polyurethane (WPU) coatings used for moisture protection of surfaces have been used broadly. They have been considered environmentally friendly because their synthesis releases less or no volatile organic compounds (VOCs) to the atmosphere. With the Covid-19 pandemic concerns, cleaning protocols of these surfaces have been applied and scientific knowledge about the effects of these liquids on WPU surfaces is necessary. In this work, diffusion experiments were performed using four liquids, in pure WPU and WPU filled with graphene oxide (GO). Detergent had the most severe effect on polyurethane films, causing severe cracks and weight loss. Diffusion parameters of HCl 5% and HCl 10% were greater in WPU/GO nanocomposites than in pure WPU. Mechanical tests under chemical aging showed that alcohol reduced most the tensile strength and Young modulus. Overall, GO protected the films for all liquid exposures, increasing their tensile strength and Young modulus.
Keywords: covid-19 cleaners, diffusion parameters, graphene oxide, waterborne polyurethane, nanocomposites.
How to cite: Silva, P. P. O., Melo, E. J. D., Espíndola, A. I. C., Florentino, M. V. F., Silva, A. P. L., & Santos, E. N. (2024). Chemical and mechanical resistance of waterborne polyurethane/graphene (WPU/GO) nanocomposite coatings. Polímeros: Ciência e Tecnologia, 34(2), e20240016. https://doi.org/10.1590/0104-1428.20230126
1. Introduction
Polyurethanes (PUs) are a particularly important class of thermoset coatings, with widespread applications in the automotive, aerospace, industrial maintenance, wood, and plastic coatings fields. However, the coatings industry has become increasingly concerned with environmental issues, adopting attitudes to increasingly reduce the emission of volatile organic compounds (VOCs) into the atmosphere. One of these approaches is the replacement of solvent-based PU with water-based/waterborne PU (WPU)[1,2]. Waterborne coatings appear as an excellent option when concerns for the environment is a priority, as well as compliance with the environmental standards of each country[3,4]. Waterborne polyurethane dispersions have emerged as an important alternative to solvent-borne adhesives and coatings due to environmental concerns[5,6]
WPU coatings have properties desired by the industry, such as chemical resistance, flexibility and relative thermal and mechanical resistance. However, in some applications that demand higher levels at the limits of these properties, thermoset WPU films may not meet the demand [7] The incorporation of nanofillers into the WPU matrix can eliminate this type of limitation, as the filler plays an important role in increasing the physicochemical properties of polymers and, therefore, can be used for the development of a new generation of composite materials. Clay, nano
silica, cellulose nanocrystal, carbon nanotubes, graphene oxide (GO), reduced graphene oxide and graphene can be used for this purpose[8]. Among the various nanofillers employed in the fabrication of polymer nanocomposites, graphene and graphene-based materials such as GO have attracted significant attention to researchers and scientists due to their unique combination of properties[9-12]. Polymer nanocomposites based on PU and graphene-based materials have a great application opportunity in automobile body parts, flexible pipes, biomedical devices, paints, coating of wires and cables, protective coatings in the construction industry, etc[8]
Graphene oxide is capable of providing surprising improvements in material properties when used in a composite, even at a very low percentage (up to 1%w/w), acting as a multifunctional crosslinker as well as a filler. Researchers and scientists working around the world are curious to discover the hidden potential of this 2D nanomaterial in enhancing polyurethane properties[13,14]. Pokharel and Lee[15] demonstrated an improvement of 40.5% in tensile strength and 19% in elasticity of PU with the addition of 1%w/w of GO. The advantage of GO over graphene when incorporating into water-based PU is that, compared with graphene, GO is easy to be homogeneously dispersed in aqueous solution, which is attributed to the existence of a large number of
Silva, P. P. O., Melo, E. J. D., Espíndola, A. I. C., Florentino, M. V. F., Silva, A. P. L., & Santos, E. N.
oxygen-containing functional groups, such as hydroxyl, carboxyl, carbonyl and epoxy[16]. Nanomaterials such as nano-silica, nano-zinc oxide, nano-titanium dioxide, clay, and cellulose nanocrystals have been widely used to improve the properties of waterborne polyurethane[17]
Moreover, after the Covid-19 pandemic, frequent surface cleaning became mandatory mainly in public locations. In many cases, these surfaces are protected with WPU coating, as in civil constructions, since this polymer coating is used as a surface waterproof protection. Common cleaner liquids for this purpose include alcohols, diluted dishwashing detergents, HCl diluted in water (muriatic acid) and so on[18,19]. As a result, understanding the effects of these liquids exposure in polymeric coating properties plays an important role in polymer science.
In this regard, this work aims to study the effect of the exposure of four liquids (HCl 5%, HCl 10%, 70% Ethyl alcohol and 50% diluted detergent) in WPU and how the addiction of GO in WPU matrix can influence in this behavior, based in diffusion approach, tensile properties and infrared spectroscopy. No scientific work has been found in the database exploring this subject so far.
2. Materials and Methods
2.1 Materials
Waterborne polyurethane, a commercial grade provided from Holf Hacker®, was used as supplied. This product is used as a waterproof agent in civil buildings, applied as a coating in concrete surfaces, wood and floors.
2.2 GO Synthesis and WPU/GO preparation
GO Synthesis follows a modified Hummers method[20] Natural graphite flakes (5.0 g - 140 mesh) was intercalated with 100 mL of a freshly prepared mixture of sulfuric-nitric acid (4:1 v/v) to yield graphite intercalation. The resulting mixture was stirred for 16 h, and then filtered through a Hirsch funnel. The resulting product was rinsed with deionized water (DI) until the filtrate reached neutrality and then dried in an oven for 24 h at 80 °C. The dried intercalated graphite was expanded by irradiation in a microwave oven (1.2 kW, Consul, Brazil) for 3-5 min. The expanded graphite was mixed with a 35% hydroalcoholic ethanol solution, followed by sonication for 5 min (50% amplitude) with an immersion ultrasonic probe (Sonics Vibra Cell Vc 505, 500W, 20 kHz, Sonics & Materials) at room temperature. The exfoliated graphite was filtered, washed with DI, air-dried for 24 h, and then dried at 80 °C overnight. An additional oxidation reaction was carried out using 1.0 g of exfoliated graphite with a solution of 0.5 g of NaNO3 in 25 mL of concentrated H2SO4. The mixture was stirred for 40 min in an ice bath. KMnO4 (3.0 g) was added, and additional stirring was carried on for an additional 2 h. The mixture was then left to rest at room temperature for 30 min, and excess H2O2 (5%) was added. The resulting mixture was rapidly heated up to 90 °C in a water bath and filtered through a TeflonTM membrane (Milipore VVLP type 0.1 μM). The residue was washed with DI, air-dried for 24 h, and then dried at 80 °C in an oven, yielding 3.15 g of GO.
WPU/GO thin films were prepared by directly mixing GO in the WPU solution as provided. Initially, the water content in the polyurethane solution was measured and subtracted in the calculation of GO ratio, as this water evaporates during the coalescence and cure of the WPU film when it dries. The WPU and WPU/GO solutions were cast in PTFE (polytetrafluoroethylene) molds and dried at room temperature (~28°C). The GO in specific ratio was added in a Becker containing WPU and put in vigorous magnetic stirrer for 2h. The GO ratios used in this work were 0.25, 0.5, and 1%w/w[7-12] .
2.3 Diffusion parameter
Swelling experiments were performed at WPU or WPU/GO film samples immersed in four liquids, HCl 5%, HCl 10%, 70% ethyl alcohol and 50% diluted solution of a commercial dishwashing detergent in deionized (DI) water. The films used in this test measured approximately 0.8x10x20 mm and were used in triplicate for each liquid. Film samples were placed in glass flasks with about 100 mL of each liquid at room temperature for an extended period (up to 1500 hours), until the plateau region reached stability and could be clearly identified. At regular intervals, the samples were removed from the liquid, carefully dried with paper towels, quickly weighed (APX-200 balance, 0.01mg precision, Denver Instruments), and then returned to the soaking bath. Sorption graphics of the samples can provide the diffusion parameters for surface-active liquids in the PU, using equations such as Fick’s 2nd law of diffusion[21]:
where ‘CD’ is the concentration of the diffusing substance, ‘D’ is the diffusion parameter and ‘t’ is time. A solution to the above equation for diffusion in a flat sheet with surfaces maintained at a constant concentration is given by Crank’s Equation[22] as: ( ) ( ) 22
where ‘L’ is the thickness of the sheet, ‘MT’ and ‘M ∞’ are, respectively, the mass of the diffusing substance after a given soaking time ‘t’ and at the final sorption time (equilibrium) ‘∞’. The ratio Mt /M ∞ ratio in Equation 3 can be expressed as[21]: ( ) ( ) // tsdd MMWWWW ∞∞
where ‘WD’ is the weight of the dry sample, ‘WS’ is the sample weight after a given soaking time ‘t’, and ‘W ∞ ’ is the sample weight in the sorption equilibrium. In short soaking times, the mass of the diffusing substance can be considered as proportional to √t. This approximation is called The Square-Root-of-Time law[23] or Stefan’s approximation[21] which is given by Equation 4:
Chemical and mechanical resistance of waterborne polyurethane/graphene (WPU/GO) nanocomposite coatings
A plot of Mt/M∞ versus the square root of sorption time (√t) is generally termed as ‘sorption curve’ and ‘D’ is calculated from the slope of the initial linear portion of this curve[21,24] A Fickian-type diffusion is characterized by diffusion rates lower than polymer segmental relaxations, owing to various modes of interaction within the penetrant-polymer system, such as mechanical and structural interactions[21]
2.4 Tensile strength test
Stress-strain curves were obtained on an Intermetric IM100 mechanical test machine, using a crosshead speed of 20mm/min (ASTM D 882-18). The tests were conducted on pure WPU thin films and WPU/GO thin films in all GO ratio described above. The chosen film (optimal GO ratio) was the one that exhibited the best performance in the tensile tests. Tensile tests on aged WPU and WPU/GO films were performed under the same conditions, except that films were left immersed for 72h in the specific liquid prior the tensile tests for accelerated aging[25,26] The samples dimensions were approximately 0.8x10x100mm, obtained through casting in PTFE molds (the same method described on section 2.2 above).
2.5 FTIR
Infrared spectra were acquired using the FTIR Jasco Spectrophotometer, model 4600, with 32 scans, a resolution
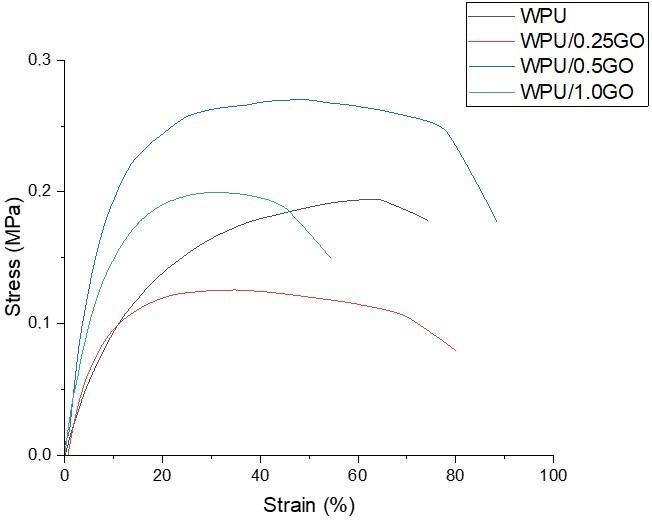
of 4 cm−1, in transmission mode within the range of 4000-400 cm−1, employing the Attenuated Total Reflectance (ATR) technique. Aged films were tested as well under the same conditions as the mechanical tests.
3. Results and Discussions
3.1 Tensile strength tests for best GO ratio in the WPU matrix
Tensile strength tests were initially performed on WPU matrices with varying GO ratios to determine the ratio that yielded the best mechanical performance. Figure 1 shows the stress-strain curves for pure WPU and WPU/GO formulations. As evident from the curves, the optimal GO ratio in the WPU matrix, considering mechanical performance, was 0.5%w/w. The maximum tensile strength for this ratio was approximately 0.28 MPa, whereas for the pure WPU and other GO ratios, it remained below 0.20 MPa. This represents a 40% improvement in this property. The maximum strain (elongation at break) for the 0.5% ratio also achieved the best value, reaching 77%, indicating a 25% improvement compared to pure WPU. Zhang et al.[14] has found a significant improvement in the mechanical strength of WPU using a functionalized GO at 0.5 wt% as the optimal ratio. Wan and Chen[27] demonstrated an overall improvement in the mechanical resistance of WPU/GO with increasing GO content. Considering that 0.5% w/w of GO content in WPU exhibited the best overall mechanical behavior, this ratio was selected for subsequent tests in this study and will be referred to as WPU/0.5GO henceforth. Figure 2 and Table 1 depict mechanical properties of the films based on GO ratio.
3.2 Diffusion parameters
The D values are crucial for predicting the material’s susceptibility to environmental stress cracking (ESC),
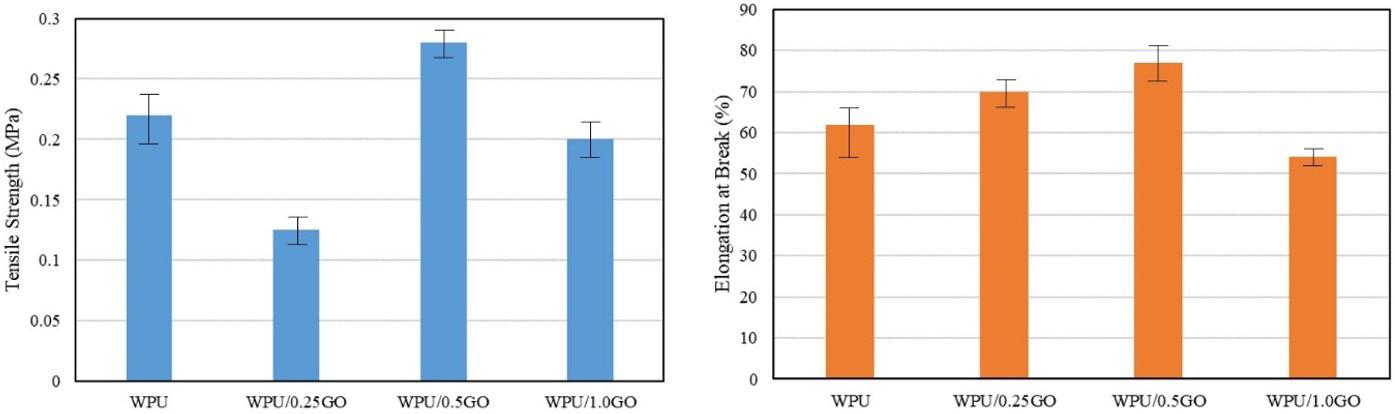
Figure 1. Stress-strain curves for pure waterborne polyurethane and WPU/GO nanocomposites.
Table 1. Mechanical properties of WPU and WPU/GO films.
Figure 2. Tensile Strength and strain capacity of WPU and WPU/GO nanocomposites.
Silva, P. P. O., Melo, E. J. D., Espíndola, A. I. C., Florentino, M. V. F., Silva, A. P. L., & Santos, E. N.
which can ultimately lead to polymer rupture and failure under operational conditions[28]. To measure this parameter, sorption tests were conducted, and the obtained sorption curves are depicted in the figures below. For WPU and WPU/0.5GO immersed in HCl 5%, the diffusion parameter found were 1.03x10⁻⁸ ±20% m2/s and 8.63x10⁻⁸±24% m2/s, respectively. It is noteworthy that, at the beginning of the sorption process, WPU chains underwent a chemical reaction with HCl, contributing to the formation of bubbles on the surface of WPU films and resulting in weight loss rather than weight gain. This effect was observed in both pure WPU and WPU/0.5GO films, as shown in Figure 3 (left). The phenomenon of bubble formation has been noted by other researchers and attributed to a chemical reaction between the acid and polyurethane material[29]. Waterborne polyurethanes contain various functional groups, such as hydroxyl and carbonyl groups, which can react with acids like hydrochloric acid. The acid can initiate a reaction with these functional groups, leading to the formation of gas bubbles as a byproduct[29]. Additionally, the composition and structure of the waterborne polyurethane can influence the formation of bubbles when exposed to hydrochloric acid. For example, glucose and sulfamate double-modified biodegradable waterborne polyurethane have been shown to have better acid resistance properties, which may affect the formation of bubbles[30]. Similarly, cationic waterborne
polyurethanes synthesized from waste frying oil have been found to exhibit resistance to both acid and alkaline environments, which may impact bubble formation[31]. Despite this, after the weight loss, it can be observed that Fickian diffusion behavior takes place, typically indicating liquid uptake and a plateau region after saturation[28,32]. Although graphene oxide promoted better mechanical behavior, for HCl 5%, WPU thin films became more susceptible to swelling and liquid diffusion. There are no references regarding measuring diffusion parameters in WPU or in WPU/GO nanocomposites. However, this behavior can be attributed to the oxygenated groups in GO structure that can react with oxygen in aqueous media, subtracting the reinforcement structure of GO in WPU matrix[33]. The same trend can be observed for diffusion parameters of HCl 10% in WPU and WPU/0.5GO films. Figure 3 (right) depicts sorption curves for WPU and WPU/0.5GO immersed in HCl 10%. The diffusion parameters for HCl 10% in WPU and WPU/0.5GO were respectively 9.96x10⁻⁸ ±20% and 5.91x10⁻⁷ ±14% m2/s. Figure 4 shows bubbles formed in WPU surfaces when immersed in HCl medium.
For WPU and WPU/0.5GO immersed in diluted detergent, a severe degradation process took place. Nevertheless, it was observed that graphene oxide protected the films to a certain extent, because in the pure waterborne polyurethane thin films, after 76 hours of immersion, the films started do
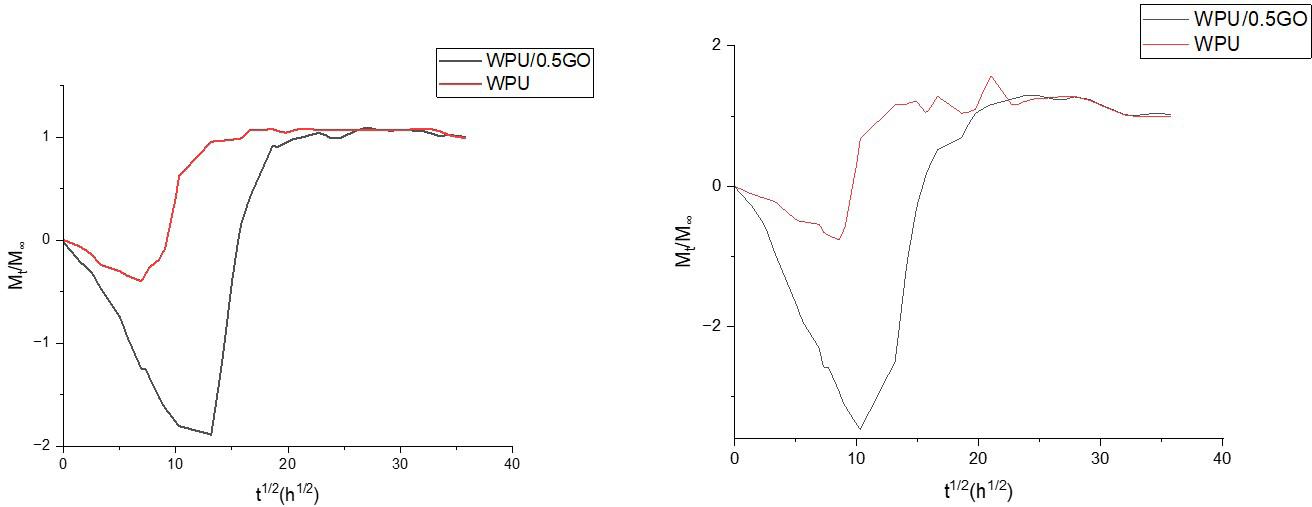
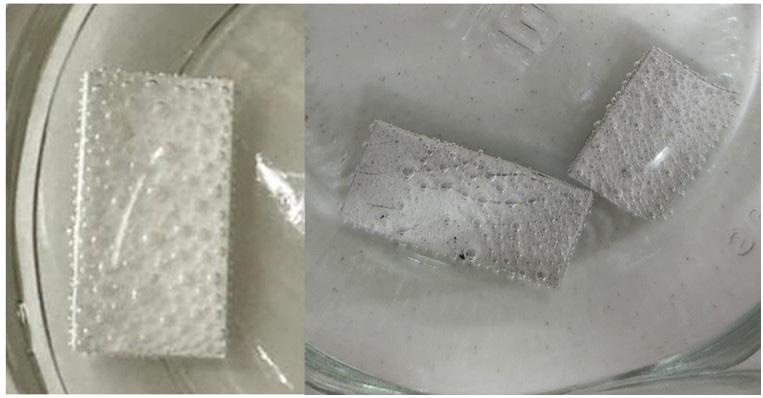
Figure 3. Sorption curve for WPU and WPU/0.5GO immersed in HCl 5% (left) and HCl 10% (right).
Figure 4. WPU and WPU/0.5GO films exhibiting bubble formation when immersed in diluted HCl due chemical reactions.
Chemical and mechanical resistance of waterborne polyurethane/graphene (WPU/GO) nanocomposite coatings
degrade, losing weight over time and visually cracking and breaking into small pieces. In the films containing GO, this process took place as well but only started after 226 hours of liquid exposure, and the mass loss was less pronounced (i.e. the slope of the curve was smaller). This behavior classifies the swelling phenomenon as non-Fickian[28] Figure 5 shows the variation in the films’ weight over time, and Figure 6 presents sample pictures depicting the degradation process occurring in the films.
Finally, for 70% ethyl alcohol, the D values for WPU and WPU/0.5GO were respectively 9.05x10⁻⁹ ±17.7% and 5.71x10⁻⁹ ±20.1% m2/s. Here, as in detergent, GO improved the resistance of the polyurethane chain to alcohol uptake by about 37%. However, contrary to the behavior in detergent, WPU and WPU/GO films underwent minor degradation after reaching the inflection point of the swelling curve. However, contrary to the behavior in detergent, WPU and WPU/GO films underwent minor degradation after reaching
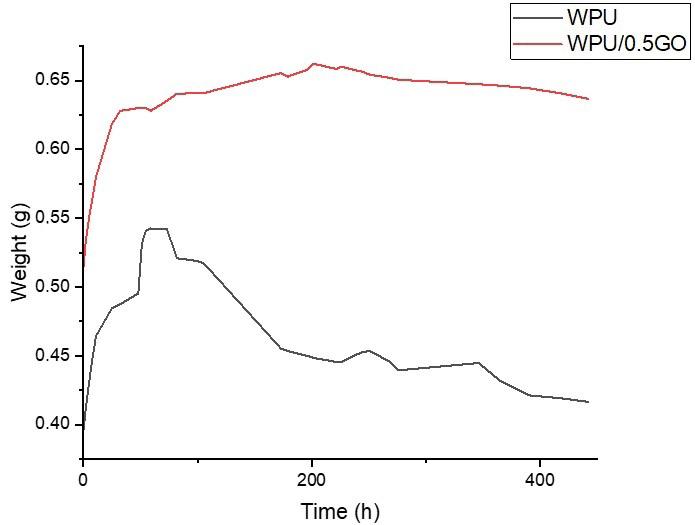
the inflection point of the swelling curve. It is important to highlight that for COVID-19 disease, 70% ethyl alcohol is the most commonly used liquid for surface sterilization[34,35] Figure 7 shows sorption curves for 70% alcohol in WPU and WPU/0.5GO.
3.3 Mechanical tests after accelerated aging
Mechanical tests were performed on pure WPU and WPU/0.5GO under 72h of aging in each of the four liquids. Figure 8 displays stress-strain curves for all cases. Overall, GO has improved mechanical tensile strength, Young’s modulus and elongation at break. These results are consonant with other research studies[27,36,37] and demonstrate the significant impact of GO on improving the mechanical properties of polymeric matrices. WPU/0.5GO outperformed pure WPU in terms of mechanical performance under chemical aging. Furthermore, among all the liquids, 70% alcohol had a more pronounced effect on decreasing the tensile strength of WPU thin films, even though detergent was the most degrading liquid in swelling experiments. Although this behavior may appear surprising, similar behavior have been observed in other polymeric systems. This likely occurred because the polar part of PU chain, as C=O, was attacked by the high polarity part of alcohol chain. This phenomenon was attributed to a match between dispersion and polar cohesion energy of Hansen’s solubility parameters of ethyl alcohol and polyurethane[28,38]. For PU, the energy from polar intermolecular forces δP is 9,3 and for ethyl alcohol is 8.8 MPa0.5 and from dispersive δD is 18.1 and 15.8 MPa0.5 [39]. WPU, under 70% alcohol aging, became significantly more deformable, as its strain capacity increased by almost 100% compared to pure WPU without chemical aging. It is worth noting that despite HCl 5% and 10% having a diffusion parameter greater in WPU/GO than in pure WPU, for mechanical tests, GO improved WPU mechanical resistance. Tensile strength for pure WPU decreased more when immersed in HCl than WPU/GO immersed in the same solution.
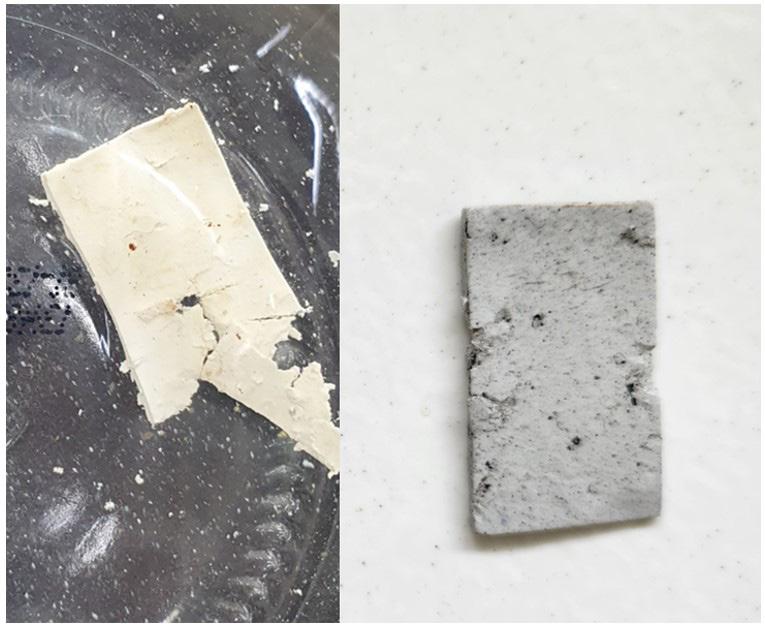
Figure 5. Weight variation of WPU and WPU/0.5GO immersed in diluted detergent.
Figure 6. WPU and WPU/GO films cracked after detergent immersion.
Silva, P. P. O., Melo, E. J. D., Espíndola, A. I. C., Florentino, M. V. F., Silva, A. P. L., & Santos, E. N.
Table 2 summarizes mechanical properties from tensile stress experiments.
3.4 FTIR analysis
Figure 9 displays FTIR spectra of graphite, GO, WPU and WPU/0.5GO. The GO spectrum exhibits oxygenated functional groups aggregated in the graphite matrix after all the oxidation steps used to transform pure graphite powder into graphene oxide. Absorption peaks for GO have been identified at 1086 cm−1 (C–O stretching), 1721 cm−1 (C=O stretching) and 3296 cm−1 (O-H stretching)[40]. The spectra of WPU and WPU/0.5GO are similar, as the amount of GO in the WPU matrix is very small, and the GO peaks overlap with the more intense bands of WPU. A weak peak was observed at approximately 3350 cm−1, corresponding to the N–H stretching vibration. The two duplets observed at 2872 and 2954 cm−1 are assigned to the C–H stretching vibrations of urethane bonds. The peak at 1725 cm-1 corresponds to C=O stretching from the urethane group. The N−H (Symmetrical bending) band from urea group at 1465 cm-1 was observed. The peak at 1160 cm-1 is attributed to C−O−C (ether) asymmetrical stretching[41,42] .
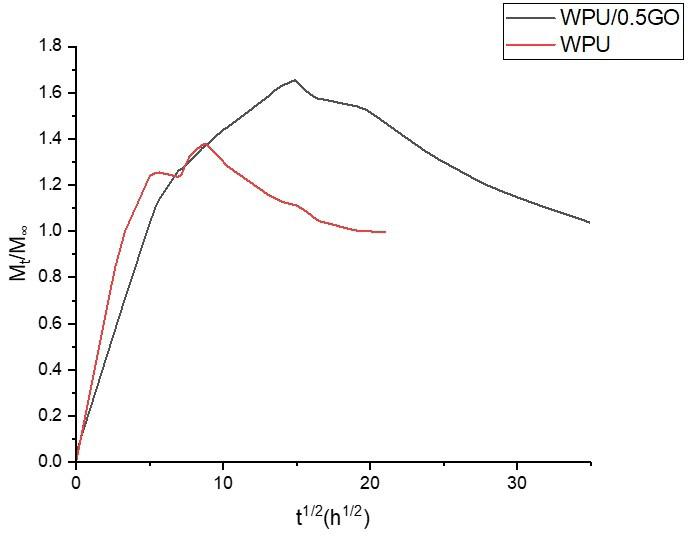
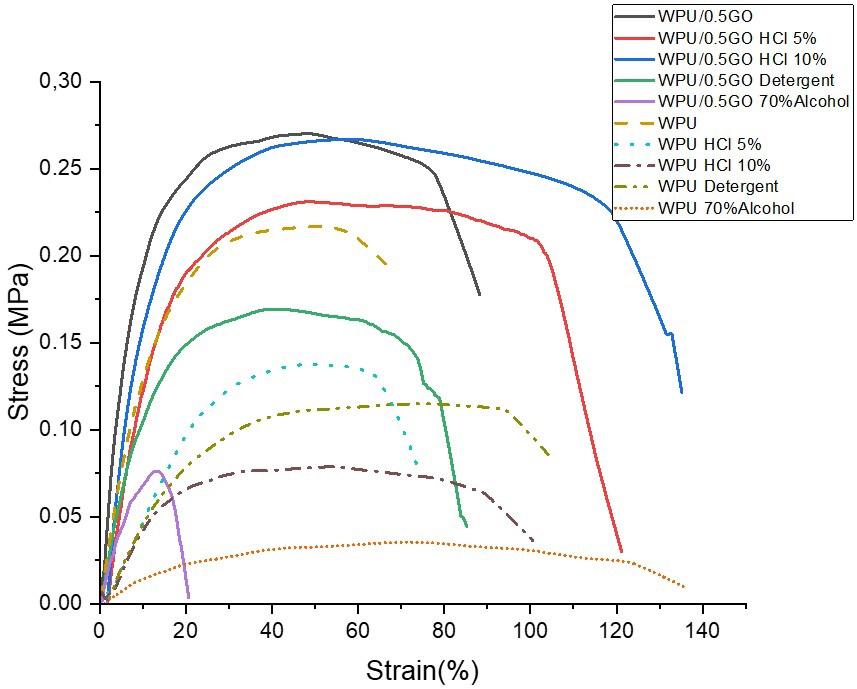
Figure 10 illustrates the FTIR spectra for WPU and WPU/0.5GO in various scenarios, without chemical aging and with chemical aging. It is evident that the spectra bear a striking resemblance to each other. This similarity suggests that chemical reactions did not occur when the films were immersed in the liquids, with the exception of the peak at 876 cm-1, attributed to bending vibration from C-O-C. Notably, this peak disappears in films aged in HCl[43] This can be explained by the fact that bubble formation in the film surfaces were formed, as discussed in section 3.2 above, and chemical reactions with the HCl and WPU took place. The chemical reaction of hydrochloric acid with the C-O-C group from polyurethane involves the cleavage of the C-O-C bond that can result in the degradation of the polyurethane structure and the formation of by-products. This finding aligns with the outcomes discussed in the mechanical properties section. Additionally, in HCl and detergent media, the spectra present a more intense and wider peak in the region 3200-3600 cm−1. This appears to indicate additional formation of -OH broader peaks in the region, and suggests chemical reactions between the media and WPU
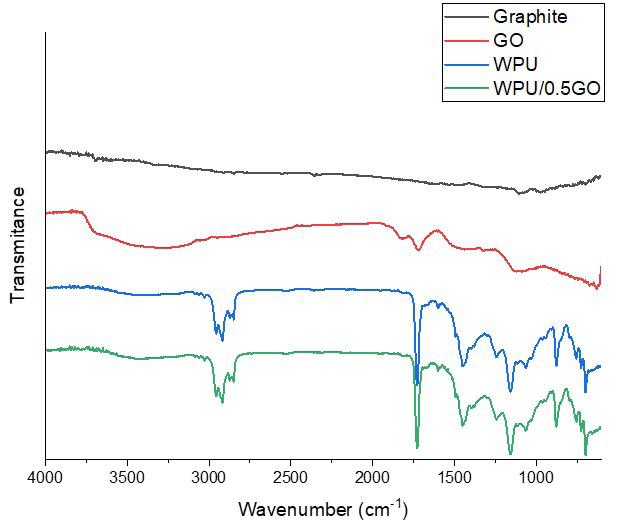
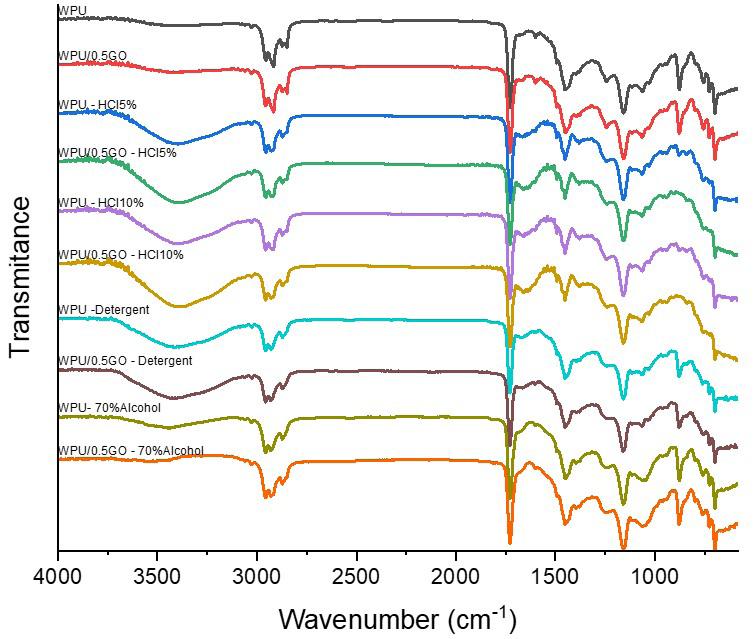
Figure 7. Sorption curve for WPU and WPU/0.5GO immersed in 70% ethyl alcohol.
Figure 8. Stress-strain curves for WPU and WPU/0.5GO in all scenarios.
Figure 9. FTIR spectra of graphite, GO, WPU and WPU/0.5GO.
Figure 10. FTIR spectra for WPU and WPU/0.5GO in all scenarios.
Chemical and mechanical resistance of waterborne polyurethane/graphene (WPU/GO) nanocomposite coatings
Table 2. Mechanical properties of WPU and WPU/0.5GO in all scenarios.
demonstrated the ability to enhance the overall resistance of WPU to these liquids.
5. Author’s Contribution
• Conceptualization – Pietro Paolo de Oliveira e Silva.
• Data curation – Pietro Paolo de Oliveira e Silva; Enderson José Dias de Melo; Elinaldo Neves dos Santos.
• Formal analysis – Pietro Paolo de Oliveira e Silva; Arthur Israel Carneiro Espíndola; Marcus Vinicius Fernandes Florentino.
WPU/0.5GO HCl 5%
WPU/0.5GO HCl 10%
WPU/0.5GO Detergent
WPU/0.5GO 70% Alcohol
matrix. For HCl, these reactions can lead to the formation of hydroxyl groups (OH) and typically involve the breaking of existing bonds in polyurethane, especially those containing oxygen atoms, such as esters and urethane groups. The H+ ions from hydrochloric acid can react with the functional groups in polyurethane, leading to the release of water and the formation of new bonds. Consequently, hydroxyl groups may be incorporated into the structure, depending on the specific characteristics of the polyurethane and the reaction conditions. These modifications in the chemical structure can have significant effects on the physical and mechanical properties of polyurethane[44,45]
4. Conclusions
Previous mechanical tensile tests indicated that a GO concentration of 0.5%w/w was optimal in the WPU matrix. Sorption tests revealed that common Covid-19 cleaners used in this study should be avoided for prolonged exposure on surfaces protected with waterborne polyurethane (WPU) coatings, as WPU tends to absorb them. Among the four liquids, diluted dishwasher detergent proved to be the most aggressive during extended exposure, leading to severe cracks in WPU films. Surprisingly, graphene oxide provided overall protection from degradation, even exhibiting greater diffusion parameters than pure WPU for HCl solutions. In mechanical tensile experiments under chemical aging, WPU/GO nanocomposites demonstrated greater tensile strength and Young modulus, even when exposed to liquids. Despite 50% diluted detergent being the most aggressive liquid for extended WPU exposure, 70% ethyl alcohol emerged as the most aggressive solution, reducing the mechanical performance of both WPU and WPU/GO nanocomposite. This phenomenon was attributed to Hansen solubility parameters. FTIR spectra suggests that HCl promotes a chemical reaction in WPU main chain, leading to bubble formation and the suppression of C-O-C bands. Therefore, liquids such HCl 5%, HCl 10%, detergent solution and 70% alcohol- typical substances used for cleaning surfaces against biological contamination likeSARS-CoV-2- should be avoided in contact with WPU coatings. Notably, GO
• Funding acquisition – Pietro Paolo de Oliveira e Silva.
• Investigation – Pietro Paolo de Oliveira e Silva; Enderson José Dias de Melo; Arthur Israel Carneiro Espíndola; Elinaldo Neves dos Santos.
• Methodology – Pietro Paolo de Oliveira e Silva; Enderson José Dias de Melo; Marcus Vinicius Fernandes Florentino; Ana Paula Lima da Silva.
• Project administration – Pietro Paolo de Oliveira e Silva.
• Resources – Pietro Paolo de Oliveira e Silva.
• Software – NA.
• Supervision – Pietro Paolo de Oliveira e Silva.
• Validation – Pietro Paolo de Oliveira e Silva; Arthur Israel Carneiro Espíndola.
• Visualization – Pietro Paolo de Oliveira e Silva; Enderson José Dias de Melo; Ana Paula Lima da Silva.
• Writing – original draft – Pietro Paolo de Oliveira e Silva.
• Writing – review & editing – Pietro Paolo de Oliveira e Silva.
6. Acknowledgements
The authors thank Wolf Hacker & cia Ltda for polyurethane supplying.
7. References
1 Zhou, X., Fang, C., Lei, W., Su, J., Li, L., & Li, Y. (2017). Thermal and crystalline properties of waterborne polyurethane by in situ water reaction process and the potential application as biomaterial. Progress in Organic Coatings, 104, 1-10 http:// doi.org/10.1016/j.porgcoat.2016.12.001
2 Noreen, A., Zia, K. M., Zuber, M., Tabasum, S., & Saif, M. J. (2016). Recent trends in environmentally friendly water-borne polyurethane coatings: A review. Korean Journal of Chemical Engineering, 33(2), 388-400 http://doi.org/10.1007/s11814015-0241-5.
3 Liu, Z., Wu, B., Jiang, Y., Lei, J., Zhou, C., Zhang, J., & Wang, J. (2018). Solvent-free and self-catalysis synthesis and properties of waterborne polyurethane. Polymer, 143, 129-136 http://doi.org/10.1016/j.polymer.2018.04.010
4 Liu, X., Hong, W., & Chen, X. (2020). Continuous production of water-borne polyurethanes: a review. Polymers, 12(12), 2875. http://doi.org/10.3390/polym12122875. PMid:33266183.
5 Alvarez, G. A., Fuensanta, M., Orozco, V. H., Giraldo, L. F., & Martín-Martínez, J. M. (2018). Hybrid waterborne polyurethane/acrylate dispersion synthesized with bisphenol
Silva, P. P. O., Melo, E. J. D., Espíndola, A. I. C., Florentino, M. V. F., Silva, A. P. L., & Santos, E. N.
a-glicidylmethacrylate (bis-gma) grafting agent. Progress in Organic Coatings, 118, 30-39 http://doi.org/10.1016/j. porgcoat.2018.01.016
6 Luo, S., Yang, K., Zhong, Z., Wu, X., & Ren, T. (2018). Facile preparation of degradable multi-arm-star-branched waterborne polyurethane with bio-based tannic acid. RSC Advances, 8(66), 37765-37773 http://doi.org/10.1039/C8RA07875K PMid:35558615.
7. Cai, D., Yusoh, K., & Song, M. (2009). The mechanical properties and morphology of a graphite oxide nanoplatelet/ polyurethane composite. Nanotechnology, 20(8), 085712 http:// doi.org/10.1088/0957-4484/20/8/085712 PMid:19417473.
8 Bera, M., & Maji, P. K. (2017). Effect of structural disparity of graphene-based materials on thermo-mechanical and surface properties of thermoplastic polyurethane nanocomposites. Polymer, 119, 118-133 http://doi.org/10.1016/j.polymer.2017.05.019
9 Song, W., Wang, B., Fan, L., Ge, F., & Wang, C. (2019). Graphene oxide/waterborne polyurethane composites for fine pattern fabrication and ultrastrong ultraviolet protection cotton fabric via screen printing. Applied Surface Science, 463, 56-65
10 Kumar, A., Sharma, K., & Dixit, A. R. (2019). A review of the mechanical and thermal properties of graphene and its hybrid polymer nanocomposites for structural applications. Journal of Materials Science, 54(8), 5992-6026 http://doi.org/10.1007/ s10853-018-03244-3
11 Kumar, A., Sharma, K., & Dixit, A. R. (2022). Effects of various functional groups in graphene on the tensile and flexural properties of epoxy nanocomposites: a comparative study. Fullerenes, Nanotubes, and Carbon Nanostructures, 30(11), 1123-1133 http://doi.org/10.1080/1536383X.2022.2077332
12 Kumar, A., Sharma, K., & Dixit, A. R. (2023). Tensile, flexural and interlaminar shear strength of carbon fiber reinforced epoxy composites modified by graphene. Polymer Bulletin, 80(7), 7469-7490 http://doi.org/10.1007/s00289-022-04413-w
13 Kale, M. B., Luo, Z., Zhang, X., Dhamodharan, D., Divakaran, N., Mubarak, S., Wu, L., & Xu, Y. (2019). Waterborne polyurethane/graphene oxide-silica nanocomposites with improved mechanical and thermal properties for leather coatings using screen printing. Polymer, 170, 43-53 http:// doi.org/10.1016/j.polymer.2019.02.055
14 Zhang, F., Liu, W., Wang, S., Jiang, C., Xie, Y., Yang, M., & Shi, H. (2019). A novel and feasible approach for polymer amine modified graphene oxide to improve water resistance, thermal, and mechanical ability of waterborne polyurethane. Applied Surface Science, 491, 301-312. http://doi.org/10.1016/j. apsusc.2019.06.148
15 Pokharel, P., & Lee, D. S. (2014). High performance polyurethane nanocomposite films prepared from a masterbatch of graphene oxide in polyether polyol. Chemical Engineering Journal, 253, 356-365 http://doi.org/10.1016/j.cej.2014.05.046
16. Cao, J., & Wang, C. (2017). Multifunctional surface modification of silk fabric via graphene oxide repeatedly coating and chemical reduction method. Applied Surface Science, 405, 380-388 http://doi.org/10.1016/j.apsusc.2017.02.017
17 Kong, L., Xu, D., He, Z., Wang, F., Gui, S., Fan, J., Pan, X., Dai, X., Dong, X., Liu, B., & Li, Y. (2019). Nanocellulosereinforced polyurethane for waterborne wood coating. Molecules, 24(17), 3151. http://doi.org/10.3390/molecules24173151. PMid:31470628.
18 Jing, J. L. J., Yi, T. P., Bose, R. J. C., McCarthy, J. R., Tharmalingam, N., & Madheswaran, T. (2020). Hand sanitizers: a review on formulation aspects, adverse effects, and regulations. International Journal of Environmental Research and Public Health, 17(9), 3326 http://doi.org/10.3390/ijerph17093326 PMid:32403261.
19 Sharafi , S. M. , Ebrahimpour, K. , & Nafez , A. (2021 ). Environmental disinfection against covid-19 in different areas
of health care facilities: a review. Reviews on Environmental Health, 36(2), 193-198 http://doi.org/10.1515/reveh-2020-0075 PMid:32845869.
20 Lima, T. B. S., Silva, V. O., Araujo, E. S., & Araujo, P. L. B. (2019). Polymer nanocomposites of surface-modified graphene. I: thermal and electrical properties of poly(vinyl alcohol)/ aminoacidfunctionalized graphene. Macromolecular Symposia, 383(1), 1800051 http://doi.org/10.1002/masy.201800051
21 Ramani, R., Shariff, G., Thimmegowda, M. C., Sathyanarayana, P. M., Ashalatha, M. B., Balraj, A., & Ranganathaiah, C. (2003). Influence of gamma irradiation on the formation of methanol-induced micro-cracks in polycarbonate. Journal of Materials Science, 38(7), 1431-1438 http://doi. org/10.1023/A:1022951926769
22 Crank, J. S. (1975). The mathematics of diffusion Oxford: Oxford University Press
23. Tarcha, P. J. (Ed.). (1990). Polymers for controlled drug delivery. Boca Raton: CRC Press
24 Al-Saidi, L. F., Mortensen, K., & Almdal, K. (2003). Environmental stress cracking resistance: behavior of polycarbonate in different chemicals by determination of the time-dependence of stress at constant strains. Polymer Degradation & Stability, 82(3), 451-461. http://doi.org/10.1016/S0141-3910(03)00199-X.
25 Oasmaa, A., & Kuoppala, E. (2003). Fast pyrolysis of forestry residue. 3. Storage stability of liquid fuel. Energy & Fuels, 17(4), 1075-1084. http://doi.org/10.1021/ef030011o.
26 Fuensanta, M., Khoshnood, A., Rodríguez‐Llansola, F., & Martín-Martínez, J. M. (2020). New waterborne polyurethaneurea synthesized with ether-carbonate copolymer and aminoalcohol chain extenders with tailored pressure-sensitive adhesion properties. Materials, 13(3), 627 http://doi.org/10.3390/ ma13030627. PMid:32023838.
27 Wan, T., & Chen, D. (2018). Mechanical enhancement of selfhealing waterborne polyurethane by graphene oxide. Progress in Organic Coatings, 121, 73-79. http://doi.org/10.1016/j. porgcoat.2018.04.016
28 Silva, P. P. O., Araújo, P. L. B., Silveira, L. B. B., & Araújo, E. S. (2017). Environmental stress cracking in gammairradiated polycarbonate: a diffusion approach. Radiation Physics and Chemistry, 130, 123-132 http://doi.org/10.1016/j. radphyschem.2016.08.006.
29 Yan, J., Li, X., Zhang, X., Liu, S., Zhong, F., Zhang, J., Zhang, Q., & Yan, Y. (2022). Metallo-polyelectrolyte-based waterborne polyurethanes as robust HCl corrosion inhibitor mediated by inter/intramolecular hydrogen bond. ACS Applied Polymer Materials, 4(5), 3844-3854 http://doi.org/10.1021/ acsapm.2c00306.
30 Wu, G., Li, Y., Yang, Z., & Zhang, H. (2021). Preparation and characterization of glucose and sulfamate double‐modified biodegradable waterborne polyurethane. ChemistrySelect, 6(31), 8140-8149 http://doi.org/10.1002/slct.202101706
31 Phunphoem, S., Saravari, O., & Supaphol, P. (2019). Synthesis of cationic waterborne polyurethanes from waste frying oil as antibacterial film coatings. International Journal of Polymer Science, 2019, 2903158 http://doi.org/10.1155/2019/2903158
32 Dolmaire, N., Espuche, E., Méchin, F., & Pascault, J.-P. (2004). Water transport properties of thermoplastic polyurethane films. Journal of Polymer Science. Part B, Polymer Physics, 42(3), 473-492 http://doi.org/10.1002/polb.10716
33 Buszek, R. J., Barker, J. R., & Francisco, J. S. (2012). Water effect on the OH + HCl reaction. The Journal of Physical Chemistry A, 116(19), 4712-4719 http://doi.org/10.1021/ jp3025107 PMid:22563978.
34. Berardi, A., Perinelli, D. R., Merchant, H. A., Bisharat, L., Basheti, I. A., Bonacucina, G., Cespi, M., & Palmieri, G. F. (2020). Hand sanitisers amid covid-19: A critical review
Chemical and mechanical resistance of waterborne polyurethane/graphene (WPU/GO) nanocomposite coatings
of alcohol-based products on the market and formulation approaches to respond to increasing demand. International Journal of Pharmaceutics, 584, 119431 http://doi.org/10.1016/j. ijpharm.2020.119431 PMid:32461194.
35 Hashemi, F., Hoepner, L., Hamidinejad, F. S., Haluza, D., Afrashteh, S., Abbasi, A., Omeragić, E., Imamović, B., Rasheed, N. A., Taher, T. M. J., Kurniasari, F., Wazqar, D. Y., Apalı, Ö. C., Yildirim, A. D., Zhao, B., Kalikyan, Z., Guo, C., Valbuena, A. C., Mititelu, M., Pando, C. M., Saridi, M., Toska, A., Cuba, M. L., Kwadzokpui, P. K., Tadele, N., Nasibova, T., Harsch, S., Munkh-Erdene, L., Menawi, W., Evangelou, E., Dimova, A., Marinov, D., Dimitrova, T., Shalimova, A., Fouly, H., Suraya, A., Faquim, J. P. S., Oumayma, B., Annunziato, M. A., Lalo, R., Papastavrou, E., Ade, A. D., Caminada, S., Stojkov, S., Narvaez, C. G., Mudau, L. S., Rassas, I., Michel, D., Kaynar, N. S., Iqbal, S., Elshwekh, H., & Hossain, I. (2023). A comprehensive health effects assessment of the use of sanitizers and disinfectants during covid-19 pandemic: A global survey. Environmental Science and Pollution Research International, 30(28), 72368-72388 http://doi.org/10.1007/ s11356-023-27197-6 PMid:37166731.
36. Tounici, A., & Martín-Martínez, J. M. (2020). Addition of graphene oxide in different stages of the synthesis of waterborne polyurethane-urea adhesives and its influence on their structure, thermal, viscoelastic and adhesion properties. Materials, 13(13), 2899 http://doi.org/10.3390/ma13132899 PMid:32605195.
37 Feng, J., Wang, X., Guo, P., Wang, Y., & Luo, X. (2018). Mechanical properties and wear resistance of sulfonated graphene/waterborne polyurethane composites prepared by in situ method. Polymers, 10(1), 75 http://doi.org/10.3390/ polym10010075 PMid:30966110.
38 Silva, P. P. O., Araujo, P. L. B., Lima, T. B. S., & Araujo, E. S. (2022). The influence of Environmental Stress Cracking (ESC) and gamma irradiation on the mechanical properties of polycarbonate: study of synergistic effects. Materials
Research, 25, e20210342 http://doi.org/10.1590/1980-5373mr-2021-0342
39 Hansen , C. M. ( 2007 ). Hansen solubility parameters: a user’s handbook Boca Raton: CRC Press http://doi. org/10.1201/9781420006834.
40 Wang, Y., Shao, Y., Matson, D. W., Li, J., & Lin, Y. (2010). Nitrogen-doped graphene and its application in electrochemical biosensing. ACS Nano, 4(4), 1790-1798 http://doi.org/10.1021/ nn100315s PMid:20373745.
41. Li, Y., Chen, S., Shen, J., Zhang, S., Liu, M., Lv, R., & Xu, W. (2021). Preparation and properties of biobased, cationic, waterborne polyurethanes dispersions from castor oil and poly (caprolactone) diol. Applied Sciences, 11(11), 4784 http://doi. org/10.3390/app11114784
42. Cai, G., Shi, M., Gao, J., & Yuan, L. (2019). Preparation and photochromic properties of waterborne polyurethane containing spirooxazine groups. Journal of Applied Polymer Science, 136(7), 47067. http://doi.org/10.1002/app.47067.
43 Wang, Y., & Jin, L. (2018). Preparation and characterization of self-colored waterborne polyurethane and its application in eco-friendly manufacturing of microfiber synthetic leather base. Polymers, 10(3), 289 http://doi.org/10.3390/polym10030289 PMid:30966324.
44 Song, J., Wu, G., Shi, J., Ding, Y., Chen, G., & Li, Q. (2010). Properties and morphology of interpenetrating polymer networks based on poly(urethane-imide) and epoxy resin. Macromolecular Research , 18 (10), 944-950 http://doi. org/10.1007/s13233-010-1009-8
45 Gunashekar, S., & Abu-Zahra, N. (2015). Synthesis of functionalized polyurethane foam using bes chain extender for lead ion removal from aqueous solutions. Journal of Cellular Plastics, 51(5-6), 453-470 http://doi.org/10.1177/0021955X14559255
Received: Dec. 27, 2023
Revised: Mar. 08, 2024 Accepted: Mar. 26, 2024
Thermal evaluation of the calcium stearate influence on polystyrene by in-line colorimetry
Felipe Bernardo1* and Sebastião Vicente Canevarolo Junior2
1Programa de Pós-graduação em Ciência e Engenharia de Materiais – PPGCEM, Universidade Federal de São Carlos – UFSCar, São Carlos, SP, Brasil
2Departamento de Engenharia de Materiais – DEMa, Universidade Federal de São Carlos – UFSCar, São Carlos, SP, Brasil
*felipeocb@hotmail.com
Obstract
This paper investigates evidence regarding the influence of a CaSt2 residual additive in the optical properties of a commercial polystyrene. This work proposes an in-line optical detector operating by illuminating the polymer with a red monochromatic light in order to evaluate its thermal behavior during a heat cycling. The detection system was bench validated by measuring the light absorption of aqueous solutions of organic acid dyes. The system showed great sensitivity in detecting the contamination’s effect on the polymer, as a great impact on the polymer’s behavior was observed due to the presence of the additive during different thermal cycles. The detector system showed that the salt’s presence elevates absorbance by five times when the temperature is higher than its fusion temperature. The in-line optical detector has proved to be suitable to quantify the presence of additives that affects the polymer ’s optical properties.
Keywords: absorbance, calcium stearate, heat cycling, in-line optical detector, thermal characterization.
How to cite: Bernando, F., & Canevarolo Junior, S. V. (2024). Thermal evaluation of the calcium stearate influence on polystyrene by in-line colorimetry. Polímeros: Ciência e Tecnologia, 34(2), e20240017. https://doi.org/10.1590/01041428.20230130
1. Introduction
The color of a material is the result of the human visual perception of the combination of wavelengths not absorbed by a substance on which a beam of white light is impinged[1] Thus, color is not a specific property, depending how it interacts with the electromagnetic radiation. For instance, pure red color has its complementary color green and viceversa, as shown in Ostwald’s cycle[2]. In other words, a red object is red by our perception because the material absorbs mainly in the green’s wavelength letting pass light in the red’s wavelength color region.
The addition of chromophore species, i.e., conjugate systems that absorb light at a specific frequency[3], may enhances the attenuation of the light beam by absorption[4,5] This reduction in the intensity of the transmitted light beam (I) in relation to the initial intensity ( I0 ) supplied to the sample is given as a ratio between them, known as absorbance (A), given by Equation 1.
its physical state or chemical composition with the variation of concentration[7]
being ε the molar extinction coefficient (or molar absorptivity), d, the optical path length and, c, the concentration of the attenuating species, respectively.
Beer-Lambert’s Law, Equation 2, establishes a relation between absorbance and the concentration of chromophore species[6]. This law is only valid for monochromatic light beams and only if the absorbent substance doesn’t change
Colorimetry is an established characterization tool in polymer science which has the light’s attenuation by absorption as object of study, being used by many scholars[8-15]. Ordinarily, researchers focus on the influence of distinct chromophore species on polymeric systems, such as dyes[8-12], pigments[13] and others additives[14,15], although few works take into account the effects of temperature variation, which is a frequent feature in polymer processing and may change the optical contribution of, for instance, existing additive in terms of absorbance. Phillips et al.[16] evaluated the thermal behavior of metal stearate lubricant mixtures for polymer compounding applications. It was observed rheological changes for all samples through cooling cycles. Zhang et al.[17] investigated the structural evolution of zinc stearate (ZnSt2) and calcium stearate (CaSt2) in a polypropylene random copolymer (PPR) upon heating and cooling. The CaSt2 in PPR exhibited vitreous agglomerates with lamella ordered structure at low temperatures and transformed to diverse colloidal liquid crystal aggregates
during heating, showing the temperature dependence of its structure. Antunes et al.[18] investigated the effect of manganese stearate (MnSt) concentrations on the thermo-oxidative degradation of high density polyethylene. Temperatures from 60 °C to 80 °C were performed. It was shown that the additives were able to accelerate the oxidative abiotic degradation of the polymer and promote the biodegradation of the material. Bensaad et al.[19] studied the effects of CaSt2 as pro-oxidant agent on the degradation of polypropylene (PP) under natural exposure. The results showed that the concentration of 5% wt calcium stearate was sufficient to initiate the process of degradation. Despite these and other contributions, there is lack of studies focusing how temperature affect the impact of the polymer’s additives in its optical properties. The applied temperatures are still far from those found in real polymer processing conditions. In this context, the aim of this work was to evaluate the influence of temperature in the polymer processing range in the absorbance of a polystyrene (PS) additivated with calcium stearate by quantifying in-line the transmitted light attenuation by absorption during a thermal cycle process with temperatures ranging in the typical processing conditions.
2. Materials and Methods
2.1
Polymer
A commercial grade of polystyrene (PS) provided by Innova (Brazil), code N2560, with the presence of a single residual additive: Calcium stearate (CaSt2), was used in this work. Polystyrene is commonly additivated with low quantities of CaSt2, which acts as lubricant and releasing agent during molding[20]. In addition, it modifies the filler surface reducing water absorption, preventing agglomeration of the filler particles, and reduces the surface energy helping its dispersion[21]. Also the calcium stearate has a wide melting temperature range of Tm = 130 °C up to 180 °C[22]
2.2
Acid dyes
Water soluble organic acid dyes with the colors: Red (N-2R 200), Green (N-3G 200) and Blue (N-2R 200) provided by Quimanil Produtos Químicos Ltda (Brazil) were used in the previous stages of this work to evaluate the efficiency of the proposed detection system. The dyes chemical structures are presented in Figure 1
2.3 Thermal stage system
An optical microscope Leica DMRXP (Figure 2a) with a hot stage system CSS450 from Linkam Scientific
Instruments (Figure 2b) was used for thermo-optical characterization. This system constitutes of a hot chamber with two parallel quartz windows between which the specimen is positioned (Figure 2c), allowing efficient temperature control (-50 °C to 450 °C) at defined different heating rates.
2.4
In-line optical detector system
The in-line optical detector is placed over the two parallel quartz windows in the hot stage system. For this system, in one side is positioned the light emitting diode LED of red (630 nm) monochromatic wavelength and at the other side there is a single phototransistor in order to collect the transmitted light’s intensity. The light exiting the LED passes through the first transparent window, through the molten polymer stream, in which is attenuated by light absorption, exit through the second transparent window and, lastly, reaches the phototransistor which quantifies the transmitted light intensity. Changes in it are collected by software, developed in LabVIEW 8.6 (National InstrumentsTM) platform for data collection, realtime calculation, screen presentation and data archiving. The adopted optical configuration is in agreement with previous set-ups[15,23] .
2.5 Experimental procedure
2.5.1 Bench validation of the optical detector with aqueous solutions
The in-line optical detector was tested and its response validated quantitatively by using aqueous solutions of the reference dyes. To avoid metal oxidation a slit-die made of Teflon was constructed and used for the bench validation. A schematic representation of the complete validation system is presented in Figure 3
The validation set-up consists of a water circulating closed-loop, fed by a large beaker containing 1.0 Liter of filtered water, pumped by a submersed aquarium plastic pump, circulating through the Teflon slit-die, having it being fitted with the in-line optical detector. A concentrated mother water solution was prepared and stepwise added to the circulating system in known volumes via a syringe, increasing their content progressively. The concentrated solution is produced with 1.0 g of dye placed in 250 mL of water. After each addition of the concentrated solution, a 3 min minimum period is waited for complete mixing, and then the detector signal is recorded, measuring the transmitted light intensity and averaging during a 3 min time interval.
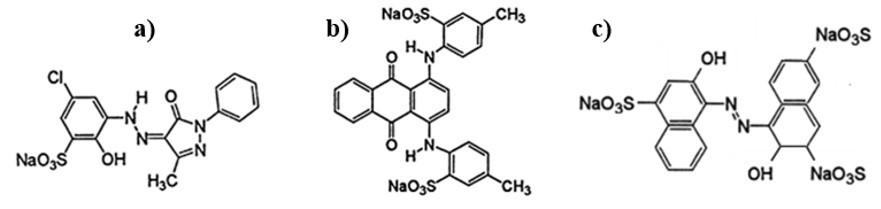
Bernardo, F., & Canevarolo Junior, S. V.
Figure 1. Chemical structure of the organic acid dyes: (a) red, (b) green and (c) blue.
Thermal evaluation of the calcium stearate influence on polystyrene by in-line colorimetry
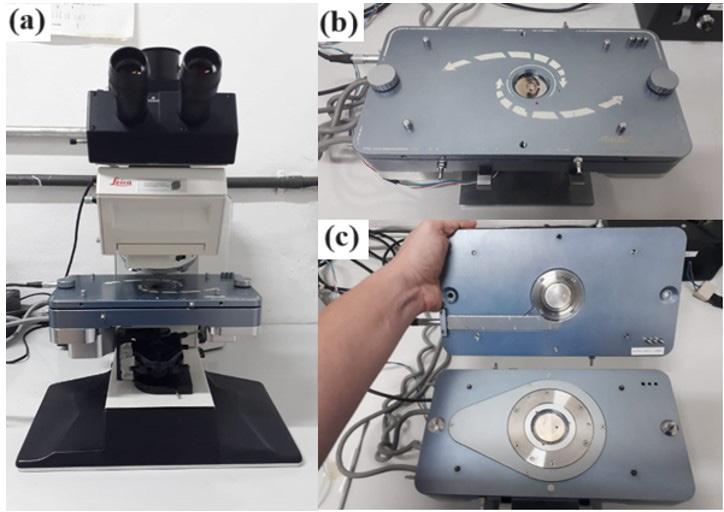
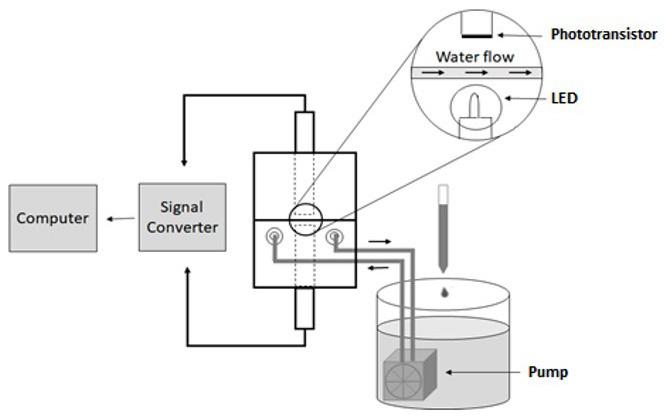
2.5.2 Optical evolution during the thermal cycling of the PS/CaSt2
The in-line optical detector was allocated in the Linkam thermal stage, and a complete thermal cyclic process was applied at a constant rate of 10 °C min-1, cooling from 210 °C down to 80 °C and heating back again to 210 °C. Each optical characterization analysis was repeated in triplicates for better accuracy of the results. Pellets of the polystyrene as received and pellets of the polystyrene after an extraction process were added between the two parallel quartz windows of the Linkam system, with a constant gap
of 1.5 mm. The extraction process was done solubilizing it with chloroform and then precipitating the solubilized polymer with ethanol. A period of one week was waited for the completed evaporation of residual solvents. Samples of PS after the additive extraction were obtained and the extracted residue was collected. During each thermal cycle, absorbance intensity measurements were collected as a function of the analysis temperature. By comparing the absorbance variations, information regarding the influence of the additive on the optical response of the polystyrene is quantified.
Figure 2. (a) The optical microscope (Leica DMRXP) fitted with the hot stage system (CSS450 from Linkam Scientific Instruments); (b) Hot stage front closed view; and (c) Front opened view.
Figure 3. Sketch of the bench validation system of the in-line optical detector using a closed water flowing loop, pumped through a Teflon slit-die.
3. Results and Discussions
3.1 Bench validation of the optical detector with aqueous solutions
The response of the optical detector was tested for each colored organic acid dye dissolved in an aqueous solution. For that, the absorption of each dye with red illumination color was measured using pure filtered water as reference medium. Increasing stepwise the dye concentration one can obtain curves of absorbance (as normalized transmitted light intensity) as a function of dye concentration in the aqueous solution. Figure 4 shows the curves and, as expected[7], the results are linear crescent curves.
The aqueous solution with the red dye absorbs weakly the red light illumination, which is in agreement with literature[1] , since absorption of a specific color wavelength by a sample of the same color is minimal. On the other hand, as observed from the performance of the solution with the green dye, showing a significant absorption under red illumination, the absorption of a specific color wavelength by a sample of the complementary color is maximal. The blue dye, whose complementary color is yellow, has a significant absorption under red illumination, which lead us to conclude that the blue acid dye used here is not a pure color (referring to the Ostwald’s cycle), but an intermediate color instead.
The optical detector operating as an in-line colorimeter has shown: i) linear response to the increase dye concentration, obeying Beer-Lambert’s law[6], and ii) correct response under the respective color illumination. This performance has indicated to us the proper function of the in-line colorimeter under light absorption, validating it.
3.2 Optical evolution during the thermal cycling of the PS/CaSt2
The optical characterization of the polystyrene, measured as absorbance curves as a function of temperature is shown in Figure 5
A molten pure polymer, particularly polystyrene, is expected to does not absorb visible light, i.e., be transparent. During its heating thermo-oxidative degradation can occur, which produces chromophores groups, contributing to color
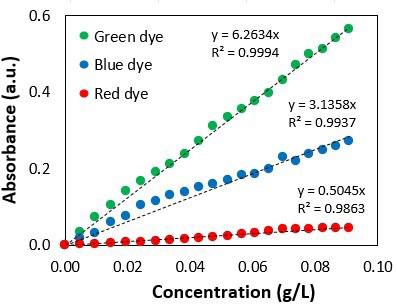
changes due to the light absorbance of these degradation products. The presence of the strong hysteresis in Figure 5, set between 80 °C and 170 °C, let clear that another effect beyond the contribution of these chromophores groups is contributing for this optical behavior and, the presence of the calcium stearate, CaSt2, may be this factor. Calcium stearate has a wide melting temperature range of Tm = 130 °C up to 180 °C[22], which coincides to the sigmoidal change in the absorbance curves’ during heating, shown in Figure 6a.
In order to further investigate the optical influence of the CaSt2 observed in this commercial polystyrene sample, another experiment was performed. Initially, a polystyrene sample as received was thermally cycled from 210 ºC down to 80 ºC at a constant cooling/heating rate of 10 ºC min-1 for five consecutive cycles. The resultant changes in the transmitted light intensity curves are presented in Figure 6, separated into two groups, that due to the heating (Figure 6a) and cooling (Figure 6b) portions.
The results observed in Figure 6 show that the additive strongly affects the light absorbance of the polymer, in which, for each additional cycle, the additive’s contribution is stronger, featuring a possible transformation of this additive [17,24] which leads to higher passage of light through the sample, implying bigger negative values of absorbance. The normalized absorbance was arbitrarily set zero at 210 °C.
The next step was to evaluate the influence of the additive in the absorbance in isotherms under and above its melting temperature. Isotherms at fixed temperatures, seen in Figure 7, were done in the Linkam System CSS450 for pure polystyrene.
The results presented in Figure 7 show the optical polymer’s response for each temperature. The absorbance is negative above the additive’s fusion temperature and positive below it, namely, the additive absorbs less light when molten.
To show this influence of the additive, it was necessary to repeat the same hot stage measures, but with the PS without it, i.e., after the extraction process previously prepared. First, the extracted residue was submitted to FTIR analysis to ratify its identity as stearic acid calcium salt. The results are presented in Figure 8
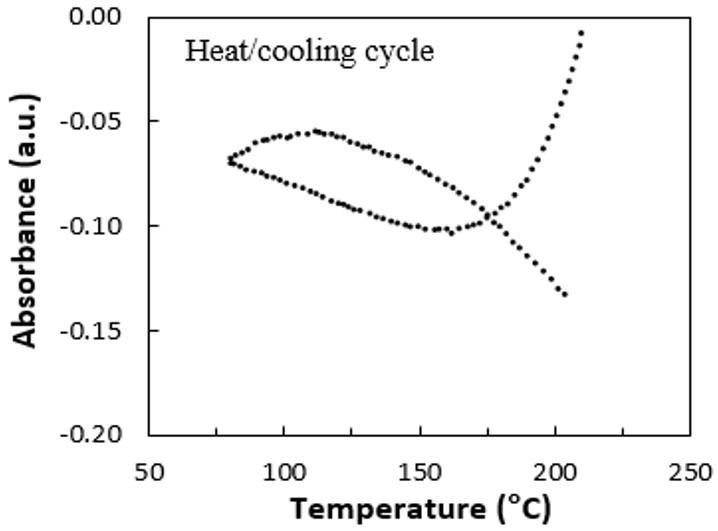
Bernardo, F., & Canevarolo Junior, S. V.
Figure 4. Absorbance as normalized transmitted light intensity as a function of the dyes’ color and concentration, in aqueous solutions, using monochromatic red light illumination.
Figure 5. Absorbance as a function of temperature for the PS, heat cycled between 210 °C and 80 °C, at 10 °C min-1
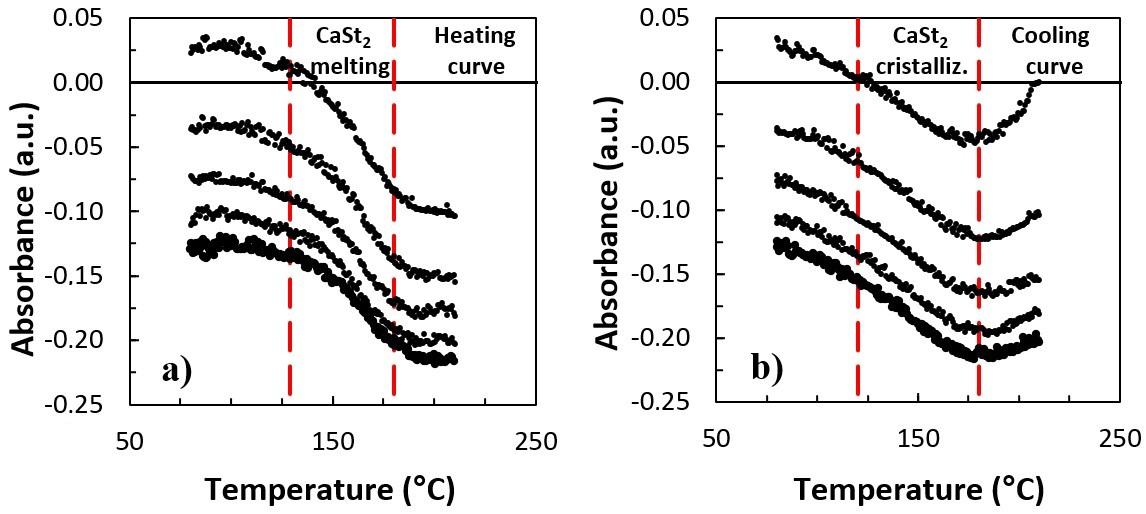
Figure 6. Light absorbance during five heat/cooling cycles of the polystyrene sample as received, ranging from 80 °C to 210 °C. In (a) the heating curves and in (b) the cooling curves. Dashed lines correspond the melting/crystallization temperature ranges of the CaSt 2, 129 - 180 °C and 180 - 120 °C, respectively.
In the spectra, it’s observed two main groups of bands around 1500 and 2900 cm-1. The peak values lead us to conclude, according to previous works available on literature[25] , that the obtained residue is, in fact, calcium stearate, since, such additive presents characteristic bands at 1542 and 1575 cm-1 due to antisymmetric stretching bands for unidendate and bidendate association with calcium ions and at 1472 cm-1 due to methylene scissoring band and 2850, and 2914 cm-1 symmetric and antisymmetric methylene stretching band respectively.
The PS after the extraction was submitted to thermal cycling from 210 °C down to 80 °C at a constant heating rate of 10 °C min-1 for five consecutive cycles. The results are presented in Figure 9.
The results presented in Figure 9 display the polymer’s response for continuous thermal cycles. The absorbance is now increasing after each cycle, contrasting with the previous results obtained before the additive extraction. It’s intuitive to conclude that the additive was impacting the optical properties of the polymer and pushing the collected absorbance values to a negative range.
The next step was to repeat the isothermal measurements with the PS samples after the extraction process. Figure 10 shows the differences of maximum absorbance intensity achieved in each isotherm for the commercial PS before and after the additive extraction process.
The results showed in Figure 10 corroborate the data presented in Figure 9 in which the influence of the stearic acid calcium salt is confirmed as the cause of the negative absorbance values. The salt’s presence elevates the collected light intensity by the phototransistor when the temperatures are higher than its fusion temperature. On the other hand, in its absence, the light intensity doesn’t change considerably, being five times less intense as before. The weak deviation from the zero-line in Figure 10 are due to thermal degradation.
Investigating the values in Figure 10, it’s verified a remarkable reduction in the absorbance intensity after the thermal cycles. This fact can be explained by the removal of not only the residual additive previously existent in the polymer system, but also the removal of possible degrading
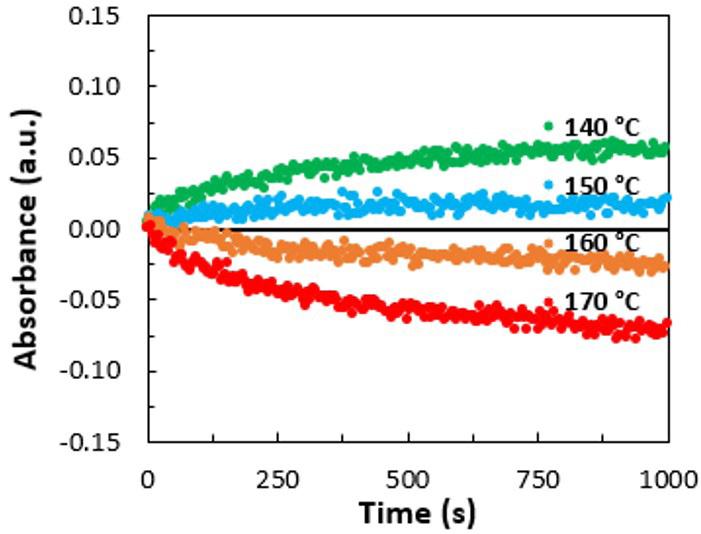
Figure 7. Absorbance as a function of time (s) for polystyrene as received. Isotherms of 140 °C, 150 °C, 160 °C and 170 °C were evaluated.
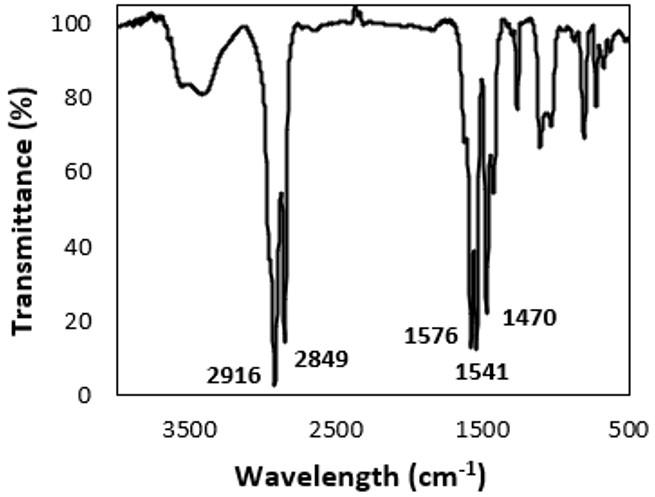
Figure 8. Transmittance (%) versus wavelength (cm-1) for the extracted additive.
agents such as free radicals and residual catalyst, which suggests a PS more resistant to degradation over time after the extraction process.
Bernardo, F., & Canevarolo Junior, S. V.
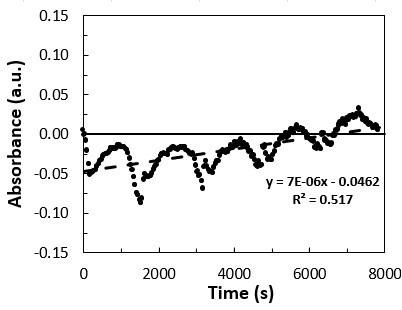
Figure 9. Absorbance as a function of time (s) for polystyrene after the additive extraction. Five heat cycles were evaluated from 210 °C to 80 °C.
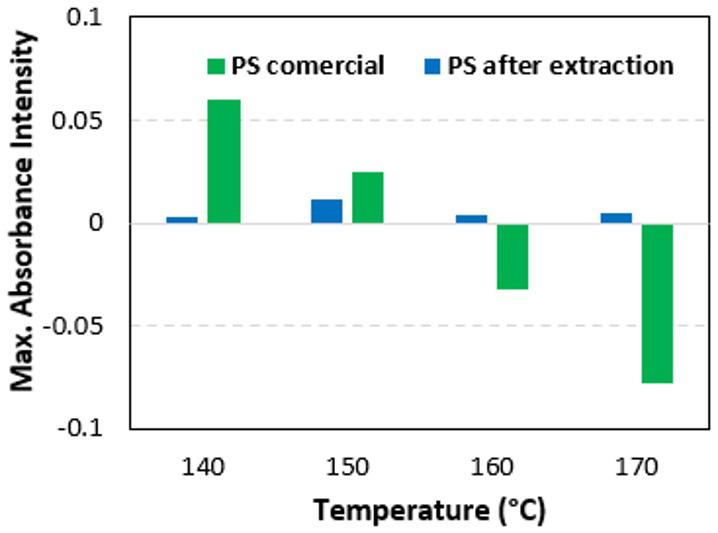
Figure 10. Maximum absorbance intensity for polystyrene as received and after the additive extraction process. Isotherms of 140 °C, 150 °C, 160 °C and 170 °C were evaluated.
4. Conclusions
A thermal cycling method has been proposed for quantify changes in the absorbance of a polymer matrix with residual additivities in high temperatures. This work showed that the resulting absorbance is a function of the pair polymer and wavelength illumination and, its behavior changes with the presence of a contaminant additive, leading even to negative values. The additive’s extraction process lead to a more resistant polymer to degradation, showing that besides additives are important in the polymer manufacturing, sometimes, depending on the type of analysis, they can have negative effects. Optical properties, such as absorbance analyzed in this paper, as they are more sensitive to internal changes in the polymeric system, are affected by the presence of an additive and, consequently, its structural changes with temperature.
5. Author’s Contribution
• Conceptualization – Felipe Bernardo; Sebastião Vicente Canevarolo Junior.
• Data curation – Felipe Bernardo; Sebastião Vicente Canevarolo Junior.
• Formal analysis – Felipe Bernardo; Sebastião Vicente Canevarolo Junior.
• Funding acquisition – Sebastião Vicente Canevarolo Junior.
• Investigation – Felipe Bernardo; Sebastião Vicente Canevarolo Junior.
• Methodology – Felipe Bernardo; Sebastião Vicente Canevarolo Junior.
• Project administration – Felipe Bernardo; Sebastião Vicente Canevarolo Junior.
• Resources – Sebastião Vicente Canevarolo Junior.
• Software – Felipe Bernardo.
• Supervision – Sebastião Vicente Canevarolo Junior.
• Validation – Felipe Bernardo; Sebastião Vicente Canevarolo Junior.
• Visualization – Felipe Bernardo; Sebastião Vicente Canevarolo Junior.
• Writing – original draft – Felipe Bernardo; Sebastião Vicente Canevarolo Junior.
• Writing – review & editing – Felipe Bernardo; Sebastião Vicente Canevarolo Junior.
6. Acknowledgements
This study was financed in part by the Coordenação de Aperfeiçoamento de Pessoal de Nível Superior - Brasil (CAPES) - Finance Code 001 scholarship (0088983400108) and the authors would also acknowledge the Programa de Pós-Graduação em Ciência e Engenharia de Materiais (PPG-CEM) of Federal University of São Carlos for providing the laboratorial facilities.
7. References
1. Ohta, N., & Robertson, A. R. (2005). Colorimetry fundamentals and applications. New York: John Wiley & Sons http://doi. org/10.1002/0470094745
2 Jacobson, E. (1948). Basic color: an introduction of the Ostwald Color System Chicago: Paul Theobald
3 Lindon, J. C., Tranter, G. E., & Koppenaal, D. W. (Eds.). (2017). Encyclopedia of spectroscopy and spectrometry. Oxford: Academic Press.
4 Born, M., & Wolf, E. (1999). Principles of optics: electromagnetic theory of propagation, interference and diffraction of light. London: Cambridge University Press http://doi.org/10.1017/ CBO9781139644181
5 Schlatter, G., Serra, C., Bouquey, M., Muller, R., & Terrisse, J. (2002). Online light scattering measurements: A method to assess morphology development of polymer blends in a twinscrew extruder. Polymer Engineering and Science, 42(10), 1965-1975 http://doi.org/10.1002/pen.11089
6 Strong, F. C. (1952). Theoretical basis of Bouguer-Beer law of radiation absorption. Analytical Chemistry, 24(2), 338-342. http://doi.org/10.1021/ac60062a020
7 van de Hulst, H. C. (1981). Light scattering by small particles New York: Dover Publications.
8 Kyzas, G. Z., Bikiaris, D. N., & Lazaridis, N. K. (2009). Selective separation of basic and reactive dyes by molecularly
Thermal evaluation of the calcium stearate influence on polystyrene by in-line colorimetry
imprinted polymers (MIPs). Chemical Engineering Journal, 149(1-3), 263-272 http://doi.org/10.1016/j.cej.2008.11.002
9 Gold, M. H., Glenn, J. K., & Alic, M. (1988). Use of polymeric dyes in lignin biodegradation assays. Methods in Enzymology, 161, 74-78. http://doi.org/10.1016/0076-6879(88)61011-1.
10 Gelover-Santiago, A., Fowler, M. A., Yip, J., Duhamel, J., Burillo, G., & Rivera, E. (2012). Unexpected absorbance enhancement upon clustering dyes in a polymer matrix. The Journal of Physical Chemistry B, 116(21), 6203-6214 http:// doi.org/10.1021/jp208646b. PMid:22594837.
11 Liu, Y., & Claus, R. O. (1999). Strong enhancement of optical absorbance from ionic self-assembled multilayer thin films of nanocluster Pt and polymer dye. Journal of Applied Physics, 85(1), 419-424 http://doi.org/10.1063/1.369401
12. Fleischmann, C., Lievenbrück, M., & Ritter, H. (2015). Polymers and dyes: developments and applications. Polymers, 7(4), 717-746 http://doi.org/10.3390/polym7040717
13 Gilmor, C., Balke, S. T., Calidonio, F., & Rom-Roginski, A. (2003). In-line color monitoring of polymers during extrusion using a charge-coupled device spectrometer: color changeovers and residence time distributions. Polymer Engineering and Science, 43(2), 356-368 http://doi.org/10.1002/pen.10030
14. Fornes, T. D., Yoon, P. J., & Paul, D. R. (2003). Polymer matrix degradation and color formation in melt processed nylon 6/ clay nanocomposites. Polymer, 44(24), 7545-7556 http://doi. org/10.1016/j.polymer.2003.09.034.
15 Yoon, P. J., Hunter, D. L., & Paul, D. R. (2003). Polycarbonate nanocomposites: part 2. Degradation and color formation. Polymer, 44(18), 5341-5354 http://doi.org/10.1016/S00323861(03)00523-8
16. Phillips, J., Weldhagen, M., Mhlabeni, T., Radebe, L., Ramjee, S., Wesley-Smith, J., Atanasova, M., & Focke, W. W. (2021). Thermal characterization of metal stearate lubricant mixtures for polymer compounding applications. Thermochimica Acta, 699, 178906 http://doi.org/10.1016/j.tca.2021.178906
17 Zhang, X., Wei, F., Wang, Z., Li, G., Yang, S., & Feng, J. (2023). Comparative investigation of the structural evolution of zinc stearate and calcium stearate in a polypropylene random copolymer upon heating and cooling. Polymer, 267, 125646. http://doi.org/10.1016/j.polymer.2022.125646
18 Antunes, M. C., Agnelli, J. A. M., Babetto, A. S., Bonse, B. C., & Bettini, S. H. P. (2017). Abiotic thermo-oxidative degradation of high-density polyethylene: effect of manganese stearate concentration. Polymer Degradation & Stability, 143, 95-103 http://doi.org/10.1016/j.polymdegradstab.2017.06.012
19 Bensaad, F., & Belhaneche-Bensemra, N. (2018). Effects of calcium stearate as pro-oxidant agent on the natural aging of polypropylene. Journal of Polymer Engineering, 38(8), 715721. http://doi.org/10.1515/polyeng-2017-0391.
20 Chukwu, M. N., Madufor, I. C., Ayo, M. D., & Ekebafe, L. O. (2011). Effect of stearic acid level on the physical properties of natural rubber vulcanisate. Pacific Journal of Science and Technology, 12(1), 344-350
21 Nguyen, T. T., Nguyen, V. K., Pham, T. T. H., Pham, T. T., & Nguyen, T. D. (2021). Effects of surface modification with stearic acid on the dispersion of some inorganic fillers in PE matrix. Journal of Composites Science, 5(10), 270 http://doi. org/10.3390/jcs5100270
22 Larrañaga, M. D., Lewis, R. J., & Lewis, R. A. (2016). Hawley’s condensed chemical dictionary (13th ed.). New Jersey: John Wiley & Sons http://doi.org/10.1002/9781119312468
23 Bernardo, F. O. C., Silva, J. M., & Canevarolo, S. V. (2018). Dispersed particle size characterization by in-line turbidimetry during polymer extrusion. Polymer Testing, 70, 449-457. http:// doi.org/10.1016/j.polymertesting.2018.08.005.
24 Vold, R. D., Grandine, J. D., 2nd, & Vold, M. J. (1948). Polymorphic transformations of calcium stearate and calcium stearate monohydrate. Journal of Colloid Science , 3 (4), 339-361 http://doi.org/10.1016/0095-8522(48)90021-X PMid:18877000.
25 Lu, Y., & Miller, J. D. (2002). Carboxyl stretching vibrations of spontaneously adsorbed and LB-transferred calcium carboxylates as determined by FTIR internal reflection spectroscopy. Journal of Colloid and Interface Science, 256(1), 41-52 http://doi. org/10.1006/jcis.2001.8112
Received: Jan. 09, 2024
Revised: Mar. 15, 2024
Accepted: Mar. 31, 2024
Physicochemical characterisation and bioactive potential of microcapsules of Moringa oleifera leaf extract
Rosely de Jesus Nascimento1 , Carlos Renato Vieira Nascimento1 , Paula Ribeiro Buarque2 and Luciana Cristina Lins de Aquino Santana1*
1 Laboratório de Microbiologia e Bioengenharia de Alimentos, Departamento de Tecnologia de Alimentos, Universidade Federal de Sergipe – UFS, São Cristóvão, SE, Brasil
2 Departamento de Nutrição, Universidade Federal de Sergipe – UFS, São Cristóvão, SE, Brasil *luciana.santana@academico.ufs.br
Obstract
In this work, moringa leaf extract was encapsulated in gum arabic by lyophilisation, using different extract:gum arabic ratios (1:10, 1:6 and 1:4). The physicochemical characteristics, total phenolic content and antioxidant potential of the microcapsules were evaluated at time 0 and after 10 months of storage at 25 °C. The moisture content, hygroscopicity and solubility of the microcapsules decreased, and the water activity increased after storage. The total phenolic content increased from 28 to 36%, with the highest increase in the microcapsule formulation with less gum arabic. The antioxidant activity also increased significantly, to values between 140 and 307%, with activity being higher in the 1:4 (extract: gum arabic) ratio microcapsules. The microcapsules of moringa leaf extract encapsulated with gum arabic showed good antioxidant potential in vitro, especially after storage, and could be a promising alternative for the future applications in the food, pharmaceutical and cosmetic sectors as additives or preservatives.
Keywords: moringa leaf, bioactive compounds, microcapsules, plant, gum arabic.
How to cite: Nascimento, R. J., Nascimento, C. R. V., Buarque, P. R., & Santana, L. C. L. A. (2024). Physicochemical characterisation and bioactive potential of microcapsules of Moringa oleifera leaf extract. Polímeros: Ciência e Tecnologia, 34(2), e20240018. https://doi.org/10.1590/0104-1428.20230128
1. Introduction
Moringa oleifera Lam. (commonly known as ‘moringa’) constitutes one of thirteen species of Moringa belonging to the monogenic family Moringaceae, a plant native to northern India and, more specifically, the Himalayan mountains. Several studies have reported M. oleifera as a medicinal plant due to the presence of bioactive compounds such as gallic acid, caffeic acid, vanillic acid, ferulic acid, apigenin, and others[1,2] However, these bioactive compounds are generally unstable and susceptible to oxidative degradation, especially when in contact with moisture, light, heat, and oxygen, thus limiting their bioavailability[3]. This limitation can be reduced by using encapsulation techniques such as lyophilisation, also known as freeze-drying, which consists of three steps: freezing, primary drying (sublimation) and secondary drying (desorption). It is widely used to preserve heat-sensitive substances and improve microcapsule stability and encapsulation efficiency (EE)[3] .
An important aspect of the application of microcapsules is their stability over long periods of storage. Dadi et al.[4] evaluated the stability of maltodextrin microcapsules with Moringa stenopetala leaf extract obtained by freeze-drying in terms of phenolic compounds content after storage for 60 days at 4 °C, 25 °C and 45 °C; George et al.[5] also evaluated the stability of microcapsules of M. oleifera extracts, stored at 4 °C, 25 °C and 45 °C for 4 weeks through the loss in the total phenolic content (TPC) weekly; and Vonghirundecha et al.[6]
evaluated the storage stability of maltodextrin microcapsules with M. oleifera leaf extract (obtained by a spray-drying technique) at 4 °C and 30 °C for 3 months, by measuring the TPC and ABTS free radical-scavenging effects every 15 days. To the best of our knowledge, stability studies of moringa extract microcapsules have been carried out for a maximum of 3 months, and only the bioactive compound content has been evaluated. Considering that parameters such as moisture, water activity, solubility, and hygroscopicity also need to be evaluated after prolonged storage, the present study aimed to determine the total phenolic content, antioxidant activity and physicochemical characteristics of different M. oleifera leaf extract microcapsule formulations after 10 months of storage at 25 °C.
2. Materials and Methods
2.1 Materials
M. oleifera leaves were collected from trees located at the Federal University of Sergipe, São Cristóvão, Sergipe (10°55’24.1”S 37°05’58.5”W) in January 2021. Gum arabic and ethanol were purchased from Perfyl Tech (São Bernardo dos Campos, São Paulo, Brazil); 6-hydroxy-2,5,7,8-tetramethyl chrome-2-carboxylic acid (Trolox), 2,2-diphenyl-1-picrylhydrazyl radical (DPPH)
Nascimento, R. J., Nascimento, C. R. V., Buarque, P. R., & Santana, L. C. L. A.
and 2,2’-azino-bis acid (3-ethylbenzthiazoline) 6-sulfonic acid (ABTS) were purchased from Sigma-Aldrich (Saint Louis, MO, USA). Sodium acetate was obtained from Neon (São Paulo, São Paulo, Brazil). The Folin-Ciocalteu reagent, sodium carbonate, potassium persulphate and acetic acid were obtained from Dinâmica (Indaiatuba, São Paulo, Brazil).
2.2 Preparation of extract from moringa leaves
The preparation of the extract was in accordance with the methodology of Feitosa et al.[7]. The moringa leaves were dried at 50 °C ± 2 °C in an oven with air circulation for 24 h and then crushed in a blender until a uniform powder was obtained. The extract was obtained using 80% ethanol at a leaf flour-to-solvent ratio of 1:5 (m/v). The solution was kept under orbital stirring at 200 rpm for 1 h at 30 °C. The extract was then filtered through filter paper and the supernatant was evaporated in a rotary evaporator at 40 °C and 50 rpm. This extract was previously analysed by Feitosa et al.[7]; its composition of polyphenolic compounds is as follows: 0.849 mg of gallic acid, 0.237 mg of epicatechin gallate, 0.384 mg of catechin, 0.412 mg of benzoic acid, 0.054 mg of 2,5–dihydroxybenzoic acid and 0.019 mg of coumarin per gram of dry powder.
2.3 Encapsulation of moringa leaf extract
A 10% (w/v) solution of gum arabic in distilled water was prepared and agitated in an orbital shaker (SOLAB/ SL222) at 250 rpm for 30 min at 35 °C. The moringa flour extract (211 mg/mL) was then added in the proportions 1:10, 1:6, and 1:4 (g extract per mL of gum arabic solution). The solutions were then homogenised in a shaker at 25 rpm for 30 min at 35 °C. A solution containing only 10% gum arabic was used as a control[8]. For the encapsulation, the solutions were first frozen at -18 °C for 48 h and then placed in a freeze-dryer (Christ Alpha 1–2 LD Plus, Brand Christ, Germany) and dried for 48 h at -55 °C, 0.021 mbar pressure and a vacuum of 0.42 mbar[9]. The samples were stored in a desiccator at 25 °C for a period of 10 months. The total phenolic content, moisture, water activity, hygroscopicity, and solubility of the microcapsules were determined at time 0 and after 10 months of storage. The microcapsules were named 1E:10GA, 1E:6GA and 1E:4GA.
2.4 Morphological analysis
The morphological analysis of the microcapsules was performed in a scanning electron microscope (Model TM3000, Hitachi, Japan). The samples were covered with gold and analysed at an accelerating voltage of 5 kV and magnifications of 100x and 1000x.
2.5 Moisture and water activity
The moisture content of the microcapsules (1 g) was determined by drying in an oven at 105 °C and directly reading the water activity using an electronic meter (Aqualab Dew Point 4TEV)[9]. All analyses were performed in triplicate.
2.6 Solubility and hygroscopicity
For the solubility analysis, 1 g of microcapsules was mixed with 100 mL of distilled water and stirred in a
magnetic stirrer (Tecnal, TE-0851) for 30 min. The solution was then centrifuged at 129 x g for 5 min. Subsequently, a 25 mL aliquot of the supernatant was placed in a petri dish and dried in an oven at 105 °C for 5 h. All analyses were performed in triplicate. The solubility was calculated by weight difference and expressed in percentage[9]
For hygroscopicity, the microcapsules (1 g, W1) were kept in a desiccator containing a saturated sodium chloride solution (75.3% relative humidity) at 25 °C for 1 week. The samples were then weighed (W2), and the hygroscopicity was calculated according to Equation 1[4]. All analyses were performed in triplicate.
( ) ( ) Hygroscopicity %= W2-W1/W1 x 100 (1)
2.7 Encapsulation efficiency (EE)
To determine the total phenolic content, 100 mg of microcapsules were dissolved in 1 mL of distilled water; 9 mL of ethanol (pure) was then added, and the solution was mixed for 5 min. The solution was then filtered through a 0.22 μm membrane filter. The total phenolic content of the microcapsule wall (the surface phenolic content) was determined by mixing 100 mg of microcapsules with 10 mL of ethanol. The dispersion was vortexed for 10 s and centrifuged at 129 x g for 3 min. The supernatant was filtered through a 0.22 μm membrane filter. The total and surface phenolic contents were quantified as described in the next section, and the EE was then determined using Equation 2[4] ( ) ( ) ( ) EE %= TPC-SPC/TPC x 100 (2)
where TPC is the total phenolic content, and SPC is the surface phenolic content.
2.8
Determination of
the total phenolic content
The total phenolic content was determined using FolinCiocalteu reagent[10]. Samples of the supernatant (0.5 mL) were mixed with 0.5 mL of 95% ethanol solution, 2.5 mL of distilled water and 0.25 mL of 1 N Folin-Ciocalteu reagent, and the solution was then homogenised. Then, 0.5 mL of 5% (w/v) sodium carbonate solution was added. The samples were kept in a dark room for 60 min and then homogenised. The spectrophotometric absorbance was measured at 725 nm. Ethanol was used as the blank control. All analyses were performed in triplicate, and the values were calculated from the gallic acid calibration curve (0150 mg/L) (y = 0.0108x – 0.0185; R2 = 0.9961). The results were expressed as g of gallic acid equivalents (GAE) per g of microcapsules (GAE/g of microcapsules).
2.9 Antioxidant activity (AA)
The AA of microcapsules was performed using the ABTS, DPPH[11], and FRAP (Ferric Reducing Antioxidant Power)[12] methods. For DPPH, the sample (250 μL) was mixed with DPPH reagent (1.25 mL), and after 5 min, the absorbance was read at 517 nm using a spectrophotometer (Spectrum SP-2000 UV, Tucumán, Argentina). Ethanol was used as the blank control. Different concentrations of Trolox, between
Physicochemical characterisation and bioactive potential of microcapsules of Moringa oleifera leaf extract
50 and 250 µmol of Trolox mL-1, were used to construct the calibration curve (y = −0.0037x + 1.6425; R2 = 0.9984), and the results were expressed in μmol Trolox/g of microcapsules. For ABTS, the sample (30 μL) was mixed with 3.0 mL of the ABTS radical, homogenised in a vortex, and kept at rest for 6 min. The absorbance value was read at 734 nm using a spectrophotometer. Different concentrations of Trolox, varying from 100 to 1,600 µmol Trolox mL-1, were used to obtain the calibration curve (y = −0.0004x + 0.6082; R2 = 0.9862). The results were expressed in μmol of Trolox/g of microcapsules. The FRAP assay was performed by mixing 90 μL of sample with 270 μL of distilled water and 2.7 mL of FRAP reagent. This solution was homogenised in a vortex and kept in a water bath at 37 °C for 30 min. The absorbance value was read at 595 nm. Concentrations of Trolox ranging from 100 to 1,200 µmol Trolox mL-1 were used to obtain the calibration curve (y = 0.0016x − 0.019; R2 = 0.9962) and the results were expressed in μmol Trolox g of microcapsules-1 .
2.10 Statistical analysis
All experiments were performed in triplicate, and the results were expressed as mean ± standard deviation.
3. Results and Discussion
3.1 EE and morphology
The EE for the microcapsules produced using extract:gum arabic ratios of 1:4, 1:6 and 1:10 were 95.70%, 94.99%,
and 89.75%, respectively. This indicates that lower extract:gum arabic ratio results in higher EE. The high EE may be related to the freeze-drying technique, which uses vacuum and low temperatures, contributing to a reduction in compound degradation[13]. Dadi et al.[4] and Vonghirundecha et al.[6] obtained lower EE values of 71.44% and 91.2% for microcapsules of M. stenopetala and M. oleifera leaf extracts obtained by freeze-drying and spray-drying, respectively. The microencapsulation efficiency (ME) of the bioactive compounds can be quite varied, since during the sublimation of water in the freeze-drying process, the encapsulated component can be degraded[9]
In relation to morphology, all microcapsules had an irregular, brittle, flake-like appearance, characteristic of microcapsules obtained by the freeze-drying process (Figure 1)[4,5,14,15]. The microcapsules without extract (Figures 1A and 1B) also showed a porous structure, probably due to the ice sublimation process during freeze-drying and a reduced thickness, possibly due to the lack of material in their core[16]. Structures with cracks or fractures, a vitreous appearance and a granule structure were observed in the microcapsules containing extract[14,17,18] (Figures 1C-H). The glassy appearance is associated with the protection of encapsulated compounds against exposure to heat and oxygen[17]. Larger particle sizes were also observed for the microcapsules containing a higher concentration of extract (1E:4GA) (Figures 1G and 1H). Similar structures were also observed in microcapsules of M. stenopetala and
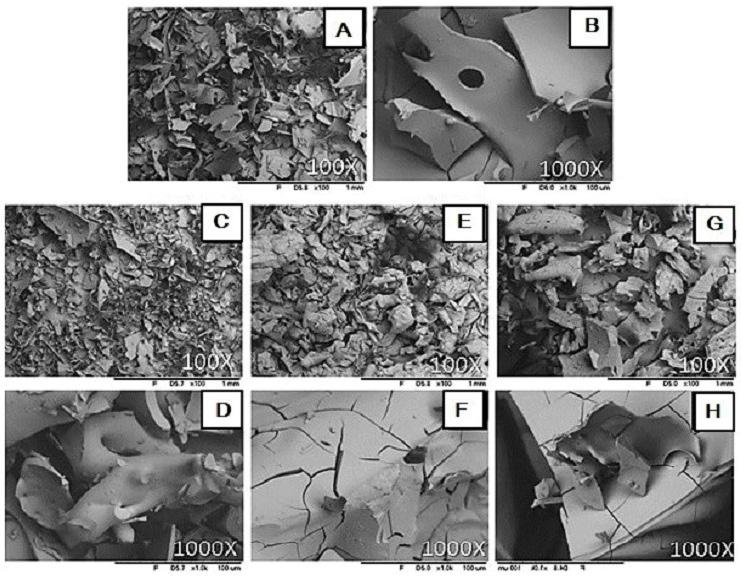
Figure 1. Scanning electron micrographs (SEM) of microcapsules at magnifications of 100× and 1000×. (A, B) Gum arabic microcapsules without extract. Microcapsules with extract:gum arabic proportions (C, D) 1E:10GA, (E, F) 1E:6GA and (G, H) 1E:4GA.
Nascimento, R. J., Nascimento, C. R. V., Buarque, P. R., & Santana, L. C. L. A.
M. oleifera leaf extracts encapsulated with maltodextrin by freeze-drying[4,5]
3.2 Physicochemical properties of the microcapsules
The microcapsules were evaluated for moisture, water activity, hygroscopicity and solubility. At time 0, the moisture content of the microcapsules varied between 3.1% and 3.5%, (Figure 2A). After 10 months of storage, the moisture was reduced to between 1.8% and 2.2% with lower values in the microcapsules containing a smaller amount of gum arabic (1E:6GA and 1E:4GA). This result was probably due to the microcapsules being stored in a desiccator in room temperature, which may have led to the gradual removal of moisture over time. Moisture values below 3% can prevent chemical or microbiological changes in the microcapsules[4]. The results indicated that prolonged storage of these microcapsules does not cause deterioration related to high moisture content.
The water activity values varied between 0.11 and 0.28 at time 0, and it was lower in the 1E:4GA microcapsules (Figure 2A). This result is within the recommended Aw value for atomised products (< 0.30) and guarantees the stability of the microcapsules[19]. Vonghirundecha et al.[6] obtained microcapsules of M. oleifera leaf extract in maltodextrin
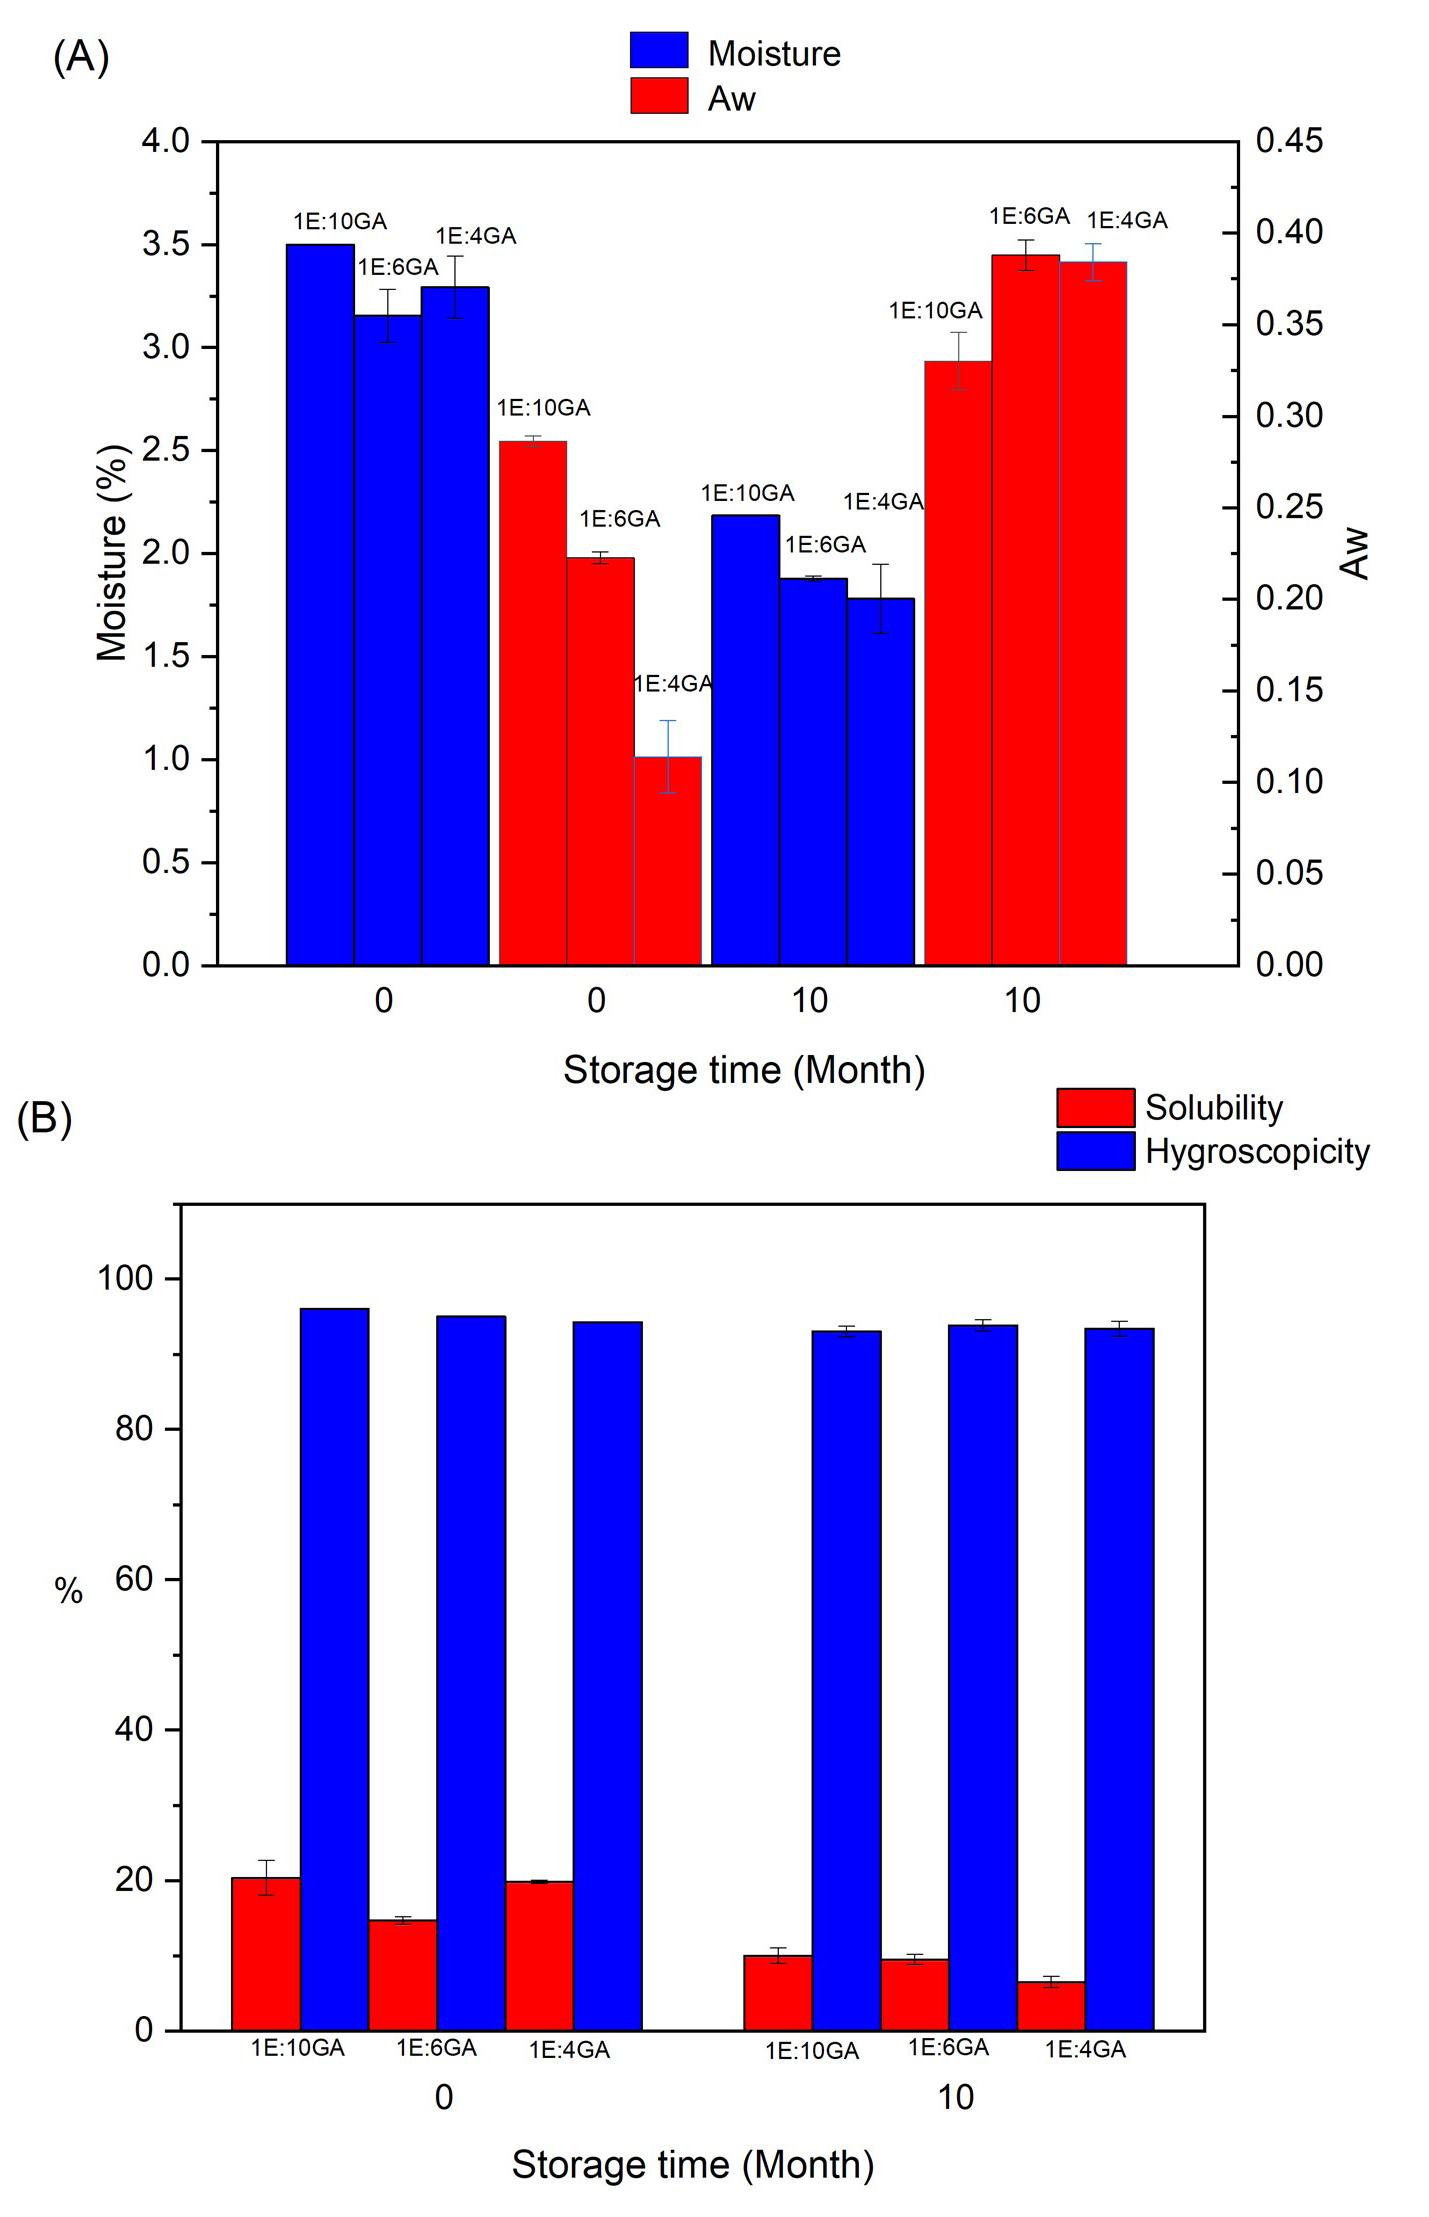
Figure 2. Physicochemical parameters of microcapsule formulations analysed at time 0 and after 10 months of storage.
01E:10GA (1 g of extract and 10 mL of gum arabic solution);
01E:06GA (1 g of extract and 6 mL of gum arabic solution);
01E:04GA (1 g of extract and 4 mL of gum arabic solution).
by spray-drying, with Aw values between 0.22 and 0.29, which is higher than the values obtained in the present study. After storage, there was a slight increase in water activity, ranging from 0.33 to 0.39, with a higher increase in the microcapsules with a higher extract concentration (1E:6GA and 1E:4GA). This result indicates the presence of available water, which can cause biochemical reactions, resulting in a shorter shelf life of the microcapsules[20]
Another significant quality parameter of microcapsules is hygroscopicity, which indicates the ability to absorb water from the environment. Microcapsules with low hygroscopicity are ideal[4]. The hygroscopicity of the microcapsules varied between 20% and 30% at time 0 and decreased to values between 6.5% and 10.0% after 10 months of storage, representing a reduction of about 78% (Figure 2B). The storage, therefore, improved this property. Vonghirundecha et al.[6] have obtained hygroscopicity values between 6.5% and 8.65% (w/w) in microcapsules of maltodextrin and M. oleifera leaf extract obtained by spray-drying; George et al.[5] obtained hygroscopicity values of 14.35% in microcapsules of gum arabic and M. oleifera leaf extract obtained by freeze-drying, and Dadi et al.[4] obtained hygroscopicity values of 16.77% and 18.12% for microcapsules of M. stenopetala leaf extract obtained by freeze-drying, using maltodextrin and a mixture of maltodextrin and pectin as encapsulants, respectively. These values were close to those obtained in this work.
The higher the aqueous solubility (close to 100%) the better the solubility of these microcapsules, for example, in food systems[9]. The solubility of the microcapsules varied between 94% and 96%, being higher in the microcapsules with a higher amount of gum arabic (1E:10GA). This result can be attributed to the gum arabic, which is known for its high solubility and low viscosity in aqueous media[21,22]. After storage, the solubility of the microcapsule formulations was still good, only decreasing to around 93% (Figure 2B). These results were similar to those obtained by other researchers, such as Dadi et al.[4], who obtained a solubility of 94.65% for microcapsules of M. stenopetala leaf extract with maltodextrin obtained by freeze-drying, Vonghirundecha et al.[6], who obtained a solubility between 91.2% and 92.2% for maltodextrin microcapsules with M. oleifera leaf extract obtained by spray-drying, and George et al.[5], who obtained values between 86.35% and 98.74% for microcapsules of gum arabic, maltodextrin, and moringa leaf extract obtained by freeze-drying.
3.3 Total phenolic content and AA of the microcapsules
The total phenolic content of the microcapsules was determined at time 0 and after 10 months of storage at 25 °C (Figure 3A). The lower the amount of gum arabic used in the microcapsules (1E:4GA), the greater the total phenolic content due to the higher concentration of extract. There was an increase in total phenolic content of 28% and 36% in the 1E:6GA and 1E:4GA microcapsule formulations, respectively, after storage. This result may be due to the higher concentration of compounds resulting from the lower moisture content obtained in the microcapsules after storage.
The results obtained in this work were better than those obtained by other researchers. Vonghirundecha et al.[6] observed no significant change in phenolic content during 90 days
Physicochemical characterisation and bioactive potential of microcapsules of Moringa oleifera leaf extract
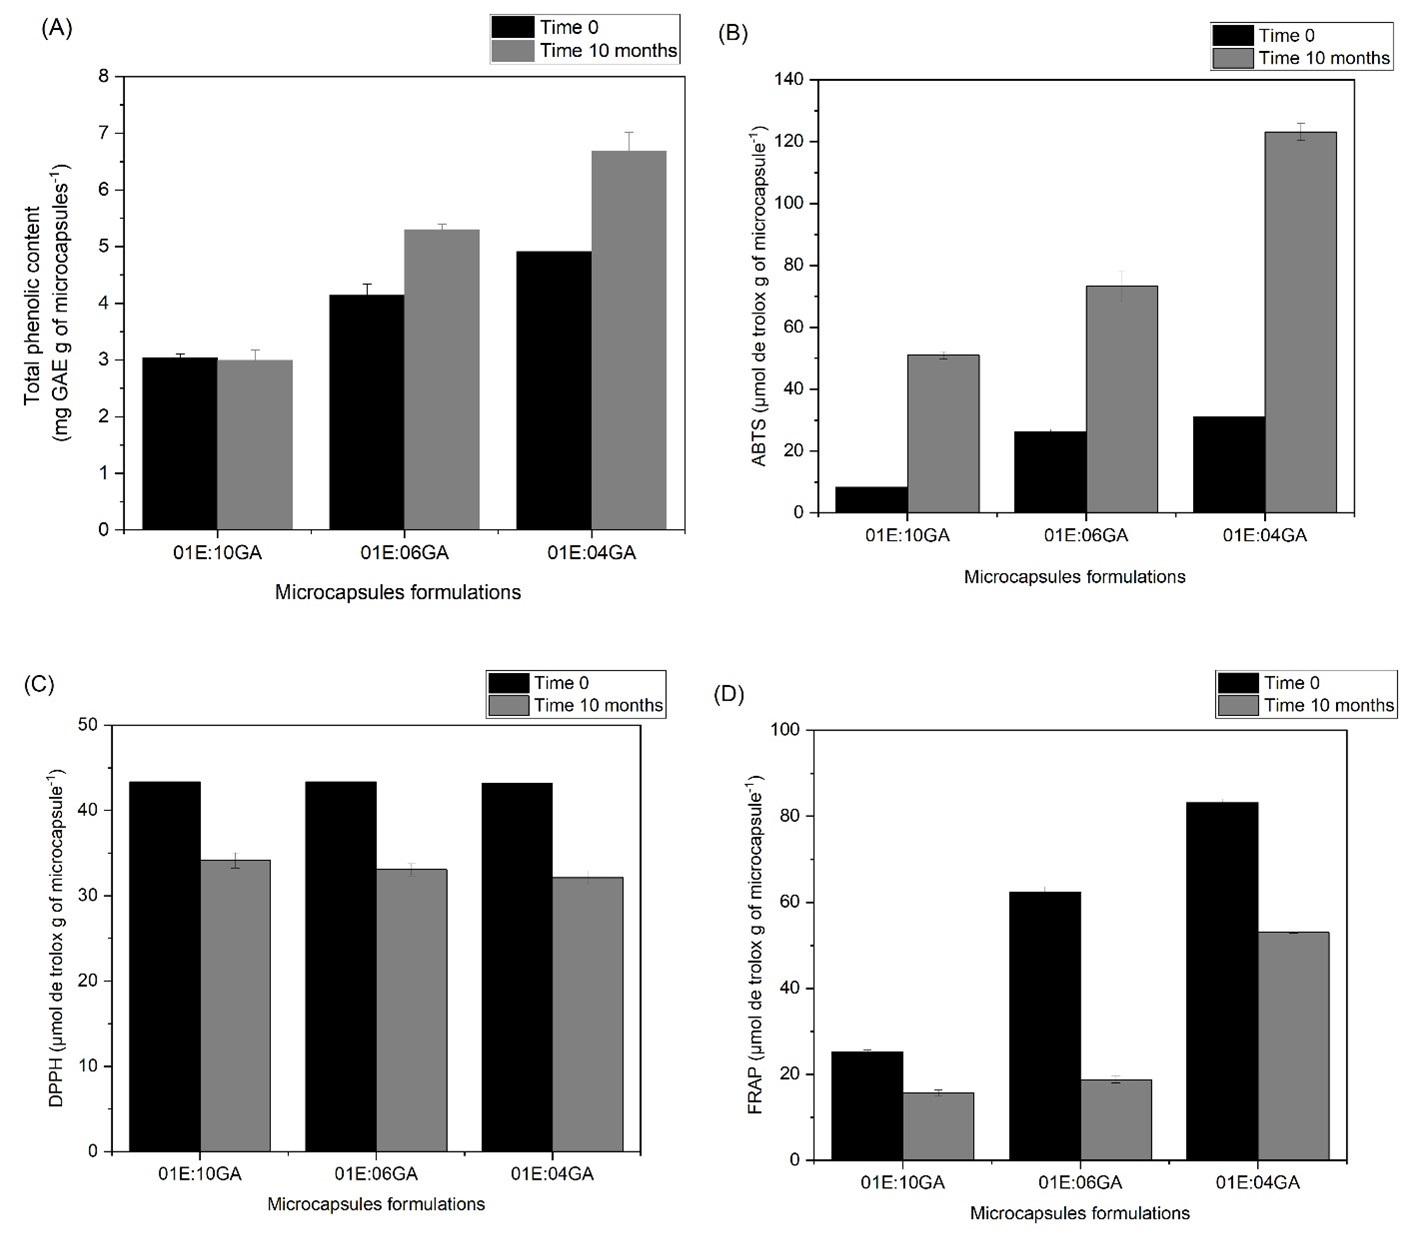
Figure 3. Total phenolic content and AA of microcapsule formulations analysed at time 0 and after 10 months of storage. 01E:10GA (1 g of extract and 10 mL of gum arabic solution); 01E:06GA (1 g of extract and 6 mL of gum arabic solution); 01E:04GA (1 g of extract and 4 mL of gum arabic solution).
of storage of M. oleifera leaf extract microcapsules at 4 °C and 37 °C in the dark in UV-protective airtight containers, and George et al.[5] obtained a stable total phenolic content in M. oleifera leaf microcapsules during storage at 4 °C for 28 days. On the other hand, Dadi et al.[4] found a decrease in the total phenolic content of M. stenopetala microcapsules after 60 days of storage at 4 °C, 25 °C and 45 °C.
With regards to the AA using the ABTS method (Figure 3B), there was a significant increase (between 140% and 307%) after 10 months of storage, being greater (123 µmol of Trolox/g of microcapsules) in the microcapsules with the lowest amount of gum arabic (1E:4GA), which also had a higher total phenolic content. This result suggests the presence of phenolic compounds with the potential to react with the ABTS radical. The AA of the microcapsules may be due to the presence of antioxidant compounds such as gallic acid, epicatechin gallate, catechin and coumarin in the M. oleifera leaf extract[7]. Vonghirundecha et al.[6] verified that there was no significant difference in the AA using the ABTS method for M. oleifera leaf microcapsules after 3 months of storage in the dark at 4 °C and 37 °C. At time 0, the AA using the DPPH method for the different microcapsules was 43.0 µmol of Trolox/g of microcapsules (Figure 3C). After storage, the values decreased to between 32 and 34 µmol of Trolox/g of microcapsules. For the FRAP method, the
AA varied between 25.0 and 83.0 µmol of Trolox/g of microcapsules at time 0 and between 15.7 and 53.0 µmol of Trolox/g of microcapsules after 10 months of storage, being higher for the microcapsule 1E:4GA, indicating the presence of antioxidant compounds in the extract with the ability to reduce iron (Figure 3D). The decrease after storage was probably due to the degradation of antioxidant compounds. It is worth noting that the results may differ between antioxidant methods due to the peculiarities of each assay and the complexity of the extract[23]
4. Conclusions
In this study, the physicochemical characteristics, total phenolic content and AA of different microcapsule formulations containing moringa leaf extract were evaluated before and after storage for 10 months at 25 °C. All microcapsules (at 0 time) had a good EE (89.75 to 95.70%), high solubility (94 to 96%), favourable hygroscopicity (20 to 30%), low moisture (3.1% to 3.5%) and water activity (0.11 to 0.28). After 10 months of storage, the moisture and hygroscopicity decreased (reduction of about 39 and 78%, respectively), the solubility was kept at 94%, and the water activity increased (about 89%) in the microcapsules. Notably, the total phenolic
Nascimento, R. J., Nascimento, C. R. V., Buarque, P. R., & Santana, L. C. L. A.
content and the AA (by the ABTS method) also increased after storage by 28-36% and 140-307%, respectively, with the highest values being observed in the microcapsules with higher concentration of extract. Microcapsules of M. oleifera leaf extract showed excellent bioactive potential after storage and could be a promising alternative for future application in the food, cosmetic, or pharmaceutical sectors.
5. Author’s Contribution
• Conceptualization – Luciana Cristina Lins de Aquino Santana; Rosely de Jesus Nascimento; Paula Ribeiro Buarque.
• Data curation – Luciana Cristina Lins de Aquino Santana; Rosely de Jesus Nascimento; Carlos Renato Vieira Nascimento; Paula Ribeiro Buarque.
• Formal analysis – Luciana Cristina Lins de Aquino Santana; Rosely de Jesus Nascimento; Paula Ribeiro Buarque; Carlos Renato Vieira Nascimento.
• Funding acquisition - Luciana Cristina Lins de Aquino Santana.
• Investigation – Rosely de Jesus Nascimento; Carlos Renato Vieira Nascimento.
• Methodology – NA.
• Project administration – Luciana Cristina Lins de Aquino Santana.
• Resources – Luciana Cristina Lins de Aquino Santana.
• Software – NA.
• Supervision – Luciana Cristina Lins de Aquino Santana; Paula Ribeiro Buarque.
• Validation – NA.
• Visualization – Luciana Cristina Lins de Aquino Santana.
• Writing – original draft – Luciana Cristina Lins de Aquino Santana; Rosely de Jesus Nascimento.
• Writing – review & editing – Luciana Cristina Lins de Aquino Santana; Paula Ribeiro Buarque.
6. Acknowledgements
The authors thank the Flavor Analysis Laboratory of the Federal University of Sergipe for technical support.
7. References
1 Hassan, M. A., Xu, T., Tian, Y., Zhong, Y., Ali, F. A. Z., Yang, X., & Lu, B. (2021). Health benefits and phenolic compounds of Moringa oleifera leaves: a comprehensive review. Phytomedicine, 93, 153771 http://doi.org/10.1016/j. phymed.2021.153771 PMid:34700271.
2 Gharsallah, K., Rezig, L., Msaada, K., Chalh, A., & Soltani, T. (2021). Chemical composition and profile characterization of Moringa oleifera seed oil. South African Journal of Botany, 137, 475-482 http://doi.org/10.1016/j.sajb.2020.11.014
3 Shishir, M. R. I., Xie, L., Sun, C., Zheng, W., & Chen, W. (2018). Advances in micro and nano-encapsulation of bioactive compounds using biopolymer and lipid-based transporters. Trends in Food Science & Technology, 78, 34-60 http://doi. org/10.1016/j.tifs.2018.05.018
4 Dadi, D. W., Emire, S. A., Hagos, A. D., & Eun, J.-B. (2020). Physical and functional properties, digestibility, and storage stability of spray-and freeze-dried microencapsulated bioactive products from Moringa stenopetala leaves extract. Industrial Crops and Products, 156, 112891 http://doi.org/10.1016/j. indcrop.2020.112891
5 George, T. T., Oyenihi, A. B., Rautenbach, F., & Obilana, A. O. (2021). Characterization of Moringa oleifera leaf powder extract encapsulated in maltodextrin and/or gum arabic coatings. Foods, 10(12), 3044 http://doi.org/10.3390/foods10123044 PMid:34945595.
6 . Vonghirundecha, P., Chusri, S., Meunprasertdee, P., & Kaewmanee, T. (2022). Microencapsulated functional ingredients from a Moringa oleifera leaf polyphenol-rich extract: characterization, antioxidant properties, in vitro simulated digestion, and storage stability. Lebensmittel-Wissenschaft + Technologie, 154, 112820 http://doi.org/10.1016/j.lwt.2021.112820
7 Feitosa, P. R. B., Santos, T. R. J., Gualberto, N. C., Narain, N., & Santana, L. C. L. A. (2020). Solid-state fermentation with Aspergillus niger for the bio-enrichment of bioactive compounds in Moringa oleifera (moringa) leaves. Biocatalysis and Agricultural Biotechnology, 27, 101709. http://doi. org/10.1016/j.bcab.2020.101709
8 Dadi, D. W., Emire, S. A., Hagos, A. D., & Eun, J.-B. (2019). Effects of spray drying process parameters on the physical properties and digestibility of the microencapsulated product from Moringa stenopetala leaves extract. Cogent Food & Agriculture, 5(1), 1690316 http://doi.org/10.1080/2331193 2.2019.1690316
9 Rezende, Y. R. R. S., Nogueira, J. P., & Narain, N. (2018). Microencapsulation of extracts of bioactive compounds obtained from acerola (Malpighia emarginata DC) pulp and residue by spray and freeze drying: chemical, morphological and chemometric characterization. Food Chemistry, 254, 281-291 http://doi.org/10.1016/j.foodchem.2018.02.026 PMid:29548455.
10 Singleton, V. L., & Rossi, J. A., Jr. (1965). Colorimetry of total phenolics with phosphomolybdic-phosphotungstic acid reagents. American Journal of Enology and Viticulture, 16(3), 144-158 http://doi.org/10.5344/ajev.1965.16.3.144
11 Andrade, J. K. S., Denadai, M., Oliveira, C. S., Nunes, M. L., & Narain, N. (2017). Evaluation of bioactive compounds potential and antioxidant activity of brown, green and red propolis from Brazilian northeast region. Food Research International, 101, 129-138. http://doi.org/10.1016/j.foodres.2017.08.066. PMid:28941675.
12 Thaipong, K., Boonprakob, U., Crosby, K., Cisneros-Zevallos, L., & Byrne, D. H. (2006). Comparison of ABTS, DPPH, FRAP, and ORAC assays for estimating antioxidant activity from guava fruit extracts. Journal of Food Composition and Analysis, 19(6-7), 669-675 http://doi.org/10.1016/j.jfca.2006.01.003
13 Mohammadalinejhad, S., & Kurek, M. A. (2021). Microencapsulation of anthocyanins: critical review of techniques and wall materials. Applied Sciences, 11(9), 3936. http://doi.org/10.3390/ app11093936
14 Saikia, S., Mahnot, N. K., & Mahanta, C. L. (2015). Optimisation of phenolic extraction from Averrhoa carambola pomace by response surface methodology and its microencapsulation by spray and freeze drying. Food Chemistry, 171, 144-152. http:// doi.org/10.1016/j.foodchem.2014.08.064 PMid:25308654.
15 Pashazadeh, H., Zannou, O., Ghellam, M., Koca, I., Galanakis, C. M., & Aldawoud, T. (2021). Optimization and encapsulation of phenolic compounds extracted from maize waste by freezedrying, spray-drying, and microwave-drying using maltodextrin. Foods, 10(6), 1396 http://doi.org/10.3390/foods10061396 PMid:34208732.
Physicochemical characterisation and bioactive potential of microcapsules of Moringa oleifera leaf extract
16 Yadav, K., Bajaj, R. K., Mandal, S., & Mann, B. (2020). Encapsulation of grape seed extract phenolics using whey protein concentrate, maltodextrin and gum arabica blends. Journal of Food Science and Technology, 57(2), 426-434 http://doi.org/10.1007/s13197-019-04070-4 PMid:32116352.
17 Khazaei, K. M., Jafari, S. M., Ghorbani, M., & Kakhki, A. H. (2014). Application of maltodextrin and gum Arabic in microencapsulation of saffron petal’s anthocyanins and evaluating their storage stability and color. Carbohydrate Polymers, 105, 57-62 http://doi.org/10.1016/j.carbpol.2014.01.042 PMid:24708952.
18 Guo, J., Li, P., Kong, L., & Xu, B. (2020). Microencapsulation of curcumin by spray drying and freeze drying. LebensmittelWissenschaft + Technologie, 132, 109892 http://doi.org/10.1016/j. lwt.2020.109892
19 Tonon, R. V., Brabet, C., & Hubinger, M. D. (2010). Anthocyanin stability and antioxidant activity of spray-dried açai (Euterpe oleracea Mart.) juice produced with different carrier agents. Food Research International , 43(3), 907-914 http://doi. org/10.1016/j.foodres.2009.12.013.
20 Nunes, G. L., Boaventura, B. C. B., Pinto, S. S., Verruck, S., Murakami, F. S., Prudêncio, E. S., & Amboni, R. D. M. C. (2015).
Microencapsulation of freeze concentrated Ilex paraguariensis extract by spray drying. Journal of Food Engineering, 151, 60-68 http://doi.org/10.1016/j.jfoodeng.2014.10.031
21 Tirgar, M., Jinap, S., Zaidul, I. S. M., & Mirhosseini, H. (2015). Suitable coating material for microencapsulation of spray-dried fish oil. Journal of Food Science and Technology, 52(7), 4441-4449 http://doi.org/10.1007/s13197-014-1515-3 PMid:26139910.
22 Labuschagne, P. (2018). Impact of wall material physicochemical characteristics on the stability of encapsulated phytochemicals: a review. Food Research International, 107, 227-247 http:// doi.org/10.1016/j.foodres.2018.02.026 PMid:29580481.
23 Noreen , H. , Semmar, N. , Farman , M. , & McCullagh , J. S. O. ( 2017). Measurement of total phenolic content and antioxidant activity of aerial parts of medicinal plant Coronopus didymus. Asian Pacific Journal of Tropical Medicine , 10 ( 8 ), 792 - 801 http://doi.org/10.1016/j. apjtm.2017.07.024 PMid:28942828.
Received: Jan. 01, 2024
Revised: Apr. 16, 2024
Accepted: Apr. 23, 2024
Pyriproxyfen-based Rumino-Reticulum Device for horn fly control in cattle: development and characterization
Melina Cardilo Campos Alves1 , Renata Nunes Oliveira3 , Gabriela Ferreira de Oliveira2 , Thais Paes Ferreira2 , Antonieta Middea4 , Maria Inês Bruno Tavares5 , Hugo Sabença2 , Bruno de Toledo Gomes1 , Luiz Henrique Guerreiro Rosado6 Fábio Barbour Scott2 and Yara Peluso Cid6*
1Programa de Pós-graduação em Ciências Veterinárias, Laboratório de Quimioterapia Experimental em Parasitologia Veterinária – LQEPV, Instituto de Veterinária, Universidade Federal Rural do Rio de Janeiro – UFRRJ, Seropédica, RJ, Brasil
2Laboratório de Quimioterapia Experimental em Parasitologia Veterinária – LQEPV, Departamento de Parasitologia Animal, Instituto de Veterinária, Universidade Federal Rural do Rio de Janeiro – UFRRJ, Seropédica, RJ, Brasil
3Departamento de Engenharia Química, Instituto de Tecnologia, Universidade Federal Rural do Rio de Janeiro – UFRRJ, Seropédica, RJ, Brasil
4Setor de Caracterização Tecnológica, Centro de Tecnologia Mineral – CETEM, Universidade Federal do Rio de Janeiro – UFRJ, Rio de Janeiro, RJ, Brasil
5Instituto de Macromoléculas Professora Eloisa Mano, Universidade Federal do Rio de Janeiro – UFRJ, Rio de Janeiro, RJ, Brasil
6Departamento de Ciências Farmacêuticas, Instituto de Ciências Biológicas e da Saúde, Universidade Federal Rural do Rio de Janeiro – UFRRJ, Seropédica, RJ, Brasil
*yarapcid@gmail.com
Obstract
This study aimed to develop a pyriproxyfen-based Rumino-Reticulum Device (RRD) consisting of films of poly(vinyl) alcohol (PVA) and sodium carboxymethylcellulose (NaCMC) to control the horn fly in cattle, one of the major pests of livestock. Films were obtained by the solvent casting method by PVA/NaCMC crosslinking and presented satisfactory homogeneity, drug content (104.8%) and pH (6.5), besides great absorptive capacity with swelling degree of 331.40% after 1 hour and diffusion-controlled release kinetics (Higuchi). FTIR and SEM analyzes clarify the characteristic bands of PVA, NaCMC and pyriproxyfen. The XRD and thermal analysis shows an increase in crystallinity due to pyriproxyfen (Xc:36.59%) and the active delivery alters the chain packing (Tg:74ºC). The pyriproxyfen-based RRD developed, in addition to fulfilling the characteristics of prolonged release, allows it to be rolled up (compressed form) facilitating swallowing and subsequent conversion to an expanded form that is retained in the rumen throughout the treatment period.
Keywords: intra-ruminal release, horn fly, polymeric films.
How to cite: Alves, M. C. C., Oliveira, R. N, Oliveira, G. F., Ferreira, T. P., Middea, A., Tavares, M. I. B., Sabença, H., Gomes, B. T., Rosado, L. H. G., Scott, F. B. & Cid, Y. P. (2024). Pyriproxyfen-based Rumino-Reticulum Device for horn fly control in cattle: development and characterization. Polímeros: Ciência e Tecnologia, 34(2), e20240019. https://doi.org/10.1590/0104-1428.20230079
1. Introduction
Polymers are commonly used to obtain controlledrelease dosage systems, acting as drug reservoirs due to their polymeric properties[1]. The United States Pharmacopeia (2022) defines controlled release as prolonging the release of the active substance (API) compared to that predicted for an immediate-release dosage form. Among its advantages are the reduction in the number of administrations and the increase in the average residence time in the gastrointestinal tract, improving the therapeutic effects[2,3] .
Polyvinyl alcohol (PVA) and carboxymethylcellulose (CMC) are biodegradable polymers with properties suitable for pharmaceutical uses, such as the ability to form films and prolonged drug release[4,5]. PVA-NaCMC films are obtained by a crosslinking reaction. Therefore, their physicochemical properties are influenced by the chemical structure of the copolymer, such as the reduction of water permeability, favoring the development of controlled release systems[5].
Alves,
M. C. C., Oliveira, R. N., Oliveira, G. F., Ferreira, T. P., Middea, A., Tavares, M. I. B., Sabença, H., Gomes, B. T., Rosado, L. H. G., Scott, F. B., & Cid, Y. P.
Haematobia irritans, or horn fly, is an obligate hematophagous parasite of cattle that generates painful bites that cause irritation and local stress in the dorsal region, resulting in deleterious effects on health, production, and performance of cattle[5]. Brazilian livestock breeding stands out internationally with the largest bovine population in the world. The economic losses linked to this parasite explain why antiparasitics for ruminants represent the largest share of the animal health products market[6,7] H. irritans control is commonly carried out using chemical products, such as pyrethroids, organophosphates, phenyl pyrazoles and their various associations, by injectable, pour-on and spray formulations as well as impregnated earrings[8]
Pyriproxyfen belongs to the insect growth regulation (IGR) class and is an alternative method to conventional pesticides. It is a juvenile hormone analog that regulates the growth and development of parasites in the immature stages, thus being more selective, less toxic and safer[9-11]. It is indicated for use in controlling fleas and ticks in pets, and insects such as Aedes aegypti[12,13]. Recently, its efficacy in controlling H. irritans administered intraruminal in multiple doses of immediate release was described[10]
Developing controlled-release dosage forms for cattle aims to minimize the time and cost of treating the herd, focusing on animal welfare and long-term protection and reducing the management cost, particularly important aspects due to extensive livestock grazing in Brazil[6,10]. Designing an Rumino-Reticulum Device (RRD) must take in consideration two important factors: the rumen environment conditions and the regurgitation reflexes. The unique anatomy and physiology of ruminants enable the long-term retention of devices in the rumen. However, to avoid regurgitation of RRDs, some strategies can be use, such as the use of particular geometrical shape that prevents regurgitation via the oesophagus. To reach such strategy, the device must present physical properties (breakage resistance and malleability) that allows it to be compressed in order to facilitate swallowed when administered and then convert to an expanded form that is retained for the duration of the treatment in rumen[14]. In this context, this study aimed to develop and characterize a pyriproxyfen-based RRD consisting of films of poly(vinyl)alcohol (PVA) and sodium carboxymethylcellulose (NaCMC) for the control of H. irritans in cattle The three-dimensional structures of the reticulated polymeric chains of films with controlled-release potential associated with oral efficacy of pyriproxyfen against H. irritans previously described[10] support the work proposal.
2. Materials and Methods
2.1 Film preparation
The films were obtained by the solvent casting method based on Oliveira et al.[15]. An aqueous PVA filmogenic solution (10% w/v) was obtained by mechanical stirring at 90 °C for 6 hours. NaCMC (2% w/v) was incorporated into the solution at room temperature under mechanical stirring for 30 minutes. Pyriproxyfen (0.00125% (w/v)) was solubilized in acetonitrile and added to the filmogenic solution. The final solution (5.0 mL) was degassed by ultrasound (Ultronique Q3.0/40), poured into silicone templates , and dried in an oven with constant air flow (Solab,
SL-102/1152), at 35 °C for 12 hours. The films were made measuring 144 cm2 (18 cm x 8 cm) containing 226.40 mg of pyriproxyfen (1.5 mg/cm2). The drug content per film was calculated in order to reach the dose (mg/kg) with larvicidal efficacy against H. irritans described by Oliveira et al.[10] The samples with and without the active ingredient were called PVA-NaCMC-P and PVA-NaCMC, respectively.
2.2 Physical-chemical characterization
The placebo (PVA-NaCMC) and film (PVA-NaCMC-P) samples were evaluated by physical-chemical tests of weight variation, surface pH, swelling degree, drug content, in vitro drug release, X-ray diffraction analysis (XRD), Fouriertransform infrared spectroscopy (FTIR), differential scanning calorimetry (DSC) and scanning electron microscopy (SEM). The film samples (PVA-NaCMC-P) after the in vitro release of the drug were also characterized by XRD, FTIR, DSC and SEM. The Figure 1 represents the chemical structure of pyriproxyfen.
2.3 Weight variation
The samples were randomly cut (1.0 cm2) from the film (n=3) and weighed individually and the results were expressed as mean ± SD. Assessments were performed in triplicate.
2.4 Surface pH
Samples with an average weight of 0.0224 g ± 0.01 were moistened in 5.0 mL of distilled water and the pH was measured on the surface of the film with a pH meter (PHS3E Even). Analyses were performed in triplicate.
2.5
Swelling degree
The degree of swelling assay was adapted according to Oliveira et al. (2013)[16]. Each sample (n=3, 1.0 cm2) was immersed in 5.0 mL of the artificial ruminal medium (ARM) solutions: Na2HPO4 (9.3g), NaHCO3 (9.8g), NaCl (4.7g), KCl (5.7g), CaCl2 (0.053g), MgCl2 (0.128g), FeSO2 (0.075g), MnSO4 (0.004g), urea (0.07g) and qsp water (1000.0 mL), pH fixed at 6.9, for four h at 38 °C, with weighing at times of 0, 5, 10, 15, 20, 30, 45 minutes and 1, 2 and 4 hours). The swelling degree (SD) was calculated according to Equation 1, where Ws is the weight of the polymer after swelling and Wd is the weight of the polymer before swelling.
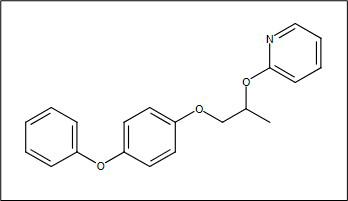
Figure 1. Chemical structure of Pyriproxyfen. CAS registry number: 95737-68-1. Molecular fórmulaC20H19NO3.
Pyriproxyfen-based Rumino-Reticulum Device for horn fly control in cattle: development and characterization
2.6 Drug content
Samples (1 cm2) of the PVA-NaCMC-P film were diluted with 10.0 mL of acetonitrile and submitted to ultrasound for 2 hours. Drug content was measured by the LC-UV method under the following conditions. The chromatographic separation was performed using a C18 column (Kromasil, 3.5 µm; 4.6×100 mm; Tedia, Rio de Janeiro, Brazil), preceded by a C18 guard column (Kromasil, 3.5 µm; 4.6×10 mm; Tedia, Rio de Janeiro, Brazil), both maintained at 25 °C. The mobile phase consisted of acetonitrile: water (80:20, v/v) with a 1.5 mL/minute flow rate. The UV wavelength was 254 nm, and the injection volume was 10 µL. The experiment was performed in triplicate, and the average values were calculated.
2.7 In vitro drug release studies
Initially, the solubility studies were performed using a shake flask method at 38 °C and a pH range of 5.1 to 7.0[17,18]. Samples were prepared with saturated solutions of pyriproxyfen in a medium of H20 (pH 5.6), phosphate buffer (pH 6.5), and artificial ruminal medium (pH 6.9) in surfactant sodium dodecyl sulfate (SDS) concentrations of 1.0 and 5.0% p/v and absence, at 38 °C. The test was performed for 24 hours on a shaking platform (Shake Incubator, Cienlab), and the aliquots were centrifuged (CT 6000r, Cientec) at 3,000 rpm, 584,7 rcf (g) for 10 min. The supernatants were filtered through a membrane Durapore® Millex-HV (PVDF), (0.45 μm × 13 mm) and analyzed by LC-UV.
The in vitro drug release studies were performed at phosphate buffer medium (PB) pH 6.5, artificial ruminal medium (ARM) pH 6.9, and ruminal medium (RM) pH 6.9, at 39 °C under agitation (Shake Incubator, Cienlab) at 100 rpm. The ruminal medium (RM) was collected via an oral probe in cattle. It was diluted (1:10) in the artificial ruminal medium, packed in amber bottles with seals against CO2 entry for medium maintenance. In each medium, film samples weighing 0.4767g ± 0.02 in the PB, 0.4708 ± 0.02g in the ARM, and 0.4869g ± 0.02 in the MR were immersed in 100 mL of the drug release medium. At time intervals of 1 to 60 days, 1 mL of the release medium was collected and the same amount of medium was replaced. The amount of released drug was analyzed by LC-UV, and the mechanism of release from the PVA-NaCMC-P samples was established by fitting the drug release kinetics data with applying three kinetic models: (1) zero-order: amount released per unit area (µg/cm2) versus time (h)(2) Higuchi: amount released per unit area (µg/cm2) versus the square root of time (h), and (3) first order: log of amount released per area (µg/cm2) versus time (h)[19].
2.8 X rays diffraction analysis (XRD)
The samples placebo (PVA-NaCMC), film (PVANaCMC-P), Film_AM (film PVA-NaCMC-P post release at artificial medium) and Film_RM (film PVA-NaCMC-P post release at ruminal medium) were evaluated by X-ray diffraction analysis using a Bruker AXS D8 Advance Eco diffractometer (CETEM/UFRJ) with CuKα radiation at 40 kV
and 25 mA. The parameters used were angular diffraction range of 2θ = 5°-70°, step of 0.02° and step time of 2 s. The curves were smoothed by the Savitzky-Golay method, polynomial order 2, no boundary condition, 15 points per window, using the Origin-Pro Software. To calculate the samples’ degree of crystallinity by XRD, Equation 2 was adapted[18], where AC is the crystalline area, and AT is the total area under the curve. To obtain the crystalline area, deconvolution of each curve using Lorentz fitting with manual adjustment was performed (Origin-Pro Software).
2.9 Fourier-transform infrared spectroscopy (FTIR)
Samples were evaluated for physical-chemical characterization by Fourier-transform infrared spectroscopy (FTIR) with a Bruker Vertex 70 spectrometer (USA), with wavenumber range of 400 cm-1 to 4000 cm-1 and 32 scans per sample. To plot the spectra, curves were smoothed (Savitzky-Golay method, 20 window points, polynomial order 2).
2.10 Differential scanning calorimetry (DSC)
The differential scanning calorimetry (DSC) analysis was performed with a TA Instruments Q-1000 calorimeter (IMA/UFRJ), with a heating rate of 10ºC/min, temperature range of room temperature to 250 ºC. The samples’ Tg (glass transition temperature) and Tm (melting temperature) were obtained in the third cycle of heating (to avoid the samples’ thermal history). The PVA’s degree of crystallinity was calculated in the third cycle of heating according to Equation 3, where: w is the PVA weight fraction in the samples, ∆Hm (J/g) is the sample heat of fusion, and ∆Hm 0 is the 100% crystalline PVA heat of fusion (161 J/g)[19]
2.11 Scanning electron microscopy (SEM)
The samples’ morphology was evaluated with a Hitachi Tm 3030 Plus scanning electron microscope under high vacuum, at 15 kV, coated with gold (Bal-tec SCD 005 sputter coater) (CETEM/UFRJ).
2.12 Statistical analysis
Statistical differences between three or more groups were analyzed using the One-way analysis of variance (ANOVA) with Tukey’s post hoc analysis. Statistical significance was set to a p value≤0.05. Results are presented as mean ± standard deviation.
3. Results and Discussions
3.1 Weight variation, surface pH, and drug content
The weight variation evaluation demonstrated the homogeneity of the samples, with values of 0.0390 ± 0.01 and 0.0446 ± 0.02 g for the placebo (PVA-NaCMC) and formulation (PVANaCMC-P), respectively. The surface pH helped characterize
Alves, M. C. C., Oliveira, R. N., Oliveira, G. F., Ferreira, T. P., Middea, A., Tavares, M. I. B., Sabença, H., Gomes, B. T.,
Rosado, L. H. G., Scott, F. B., & Cid, Y. P.
the films’ acidic or basic indicators and did not vary between the PVA-NaCMC and PVA-NaCMC-P samples, obtaining values from 6.80 ± 0.02 to 6.50 ± 0.14, indicating that the pH of the surface of the films is biocompatible with ruminal pH. The content value obtained for PVA-NaCMC-P was 104.81 ± 0.01, in accordance with the acceptable range of 90.0 to 110.0% of the active agent in the formulation (Table 1).
3.2 Swelling degree
The swelling degree test evaluates the film’s absorptive capacity, an important parameter to elucidate dissolution properties and release of the active by diffusion. The initial swelling degree was found to be 147.93% in 1 minute and increased over time, remaining stable at 60 minutes, with 331.40%, as shown in Figure 2.
The films consist of a crosslinked polymer network, with spaces between the polymer chains. Meshes allow the diffusion of liquids and small solutes, and one of the strategies for releasing actives trapped in polymeric films is controlled swelling[20]. According to the results, the PVANaCMC-P film has fast absorptive capacity, stabilizing in 1 hour. To evaluate this profile and its influence on the active release, an in vitro release study was carried out.
3.3 Solubility study: shake flask
Pyriproxyfen’s solubility (μg/mL) in the different dissolution media, with varying pH range (6.0 to 7.0), in the absence and presence of surfactant in various concentrations, is described in Table 2
Pyriproxyfen undergoes hydrolysis in an acid medium, being more stable in buffers with pH ranging from 4.0 to 9.0[21]. Since the bovine ruminal medium has a neutral pH (6.0 to 8.0), testing the solubility of pyriproxyfen under these conditions mimics the solubility and dissolution of the active agent under biological conditions[18]. The phosphate
Table 1. Results of Physicochemical evaluation of films. (n = 3).
*mean ± dp.
Table 2. Solubility (μg/mL) of Pyriproxyfen obtained by shake flask assay.
% SDS
(µg/mL)*
4.95 ± 0.1b 1 414.31 ± 0.8c
2088.53 ± 1.5d Phosphate Buffer (PB) - 0.39 ± 0.2 b
398.86 ± 0.9c 5 2412.43 ± 0.8d Artificial Ruminal Median (ARM) - 0.63 ± 0.2b 1 499.12 ± 0.9c 5 2349.02 ± 1.3d
*Solubility ± dp. Different letters differ significantly P <0,05; Equal letters don’t differ significantly. P > 0,05. Statistical analysis: OneWay ANOVA (Tukey).
buffer dissolution media and the artificial ruminal medium showed no significant differences. The increase in solubility was directly related to the rise in SDS concentration in the basic media, with the 5.0% concentration having the highest solubility of the three media. The use of surfactants in dissolution media is one of the main strategies to increase the solubility of insoluble drugs such as pyriproxyfen, in addition, the ruminal medium has fatty acids that act as surfactants[22]. Based on the results obtained, the value of the sink condition was 9.64 in ARM, being approximately nine times the total volume of the dissolution medium sufficient to prevent drug saturation and promote in vitro release.
3.4 In vitro drug release
The in vitro release profile of PVA-NaCMC-P films in the dissolution media phosphate buffer (PB), artificial ruminal medium (ARM), and ruminal medium (RM) is shown in Figure 3.
The dissolution profile of the PVA-NaCMC-P film in the PB, ARM, and MR media showed dissolved fractions from day 1, corresponding to 12.39%, 13.37%, and 11.18%, and on day 60 of 40.24%, 46.43%, and 49.39%, respectively.
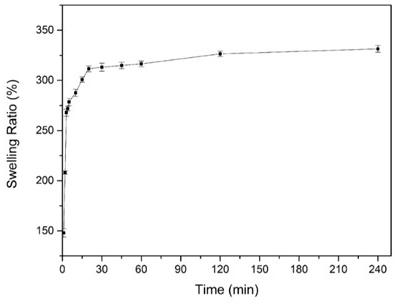
Figure 2. Swelling degree profile of PVA-NaCMC-P film in artificial ruminal medium (RAM).
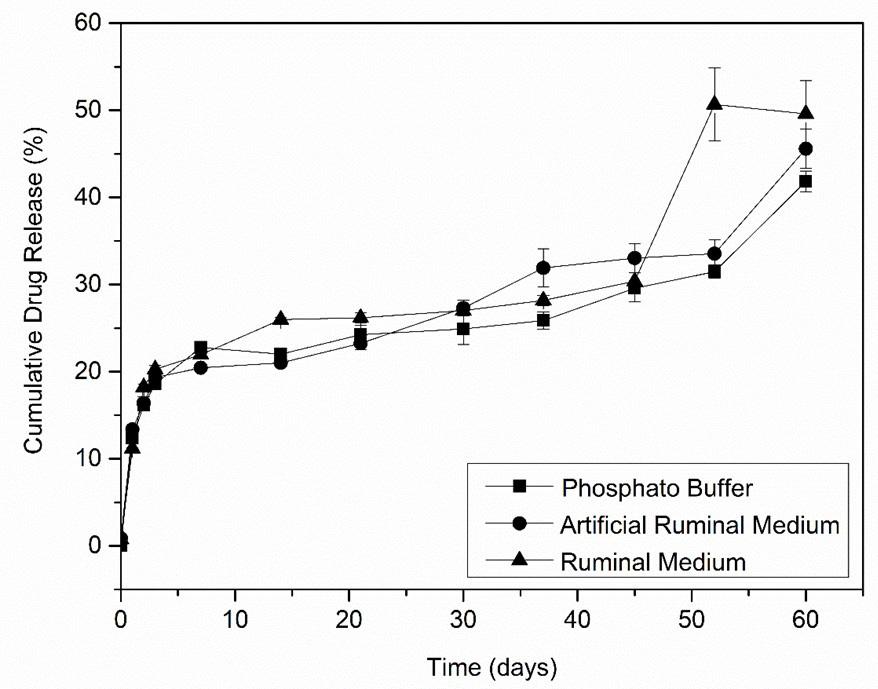
Figure 3. Drug release of PVA-NaCMC-P films determined in 100 mL of dissolution media (PB, ARM, RM) with SDS 5,0%; 100 rpm varying dissolution media.
Pyriproxyfen-based Rumino-Reticulum Device for horn fly control in cattle: development and characterization
Therefore, the one-way ANOVA and Tukey test indicated that the medium used did not significantly interfere with the release profile of the PVA-NaCMC-P formulation. Due to the support and control of the active release profile results together with the kinetics study, it can be stated that the formulation has the proper characteristics of a controlled release system.
3.5 In vitro release kinetics
The most linear portion (10 to 40 days) of each profile was chosen to determine the release kinetics for each formulation, and the three kinetic models were applied. The model that presented the highest linear correlation value was chosen as the kinetic model. The flux value (J) corresponds to the slope of the linear regression line. The flux (J) and linear correlation coefficient (r) values of the analyzed formulations are shown in Table 3.
In vitro release studies revealed pseudo-first-order kinetics (Higuchi), characterizing a diffusion-controlled release system. The dissolution media did not influence the kinetic profile. PVA-NaCMC hydrogels have been previously described for transporting drugs with sustained and controlled release, with several medical applications. Among its applications is the controlled release of drugs from transdermal dressings[23], release of water-soluble drugs[24], and release of orally administered peptides into the intestinal fluid[25]
The films were analyzed after release to elucidate the influence of dissolution and the medium on the mechanical, thermal, and morphological characteristics. They were named film AM (sample loaded with pyriproxyfen after immersion in the artificial medium) and film RM (sample loaded with pyriproxyfen after immersion in the bovine rumen medium).
3.6 X-ray diffraction analysis (XRD)
The samples’ XRD curves are displayed in Figure 4
The increase of the crystallinity of the Film sample occurs due to the presence of pyriproxyfen, attributed to the high number of crystalline peaks in the sample. The presence of pyriproxyfen was observed by the diffraction peaks at 2θ=13.93º and 16.77º and the PVA peak’s increased intensity at 2θ=19.42º. The film_AM (PVA-NaCMC-P post release at artificial medium) sample presented a diffractogram similar to the Placebo sample, indicating pyriproxyfen release, although the film_RM (PVA-NaCMC-P post release at ruminal
medium) sample had increased intensity of pyriproxyfen peaks at 2θ=13.91º and 2θ=16.62º, besides an extra peak at 2θ=25.25º. To calculate the crystallinity degree of each sample by XRD, the PVA-NaCMC peaks at 2θ=19.42º, 2θ=22.68º and 2θ=40.53º were considered crystalline ones, along with the pyriproxyfen peaks at 2θ=13.93º and 16.77º, a method adapted from[26] (Figure 5).
Regarding the Placebo sample, it is composed of PVA and NaCMC. PVA presented a peak at 2θ=19.42º, diffraction plane (101), a shoulder centered around 2θ=22.68º, diffraction plane (200), as well as a broad peak at 2θ=40.53º, a probable contribution of the PVA diffraction plane (110) or PVA diffraction plane (111)[27]. Carboxymethyl cellulose might also have contributed to the peaks at 2θ=19.42º and 2θ=22.68º
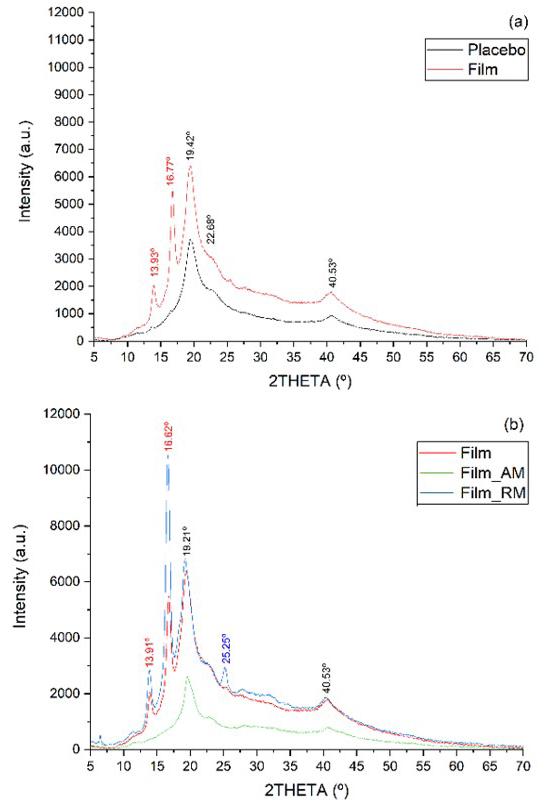
4. Diffractograms of (a) placebo and Film samples, (b) Film, Film_AM, and Film_RM samples.
dissolution media.
*Average values and their standard deviation.
Table 3. Determination of flux (J) and release kinetics (n=3) of PVA-NaCMC-P formulations in different
Figure
Alves,
M. C. C., Oliveira, R. N., Oliveira, G. F., Ferreira, T. P., Middea, A., Tavares, M. I. B., Sabença, H., Gomes, B. T., Rosado, L. H. G., Scott, F. B., & Cid, Y. P.
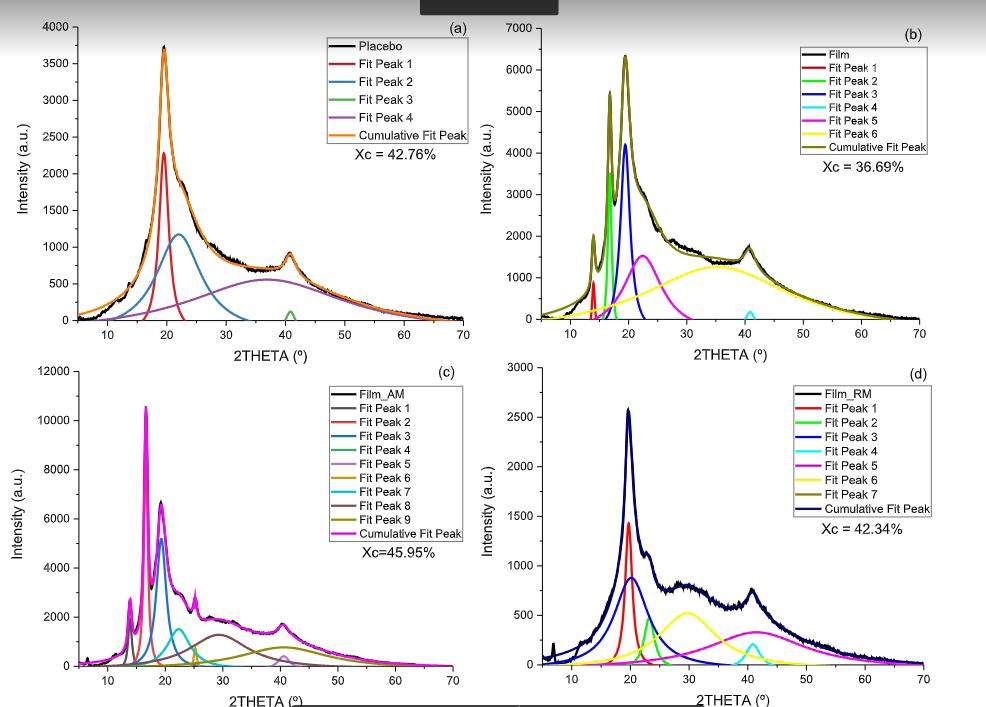
Figure 5. The deconvolution data, as well as the deconvoluted curves of the samples (a) placebo, (b) Film, (c) Film_AM, and (d) Film_R.
since cellulose type I presents crystalline peaks at 2θ=17º, 21º and 23º while cellulose type II presents diffraction peaks at 2θ=20º and 23º[28]. Na-CMC itself presents broad peaks in the region between 2θ=10º and 2θ=20º, related to the diffraction planes (002) and (101)[29].
The film sample had similar composition to the placebo sample, but pyriproxyfen was added, causing considerably more diffraction peaks, characteristic of some drugs[30] Pyriproxyfen presented diffraction peaks with high intensity in the range of 2θ=17º-25º[15]. Despite the crystallinity of pyriproxyfen, its addition diminished the samples’ degree of crystallinity. After immersion in artificial media, the film sample diffractogram was similar to the placebo one: the pyriproxyfen peaks were absent, indicating drug release. Nevertheless, after immersion in bovine rumen medium, the samples exhibited more intense pyriproxyfen peaks and an extra peak at 2θ=25.25º. In addition, the sample crystallinity was higher after immersion in the artificial medium (probably due to the release of pyriproxyfen, leaving the polymer chains with more freedom to move and pack in crystallites[15]. The Xc was similar to the placebo degree of crystallinity after immersion in bovine rumen medium.
3.7 Fourier-transform infrared spectroscopy (FTIR)
Compared to PVA and CMC, the Placebo sample (PVANaCMC) (Figure 6) presented similar bands to the original polymers. Still, some bands were displaced (indicated by arrows in Figure 6a), e.g., at 1647 and 1317 cm-1. Among them, some were located between PVA and CMC bands (indicated by arrows and lines in Figure 6a, i.e., 3268, 1145, 1083 cm-1),
probably indicating miscibility between polymers[31], and physical interaction between PVA and CMC[32]. In addition, a band related to crystalline cellulose I, at 896 cm-1, was detected[33]. The samples loaded with pyriproxyfen (named “Film”) presented not only some shifted bands, but low intensity bands probably related to pyriproxyfen, e.g., at 2958 cm-1, due to C-H (stretching/vibration/deformation) from the aromatic ring[34]; 1708 cm-1, attributed to C=O[35]; 1658 cm-1 , related to ( ) ( ) ( ) CO coupled with CN, = ν deformation CCN [36] (indicated by arrows in Figure 6b. The membrane evaluated after immersion in artificial medium did not have new bands. Although slight band displacement was observed, the absence of many NaCMC bands might be related to the high hydrophilicity of NaCMC[37]. The media might leach out amorphous NaCMC chains, resulting in absent bands[32]
The identified effect agrees with the results of the XRD and DSC analysis, where the dissolution of NaCMC in the media led to more freedom of movement of PVA chains, resulting in crystallization[38]. The same effect was encountered in samples immersed in rumen medium, but a band at 1558 cm-1 was identified (indicated by an arrow in Figure 6 d. It might have been related to amide II vibrations of proteins ( ( ) ( ) COandCNνν = of the peptide backbone), presented in the rumen medium[39]
3.8 Differential scanning calorimetry (DSC)
The placebo (PVA-NaCMC), film (PVA-NaCMC-P), and film_RM (PVA-NaCMC-P post release at ruminal medium) samples presented approximately similar Tg values (temperature in which the amorphous chains present
Pyriproxyfen-based Rumino-Reticulum Device for horn fly control in cattle: development and characterization
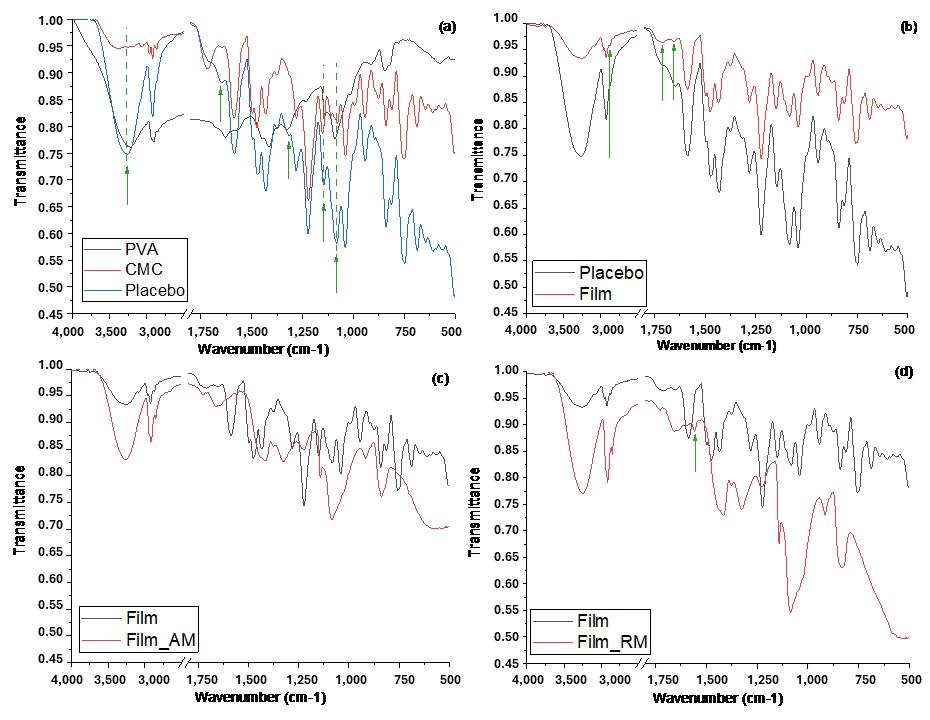
mobility[40], while film_AM had higher Tg than the other samples (Figure 7).
The high Tg of this sample might be related to the pyriproxyfen delivery, since the amorphous polymer chains might have rearranged themselves in the near absence of the drug. The Tm and Xc values diminished with a similar trend: Placebo > Film > Film_AM. The melting temperature is related to the melting of the hydrogels’ crystallites, which decreases as the crystallite imperfections increase[41]. Probably pyriproxyfen interferes with the crystallites’ formation and the swelling in the artificial media. The degree of crystallinity is related to the chains’ organization in the hydrogel[42] It followed the same trend as Tm, where pyriproxyfen and the artificial media interfered with the polymers’ chain organization according to the XRD results. After immersion in bovine rumen medium, there was an increase in both Xc and Tm, indicating that the hydrogel-medium interactions promote chain organization for formation of crystallites.
3.9 Scanning electron microscopy (SEM)
The porosity of the film sample was greater than that of the placebo one (Figure 8). The addition of pyriproxyfen altered the samples’ porosity distribution. After inclusion of artificial media, there were crystals (needle-like particles) on the fracture surface, indicating the probable presence of nanometric crystals related to the artificial media. The fracture surface of film_RM was similar to that of the placebo.
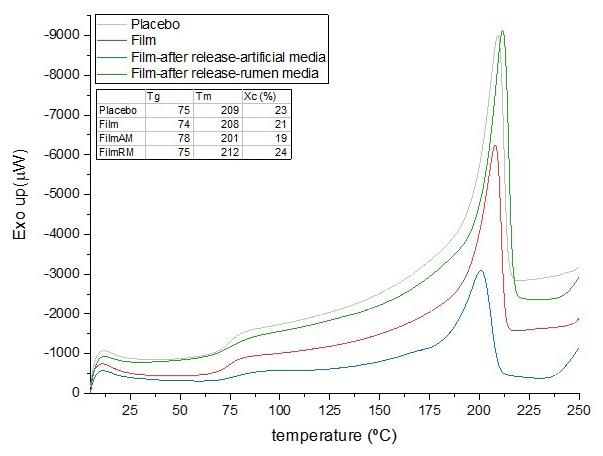
After immersion in both media, the samples presented low porosity, possibly indicating changes in the matrix due to drug delivery and polymer chain rearrangement promoted by the immersion in media[43]
Pyriproxyfen was encountered in the samples diffractograms, while the same technique indicated the drug release in the artificial medium and drug persistence after immersion in bovine rumen medium. The thermal analysis revealed that pyriproxyfen, as well as its delivery, altered the chain packing. In addition, the FTIR analysis showed
Figure 6. FTIR diffractograms of each sample .
Figure 7. DSC curves of each sample.
Alves,
M. C. C., Oliveira, R. N., Oliveira, G. F., Ferreira, T. P., Middea, A., Tavares, M. I. B., Sabença, H., Gomes, B. T., Rosado, L. H. G., Scott, F. B., & Cid, Y. P.
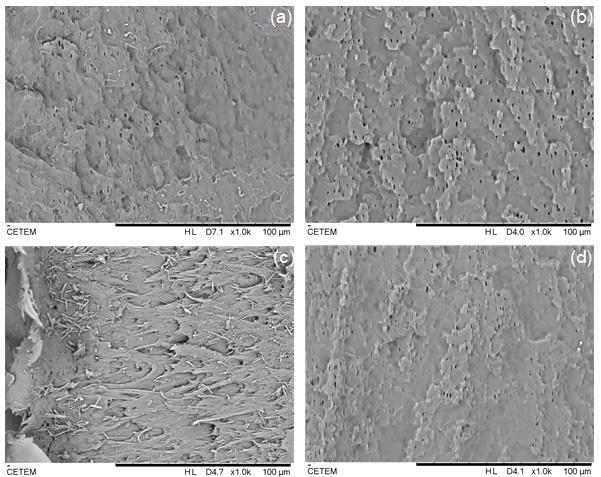
that PVA with low NaCMC was probably the remaining material after immersion in the media. The porosity of the films diminished after immersion, which might have been related to drug delivery and NaCMC dissolution.
As previously reported, pyriproxyfen when administered by the intra-ruminal route in cattle does not undergo degradation in the ruminal environment being eliminated in its active form in feces with strong IGD activity against H. irritans[10] The pyriproxyfen-based RRD consisting of films of poly(vinyl)alcohol (PVA) and sodium carboxymethylcellulose (NaCMC) developed in this work, in addition to full fill the characteristics of prolonged release, allows it to be wound (compressed form) resisting breakage or cracking and convert to an expanded form that is retained for the duration of the treatment. However, in order to verify the feasibility and biocompatibility of the device for oral administration in cattle, in vivo studies are necessary to identify potential advantages and disadvantages of oral application to ensure animal health and safety.
In the Brazilian livestock market, technological innovation is necessary to promote animal health and well-being and offer practicality and safety in veterinary therapy. The success of these controlled release systems (RDD) is related to the physicochemical characteristics of the polymer, guaranteeing advantages such as reduced animal stress, reduced handling risks and medication administration. The current market has delivery systems in the form of injectable solutions, impregnated earrings and pour-on solutions, therefore, the development of this device allows the market to resume with innovative oral applications.
4. Conclusion
The PVA-NaCMC-Pyriproxyfen film presented homogeneity in the weight variation test, along with content and pH
parameters satisfactory for the purpose. PVA, NaCMC and pyriproxyfen were identified in the FTIR spectra. SEM images showed changes in the porosity distribution after the addition of pyriproxyfen. XRD analysis showed an increase in crystallinity due to the presence of pyriproxyfen. In addition, DSC analysis revealed that pyriproxyfen and its delivery altered chain packing. Furthermore, the release study corroborated the pseudo-first-order kinetics model, characterizing a controlled drug release system without the influence of the dissolution medium (PB, ARM, RM). The pyriproxyfen-based RRD consisting of films of poly(vinyl)alcohol (PVA) and sodium carboxymethylcellulose (NaCMC) developed, in addition to fulfilling the characteristics of prolonged release, allows it to be rolled up (compressed form) facilitating swallowing and subsequent conversion to an expanded form that is retained in the rumen throughout the treatment period, presenting potential for application in the control of horn flies in cattle.
5. Author’s Contribution
• Conceptualization – Melina Cardilo Campos Alves; Luiz Henrique Guerreiro Rosado; Yara Peluso Cid.
• Data curation – Renata Nunes Oliveira; Thais Paes Ferreira.
• Formal analysis – Antonieta Middea; Maria Inês Bruno Tavares.
• Funding acquisition – Yara Peluso Cid; Fábio Barbour Scott.
• Investigation – Melina Cardilo Campos Alves.
• Methodology – Melina Cardilo Campos Alves; Gabriela Ferreira de Oliveira; Bruno de Toledo Gomes; Hugo Sabença.
• Project administration – Yara Peluso Cid.
• Resources – Fábio Barbour Scott; Yara Peluso Cid.
Figure 8. SEM images of the fracture surface of (a) placebo, (b) Film, (c) Film_AM, and (d) Film_RM samples.
Pyriproxyfen-based Rumino-Reticulum Device for horn fly control in cattle: development and characterization
• Software – NA.
• Supervision – Yara Peluso Cid; Renata Nunes de Oliveira.
• Validation – NA.
• Visualization – Melina Cardilo Campos Alves; Yara Peluso Cid.
• Writing – original draft – Melina Cardilo Campos Alves.
• Writing – review & editing – Melina Cardilo Campos Alves; Yara Peluso Cid; Renata Nunes de Oliveira.
6. Acknowledgements
This work was carried out with the support of CAPES and FAPERJ Process SEI E-26/201.381/2021 (260532). To the Analytical Center of QI and CETEM-UFRJ for the partnership and analyzes made.
7. References
1 Tran, T. T. D., & Tran, P. H. L. (2019). Controlled release film forming systems in drug delivery: the potential for efficient drug delivery. Pharmaceutics, 11(6), 290 http://doi.org/10.3390/ pharmaceutics11060290 PMid:31226748.
2 United States Pharmacopeia. (2022, November). 43 - National Formulary 38 (USP 43 - NF 38) Rockville: United States Pharmacopeia
3 Adepu, S., & Ramakrishna, S. (2021). Controlled drug delivery systems: current status and future directions. Molecules (Basel, Switzerland), 26(19), 5905. http://doi.org/10.3390/ molecules26195905. PMid:34641447.
4. Kim, M. N., & Yoon, M. G. (2010). Isolation of strains degrading poly(Vinyl alcohol) at high temperatures and their biodegradation ability. Polymer Degradation & Stability, 95(1), 89-93 http://doi.org/10.1016/j.polymdegradstab.2009.09.014
5 Khoramabadi, H. N., Arefian, M., Hojjati, M., Tajzad, I., Mokhtarzade, A., Mazhar, M., & Jamavari, A. (2020). A review of polyvinyl alcohol/carboxymethyl cellulose (PVA/CMC) composites for various applications. Journal of Composites and Compounds, 2(3), 69-76 http://doi.org/10.29252/jcc.2.2.2
6 Grisi, L., Leite, R. C., Martins, J. R. S., Barros, A. T. M., Andreotti, R., Cançado, P. H. D., Leon, A. A. P., Pereira, J. B., & Villela, H. S. (2014). Reassessment of the potential economic impact of cattle parasites in Brazil. Revista Brasileira de Parasitologia Veterinária, 23(2), 150-156 http://doi. org/10.1590/S1984-29612014042 PMid:25054492.
7 Sindicato Nacional da Indústria de Produtos para Saúde Animal - SINDAN. (2022, November 11). Retrieved in 2023, October 3, from https://sindan.org.br/wp-content/uploads/2023/10/ Fechamento-Mercado-2022_div-1.pdf
8 Taylor, M. A. (2001). Recent developments in ectoparasiticides. Veterinary Journal (London, England), 161(3), 253-268. http:// doi.org/10.1053/tvjl.2000.0549. PMid:11352483.
9. Faria, A. B. C. (2009). Revisão sobre alguns grupos de inseticidas utilizados no manejo integrado de pragas florestais. Ambiência - Revista do Setor de Ciências Agrárias e Ambientais, 5(2), 345-358. Retrieved in 2023, October 3, from https://revistas. unicentro.br/index.php/ambiencia/article/view/347/pdf
10 Oliveira, G. F., Magalhães, V. S., Alves, M. C. C., Jesus, I. L. R., Medeiros, M. T., Gomes, B. T., Calado, S. B., Melo, R. C., Cid, Y. P., & Scott, F. B. (2021). Evaluation of pyriproxyfen in cattle by oral treatment: an alternative to control Haematobia
irritans. Veterinary Parasitology, 299, 109565 http://doi. org/10.1016/j.vetpar.2021.109565 PMid:34507202.
11 Apolinário, R., & Feder, D. (2021). Existing potentials in Insect Growth Regulators (IGR) for crop pest control. Research, Social Development, 10(1), e35910111726 http://doi.org/10.33448/ rsd-v10i1.11726.
12 Albuquerque, M. F. P. M., Souza, W. V., Mendes, A. C. G., Lyra, T. M., Xiemenes, R. A. A., Araújo, T. V. B., Braga, C., Miranda-Filho, D. B., Martelli, C. M. T., & Rodrigues, L. C. (2016). Pyriproxyfen and the microcephaly epidemic in Brazil - an ecological approach to explore the hypothesis of their association. Memorias do Instituto Oswaldo Cruz, 111(12), 774-776 http://doi.org/10.1590/0074-02760160291 PMid:27812601.
13 Vythilingam, I., Luz, B. M., Hanni, R., Beng, T. S., & Huat, T. C. (2005). Laboratory and field evaluation of the insect growth regulator pyriproxyfen (Sumilarv 0.5 G) against dengue vectors. Journal of the American Mosquito Control Association, 21(3), 296-300. http://doi.org/10.2987/8756-971X(2005)21[296:LA FEOT]2.0.CO;2 PMid:16252520.
14 Vandamme, T. F., & Ellis, K. J. (2004). Issues and challenges in developing ruminal drug delivery systems. Advanced Drug Delivery Reviews, 56(10), 1415-1436 http://doi.org/10.1016/j. addr.2004.02.011 PMid:15191790.
15 Oliveira, R. N., McGuinness, G. B., Rouze, R., Quilty, B., Cahill, P., Soares, G. D. A., & Thiré, R. M. S. M. (2015). PVA hydrogels loaded with a Brazilian propolis for burn wound healing applications. Journal of Applied Polymer Science, 132(25), 1-12. http://doi.org/10.1002/app.42129.
16 Oliveira, R. N., Rouzé, R., Quilty, B., Alvez, G. G., Soares, G. D. A., Thiré, R. M. S. M., & McGuinness, G. B. (2013). Mechanical properties and in vitro characterization of polyvinyl alcohol-nano-silver hydrogel wound dressings. Interface Focus, 4(1), 120130049 http://doi.org/10.1098/rsfs.2013.0049 PMid:24501677.
17 Agência Nacional de Vigilância SanitáriaANVISA. (2013, June 17). Nota Técnica 003/2013 Brasília: Agência Nacional de Vigilância Sanitária
18 Apley, M., Crist, B., Gonzalez, M. A., Hunter, R. P., Martinez, M. N., Modric, S., Papich, M. G., Parr, A. F., Riviere, J. E., & Marques, M. R. C. (2013). Solubility criteria for veterinary drugs-workshop report. Dissolution Technologies, 39(4), 2235 http://doi.org/10.14227/DT240117P22
19 Chou, C.-T., Shi, S.-C., & Chen, C.-K. (2021). SandwichStructured, Hydrophobic, Nanocellulose-Reinforced Polyvinyl Alcohol as an Alternative Straw Material. Polymers, 13(24), 4447 http://doi.org/10.3390/polym13244447 PMid:34960998.
20 . Li, J., & Mooney, D. J. (2016). Designing hydrogels for controlled drug delivery. Nature Reviews. Materials, 1(12), 16071 http:// doi.org/10.1038/natrevmats.2016.71 PMid:29657852.
21. Tassone, S., Fortina, R., & Peiretti, P. G. (2020). In vitro techniques using the daisyii incubator for the assessment of digestibility: a review. Animals (Basel), 10(5), 775 http://doi. org/10.3390/ani10050775 PMid:32365689.
22 Oliveira, R. N., Moreira, A. P. D., Thiré, R. M. S. M., Quilty, B., Passos, T. M., Simon, P., Mancini, M. C., & McGuinness, G. B. (2017). Absorbent polyvinyl alcohol–sodium carboxymethyl cellulose hydrogels for propolis delivery in wound healing applications. Polymer Engineering and Science, 57(11), 12241233 http://doi.org/10.1002/pen.24500
23. Agarwal, R., Alam, M. S., & Gupta, B. (2013). Polyvinyl alcohol-polyethylene oxide-car boxymethyl cellulose membranes for drug delivery. Journal of Applied Polymer Science, 129(6), 3728-1836 http://doi.org/10.1002/app.39144
24 Ye, J., Liu, L., Lan, W., & Xiong, J. (2023). Targeted release of soybean peptide from CMC/PVA hydrogels in simulated intestinal
Alves, M. C. C., Oliveira, R. N., Oliveira, G. F., Ferreira, T. P., Middea, A., Tavares, M. I. B., Sabença, H., Gomes, B. T., Rosado, L. H. G., Scott, F. B., & Cid, Y. P.
fluid and their pharmacokinetics. Carbohydrate Polymers, 310, 120713 http://doi.org/10.1016/j.carbpol.2023.120713 PMid:36925260.
25 Schoeler, M. N., Scremin, F. R., Mendonça, N. F., Benetti, V. P., Jesus, J. A., Basso, R. L. O., & Bittencourt, P. R. S. (2020). Cellulose nanofibers from cassava agro-industrial waste as reinforcement in Pva films. Quimica Nova, 43(6), 711-717 http://doi.org/10.21577/0100-4042.20170542
26 Tang, C.-M., Tian, Y.-H., & Hsu, S.-H. (2015). Poly(vinyl alcohol) nanocomposites reinforced with bamboo charcoal nanoparticles: mineralization behavior and characterization. Materials (Basel), 8(8), 4895-4911 http://doi.org/10.3390/ ma8084895 PMid:28793480.
27 Machado, G. O. (2000). Preparação e caracterização de CMC e CMC graftizada (Master’s thesis). Universidade de São Paulo, São Carlos http://doi.org/10.11606/D.88.2000. tde-11092001-160555
28 Sunardi, S., Febriani, N. M., & Junaidi, A. B. (2017). Preparation of carboxymethyl cellulose produced from purun tikus (Eleocharis dulcis). IOP Conference Series. Materials Science and Engineering, 1868, 020008 http://doi.org/10.1063/1.4995094
29 Cardoso, V. M. O., Cury, B. S. F., Evangelista, R. C., & Gremião, M. P. D. (2017). Development and characterization of crosslinked gellan gum and retrograded starch blend hydrogels for drug delivery applications. Journal of the Mechanical Behavior of Biomedical Materials, 65, 317-333 http://doi.org/10.1016/j. jmbbm.2016.08.005. PMid:27631170.
30 Gurarslan, A., Shen, J., Caydamli, Y., & Tonelli, A. E. (2015). Pyriproxyfen cyclodextrin inclusion compounds. Journal of Inclusion Phenomena and Macrocyclic Chemistry, 82(3), 489-496 http://doi.org/10.1007/s10847-015-0526-7
31 Reddy, R., Okigbo, R. N., & Putheti, M. (2016). Correlation of the miscibility of commercially important polymers PVC/PMMA and PS/PMMA in dilute solutions and in solid state. Science Advances and Engineering Research, 2(2), 11-15. Retrieved in 2023, October 3, from https://www.primescholarslibrary. org/articles/correlation-of-the-miscibility-of-commerciallyimportant-polymers-pvcpmma-and-pspmma-in-dilute-solutionsand-in-solid-st.pdf
32 Santos, G. S., Santos, N. R. R., Pereira, I. C. S., Andrade Júnior, A. J., Lima, E. M. B., Minguita, A. P., Rosado, L. H. G., Moreira, A. P. D., Middea, A., Prudencio, E. R., Luchese, R. H., & Oliveira, R. N. (2020). Layered cryogels laden with Brazilian honey intended for wound care. Polímeros: Ciência e Tenologia, 30(3), e2020031. http://doi.org/10.1590/01041428.06820
33 Yang, Y. P., Zhang, Y., Lang, Y. X., & Yu, M. H. (2017). Structural ATR-IR analysis of cellulose fibers prepared from a NaOH complex aqueous solution. IOP Conference Series. Materials Science and Engineering, 213(1), 012039 http:// doi.org/10.1088/1757-899X/213/1/012039
34 Alves, M. C. C. (2021, July 19-22). Poly(vinyl)alcohol -based films containing pyriproxyfen against Haematobia
irritans in cattle: formulation development, physico-chemical characterization and in vitro drug release. In Proceedings of the 28th Conference of the World Association for the Advancement of Veterinary Parasitology WAAVP 2021 (pp. 492). Dublin, Ireland
35 Yang, K. W., Murphy, D. L., White, C. S., Parfenova, M. N., McDaniel, J. D., & Ko, J. (2006). U.S. Patent No US8226963B2 Washington, DC: U.S. Patent and Trademark Office. Retrieved in 2023, October 3, from https://patents.google.com/patent/ US8226963B2/en
36. Alromeed, A. A., Scrano, L. A., Bufo, S. A., & Undabeytia, T. (2015). Slow-release formulations of the herbicide MCPA by using clay-protein composites. Pest Management Science, 71(9), 1303-1310 http://doi.org/10.1002/ps.3929 PMid:25346289.
37 Rahman, S., Hasan, S., Nitai, A. S., Nam, S., Karmakar, A. K., Ahsan, S., Shiddiky, M. J. A., & Ahmed, M. B. (2021). Recent developments of carboxymethyl cellulose. Polymers (Basel), 13(8), 1345 http://doi.org/10.3390/polym13081345 PMid:33924089.
38. Zuo, Z., Zhang, Y., Zhou, L., Liu, Z., Jiang, Z., Liu, Y., & Tang, L. (2021). Mechanical behaviors and probabilistic multiphase network model of polyvinyl alcohol hydrogel after being immersed in sodium hydroxide solution. RSC Advances, 11(19), 11468-11480 http://doi.org/10.1039/D1RA00653C PMid:35423654.
39. Liu, D., Wu, P., & Jiao, P. (2016). Researching rumen degradation behaviour of protein by FTIR spectroscopy. Czech Journal of Animal Science, 60(1), 25-32 http://doi.org/10.17221/7908CJAS.
40 Iijima, M., Kosaka, S., Hatakeyama, T., & Hatakeyama, H. (2016). Phase transition of poly(vinyl alcohol) hydrogel filled with micro-fibrillated cellulose. Journal of Thermal Analysis and Calorimetry, 123(3), 1809-1815 http://doi.org/10.1007/ s10973-015-4725-7
41 Fakirov, S., Cagiao, M. E., Baltá-Calleja, F. J., Sapundjieva, D., & Vassileva, E. D. (1999). Melting of gelatin crystals below glass transition temperature: a direct crystal-glass transition as revealed by microhardness. International Journal of Polymeric Materials, 43(3-4), 195-206 http://doi. org/10.1080/00914039908009685
42 Bustamante-Torres, M., Romero-Fierro, D., Arcentales-Vera, B., Palomino, K., Magaña, H., & Bucio, E. (2021). Hydrogels classification according to the physical or chemical interactions and as stimuli-sensitive materials. Gels (Basel, Switzerland), 7(4), 182 http://doi.org/10.3390/gels7040182 PMid:34842654.
43 Zhang, M., Bhattarai, N., & Matsen, F. A. (2014). US Patent No US8663686B2 Washington, DC: U.S. Patent and Trademark Office. Retrieved in 2023, October 3, from https://patents. google.com/patent/US8663686B2/en
Received: Oct. 03, 2023
Revised: Apr. 15, 2024
Accepted: Apr. 23, 2024
Processing and characterization of biocomposites based on polylactic acid and coconut by-products
Yulinali Valente Morales1 , Luz del Carmen Montoya-Ballesteros1 , Luis Enrique Robles-Ozuna1 , Yesica Yudith Martínez Núñez1 , Judith Fortiz Hernández1 , José Carmelo Encinas-Encinas2 and Tomás Jesús Madera-Santana1*
1Coordinación de Tecnología de Alimentos de Origen Vegetal, Centro de Investigación en Alimentación y Desarrollo A.C., Hermosillo, Sonora, México
2Departamento de Investigación en Polímeros y Materiales, Universidad de Sonora, Hermosillo, Sonora, México
*madera@ciad.mx
Obstract
Coconut mesocarp fiber (CMF) is a by-product of the coconut industry; it was milled to produce coconut mesocarp particles (CMP). The main elements identified in CMP samples were C and O, which represent 96.75%. The CMP were mixed with a polylactic acid (PLA) matrix by extrusion. The mechanical, thermal, structural, and morphological properties of four biocomposites with 0, 2, 5, and 8 wt% CMP (CMP0, CMP2, CMP5, and CMP8, respectively) were determined. The biocomposites showed a decrease in tensile strength, elongation at break, and elastic modulus values as the CMP content increased, except for CMP5, which showed a higher elastic modulus than the PLA matrix. The thermal analysis showed that the biocomposites presented better thermal stability than the PLA matrix. CMP2 and CMP5 had rough surfaces, while CMP8 had weaker fracture zones.
Keywords: composite materials, agroindustrial by-product, morphological analysis, physicochemical properties, bioplastic matrix.
How to cite: Valente Morales, Y., Montoya-Ballesteros, L. C., Robles-Ozuna, L. E., Martínez Núñez, Y. Y., Fortiz Hernández, J., Encinas-Encinas, J. C., & Madera-Santana, T. J. (2024). Processing and characterization of biocomposites based on polylactic acid and coconut by-products. Polímeros: Ciência e Tecnologia, 34(2), e20240020. https://doi.org/10.1590/0104-1428.20240032
1. Introduction
Agro-industrial wastes represent a major environmental pollution problem: They impact different ecosystems through final disposal in confinement sites, open dumps, or water bodies. Untreated agro-industrial wastes, including undesirable by-products, contribute to the emission of greenhouse gases, which exacerbate climate change in various ways[1] . Agro-industrial residues contain a high content of organic matter, which is rich in carbohydrates, proteins, lipids, fibers, phenolic compounds, and bioactive compounds[2]. These products can be used to fabricate biocomposites due to their high availability and low price, making them a highly sustainable strategy for waste valorization[3]. Moreover, they represent an ecological and unique option to reinforce bioplastic matrices, such as polylactic acid (PLA), which is a biodegradable under compostable conditions and can be employed as a matrix or binding agent for the development of biocomposites[4]
Coconut (Cocos nucifera L.) is one of the most important crops in tropical areas. It grows in 93 countries around the world, including Mexico. The growing demand for coconut consumption has turned it into a commercially important crop that contributes to the growth of national economies. Each year, 55 billion coconuts are processed throughout the
world, generating a large volume of waste, including coconut residues (mesocarp), shells, and inner kernels (endocarp). This disposal represents a waste of natural resources and a source environmental pollution[3,5]. Coconut fiber, also known as “coconut coir”, is present in the mesocarp and represents around 35% of the coconut. It is a hard, resistant, and light fiber that has resistance to abrasion and good thermal stability due to its high lignin content (26.43%)[3] However, no studies exist on coconut mesocarp particles (CMP) by-products to develop biocomposites using PLA as a polymeric matrix.
The aim of this study was to develop and characterize new biocomposites based on coconut mesocarp particles (CMP) of the Alto Pacifico 2 variety and PLA as matrix. The proximal and physicochemical characteristics of the CMP were determined. The PLA-CMP biocomposites were produced by extrusion in a flat die profile to obtain laminated biocomposites. Mechanical, chemical, structural, and morphological properties were determined for PLACMP biocomposites. The addition of CMP to a PLA matrix produces biodegradable biocomposites with excellent mechanical and thermal properties.
Morales, Y., Montoya-Ballesteros, L. C., Robles-Ozuna, L. E., Martínez Núñez, Y. Y., Fortiz Hernández, J., Encinas-Encinas, J. C., & Madera-Santana, T. J.
2. Materials and Methods
2.1. Materials
Coconut mesocarp fiber (CMF) was obtained from Alto Pacifico 2 coconuts at port of San Crisanto, Yucatán. CMF was sun-dried for one week until it reached a moisture content of 7.67%. Then, CMF was ground in an industrial knife mill (Pagani model 1620, Mexico City, Mexico); a second grinding was carried out in a Comitrol 3600 mill (Urschel Laboratories Inc., Chesterton, IN, USA). The ground CMF was subjected to a size reduction via a hammer mill (model DF-15, Dade, Shenzhen, China). After milling, the product was sieved through a Tyler No. 100 mesh to obtain small particles, which were called coconut mesocarp particles (CMP). Polylactic acid (Ingeo 4043D) from NatureWorks LLC. (Minnetonka, MN, USA) was used as the polymeric matrix.
2.2. Physicochemical characterization
The proximate composition of CMP—including moisture, ash, protein, ethereal extract, crude fiber, and nitrogen-free extract were determined by using the official methods of AOAC International.
Fourier transform infrared spectroscopy (FTIR) was performed using the attenuated total reflection (ATR) accessory of a Thermo Nicolet Nexus 670-FTIR spectrophotometer (Madison, WI, USA). The CMP spectra were obtained in the 4000-600 cm-1 range, at 4 cm-1 resolution, and with 64 scans.
To measure phenolic compounds in CMP, 25 mg of the dry sample was weighed and added to 5 mL of an 80% methanol solution was added. The mixture was agitated for 4 min. Subsequently, it was centrifuged at 1100 g for 10 min at room temperature (25°C), and the supernatant was removed and stored. The residue was subjected to four extractions, each with 5 mL of 80% methanol, and the supernatants were pooled. The total phenolic contents was determined with the Folin–Ciocalteu method as described by Singleton et al.[6], with some modifications. Briefly, 100 µL of sample, 600 µL of distilled water, and 50 µL of Folin–Ciocalteu reagent were incubated in a test tube for 5 min. Subsequently, 150 µL of sodium carbonate was added. After incubation for 2 h in the dark, the absorbance was read at 760 nm. A gallic acid standard curve was used to determine the total phenolic content. The results are expressed as mg gallic acid/g sample on a dry basis.
2.3.
Morphological characterization
FEI XL30 environmental scanning electron microscope (Philips Corp. –FEG, Hillsboro, OR, USA) was used for morphological analysis of CMP. The samples were coated with a layer of gold-palladium with an Au-Pd layer with a QI5OR-ES plasma generator (Quorum, Sussex, UK). The morphological analysis of the PLA–CMP biocomposites in their tensile fracture zone was performed. The elemental composition of the CMP was determined using a JEOL energy dispersive X-ray spectrometer (EDS) on JSM 7900F FSEM equipment (Zaventem, Belgium), which had a 30 kV acceleration.
2.4.
Processing of the biocomposites
The PLA-CMP biocomposites that were produced in this work are described in Table 1. Their production involved two stages. In the first stage, the components were pre-mixed in a single-screw extruder (l/d 25/1 and a compression ratio of 3:1; Beutelspacher, Mexico City, Mexico). The mixing speed was 40 rpm, and the temperature profile from the feed zone to the die zone was 130, 140, 145, and 150°C. Throughout this step, CMP was incorporated into the PLA matrix to produce biocomposite filaments that were then pelletized. In the second stage, the formulations were processed by extrusion in a flat die to produce a laminated biocomposite that was 12 cm wide. The mixing speed was 65 rpm, and the temperature profile from the feed zone to the die zone was 150, 160, 175, and 190°C.
2.5. Characterization of PLA-CMP biocomposites
The color parameters of the biocomposites were measured with a chroma meter (Konica Minolta model CR-400) at five random points on the laminate on a white background. Based the parameters L*, a*, and b*, hue angle (°Hue*), and chromaticity (C*) were calculated using Equation 1 and Equation 2, respectively.
2.5.1. Apparent density
Weightofthesampleg
Density Volumeofthesamplecm = (3)
ASTM D1895-17 was used to establish the density of the biocomposites. The samples consisted of 1 × 4 cm rectangles, and their thickness was measured to calculate the volume. Subsequently, the samples were weighed on an analytical balance (Ohaus model PX2224, Parsippany, NJ, USA). Density was calculated with Equation 3 was used as follows: ( ) ( ) 3
2.5.2. Differential scanning calorimetry (DSC)
A calorimeter (Perkin Elmer model Pyris-Diamond, Boston, MA, USA) was used to determine the thermal parameters of glass transition temperature (Tg), crystallization temperature (Tc), melting temperature (Tm), enthalpy of
Table 1. Polylactic acid (PLA) – coconut mesocarp particle (CMP) biocomposites.
Código PLA (wt%) CMP (wt%)
Valente
Processing and characterization of biocomposites based on polylactic acid and coconut by-products
crystallization (∆Hc), enthalpy of fusion (∆Hm), and the percentage of crystallinity. The measurement was conducted in the second heating (heat-cool-heat), in a temperature range from 0°C to 200°C, with a heating and cooling rate of 10°C/min and 50°C/min, respectively.
2.5.3. FTIR spectroscopy
FTIR spectroscopy was used to analyze the PLA–CMP biocomposites as described in section 2.2.
2.5.4. Mechanical properties
Tensile tests were performed using an universal machine (United model SSTM-5KN, Fullerton, CA, USA). The mechanical test was carried out at a crosshead speed of 5 mm/min up to sample failure. The parameters tensile strength, percentage of elongation at break, and tensile modulus were determined from the stress-strain curves. At least six rectangular specimens (1 × 6 cm) were tested at room temperature (25°C and 60% relative humidity).
2.5.5. Statistical analysis
A completely randomized design was employed, with the response variables determined by the amount of CMP (0, 2, 5, and 8 wt%) in the biocomposites. CMP0, which contained just PLA, was used as a control sample. The mean ± standard deviation of the replicates are reported for each analyzed parameter. The STATGRAPHICS PLUS 5.1 statistical program was used to perform analysis of variance (ANOVA). A p-value (p < 0.05) indicates statistically significant difference.
3. Results and Discussions
3.1. Characterization of CMP
Table 2 shows the proximate analysis of CMP on a dry basis (d.b.). The moisture and ash content were 7.67% and 4.59%, respectively. Compared with coconut, the natural fibers of abaca, jute, and sisal have higher moisture percentages of 15, 12.6, and 11%, respectively[7], and lower ash content of 3%, 1%, and 0.8%, respectively[8]. With respect to the ash content, CMP has more minerals than jute, sisal, hemp, cabuya, and banana stalk fibers. However, this content may vary over time; if the fiber is exposed to the environment, minerals are lost through leaching. Finally, the ether extract and protein contents of CMP are low compared with other plant products. This indicates that coconut fiber is not a source of protein and energy.
3.1.1.
FTIR spectroscopy
The FTIR spectrum of CMP (Figure 1) presents the characteristic bands of cellulose and lignin structures. There is a broad absorption band at 3315 cm-1, which represents the vibration of the O-H (hydroxyl) bonds; this signal is assigned to polysaccharides such as lignin, cellulose, and hemicellulose[9]. A band at 2907 cm-1 represents the stretching of the aliphatic group of C-H2. The bands at 1615 cm-1 and 1597 cm-1 correspond to the vibrations of the ester (COO-) and alkene (C-C) bonds of the lignin molecule (aromatic ring), respectively. The band at 1239 cm-1 corresponds to the C-O groups of hemicellulose present in coconut fiber[10]
Parameters Value (wt% dry basis)
Protein
3.10±0.2
Data are presented as the mean ± standard deviation.
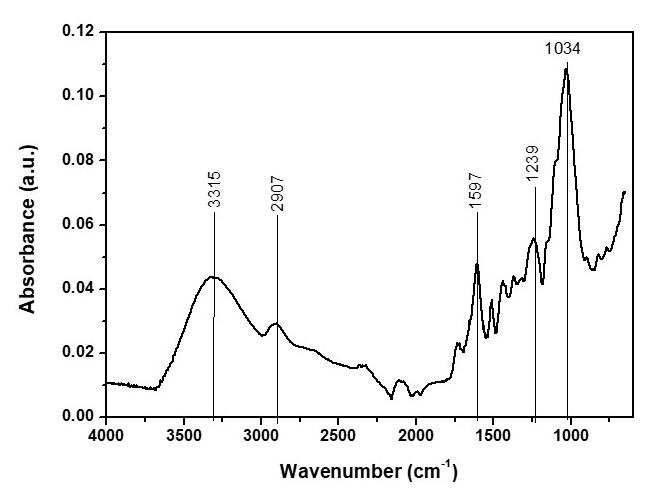
An intense band at 1034 cm-1 is attributed to stretching vibrations in C-O and C-C groups present in the glycoside ring of cellulose[11]. Overall, the FTIR spectrum of CMP indicates the substantial presence of cellulose and lignin, as well as a relatively low hemicellulose content.
3.1.2. Total phenolic content
Based on the Folin-Ciocalteu method, the total phenolic content of CMP was 50.30 ± 1.6 mg gallic acid/g. This result is within the range of 25 to 78 mg gallic acid/g reported for copra, which is used for the extraction of virgin coconut oil[12] Because the total phenolic content of CMP of the Alto Pacífico 2 variety had not been previously reported, it was compared with other agro-industrial residues. Walnut shells (58.17 ± 2.64 mg gallic acid/g) and coffee shells (52.57-97.44 mg gallic acid/g) have a slightly higher total phenolic content than of PMC. In contrast, grape pomace (10.60 ± 0.40 mg/g) and orange peel (33.24 ± 4.10 mg gallic acid/g) present a lower total phenolic content than CMP. Phenols in CMP can confer antioxidant properties. Moreover, the complex polyphenolic structure and numerous functional groups of lignin mean it could be mixed with other biopolymers to produce active films. These films contain biopolymers with bioactive compounds, allowing the controlled release of these compounds. This controlled release can extend the shelf life of food and protect it against oxidative rancidity, degradation, and discoloration.
3.1.3. Morphological characterization and elemental composition
CMP is lignocellulosic material composed of cellulose microfibrils bound together by lignin. CMP, produced from CMF, were submitted to morphological analysis.
Table 2. Proximate composition of Cocos nucifera L. (Alto Pacifico 2 variety) mesocarp particles.
Figure 1. Fourier-transform infrared spectrum of coconut mesocarp particles.
Valente Morales, Y., Montoya-Ballesteros, L. C., Robles-Ozuna, L. E., Martínez Núñez, Y. Y., Fortiz Hernández, J., Encinas-Encinas, J. C., & Madera-Santana, T. J.
Figure 2 shows the scanning electron micrographs of the Tyler No. 100 mesh particles at 100× (Figure 2a) and 200× (Figure 2b) magnification. In Figure 2a, there are small and large particles indicating a heterogeneous particle size distribution. Figure 2b presents a close-up of one of the larger particles showing the unit cell structure of the exfoliated, which are in the form of overlapping sheets and plates. The exfoliated structures correspond to non-fibrous particles; it is assumed that they are coated by layers that are rich in hemicellulose and lignin. Moreover, these structures provide rigidity to the cellulose–hemicellulose–lignin network, which showing a rough surface[13] .
The elemental composition of the coconut particles is presented in Figure 3. This analysis was performed on the surface of the sample (inset image). The elements present in the spectrum are carbon, potassium, oxygen, sodium, silicon, and chlorine; sodium and silicon are present in trace amounts. The presence of sodium and potassium is mainly
attributed to the salinity of the CMF powder[14]. The table in Figure 3 shows that the major element is carbon, followed by oxygen; together, these elements represent 96.75% of the weight. The atomic O/C ratio of coconut particles is 0.57, which is lower than pineapple husk (0.70) and coffee husk (0.71). According to Ugwu and Enweremadu[15], the higher the atomic O/C ratio, the lower the calorific value; therefore, the oxygen in the residue does not contribute to the calorific value in the agro-industrial residue.
3.2. Characterization of the PLA-CMP biocomposites
3.2.1.
Color and density
In the PLA–CMP biocomposites, L* and °Hue* decreased gradually as the CMP content increased. The brightness of CMP0 (which only contained PLA) was significantly different (p < 0.05) from CMP2, CMP5, and CMP8. This difference is because CMP do not reflect light and the PLA–CMP biocomposites behave as an opaque material.
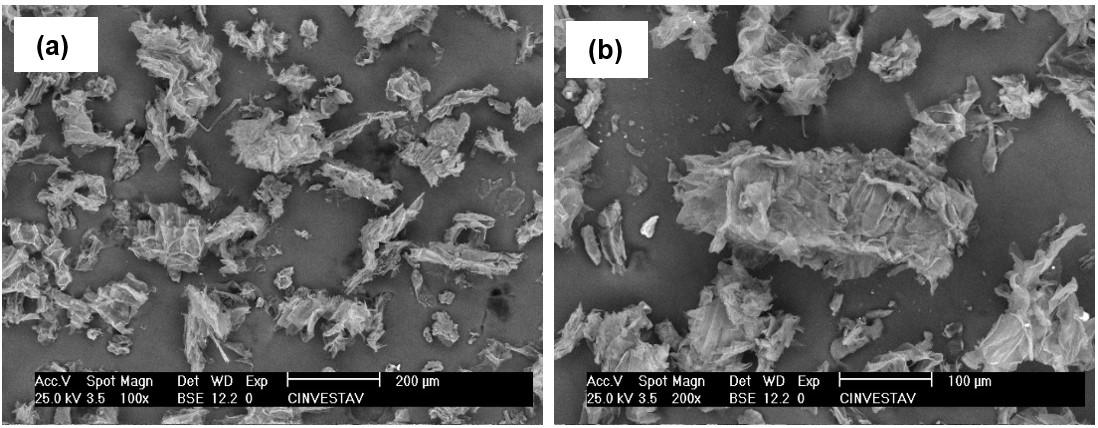
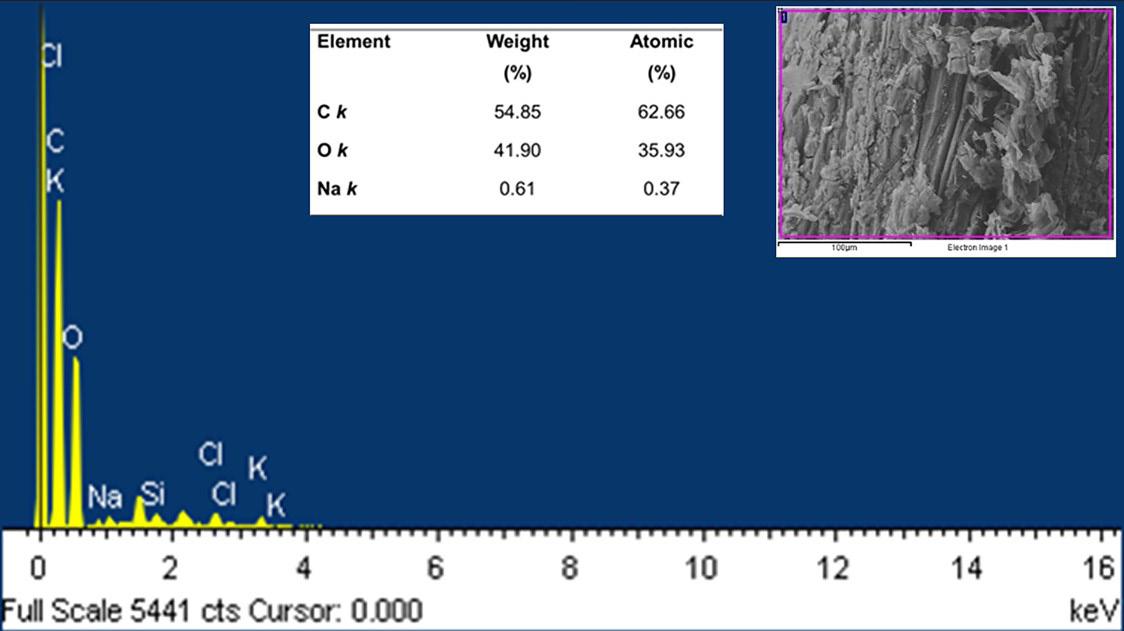
Figure 2. Scanning electron micrographs of coconut mesocarp particles at 100× (a) and 200× (b) magnification.
Figure 3. Elemental composition of coconut mesocarp particles.
Processing and characterization of biocomposites based on polylactic acid and coconut by-products
CMP0 (only PLA) presented a C* value close to 0, which indicates that there is a tendency for it to be white. The C* value increased in the PLA–CMP biocomposites as the CMP content increased; it was significantly different (p < 0.05) in CMP2, CMP5, and CMP8 compared with CMP0. C* was not significantly different (p > 0.05) between CMP5 and CMP8; both films had a brownish chroma. CMP0 had a white shade and a significantly different °Hue* (p < 0.05) compared with CMP2, CMP5, and CMP8, which presented a yellowish shade. There was a significant difference (p < 0.05) in °Hue*. The °Hue* and C* parameters confirms that the brown (red-yellow) shade of CMP8. Figure 4 shows the images of the formulated biocomposites.
Table 3 also presents the density of each formulation. Given that the density of the PLA matrix is 0.95 g/cm3 and the density of the CMP is 0.145 g/cm3, the addition of
CMP decreased the density of the biocomposites. There was an increase in density from CMP2 to CMP5 because CMP occupy a larger volume but are distributed throughout the PLA matrix, occupying all the space. The subsequent decrease in density in CMP8 is due to poor displacement of CMP, leading to empty spaces in which the air is trapped inside the material.
3.2.2. Thermal characterization
Table 4 presents the thermal analysis of the formulations determined with DSC. Tg, Tc, Tm, ∆Hc, and ∆Hm were obtained from the thermograms of the second heating of the biocomposites. Tg of the PLA matrix (CMP0) was 58.45°C; it is similar for CMP2 and CMP5, but decreased slightly, to 57.33°C, for CMP8. The Tg result indicate that there is compatibility at the PLA matrix–CMP interface[16]
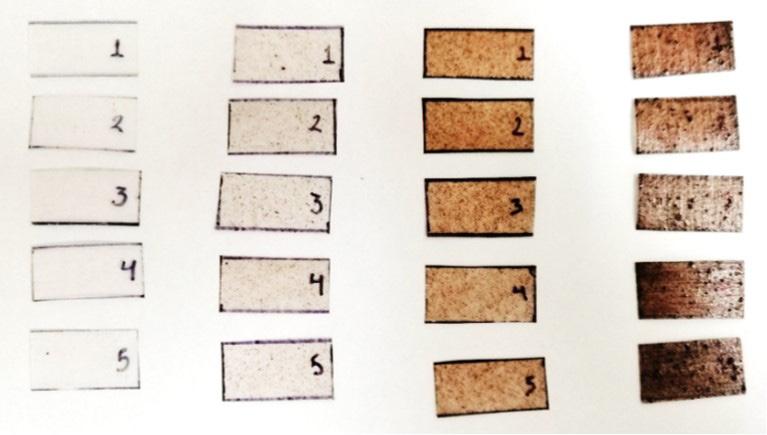
Figure 4. Images of the polylactic acid (PLA)–coconut mesocarp particle (CMP) biocomposites. From left to right: CMP0 (PLA only), CMP2, CMP5, and CMP8.
3. Color parameters (L*, C*, and °Hue*) and the density of polylactic acid (PLA) and coconut mesocarp particle (CMP) biocomposites.
The data are presented as the mean ± standard deviation. Different letters in the same column indicate a significant difference (p < 0.05).
Table 4. Thermal parameters of polylactic acid (PLA)–coconut mesocarp particles (CMP) biocomposites.
Table
Valente Morales, Y., Montoya-Ballesteros, L. C., Robles-Ozuna, L. E., Martínez Núñez, Y. Y., Fortiz Hernández, J., Encinas-Encinas, J. C., & Madera-Santana, T. J.
A decrease in Tg in biocomposites has been reported in PLA systems and other agro-industrial wastes and indicates possible interactions between the components[17]
Tc in the PLA matrix (CMP0) was 123°C and decreased gradually as the amount of CMP in the PLA–CMP biocomposite increased. This indicates that there is a decrease in the temperature at which cold crystallization of PLA occurs because the particles act as nucleating agents that induce the formation of crystalline phases around them. Tm behave similarly to Tg because the fraction of PLA that melts has a lower fraction of crystalline phase in the biocomposite. ∆Hc and ∆Hm show an increase and decrease, respectively, as the amount of CMP in the PLA–CMP biocomposites increased. This apparent anomalous behavior is due to the distribution of crystalline phases in the biocomposite; CMP restrict the mobility of the chains. The biocomposites with a lower CMP content have greater crystallinity because there are more PLA chain–CMP interactions. In CMP8, CMP tend to agglomerate, generating crystalline phases in the matrix, sot there is an increase in ∆Hc and ∆Hm. Hassain et al.[18] reported similar behavior.
3.2.3. Structural characterization
The FTIR spectra of the biocomposites are shown in Figure 5. The biocomposites spectra show the same band pattern because the particles are encapsulated within the PLA matrix. Overall, the addition of CMP does not have a significant effect on CMP (PLA only) spectrum. A band at 2916 cm-1 is attributed to asymmetric methylene stretching vibrations. The band at 2850 cm-1 is attributed to symmetric methylene stretching vibrations. These bands are present in the biocomposites, although they are less intense.
The sharp and prominent band at 1753 cm-1 corresponds to the stretching of the carbonyl groups (C=O) of the PLA ester group. The bands at 1450 and 1356 cm-1 correspond to the asymmetric C-H deformation of the methyl group (CH3). The stretching modes of the C-O signal of the PLA ester group appear at 1225 cm-1, and the asymmetric mode of the C-O-C signal appears at 1090 cm-1. Other notable bands are at 956 and 921 cm-1, due to the secondary signals of the CH3 group and corresponding to the vibrations in the main chain of the CH3 group. There are bands at 871 and 756 cm-1 that can be attributed to the amorphous and crystalline phases of PLA, respectively[18]
3.2.4. Mechanical properties
Figure 6 shows the tensile strength, elongation at break, and tensile modulus obtained from the mechanical tests of the biocomposites. The tensile strength of the biocomposites decreased significantly (p < 0.05) in CMP2, CMP5, and CMP8 compared with CMP0. There was no significant difference (p > 0.05) between CMP2 and CMP5, and CMP8 presented the lowest tensile strength. This is explained by the fact that while CMP are dispersed throughout the matrix at lower concentrations, they also show the development of agglomerations in the biocomposites and the creation of areas of stress concentration as the CMP content increases. Furthermore, the inadequate stress transfer caused by the weak interfacial adhesion between the PLA matrix and the dispersed phase of CMP inhibits CMP from acting as a reinforcing agent. Islam et al.[19] observed a decrease in
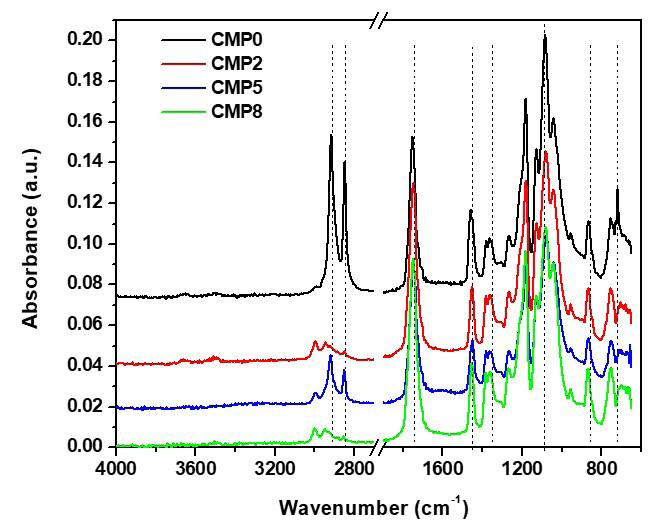
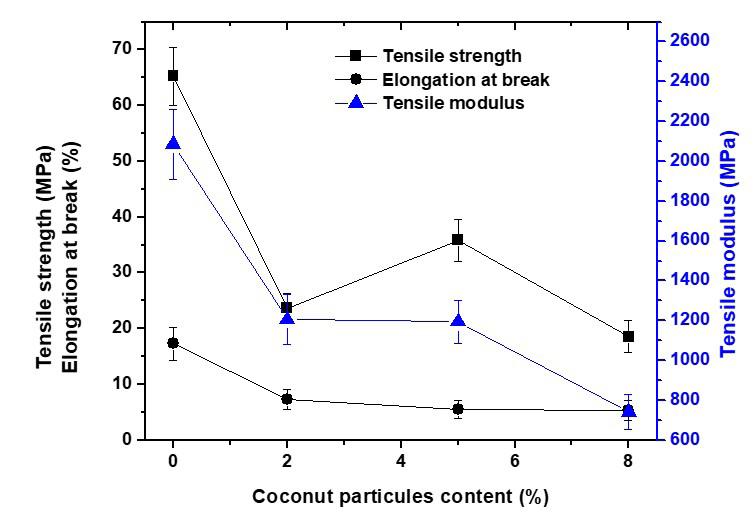
tensile strength in polypropylene composites and coconut particles without surface modification; they attributed it to the weak particle–matrix interactions.
The elongation at break showed a 55% reduction in CMP2, but it was not reduced in CMP5 and CMP8. This could be attributed to the irregular shape of the particles and the discontinuity in the matrix caused by CMP, which weakens the biocomposite and makes it brittle. The elastic modulus (Figure 6) decreased significantly (p < 0.05) when CMP was incorporated into the PLA matrix. There was not a significant difference between CMP2 and CMP5 (p < 0.05) in this parameter. This can be attributed to the lack of adequate adhesion between CMP and the PLA matrix, resulting in a weak particle–matrix interactions[20]. In addition, an increase in the CMP content weakens the fiber–matrix interactions as well as cohesion, leading to a decreasing trend in tensile strength as well as a decrease in the amount of polymer matrix for material elongation[21]. The stiffness of a material is critical to determine its application, so the elastic modulus is the primary parameter analyzed in the selection of a material. The dispersion and adhesion of CMP in the PLA matrix are critical factors that determine the mechanical properties of biocomposites.
Figure 5. Fourier-transform infrared spectra of the polylactic acid (PLA)–coconut mesocarp particle (CMP) biocomposites.
Figure 6. Mechanical parameters of the polylactic acid (PLA)–coconut mesocarp particle (CMP) biocomposites.
Processing and characterization of biocomposites based on polylactic acid and coconut by-products
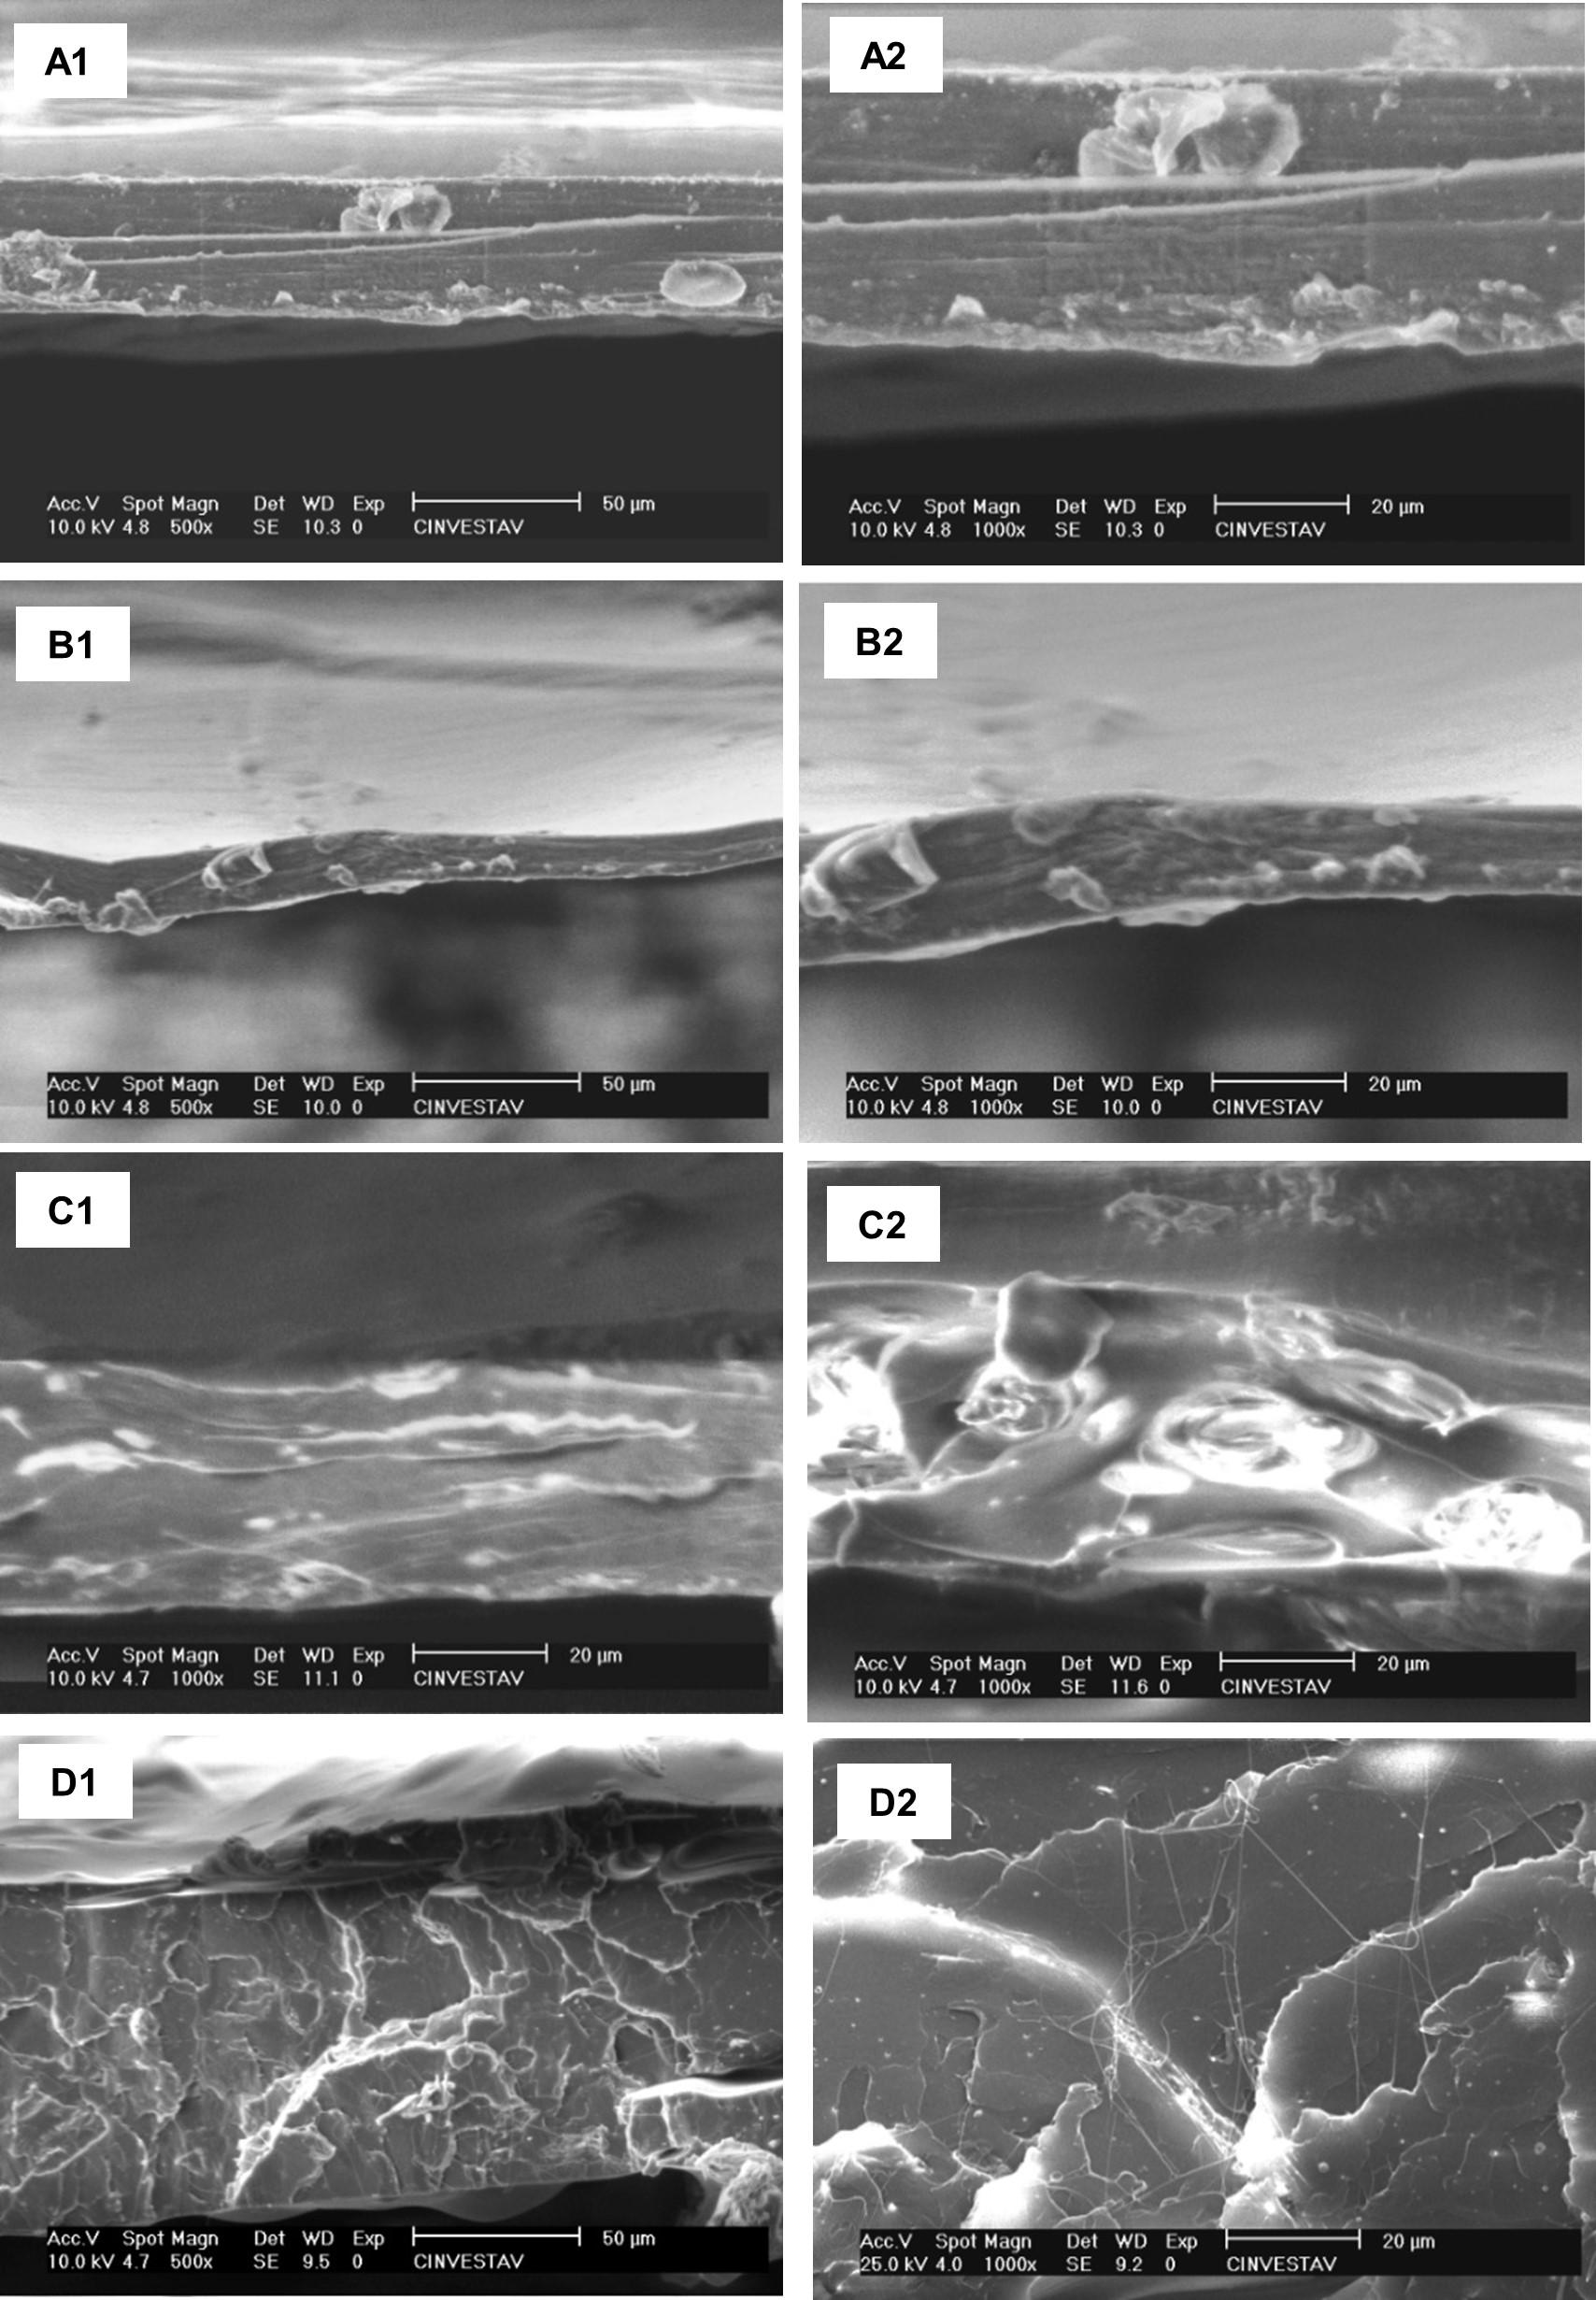
3.2.5. Morphological characterization of the biocomposites
Scanning electron microscopy analysis of the fracture surfaces was performed on the biocomposites subjected to tension. Figure 7(A1) and 7(A2) show the surface roughness of CM0 (PLA only), which is typical of a plastic fracture of a thermoplastic polymer under a low stretching rate. This characteristic is homogeneous along the fracture surface of the sample. Madera-Santana et al.[17] reported a similar result with PLA—algal residue biocomposites. Figure 7(B1) and 7(B2) correspond to CMP2; in the fracture surface area, there is a rough surface accompanied by very few CMP. Figure 7(C1) and 7(C2), correspond to CMP5.
CMP are distributed in the matrix; in addition, there are some spaces between CMP and the PLA matrix, which indicate deficient particle—matrix interfacial adhesion. Figure 7(D1) and 7(D2) show CMP8 micrographs. The matrix shifts from plastic to a brittle fracture; in addition, there are some pores on the surface and filaments of the PLA matrix. These empty spaces (pores) are generated by the detachment of CMP from the PLA matrix. These weak zones are closely correlated with the strength of the matrix, which gradually decrease the strength of the biocomposite[21]. Importantly, the detachment of matrix particles in biocomposites indicates brittle fracture of the
Figure 7. Scanning electron micrograph of polylactic acid (PLA)—coconut mesocarp particle (CMP) biocomposites: CMP0 (A), CMP2 (B), CMP5 (C), and PMC8 (D) at 500× (1) y 1000× (2) magnification.
Valente Morales, Y., Montoya-Ballesteros, L. C., Robles-Ozuna, L. E., Martínez Núñez, Y. Y., Fortiz Hernández, J., Encinas-Encinas, J. C., & Madera-Santana, T. J.
material. However, the roughness of CMP may favor their mechanical adhesion to the matrix.
4. Conclusions
Proximate analysis of CMP revealed that they have limited nutritional value, so their application for the manufacture of biocomposites is an alternative. Hence, PLA—CMP biocomposites were produced via extrusion.
The brownish color in the biocomposites was caused by CMP inclusion. The biocomposites showed a gradual decrease in tensile strength as the CMP content increased. The elongation at break of the biocomposites decreased significantly compared with the PLA matrix, although they did not differ significantly from each other. CMP5 presented the highest elastic modulus among the biocomposites. The crystallinity of the biocomposites decreased as the amount of CMP increased, which indicates that the particles act as nucleating agents, restricting the mobility of the PLA chains. The FTIR spectra of the biocomposites present similar bands to the PLA matrix spectrum because CMP are embedded in the polymer. Some PLA functional group signals exhibit slight shifts in location and intensity, which may be explained by interactions between the PLA matrix and CMP. According to the results obtained in this work, CMP and PLA can form a biocomposite with suitable physicochemical properties for use as rigid packaging for food or other biodegradable products.
5. Author’s Contribution
• Conceptualization – Luz del Carmen MontoyaBallesteros; Tomás Jesús Madera-Santana.
• Data curation – Yulinali Valente-Morales; Yesica Yudith Martínez Núñez; Judith Fortiz Hernández; Luis Enrique Robles-Ozuna.
• Formal analysis – Luz del Carmen Montoya-Ballesteros; Tomás Jesús Madera-Santana.
• Funding acquisition – Luz del Carmen MontoyaBallesteros.
• Investigation – Yulinali Valente-Morales; Yesica Yudith Martínez Núñez; Judith Fortiz Hernández; Luis Enrique Robles-Ozuna.
• Methodology – NA.
• Project administration – Tomás Jesús Madera-Santana.
• Resources – Luz del Carmen Montoya-Ballesteros; Tomás Jesús Madera-Santana; José Carmelo Encinas-Encinas.
• Software – NA.
• Supervision – Luz del Carmen Montoya-Ballesteros; Tomás Jesús Madera-Santana.
• Validation – NA.
• Visualization – Luz del Carmen Montoya-Ballesteros; Tomás Jesús Madera-Santana.
• Writing – original draft – Yulinali Valente Morales; Tomás Jesús Madera-Santana
• Writing – review & editing – Luz del Carmen Montoya-Ballesteros; José Carmelo Encinas-Encinas.
6. Acknowledgements
Part of this research was conducted at the facilities of Laboratorio Nacional CONACYT LANNBIO-Cinvestav Unidad Mérida (PROY. No. 321119).
7. References
1 Koul, B., Yakoob, M., & Shah, M. P. (2022). Agricultural waste management strategies for environmental sustainability. Environmental Research, 206, 112285 http://doi.org/10.1016/j. envres.2021.112285 PMid:34710442.
2 Esparza , I. , Jiménez-Moreno , N. , Bimbela , F. , AncínAzpilicueta, C., & Gandía, L. M. (2020). Fruit and vegetable waste management: conventional and emerging approaches. Journal of Environmental Management, 265, 110510 http:// doi.org/10.1016/j.jenvman.2020.110510 PMid:32275240.
3 Torres-Giner, S., Hilliou, L., Meléndez-Rodríguez, B., Figueroa-López, K. J., Madalena, D., Cabedo, L., Covas, J. A., Vicente, A. A., & Lagaron, J. M. (2018). Melt processability, characterization, and antibacterial activity of compression-molded green composite sheets made of poly(3-hydroxybutyrate-co-3hydroxyvalerate) reinforced with coconut fibers impregnated with oregano essential oil. Food Packaging and Shelf Life, 17, 39-49 http://doi.org/10.1016/j.fpsl.2018.05.002
4 Burrola-Núñez, H., Herrera-Franco, P. J., Rodríguez-Félix, D. E., Soto-Valdez, H., & Madera-Santana, T. J. (2019). Surface modification and performance of jute fibers as reinforcement on polymer matrix: an overview. Journal of Natural Fibers, 16(7), 944-960 http://doi.org/10.1080/15440478.2018.144 1093
5. Rosa, M. F., Chiou, B.-S., Medeiros, E. S., Wood, D. F., Williams, T. G., Mattoso, L. H. C., Orts, W. J., & Iman, S. H. (2009). Effect of fiber treatments on tensile and thermal properties of starch/ethylene vinyl alcohol copolymers/coir biocomposites. Bioresource Technology, 100(21), 5196-5202 http://doi.org/10.1016/j.biortech.2009.03.085. PMid:19560341.
6 Singleton, V. L., Orthofer, R., & Lamuela-Raventós, R. M. (1999). Analysis of total phenols and other oxidation substrates and antioxidants by means of Folin-Ciocalteu Reagent. Methods in Enzymology, 299, 152-178 http://doi.org/10.1016/S00766879(99)99017-1
7 Ramamoorthy, S. K., Skrifvars, M., & Persson, A. (2015). A review of natural fibers used in biocomposites: Plant, animal and regenerated cellulose fibers. Polymer Reviews (Philadelphia, Pa.), 55(1), 107-162. http://doi.org/10.1080/15583724.2014. 971124
8 Li, X., Tabil, L. G., & Panigrahi, S. (2007). Chemical treatments of natural fiber for use in natural fiber-reinforced composites: a review. Journal of Polymers and the Environment, 15(1), 25-33 http://doi.org/10.1007/s10924-006-0042-3
9 Vidal, N. E. H., Bautista, V. L., Morales, V. M., Ordoñez, W. M., & Osorio, E. S. C. (2018). Chemical characterization of coco fiber (Cocos nucifera L.) from Mexico using Infrared Spectroscopy (FTIR). Revista Ingeniería y Región, 20, 67-71 Retrieved in 2024, August 20, from https://dialnet.unirioja.es/ servlet/articulo?codigo=7059315
10 Célino, A., Goncalves, O., Jacquemin, F., & Fréour, S. (2014). Qualitative and quantitative assessment of waters sorption in natural fibres using ATR FTIR spectroscopy. Carbohydrate Polymers, 101, 163-170 http://doi.org/10.1016/j. carbpol.2013.09.023 PMid:24299761.
11. Abraham, E., Deepa, B., Pothen, L. A., Cintil, J., Thomas, S., John, M. J., Anandjiwala, R., & Narine, S. S. (2013). Environmental friendly method for the extraction of coir fibre and isolation of nanofibre. Carbohydrate Polymers, 92(2),
Processing and characterization of biocomposites based on polylactic acid and coconut by-products
1477-1483 http://doi.org/10.1016/j.carbpol.2012.10.056 PMid:23399179.
12 Marina, A. M., Che Man, Y. B., Nazimah, S. A., & Amin, I. (2009). Antioxidant capacity and phenolic acids of virgin coconut oil. International Journal of Food Sciences and Nutrition, 60(2, Suppl 2), 114-123 http://doi.org/10.1080/09637480802549127 PMid:19115123.
13. Olorunnisola, A. O. (2009). Effects of husk particle and calcium chloride on strength and sorption properties of coconut huskcement composites. Industrial Crops and Products, 29(2-3), 495-501. http://doi.org/10.1016/j.indcrop.2008.09.009.
14 Abad, M., Noguera, P., Puchades, R., Maquieira, A., & Noguera, V. (2002). Physico-chemical and chemical properties of some coconut coir dusts for use as a peat substitute for containerised ornamental plants. Bioresource Technology, 82(3), 241-245 http://doi.org/10.1016/S0960-8524(01)00189-4 PMid:11991072.
15. Ugwu, S. N., & Enweremadu, C. C. (2020). Ranking of energy potentials of agro-industrial wastes: bioconversion and thermoconversion approach. Energy Reports, 6, 2794-2802 http:// doi.org/10.1016/j.egyr.2020.10.008.
16 Tognana, S., Salgueiro, W., & Somoza, A. (2007). Influencia del proceso de curado y del contenido de carga sobre la Tg y el volumen libre en compuestos particulados de matriz epoxi. Revista Matéria (Rio de Janeiro), 12(3), 510-517 http://doi. org/10.1590/S1517-70762007000300012
17 Madera-Santana, T. J., Freile-Pelegrín, Y., Encinas, J. C., RíosSoberanis, C. R., & Quintana-Owen, P. (2015). Biocomposites
based on poly(lactic acid) and seaweed wastes from agar extraction: evaluation of physicochemical properties. Journal of Applied Polymer Science, 132(31), 42320 http://doi. org/10.1002/app.42320
18. Hassain, K. M. Z., Parsons, A. J., Rudd, C. D., Ahmed, I., & Thielemans, W. (2014). Mechanical, crystallisation and moisture absorption properties of melt drawn poly(lactic) acid fibres. European Polymer Journal, 53, 270-281 http:// doi.org/10.1016/j.eurpolymj.2014.02.001
19. Islam, N., Rahman, R., Haque, M., & Huque, M. (2010). Physico-mechanical properties of chemically treated coir reinforced polypropylene composites. Composites Part A: Applied Science and Manufacturing, 41(2), 192-198. http:// doi.org/10.1016/j.compositesa.2009.10.006
20 Marinho, J. F., Braga, N. F., Krohn, A., Myata, F. S., Silveira, L. H., Cabral, A., No., & Fechine, G. J. M. (2015). Melt processing of polymers biocomposites. Polímeros: Ciência e Tecnologia, 25(2), 133-136 http://doi.org/10.1590/0104-1428.1847
21 Nam, T. H., Ogihara, S., Tung, N. H., & Kobayashi, S. (2011). Effect of alkali treatment on interfacial and mechanical properties of coir fiber reinforced poly(butylene succinate) biodegradable composites. Composites Part B: Engineering, 42(6), 1648-1656 http://doi.org/10.1016/j.compositesb.2011.04.001
Received: Mar. 20, 2024
Revised: May 02, 2024
Accepted: May 04, 2024
Alternative production of bacterial cellulose by Komagataeibacterhansenii and microbial consortium
Izabel Cristina Nóvak1 , Bruna Segat2 , Michele Cristina Formolo Garcia2,3 , Ana Paula Testa Pezzin1 and Andréa Lima dos Santos Schneider2,3*
1Laboratório de Materiais, Programa de Pós-graduação em Engenharia de Processos, Universidade da Região de Joinville – Univille, Joinville, SC, Brasil
2Laboratório de Biotecnologia I, Departamento de Engenharia Química, Universidade da Região de Joinville – Univille, Joinville, SC, Brasil
3Laboratório de Biotecnologia II, Programa de Pós-graduação em Saúde e Meio Ambiente, Universidade da Região de Joinville – Univille, Joinville, SC, Brasil
*andrea.lima@univille.br
Obstract
Bacterial cellulose (BC) is a biopolymer produced by several microorganisms and has attracted attention due to its unique characteristics, replacing cellulose extracted from nature. This work aimed to compare different BC production methods and the possible interference of these methods on the characteristics of the BC produced, seeking low-cost and large-scale production. BC membranes were produced by K. hansenii and a microbial consortium using different culture media. Rehydration percentage, water-holding capacity, TGA, and FTIR characterized the membranes. The production from the microbial consortium was highlighted for having a higher dry mass yield (0.289 ± 0.199 g), more than triple the amount produced by pure strain. Both samples showed similar chemical structures, as pointed out by FTIR. However, the BC produced by the microbial consortium showed superior thermal stability (357 °C). Moreover, using the microbial consortium, it was possible to obtain BC with a reduction in production cost of 92%.
Keywords: bacterial cellulose, kombucha microbial consortium, Komagataeibacter hansenii.
How to cite: Nóvak, I. C., Segat, B., Garcia, M. C. F., Pezzin, A. P. T., & Schneider, A. L. S. (2024). Alternative production of bacterial cellulose by Komagataeibacter hansenii and microbial consortium. Polímeros: Ciência e Tecnologia, 34(2), e20240021. https://doi.org/10.1590/0104-1428.20230080
1. Introduction
Cellulose is one of the most abundant biopolymers on the planet, having plants and wood as its primary sources. Cellulose is present in 33% of all vegetables, reaching 40-50% in wood and up to 90% in cotton[1]. This natural polymer has great economic importance and great technological interest, being considered one of the largest productions in the world, with approximately 19.7 million tons manufactured in Brazil in 2019, according to the 2020 Annual Report of the IBÁ (Brazilian Tree Industry)[2]
However, the global demand for vegetable cellulose (VC) can cause several problems, including deforestation. According to Bologna and Aquino[3], trees store carbon, regulate the water cycle, produce oxygen, contribute to soil conservation, and provide a natural habitat for several species, keeping the atmosphere clean. Another commonly encountered problem is the additional cost generated to remove components such as lignin, hemicelluloses, pectin and other polymers present from the part of interest to the industry. Seeking more sustainable alternatives appears to the production of cellulose through bacteria.
According to Picheth et al.[4], bacterial cellulose (BC) is a biopolymer formed by cellulose microfibrils, intertwined
and variable length, forming a translucent and gelatinous membrane, produced extracellularly by genera such as Gluconobacter, Acetobacter, Agrobacterium, Achromobacter, Aerobacter, Sarcina, Azobacter, Rhizobium, Pseudomonas, Salmonella and Alcaligenes. Among the BC-producing bacteria, the genus Komagataeibacter is commonly used for its high yield[5]. In addition, it can convert glucose, glycerol, sugar, or any other organic substances into pure cellulose[6]
Recent studies have sought to understand the biomolecular mechanism of BC production. In this context, Manan et al.[7], funded the involvement of specific operons (bcsABCD), which code for the cellulose synthase (CS) complex. They describe that this operon regulates intracellular biosynthesis, extracellular transport across the cellular membranes, and in vitro assembly of cellulose fibrils into highly ordered structures. Other studies are also moving towards cell-free cellulose production, synthesized in vitro, where you can conduct enzymatic reactions involved in the natural biochemical pathway of cellulose production by microbial cells[8] .
The unique properties of BC qualify it for applications in the most diverse areas, such as different food
Nóvak, I. C., Segat, B., Garcia, M. C. F., Pezzin, A. P. T., & Schneider, A. L. S.
packaging[9], paper[10], textiles[11] and bioconcrete[12], as well as bioremediation[13], cosmetics[14], electronics[15] and sensors[16] applications. According to Barud et al.[17] , BC has excellent potential as a biopolymer, especially in biomedical applications. It will not interfere with the patient’s body in the medium and long term. BC’s known characteristics are biocompatibility, mechanical resilience, ease of incorporating drugs or nanoparticles, and moistening the injured area while absorbing exudates[18] .
BC is chemically equivalent to VC, but it has a high degree of crystallinity and high purity (free of lignin, hemicellulose, pectin and other biogenic components) as well as a unique structure of cellulose nanofiber-weaved three-dimensional (3D)[19]. However, the high cost of the culture medium and low yield are the main challenges in producing BC for industrial-scale applications[20]. Rejected agricultural and industrial waste can be used to synthesize BC through its fermentation. When low-quality fruits are not shipped, many are discarded, and they are rich in glucose and fructose. In this case, they can be used as a carbon source for making useful products, such as BC[21]. Low-cost alternative nutrients are already being researched, such as grape pomace[22], corn steep liquor[23] , coconut juice[24] and pineapple[25] from agribusiness, yeast residues from the brewing industry[26], lychee extract[27] , among others.
In this context, we also find an alternative fermentation process using a medium composed of an infusion of black or green tea leaves that is fermented with a symbiotic association of bacteria and yeast, which are capable of forming a cellulosic film on the surface of the liquid sweetened product called kombucha[28]
Therefore, in this work, BC production was evaluated using alternative media to analyze the best cultivation condition for membrane formation on a larger scale, using the isolated strain of Komagataeibacter hansenii ATCC 23769 and the symbiotic association that gives rise to kombucha.
2. Materials and Methods
2.1 Membrane production
2.1.1 Membrane from Komagataeibacter hansenii
The microorganism used was the bacterium Komagataeibacter hansenii ATCC 23769, preserved in a liquid medium in a refrigerator. The culture medium used was: Carbon source (20g/L), peptone (5g/L), yeast extract (5 g/L), bibasic sodium phosphate (2.7 g/L) and citric acid (1.15 g/L). Bacterial activation was carried out in Erlenmeyer flasks containing culture medium (pH 7.0) and incubated at 30 °C under static conditions for two days. After this period, the inoculum was transferred to other flasks with culture medium (with the same concentrations already mentioned) at a rate of 20% with initial optical density (O.D.) varying between 0.15 and 0.19. The carbon sources used were mannitol and glucose. Membranes produced by K. hansenii using mannitol as a carbon source was named KHMN, while those produced with glucose were named KHGL.
The cultivation of K. hansenii was also tested in a culture medium containing black tea (6 g/L) and
commercial sugar (50 g/L), boiled for 15 min, filtered and autoclaved before inoculation. The experiments were carried out in different flasks previously sterilized with alcohol, boiling water and exposed to ultraviolet light. Then, the culture media were incubated in an oven at 30 °C and static condition for 12 days to form hydrated BC blankets at the liquid/air interface. These membranes were called KHCP (Figure S1, Supplementary Material).
2.1.2 Obtaining the membrane from the microbial consortium
The prepared cultivation media contained 6 g/L of black tea as nitrogen and 50 g/L of commercial sugar as a carbon source. The inoculum was produced with previously formed and stored membranes, known as SCOBY, for seven days. Together with 100 mL of the remaining broth containing the active symbiotic association, the inoculum membrane was used, inserting them in a new black tea culture medium, with the same composition mentioned, and remaining for 12 days in the flasks for the synthesis of BC. The cultivation was conducted at room temperature and static conditions. These membranes formed at the liquid/air interface were called CMCP (Figure S2, Supplementary Material).
2.2 Purification of membranes
The purification of the membranes was carried out as described by Silveira et al.[29]. Afterward, the membranes were washed with distilled water until reaching pH 7.0, stored in distilled water, autoclaved to avoid contamination, and dried in an oven at 30 °C.
2.3 Membrane characterization
2.3.1 Water retention capacity (WRC)
A never-dried membrane was used, immersed in deionized water. The sample was removed and dried on absorbent paper to remove excess surface water with constant manual pressure for 10 s and then weighed (m_wet). Then, it was dried in an oven at 30 °C to remove all the water until constant weight and determine its dry mass (m_dry). Then, equation 1, provided by Zhang et al.[30], was used to calculate the water retention capacity.
2.3.2 Rehydration percentage (RP)
BC membranes were characterized by the rehydration percentage (RP) according to the methodology described in Inoue et al.[31]
2.3.3 Dry mass yield
The dry mass yield was determined by weighting the membranes after drying (mdry). Then, the average dry mass values obtained for all samples were normalized about KHGL, the standard cultivation medium. The Equation 2 was used to calculate the relative dry mass yield:
Alternative production of bacterial cellulose by Komagataeibacter hansenii and microbial consortium
Therefore, values greater than 100% mean that they had a dry mass yield higher than the standard (KHGL) and values lower than 100% the dry mass yield was lower than the standard. Quintuplicates were performed.
2.3.4 Thermogravimetric Analysis (TGA)
To verify the influence of culture media on the thermal stability of membranes. The samples were heated at a rate of 10 °C/min from room temperature to 1000 °C, under an inert atmosphere (N2), in TA Instruments model TGA-Q50 equipment.
2.3.5 Fourier-Transform Infrared Spectroscopy (FTIR)
The characterization of the functional groups of the membranes was obtained by spectroscopy in the infrared region in equipment from Perkin Elmer Frontier. Scans were performed per sample, from 450 to 4000 cm-1, with a resolution of 2 cm-1 in the Attenuated Total Reflectance (ATR) mode.
2.3.6 Analysis of Variance and Tukey’s Test
Analyzes of variance (ANOVA) and Tukey’s test were performed using Minitab 18 software to verify statistically significant differences between the different culture media.
3. Results and Discussions
Membranes were synthesized in flasks with 14 cm diameter, acquiring the same dimension. In Figure 1, there are images of the membranes produced, identified by a) KHMN (K. hansenii produced in mannitol), b) KHGL (K. hansenii produced in glucose), c) KHCP (K. hansenii produced in black tea and sucrose), and d) CMCP (microbial consortium produced in black tea).
Membranes produced in the black tea culture medium acquired a darker color than the other samples. According to
Yim et al.[32], black tea contains polyphenol, which generates compounds that darken the membrane after its conversion, such as orange theaflavin. However, all membranes reached white color after purification.
The membranes were analyzed for dry and wet mass in their respective culture media, WRC and RP tests. The data obtained are presented as mean values and their respective standard deviations in Table 1.
The average dry mass values obtained for all samples were normalized about KHGL, the standard cultivation medium. This allowed us to compare the relative variation in the yield of bacterial cellulose produced by each condition. The results are shown in Figure 2
It can be observed that the culture of K. hansenii containing mannitol (KHMN) obtained a dry mass yield of around half that obtained by the standard cultivate (KHGL). It is also observed that the yield presented by the same microorganism with sucrose as a carbon source (KHCP) was slightly higher, around 60% of the yield obtained by KHGL, which had glucose as a carbon source. However, it is essential to highlight that the crop that obtained the best yield was CMCP, presenting a yield of almost 350%, representing an increase in cellulose production of more than 3 times compared to the standard cultive.
According to Tureck et al.[33], glucose is readily transported across the cell membrane and incorporated into the cellulose biosynthetic pathway, causing more excellent film production using this carbon source. However, the culture medium containing commercial sugar (sucrose) does not occur in the same form. Sucrose must be hydrolyzed in the periplasm into glucose and fructose[34]. Therefore, this delay generates lower yield in the same incubation period. The same occurs with mannitol, which is first transformed into fructose to be later metabolized by the organism of the bacteria, producing cellulose[35]. Therefore, the lower yield of the carbon sources mentioned is related to the metabolism
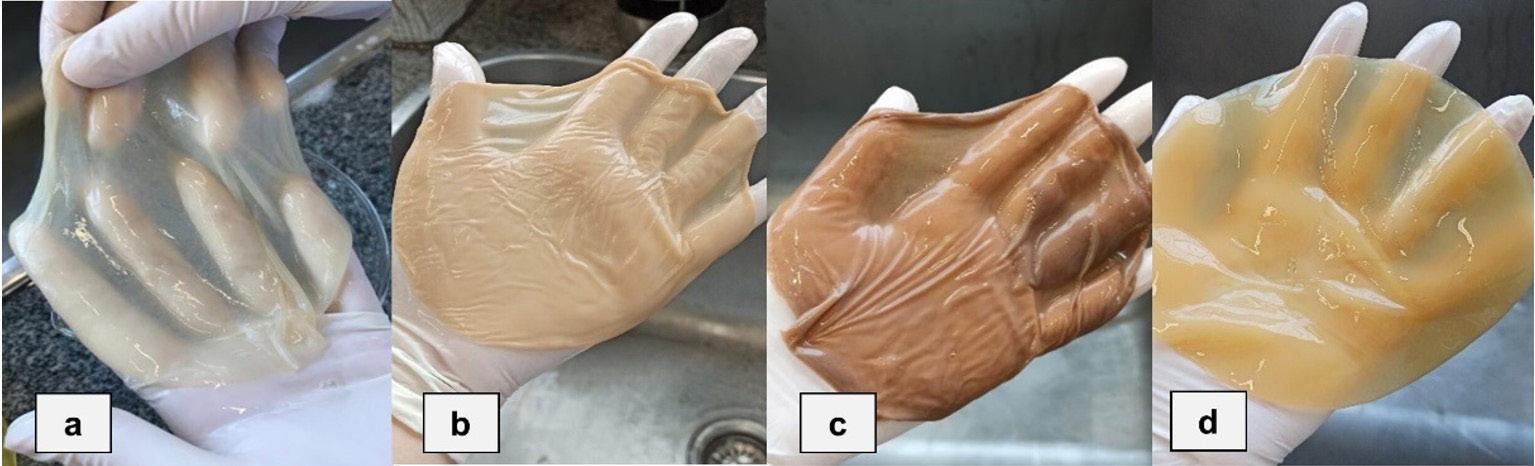
Figure 1. Membranes of BC synthesized before purification step (a) KHMN; (b) KHGL (c) KHCP; (d) CMCP.
Table 1. Dry mass, wet mass, water retention capacity (WRC) and rehydration percentage (RP) for KHMN, KHGL, KHCP and CMCP membranes.
Nóvak, I. C., Segat, B., Garcia, M. C. F., Pezzin, A. P. T., & Schneider, A. L. S.
of their molecules. It is noteworthy that, compared to the mannitol and sucrose, there was a higher yield of membranes produced in a culture medium containing sucrose by the bacterium K. hansenii because it contains a higher carbon source concentration of 50 g/L.
Villarreal‐Soto et al.[36] also explains that in the case of Kombucha, the different yeasts and bacteria species act in parallel, producing two different final products: the fermented tea and the biofilm. While yeasts convert sucrose into glucose and fructose, bacteria use these compounds already converted to produce cellulose. Through analysis of variance and Tukey test, the dry mass yield of the microbial consortium does not significantly differ from the yield obtained with K. hansenii in black tea medium. However, it is significantly different from the other experiments. There was no significant difference between the values of the culture media using mannitol and glucose as a carbon source and the black tea culture medium for K. hansenii
Despite using different culture media and microorganisms, the WRC analysis demonstrates high water retention by all synthesized membranes, above 95%. Galdino et al.[37] , using propolis extract and steep corn liquor, respectively, for synthesizing cellulose membranes as culture medium, obtained the same values for this parameter. Furthermore, according to Ullah et al.[38], highly porous BC favors a high-water holding capacity where the water molecules remain within the porous matrix. Rebelo et al.[39] explain that many hydrogen bonds in BC result in high water retention. The analysis of variance and Tukey test shows no significant difference between the samples produced by the microbial consortium (CMCP) and by K. hansenii in a black tea (KHCP) and culture medium containing mannitol as a carbon source (KHMN). The samples produced in a culture medium containing glucose (KHGL) do not significantly differ from those synthesized in a medium containing mannitol in its formulation (KHMN). However, KHGL is significantly different from the other samples.
It is important to highlight that the membranes formed decreases in thickness after drying in the oven when water is lost from its structure. The KHCP membrane, for example, decreased the thickness from 3.513 ± 0.049 mm to 0.019 ± 0.001 mm after drying (Figure S3, Supplementary Material).
As for the percentage of rehydration (RP) (Table 1), it was identified through analysis of variance and Tukey test that there is no significant difference between culture medium containing glucose (KHGL) and mannitol for
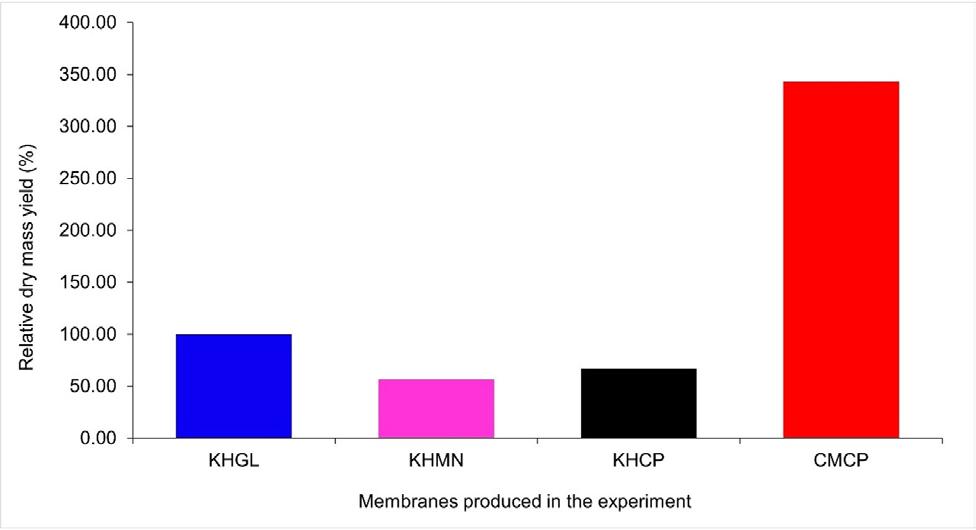
K. hansenii (KHMN), mannitol (KHMN) and black tea for K. hansenii (KHCP), and black tea for K. hansenii (KHCP) and the microbial consortium (CMCP). Therefore, there was a significant difference between the membranes, indicating that those produced by K. hansenii can reabsorb a more significant amount of water than the films produced by SCOBY. The interaction between the cellulose matrix and the water molecules also changes according to the arrangement of the cellulose fibers; the more relaxed the interaction, the more efficient it is. Fibers from samples produced by the microbial consortium may find themselves more tightly interconnected, resulting in less space to reaccommodate water. Illa et al.[40] explain that although the cellulose formed has a high water retention capacity, water needs to be removed for most of its applications, thus using several techniques that affect the properties of the membrane.
Considering that the membranes produced were ovendried, Inoue et al.[31] reports that the cellulose fibers collapse due to the rapid evaporation of water, making the water molecules, when rehydrating them, unable to overcome the intermolecular forces formed and go back to the original structure. Lin et al.[41] justifies the low rehydration of dry membranes due to the high crystallinity of membranes, also affecting their permeability. According to Leonarski et al.[42] , the more porous surface of the formed membrane remains in contact with the liquid, while the more crystalline structure is in contact with the air. Therefore, when analyzing the membranes formed by the microbial consortium, there is an abundant growth of the film above the surface of the liquid, which makes the more crystalline part (in contact with air) more significant than the porous part of the membrane, also justifying the low rehydration of this membrane.
In order to assess possible changes in the chemical structures of the cellulose membranes synthesized as a function of the change in the carbon source, the FTIR analysis was performed. Figure 3 shows the results for the samples. In all samples, bands related to BC were identified, such as stretching (ν) of the hydroxyl groups at 3340 cm-1, C-H and CH2 stretching at 2890 cm-1, symmetrical angular bending (δs) of H-O-H at 1626 cm-1, symmetrical angular bending of C-OH and CH at 1428 and 1313 cm-1, stretching of the C-O at 1180 and 983 cm-1, and C-H angular bending (δ) at 896 cm-1[43]. It is
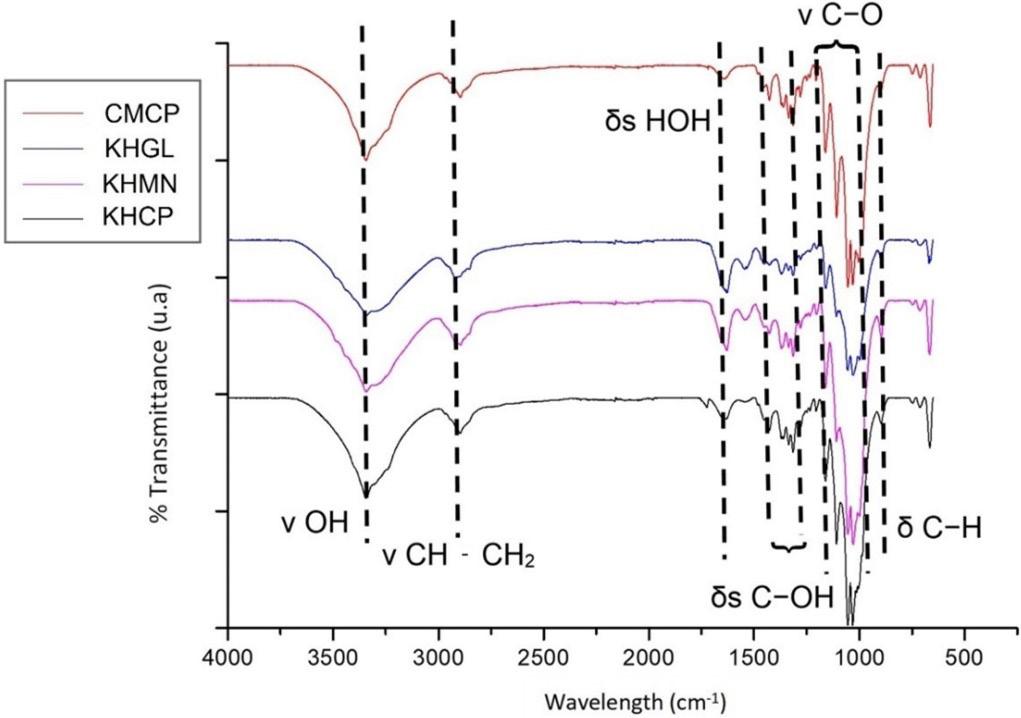
Figure 2. Yield of membranes in dry mass.
Figure 3. FTIR analysis of KHMN, KHGL, KHCP and CMCP samples and characteristic binding of bacterial celulose.
possible to observe that all samples show the same behavior. Therefore, BC was also obtained as a product with similar chemical structures when using the microbial consortium and other culture media.
From the thermogravimetric analysis (TGA) (Figure S4, Supplementary Material), information about the maximum thermal degradation temperature (Tpeak) and mass loss of the membranes were extracted to form Table 2.
The first thermal event, ranging from approximately 30 °C to 250 °C, indicates the loss of mass related to the evaporation of residual water from the drying process. Already in the second stage (325 to 357 °C), the samples suffer a marked mass loss (about 68%), corresponding to cellulose degradation (dehydration and decomposition of glycosidic units). The third and last stage, around 430 °C, is related to the thermoxidative degradation of cellulose.
The CMCP sample obtained a higher temperature during the second thermal event referent cellulose degradation (Tpeak2 285 °C) (Table 2 and Figure S4, Supplementary Material), while the KHGL sample (standard cultivation medium) presented Tpeak2 of 256 °C. This result suggests that the BC obtained from the symbiotic association pointed out to have more thermal stability than that produced from only one bacterial species. One possibility is the high density of fiber and arranged more firmly linked. With most of the membrane composed of a crystalline network, the temperature required for its degradation has increased. The temperatures and loss mass values obtained by CMCP were near values found by Avcioglu et al.[44] using black tea and glucose in membrane production.
The KHMN sample showed the lowest maximum temperatures in all stages. Studies conducted by Mohammadkazemi et al.[45] demonstrated that different carbon sources could result in different morphologies, resulting in properties such as crystallinity and orientation of different fibers. These structural parameters affect the behavior of thermal degradation. For this reason, the samples KHMN, KHCP and KHGL, although the same microorganism synthesized them, showed degradation behavior in the three stages and different waste content due to the different carbon sources used in cultivation.
According to Molina-Ramírez et al.[46], the initial degradation temperature of BC occurs between 220-300 °C, and its maximum degradation temperature is reported between 348-361 °C. Therefore, when comparing this information with Table 2, it was concluded that all sample temperatures are within the cited ranges. The temperatures were compared with those obtained by other authors, represented in Table 3 It is worth highlighting that the temperature variations between them are a function of the microorganism and the culture medium.
In addition to the more extensive cellulose production, the characterization analyses demonstrated that the material produced from the pure strain and microbial consortium is the same. It is essential to highlight that the microbial consortium achieved this result using a lower-cost alternative medium without temperature control and sterilization of the medium and the culture vessel, reducing the membrane’s production cost. In the fermentation process, the cost of the medium is responsible for 50-65% of the total expense[20] . In this way, a price survey was carried out, and other waste used by other authors was considered for comparison with the results obtained in this study (Table 4).
Thus, to prepare 1 liter of culture medium for the formation of the BC membrane, there was a 92.65% cost reduction considering only the medium. The HS standard medium totals USD 1.36/L, while the value per liter of the alternative culture medium was just USD 0.10/L. In a study, Avcioglu et al.[44] found a reduction of almost 30% in the cost of the culture medium using the alternative medium for kombucha synthesis instead of the synthetic medium. However, such a difference in cost reduction compared to the present work is justified by using glucose as a carbon source. At the same time, the author evaluated using mannitol as a carbon source. Considering all of the options of culture media using waste materials to produce bacterial cellulose, the black tea used in this study is still an alternative to reduce the cost of production of BC. One of the advantages of using the microbial consortium, according to Villarreal‐Soto et al.[36], is the possibility of producing cellulose from various carbon sources, including glucose, ethanol, sucrose and glycerol. As a result, the kombucha
thermograms
Table 3. Comparison of temperature ranges found by other authors concerning TGA and DTG.
Reference Microorganism used
Costa et al. [23] Gluconacetobacter hansenii HS modified with corn steep liquor
Molina-Ramírez et al.[46] Komagataeibacter medellinensis Rotten mango juice
Avcioglu et al.[44] Kombucha microbial consortium lack tea and glucose
Gündüz and Aşık[47] Gluconacetobacter hansenii Carrot Juice
Table 2. Maximum thermal degradation temperature (Tpeak) and mass loss data for BC membranes obtained from
Nóvak, I. C., Segat, B., Garcia, M. C. F., Pezzin, A. P. T., & Schneider, A. L. S.
Table 4. Comparison with the literature of Hestrin-Schramm culture medium and black tea in the production of microbial cellulose in terms of cost reduction (%).
Reference Culture media Reagents
This study Black tea Black tea, commercial sugar 0.10
This study Standard HS
Glucose, peptone, yeast extract, sodium phosphate bibasic, citric acid 1.36
Amorim et al.[48] Fruit residue juice Fruit residue juice 0.94
Zhou et al.[49] Supplemented jasmine flower, enzymatic hydrolyzate Jasmine flower enzymatic hydrolyzate, yeast extract, tryptone 3.29
Liu et al.[50] Vinegar residue AC treated vinegar residue, sugar, lignin 5.58
Souza et al.[51] Cashew apple juice
industry has overgrown in recent years, and research related to kombucha is flourishing[52]. In other words, the greater the growth of this segment in the market, the greater the production of BC can also become. However, one of the challenges to be overcome is the standardization of the composition of these microorganisms in the microbial consortium to establish a uniform and controlled production.
4. Conclusions
All experiments performed synthesized BC membranes, both as well K. hansenii as the association of fungi and bacteria (SCOBY) in different culture media, with a higher yield in dry mass for membranes produced by the microbial consortium in the same period of growth than the isolated bacterium. The characterization of the membranes showed that they were of the same composition, showing, however, better thermal stability than membranes formed by K. hansenii. Notably, the film formed by the association of microorganisms, in addition to having been synthesized in the lowest cost medium (black tea and sucrose), did not require temperature control (room temperature) and sterilization of the culture medium. Thus, it is concluded that it is possible to obtain BC membranes from the association of microorganisms (SCOBY), using lower-cost culture media and presenting the same properties as those produced by the pure strain in a synthetic culture medium, allowing its large-scale production.
5. Author’s Contribution
• Conceptualization – Izabel Cristina Nóvak; Andréa Lima dos Santos Schneider.
• Data curation – Izabel Cristina Nóvak.
• Formal analysis – Izabel Cristina Nóvak.
• Funding acquisition - Andréa Lima dos Santos Schneider.
• Investigation – Izabel Cristina Nóvak; Bruna Segat.
• Methodology – Izabel Cristina Nóvak; Andréa Lima dos Santos Schneider.
• Project administration – Andréa Lima dos Santos Schneider.
• Resources – Michele Cristina Formolo Garcia; Ana Paula Testa Pezzin; Andréa Lima dos Santos Schneider.
• Software – NA.
Cashew apple juice, crude soybean molasses 1.34
• Supervision – Andréa Lima dos Santos Schneider.
• Validation – Izabel Cristina Nóvak; Michele Cristina Formolo Garcia; Andréa Lima dos Santos Schneider.
• Visualization – Izabel Cristina Nóvak.
• Writing – original draft – Izabel Cristina Nóvak.
• Writing – review & editing – Bruna Segat; Michele Cristina Formolo Garcia; Ana Paula Testa Pezzin; Andréa Lima dos Santos Schneider.
6. Acknowledgements
This work was supported by Santa Catarina University Scholarship Program – UNIEDU (article 170).
7. References
1 Güzel, M., & Akpınar, Ö. (2020). Preparation and characterization of bacterial cellulose produced from fruit and vegetable peels by Komagataeibacter hansenii GA2016. International Journal of Biological Macromolecules, 162, 1597-1604 http://doi. org/10.1016/j.ijbiomac.2020.08.049 PMid:32777420.
2 Indústria Brasileira de Árvores – IBÁ. (2021). 2020 annual report São Paulo: IBÁ
3 Bologna, M., & Aquino, G. (2020). Deforestation and world population sustainability: a quantitative analysis. Scientific Reports, 10(1), 7631 http://doi.org/10.1038/s41598-02063657-6. PMid:32376879.
4 Picheth, G. F., Pirich, C. L., Sierakowski, M. R., Woehl, M. A., Sakakibara, C. N., Souza, C. F., Martin, A. A., Silva, R., & Freitas, R. A. (2017). Bacterial cellulose in biomedical applications: a review. International Journal of Biological Macromolecules, 104(Pt A), 97-106 http://doi.org/10.1016/j. ijbiomac.2017.05.171 PMid:28587970.
5 Blanco Parte, F. G., Santoso, S. P., Chou, C.-C., Verma, V., Wang, H.-T., Ismadji, S., & Cheng, K.-C. (2020). Current progress on the production, modification, and applications of bacterial cellulose. Critical Reviews in Biotechnology, 40(3), 397-414 http://doi.or g/10.1080/07388551.2020.1713721 PMid:31937141.
6 Lahiri, D., Nag, M., Dutta, B., Dey, A., Sarkar, T., Pati, S., Edinur, H. A., Kari, Z. A., Noor, N. H. M., & Ray, R. R. (2021). Bacterial celulose: production, characterization, and application as antimicrobial agente. International Journal of Molecular Sciences, 22(23), 12984. http://doi.org/10.3390/ ijms222312984 PMid:34884787.
7 Manan, S., Ullah, M. W., Ul-Islam, M., Shi, Z., Gauthier, M., & Yang, G. (2022). Bacterial cellulose: molecular regulation of biosynthesis, supramolecular assembly, and tailored structural and functional properties. Progress in Materials Science, 129, 100972 http://doi.org/10.1016/j.pmatsci.2022.100972
8 Ullah, M. W., Ul-Islam, M., Khan, S., Kim, Y., & Park, J. K. (2015). Innovative production of bio-cellulose using a cell-free system derived from a single cell line. Carbohydrate Polymers, 132, 286-294 http://doi.org/10.1016/j.carbpol.2015.06.037 PMid:26256351.
9. Atta, O. M., Manan, S., Shahzad, A., Ul-Islam, M., Ullah, M. W., & Yang, G. (2021). Biobased materials for active food packaging: a review. Food Hydrocolloids, 125, 107419 http:// doi.org/10.1016/j.foodhyd.2021.107419
10. Sriplai, N., Sirima, P., Palaporn, D., Mongkolthanaruk, W., Eichhorn, S. J., & Pinitsoontorn, S. (2018). White magnetic paper based on a bacterial cellulose nanocomposite. Journal of Materials Chemistry. C, Materials for Optical and Electronic Devices, 6(42), 11427-11435 http://doi.org/10.1039/C8TC04103B
11 Fernandes, M., Souto, A. P., Dourado, F., & Gama, M. (2021). Application of bacterial cellulose in the textile and shoe industry: development of biocomposites. Polysaccharides, 2(3), 566-581 http://doi.org/10.3390/polysaccharides2030034
12 Akhlaghi, M. A., Bagherpour, R., & Kalhori, H. (2020). Application of bacterial nanocellulose fibers as reinforcement in cement composites. Construction & Building Materials, 241, 118061 http://doi.org/10.1016/j.conbuildmat.2020.118061
13 Huang, W.-M., Chen, J.-H., Nagarajan, D., Lee, C.-K., Varjani, S., Lee, D.-J., & Chang, J.-S. (2022). Immobilization of Chlorella sorokiniana AK-1 in bacterial cellulose by coculture and its application in wastewater treatment. Journal of the Taiwan Institute of Chemical Engineers, 137, 104286 http://doi.org/10.1016/j.jtice.2022.104286.
14 Mbituyimana, B., Mao, L., Hu, S., Ullah, M. W., Chen, K., Fu, L., Zhao, W., Shi, Z., & Yang, G. (2021). Bacterial cellulose/ glycolic acid/glycerol composite membrane as a system to deliver glycolic acid for anti-aging treatment. Journal of Bioresources and Bioproducts, 6(2), 129-141 http://doi. org/10.1016/j.jobab.2021.02.003
15. Liang, H.-W., Guan, Q.-F., Zhu, Z., Song, L.-T., Yao, H.-B., Lei, X., & Yu, S.-H. (2012). Highly conductive and stretchable conductors fabricated from bacterial cellulose. NPG Asia Materials, 4(6), e19 http://doi.org/10.1038/am.2012.34
16 Farooq, U., Ullah, M. W., Yang, Q., Aziz, A., Xu, J., Zhou, L., & Wang, S. (2020). High-density phage particles immobilization in surface-modified bacterial cellulose for ultra-sensitive and selective electrochemical detection of Staphylococcus aureus. Biosensors & Bioelectronics, 157, 112163 http://doi. org/10.1016/j.bios.2020.112163 PMid:32250935.
17 Barud, H. G. O., Silva, R. R., Barud, H. S., Tercjak, A., Gutierrez, J., Lustri, W. R., Oliveira, O. B., Jr., & Ribeiro, S. J. L. (2016). A multipurpose natural and renewable polymer in medical applications: bacterial cellulose. Carbohydrate Polymers, 153, 406-420 http://doi.org/10.1016/j.carbpol.2016.07.059 PMid:27561512.
18 Carvalho, T., Guedes, G., Sousa, F. L., Freire, C. S. R., & Santos, H. A. (2019). Latest advances on bacterial cellulose‐based materials for wound healing, delivery systems, and Tissue Engineering. Biotechnology Journal, 14(12), e1900059 http:// doi.org/10.1002/biot.201900059 PMid:31468684.
19 Zhong, C. (2020). Industrial-scale production and applications of bacterial cellulose. Frontiers in Bioengineering and Biotechnology, 8 , 605374 http://doi.org/10.3389/fbioe.2020.605374 PMid:33415099.
20 Hussain, Z., Sajjad, W., Khan, T., & Wahid, F. (2019). Production of bacterial cellulose from industrial wastes: a review. Cellulose, 26(5), 2895-2911 http://doi.org/10.1007/ s10570-019-02307-1
21. Islam, M. U., Ullah, M. W., Khan, S., Shah, N., & Park, J. K. (2017). Strategies for cost-effective and enhanced production of bacterial cellulose. International Journal of Biological
Macromolecules, 102, 1166-1173 http://doi.org/10.1016/j. ijbiomac.2017.04.110 PMid:28487196.
22 Vazquez, A., Foresti, M. L., Cerrutti, P., & Galvagno, M. (2012). Bacterial cellulose from simple and low cost production media by Gluconacetobacter xylinus. Journal of Polymers and the Environment, 21(2), 545-554 http://doi.org/10.1007/s10924012-0541-3.
23 Costa, A. F. S., Almeida, F. C. G., Vinhas, G. M., & Sarubbo, L. A. (2017). Production of bacterial cellulose by Gluconacetobacter hansenii using corn steep liquor as nutrient sources. Frontiers in Microbiology, 8, 2027. http://doi.org/10.3389/fmicb.2017.02027. PMid:29089941.
24 Indrianingsih, A. W., Rosyida, V. T., Jatmiko, T. H., Prasetyo, D. J., Poeloengasih, C. D., Apriyana, W., Nisa, K., & Nurhayati, S., Hernawan, Darsih, C., Pratiwi, D., Suwanto, A., & Ratih, D. (2017). Preliminary study on biosynthesis and characterization of bacteria cellulose films from Coconut Water. In Proceedings of the International Conference on Natural Products and Bioresource Science 2017 (ICONPROBIOS 2017), Jakarta, Indonesia http://doi.org/10.1088/1755-1315/101/1/012010
25 Ch’ng, C. H., Rahman, M. R. A., Muhamad, I. I., Pa’e, N., & Zaidel, D. N. A. (2020). Optimization of bacterial cellulose production from pineapple waste using different fermentation method. Chemical Engineering Transactions, 78, 559-564 http://doi.org/10.3303/CET2078094
26 Lin, D., Lopez-Sanchez, P., Li, R., & Li, Z. (2014). Production of bacterial cellulose by Gluconacetobacter hansenii CGMCC 3917 using only waste beer yeast as nutrient source. Bioresource Technology, 151, 113-119 http://doi.org/10.1016/j. biortech.2013.10.052 PMid:24212131.
27. Yang, X.-Y., Huang, C., Guo, H.-J., Xiong, L., Luo, J., Wang, B., Lin, X.-Q., Chen, X.-F., & Chen, X.-D. (2016). Bacterial cellulose production from the Litchi extract bygluconacetobacter xylinus. Preparative Biochemistry & Biotechnology, 46(1), 39 -43 http://doi.org/10.1080/10826068.2014.958163 PMid:25181328.
28 Mafra, A. C., Garcia, M. C. F., Pezzin, A. P. T., Schneider, A. L. S., & Apati, G. P. (2020). Study of influence of type of tea on the production of bacterial cellulose in kombucha tea and evaluation of its antimicrobial action. In Anais do II Encontro de Polímeros Naturais (EPNAT) (80 p.). Retrieved in 2023, August 31, from https://www.journalamb.com/public/site/ II_EPNAT_2020.pdf
29 Silveira, F. C. A., Pinto, F. C. M., Caldas Neto, S. S., Leal, M. C., Cesário, J., & Aguiar, J. L. A. (2016). Treatment of tympanic membrane perforation using bacterial cellulose: a randomized controlled trial. Revista Brasileira de Otorrinolaringologia, 82(2), 203-208. http://doi.org/10.1016/j.bjorl.2015.03.015. PMid:26631330.
30 Zhang , H. Y. , Yan , X. J. , Jiang , Y., & Cong , J. (2011 ). Development and characteristic of bacterial cellulose for antimicrobial wound dressing. Advanced Materials Research, 152-153, 978-987 http://doi.org/10.4028/www.scientific.net/ AMR.152-153.978
31 Inoue, B. S., Streit, S., Schneider, A. L. S., & Meier, M. M. (2020). Bioactive bacterial cellulose membrane with prolonged release of chlorhexidine for dental medical application. International Journal of Biological Macromolecules , 148, 1098-1108 http://doi.org/10.1016/j.ijbiomac.2020.01.036 PMid:31917984.
32 Yim, S. M., Song, J. E., & Kim, H. R. (2017). Production and characterization of bacterial cellulose fabrics by nitrogen sources of tea and carbon sources of sugar. Process Biochemistry, 59, 26-36. http://doi.org/10.1016/j.procbio.2016.07.001.
33 Tureck, B. C., Hackbarth, H. G., Neves, E. Z., Garcia, M. C. F., Apati, G. P., Recouvreux, D. O. S., Pezzin, A. P. T., &
Nóvak, I. C., Segat, B., Garcia, M. C. F., Pezzin, A. P. T., & Schneider, A. L. S.
Schneider, A. L. S. (2021). Obtaining and characterization of bacterial cellulose synthesized by Komagataeibacter hansenii from alternative sources of nitrogen and carbon. Matéria, 26(4), e13092 http://doi.org/10.1590/s1517-707620210004.1392
34. Velasco-Bedrán, H., & López-Isunza, F. (2007). The unified metabolism of Gluconacetobacter entanii in continuous and batch processes. Process Biochemistry, 42(8), 1180-1190 http://doi.org/10.1016/j.procbio.2007.05.017
35 Mikkelsen, D., Flanagan, B. M., Dykes, G. A., & Gidley, M. J. (2009). Influence of different carbon sources on bacterial cellulose production by Gluconacetobacter xylinus strain ATCC 53524. Journal of Applied Microbiology, 107(2), 576-583 http:// doi.org/10.1111/j.1365-2672.2009.04226.x. PMid:19302295.
36 Villarreal‐Soto, S. A., Beaufort, S., Bouajila, J., Souchard, J.-P., & Taillandier, P. (2018). Understanding kombucha tea fermentation: a review. Journal of Food Science, 83(3), 580588 http://doi.org/10.1111/1750-3841.14068 PMid:29508944.
37. Galdino, C. J. S., Jr., Maia, A. D., Meira, H. M., Souza, T. C., Amorim, J. D. P., Almeida, F. C. G., Costa, A. F. S., & Sarubbo, L. A. (2020). Use of a bacterial cellulose filter for the removal of oil from wastewater. Process Biochemistry, 91, 288-296 http://doi.org/10.1016/j.procbio.2019.12.020
38 Ullah, M. W., Manan, S., Kiprono, S. J., Ul‐Islam, M., & Yang, G. (2019). Synthesis, structure, and properties of bacterial cellulose. In J. Huang, A. Dufresne & N. Lin (Eds.), Nanocellulose: from fundamentals to advanced materials. Berlin: Wiley. pp. 81-113. http://doi.org/10.1002/9783527807437.ch4
39 Rebelo, A. R., Archer, A. J., Chen, X., Liu, C., Yang, G., & Liu, Y. (2018). Dehydration of bacterial cellulose and the water content effects on its viscoelastic and electrochemical properties. Science and Technology of Advanced Materials, 19(1), 203-211 http://doi.org/10.1080/14686996.2018.1430 981 PMid:29707063.
40. Illa, M. P., Sharma, C. S., & Khandelwal, M. (2019). Tuning the physiochemical properties of bacterial cellulose: effect of drying conditions. Journal of Materials Science, 54(18), 12024-12035. http://doi.org/10.1007/s10853-019-03737-9.
41 Lin, S.-B., Hsu, C.-P., Chen, L.-C., & Chen, H.-H. (2009). Adding enzymatically modified gelatin to enhance the rehydration abilities and mechanical properties of bacterial cellulose. Food Hydrocolloids, 23(8), 2195-2203 http://doi. org/10.1016/j.foodhyd.2009.05.011.
42 Leonarski, E., Cesca, K., Borges, O. M. A., Oliveira, D., & Poletto, P. (2021). Typical kombucha fermentation: kinetic evaluation of beverage and morphological characterization of bacterial cellulose. Journal of Food Processing and Preservation, 45(12), e16100 http://doi.org/10.1111/jfpp.16100
43 Pecoraro, É., Manzani, D., Messaddeq, Y., & Ribeiro, S. J. L. (2007). Bacterial cellulose from Glucanacetobacter xylinus: preparation, properties and applications. In M. N. Belgacem & A. G. Monomers (Eds.), Polymers and composites from
renewable resources (pp. 369-383). Oxford: Elsevier http:// doi.org/10.1016/B978-0-08-045316-3.00017-X
44. Avcioglu, N. H., Birben, M., & Bilkay, I. S. (2021). Optimization and physicochemical characterization of enhanced microbial cellulose production with a new Kombucha consortium. Process Biochemistry, 108, 60-68 http://doi.org/10.1016/j. procbio.2021.06.005
45 Mohammadkazemi, F., Azin, M., & Ashori, A. (2015). Production of bacterial cellulose using different carbon sources and culture media. Carbohydrate Polymers, 117, 518-523 http:// doi.org/10.1016/j.carbpol.2014.10.008 PMid:25498666.
46 Molina-Ramírez, C., Castro, C., Zuluaga, R., & Gañán, P. (2018). Physical characterization of bacterial cellulose produced by Komagataeibacter medellinensis using food supply chain waste and agricultural by-products as alternative low-cost feedstocks. Journal of Polymers and the Environment, 26(2), 830-837 http://doi.org/10.1007/s10924-017-0993-6
47 Gündüz, G., & Aşık, N. (2018). Production and characterization of bacterial cellulose with different nutrient source and surface–Volume ratios. Drvna Industrija, 69(2), 141-148 http://doi. org/10.5552/drind.2018.1744.
48 Amorim, J. D. P., Silva Júnior, C. J. G., Costa, A. F. S., Sarubbo, L. A., & Melo, J. F. H. (2019). Avaliação do potencial da celulose bacteriana para aplicação em cosméticos. Brazilian Journal of Development, 5(10), 18457-18462 http://doi.org/10.34117/ bjdv5n10-099
49 Zhou, J., Gu, F., Yang, H., Cao, G., Xu, W., Sun, S., & Zhang, Y. (2022). Sequential fermentation strategy improves microbial conversion of waste jasmine flower to bacterial cellulose with antibacterial properties. Industrial Crops and Products, 185, 115147 http://doi.org/10.1016/j.indcrop.2022.115147
50. Liu, Z., Wang, Y., Guo, S., Liu, J., & Zhu, P. (2024). Preparation and characterization of bacterial cellulose synthesized by kombucha from vinegar residue. International Journal of Biological Macromolecules, 258(Pt 1), 128939 http://doi. org/10.1016/j.ijbiomac.2023.128939 PMid:38143062.
51 Souza, E. F., Furtado, M. R., Carvalho, C. W. P., FreitasSilva, O., & Gottschalk, L. M. F. (2020). Production and characterization of Gluconacetobacter xylinus bacterial cellulose using cashew apple juice and soybean molasses. International Journal of Biological Macromolecules, 146, 285-289 http:// doi.org/10.1016/j.ijbiomac.2019.12.180 PMid:31883899.
52 Kim, J., & Adhikari, K. (2020). Current trends in kombucha: marketing perspectives and the need for improved sensory research. Beverages , 6 ( 1 ), 15 http://doi.org/10.3390/ beverages6010015
Received: Aug. 31, 2023
Revised: Apr. 05, 2024
Accepted: Apr. 15, 2024
Supplementary Material
Supplementary material accompanies this paper.
Figure S1. Process of synthesis of bacterial cellulose membrane from Komagataeibacter hansenii ATCC 23769.
Figure S2. Process of bacterial cellulose membrane synthesis from a microbial consortium.
Figure S3. KHCP membrane a) before and b) after oven drying.
Figure S4. TGA analysis of samples: a) TG curves; b) DTG curves.
This material is available as part of the online article from https://doi.org/10.1590/0104-1428.20230080
Synthesis and characterization of BC-ZnO and antibacterial activity test
Hermawan Purba1 , Marpongahtun Marpongahtun2* , Tamrin Tamrin2 and Athanasia Amanda Septevani3
1 Postgraduated Program, Department of Chemistry, Faculty of Mathematic and Natural Sciences, Universitas Sumatera Utara, Medan, North Sumatera Utara Province, Indonesia
2 Department of Chemistry, Faculty of Mathematic and Natural Sciences, Universitas Sumatera Utara, Medan, North Sumatera Utara Province, Indonesia
3 Research Center for Environmental and Clean Technology, National Research and Innovation Agency, Komplek BRIN Cisitu, Bandung, West Java Province, Indonesia
*marpongahtun@usu.ac.id
Obstract
This study presents the green synthesis of bacterial cellulose-zinc oxide (BC-ZnO) composites. Bacterial cellulose (BC) was produced through the fermentation of Acetobacter xylinum, using tofu liquid waste as a bacterial medium under optimal conditions. Following purification, BC underwent characterization through Fourier Transform Infrared Spectroscopy (FTIR), X-Ray Diffraction (XRD), Scanning Electron Microscopy (SEM), and Energy-Dispersive X-ray Spectroscopy (EDX). The results confirmed the successful formation of BC, highlighting its functional groups, crystallinity, surface morphology, and elemental composition. The BC-ZnO composite was synthesized using an ex-situ chemical method, with characterization data revealing that ZnO was successfully impregnated onto the BC template, constituting 40.92% of the BC-ZnO material by mass. The antibacterial efficacy of the BC-ZnO composite was evaluated against Propionibacterium acnes using the diffusion method. The results demonstrated a significant inhibitory effect, with a zone of inhibition measuring 18.7 mm, categorizing it as strongly antibacterial.
Keywords: BC-ZnO, synthesis, antibacterial activity.
How to cite: Purba, H., Marpongahtun, M., Tamrin, T., & Septevani, A. A. (2024). Synthesis and characterization of BC-ZnO and antibacterial activity test. Polímeros: Ciência e Tecnologia, 34(2), e20240022. https://doi.org/10.1590/01041428.20240028
1. Introduction
Liquid waste of tofu (LWT) is a by-product of tofu production. Typically, LWT is not repurposed but rather discarded into waste disposal sites. However, it is rich in organic compounds derived from the tofu manufacturings process, including proteins, nitrogen, carbohydrates, fats, vitamins, and minerals[1]. These nutrients make LWT an excellent medium for cultivating certain bacteria, such as Acetobacter xylinum. This bacterium is capable of producing bacterial cellulose (BC) through fermentation. Recently, modified BC has found wide-ranging applications across various sectors, notably in healthcare. It is used in the manufacture of food packaging, biosensors, wound dressings, toxic gas adsorbents, among other products[2-4] BC offers numerous benefits, such as being non-toxic, easily modifiable, simple to produce, and cost-effective[5]. In their study, BC was modified into a composite material through the addition of ZnO to the BC template. The selection of ZnO was based on its excellent antibacterial properties, non-toxicity, and affordability[6]. The composite was created using the ex-situ chemical method, which involves immersing BC in a solution containing ZnO. This
method is widely used for large-scale production of BC composites due to its simplicity, practicality, and ability to achieve a well-dispersed incorporation of ZnO into the BC template[7,8]. Following immersion, the composite was characterized, and its antibacterial efficacy was tested against Propionibacterium acnes
Propionibacterium acnes is an enzyme-producing bacterium that contributes to the inflammatory process and can lead to skin issues, notably acne. Acne is a prevalent, chronic inflammatory condition affecting the pilosebaceous unit, which comprises hair follicles and sebaceous glands. It is primarily triggered by increased sebum production, hyperkeratinization of follicles, bacterial colonization, and inflammation. The disorder is marked by the chronic or recurrent appearance of comedones, erythematous papules, and pustules, mainly on the face, but it can also affect the neck, trunk, and proximal upper extremities. While acne vulgaris is often seen as a benign and self-limiting issue, it can lead to significant psychological distress and disfiguring scars. This article offers an updated review of acne, with an emphasis on its management[9,10] .
Purba, H., Marpongahtun, M., Tamrin, T., & Septevani, A. A.
2. Materials and Methods
2.1 Materials
The materials used include Acetobacter xylinum, anhydrous ZnCl2, NaOH, Na2CO3, glacial acetic acid, hydrochloric acid, ammonium sulfate (referred to as zwavelzure ammoniac, ZA), sucrose, clindamisyn, liquid waste of tofu (LWT), coconut water and distilled water (aquadest). Table 1 show that the fuction of all the material for synthesis BC, BC-ZnO and antibacterial activity test.
2.2
BC synthesis
Bacterial cellulose (BC) was synthesized through the fermentation of LWT using Acetobacter xylinum. The process was optimized by adjusting the medium’s acidity to pH levels of 2, 3, 4, 5 and 6. The ratios of tofu liquid waste to coconut water tested were 1:0, 1:1, and 3:1 (%v), over a fermentation period ranging from the 2nd to the 13th days. LWT was sourced from the waste disposal system of Tofu Industry Polonia in Medan, North Sumatra Province, Indonesia, and subsequently filtered using a vacuum filter. A mixture of 500 mL of LWT and 500 mL of coconut water was sterilized in an autoclave at 121°C for 15 minutes. The medium was then adjusted to pH levels between 2 and 6 by adding glacial acetic acid, cooled to room temperature, and supplemented with 25 grams of sucrose and 5 grams of ZA. Each culture container received 350 mL of this medium, to which 15 mL of Acetobacter xylinum starter culture was added. BC produced from the fermentation was collected from the 2nd to the 13th day[11]. The BC was then purified with distilled water and treated with 5% NaOH for 24 h. Subsequently, the BC was rinsed with distilled water until it reached a neutral pH level of 7.
2.3
BC-ZnO synthesis
The BC-ZnO composite was synthesized using an ex-situ chemical method. Initially, pure bacterial cellulose (BC) was immersed in a solution of zinc oxide (ZnO) synthesized from the ZnCl2 precursor. A concentration of 100 ppm ZnO was prepared in advance for the immersion process, ensuring the BC was fully submerged in the ZnO solution within the crucible. This soaking process was conducted over a period of 3 days, with each day totaling 24 hours, followed by a purification step using distilled water. The purified composites were then dried and subjected to characterization.
2.4 Characterization
The final product of synthesis BC and BC-ZnO with previous procedure then purification with aquadest untill reached pH neutral (pH 7). The neutral BC and BC-ZnO then was dryed by oven at 40°C until reached constant mass. Then the material was charaterized using FTIR, XRD, SEM-EDX.
2.5
Antibacterial activity test
The antibacterial efficacy of the BC-ZnO composite against Propionibacterium acnes was evaluated using the diffusion method combined with the cup plate technique. Initially, 1 ml of Propionibacterium acnes bacterial suspension was integrated into Mueller-Hinton Agar (MHA) media and homogenized using a vortex mixer. The mixture was then transferred to a petri dish and allowed to solidify upon cooling. Wells were created in the solidified media using a cork borer, and the BC-ZnO composite was placed into these wells. The setup was incubated at 37°C for 24 hours. Post-incubation, the formation of clear inhibition zones around the wells was observed and the diameters of these zones were measured using Vernier calipers.
3. Results and Discussions
3.1 Synthesis BC
Tabel 1. The fuction of material for synthesis BC, BC-ZnO, and antibacterial activity test.
No Material Function
1. Acetobacter xylinum Bacteria for synthesis BC
2. ZnCl2/Na2CO3 Precursor synthesis ZnO
3. NaOH/aquadest Purification BC
4. LWT/coconut water Medium of bacteria Acetobacter xylinum
5. Clindamisyn Postif control for antibacterial test
6. ZA/sucrose Nutritional for bacteria Acetobacter xylinum
Optimization of bacterial cellulose (BC) production using liquid waste of tofu (LWT) media by Acetobacter xylinum involved varying the concentration ratios of LWT to coconut water, fermentation duration, and media acidity. Three concentration ratios were tested: 1:0, 1:1, and 3:1. Analysis revealed that the optimal ratio for BC production was 1:1, based on the percent yield of each variation. At a 1:0 ratio, no BC formation occurred, likely due to insufficient nutritional content for Acetobacter xylinum, preventing fermentation. Additionally, the effect of fermentation time on BC yield was examined over a period from the 2nd to the 13th day. It was observed that an increase in fermentation time led to a higher yield of BC, up to a point where the nutrient content of the media was depleted. The research findings indicated that by the third day, bacterial cellulose (BC) transitioned from a gel-like state to a solid form. This layer of BC, which is white, floated to the top of the fermentation container. This phenomenon occurs due to the production of CO2 gas from the bacterial metabolic process, pushing the BC layer to the surface. The medium’s acidity was adjusted by adding glacial acetic acid, with pH levels set at 2, 3, 4, 5, and 6. Data (Figure 1) revealed that the optimal acidity condition for the medium is at pH 4, aligning with prior studies suggesting Acetobacter xylinum operates most efficiently at this pH level[12]. This was evidenced by the percent yield of BC produced during the fermentation process.
3.2 BC-ZnO synthesis
The BC-ZnO composite was synthesized using chemical ex-situ methods, with its characteristics confirmed by instruments such as FTIR, XRD, SEM, and EDX. The key to the successful synthesis of BC-ZnO was the interaction
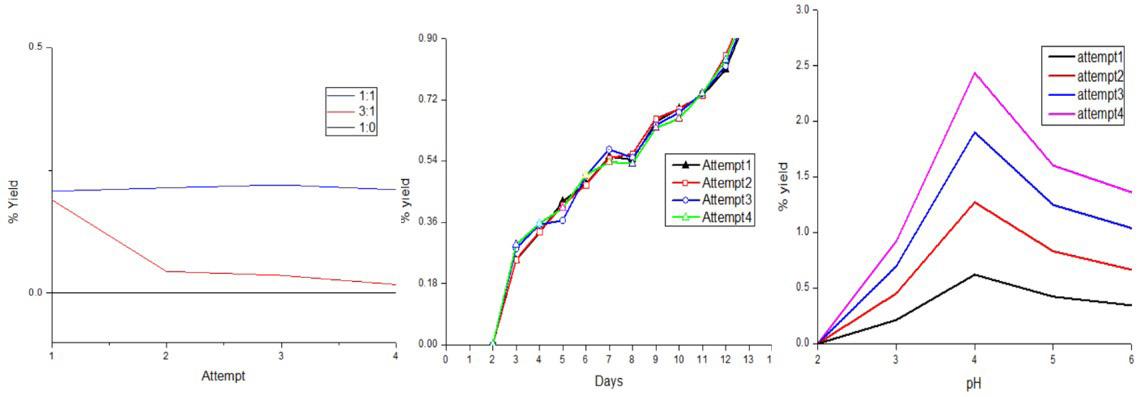
of hydrogen bonds between the BC and ZnO materials[13] The reaction mechanism leading to the formation of BCZnO is outlined as follows[14 ]:
The interaction between ZnO and BC is very strong, preventing the degradation of the composite material. This robustness makes BC-ZnO a viable option for antibacterial applications.
3.3 Characterization
The bacterial cellulose (BC) produced through the fermentation process was analyzed using FTIR, XRD, SEM, and EDX techniques. The analysis results indicated the presence of specific functional groups characteristic of BC. The IR spectrogram (Figure 2) showed that wavelengths number in the range of 3200-3700 cm-1, representing the -OH functional group, 2800-2950 cm-1 indicating the -CH functional group, and at 1050 cm-1 corresponding to the -C-O-C- functional group. These findings align with the known functional groups of bacterial cellulose[15] .
The data of X-ray diffraction (XRD) analysis of the sample revealed specific diffraction peaks at 2θ degrees of 14° and 22°, indicating the presence of bacterial cellulose (BC) with a crystallinity of 81% (Figure 3). These results confirm the successful production of BC[16-18]. Scanning Electron Microscopy (SEM) analysis of the surface morphology, as illustrated in Figure 4, showed that BC had a fibrous structure with an average particle size of 94.47 nm (using imageJ software analysis). Elemental analysis by Energy-Dispersive X-ray Spectroscopy (EDX) data at Figure 5 indicated that the primary elements of BC, carbon (C) and oxygen (O), were present at 43.21% and 51.29%, respectively. This elemental composition closely matches theoretical calculations, with carbon and oxygen mass percentages expected to be 44.4% and 49.4%, respectively. These findings support the conclusion that BC was successfully produced through the fermentation process. Subsequently, BC was modified into a BC-ZnO composite using chemical ex-situ methods. This modification resulted in a change in the color of BC,
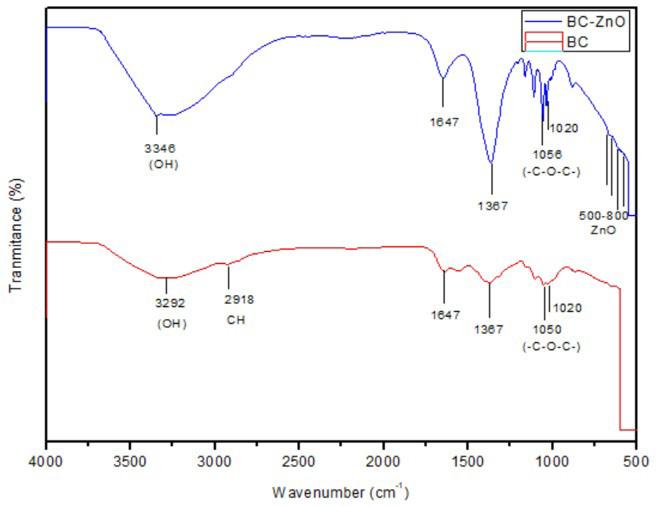
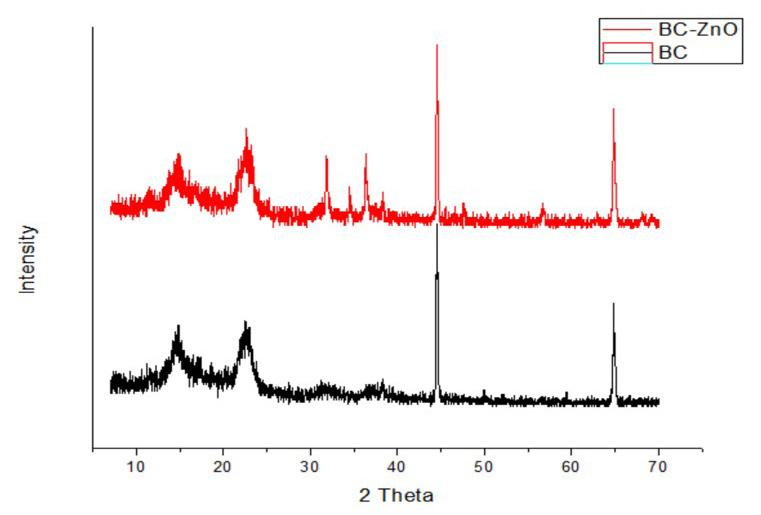
indicating the formation of the BC-ZnO material, which was then characterized for its properties.
The analysis of the BC-ZnO composite was conducted to examine properties such as particle size, surface morphology, crystallinity, and functional groups. The identification of functional groups in the BC-ZnO composite through IR spectroscopy revealed that the characteristic wavelength numbers associated with BC were present in the IR spectrum. This indicates that the functional groups of BC remained unchanged in the BC-ZnO composite. The characteristics of ZnO within the BC-ZnO composite were identified
Figure 1. Optimization of BC synthesis (a) concentration variation (b) fermentation time (c) medium acidity.
Figure 2. IR spectrograms of BC and BC-ZnO
Figure 3. X-ray diffractogram of BC and BC-ZnO.
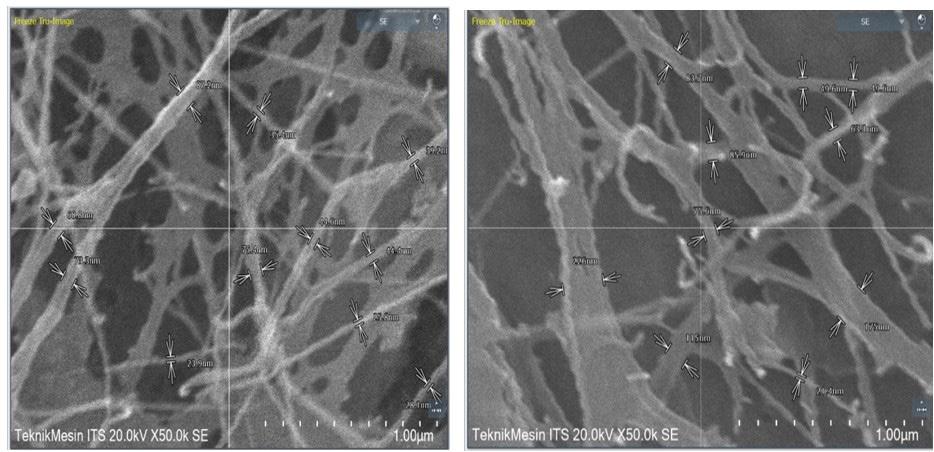
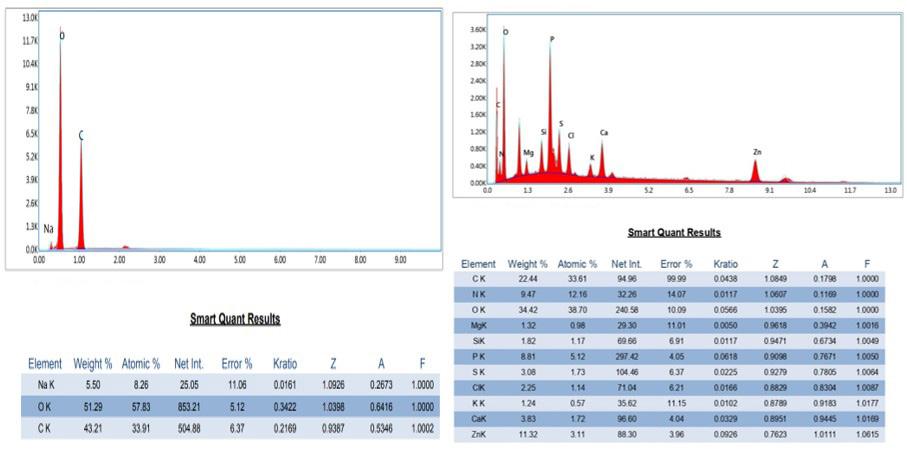
by wavelength numbers between 500 cm-1 and 800 cm-1, attributed to the vibration of the Zn-O bond. Peaks observed at 910, 1020, 2918 cm-1 were due to the presence of C-O and C-H vibrations[19] (Figure 2). The X-ray diffraction (XRD) diffractogram of BC-ZnO ilustrated as Figure 3 showed that the characteristic 2θ degrees of BC at 14° and 22° were retained. Additionally, characteristic peaks of ZnO appeared at 2θ = 31.8, 34.5, 36.2, 47.8, 56.5, 62.8, and 68.0º, corresponding to the ZnO crystal structure. The emergence of these new peaks confirmed the presence of both BC and ZnO, largely maintaining their original forms within the composite[20,21] .
The data of morphological analysis show in Figure 4, It was indicates that bacterial cellulose (BC) possesses a fibrous structure. Similarly, the BC-ZnO composite retains the fibrous morphology of the BC template, aligning with previous findings that BC is characterized by its fibrous form[16]
ZnO was incorporated into the BC template using chemical ex-situ methods. Elemental analysis by EDX show at Figure 5 revealed that the mass percentage of Zn in the BC template was 40.92%, confirming the successful impregnation of ZnO onto the BC template.
3.4 Antibacterial activity test
The antibacterial mechanism of BC-ZnO against Propionibacterium acnes[13] operates as follows:
The antibacterial activity test at Table 2, conducted using diffusion methods, demonstrated that the BC-ZnO
Purba, H., Marpongahtun, M., Tamrin, T., & Septevani, A. A.
Figure 4. Morphological analysis of BC using SEM (left) and BC-ZnO (right).
Figure 5. Elemental analysis of BC (left) and BC-ZnO (right) by EDX.
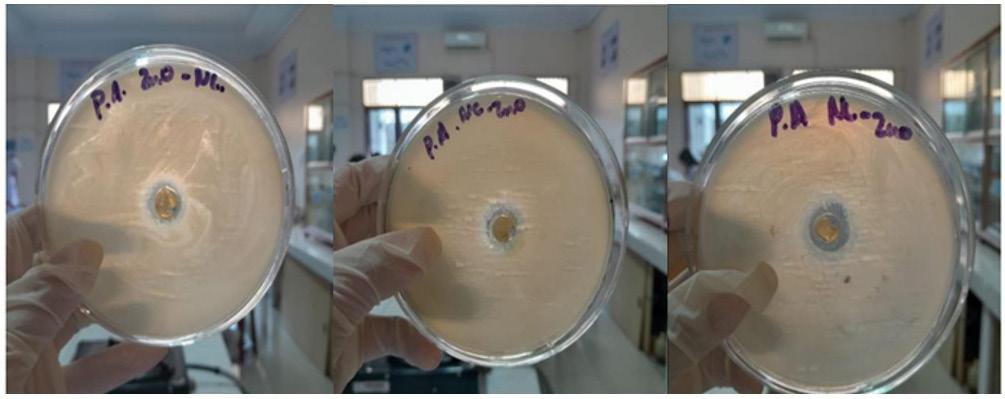
No. Material
Zone Diameter (mm) Average (mm) Category attempt1 attempt2 attempt3 1.
composite inhibits the growth of Propionibacterium acnes, as evidenced by the diameter of the clear zone around the disc. The antibacterial effect of BC-ZnO is attributed to the generation of highly reactive species such as superoxide, hydrogen peroxide, and hydroxyl radicals on the ZnO surface, activated by UV and visible light. The production of H2O2 on the ZnO surface plays a crucial role in bacterial growth inhibition[22].
The antibacterial activity of a material can be seen from the diameter of the clear zone in the well method or diffusion method. It can be seen from Figure 6 that there was a clear zone in the BC-ZnO antibacterial activity test with a diameter of 18.7 mm. This shows that the material was antibacterial in the strong category
4. Conclusions
Optimal conditions for BC production were identified as a 1:1 ratio of LWT to coconut water, a medium acidity of pH 4, and an observation that longer fermentation times yield greater amounts of BC. Characterization data confirmed the successful synthesis of both BC and BC-ZnO, as evidenced by the results from FTIR, XRD, and SEM-EDX analyses. The antibacterial test, utilizing the diffusion method, categorized the BC-ZnO composite as having strong antibacterial activity against Propionibacterium acnes
5. Author’s Contribution
• Conceptualization – Hermawan Purba; Marpongahtun Marpongahtun; Tamrin Tamrin; Athanasia Amanda Septevani
• Data curation – Hermawan Purba; Marpongahtun Marpongahtun; Tamrin Tamrin; Athanasia Amanda Septevani.
• Formal analysis – Hermawan Purba; Marpongahtun Marpongahtun; Athanasia Amanda Septevani.
• Funding acquisition – NA.
• Investigation – Hermawan Purba; Marpongahtun Marpongahtun.
• Methodology – Hermawan Purba; Marpongahtun Marpongahtun; Tamrin Tamrin; Athanasia Amanda Septevani.
• Project administration – Hermawan Purba; Marpongahtun Marpongahtun.
• Resources – Hermawan Purba; Marpongahtun Marpongahtun.
• Software – NA.
• Supervision – Marpongahtun Marpongahtun; Tamrin Tamrin; Athanasia Amanda Septevani.
• Validation – Marpongahtun Marpongahtun; Athanasia Amanda Septevani.
• Visualization – Hermawan Purba; Marpongahtun Marpongahtun.
• Writing – original draft – Hermawan Purba.
• Writing – review & editing – Hermawan Purba; Marpongahtun Marpongahtun; Tamrin Tamrin; Athanasia Amanda Septevani.
6. Acknowledgements
The authors wish to express their gratitude to the rector of Universitas Sumatera Utara and the Lembaga Penelitian
Figure 6. BC-ZnO antibacterial activity test against Propionibacterium acnes
Table 2. Antibacterial activity test with diffusion method.
Purba, H., Marpongahtun, M., Tamrin, T., & Septevani, A. A.
LP-TALENTA for financial support through the Penelitian Disertasi Doktor grant scheme in 2021.
7. References
1 Fika, W. (2019). Development of superabsorbent polymer nanocomposites made from cassava starch with bacterial nanocellulose reinforcement from nata de soya (Master’s thesis). Universitas Andalas, Indonesia
2 Eskilson, O., Zattarin, E., Berglund, L., Oksman, K., Hanna, K., Rakar, J., Sivlér, P., Skog, M., Rinklake, I., Shamasha, R., Sotra, Z., Starkenberg, A., Odén, M., Wiman, E., Khalaf, H., Bengtsson, T., Junker, J. P. E., Selegård, R., Björk, E. M., & Aili, D. (2023). Nanocellulose composite wound dressings for real-time pH wound monitoring. Materials Today. Bio, 19, 100574. http://doi.org/10.1016/j.mtbio.2023.100574. PMid:36852226.
3 Li, Q., Gao, R., Wang, L., Xu, M., Yuan, Y., Ma, L., Wan, Z., & Yang, X. (2020). Nanocomposites of bacterial cellulose nanofibrils and zein nanoparticles for food packaging. ACS Applied Nano Materials, 3(3), 2899-2910 http://doi.org/10.1021/ acsanm.0c00159
4 Picheth, G. F., Pirich, C. L., Sierakowski, M. R., Woehl, M. A., Sakakibara, C. N., Souza, C. F., Martin, A. A., Silva, R., & Freitas, R. A. (2017). Bacterial cellulose in biomedical applications: a review. International Journal of Biological Macromolecules, 104(Pt A), 97-106 http://doi.org/10.1016/j. ijbiomac.2017.05.171
5. Hussain, Z., Sajjad, W., Khan, T., & Wahid, F. (2019). Production of bacterial cellulose from industrial wastes: a review. Cellulose (London, England), 26(5), 2895-2911 http://doi.org/10.1007/ s10570-019-02307-1.
6 Oun, A. A., Shankar, S., & Rhim, J.-W. (2020). Multifunctional nanocellulose/metal and metal oxide nanoparticle hybrid nanomaterials. Critical Reviews in Food Science and Nutrition, 60(3), 435-460 http://doi.org/10.1080/10408398.2018.15369 66 PMid:31131614.
7 Dincă, V., Mocanu, A., Isopencu, G., Busuioc, C., Brajnicov, S., Vlad, A., Icriverzi, M., Roseanu, A., Dinescu, M., Stroescu, M., Stoica-Guzun, A., & Suchea, M. (2020). Biocompatible pure ZnO nanoparticles-3D bacterial cellulose biointerfaces with antibacterial properties. Arabian Journal of Chemistry, 13(1), 3521-3533 http://doi.org/10.1016/j.arabjc.2018.12.003
8 Wasim, M., Khan, M. R., Mushtaq, M., Naeem, A., Han, M., & Wei, Q. (2020). Surface Modification of Bacterial Cellulose by Copper and Zinc Oxide Sputter Coating for UV-Resistance/ Antistatic/Antibacterial Characteristics. Coatings, 10(4), 364 http://doi.org/10.3390/coatings10040364.
9 Heng, A. H. S., & Chew, F. T. (2020). Systematic review of the epidemiology of acne vulgaris. Scientific Reports, 10(1), 5754 http://doi.org/10.1038/s41598-020-62715-3 PMid:32238884.
10 Goodarzi, A., Mozafarpoor, S., Bodaghabadi, M., & Mohamadi, M. (2020). The potential of probiotics for treating acne vulgaris: a review of literature on acne and microbiota. Dermatologic Therapy, 33(3), e13279 http://doi.org/10.1111/dth.13279 PMid:32266790.
11 Purba, H., Marpongahtun, Andriayani, Septevani, A. A., & Sitepu, E. (2023). Charaterization of nanocellulose from liquid wasted of tofu by acetobacter xylinum. AIP Conference Proceedings, 2626(1), 040020 http://doi.org/10.1063/5.0136106
12 Cheng, Z., Yang, R., Liu, X., Liu, X., & Chen, H. (2017). Green synthesis of bacterial cellulose via acetic acid pre-hydrolysis liquor of agricultural corn stalk used as carbon source.
Bioresource Technology, 234, 8-14 http://doi.org/10.1016/j. biortech.2017.02.131 PMid:28315605.
13. Zhao, S.-W., Guo, C.-R., Hu, Y.-Z., Guo, Y.-R., & Pan, Q.-J. (2018). The preparation and antibacterial activity of cellulose/ ZnO composite: a review. Open Chemistry, 16(1), 9-20 http:// doi.org/10.1515/chem-2018-0006
14 Wahid, F., Duan, Y.-X., Hu, X.-H., Chu, L.-Q., Jia, S.-R., Cui, J.-D., & Zhong, C. (2019). A facile construction of bacterial cellulose/ZnO nanocomposite films and their photocatalytic and antibacterial properties. International Journal of Biological Macromolecules, 132, 692-700 http://doi.org/10.1016/j. ijbiomac.2019.03.240 PMid:30946911.
15 Chuah, C., Wang, J., Tavakoli, J., & Tang, Y. (2018). Novel bacterial cellulose-poly (acrylic acid) hybrid hydrogels with controllable antimicrobial ability as dressings for chronic wounds. Polymers, 10(12), 1323. http://doi.org/10.3390/ polym10121323 PMid:30961248.
16 Costa, A. F. S., Almeida, F. C. G., Vinhas, G. M., & Sarubbo, L. A. (2017). Production of bacterial cellulose by Gluconacetobacter hansenii using corn steep liquor as nutrient sources. Frontiers in Microbiology, 8, 2027 http://doi.org/10.3389/fmicb.2017.02027 PMid:29089941.
17 Dórame-Miranda, R. F., Gámez-Meza, N., Medina-Juárez, L., Ezquerra-Brauer, J. M., Ovando-Martínez, M., & Lizardi-Mendoza, J. (2019). Bacterial cellulose production by Gluconacetobacter entanii using pecan nutshell as carbon source and its chemical functionalization. Carbohydrate Polymers, 207, 91-99 http:// doi.org/10.1016/j.carbpol.2018.11.067 PMid:30600072.
18 . Meza-Contreras, J. C., Manriquez-Gonzalez, R., GutiérrezOrtega, J. A., & Gonzalez-Garcia, Y. (2018). XRD and solid state 13C-NMR evaluation of the crystallinity enhancement of 13C-labeled bacterial cellulose biosynthesized by Komagataeibacter xylinus under different stimuli: a comparative strategy of analyses. Carbohydrate Research, 461 , 51 - 59 http://doi.org/10.1016/j.carres.2018.03.005 PMid:29587136.
19 Lanje, A. S., Sharma, S. J., Ningthoujam, R. S., Ahn, J.-S., & Pode, R. B. (2013). Low temperature dielectric studies of zinc oxide (ZnO) nanoparticles prepared by precipitation method. Advanced Powder Technology, 24(1), 331-335 http://doi. org/10.1016/j.apt.2012.08.005
20 Jebel, F. S., & Almasi, H. (2016). Morphological, physical, antimicrobial and release properties of ZnO nanoparticles-loaded bacterial cellulose films. Carbohydrate Polymers, 149, 8-19 http://doi.org/10.1016/j.carbpol.2016.04.089 PMid:27261725.
21 Abdalkarim, S. Y. H., Yu, H.-Y., Wang, C., Huang, L.-X., & Yao, J. (2018). Green synthesis of sheet-like cellulose nanocrystal–zinc oxide nanohybrids with multifunctional performance through one-step hydrothermal method. Cellulose (London, England), 25(11), 6433-6446 http://doi.org/10.1007/ s10570-018-2011-0
22 Ba-Abbad, M. M., Takriff, M. S., Benamor, A., Mahmoudi, E., & Mohammad, A. W. (2017). Arabic gum as green agent for ZnO nanoparticles synthesis: properties, mechanism and antibacterial activity. Journal of Materials Science Materials in Electronics, 28(16), 12100-12107 http://doi.org/10.1007/ s10854-017-7023-2
Received: Mar. 19, 2024
Revised: Apr. 23, 2024
Accepted: May 07, 2024
Alternative materials to shorten injection mold manufacturing and molding cycles
Adriano Fagali de Souza1* , Janaina Lisi Leite Howarth2 , Bruno Edu Arendarchuck1 , Alexandre Mateus Popiolek1 , Claudio Antonio Treml Junior2 and Crislaine Kavilha2
1Grupo de Pesquisa em Manufatura Auxiliada por Computador – GPCAM, Laboratório de Mecânica de Precisão – LMP, Departamento de Engenharia Mecânica, Universidade Federal de Santa Catarina –UFSC, Florianópolis, SC, Brasil
2Departamento de Engenharia Mecânica, Sociedade Educacional de Santa Catarina – SOCIESC, Joinville, SC, Brasil
*adriano.fagali@ufsc.br
Obstract
This paper investigates mold materials for polypropylene (PP) injection molding, including CuBe alloy (high thermal conductivity), AISI P20 mold steel (the conventional material for injection molds), and polyurethane resin (rapid tooling). Characterization of molded parts involved microstructural analysis, tensile tests, warping, and degree of crystallinity assessments. The results show that the higher thermal conductivity of the mold’s inserts reduced the injection molding cycle time and produced thicker skins, which resulted in smaller spherulite sizes in the core of the samples, reduced the crystallinity degree, and consequently reduced the maximum strain property. The thermal conductivity of the molds’ inserts was shown to be more significative than the skin thickness and mold temperature for the size of the spherulites when they are formed. In addition, CuBe alloys showed to be a strong competitor with additive manufacturing-produced molds with conformal cooling channels to reduce injection molding cycle time.
Keywords: CuBe alloys, injection molding, mold materials, processing cycle time.
How to cite: Souza, A. F., Howarth, J. L. L., Arendarchuck, B. E., Popiolek, A. M., Treml Junior, C. A., & Kavilha, C. (2024). Alternative materials to shorten injection mold manufacturing and molding cycles. Polímeros: Ciência e Tecnologia, 34(2), e20240023. https://doi.org/10.1590/0104-1428.20230088
1. Introduction
The injection molding process using polypropylene (PP) material is one of the most popular techniques for fabricating thermoplastic products and components in a vast range of segments such as the medical industry, electronics, goods, automobile, among others[1]. This process requires a metal mold usually manufactured by machining. AISI P20 steel is mostly used for this application due to its wear resistance, machinability, high polishing capability, and availability on the current market[2]
The injection molding cycle process includes the following phases: feeding the plastic material, pressurizing and holding, cooling, and ejection of the part from the mold[3] Within the process, factors such as injection rate, mold temperature (including cooling phase duration and rate), mold thickness, and the molecular weight of the molding material play crucial roles in determining the morphology and mechanical performance of semicrystalline injection moldings[4]. It is worth noting that cooling is one of the most important stages of the process because it can deeply affect the production efficiency and the quality of the final parts in terms of mechanical properties and microstructure formation[5] A Non-uniform heat transfer during the cooling phase in the molding can also result in warpage and deformations of the
molded parts can also result in warpage and deformations of the molded parts[6]
During the injection molding process, after the melting phase, the final plastic part is formed by two distinct regions presenting morphological distinctions: an outer region with a highly oriented layer in the border of the material known as skin, and a massive region in the central portion known as the core. The arrangement of these layers can occur according to the processing parameters, part geometry, mold design, and the molded material’s properties[7]. According to Karger-Kocsis and Bárány[8], the polypropylene core layer is much thicker than the other layers because the core is cooled down slowly, thus it has more time to crystallize. The thickness of the skins is influenced by the flow rate, the material viscosity, filling time, mold temperature, heat conductivity, melt temperature, cavity thickness, surface roughness, geometry, and mold coating. A thinner skin layer can promote flexibility and resistance to cracking or stress failure[9]. However, its final size is determined by the degree of relaxation of stress-induced orientation in the material. A shorter cooling time reduces the period for the material to relax its orientation, thereby increasing the ‘original’ size of the oriented skin[4]
Souza, A. F., Howarth, J. L. L., Arendarchuck, B. E., Popiolek, A. M., Treml Junior, C. A., & Kavilha, C.
Processing polymers by injection molding promotes different shear or compressive forces, which can be related to changes in materials features such as degree of crystallinity and crystallization formation[10,11]. According to Rizvi[12] , higher mold temperature is favorable for yield strength and tensile modulus. Depending on the cooling rate (i.e., mold temperature), the crystallization rate of the polymer is modified as well as its crystalline microstructure and crystallinity percentage[13]. This mainly occurs during the packing and cooling phase due to its transient nature and the rapid changes in pressure and temperature[14]
The degree of crystallinity influences the material’s longer-range arrangement level. A high degree of crystallinity degree of crystallinity in polymers leads to increased modulus of elasticity and maximum strain[15]. The high mold temperature prevents the cooling process from rapidly cooling the material, leading it to crystallize fully to its equilibrium state, especially near the sample wall. In experiments with slower flow rates, the flow-induced crystallization (FIC) effect on crystallization kinetics isn’t enough to offset the influence of intense cooling. Consequently, the quenching zone thickness increases[8]. Differential scanning calorimetry (DSC) techniques can be used to evaluate the crystalline degree[14].
The major effect of crystallites is to act as a crosslinked network. The deformation of polymer – i.e., moving dislocations and the presence of glide planes – are restricted by forming a significant cross-linked network; thus, increasing crystallinity is expected to improve mechanical properties[16]
Today, one of the efforts expended to develop this manufacturing process concentrates on the reduction of the injection molding cycle time by using materials, instead of AISI P20, with high thermal conductivity to manufacture molds[17]. Another effort involves focusing on the reduction of the time required to manufacture the injection mold itself by using alternative materials to facilitate the manufacturing of the mold, known as the rapid tooling approach[18]. Taking into account these efforts, the materials used for manufacturing the molds are the issue investigated in the present work.
Some alternative materials with higher thermal conductivity can be used for mold inserts, such as copperberyllium (CuBe) alloys[19]. These alloys, with more than 1.7 wt. % of Be, have prevailed in the market because they present adequate mechanical properties, hardening up to 330 to 360 Brinell. In this range, the material is ductile, has no tendency to fragility at the edges, and is readily polishable, which are essential characteristics to produce parts with low degrees of roughness. Machining or casting can be used to produce such molds[17]
Apacki[20] and Kelly et al.[21] evaluated the injection molding cycle time using a mold of CuBe and another fabricated with AISI P20 steel. These results showed a reduction of 17% in the cycle time compared to P20 steel in the first experiment and a reduction of 25% of the cooling time was achieved in the second one. Warpage measurements of the injected parts did not show statistical differences between CuBe and P20 molds. These studies are important contributions to the knowledge of the molding process using CuBe alloy, but it is still missing the analyses of the microstructure skin and the degree of crystallinity degree of crystallinity of
the injected parts in such molds with a higher cooling rate. According to Lee and Cha[9], there is a lack of knowledge of the factors that influence the formation of the skin layer and its thickness, which can directly impact the properties of the molded parts.
Based on this background, the current work presents an investigation of the microstructure formation and degree of crystallinity degree of crystallinity of polypropylene parts manufactured by injection molding using different materials, with very different thermal conductivity, for the mold’s inserts, focusing on: i) rapid tooling approach, and ii) reduction of the injection molding cycle time. To be closer to real application, a free-form workpiece and its molds were designed and manufactured. This workpiece geometry and the mold were originally designed for research purposes and are used in other projects[22]. Three pairs of mold inserts were manufactured using: i) CuBe alloy (rapid cooling), ii) polyurethane resin (rapid tooling), and iii) AISI P20 steel ordinary material.
Batches of injection molding were conducted altering these three pairs of inserts. The molded workpieces were investigated in terms of microstructure formation, crystallinity degree, warpage, and mechanical properties. CAE simulations were carried out and the real temperature inside the mold was obtained in real-time to contribute to the understanding of the phenomena that occur during these injection molding processes. The experimental procedures are detailed below.
2. Experimental Procedure
A representative workpiece containing free-form geometries was designed and modeled in 3D CAD software. A mold with interchangeable inserts was also designed and manufactured. These inserts were manufactured using the following three different materials: i) ordinary AISI P20 steel, ii) Plasloy 20C a CuBe alloy with Be greater than 1.7% (fast cooling), and iii) Huntsman RenShape®5166 (rapid tooling) – a polyurethane resin matrix reinforced with aluminum trihydrate about 68.7 wt.%[18] .
The injection molding process utilized Polypropylene HP 550, a high fluidity homopolymer, to fabricate the workpieces. This material boasts a Shore D hardness of 71 and a density of 0.905g/cm3 at 23 °C. CAE simulations were carried out to obtain the injection molding parameters. The workpieces were characterized through microstructural analysis, tensile tests, warpage, and crystallinity degree. Thermocouples were installed inside the mold to furnish the real temperature during the injection process to add to the proposed investigation. Other peripherical analyses are also briefly discussed, which even if not deeply investigated, may contribute to future research.
2.1 Part geometry and the injection molds
The workpiece geometry consists of a disc of 140 mm in diameter, and five equidistant cavities with 28.5 mm of height, interconnected by 2 mm of thickness. A central sprue was used of 60 mm in length and 6 mm in diameter at the entrance with a draft angle of 2°. The sensor 1 was installed in the fixed cavity and the sensor 2 in the movable cavity, on the molding block, 10 mm away from plastic part
Alternative materials to shorten injection mold manufacturing and molding cycles
(Figure 1), in order to avoid marks on the product surface. Figure 1 shows the interchangeable inserts, the workpiece, and the entire mold. Two thermocouple type-K were installed inside the molds, as presented in Figure 1b. Both sensors were installed 10 mm away from the workpiece.
The RenShape®5166 resin is a material usually used for prototyping and other similar applications. Rapid tooling is favored for small batch injection cycles due to its advantages like reduced lead time, lower capital costs, and enhanced customization. The demand for timely delivery of low-cost products with diverse geometries is on the rise, driving its widespread adoption across industries, especially in new product development[23]. Thus, its thermal properties are not found on its datasheet[24]. However, to conclude the present work, the thermal properties of the RenShape had to be established. To do so, the thermal conductivity was obtained by following the ISO 8301-1991 standard, utilizing a heat flow meter apparatus with a Symmetrical Single-specimen layout. Thermal resistance was determined using Fourier’s law, and the thermal conductivity was calculated by dividing the resin’s thickness (50.8mm) by the thermal resistance, resulting in a value of 0.51 W/mK with an uncertainty of 4%. The resin sample was considered homogeneous.
The specific heat determination was performed using differential scanning calorimetry (DSC) equipment, specifically the TA Instruments model Q20, following the ASTM E1269 standard. At a rate of 10 °C/min, the following procedures were carried out: first with an empty crucible, the second with Sapphire as the standard, and the third with the resin of interest. The specific heat values of the empty crucible were subtracted from the reference results and the resin’s specific heat values to obtain the desired outcome. The specific heat value collected at 86.85 °C, which closely represents the average surface temperature expected during the injection process, was determined to be 1648 J/kg.K.
For the AISI P20 and CuBe alloy, their thermal properties can be found on their datasheets. The density and the thermal conductivity of the three materials used to manufacture the mold’s inserts are presented in Table 1
A CNC milling machine Feller model FV-600 was utilized to machine the inserts. Figure 2 shows the final mold, the inserts, and some molded workpieces.
In a peripherical analysis, to gain a general idea about the manufacturing time considering the rapid tooling application, a simplified analysis of the manufacturing time of the inserts was conducted. The machining time was assessed and is presented in Table 2 (only the milling process). It may be considered that machining time is a very complex subject, involving cutting parameters, a CNC machine, a cutting tool, a fixture, and so on. This information is only presented to offer a first view of the machining time of these materials. It is limited to the resources used in the present work.
In the case investigated, the same cutting parameters for the P20 and CuBe were used; thus, the milling time was the same. A reduction of about 50% of the machining time was verified with the resin, because of the roughing operation. In this operation, the resin material propitiated higher cutting parameters and speeds. Figure 3 provides a view of the toolpath for roughing. Figure 3a shows the roughing for resin, a lower density of toolpaths, and Figure 3b the tool path for AISI P20, which requires a shallower cut, thus requiring more density of toolpaths, resulting in a longer machining time.
Resin AISI P20 / CuBe – same cutting parameters

Figure 1. Workpiece geometry, inserts, entire mold, and position of the thermocouples (sensor 1 and sensor 2).
Table 1. Main properties of the tested insert materials.
Table 2. Machining time of the inserts according to its material.
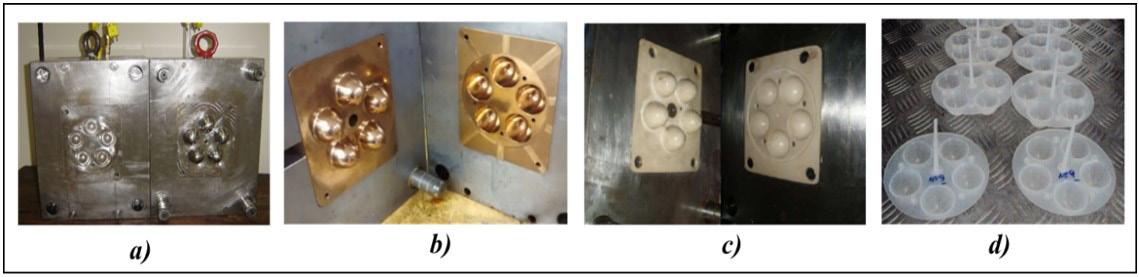
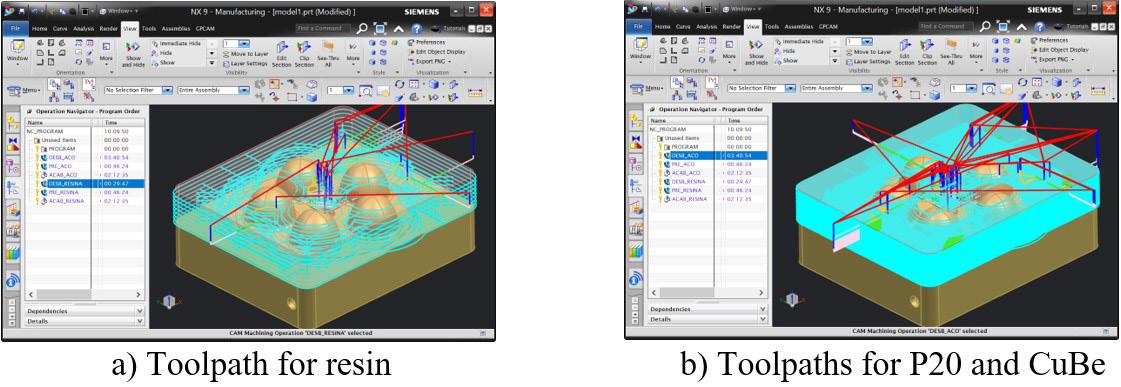
2.2 Workpiece material and the injection molding process
The Braskem PP H201 polypropylene was used for the injection molding of the workpieces. The CAE software Moldflow® was used to obtain the main injection molding parameters. The simulated parameters as well as the real ones used in the experiments are presented in Table 3 A Sandretto injection molding machine model MICRO 650/247 was used for injection molding the workpieces.
Fixing the parameter of the injection molding using the AISI P20 resulted in a remarkable reduction of 46% in the cycle time using the CuBe inserts, and an increase of about 2,800% in the cycle time using the alternative resin.
2.3 Characterization of the molded workpieces
To evaluate the influences that each mold material had on the molded plastic parts, specimens were withdrawn from the injected workpieces to carry out morphology analysis and tensile test. The specimens from the workpiece were obtained from the local indicated in Figure 4
The Olympus model BH2 microscope was utilized to observe via polarized optical images the morphology of the injected parts. A Leitz 1401 microtome was utilized to cut the samples at room temperature, with 10 μm of thickness. The formation and characteristics of the skin, the center, and the size of the spherulites were analyzed. Tensile tests were conducted according to ASTM D 638 type V (ASTM D638)[25] For a statistic evaluation, five specimens of ASTM D 638 type V were extracted from the workpiece, as shown in Figure 4
Moldflow® Simulation
Real injection parameters
The warpage of the injected workpiece was evaluated by measuring five points on it, which were then compared to part nominal dimension on the CAD model (28.5 mm). These points were accessed by a Mitutoyo Crista 710 coordinate measuring machine. The computer-aided inspection (CAI) system was utilized for warpage assessment. Using a coordinate measuring machine (CMM), the sample was measured at five predetermined points in a sequence (refer to Figure 4a). These values were then compared to the original ones from the 3D CAD geometry, and any differences were noted. Analysis of variance (ANOVA) was realized to evaluate the warpage among the samples.
Differential scanning calorimetry (DSC) was used to measure the degree of crystallinity of injected polypropylene.
Figure 2. Mold and the different inserts. (a) P20 steel; (b) CuBe alloy; (c) resin; (d) the molded workpieces.
Figure 3. Visualization of the toolpaths for roughing operation (NX Siemens).
Table 3. Simulated injection parameters by Moldflow® and real values used.
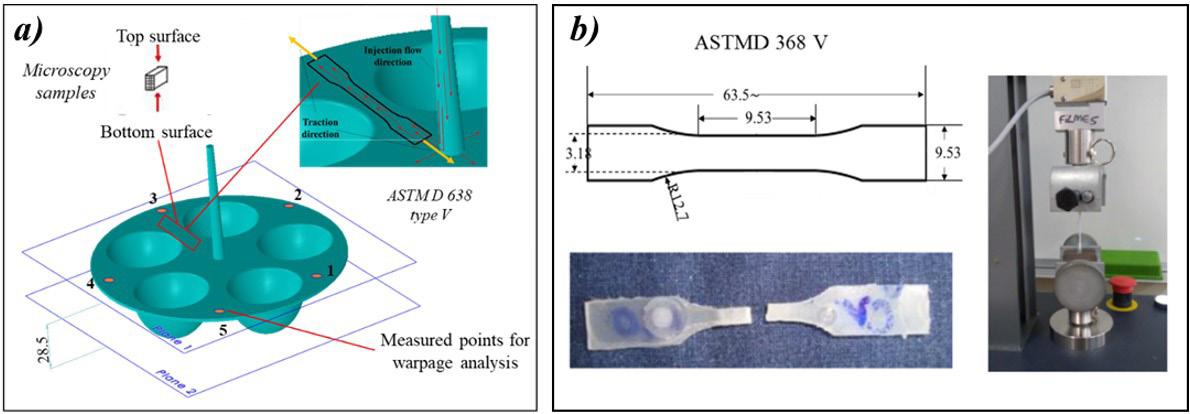
This is a satisfactory technique to assess the degree of the PP parts[26]. TA Instruments, model Q20, was utilized, with a heating rate of 10 °C/min from 20 °C to 300 °C in an inert atmosphere of oxygen. The method consists of an energy measurement to melt the polymer crystal and compare it to the known value of 100% melt crystals using Equation 1.
where ( (%C) is the degree of crystallinity degree of crystallinity (%), ( ) H∆ is the experimentally melting enthalpy for PP H201, and 0 (H) ∆ the theoretical enthalpy, considering (209 J·g-1) as a reference value[27]. All specimens were extracted from the same local, as shown in Figure 4
3. Results and Discussion
Firstly, a discussion is presented about the injection molding cycle time according to the material’s thermal conductivity of the inserts of the mold, to furnish a production perspective and some concerns for the following analyses. Then, the temperature behavior during the injection molding process for each pair of inserts and the analyses of microstructure, the part’s warpage, crystallinity degree, and tensile tests are presented.
3.1 The cycle time according to the material’s thermal conductivity
Significant differences in the injection molding cycle time were observed (Table 3), as expected, which mainly occurred during the cooling time stage as a result of the insert materials’ thermal conductivity.
Aiming to reduce the injection molding cycle time, in addition to the possibility of using a material with higher thermal conductivity (CuBe for example), another alternative includes the manufacture of conformal cooling channels using metal additive manufacturing technology. Thus, a discussion emerges about which option could be more advantageous. In this scenario, Marques et al.[22] compared CAE simulation conformal cooling channels against common linear cooling channels using a P20 steel.
Their results showed a reduction in the cycle time of about 16%. Marin et al.[28]. designed and manufactured a mold with conformal cooling using metal additive manufacturing (SLM process). Evaluating the conformal cooling mold against a conventional counterpart, the reduction of the cycle time obtained reached 36% using the mold with conformal cooling. Even considering the different conditions of these works, the present work shows that CuBe could be a strong competitor for additive manufacture for molding application when considering the cooling time.
The present work shows a reduction of 46% in the cycle time using CuBe inserts, higher than that presented by Marin et al.[28] using additive manufacturing and conformal cooling.
3.2 Analysis of the temperature
The temperature behavior during the injection molding process using the three different pairs of inserts (AISI P20, CuBe, and resin) is presented in Figure 5. Sensor 1 was in the fixed cavities and sensor 2 in the movable cavities.
Figure 5 shows that a significant alteration of temperature cannot be observed, neither in the temperature cusps nor in the temperature gradient in each insert. Furthermore, the difference in temperatures between the inserts of the same material (sensor 1 and sensor 2) at the end of a molding cycle presented little variation (between 5 °C and 8 °C).
Instead, there is a significant difference in the time that the parts remained inside the mold before extraction. Thus, the material’s thermal conductivity might influence the plastic parts and/or the molding process not by altering the process temperatures itself but due to the time that the samples remain inside the mold before extraction. The temperatures and the cycle time observed for both inserts – for the three inserts’ materials evaluated – are useful for the following analyses.
3.3 Analyses of the microstructure
This section presents microstructural analysis in terms of skin thickness and the spherulite formation of H201 polypropylene specimens according to the three different inserts’ materials used for the injection molding of the samples.
Figure 4. Workpiece and samples for analyses. (a) Schematic representation of geometry; (b) Tensile tests.
A. F., Howarth, J. L. L., Arendarchuck, B. E., Popiolek, A. M., Treml Junior, C. A., & Kavilha, C.
3.3.1 Skin thickness
Figure 6 shows the micrographs obtained by polarized light microscopy (magnification of approximately 67x) of the samples molded using the inserts of CuBe (Figure 6a), AISI P20 (Figure 6b), and resin (Figure 6c), highlighting the skin formation. Firstly, it is noticeable that the micrograph of the sample injected using the resin insert does not have well-defined layers between the skins (Figure 6c).
In general, two distinct regions can be observed on the micrograph of the injected samples, presenting morphological alterations. First, a region with a highly oriented layer in the border of the material – the skin – and a massive region in the central portion – the core. Between these regions, there is a formation of a transition zone next to the core, and a high shear zone denoted by a darkened region. However, such a transition zone cannot be observed on the samples molded by the resin inserts (Figure 6c, 40x magnified). This likely occurred because of the frozen skin together with the low thermal conductivity of the resin inserts, which resulted in a longer melt temperature in the core region propitiating more time for a molecular restructuration.
Table 4 presents the skin thickness of the molded samples. These values were obtained using the image in Figure 6 and the software ImageJ®. The materials of the inserts directly influence the total skin thickness. Higher thermal conductivity in the inserts results in a thicker skin layer. Additionally, within the same timeframe, increasing the thermal conductivity of the mold material leads to a decrease in temperature. This aligns with the established understanding that cooler molds produce thicker skins on the moldings. Conversely, higher mold temperatures allow for a longer period for the material to relax its orientation, thereby reducing the initial size of the oriented skin[4]
A highly oriented outer layer (skin) is formed when the melted polymer contacts the cold mold, which automatically
freezes due to the high-temperature differences resulting in a solid frozen layer[29]. However, in the present work, in the resin inserts even the real temperature was 8% colder than the CuBe ones. When the material entered the mold, the resin inserts propitiated smaller skin than the parts molded by the CuBe inserts. It is suggested that in such cases, due to the elevated total cycle time requested for the resin inserts (which took 5.261% longer), it might signify that the skin is not formed instantaneously, requiring a time interval. Given such time, if the inserts had greater thermal conductivity, it would propitiate a thicker skin. Thus, this may explain why the inserts with higher thermal conductivity and higher temperature at the beginning of the process generated parts with thicker skins.
3.3.2 The formation of the spherulites
Figure 7 shows the core formation of the spherulites. It is noticeable that the size of the spherulites increase from the CuBe compared to the resin inserts. The core of the samples is generally formed by α-type spherulitic crystallization and exhibits a Maltese cross due to the birefringent property of the material.
The size of the skin is influenced by various factors, but its final size is determined by the degree of relaxation
Sample layer CuBe inserts P20 inserts Resin inserts
Outer layer 0.01 mm 0.02 mm 0.19 mm*
Refined layer and high shear 0.16 mm 0.08 mm
Transition zone 0.19 mm 0.17 mm
TOTAL 0.35 mm 0.26 mm 0.19 mm
*The micrograph analysis on the sample injected into a resin insert does not present well-defined layers.
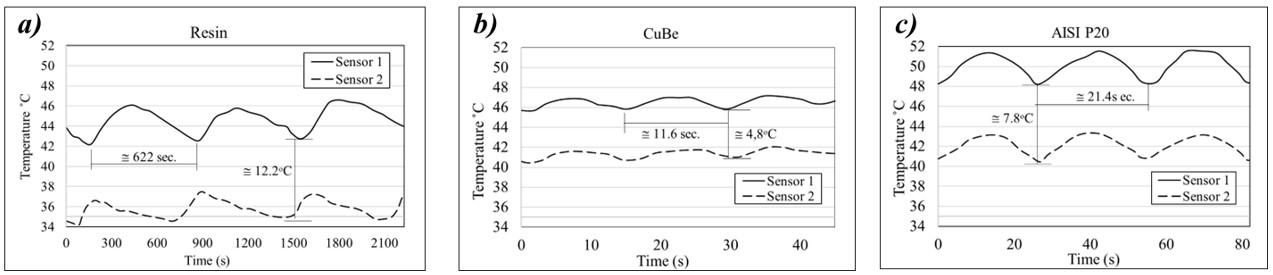
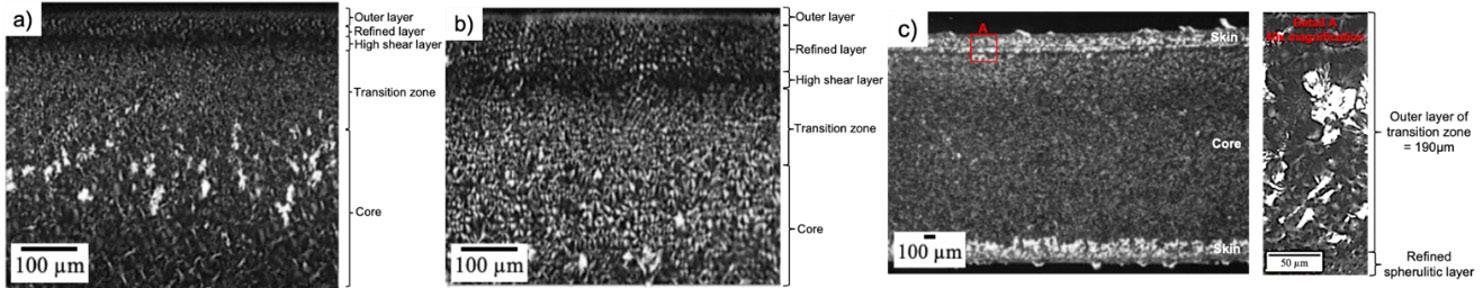
Figure 5. Temperature monitored during the injection process.
Table 4. Layer measurements of P20, CuBe, and resin injected samples by polarized light microscopy.
Figure 6. Micrograph of the injected samples using different insert material: (a) AISI P20; (b) CuBe; (c) Resin.
of stress-induced orientation in the material. A shorter cooling time reduces the period for the material to relax its orientation, thereby increasing the ‘original’ size of the oriented skin[1]
According to Lee and Cha[9], the low mold temperature of the molds’ cavities impedes the growth of the polymer cells during the melting process. A thicker skin can provide higher insulation to the core, and for that reason, the spherulites can grow in the core zone[8] .
However, by conjoining both these conclusions, the study suggests that the thermal conductivity of the mold’s inserts outweighs the importance of mold temperature and skin thickness. CuBe inserts resulted in smaller spherulites despite thicker skin (Table 4), due to rapid solidification caused by high thermal conductivity. Conversely, resin inserts with low thermal conductivity led to spherulite growth despite thinner skin and lower mold temperature. Therefore, when comparing insert materials, thermal conductivity proves more significant in determining spherulite size during formation.
3.4 Warpage analysis
The warpage was evaluated by measuring five positions on the top surface of the workpieces (Figure 8) produced by injection molding using the three inserts’ materials. Considering that the nominal value of the evaluated point is 28.50 mm (Figure 8), for a confidence interval of 95%, the samples injected in the AISI P20 insert presented an average value of 28.49 ± 0.07 mm, CuBe 28.46 ± 0.15 mm, and 28.30 ± 0.14 mm for the resin inserts, as presented in Figure 8a. The expected deformation is depicted in Figure 8b, considering the hotter and colder inserts positioned on the fixed and movable components of the injection machine, respectively.
Firstly, in a general view, the one-way analysis of variance (ANOVA) showed that there is no significative difference (p=0.131) in the parts’ warpage using the different inserts’ materials evaluated in the present work (AISI P20, CuBe, and resin).
Contrary to expectations, resin inserts were anticipated to reduce warpage in parts. However, despite longer cooling
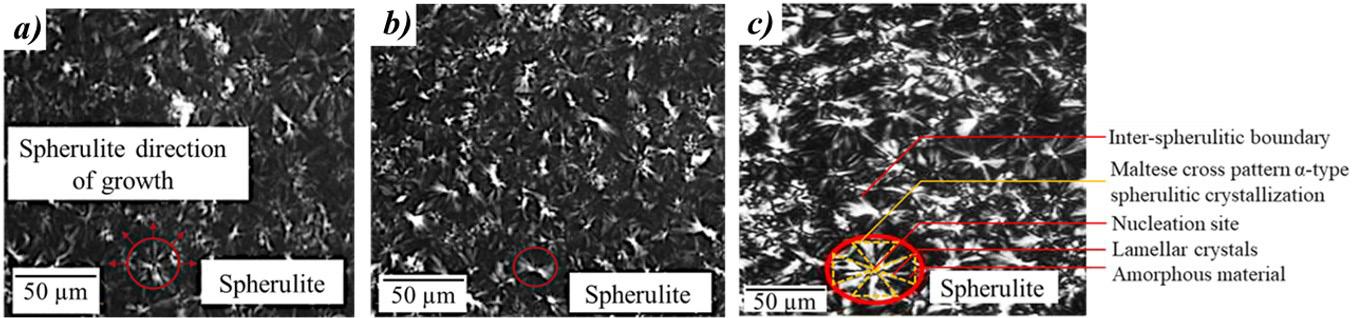
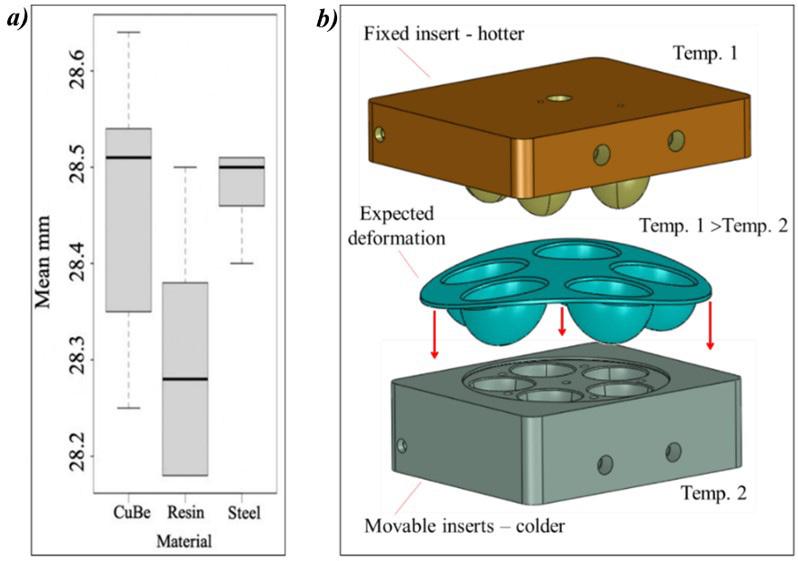
Figure 7. Micrograph of the core of the injected samples showing the spherulite and its characteristics (a) in AISI P20 steel inserts; (b) in CuBe inserts; (c) in resin.
Figure 8. Warpege analysis. (a) Box plot of warpage; (b) expected deformation.
A. F., Howarth, J. L. L., Arendarchuck, B. E., Popiolek, A. M., Treml Junior, C. A., & Kavilha, C.
Table 5. Results of the enthalpy of fusion, degree of crystallinity, modulus of elasticity, and maximum strain of the injected samples.
times for samples produced using resin inserts, warpage tendencies were higher compared to counterparts. This suggests that the core portion of the sample may accumulate more residual stress, exerting a greater influence on warpage. The samples produced by the resin inserts presented smaller skin thickness (about 54% smaller than the CuBe ones), and consequently a larger volume of the core portion, which likely influenced the warpage. Therefore, the volume of the core portion may be the reason why the resin insets, even with a longer cooling time, had the tendency to present more warpages than the others.
3.5 Degree of crystallinity and tensile test analyses
Table 5 shows the degree of crystallinity of samples injected in the present work as well as the young modulus and the maximum strain. The resin inserts produced parts with higher crystallinity and CuBe counterparts with lower crystallinity. This may occur because the resin inserts permitted a longer time of the crystalline temperature inside the mold, which occurred not because of the skin thickness (these samples had smaller skin) but due to the lower thermal conductivity of the resin inserts. The lower thermal conductivity of the inserts permits the polymer molecules to rearrange in an ordered manner within the structure, consequently increasing the degree of crystallinity, as observed in the three cases studied in the present work (the three insert materials).
For the maximum strain, the CuBe inserts presented the lowest values whereas the resin inserts resulted in the highest ones. Evaluating the properties accessed on the samples molded by resin inserts against the CuBe ones, there are: the resin inserts i) increased sizes of the spherulites, ii) a 56% increase in the crystallinity degree, and iii) a 45% reduction in the skin thickness. All these properties increased the maximum strain of the parts manufactured by resin inserts by 12%. From perspective of the skin thickness, a reduction of skin thickness increased the maximum strain. Thus, this may mean that skin thickness can represent a weak structure, based on the maximum strain evaluation. The thinner the skin, the more material is required in the core portion of the part.
Considering the young modulus, firstly, the larger spherulite structure found in the core of the molded parts using the resin inserts (Figure 7c) may contribute to reducing the young modulus due to the lower number of secondary bounds among the spherulites, in comparison with the structure observed on the samples produced by the others inserts. Secondly, all the refined skin layers were formed, in this work, on the polymer flow direction during the filling stage and is coincident with the direction
of the traction for the tensile tests (Figure 4). This is likely in relation to the young modulus. The thinner the skin, the lesser young modulus are present. This fact can be verified by the samples molded by the resin inserts.
4. Conclusions
This study explores the influences of the materials used to manufacture injection molding inserts, focusing on either reducing the molding cycle time or the time and costs to manufacture the inserts (rapid tooling). To do so, three pairs of inserts were manufactured: i) the ordinary AISI P20 (as a reference), ii) CuBe alloy (due to reduce molding time by its high thermal conductivity), and iii) ReniShape resin (savings on the manufacture of the mold for small batch production of plastic parts, rapid tooling). These three pairs of inserts were used for injection molding in the PP parts. The mold manufacturing and the injection molding process were assessed, and the properties of the molded parts were examined using these different mold materials.
Key findings include a 46% reduction in injection molding cycle time with CuBe inserts compared to AISI P20. In contrast, Marin et al.[28] found a reduction of about 36% in cycle time using injection molds with conformal cooling channels manufactured by additive manufacturing technology (high cost/time). Thus, the results observed in the current study hold significant potential for using CuBe inserts to reduce the costs and requirements associated with additive manufacturing process. Despite minimal temperature variations (5-8 °C), skin thickness dynamics, spherulite formation, and unexpected warpage tendencies were observed. The study suggests using CuBe inserts and outlines future research directions. CuBe inserts yield smaller spherulites due to rapid solidification and high conductivity.
The use of alternative resin Renishape reduced more than 50% the machining time of the mold`s inserts, on the other hand, it increased 2,800% in molding cycle time. In the plastic parts, the resin inserts promoted spherulite growth due to lower conductivity and gradual cooling of the melt.
Regarding the skin thickness, the resin inserts yield thinner skins. The longer cycle time required by the resin inserts suggests that the skin formation may not occur instantaneously, requiring a time interval. If the inserts had higher thermal conductivity, it could lead to thicker skin formation. This explains why inserts with higher thermal conductivity and temperature at the beginning of the process produced parts with thicker skins.
The ANOVA analysis showed no significant warpage difference among AISI P20, CuBe, and resin-insert parts. Contrary to the literature, longer cooling times in resin-insert samples led to a higher warpage tendency, possibly due to thinner skins causing a larger core volume and concentrated residual stress.
Suggested future work: (1) Use computational simulation to analyze the impact of mold inserts on part properties; (2) Evaluate wear resistance in different insert materials; (3) Conduct a comprehensive cost-benefit analysis of CuBe inserts versus molds with additive manufacturing (SLM) conformal cooling.
5. Author’s Contribution
• Conceptualization – Adriano Fagali de Souza; Janaina Lisi Leite Howarth.
• Data curation – Bruno Edu Arendarchuck; Alexandre Mateus Popiolek; Claudio Antonio Treml Junior; Crislaine Kavilha.
• Formal analysis – Bruno Edu Arendarchuck; Alexandre Mateus Popiolek; Claudio Antonio Treml Junior; Crislaine Kavilha.
• Funding acquisition – Adriano Fagali de Souza; Janaina Lisi Leite Howarth.
• Investigation – Bruno Edu Arendarchuck; Alexandre Mateus Popiolek; Claudio Antonio Treml Junior; Crislaine Kavilha.
• Methodology – Adriano Fagali de Souza; Janaina Lisi Leite Howarth.
• Project administration – Adriano Fagali de Souza; Janaina Lisi Leite Howarth.
• Resources – NA.
• Software – Bruno Edu Arendarchuck; Alexandre Mateus Popiolek; Claudio Antonio Treml Junior; Crislaine Kavilha.
• Supervision – Adriano Fagali de Souza; Janaina Lisi Leite Howarth.
• Validation – Bruno Edu Arendarchuck; Alexandre Mateus Popiolek; Claudio Antonio Treml Junior; Crislaine Kavilha.
• Visualization – Bruno Edu Arendarchuck; Alexandre Mateus Popiolek; Claudio Antonio Treml Junior; Crislaine Kavilha.
• Writing – original draft – Adriano Fagali de Souza; Bruno Edu Arendarchuck; Alexandre Mateus Popiolek.
• Writing – review & editing – Adriano Fagali de Souza; Bruno Edu Arendarchuck; Alexandre Mateus Popiolek.
6. Acknowledgements
The authors would like to thank The National Council for Scientific and Technological Development (CNPq) for the doctorate scholarship and the Fellow Researcher Funding (306438/2021-6), and the Fundação de Amparo a Pesquisa e Inovação de Santa Catarina (FAPESC) for the financial support of this research.
7. References
1 Chen, J.-Y., Tseng, C.-C., & Huang, M.-S. (2019). Quality indexes design for online monitoring polymer injection molding. Advances in Polymer Technology, 2019, 3720127 http://doi.org/10.1155/2019/3720127
2 Marin, F., Souza, A. F., Ahrens, C. H., & de Lacalle, L. N. L. (2021). A new hybrid process combining machining and selective laser melting to manufacture an advanced concept of conformal cooling channels for plastic injection molds. International Journal of Advanced Manufacturing Technology, 113(5-6), 1561-1576. http://doi.org/10.1007/s00170-021-06720-4
3 Bozdana, A. T., & Eyercıoğlu, Ö. (2002). Development of an expert system for the determination of injection moulding
parameters of thermoplastic materials: EX-PIMM. Journal of Materials Processing Technology, 128(1-3), 113-122 http:// doi.org/10.1016/S0924-0136(02)00436-3
4 Brito, A. M., Cunha, A. M., Pouzada, A. S., & Crawford, R. J. (1991). Predicting the skin-core boundary location in injection moldings. International Polymer Processing, 6(4), 370-377 http://doi.org/10.3139/217.910370
5 Farotti, E., & Natalini, M. (2018). Injection molding: influence of process parameters on mechanical properties of polypropylene polymer: a first stud. Procedia Structural Integrity, 8, 256-264 http://doi.org/10.1016/j.prostr.2017.12.027
6 Altaf, K., Rani, A. M. A., Ahmad, F., Baharom, M., & Raghavan, V. R. (2016). Determining the effects of thermal conductivity on epoxy molds using profiled cooling channels with metal inserts. Journal of Mechanical Science and Technology, 30(11), 4901-4907. http://doi.org/10.1007/s12206-016-1055-z.
7 Viana, J. C. (2004). Development of the skin layer in injection moulding: phenomenological model. Polymer, 45(3), 993-1005 http://doi.org/10.1016/j.polymer.2003.12.001
8 Karger-Kocsis, J., & Bárány, T. (Eds.). (2019). Polypropylene handbook: morphology, blends and composites. Switzerland: Springer http://doi.org/10.1007/978-3-030-12903-3
9 Lee, J. J., & Cha, S. W. (2006). Characteristics of the skin layers of microcellular injection molded parts. PolymerPlastics Technology and Engineering, 45(7), 871-877 http:// doi.org/10.1080/03602550600611768
10 Baltes, L., Costiuc, L., Patachia, S., & Tierean, M. (2019). Differential scanning calorimetry: a powerful tool for the determination of morphological features of recycled polypropylene. Journal of Thermal Analysis and Calorimetry, 138(4), 23992408 http://doi.org/10.1007/s10973-019-08679-7
11. Strömberg, E., & Karlsson, S. (2009). The design of a test protocol to model the degradation of polyolefins during recycling and service life. Journal of Applied Polymer Science, 112(3), 1835-1844. http://doi.org/10.1002/app.29724.
12 Rizvi, S. J. A. (2017). Effect of injection molding parameters on crystallinity and mechanical properties of isotactic polypropylene. International Journal of Plastics Technology, 21(2), 404-426 http://doi.org/10.1007/s12588-017-9194-3
13. van Renterghem, J., Dhondt, H., Verstraete, G., De Bruyne, M., Vervaet, C., & De Beer, T. (2018). The impact of the injection mold temperature upon polymer crystallization and resulting drug release from immediate and sustained release tablets. International Journal of Pharmaceutics, 541(1-2), 108-116 http://doi.org/10.1016/j.ijpharm.2018.01.053 PMid:29409747.
14 Suplicz, A., Szabo, F., & Kovacs, J. G. (2013). Injection molding of ceramic filled polypropylene: the effect of thermal conductivity and cooling rate on crystallinity. Thermochimica Acta, 574, 145-150 http://doi.org/10.1016/j.tca.2013.10.005
15 Sperling, L. H. (2005). Introduction to physical polymer science Hoboken: John Wiley & Sons. http://doi.org/10.1002/0471757128.
16 Cowie, J. M. G., & Arrighi, V. (2007). Polymers: chemistry and physics of modern materials Boca Raton: CRC Press http://doi.org/10.1201/9781420009873
17 Menges, G., Michaeli, W., & Mohren, P. (2001). How to make injection molds Munich: Hanser
18 Fernandes, A. C., Souza, A. F., & Howarth, J. L. L. (2016). Mechanical and dimensional characterization of polypropylene injection moulded parts in epoxy resin/aluminium inserts for rapid tooling. International Journal of Materials & Product Technology, 52(1-2), 37-52 http://doi.org/10.1504/ IJMPT.2016.073618
19 Beal, V. E., Erasenthiran, P., Ahrens, C. H., & Dickens, P. (2007). Evaluating the use of functionally graded materials inserts produced by selective laser melting on the injection moulding of plastics parts. Proceedings of the Institution of Mechanical
Souza, A. F., Howarth, J. L. L., Arendarchuck, B. E., Popiolek, A. M., Treml Junior, C. A., & Kavilha, C.
Engineers. Part B, Journal of Engineering Manufacture, 221(6), 945-954 http://doi.org/10.1243/09544054JEM764
20 Apacki, K. C. (1995). Copper-alloy molds provide cycle time and quality advantages for injection molding and resin transfer molding (SAE Technical Paper, No. 950566). Warrendale: SAE International. doi:http://doi.org/10.4271/950566
21 Kelly, A. L., Mulvaney-Johnson, L., Beechey, R., & Coates, P. D. (2011). The effect of copper alloy mold tooling on the performance of the injection molding process. Polymer Engineering and Science, 51(9), 1837-1847. http://doi.org/10.1002/pen.21975.
22 Marques, S., Souza, A. F., Miranda, J., & Yadroitsau, I. (2015). Design of conformal cooling for plastic injection moulding by heat transfer simulation. Polímeros, 25(6), 564-574 http:// doi.org/10.1590/0104-1428.2047
23. Huzaim, N. H. M., Rahim, S. Z. A., Musa, L., Abdellah, A. E., Abdullah, M. M. A. B., Rennie, A., Rahman, R., Garus, S., Błoch, K., Sandu, A. V., Vizureanu, P., & Nabiałek, M. (2022). Potential of rapid tooling in rapid heat cycle molding: a review. Materials (Basel), 15(10), 3725 http://doi.org/10.3390/ ma15103725 PMid:35629751.
24 Huntsman Advanced Materials. (2007, June 3). RenShape® 5166: datasheet. Switzerland: Huntsman Advanced Materials Americas Inc.
25 American Society for Testing and Materials – ASTM. (2022). ASTM D638-22: standard test method for tensile properties of plastics West Conshohocken: ASTM International
26 Kong, Y., & Hay, J. N. (2003). The enthalpy of fusion and degree of crystallinity of polymers as measured by DSC. European Polymer Journal, 39(8), 1721-1727. http://doi.org/10.1016/ S0014-3057(03)00054-5
27 Ujhelyiová, A., Horbanová, Ľ., Petková, M., Ryba, J., & Annus, J. (2019). Polypropylene crystallisation in the presence of inorganic additives. Fibres & Textiles in Eastern Europe, 27(2), 30-38 http://doi.org/10.5604/01.3001.0012.9984
28 Marin, F., Miranda, J. R., & Souza, A. F. (2018). Study of the design of cooling channels for polymers injection molds. Polymer Engineering and Science, 58(4), 552-559 http://doi. org/10.1002/pen.24769.
29. Callister, W. D., Jr., & Rethwisch, D. G. (2018). Materials science and engineering: an introduction Brisbane: John Wiley & Sons
Received: Jan. 02, 2024
Revised: Mar. 28, 2024
Accepted: May 08, 2024
The role of thermoactive binders in the structuring of composites
Meiyu Shao1* , Andrii Bieliatynskyi1 , Viacheslav Trachevskyi2 , Shilin Yang3 and Mingyang Ta1
1School of Civil Engineering, North Minzu University, Yinchuan, NingXia, P.R. China
2Institute of Macromolecular Chemistry of the National Academy of Sciences of Ukraine, Kyiv, Ukraine
3Department of Computer Technologies of Construction and Reconstruction of Airports, Faculty of Architecture, Civil Engineering and Design, National Aviation University, Kyiv, Ukraine
*shaomy1994@163.com
Obstract
Thermoactive binders are the most widely used form of polymer matrix materials in modern composites. In the production of composites, thermoactive binders are the basis of the matrix structure formation process with different properties. Various thermoactive binders based on epoxy, polyester and other resins compatible with corresponding polymer matrices were examined in the article. The influence of binders on the pre-molding process, various properties of the products, including density, stability and water permeability, as well as the main characteristics of composite materials obtained by various methods, was considered. The most optimal thermoactive binder (epoxy resin) were determined. The influence of thermoactive binders was shown and the advantage of using thermoactive binders in the production of composites was proved on the example of bitumen asphalt.
Keywords: thermoactive binder, polymer, composite, composite matrix, structure formation.
How to cite: Shao, M., Bieliatynskyi, A., Trachevskyi, V., Yang, S., & Ta, M. (2024). The role of thermoactive binders in the structuring of composites. Polímeros: Ciência e Tecnologia, 34(2), e20240024. https://doi.org/10.1590/01041428.20230102
1. Introduction
Within modern materials science research and technological innovation, composite materials have become vital for a wide range of industrial and scientific applications. Their unique properties, combining the advantages of different components, make them particularly relevant for solving a variety of engineering problems. The prerequisite for the emergence of thermoactive binders in modern composite materials was the creation of synthetic resins and fibers. Between 1870 and 1890, a revolution in chemistry occurred, and synthetic (technogenic) resins were developed that could be converted from liquid to solid via polymerization. These polymeric resins are converted from a liquid state to a solid state by cross-linking of molecules. The first synthetic resins were bakelite, celluloid, melamine, polystyrene, phenolic resins, and polyester. World War II shifted the composite industry from research to real production[1]
In recent decades composite materials have become widely used in many industries, including aviation, automotive, construction, and medical industries. One of the key aspects of composites is binders, which determine the quality and properties of the final product. In this context, thermoactive binders play an important role in the structuring of composites, providing not only strength, but also resistance to external factors[2]
Binders in composites play a key role in determining the quality, strength and structure of the final material. However,
among the binders, a special place is occupied by thermoactive binders, which provide not only an effective connection of the components of the composite, but also allow to control the process of forming the material[3]. Thermoactive binders are a key element in the structuring composite materials, achieving optimal characteristics and properties of the final product. These binders tend to be activated at certain temperatures, allowing them to react and connect the components of the composite, forming strong and stable bonds[4]
The large-scale use of thermoactive binders in polymer composite materials began in the 1970s. Due to the combination of their opposite properties (high strength but low density), polymeric composites began to compete with steel and other metal products[5]. However, the process of replacing metal products with composites was slowed by the high cost of materials used in their manufacture[6]
The use of thermoactive binders made it possible to create polymer composites with a number of properties, owing to which they were widely used, namely: low viscosity of solutions, high adhesion, and relatively low curing temperatures. When choosing a binder, it is essential to take into account quite conflicting requirements which provides the possibility of obtaining various products as follows: a combination of high strength and heat resistance, cracking resistance under impact load and the necessary processability[7]
Shao, M., Bieliatynskyi, A., Trachevskyi, V., Yang, S., & Ta, M.
Therefore, in addition to assessing the performance of the binder (mechanical properties, heat resistance, dielectric properties), it is necessary to take into consideration its technological properties (viscosity, temperature, curing rate, gelation time). Given the variety of thermoactive binders, it became necessary to consider their correct use in the production of polymer composite materials. One of the central advantages of thermoactive binders is their self-reaction properties under the influence of heat, which allows for efficient structuring of the material without the need for additional chemicals[8]. This makes the production process more efficient and cost-effective. Apart from that, thermoactive binders can be easily adapted to a variety of processing and manufacturing conditions, facilitating control and optimization of composite materials formation. This makes them feasible in the production of large and complex structures where precision and stability are important.
In general, the use of thermoactive binders in the structuring of composites presents new prospects for the development of modern materials with improved mechanical properties, stability, and durability. Thus, a thorough research in this area can lead to the creation of new materials that will meet the requirements of modern industrial production and provide effective solutions for a variety of technical tasks.
Based on the prospect of the wide use of thermoactive binders, the study of the influence of binders on the structure of the composites and its properties is a topical issue[9] Consequently, the aim of the research is to analyze the influence of thermoactive binders on the structure formation of composites. To that end, the following tasks must be accomplished:
1. Examine the types of thermoactive binders;
2. Analyze the influence of thermoactive binders on the structuring of composites;
3. Determine optimal types of binders for the structuring of composites;
4. Consider the practical impact of optimal thermoactive binder on the composites.
This article is aimed at specialists in the field of materials science, chemistry and engineering, as well as at anyone interested in the development and use of new materials with improved properties.
2. Materials and methods
2.1 General characteristics of thermoactive polymers
Thermoactive polymers are substances consisting of solid glass-like and non-fusible elements. They have the spatial structure of molecules and the ability to solidify when heated. This group of polymers includes phenol formaldehyde, epoxy, polyester resins, and organosilicon polymers[10]
In the initial modelling of polymer binders, the basic requirements were set, namely: the strength and the tendency to uniform distribution in the material used[11] Phenol formaldehyde oligomers are products of phenols polymerization with linear and branched formaldehyde.
Due to the relative low cost, availability of raw materials and a number of valuable properties, these oligomers are widely used in various industries[12] .
The main raw material in the production of phenol formaldehyde resins are phenol and formaldehyde in the form of aqueous solution of formalin. The reaction of phenol to formaldehyde is based on causal and parallel compounds[13]. The properties of the resulting resin depend on their molar ratio and the acidity of the reaction medium. The molar concentration affects oligomer properties. Accordingly, thermoplastic oligomers are called novolacs, whereas thermoactive oligomers are called resols[14] . Phenol-formaldehyde (thermoplastic) polymers are used in the production of composite materials in various areas. Products based on them have high mechanical strength, heat resistance, acid resistance, and do not conduct electricity[15] They are often formed by phenol formaldehyde resins.
Carbonized and graphite phenol formaldehyde materials are widely used as thermal shields in aeronautical and space technology[16]. The active atoms are connected to hydroxyl groups. Resols are formed when an extra formaldehyde is added and bases are present[17]. In order to produce them, a hardener is introduced into the composition of resol oligomers. The resols are solidified and form a spatially cross-linked structure, which in turn forms a new polymer resite[18]
Furan polymers is another type of heterocyclic polymer. Due to the presence of hydroxyl bonds, furan polymers allow the production of highly dense polymers[19]. Furan oligomers are liquids with high viscosity, which can dissolve in alcohol, benzene, and acetones. They are solidified by opening double bonds in furan cycles and can be formed at 120-140 °C with strong acids of organic origin, and at 20-25 °C with sulfate acids[20]
2.2 Epoxy resins
Epoxy resins are polymers whose main macromolecule chains contain epoxy groups or glycide groups. These groups produce a spatial cross-linked polymer. Epoxy resins is the optimum type of binder for the majority of composites with a fibrous structure, due to the following characteristics[21]:
– the high adhesion to a large number of fillers and reinforcing parts;
– the diversity and accessibility of epoxy resins;
– the absence of by-products and small shrinkage rates when curing;
– chemical resistance and good electrical insulation.
Compounds containing epoxy resins molecules are classified as epoxy resins. Interaction of phenols, alcohols, amines with epichlorohydrin form epoxy compounds (oligomers)[22]. In contrast to mono or diane epoxides, polyepoxides have a greater number of epoxy groups. Due to this, they have a higher cross-linking capacity, can withstand higher temperatures after setting solid, and have the properties of hardeners. They are divided into two groups, namely: cross-linking hardeners, which work with groups of epoxide oligomer, and catalytic hardeners
The role of thermoactive binders in the structuring of composites
that are formed during polymerization[23]. The process for cross linking hardeners with amines is shown in Figure 1
The hardener is formed at temperatures of 0-150 °C when reacting with amines. 1,6-hexamethylenediamine and polyethylene polyamine are mainly used with the following Formula 1:
( ) 222222 n HNCHCHNHCHCHNH (1)
where n = 1-4.
These compounds start to react at 20 °C. Aromatic amines are less active and begin to react at 150 °C. Acid hardeners are the aldehydes of carboxylic acids: phthalic, trimellitic, phyromellitic, benzo tricarboxylic anhydride. Their curing occurs at 120-180 °C[24] .
2.3 Organosilicon polymers (polyorganosiloxanes)
Organosilicon polymers contain silicon atoms. They have good frost resistance, light resistance, heat resistance, high water and weather resistance, resistance to weak acids and alkalis[25]. The distinctive property of polyorganosiloxanes is high temperature resistance (up to 400-500 °C), which becomes possible with the unique Si-O bond. The raw materials used for the production of polyorganosiloxanes are monomeric silicon and organic compounds in which the silicon atom is directly connected with organic radicals and with chlorine atoms or alkoxy groups. Among these compounds, alkyl(aryl)chlorosilanes and alkyl(aryl)alkoxysilanes were found to be of the most practical use[26] .
The hydrolytic polycondensation produced by oligoorganosiloxanes has a relatively low molecular mass. They are soluble in hydrocarbons, compound esters, ketones and limitedly in higher alcohols. Oligoorganosiloxanes are thermoactive oligomers capable of curing due to further polycondensation under harsh conditions (at 200-250 °C within 5-10 hours). In the presence of catalysts (Zn, Fe, Sn) curing occurs in 1-1.5 hours at 100-150 °C[27]
The application of three-functional compounds (silanetriol) leads to the formation of spatial non-polar and insoluble polymers. The properties of organosilicon polymers are determined by the composition and structure of the macromolecule main chain and the chemical composition of the lateral groups. Polyimides are polymers that have clusters with cyclic images. Polyimides have a wide range of temperatures (from –270 to 300 °C) and radiation resistance[28] .
Cyanate esters are another equally promising thermoactive polymer matrix that is used in the production of multi-functional polymer composite materials for high-tech industries[29,30] The relevance of using cyanate esters in the creation of polymer materials is explained by the combination of the processability of processing oligocyanates and the unique complex of properties of the produced polymers[31]. It is necessary to note the thermal resistance of polytriazine
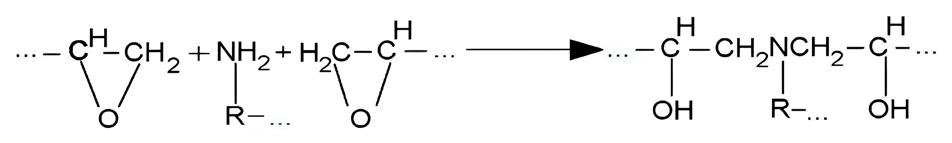
polymer matrices, their excellent dielectric properties, radio transparency, low moisture absorption, dimensionality, resistance to ionizing radiation, low smoke separation and gas permeability[32,33]
2.4 Bisphenol-based epoxy resins
The properties of bisphenol A diglycidyl ether epoxy resins are highly dependent on the length of the polymer chains. The low-molecular epoxy resins are in a liquid state, while the epoxy resins with a high molecular mass may be in a solid or jelly-like form. Bisphenol A diglycidyl ether oligomers usually contain a number of specific hydroxyl groups that play an important role in cure kinetics[34,35]
The novolac resins are produced by condensation of phenol and formaldehyde with an acid catalyst followed by condensation results with epichlorohydrin. The high condensation of novolac resins affects the increase in resin functionality that can be achieved by changing the phenolformaldehyde ratio from 1.49 to 1.72. The formation of novolac resins should occur at 160 °C within 2-4 hours to ensure the formation of a full structure and the release of water vapor as an excess product[36]
The epoxy group in novolac resins facilities high density of transverse bonds. Therefore, the novolac resins have thermal and chemical properties that are ideal for the production of composite glue and the formation of composite matrix. Epoxy resin polymers form a solid, refractory and non-polar mass. The curing process of epoxy resins requires additional substances called hardeners or curing agents[37]. High-performance epoxy resins with low molecular weight will result in high-grade cross-links after curing with amine compounds. Figure 2 shows the chemical structure of amines[38]
The number of hydrogen atoms in an amine molecule determines the functionality of the amine. The main amino group, in which two hydrogen atoms are connected to nitrogen, will react with two epoxy groups, and the secondary amine will react with only one epoxy group. The tertiary amine group that does not have an active hydrogen atom will not react with epoxy groups, but will act as a catalyst that can accelerate the curing process[39]. The advantage of aliphatic amine is that it can cure epoxy resins at room temperature, so it does not require additional energy for reaction.
The second group of amine hardeners require heating during the curing process, which requires not only additional energy, but also cannot be applied for the production of some composites. However, aliphatic amines require a high temperature to obtain a full reaction. The main limitations of the structure formation of epoxy resins with a curing agent are that they cannot form a complete structure at a glass-liquid transition temperature above 120 °C. Aromatic amines require a temperature of 250-300 °C during curing. Many epoxy resins can withstand high temperatures and can therefore be used as a matrix in composites[40]
The epoxy-anhydride thermoactive system typically exhibits low viscosity and long shelf life, low exothermic thermal response and very low shrinkage at high temperature. The curing process takes place slowly at a temperature of 200 °C and is usually catalyzed by a base, acid, tertiary amines or acid compounds[41]. The catalyst concentrate must
Figure 1. Curing process of epoxy oligomers.
Shao, M., Bieliatynskyi, A., Trachevskyi, V., Yang, S., & Ta, M.
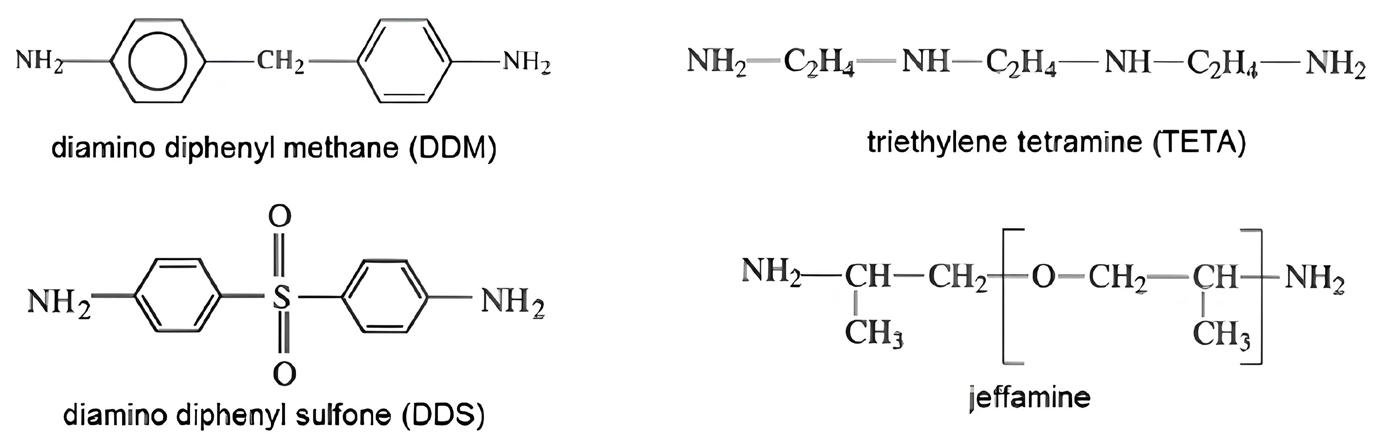
be carefully calculated according to the type of anhydride curing agent to produce an epoxy resin resistant to high temperatures[42,43]. Methods for measuring epoxy resins are commonly used by the halogenic acid reaction to open an epoxide ring and produce halohydrins[44,45] .
The second hydroxyl group is α-glycol, which is formed from the hydrolysis of the epoxy group and phenolic hydroxyl, which is created by the reaction of phenol imperfection in the production of epoxy resins from high-concentration bisphenol A. The concentration of α-glycol may be determined by the Periodic Acid Schiff (PAS) test or by the lithium aluminum hydride test, which reacts only with active hydrogen. Since α-glycol usually appears in small quantities, it is necessary to be careful when measuring the results[46,47]
In epoxy resins based on bisphenol A, chlorides have a destructive effect on electrical properties when they are applied as a semiconductor[48]. The color and reactivity of the resin can also be affected by the presence of chloride. Active chlorides can block thermoactive reactions of epoxy resins during composite formation. When chloride bonds appear in epoxy resins, they reduce the functionality of epoxy resin and its compounds. Components inside the composite become inefficient[49,50]
The connection process can occur with the input of thermal energy, and some of these compounds occur at room temperature (25 °C) due to the mechanism of epoxy resin curing[51]. The curing process of epoxy resin is an essential factor influencing the guaranteed quality and performance of composites[52]. After an analytical review of thermoactive binders in the structuring of composites, it can be concluded that epoxy resins are the most universal binder.
3. Results
In order to study the influence of thermoactive binder from the practical standpoint, it is necessary to consider the influence of epoxy resin on a composite consisting of bitumen-based asphalt concrete. The shape and structure of bitumen depends mainly on its thermal state as well as on external conditions, which determines its ability to transit from a liquid to a solid state and vice versa. The introduction of epoxy resin into the bitumen itself changes its properties and corresponds to the properties of the material it is composed of[53]
By dissolving bitumen in benzene and subsequently washing with hexane, asphaltenes were isolated, dried and weighed after filtration. At the same time, it was empirically determined that when adding epoxy resins to bitumen, the
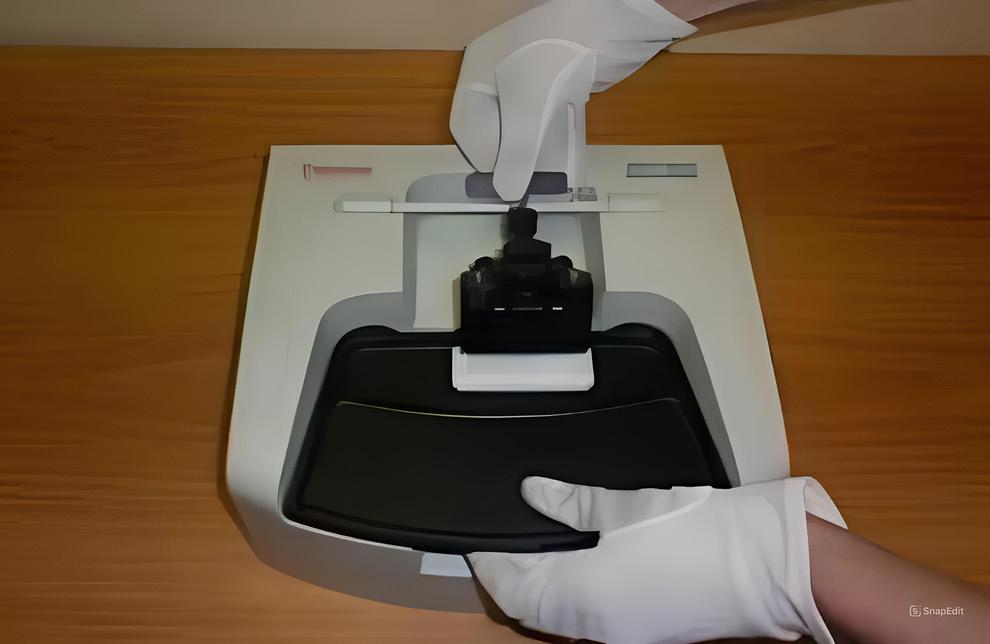
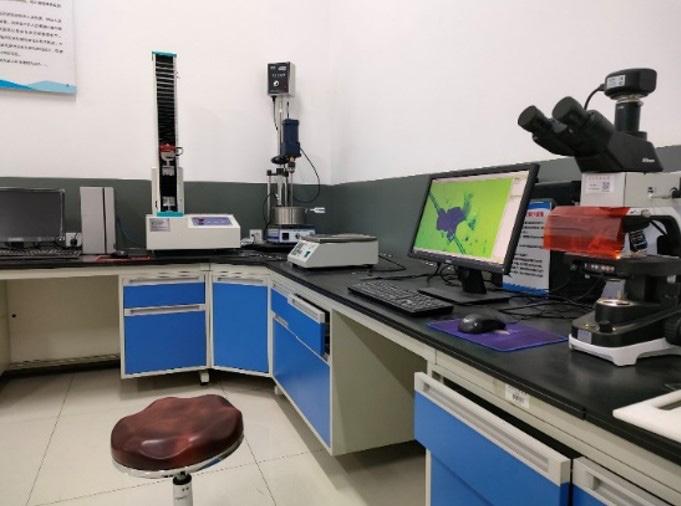
number of asphaltenes increased. The study applied IR spectrographic analysis, using IR-Fourier spectrometer Nicolet-380 and Smart Multi Bounce HATR (Figure 3).
Bitumen without additives showed the range of hydrocarbons, paraffins, oils, deformation oscillations d(CH2)) and 1377 cm-1 (deformation oscillations d(CH3)). Band 720 cm-1 corresponds to free paraffin chains. Stripes 747, 812, and 870 cm-1 showed aromatic formations[54] The experiment was conducted in the specially equipped laboratory (Figure 4) at North Minzu University, China.
The interaction of fiber from the fly ash of thermal power plants with road asphalt bitumen[55] is shown in Figure 5
Figure 2. Chemical structure of amines (hardeners).
Figure 3. Smart Multi Bounce HATR.
Figure 4. The laboratory at North Minzu University, China.
IR-spectrum of samples of bitumen without additives and bitumen containing epoxy resin showed changes in absorption band 1600cm-1. Oscillations in the region of 3050cm-1 of the original bitumen are attributed to valence oscillations of hydroxyl groups OH-. This change shows the rearrangement of the hydrogen bonds that were influenced by the introduction of epoxy resin (Figure 6).
The change in the structural composition after the introduction of epoxy resin can also be observed after
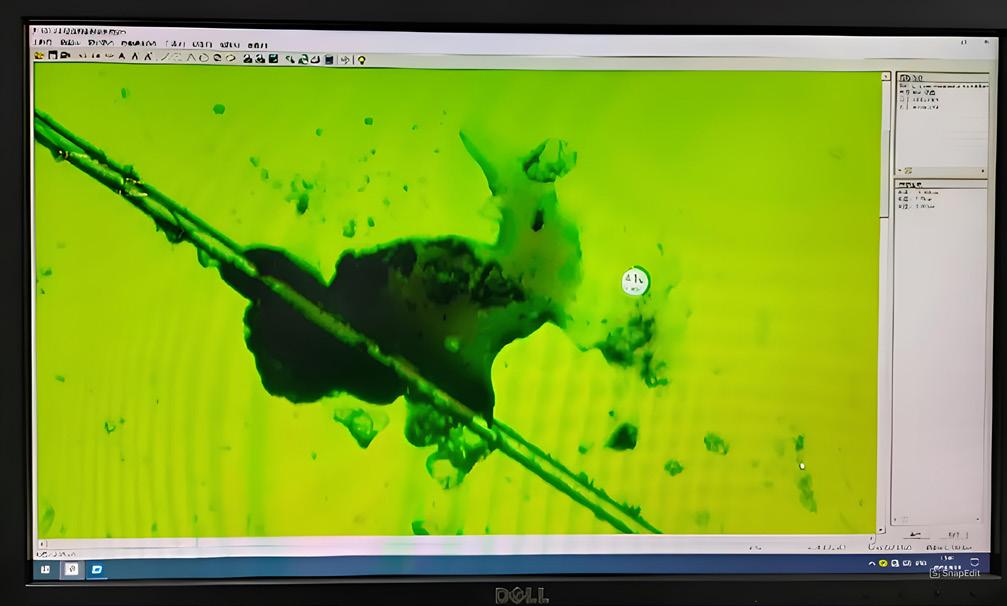
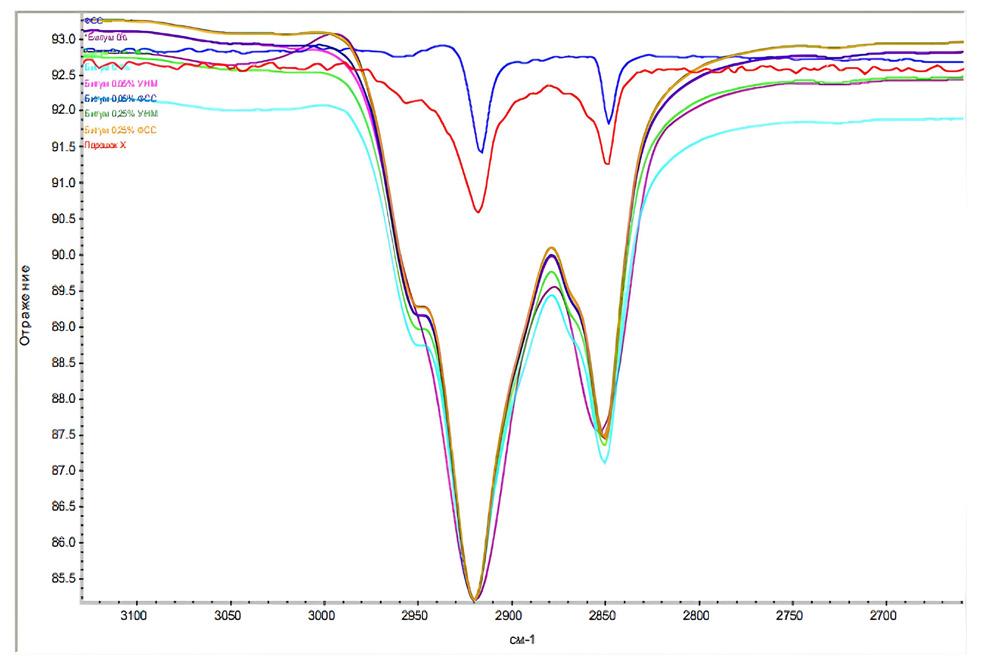
considering the absorption band intensity of modifiable epoxy resins, which were determined by IR spectroscopy (Table 1).
The analysis shows the change of chemical composition of modified bitumen. It can be seen that 2.5% of the epoxy resin content has the greatest influence on the composition. Different percentage ratios of additives and different temperature ranges (from 0 °C to 30 °C) were considered for more precise determination of the amount of epoxy resins necessary for the change of bitumen structure. Other properties of bitumen (both modified and original) were tested via the methods recommended by DSTU 4044[54] Penetration was determined after thermostatic control, which was carried out for 60 minutes in water bath. The activation energy of bitumen (original and modified with epoxy resins) was calculated by the Arrhenius equation.
The activation energy (EA) and the logarithm of preexponential factor is calculated by the Formula 2:
It is graphically represented as the tangent of the angle of inclination straight to the axis of the abscissa (Table 2).
The observed reduction in activation energy at 2.0% of epoxy resin introduction could occur when the hydrogenintermolecular or near-π bonds in the asphaltene molecular subsystem break. The activation energy decreased after less than 2.5% of bitumen was introduced. This may indicate a break of existing links within bitumen and insufficient number of epoxy resin to form new links. Bitumen can be in different states depending on temperature. However, the transition from one state to another depends on a certain temperature. When modifying epoxy resins, bitumen behaves homogeneously at temperature changes, which allows to extend the temperature range in the manufacture of composites and during their subsequent operation[56]
Analyzing the data shown in Figure 7, it is affirmed that the introduction of epoxy resins in the form of a thermoactive binder allows to extend the range of operating temperatures of bitumen, while reducing the temperature of its fragility and
Figure 5. The interaction of fiber from the fly ash of thermal power plants with road asphalt bitumen.
Figure 6. Comparative spectrum of bitumen modification.
Table 1. Absorption band intensity.
Table 2. Definition of the natural logarithm of penetration with the introduction of fullerene-containing modifier.
Shao, M., Bieliatynskyi, A., Trachevskyi, V., Yang, S., & Ta, M.
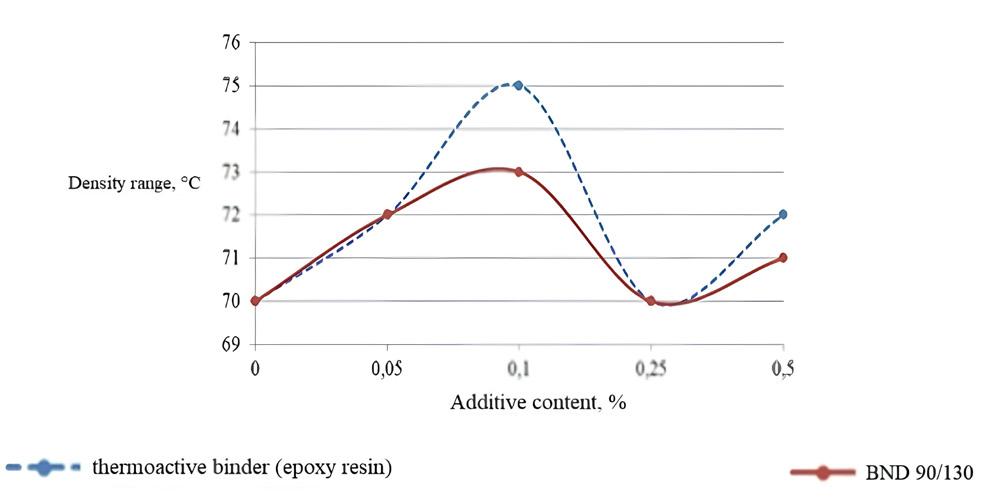
increasing the temperature of its softening. Figure 7 shows that the introduction of 2.0 mass. %. of epoxy resin increases the operating temperature range by 7-10%. The role of epoxy resin as a thermoactive binder consists in the fact that epoxy resin molecules in reactions are energy carriers by attaching radicals to themselves. At the same time, strong bonds are formed around new molecules.
4. Discussion
Epoxy-fibroblastic concrete mixtures are prepared at factories producing asphalt concrete and having epoxy resin and hardeners metering and feeding systems. When preparing epoxy-fibroblastic concrete, the content of the complex binder is up to 10% of the bitumen mass. Partial replacement of bitumen with modifier is possible[57]. The exact content of the epoxy constituents is determined by the selection of epoxy samples with different modifier content based on the results of laboratory tests[58]. The optimal epoxy content of CHS-EPOXY 525 together with the solidifier TELALIT 0800 is 2.5% of the total binder mass. The preparation consists of the following processing steps:
– delivery of BND to the machine for modification and heating up to 125-130 °C;
– step-by-step addition the required amount of curing agent (TELALIT 0800) to BND when mixing;
– combining bitumen with a hardener by mixing for 40-60 min or by passing through the colloid mill (1-2 cycles);
– preparation of a sand-gravel mixture at a temperature of 70-85 °C;
– introduction of bitumen, which contains a hardener, into the mineral mixture with constant stirring;
– introduction to the mixture of mineral powder with constant stirring;
– introduction of epoxy resin (CHS-EPOXY 525) into the asphalt concrete mixture and mixing for 10-15 sec.;
– unloading the epoxy-asphalt concrete mixture from the asphalt mixer into the storage hopper or car.
When preparing epoxy-fibroblast asphalt concrete, it is necessary to strictly adhere to the temperature regime of heating the mineral mixture and bitumen. Over temperature leads to rapid reaction between epoxy and fiber. As a
consequence, the hardening of the mixture and the loss of its plasticity occur because after the repeated dissolution of the mixture, the epoxy is destroyed and the effect of modification is lost).
In case of long-term pauses in the epoxy and fiber feed, and at the end of the working shift, it is necessary to rinse the feed system with organic solvent (toluene) to prevent it from clogging with the polymerized product. After each shift, the asphalt mixer must be thoroughly cleaned of the residue of the mixture by loading the gravel into it and stirring it for 3 minutes, after which the rubble is unloaded from it[59]. The epoxy-asphalt concrete mixtures are placed in the upper layers of pavements on motorways, sections of roads with high traffic intensity, bridges and overpasses, and heavy goods transport parking areas in accordance with the requirements of DBB B.2.3-4 and other normative documents in all road and climatic zones of Ukraine.
5. Conclusions
The main types of thermoactive binders are considered. The analytical review of the studies made it possible to identify the most optimal thermoactive binder in the form of epoxy resins for use in various fields of composite production. The asphalt concrete composition with the addition of epoxy resin as a thermoactive binder was developed. The developed asphalt concrete with epoxy resins showed better deformation and strength characteristics in comparison with the original asphalt concrete.
The use of epoxy resins for bitumen modification was analyzed. Thus, it was proved that the introduction of epoxy resins as a thermoactive binder reduces the number of paraffins by redistributing hydrogen bonds, which results in the formation of benzene rings and new structural elements. When the amount of additive is increased to 2.5% by weight, the epoxy resin is evenly distributed, while thermostability is enhanced. At the same time, the activation energy during the introduction of the epoxy resins forms the non-ferrous films (at the introduction of 2.5%). With less additives, no such structures are formed.
Moreover, the introduction of epoxy resins changes the structure at the macro level, which is confirmed by the increase in plasticity of the composite. It was also established that when used as an additive in the amount of at least 2.5%, the resulting composite epoxy material gains in strength at an increased temperature range. Furthermore, it was determined that the epoxy asphalt concrete preparation requires a hardener that provides a long reaction time with the epoxy resin.
6. Author’s Contribution
• Conceptualization – Meiyu Shao; Shilin Yang; Viacheslav Trachevskyi.
• Data curation – Mingyang Ta.
• Formal analysis – Meiyu Shao; Viacheslav Trachevskyi.
• Funding acquisition - Andrii Bieliatynskyi.
• Investigation – Shilin Yang; Andrii Bieliatynskyi; Meiyu Shao.
Figure 7. Influence of epoxy resins on a change in bitumen plasticity interval.
The role of thermoactive binders in the structuring of composites
• Methodology – Meiyu Shao; Viacheslav Trachevskyi; Mingyang Ta.
• Project administration – Andrii Bieliatynskyi.
• Resources – Andrii Bieliatynskyi; Viacheslav Trachevskyi; Mingyang Ta.
• Software – Meiyu Shao; Shilin Yang.
• Supervision – Viacheslav Trachevskyi.
• Validation – Andrii Bieliatynskyi.
• Visualization – Shilin Yang.
• Writing – original draft – Shilin Yang; Mingyang Ta.
• Writing – review & editing – Meiyu Shao; Viacheslav Trachevskyi.
7. Acknowledgements
The authors gratefully acknowledge the financial support from the Science and Technology Department of Ningxia, the Scientific Research Fund of North Minzu University (No. 2020KYQD40) and China Scholarship Council under Grant (No. 202008100027, No. 202108100024).
8. References
1 Xiao, Z., Liu, X., Harper, L. T., Endruweit, A., & Warrior, N. A. (2020). Modelling the permeability of random discontinuous carbon fibre preforms. Journal of Composite Materials, 54(20), 2739-2751 http://doi.org/10.1177/0021998320902506
2 Widyatmoko, I., & Elliot, R. (2007). A review of the use of crumb rubber modified asphalt worldwide London: Waste & Resources Action Programme.
3 Brissette, R. S. (1962). US Patent No 3063883A. Washington: U.S. Patent and Trademark Office. Retrieved in 2024, April 2, from https://patents.google.com/patent/US3063883
4. Nicolais, L., Borzacchiello, A., & Lee, S. M. (Eds.). (2012). Wiley encyclopedia of composites London: John Wiley & Sons
5 Shim, S.-B., & Seferis, J. C. (1994). Characterization of binder interactions with lightly crosslinked thermosets. Science and Engineering of Composite Materials, 3(3), 191-208. http:// doi.org/10.1515/SECM.1994.3.3.191
6 Fauster, E., Schillfahrt, C., Hueber, C., & Schledjewski, R. (2017). Automated profile preforming for structural components. Science and Engineering of Composite Materials, 24(5), 631650. http://doi.org/10.1515/secm-2015-0377.
7 Dharmalingam, A. S., Hemmer, J., Lectez, A.-S., Binetruy, C., & Comas-Cardona, S. (2018). Evolution of single carbon and glass fibrous tow cross-sections in dry and lubricated states during compaction perpendicular to the fiber. Composites. Part B, Engineering, 148, 235-242 http://doi.org/10.1016/j. compositesb.2018.05.001
8 Yasynska, N. A., Syrmamiikh, I. V., Derevyanko, B. V., Nikolenko, L. M., & Katrych, A. V. (2002). Transformation of the metallurgical industry of Ukraine from the concept “Industry 4.0” to capitalism of stakeholder. Naukovyi Visnyk Natsionalnoho Hirnychoho Universytetu, 2(2), 166-173 http:// doi.org/10.33271/nvngu/2022-2/166
9 Yang, S., Bieliatynskyi, A., Trachevskyi, V., Shao, M., & Ta, M. (2023). Research of nano-modified plain cement concrete mixtures and cement-based concrete. International Journal of Concrete Structures and Materials, 17(1), 50 http://doi. org/10.1186/s40069-023-00601-8
10 Yu, P., Manalo, A., Ferdous, W., Abousnina, R., Salih, C., Heyer, T., & Schubel, P. (2021). Investigation on the physical, mechanical and microstructural properties of epoxy polymer matrix with crumb rubber and short fibres for composite railway sleepers. Construction & Building Materials, 295, 123700. http://doi.org/10.1016/j.conbuildmat.2021.123700.
11 Robertson, F. C. (1988). Resin transfer moulding of aerospace resins: a review. British Polymer Journal, 20(5), 417-429 http://doi.org/10.1002/pi.4980200506.
12 Rohatgi, V., Lee, L. J., & Melton, A. (1998). Overview of fibre preforming. In T. M. Kruckenberg, & R. Paton (Eds.), Resin transfer moulding for aerospace structures (pp. 148-176). Netherlands: Springer Science+Business Media http://doi. org/10.1007/978-94-011-4437-7_6
13 Summerscales, J., & Searle, T. J. (2005). Low-pressure (vacuum infusion) techniques for moulding large composite structures. Proceedings of the Institution of Mechanical Engineers. Proceedings Part L, Journal of Materials: Design and Applications, 219(1), 45-58. http://doi.org/10.1243/146442005X10238.
14 Rimmel, O., Becker, D., & Mitschang, P. (2016). Maximizing the out-of-plane-permeability of preforms manufactured by dry fiber placement. Advanced Manufacturing: Polymer & Composites Science, 2(3-4), 93-102 http://doi.org/10.1080/ 20550340.2016.1260900
15 Ivanov, D. S., White, J. A. P., Hendry, W., Mahadik, Y., Minett, V., Patel, H., & Ward, C. (2015). Stabilizing textile preforms by means of liquid resin print: a feasibility study. Advanced Manufacturing: Polymer & Composites Science, 1(1), 26-35 http://doi.org/10.1179/2055035914Y.0000000006.
16 Shih, C.-H., Liu, Q., & Lee, L. J. (2001). Vacuum-assisted resin transfer molding using tackified fiber preforms. Polymer Composites, 22(6), 721-729. http://doi.org/10.1002/pc.10574.
17 Rohatgi, V., & Lee, L. (2016). Moldability of tackified fiber preforms in liquid composite molding. Journal of Composite Materials, 31(7), 720-744. http://doi.org/10.1177/002199839703100705.
18 Mendikute, J., Plazaola, J., Baskaran, M., Zugasti, E., Aretxabaleta, L., & Aurrekoetxea, J. (2021). Impregnation quality diagnosis in resin transfer moulding by machine learning. Composites. Part B, Engineering, 221, 108973 http://doi.org/10.1016/j. compositesb.2021.108973
19 Schmidt, S., Mahrholz, T., Kühn, A., & Wierach, P. (2018). Powder binders used for the manufacturing of wind turbine rotor blades. Part 1: characterization of resin-binder interaction and preform properties. Polymer Composites, 39(3), 708-717 http://doi.org/10.1002/pc.23988.
20 Evans, R., & Lawton, S. (2006). US Patent No 20060048881A1. Washington: U.S. Patent and Trademark Office. Retrieved in 2024, April 2, from https://patents.google.com/patent/ US20060048881A1/en?oq=20060048881
21 Ball, C. A., Greydanus, S., Swentek, I., & Nara, K. R. (2020). Development of an epoxy carbon fiber reinforced roof frame using the high pressure resin transfer molding (HP-RTM) process (SAE Technical Paper, No. 2020-01-0773). Warrendale: SAE International http://doi.org/10.4271/2020-01-0773
22 Coutandin, S., Wurba, A., Luft, A., Schmidt, F., Dackweiler, M., & Fleischer, J. (2019). Mechanical characterisation of the shear, bending and friction behaviour of bindered woven fabrics during the forming process. Materialwissenschaft und Werkstofftechnik, 50(12), 1573-1587 http://doi.org/10.1002/ mawe.201900074
23. Mack, J., & Mitschang, P. (2015). Efficient and flexible technology for binder roving manufacturing. KMUTNB International Journal of Applied Science and Technology, 8(2), 93-100 http://doi.org/10.14416/j.ijast.2015.03.002
24 Mei, M., Sun, L., He, Y., Li, M., Duan, S., Wei, K., & Yang, X. (2021). Preforming characteristics in compaction process
Shao, M., Bieliatynskyi, A., Trachevskyi, V., Yang, S., & Ta, M.
for fabric with binder under elevated temperature. Composites Communications , 23 , 100545 http://doi.org/10.1016/j. coco.2020.100545
25 Brody, J. C., & Gillespie, J. W. (2005). The effects of a thermoplastic polyester preform binder on vinyl ester resin. Journal of Thermoplastic Composite Materials, 18(3), 157-179 http://doi.org/10.1177/0892705705043535
26 Herbeck, L., Ufer, J., & Pointner, A. (2019). Automated series production of composite components. Lightweight Design Worldwide, 12(1), 12-17. http://doi.org/10.1007/s41777-0180068-y
27 Pantelelis, N., Etchells, M., Lira, C., & Bistekos, E. (2019). Online viscosity and Tg measurement of CFRP manufactured using high-pressure RTM. In Proceedings of the SAMPE Europe Conference 2019 (8 p.). Nantes: SAMPE Europe
28 Gardiner, G. (2014, January 1). Resin-infused MS-21 wings and wingbox. CompositesWorld. Retrieved in 2024, April 2, from https://www.compositesworld.com/articles/resin-infusedms-21-wings-and-wingbox
29 Moser, L., Heide, S., Swentek, I., Schmidt, U., & Seiz, M. (2021). Thermoset technologies for cost efficient production of lightweight composites. In K. Dröder, & T. Vietor (Eds.), Technologies for economic and functional lightweight design (pp. 35-41). Berlin: Springer http://doi.org/10.1007/978-3662-62924-6_4
30 Burns, J. P., & Sanderson, F. T. (1967). US Patent No 3340136A. Washington: U.S. Patent and Trademark Office. Retrieved in 2024, April 2, from https://patents.google.com/patent/ US3340136
31 Bieliatynskyi, A., Yang, S., Pershakov, V., Shao, M., & Ta, M. (2022). Features of the hot recycling method used to repair asphalt concrete pavements. Materials Science Poland, 40(2), 181-195. http://doi.org/10.2478/msp-2022-0021.
32 Rutt, M. (2020). Aspects of material and process optimization for automotive composite production using resin transfer moulding (Doctoral thesis). University of Surrey, Surrey, England
33 Yang, S., Bieliatynskyi, A., Trachevskyi, V., Shao, M., & Ta, M. (2022). Technology for improving modern polymer composite materials. Materials Science Poland, 40(3), 27-41. http://doi. org/10.2478/msp-2022-0027
34 Sakaguchi, K., Minakata, M., Takamori, S., Furukawa, J.-I., & Kono, Y. (1977). US Patent No 4054713A. Washington: U.S. Patent and Trademark Office. Retrieved in 2024, April 2, from https://patents.google.com/patent/US4054713A/en
35 Ishihari, K., & Kaneko, T. (2009). JP Patent No 2009235175A. Tokyo: Japan Patent Office. Retrieved in 2024, April 2, from https://patents.google.com/patent/JP2009235175A/ja
36 Buckley, D. T. (1993). US Patent No 5217654A. Retrieved in 2024, April 2, from https://patents.google.com/patent/ US5217654A/en?oq=5217654
37 Dutta, S., Schmidt-Eisenlohr, C., & Malecha, M. (2019). Fixation with RTM6 makes preforming for dry fiber placement more economical and avoids influence of additional external material. In Proceedings of the SAMPE Europe Conference 2019 (pp. 18-19). Nantes: SAMPE Europe
38. Restuccia, C. L., Hobisch, G., Jacobs, W., & Ponsolle, D. (2020). US Patent No 10655006B2. Washington: U.S. Patent and Trademark Office. Retrieved in 2024, April 2, from https:// patents.google.com/patent/US10655006B2/en?oq=10655006
39 Restuccia, C. L., Hobisch, G., Jacobs, W., & Ponsolle, D. (2018). US Patent No 9920197B2. Washington: U.S. Patent and Trademark Office. Retrieved in 2024, April 2, from https:// patents.google.com/patent/US9920197B2/en?oq=Patent+9920197
41 Schmidt, S., Mahrholz, T., Kühn, A., & Wierach, P. (2019). Powder binders used for the manufacturing of wind turbine rotor blades. Part 2: investigation of binder effects on the mechanical performance of glass fiber reinforced polymers. Journal of Composite Materials, 53(16), 2261-2270. http:// doi.org/10.1177/0021998318824784.
42 Wang, C., Ye, J., Yue, G., Bai, G., Liu, L., & Zhang, B. (2018). Mechanical properties of the cured laminates on the hot-press tackified preforms in vacuum assisted resin transfer molding. Journal of Wuhan University of Technology-Mater. Sci. Ed., 33(1), 242-248 http://doi.org/10.1007/s11595-018-1812-1
43 Patel, K., Potluri, P., Yousaf, Z., & Wilkinson, A. (2019). Multiscale reinforcement of epoxy composites - Use of carbon fibre fabrics coated with an epoxy binder containing MWCNTs for improved interlaminar fracture resistance. Composites. Part B, Engineering, 165, 109-119 http://doi.org/10.1016/j. compositesb.2018.11.100
44. Yang, S., Bieliatynskyi, A., Trachevskyi, V., Shao, M., & Ta, M. (2022). Technological aspects of the preparation of polymer composites of building materials and coatings. Polymers & Polymer Composites, 30 In press http://doi. org/10.1177/09673911221135690
45 Sukanto, H., Raharjo, W. W., Ariawan, D., Triyono, J., & Kaavesina, M. (2021). Epoxy resins thermosetting for mechanical engineering. Open Engineering, 11(1), 797-814 http://doi.org/10.1515/eng-2021-0078
46 Bhudolia, S. K., Gohel, G., Leong, K. F., & Joshi, S. C. (2020). Damping, impact and flexural performance of novel carbon/Elium® thermoplastic tubular composites. Composites. Part B, Engineering, 203, 108480. http://doi.org/10.1016/j. compositesb.2020.108480.
47 Bhudolia, S. K., Perrotey, P., Gohel, G., Joshi, S. C., Gerard, P., & Leong, K. F. (2021). Optimizing bladder resin transfer molding process to manufacture complex, thin-ply thermoplastic tubular composite structures: an experimental case study. Polymers, 13(23), 4093 http://doi.org/10.3390/polym13234093 PMid:34883597.
48 Herzog, J., Wendel, R., Weidler, P. G., Wilhelm, M., Rosenberg, P., & Henning, F. (2021). Moisture adsorption and desorption behavior of raw materials for the T-RTM process. Journal of Composites Science, 5(1), 12 http://doi.org/10.3390/jcs5010012
49. Kummer-Dörner, S., Stusgen, S., Witzel, S., Pusch, J., Schneider, M., & Wohlmann, B. (2017). US Patent No 9540509B2. Washington: U.S. Patent and Trademark Office. Retrieved in 2024, April 2, from https://patents.google.com/patent/ US9540509B2/en?oq=9540509
50 Wei, K., Liang, D., Mei, M., Wang, D., Yang, X., & Qu, Z. (2019). Preforming behaviors of carbon fiber fabrics with different contents of binder and under various process parameters. Composites. Part B, Engineering, 166, 221-232 http://doi.org/10.1016/j.compositesb.2018.11.143
51 Wei, K., Liang, D., Mei, M., Li, M., Yang, X., & Duan, S. (2018). A viscoelastic model of recovery behaviors in preforming process for carbon fiber fabrics with binder. International Journal of Applied Mechanics, 10(10), 1850111 http://doi. org/10.1142/S1758825118501119.
52 Wei, K., Liang, D., Mei, M., Yang, X., & Chen, L. (2019). A viscoelastic model of compression and relaxation behaviors in preforming process for carbon fiber fabrics with binder. Composites. Part B, Engineering , 158 , 1 -9 http://doi. org/10.1016/j.compositesb.2018.09.038
53 NZ Transport Agency. (2014). Epoxy modified bitumen chip seals. Wellington: NZ Transport Agency. Retrieved in 2024,
40 Qianqian, F., & Li, C. (2021). Effect of thermal bonding layers on interlaminar shear strength of laminated composites. Journal of Physics: Conference Series, 1790(1), 012085 http://doi. org/10.1088/1742-6596/1790/1/012085
The role of thermoactive binders in the structuring of composites
April 2, from https://www.nzta.govt.nz/assets/resources/ research/reports/558/docs/558.pdf
54 National Standard of Ukraine. (2019, August 12). DSTU 4044:2019: bitumen oil road viscous: technical specifications. Ukraine: National Standard of Ukraine. Retrieved in 2024, April 2, from http://online.budstandart.com/ua/catalog/doc-page?id_doc=84291
55 Bieliatynskyi, A., Yang, S., Pershakov, V., Shao, M., & Ta, M. (2023). Investigation of the properties and technologies of epoxy asphalt concrete preparation with the addition of fiber from fly ash of thermal power plants. European Journal of Environmental and Civil Engineering, 27(5), 2070-2087 http://doi.org/10.1080/19648189.2022.2110160.
56 Organisation for Economic Co-Operation and Development –OECD. (2005). Economic evaluation of long-life pavements: phase 1. Paris: OECD. Retrieved in 2024, April 2, from https:// www.itf-oecd.org/sites/default/files/docs/05pavementi.pdf
57 Giuliani, P. M., Giannini, O., & Panciroli, R. (2022). Characterizing flax fiber reinforced bio-composites under monotonic and
cyclic tensile loading. Composite Structures, 280, 114803 http://doi.org/10.1016/j.compstruct.2021.114803
58 Bongiorno, F., Militello, C., & Zuccarello, B. (2022). Mode I translaminar fracture toughness of high performance laminated biocomposites reinforced by sisal fibers: accurate measurement approach and lay-up effects. Composites Science and Technology , 217 , 109089 http://doi.org/10.1016/j. compscitech.2021.109089
59 Vinod, A., Tengsuthiwat, J., Gowda, Y., Vijay, R., Sanjay, M. R., Siengchin, S., & Dhakal, H. N. (2022). Jute/Hemp bio-epoxy hybrid bio-composites: influence of stacking sequence on adhesion of fiber-matrix. International Journal of Adhesion and Adhesives, 113, 103050. http://doi.org/10.1016/j. ijadhadh.2021.103050
Received: Apr. 02, 2024
Revised: May 13, 2024
Accepted: May 18, 2024
São Paulo 994 St. São Carlos, SP, Brazil, 13560-340
Phone: +55 16 3374-3949
Email: abpol@abpol.org.br
2021