
63 minute read
TABLE 5 THE SMCA DESIGN FOR THE EVALUATION OF TOD IN OUR CASE STUDIES/ BASED IN MALCZEWSKI 1999 MODEL. SOURCE: AUTHOR’S ELABORATION ON THE METHOD USING OUR CRITERIA AND STEPS


Table 5 The SMCA Design for the evaluation of TOD in our case studies/ Based in Malczewski 1999 model. Source: Author’s elaboration on the method using our criteria and steps
5.4 Indicators of TOD
Advertisement
As the complexity of urban systems is formed by the synergistic integration of vital components, meaningful combination of various components is possible to get insight into the urban condition. A paradigm shift in how urban indices such as density, FAR, and so on are evaluated will be achieved by using this method. Subsystems are characterized by physical traits and configurations and used to analyze the relationship between urban morphology and energy consumption, as well as environmental performance. As a result of this design strategy, the goal is to create a more environmentally friendly and efficient city (Mitchell M. , 2009).
As with any other system, a building's components and subsystems are complex. A thorough understanding of the spatial and temporal extents of cities, as well as their expansion tendencies, is essential in order to effectively monitor and map urban growth as well as build efficient urban planning strategies. Some instances of urban expansion include the redevelopment of existing built-up areas at a higher density, the infilling of residual open space, and the creation of greenbelt land around urban centers.
As an example, we have used Spatial Multicriteria Analysis in our case studies to extract data from Arlington, Virginia's open data platform (https://gisdataarlgi.opendata.arcgis.com/datasets/ArlGIS::arlingtoncountyboundarypolygon/explore?filters=eyJDT1VOVFkiOlsaN)and other locations. As part of our example, the planning unit breaks up the essential data into the four polygons (polygon 158, polygons 168, polygon 142, polygon 112) in order to retrieve it (the smallest division unit within the area). Finally, the collected and filtered data was overlay and (clipped) divided by infrastructure axes (common division mode applied in many countries). This information has been compiled into one database (virtual space within GIS for data management) and analyzed based on FAR, Density, Proximity to Transit, Proximity to CBD, and Permeability (walkable
148
space) calculations in each part region. A normalization value specified in Arlington; Virginia's technical report was used for the final data transmission.
Each of our case studies, such as Portland, Oregon(https://gispdx.opendata.arcgis.com/search?tags=development),Vienna,Austria (https://www.eea.europa.eu/data-and-maps/data/eea-reference-grids-2/gisfiles/austria-shapefile), and Copenhagen, Denmark (https://freegisdata.org/place/), followed this predetermined procedure Table nr. 6, hows the four Matrix of Comparison sent for each of our scenarios, which serves as a foundation for our best-case scenario comparison and contrast with our Tirana local case study.
Table 6 The criteria of evaluation of the case studies with the normalization value defined by the Arlington, Virginia case Source: Authors own elaboration based on the Arlington, Virginia development strategy.
149
6 CHAPTER SIX – CASE STUDIES
6.1 TOD in US Cities / Europe, Case studies
Case studies entail a methodical and in-depth examination of a single example, which is frequently constrained by its geographical location. There is already an abundance of TODs in North America, and examining them all would take considerably longer than the time allotted for this research endeavor. As a result, an inquiry was conducted on a small number of TODs that were previously regarded "successful." However, this concept's introduction into Europe is not novel or surprising.
The current body of knowledge measures TOD performance according to the number of design components present in the neighborhood, such as high density and a mix of uses. As previously stated, a TOD may contain the majority or all of these components but fail to capitalize on its proximity to public transportation.
6.2 An enquiry of the motivation after TOD
This study analyzed four TOD projects in two distinct contexts: the US TOD (taking into account the rationale for the concept's evolution from US experience) and the European TOD as a response to urban growth, utilizing eight distinct types of urban design assessment tools to evaluate existing TOD guidelines and reformulate a series of "best practices" for urban design.
150
The case studies that serve use as “best case” are chosen to demonstrate the components of TOD into different context, starting from Allington, Virginia, Portland Oregon that represent cities developed though TOD interventions and European case studies were TOD was not the main focus, such as Copenhagen, Denmark but influenced greatly into their planning continuity and development, the case of Vienna as an European experience was based on the components of TOD, with a focus on walkability, services and long-term sustainability. The differences between our case studies:
Geographical location: Two of our case located in the US cities (Arlington and Portland), studies represent the “classic” TOD implementation, thought its components. The European case studies of Vienna and Copenhagen represent an entirely different context in planning approach and development. An important component to consider is that the US case studies since before the implementation of the components had a great reliance on car-oriented transport, in the case of European cities due to historical development and origin of the urban planning have a considerable shift in public transport.
Period: The case studies are always a work in process due to the dynamic urban development, however the US case studies provide historic data since they started the implementation of the TOD as early as the 1970’s, the European Case of Copenhagen started in the 1947’s, however the plan is always in development and adaptation and was recognized as TOD intervention in the late 80’s with the expansion of the western corridors. The case of Vienna provides a newly incorporation since the plan started its conception in 2010 and was officially published in 2015.
Land Use: The case of Arlington and Portland are mainly commercial uses; the case of European TOD are more residential uses.
In addition to this component the case studies have been viewed into different perspectives and components as well, such as the mixed-use level in the areas, walkability index measured by the 10 mile walk or 500-meter radius as translated
151
into our study, the proximity to central services, the density and the open space ratio. In general, this concentrated research on urban components related to TOD identifies a variety of themes and topics that are both significant in and of itself and also offer concerns for future research.
6.3 Arlington, Virginia TOD
6.3.1 The overall expectations from the development of TOD
Arlington's prominence as a county has increased since the 1970s, owing in part to its proximity to Washington, DC. Realizing a specific aim, such as increasing the demand for higher-density structures in areas near public transit and urban centers, is essential. Develop a pool of developers with previous experience building higher-density mixed-use projects in suburban settings. By incorporating high-quality architecture into urbanstyle structures, you may increase public acceptance of them. Participate in the creation of new places and the building of a sense of belonging in your community.
Arlington's primary goal was economic development and growth control in order to protect low-density communities, but the initiative also had positive environmental effects from decreased private vehicle use. For all journeys, public transit usage is doubled, cycling is tripled, and walking is six times higher than in the rest of the area. In comparison to adjacent suburban areas, total vehicle miles driven per capita in the transit corridor is slightly lower. (D. A, 2000)

Figure 14 Arial view of the Arlington Rosslyn-Ballston corridor Source: Google Maps, January 2021
152
Arlington's successful transition to transit-oriented development was not without its challenges, especially in terms of improving the station areas' pedestrian design. Even though the TOD principles upon application improved the overall area, the increase of public transport within the area was more related to design of walkable spaces and the number of people living within the range of the walkable distance near the stations. Improved pedestrian design, such as uninterrupted and direct sidewalk access and a healthy atmosphere to drive through, may help to reduce private vehicle usage even further. Private sector investment in transit-oriented growth in Arlington was promoted by the county's long-term planning, which was matched with public infrastructure and urban design investment incentives. High-density development was encouraged within a 0.4-kilometer walking radius of Metro stations, and mixed-use development, which combined industrial, retail, and residential uses in the same building or location, was encouraged.
6.4 Translating TOD
”High-density construction was encouraged within a 0.4-kilometer walking radius of Metro stations, and mixed-use development that combined industrial, retail, and residential uses in the same building or area was encouraged” . (Cervero R. , Land Use Mixing and Suburban Mobility, 1988) ”Infrastructure, public amenities, and urban design upgrades were funded by the county and the private sector, demonstrating the value of public-private partnerships. Arlington exemplifies how transit-oriented development can be built and coexist with traditional automobile-oriented development” . ”The system will be a hybrid underground/commuter railway, dubbed Metro today. Arlington will have ten stations, five of which would be located along a three-mile, failing commercial corridor that stretches from Rosslyn to Ballston (RB) in the county's northern part” .
153
”The decision did not guarantee TOD, however, as some residents banded together to push for the preservation of low-density communities along the corridor by planning park-and-rides at each stop” . The county listened to their concerns and developed a General Land Use Plan (GLUP) that would limit the highest densities to a walking distance from each station.
6.5 Why a successful TOD
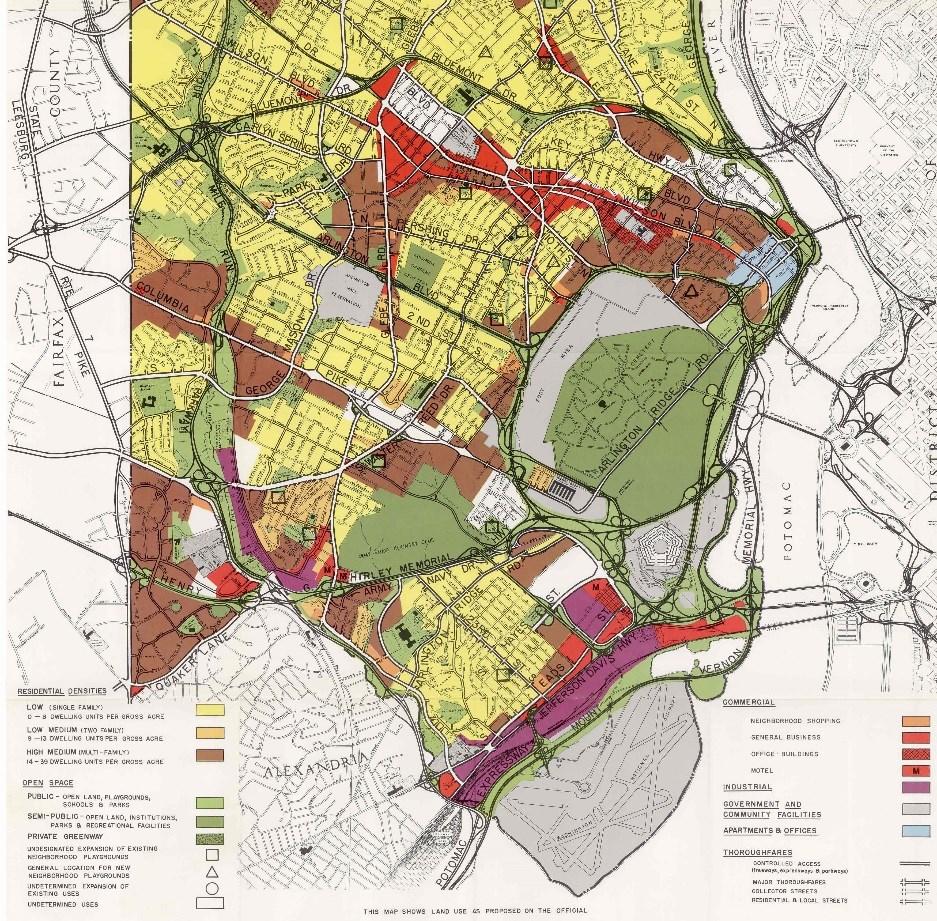
Figure 15 The Arlington’s General Land Use Plan map Source: Arlington county General Land Use Plan document, June 30, 2018 /https://arlingtonva.s3.duals tack.us-east1.amazonaws.com/wpcontent/uploads/sites/31/20 17/02/GLUP_Booklet_Dece mber_2016_final.pdf
The Rosslyn-Ballston corridor, which is home to some of the country's most popular TODs, is one of the busiest transit lines in the area. The area has developed into a booming business district and a lively downtown where people want to live and work. These TODs are thriving urban centers surrounded by a dense network of transitfriendly neighborhoods, and they serve as excellent examples of what TOD policy can accomplish. One of the main reasons why the Rosslyn-Ballston corridor is a model for TOD success is because of its high transit ridership. (Brinklow, 2010)
154
Ridership was also strong along the Rosslyn-Ballston route, which includes many station areas, and has almost double of percentage of ridership that the region according to US census bureau publication of 2008. Since 1980, office construction along the Rosslyn-Ballston corridor has exploded, transforming the area into a Class-A office market.
The retail business in Rosslyn-Ballston has also performed exceptionally well. Currently, the transit corridor contains half of all retail space in the county. Market Common, a mixed-use center adjacent to Clarendon Station, was built in response to this trend to draw shoppers to the city. As a result, retail in the RosslynBallston corridor is doing exceptionally well, thanks to the large number of customers who live, work, or commute through the city. In the transit corridor, housing has also performed exceptionally well. What was once a low-density industrial thoroughfare has become a mixed-use, high-density corridor.

Figure 17 ”Arlington County’s Smart Growth Journey, Rosslyn – Ballston Corridor a compare sent between 1979 and Today, Source: 2017 American Planning Association National Planning Achievement Award for Implementation” . ”http://www.pgplanning.org/DocumentCenter/View/9199/Article-onArlington-County-SGJRB-Corridor-9-18”
Rosslyn, Ballston, and Clarendon are all communities with a deep sense of belonging. Clarendon Alliance, for example, is a neighborhood group that brings together residents and business owners to address issues in the community and promote the area to other areas. The three TODs along the Rosslyn-Ballston corridor that were sampled are all highdensity, mixed-use centers. All station construction must include dense, mixed-use developments in compliance with the General Land Use Plan to ensure that each station has its own sense of community.
155
6.6 Portland, Oregon
6.6.1 The overall expectations from the development of TOD
”Many of Portland's planning strategies are seen as models in other cities. Rezoning land adjacent to light rail stations to build new mixed-use development has been a key policy for the Portland area” . ”A New Urbanist initiative was followed in many Portland cases, resulting in wellconnected, pedestrian-friendly streets and a diverse mix of housing, retail, and civic uses” . ”Portland's downtown station areas have a high level of intensity, the region's nondowntown station areas have a low level of intensity” . ”Notably, there appears to be a strong distinction between the intensity of Portland's core station areas” (in blue, which includes the Portland Streetcar) and the intensity of the region's non-core station areas (in green, clustered in the chart's lower left corner). ”Portland Metro's Transit-Oriented Development Program was the first in the country to be granted permission to use federal transportation funds to purchase land for renovation next to a light rail station in 1998”. This program was used to develop Metro's 2040 Growth Concept, which emphasized transit villages and main streets. (County, 2008)

Figure 18 Arial view of the Portland, Oregon TOD topologies Source: Google Maps, January 2021
”Orenco Station is a New Urbanist neighborhood in Hillsboro, Oregon, located just 15 miles west of downtown Portland”. Orenco's growth started in the 1980s, when
156
the city made a deliberate planning decision to attract high-tech industrial development, such as Intel, NEC, Fujitsu, and Toshiba, to the area. Pac Trust, an industrial and commercial developer, bought the Orenco Station lands and developed the entire area around the MAX light rail station. Orenco Station is one of the most widely cited TOD examples today, but there is much controversy about its popularity. As a result, while transit ridership is comparable to that of other popular TODs, the surrounding area continues to be car-centric. Hillsboro agreed to construct more than the minimum necessary parking spaces after Pac Trust, which owns land near the station, negotiated with them. Pac Trust also built parcels nearest to the highway system first, while owning land on both sides of the station. Neighborhoods are built in a way that resembles small urban communities, with residents interacting and participating in community activities. Orenco Station's architecture follows this concept, with homes with narrow side yards rather than the traditional suburban big backyards. It is hoped that by reducing the amount of private space and increasing the amount of public space, more leisure time would be spent in shared spaces, resulting in more interaction. Furthermore, pedestrian-friendly streets and sidewalks connect to the main town center, where residents can get to know their neighbors and socialize in a central location. Many of the design concepts developed by TOD pioneers were adopted by Orenco Station. (Carlton, 2014)

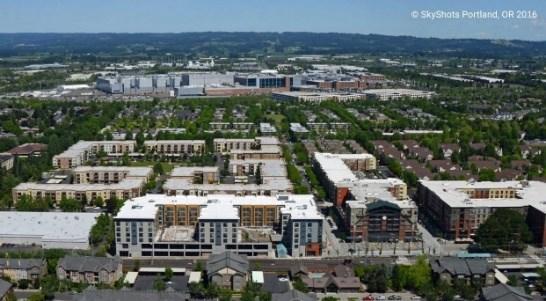
Figure 19 Portland TOD Corridor development Source: A CNU Journal by Robert Steuteville in May. 2, 2018. https://www.cnu.org/publicsquare/2018/05/02/connected-and-walkable-suburb
Higher densities were chosen in particular to establish a typical urban neighborhood that would benefit from its proximity to public transportation. Orenco seems to do
157
better in some areas than others. Many of the TOD design features are present: high densities, vertically mixed uses, and higher ridership than the rest of the country. Orenco Station, on the other hand, is still a car-dependent neighborhood, with massive surface parking lots and suburban-style shopping malls. Given the fun walking experience, residents still prefer to drive their vehicles, despite the site's proximity to public transportation. ”Typologies have recently become a popular method for structuring short- and longterm investments in transportation communities in many cities and regions across the country” . ”A TOD typology is a way of classifying and distinguishing the region's many transit-rich neighborhoods by grouping them together based on key common characteristics” .
6.7 TOD in European experience 6.8 Copenhagen, Denmark
6.8.1 The overall expectations from the development of TOD
Two factors characterize the capacity for growth and transformation: the attractiveness of the urban environment as a dynamic state, and the various drivers of urban change as processes. The growth of distinct communities and identifiable cityscapes that are represented as urban characteristics. Orestad is a linear new town in Copenhagen that will be developed over the course of 30 years around stations on an elevated, driverless mini-metro line. ”The construction of the Copenhagen Metro was to be funded by the selling of publiclyowned property along the route to developers” . Since the internationally renowned 1947 Finger Plan, Copenhagen has had a 60-year track record of transit-oriented growth.

158

Figure 22 Copenhagen finger plan development, Greater Copenhagen plan 2005
The main principle of this plan: Access to green space, Urban development to follow transport, Proximity to natural spaces, Development linearly, Densification and mix use, Transit nodes for transport, Overlap Multimodal transports., multi-center development, Center not for cars, Long-term development
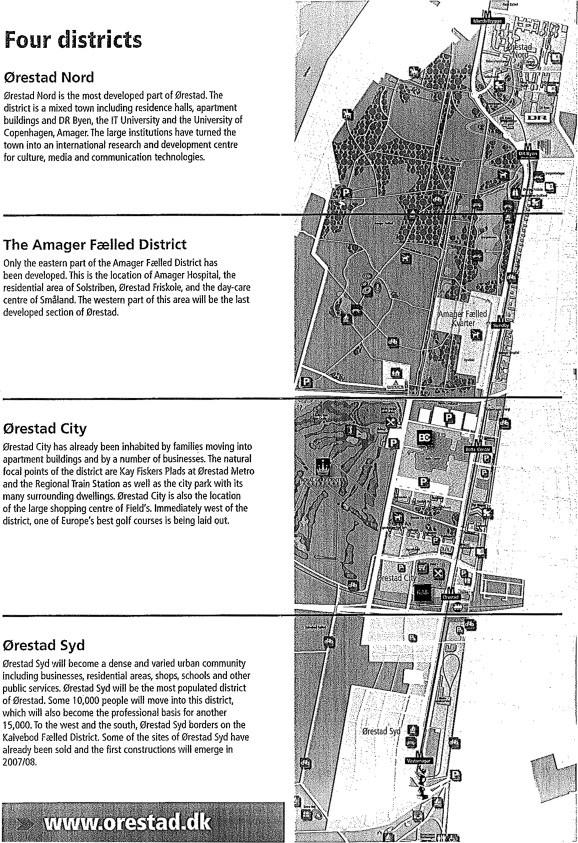
Figure: 28 Four main districts of TOD corridor development in the extension of Copenhagen Finger plan, Source: Copenhagen plan revision 2018 https://www.ovpm.o rg/wpcontent/uploads/201 8/09/copenhagueda nemark.pdf
6.9 Vienna, Austria
6.9.1 Findings from the case studies we reviewed
159
TOD (transit-oriented development) is a strategy that promotes the use of public transportation by designing and developing dense, pleasant, and walkable urban environments. TOD is concerned with synchronizing urban life - its growth and development, daily activities, and mobility patterns - with public transportation networks in a wider sense.

Figure 29: Venna Step plan 2030, The develop ment corridor of the south, Vienna step plan 2012
6.10 Spatial analyses
The Spatial analyses will start with the scale of implementation, in a spatial comparison set between our four case studies, considering seven main criteria for each case in relation to the case implementation, giving us access to almost 30 parameters.
These parameters translated into spatial analyses maps, have been translated into a spatial dimension of 500-meter radius (in accordance of TOD components and Leon Krier distance of walkability), considered with the main notes implemented into the TOD projects, from design to implementation. TOD was conceived to be a flexible concept, each city, region or state can develop it according to need and context. There are no set rules and development does not have a standard process.
160

Figure 14 The 10 miles radius of the area considered for the index measurement within the node, map from Arlington Virginia scale 1:8000, Source Authors creation
The considered criteria started by classifying the scale into three main groups, starting from the first group the radius defined the measurement starting from the center of the node. The second group followed the same practice increasing the radius to 500 meters.
”Taking into consideration services within the area into the two different type radius groups, considering travel accessibility the density index” , ”proximity into the central districts area, FAR parameters, and LUC parameters” . ”These indicators will eventually provide a well-rounded comparison with all case studies providing some similarities and unveiling essential components of applying the TOD indicators and how” . ”Grengs (2004) demonstrated a method to measure changes in transit accessibility on one neighborhood from Buffalo and another from Rochester”, New York by developing a gravity model using Geographic Information Systems (GIS).
”This method separated the combined spatial effect of shifts in land use patterns and transit service” . ”The results were obtained in the form of a dimensionless neighborhood accessibility index (NAI) and were compared at two points in time” ,
161
1990 and 1997. ”NAI was based on proportional coverage, frequency factor, travel time and employment within walking distance of transit stop” (Equation 2.13). ”A variable was used to represent the share of accessibility change attributable to transit” .
”The accessibility was found to vary due to different causes, in Buffalo case it improved because of changes in transit service while in Rochester study, accessibility improved because of changes in land use ”. The analysis was mainly for transit dependent poor people who live in inner–city neighborhoods. It may not be obvious why spatial data requires special treatment and why substantial research in transport planning still applies non-GIS based data analysis, despite acknowledging that it is addressing inherently spatial processes. Given the relatively recent diffusion of GIS technologies and analytical tools, research has relied on concepts of distance, adjacency, neighborhood, and network (Figure 8), without questioning the relationships between attributes and the spatial location.
As described by Harvey (2008 p. 629), it is the “mechanistic approach that ignored the spatial, temporal, and individual interdependencies among transportation, land use and population”, which “has left a legacy of urban areas with seriously inappropriate land use and transportation systems.” Brown’s (2008) investigation of land-change dynamics, integrating survival analysis with GIS, presents urbanization as a unidirectional land-use transformation process, driven by a complex array of factors (Zhang, 2001). Once the land has been developed, the infrastructure is expected to last for decades (at least) and land-use changes may result in rigid, highly inflexible frameworks that are constraining opportunities for future modifications. The minute human actions have sculptured a new urbanized face of the earth, the resultant transformations, such as the core settlement and economic fabric and intertwined transport network, continue to dominate human life in perpetuity and represent nearly irreversible influences.
162
”The effects of Detroit’s fall in the 1950’s made it an example of a disarticulated planning process, with disruptive effects on the functioning of the city until the present day” . ”Create new market comparable for higher density buildings near transit and urban centers. Cultivate developers with expertise in higher density mixed-use buildings in suburban settings” . ”Increase acceptance of urban style buildings through high quality design” . ”Carry out placemaking and contribute to local identity as a result of the TOD Program, six projects, ranging from small to large, have been completed” .
Portland, Oregon14
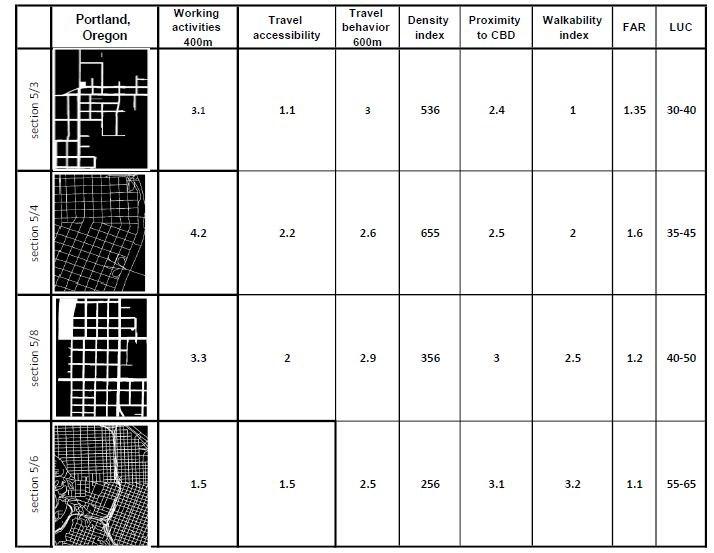
Table 7 Portland Oregon Matrix of data overlay using SMCA Source: authors own elaboration
The first set of parameters started the same for all the considered case studies from the Portland Case study (Table nr. 7) to Vienna, considering our choice of
14 the 1755 Lisbon earthquake, more recently the 2010 and 2011 Canterbury earthquakes in New Zealand or earthquake
related events, such as the Tsunami impacting the east coast of Japan in 2011; the emerging response to sea level rise triggered by climate change for many low-lying cities around the world
163
methodology the corridor of development was divided into 1 mile matrix which divided the area into 1 mile * 1-mile squares. The areas were the starting point for the multicriteria analyses, using GIS and particularly ArcMap we created a model that involved nine parameters that were initially, picked apart from our database of each case study based into the national database of each country. These initial data have both measured into the geographical dimension on the database, compering these data with the data extracted from the national plan and the institute of statistics of each country, updated no less than 5 years from the extraction of the data. After each parameter was compared and identified it was represented into our geographic space with a basic component of GIS, a shapefile.
The Database was then created as a merger of each data from each category and each case study into the matrix comparison, within the model measuring the derivate data of each parameter (such as FAR= Total surface of build environment* number of flours /Sub-traction area of subdivision within the general plan).
Each Section was compared within the area and between the two scales of implementation and translated into a scale of implementation. Starting from the lowest value (for example the concentration working activities within the 400 meter of proximity and the number of activities within the 1*1 mile of initial square, and later from the section of the 1 mile’s radius to the 400-max limit of the walkability possible valued at 0,1,2,3 etc.) to the heights value not going over our comparison setting scale of 10 point indicating the max of value from the model, subtracting the total of the max value from the matrix and adding our valued scale.
The purpose of this matrix is to understand the value of each component and how each component finds its place within the overall project applicability by quantifying the data representing the physical development of each component in the geographic scale of a unit of 1 mile with 1 mile considering the walkability index and development of the corridor depth.
164
The tables set below represent the translation of the data into our case studies and our finding, from each component and the role they play in the overall development of the TOD corridor.
We must consider that even though the selected case studies are quite different in origin, implementation and development. This selection was quite intentional since the theory has such a wide application and the context of application is very diverse but also represents two different cultures of applications. The American based case studies have a different approach to the data and translation of the components, even though the basic components find their application into all our case studies.
Arlington, Virginia

Table 8 Arlington, Virginia Matrix of data overlay using SMCA Source: authors own elaboration
165
Copenhagen, Denmark
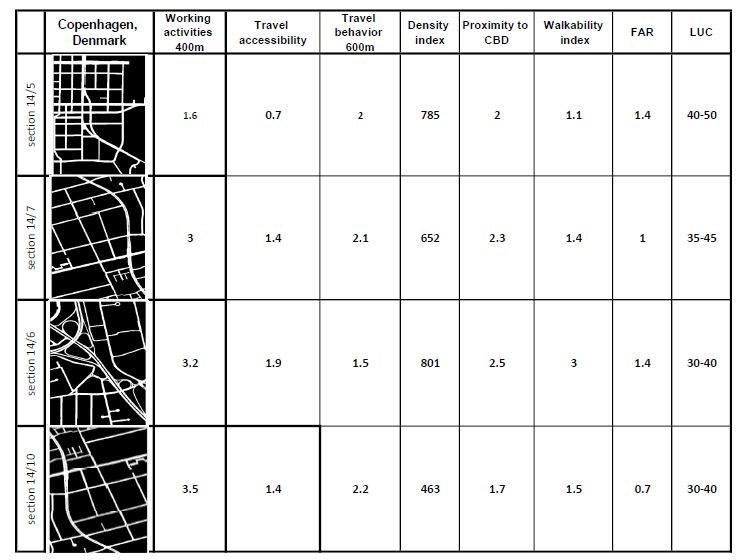
Table 9 Copenhagen, Denmark Matrix of data overlay using SMCA Source: authors own elaboration
166
Vienna, Austria
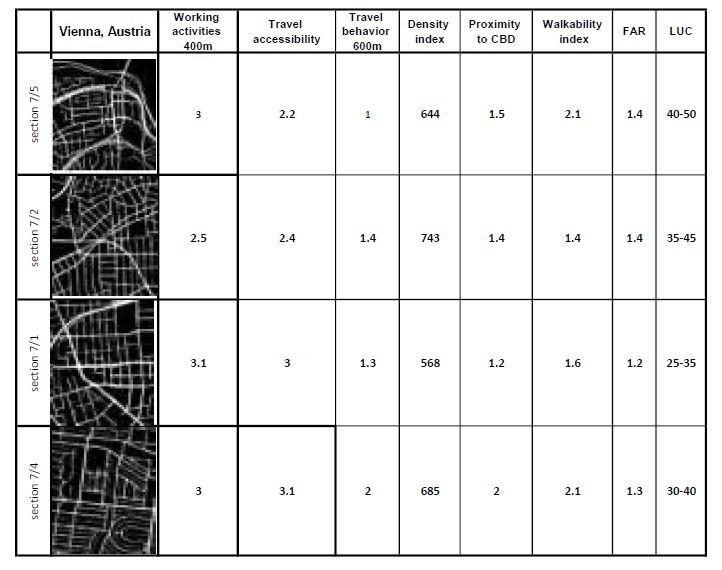
Table 10 Vienna, Austria Matrix of data overlay using SMCA Source: authors own elaboration
”The matrices above depict the universe of activities in which the TOD Program currently invests, and in which it could invest more significantly in the future if additional funding is available” . ”Each of the matrices is used to distinguish between activities that are core to the program, activities that are more incidental to the program, and activities where the program personnel only provide assistance to other agencies” .
The use of the Spatial multicriteria analyses in our case studies is based on the data platform from each of our selected areas particularly we have accessed their national open data database to extract the country data in the case of Arlington, Virginia(https://gisdata-arlgis.opendata.arcgis.com/datasets/ArlGIS::arlingtoncountyboundarypolygon/explore?filters=eyJDT1VOVFkiOlsiNTEiXX0%3D&locatio n=38.877561%2C-76.962900%2C11.00), this data has been selected in structured
167
query language (SQL) to retrieve only data that corresponds to our four sections within the administrative boundaries of Arlington. In retrieving the necessary data in our case (polygon 158, polygon 168, polygon 142, polygon 112) these areas are divided by the planning unit (the smallest division unit within the area). The collected and filtered data have than been overlayed and (clipped) separated by main axes of infrastructure (common division mode applied in many countries). Finally, this data have been incorporated into a single Database (virtual space within GIS to manage data), and have been measured according to the calculations of FAR, Density, Proximity to transit, Proximity to CBD and Permeability (walkable space) within each section area. Finally, the end data have been transplanted using the normalization value found in the Arlington, Virginia technical report of the plan. This process followed this designed step for each of our case studies, Portland, Oregon (https://gis-pdx.opendata.arcgis.com/search?tags=development), Vienna, Austria ( https://www.eea.europa.eu/data-and-maps/data/eea-reference-grids-2/gisfiles/austria-shapefile)(https://www.wien.gv.at/stadtplan/en/)Copenhagen, Denmark (https://freegisdata.org/place/51139/) in order to provide valuable input for our case study compare sent as best case scenario. The conclusion of these data was extracted into four Matrix of compare sent for each of our cases (see Figure 11), providing the bases for our best-case scenario to compare and contrast with our local case study of Tirana later on.


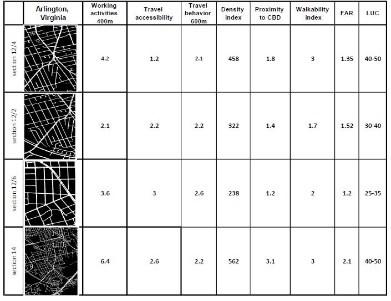
Figure 11 The Data Matrix for the compare sent of our case studies
Source: Authors own elaboration
168 Main Findings Working activities| services need to be very close (20%-30%) within the 400–500-meter distance Travel accessibility should be between 3-5 high Travel behavior need to be between from 100500 so any indicator between the 1-5 is acceptable
Density index should be high between 0.05-0.07 to accommodate the services allocation Proximity to CBD is not primary but it can be between 350-500 m or even higher. FAR is established by the plan, by default the FAR needs to be high in the high-density areas.
In addition to our findings from the Spatial Multi criteria analyses, as part of the literature analyses, we have also created a matrix of the definitions of the Transit oriented development within each plan of our case studies in order to establish how TOD components have been incorporated into the plan. The matrix divides the information into main components present in the plan rhetorical description and the regulatory document that reflect the development criteria, the second components are components that are present, however not in all our case studies equally and there for have been categorized as secondary importance components, the third components are components that are present however they do not play a decision making role they are represented as goals or undirect objectives within the plans. The fourth and final components are complementary components that support the application of our first and second components though steps and guideline, or as spaces such as (strategic documents) for these components to take place.
Definition
Important components Secondary components
Third components Supporting/Policies/ Instruments
Arlington /Virginia
High and mid density
Around Transit
Mixed uses Preserve and reinvest in neighborhood
Enhance open space
Pedestrian and Bicycle environment Expending Travel options Strategic Planning Instruments
Future Traffic trends
catalyze private development
Portland/Oregon
mixed-use buildings
existing conditions
corridors according to market readiness Guide future investments Strategic Plan
Strategically Target Program
169
Copenhagen, Denmark
Vienna/Austria
mixes residential and commercial
maximizing access to public transport optimizing the use of land Regional Planning
hubs
mixed-use development
Car-restrictive measures
building a completely new district secure long-term
value capture
growth in public transport
new development corporation to manage and act as planning authority for future regeneration
Strategic Plan
maximizing access to public transport Increasing quality of life
Table 11 The Matrix created to evaluate the components of TOD as conclusion from our case study analyses of each of the case studies of Allington, Portland, Vienna, Copenhagen. Source: Authors own elaboration
While the TOD framework provides a general guide to the types of investments that are suitable in each station area and corridor segment, those types of investments must be tailored to the unique circumstances of each station area and corridor segment. Some aspects of TOD implementation” , ”such as affordable housing construction, land acquisition, mixed-use and sustainable living facilities, and job uses, may need to be weighed against local market conditions and genuinely supportive local stakeholders” ,
”as evidenced by direct donations, abatements, SDC credits or discounts, and tax increment financing” .
170
7 SEVENTH CHAPTER- COMPERATIVE ANALYSES
TIRANA
7.1 Setting the stage | Tirana
Due to historical, political, cultural, and social factors, Albania's planning process has undergone many changes and challenges. All of these problems reshaped the planning methods and tools that are currently in use. Despite the fact that these improvements improved the planning platform, many of the instruments remain static and inflexible, rendering the planning process even more complex and, in some cases, ineffective. During the socialist period, the planning process was highly centralized. There was no definition of private property. All belonged to the state, so everything had to be carefully planned to achieve a particular goal. The design process was part of a larger effort to standardize architecture, lifestyle, and planning tools. The regulatory plan, which was very strict, was the main instrument in the planning phase. Its main function was to regulate and define centralized political initiatives. Having said that, we can see a strong distinction between two separate planning methods during this time span (the timeline refers to the pre-90’s and after the 90’s as two key timelines).
The first was the massive construction of new cities from the ground up with a predetermined number of inhabitants with no differences between them and regardless of their surroundings, something very common for the cities build during the socials time in Albania (pre 90’s).
171
Albania was an example of a stable economy and growth at the start of the 1990s. Economic shifts, as well as cultural and urban transformations, resulted from the radical changes in the political regime. The two most important development requirements at the time were: The sprawl of main cities and the large concentration of settlements this phenomena started after the 1997 and lasted till almost the end of 2007.
Transportation challenges, solutions, and innovation stand as the main focus in the development agenda of cities today. As cities change, grow and become more complex, so do their needs and transport planning approach. The Transport Sector in Albania before the 90s was developed in line with the needs of the economy, focusing more on industrialized areas and areas with intensive agriculture and less on urban centers as a result of their expansion. Transportation was a state monopoly. After changing the system of government public transport as well as many other sectors and changed. The quality of its service decreases, creating a state of limitation in the lives of citizens. The transport sector after the 90s was developed dynamically. Despite the changes nowadays, our country is far from the standard of European Union countries. Main cities like Tirana are almost in chaos and people must spend hours to travel short distances, despite efforts to introduce alternative means of circulation.
Shift began in 1993, when the parliament passed the 7693 nr. Law “For Urbanism,” which aimed to establish, many reforms in the planning process, though many amendments were made to the same law from 1994 to 1997 (R.Toto, 2010).
The slow awakening of the state's lack of control and the lack of a proper planning system created a void in the country's management and planning, which was clearly reflected in the lack of measures and regulations to address the phenomenon of informal growth. The planning process was in disarray, and the planning tradition remained stagnant, with few planning instruments. The turning point in the creation of a new structure occurred in 2006, when, in response to external pressures and community-based organizations, the initiation of a document for territorial policies
172
began, with help from The United States Agency for International Developmen, USAID (The decentralization process).
7.2 Tirana | Transport Condition and Study
”Tirana is the current capital of Albania and the largest city in the country” . Mobility preparation is a critical component of this study's structure. As a result, we will divide Tirana's mobility planning progress into three phases, each reflecting critical changes in the country's overall development as well as historical changes that influenced social, economic, and territorial changes. The mobility planning process did not include any new infrastructure, instead focusing solely on the reconstruction of existing roads. From 2000 to 2005, it was time to reconstruct by investing in new and improved infrastructure. This new approach resulted in the advancement of national infrastructure (improving Albania's connectivity with its neighbors) as well as an increase in city mobility planning. The reorganization of public transit networks in 2006, which was accomplished by public-private partnerships, increased the efficiency of city mobility planning. The majority of Tirana's infrastructure is of the radial kind. The infrastructure is in good shape and consists primarily of primary roads, but since the city's rapid growth, a significant number of informal settlements have expanded the infrastructure into tertian roads.
7.3 Urban Development and Land use
The countries transition from a centralized economy to a market-based one has influenced many spheres including transportation, were it experienced a shift from the single centralized institutions that planed based on economic and uniform territorial connections “Central place theory” (Christaller, 1966) to long-term objectives and territorial cohesion planning. The new Tirana urban legislation will serve as a good starting point for a new set of town planning rules, which the country urgently requires. Regardless of the variations that may occur, the drafting of this new regulatory plan as a mechanism and in collaboration with many
173
specialist agencies and other concerned groups and communities is likely to be successful and not liable to raise concerns. The future of Tirana is a challenge that depends on the contribution of its people, the position of communities, private sector, and the leadership of the public administration, based on lessons learned from previous urban planning, current urban phenomena, and new proposed urban plans for Tirana Region (as outlined in this Guide). Another powerful motivator is Tirana's and Albania's drastic changes in the 1990s, especially in terms of urban growth.
7.4 How and why TOD in Tirana
“Walkable, compact, mixed-use, “higher-density development within walking distance of a transit facility” is what transit-oriented development (TOD) is known as“ . “TOD is a mixed-use development that aims to make public transportation more efficient, improve the convenience and safety of walking and bicycling“, and create a vibrant, livable community. “By the year 2025, 14.6 million households will demand homes within walking distance to public transit and rail systems. TOD can help meet some of that demand“ .
“TOD has the potential to enhance public health. Vehicle dependency and congestion can be reduced in a city with a good and reliable transit system and streetscaping elements“ . “It is thought that a TOD culture would boost community health and even reduce obesity. According to a study titled The Effect of Light Rail Transit on Body Mass Index and Physical Activity“ , “commuters who used a recently built train were more active“ . “TOD has the potential to make a society more resilient“ . “Transportation accounts for about 28% of all greenhouse gas (GHG) emissions, according to the Center for Transit-Oriented Development's Planning for TOD at the Regional Scale“ . “TOD, on the other hand, has the ability to minimize annual GHG emissions“ . “TOD has the potential to boost local economies. Improving local public transportation will reduce car transportation costs and travel time“ . “People will be able to spend their time and money at local restaurants, stores, and museums as travel times and costs decrease“ .
174
“A neighborhood with TOD components is less expensive than sprawling suburbia. Since sprawl construction necessitates the expansion of public infrastructure and services, it is expensive“ . “Community opposition and an unsupportive regulatory system are the two biggest obstacles to TOD“ . “Although nearby property owners may be concerned that TOD would detract from a neighborhood's character or cause traffic congestion, TOD has been shown to be pedestrian and bicycle friendly, help local businesses, increase property values, and reduce sprawl“ .
For the purpose of this study, we recognize three important timeline stops in the transit/mobility development of the city of Tirana, these three important steps also serve us as a motivation as why we have established Tirana as a case study. The first one refers to the 1920’ regulatory plan of the “Zog” period, in which the city started the development of the main boulevard named after the Zog king, that gave a new face to the city and also kick started the development of housing along the main access, the second focus is the Tirana-Durres corridor in the beginning of the 2000’s that linked Tirana and Durres in a strong unified axe which gave a new development orientation of the City and quickly this became the main economic corridor for the region. The third and final motivation comes from the 2015-2020 Regulatory plan of Tirana which reconsiders the idea of the outer ring of Tirana as the second ring-road that connects the city, this concept has present since the 80’s and had a comeback as necessary mean of development according to the local government. The graphic illustration of these three important steps are illustrated in Figure nr.12 bellow.
175
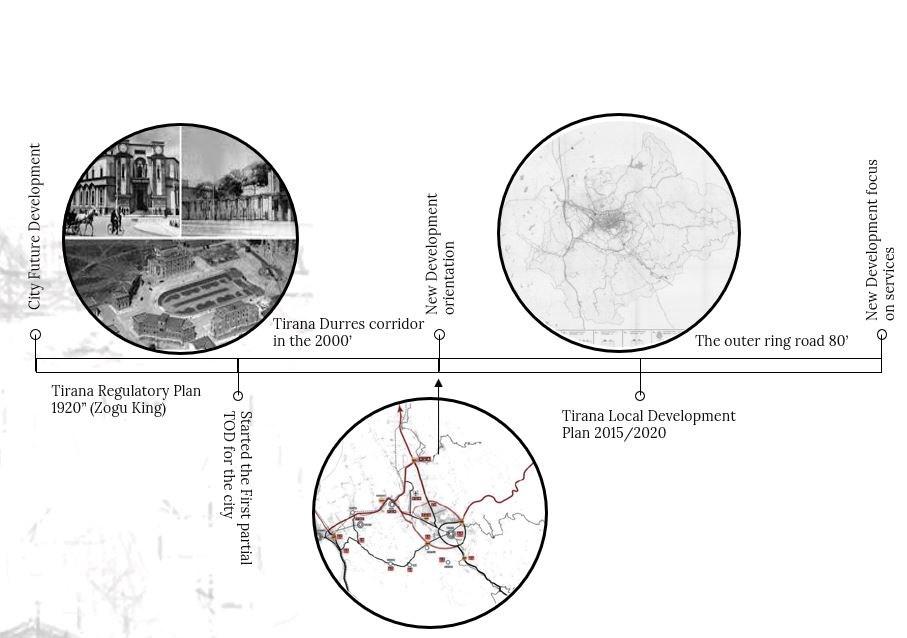
Figure 12 Tirana three development stops, the motivation behind the local case study focus Source: Authors own elaboration
7.5 Urban Policies and legislation
“Local governments should review their regulatory structure to help TOD“. The need for TOD and the roadmap for policy implementation should be included in comprehensive and master plans. Furthermore, zoning and land use ordinances must promote and endorse transit-friendly development patterns and regeneration strategies. Automobile-oriented, single-purpose, suburban-scale construction should not be the primary focus of zoning ordinances and land development codes. To accommodate the construction density needed for TOD, zoning codes will need to be changed physically. The planning process for TOD can differ from community to community. “When a community has adopted a transit-friendly regulatory structure, a TOD study will begin (including comprehensive plan and codes) “ . “A TOD analysis is used to
176
identify the need for improvements to a community's transit-served area(s) and to evaluate the potential for TOD around a proposed transit station/hub“ . “A public participation strategy should be developed to ensure feedback from all stakeholders. To oversee the planning process and engage community members, a town's planning board, a special TOD study committee, or an advisory may be created. A group may wish to hire consultancy services to help with the planning process. The transition from urban sprawl to inclusive TOD is a critical issue that must be addressed immediately. It is, however, easier to conceptualize than to implement. Several interconnected and diverse elements must be aligned and brought together. Infrastructure, street, and building planning and design are among them, as are codes, regulatory reform, and finance“ . “Rail owners can cover capital costs of construction and secure long-term profits to offset operational costs once in operation by introducing smart transit hubs, or transit-oriented projects“ . “They will meet critical development targets and smart city projects at the same time. In this way, transit hubs have the ability to serve as a powerful mechanism for implementing new growth strategies“ .
7.6 Transportation Background on Tirana
Tirana was named the capital in January 1920 by the Lushnja Congress. Along with the political factors of the time, it appears that the geographical location of Tirana possessed all the characteristics of an ideal settlement and capital, including the proper distance from the sea and the mountain, a very favorable climate, an abundance of natural elements such as water and greenery, fertile areas for agricultural development and population growth, and most importantly, was located in the intersection of important commercial routes. Time has demonstrated that this election justified the consecutive problems that Tirana would confront as a rapidly rising metropolis.
Beginning of 1917 and 1918, Austrian academics made the first attempts to map Tirana and its road network. On this basis, an Austrian engineer and architect drew up the first plan for the city in 1923, with the intention of correcting and regulating
177
the city's road structure to a more rectangular shape that would fit as closely as possible with the existing grid and also maintained the city's radial directions. In locations where building was not taking place at the time, the objective was to develop a quadratic network of clean drinking water. The enlargement of Durres Street, Kavaja Street, and Barricades was a result of this concept.
It was in this context that architect Armando Brasini (a well known Italian architect …)was called to Albania in 1925, where he worked with the original proposal for the city's core. His concept was to create a central axis and a series of colossal structures that would not only introduce a new European trace into Tirana's oriental construction but would also serve as indicators of a new way of life. Based on the design proposed by Brasini, the city's northern section and the historic bazaar were feared to be demolished by the proposed axis.
However, while the Roman models of Cardo and Decumanus appear to have inspired the design of this axis, its adaptation to Tirana's specific situation is not
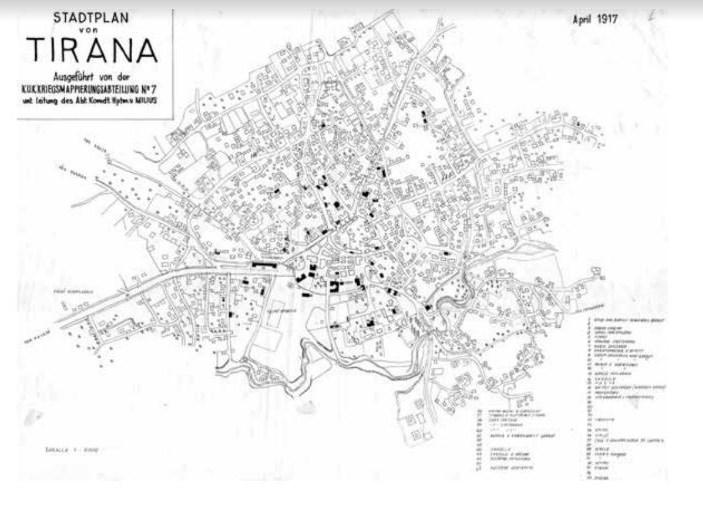
Figure 13 Tirana Plan map 1917 / source: National cartographic archive
178
solely based in this abstraction, but rather on the clear orientation about local elements such as Dajti Mountain, river flows (originally Lana and the river of Tirana), hills raised at the beginning and end, etc.
For the first time at the city level, the Brasini proposal for the north-south axis that runs through Tirana was manifested in a more complete design produced in 1926. This plan was more of an adaption of the earlier in the year 1923 plan. Changes and alterations were made in 1929 to the original 1928 plan. As part of this plan, the boulevard was extended further to the north, taking its full length of 2 kilometers from the royal palace to "Skanderbej" square and to the new stadium (where the train station was located up until a few years ago) located north of the boulevard (where it had previously been located).
Following this design, the city's borders (4.5 km2) and the most central sections along the boulevard, as well as the important historical entrance routes (Durrs Roads, Kavaja, and Elbasan) were delineated, as well as the places to be renovated and constructed along them. Layout presented a plan that included two main perpendicular axes: the vast north-south road as a "Cardo," which included the promenade Viktor Emanuele " (now Zog I Par Street) and the promenade of the "Empire" ("Dshmort e Kombit" boulevard), which featured a square on one side. Bus travel or philo buses were planned for in the plan's urban transportation section, which used the word "circumvallation" to describe the radial lines linking and circling within and beyond the circle of rings. Additionally, the plan called for the development of public transportation systems that would connect and operate across a variety of modes of transportation and public areas.
7.7 Breaking down the method
“Integrated Modification Technique (IMM) is a novel design methodology based on a specific procedure with the main purpose of increasing the energy performance of CAS “(Complex Adaptive Systems) “by modifying its ingredients and optimizing the urban parameters. “The Integrated Modification Methodology (IMM), created by
179
the Polytechnic of Millan department of the ABC“ (Tadi, 2015), is a multi-stage, multi-layer, multi-scale, holistic, and iterative procedure for urban components.
It focuses on the ‘subsystems' characterized by physical characteristics and layout to examine the links between urban morphology. It also emphasizes the importance of acting not only on the physical properties of units (architecture), but also on the operation of the urban system, taking into account functions, services, transportation, resource management, and anything else that has the potential to influence citizens' behavior from an ecological standpoint. It takes a holistic, multilayer, multi-scale approach to problem solving. “According to this concept, the city is a dynamic Complex Adaptive System (CAS) composed of the synergic integration of a number of primary pieces“ , “which give a specific physical and temporary arrangement of the CAS through their arrangement and the architecture of their ligands“ (Tadi M., 2013). According to this concept, the city is a dynamic Complex Adaptive System composed of the synergic integration of a number of primary pieces, which give a specific physical and temporary arrangement of the CAS through their arrangement and the architecture of their ligands.
Key categories are the emergent processes of interaction between primary pieces to generate a synergy in IMM. The synergy between elementary pieces produces key categories, a new organization that emerges not (merely) as an added result of the properties of the primary elements.
In our case the key elements tying this methodology to our topic are the 7 components of TOD identified in the theoretical chapters. These components (density, proximity to transit, mixed use, walkability, public transport, scale of implementation, security, pedestrian and cycle orientation) will become the accord for the IMM methodology to translate the application of these components in our case study of Tirana. The methodology will translate the components of TOD into the context, allowing us to compare the indicators, extracted from the four case studies (as successful TOD applications) and measure the difference of context with these indicators. The final result will allow the researcher to understand
180
through data, what level of TOD we should and can implement in a variety of contexts. As a final step attached to this methodology we will connect to GIS our instrumental method, the formula of indicators measure, for each of the 7 components in a single model. Enabling the use of this model in every context, to measure and identify gaps and measures in the application of TOD, in an existing build context. The IMM focuses on the 'subsystems,' which are defined by physical characteristics and arrangements, to explore the links between urban morphology, development consumption, and environmental performance.
7.8 The selection of the Area
Our corridor is located in the city of Tirana, which is the capital of the country and one of the densest urban centers. The corridor on which this area is located has a significant meaning for this study, since it connects the Tirana-Durres corridor build after the 2000s, were the largest number of companies and economic development alongside it, also one of the main access of connection with the north and the south of the country. Our corridor considers both the beginning of the highway and the new outer ring road, which is now partially finished as the second ring of the city, developed since the 2015’ (we are referring to the western part of the ring road starting from the Dritan hoxha main road and following the ring road to the TiraneElbasan highway).
This selected corridor represents three completely different scenarios since at the beginning of the corridor where our first area is located, we have more economic area which is now changing due to the “build pressure” and its slowly changing its land-use from economic / industrial to more residential / service development in the last 3-5 years, from a low density to a mid-density (In compare sent to our two other areas). Our second area located at the midpoint of our selected corridor has started its development since the late 2017s where the area was not well connected with infrastructure, but high-density development has already in place due to the proximity the area had with the future infrastructure. The third and final scenario case area is located in the end of our corridor, as a newly developed area which
181
started the development in 2018 just after the ring road construction, the area is now consolidating development as residential area with services and mixed uses.
For the purpose of this study three interconnected areas are selected. In continuity of the criteria identified of TOD in the previous Sixth chapter the selection of the study areas is guided by two main criteria. Firstly, the selected area must represent one or more than one typology of TOD and, secondly, in order to include the three Ds of TOD basis diversity in the selection of the areas is a key component. The figure 15 shows the overall extension of our selected corridor in arial view.
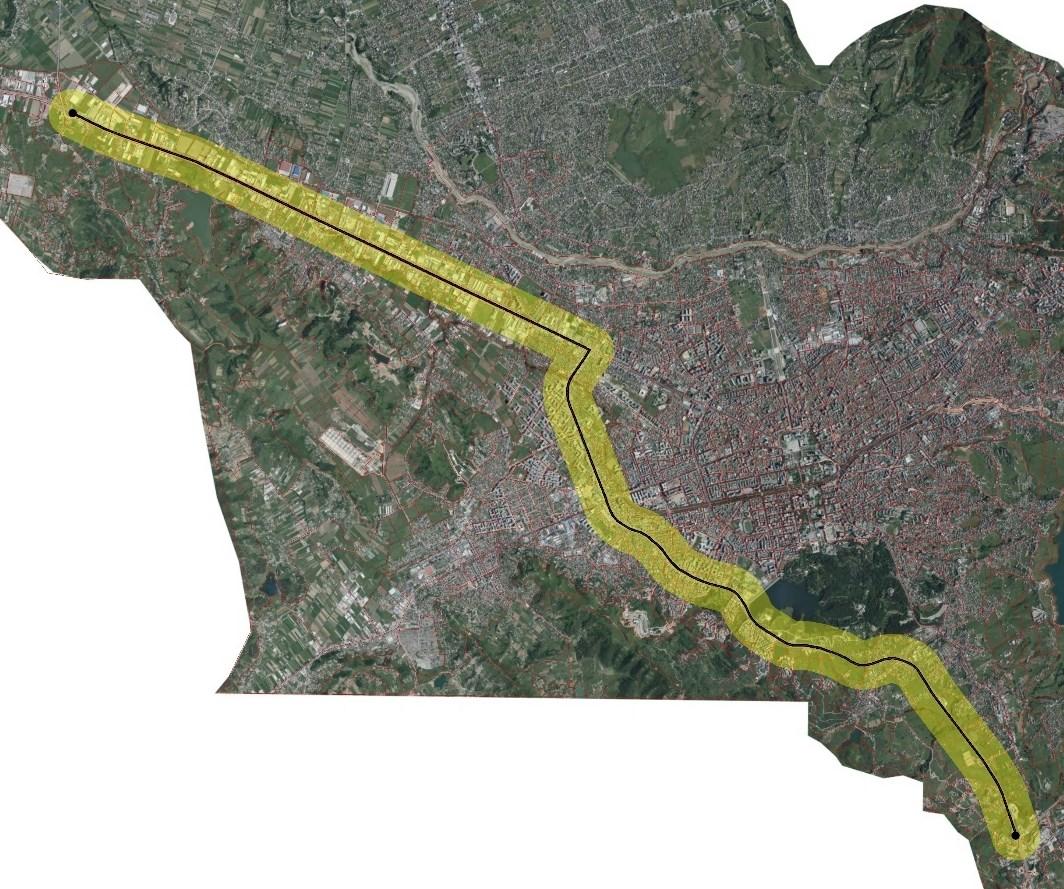
Figure 15 The selected Corridor of study area / Map generated and extracted by the researcher from ArcMap 10.7.1 source: authors elaboration
182


Figure 14 The overall corridor for the area selection of our case studies/ Isometric photo extracted from google earth pro Source: Author’s elaboration
The selected areas start with an important corridor at the beginning of the TiranaDurres corridor, continuing to the western part of the outer ring road, extending to the outer city Elbasan corridor. The selection of this continued area fits the two main criteria. The selected area, as an added value, differs in the typology of development, where the first part is the Tirana-Durres corridor is mainly an economic area, that slowly invited housing development, the western ring road is a newly high density build area that was just divided by the construction of the ring road, the final part of this section is the outside Tirana-Elbasan corridor a still developing area with low density private housing. The overall study corridor area is 20 km long, which makes it hard to apply the methodology throughout the entire corridor. In helping to frame the study subsections, to match our four initial case studies we will select 12 sub areas from the structural units of the local general development plan of Tirana 2030, which will reflect the typology, diversity and overall design of the section. The third and final area is a newly developing section near the Tirana artificial lake, this particular area is under development that has been supported by the ring road infrastructure.
183
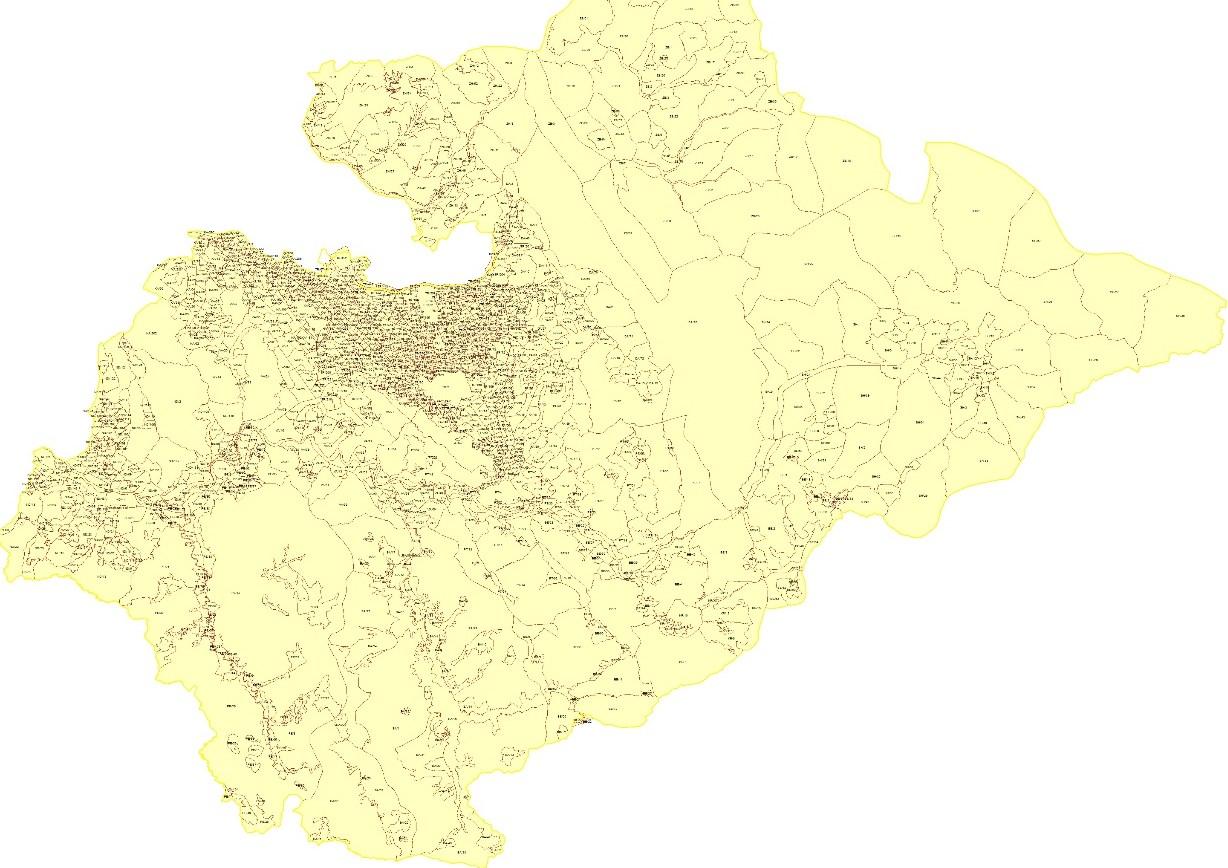

Figure 15 Map of the Structural units defined by the Local general plan, with a focus in the study corridor / Map extracted by the researcher from the ASIG national database
184


Figure 16 The area of study of the 240 units of division, Map created by the researcher 2021
185
Our first area is located at the edge of the Tirana- Durres Corridor, based on the division of the Tirana 2030 Plan division nr TR/441. The overall area does not Exide the 8 ha, and represent our first case study area Figure nr 17.
TR/ 441 Area 1

Figure 17 Arial photo of the area nr 1, photo of 2021 extracted by the researcher from ArcMap
118 buildings 2.45 km Infrastructure 16 services and business
The total surface of 78700- square meters with 17805 meters of existing build area, the existing 0.3 far and primary development of housing build, maximum of 7 stories build and 1322 of green area space and a population capacity of 5289 people. The area was developed as an informal sprawl to the city of Tirana in the late 19982002. The first development of business started in 2005 with mainly commercial services. In the arial photos below we can track the development of the area (figure 16).
186

Figure 18 Arial Photo of the Area 1 extracted by Google Earth historic data 2003 by the researcher in 10.10.2021
Figure 19 Arial Photo of the Area 1 extracted by Google Earth historic data 2009 by the researcher in 10.10.2021

It is obvious by the observation of the two historical photos that the area started the development of large residential areas after 2010 with the infill of private houses and residential buildings, more that 8% of changes (in land use %) took place in the area, were land use changed from economic to residencia and mixed use (services and residential according to the Tirana Development plan of 2015 classification). These provide some evidence to land use changes that started in the area and
187
have sparked our interest in selecting this area(see figure nr 20).According to the Local development plan the area has a division between the economic / industrial part and the area is located somewhere in-between, however, the development of the residential land-use has crossed over to the part defined into plan as economic and industrial.
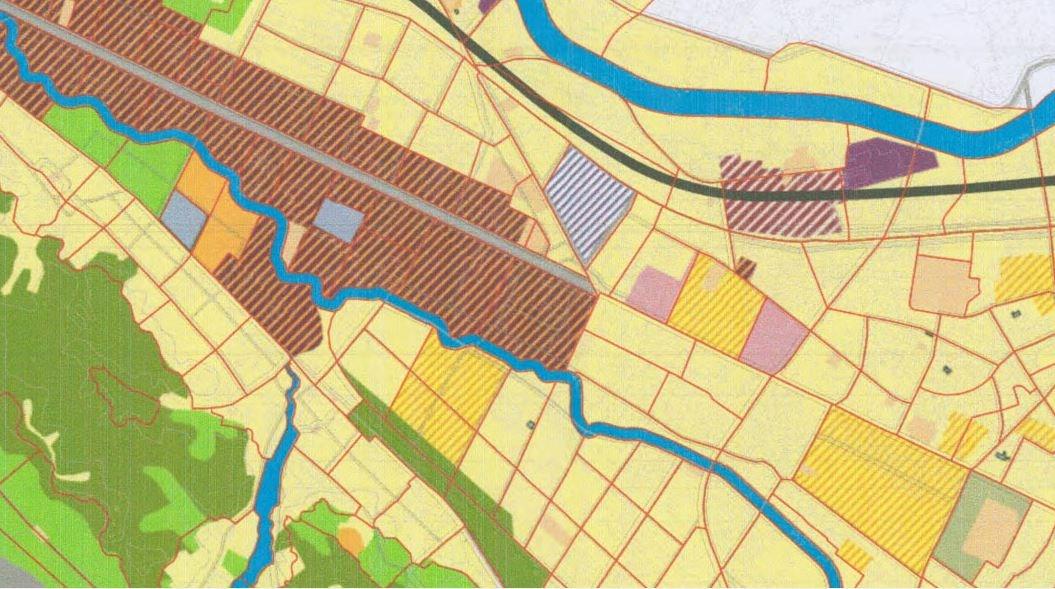
Figure 20 The proposed land-use for the Area nr 1 as a reference of the Local development plan 2015 Source: The national Government agency official website, Plan document https://planifikimi.gov.al/index.php?eID=dumpFile&t=f&f=2096&token=a9770f32412717de3162e553df0f70785f24 72df
188
KA / 53 Area 2

Figure 21 Arial photo of the area nr 2, photo of 2021 extracted by the researcher from ArcMap
27 buildings 1.40 km Infrastructure 28 services and business
The second area is located at the edge of the Western Ring-road, based on the division of the Tirana 2030 Plan division nr KA/53 with a total surface area 36100square meter, with 11332 meter of existing build area, the existing 2.41 FAR and primary development of housing build, maximum of 8 stories build and 7650 of green area space and a population capacity of 3060 people as measured by the local development plan in 2017. The area was developed as an informal sprawl to the city of Tirana in the late 1998-2002. The first development of large residential areas started in 2010. With the first development of infrastructure this was the start of business development and commercial services as illustrated in Figure 18 below.
189

Figure 22 Arial Photo of the Area 2 extracted by Google Earth historic data 2003 by the researcher in 10.10.2021
Figure 23 Arial Photo of the Area 2 extracted by Google Earth historic data 2009 by the researcher in 10.10.2021

190
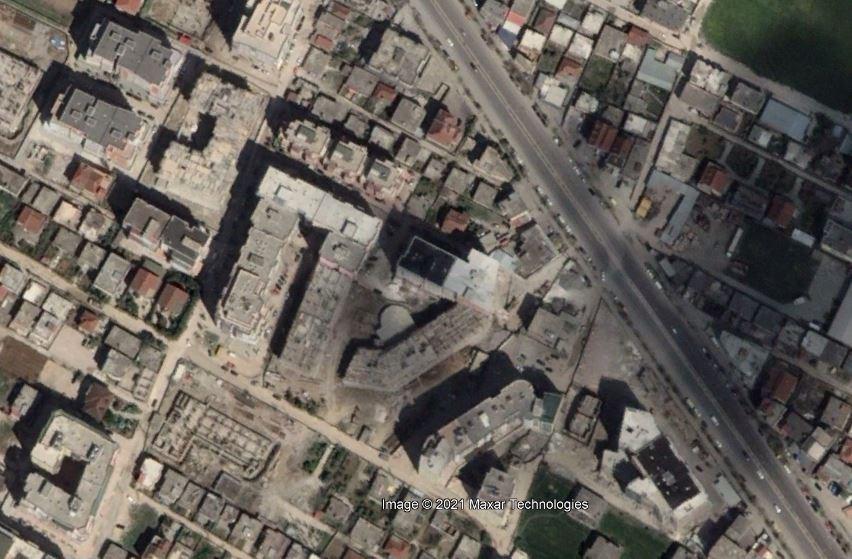
Figure 24 Arial Photo of the Area 2 extracted by Google Earth historic data 2013 by the researcher in 10.10.2021
Observing the differences of the arial photos we provide a better understanding of the area. The main infrastructure axe was present since the end of 2002, however the redevelopment of the area started after the 2010 when the plan for building the outer city ring road was discussed, this development preceded this decision, since the infrastructure in place since 2002 also served as the main economic axe for mainly service industries. However, this changed dramatically after the building of the ring road due to the split this strong infrastructure implemented in the area. The area started morphing into a more residential mixed-use development and its continuedly growing to this day with new development on the inside of the area, since new infrastructure accesses have started to grow. This is something very normal for the area, since it has been identified as one of the areas with potential development, to supply the housing needs for the city. This can be illustrated in Figure nr. 25 , were the yellow color illustrates the areas that will be developed for residential and mixed use according to the local development plan.
191

Figure 25 The proposed land-use for the Area nr 2 as a reference of the Local development plan 2015 Source: The national Government agency official website, Plan document https://planifikimi.gov.al/index.php?eID=dumpFile&t=f&f=2096&token=a9770f32412717de3162e553d
FA / 145 Area 3

Figure 26 Arial photo of the area nr 3, photo of 2021 extracted by the researcher from ArcMap
192
15 buildings 1.24 km Infrastructure 6 services and business
The third area is located at the edge of the Western Ring-road, based on the division of the Tirana 2030 Plan division nr FA/ 145 with a total surface area 14600 - square meter with 10434 meter of existing build area, the existing 0.72FAR and primary development of housing build, maximum of 3 stories build and 745 of green area space and a population capacity of 298 people (when?). The area was developed after the approval of the local development plan and has been developed in agreement with the indicators of development established by the plan. The development of the area started in 2020 as a new development area with low residence buildings, before 2020 the area was only a natural space as shown in the Figure 27 below.

Figure 27 Arial Photo of the Area 2 extracted by Google Earth historic data 2019 by the researcher in 10.10.2021
All three selected areas are connected by the same infrastructure corridor; however, this newly build corridor was built in sequence. The first area was developed unrelatedly to the corridor since at that time the corridor had only an inter-urban corridor, but with the new corridor and the expansion of the road into
193
the overpass the area is developing into residential area with higher density. The second area is also located in the same corridor. This area has developed very intensively in the last decade after the infrastructure redevelopment of the corridor started. The entire section of the corridor has changed radically, focusing on high rise residential buildings, however this is something that happened before the general local plan of Tirana. The third area selected in this corridor is also in the lastly developed part of this corridor. This section was finished between 2018 and 2020, which also coincides with the local general development plan of Tirana. This area is a completely new area, which is still under development and has just started to have inhabitants living there, which makes this an interesting find along this strong infrastructure axe.
194
8 CHAPTER EIGHT - INDICATOR AGGREGATION
8.1 TOD criteria and the bases for these analyses
In order to further investigate the application of TOD components in an urban context, we must firstly understand the relation of these components to the urban situation and how to apply them into an urban context. The aggregation of the components, naturally sum up the TOD theory, as the aggregation is based into the primary components of this theory.
With the thorough investigation of components relying into the IMM methodology for the translation of these components, we have matched the need for evaluating the component with the “how” is translated into a context. Starting this approach by understanding what the component is measuring, how will the measuring process occur and what data will better illustrate this component.
Starting from our first indicator “Density” as simple indicator considers only the number of people situated into a meter square area, in our case we will measure Density with the porosity of the area, including the change build volume and void in the area, the link to transportation and the functions within this area the aggregation of these data will guide this research to portray Density as the complex component it is.
The word "urban density" encompasses a wide variety of urban features and is multidimensional. Most research on urban density focus on demographics and other aspects of human settlement, which is a limitation. However, there are many
195
other aspects of urban density that have a substantial influence on the sustainability of cities, which will be discussed later. It is difficult to say if compact cities are more sustainable than scattered ones because of the lack of data on the link between urban density and long-term growth. City planning, development, and administration may benefit greatly from the analysis of many aspects of urban density. According to a variety of circumstances, urban density can give significant information for city planning and growth.
A city is more than the sum of its parts. Buildings, on the other hand, aren't only places to live. Densification, however, is frequently framed in terms of building as many houses as feasible and doing it as rapidly as possible. However, given that there is now a huge need for housing and the hurry to construct, it is imperative that we sit down and ask ourselves: What kinds of surroundings are we creating? Who are we constructing this for? How can we guarantee that our cities are safe, sustainable, and comfortable for all of our residents? Is the built environment and the quality of life enhanced by the new structures we are building?
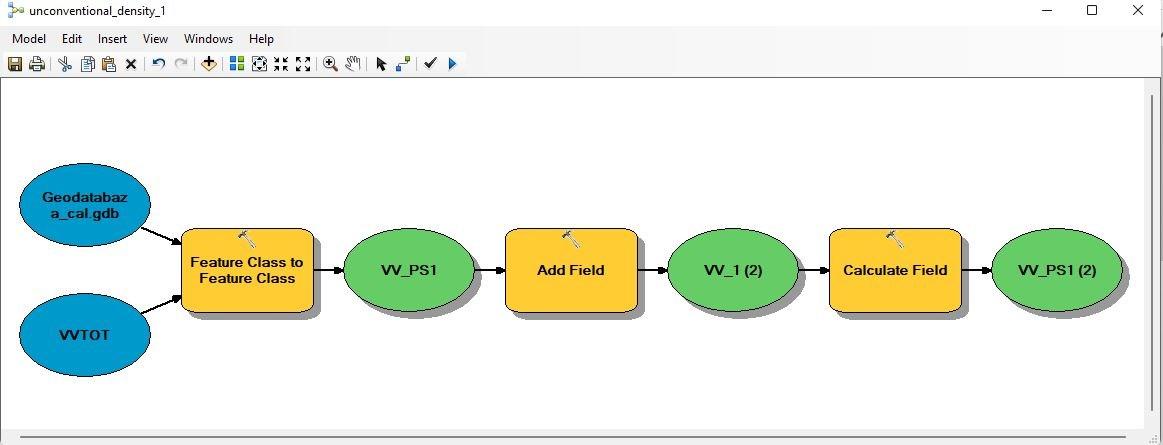
The methodology chosen by the researcher is a novel design method which applies two basic principles, the measure of urban indicators happens always base on spatial data and the consideration of each component comes in a horizontal and vertical review. This process allows us to firstly address the complexity in which TOD comes as a conglomeration of many components (density, proximity to transit, mixed-us, walkability, security, permeability) but also use these components as input and output. The input components are the data we have retrieved from the analyses conducted on our three Areas for the case of Tirana, the output I this case are the data that we gain by geoprocessing this initial data into our model builder, by having two set of data with an edit value. For example, the density design for our data consideration DENSITY = floorspace occupancy × floor area ratio × residential share × VOID of non-build area × total Volume of the build parcels × infrastructure link × Nearest transportation node within the 500-meter radius× service functions within this area this would normally be the input data, which we will later serve as the unconventional density, but would also be the input of measuring the mixed use in the area since the density already has included the
196
service distribution in the area. In Figure nr. 28 we have a details connection between the theory the components and our output (grouping) of the data, conducted within this research.
INPUT 1
INPUT 2

Figure 28 The main components of TOD identified in this study Source: Authors personal library
8.2 Measuring and investigating Density
Density is a vertical indicator related to the possibility of building within a space, but measuring density for this study takes into consideration the complex and vast indicators collected within an urban space. This study will measure density in relation to layer in superimposition outlining volumes in an urban context. The layer superimposition means that each layer has a different role in the key categories in
197
our first component is VOID / Volume / link / Transport / functions. Considering this the analyses effectuated in ArcMap model builder integrates the data of volumes, surfaces, footprint (buildings), distribution of services and the buildings number. To provide a simplified method in calculating we will use the average height of the building, covering the area to finally define the boundary of urban volume. In the classical representation of the Density the overall formula is only a collection between the floorspace occupancy × floor area ratio × residential share = urban density, however this representation of the formula leaves many of the urban components outside its findings. Density is necessary to understand the morphology of the city. The components as part of the TOD are much more complex and require much of the vertical and horizontal representation, taking into account not only the density as its classical representation, but also the void in between representing urban space, services within this space the distribution and linkage to the space. Breaking down the following formula:
VOID SPACE
BUILT AREA

198

mean
Xh
Extinction of the Analyses Area
��ℎ =∑ . (����ℎ)/∑.��
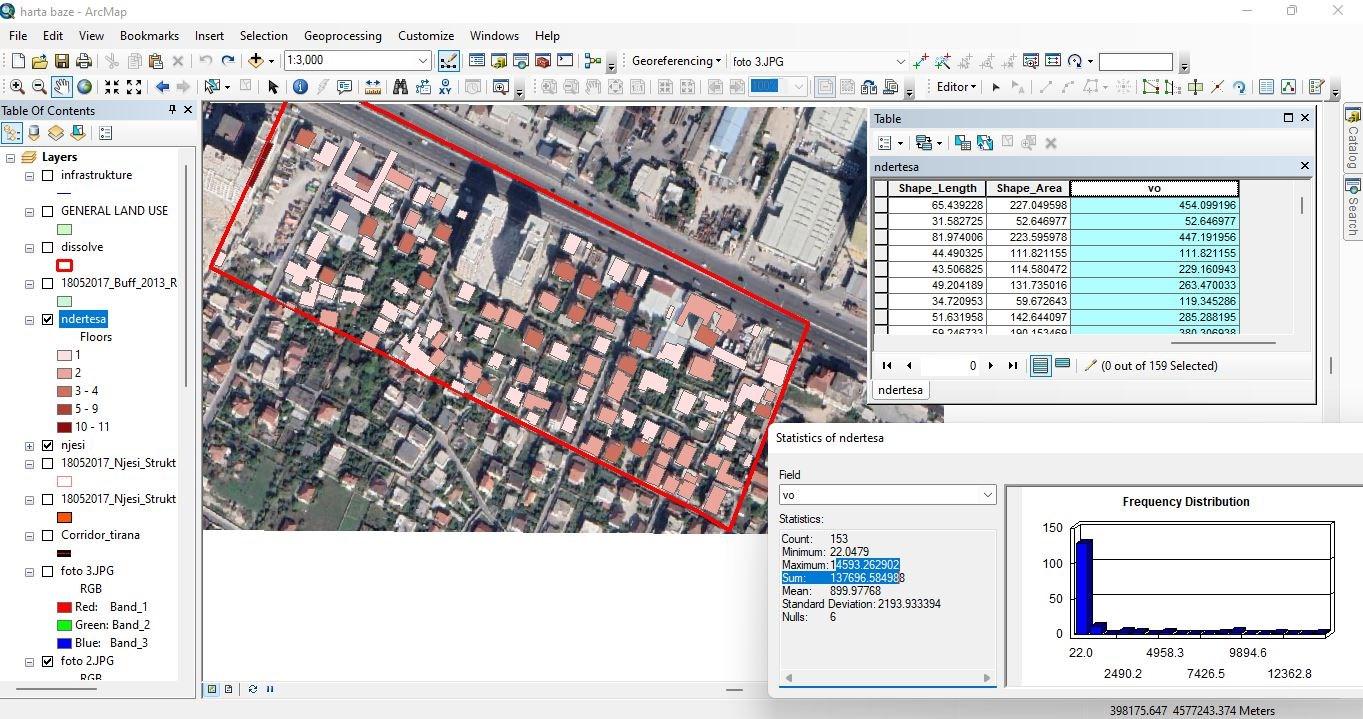
A = Area of Building footprint h = height of building Vo = Volume of Built area
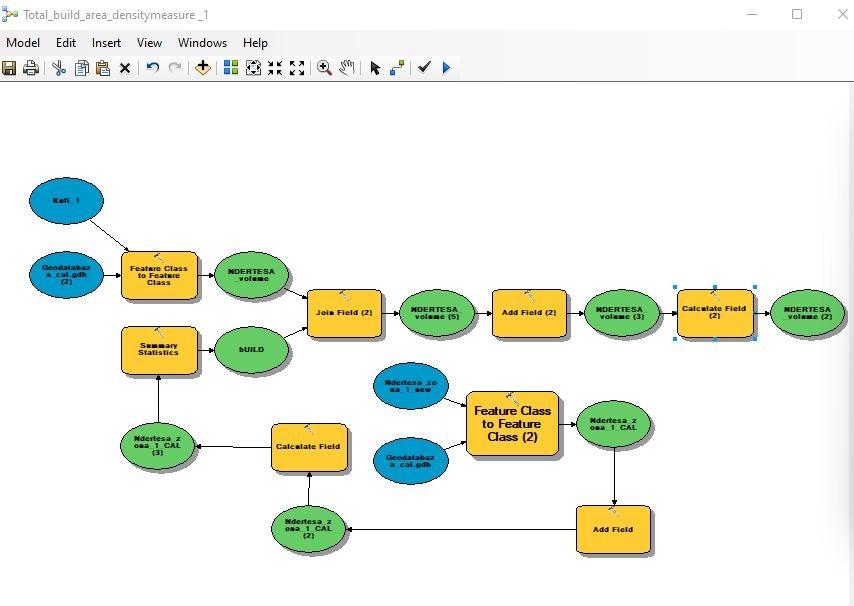
Building footprint means the area of land measured at finished ground level that is enclosed by the external walls of a building. As a first step, we must acknowledge the current situation and understand the total volume of the area we are testing our indicators. As a first step in generating a unified model is to create three separate files, each area must be an independent input to the model.
Area 1 calculations of the Volume of Built area:
199

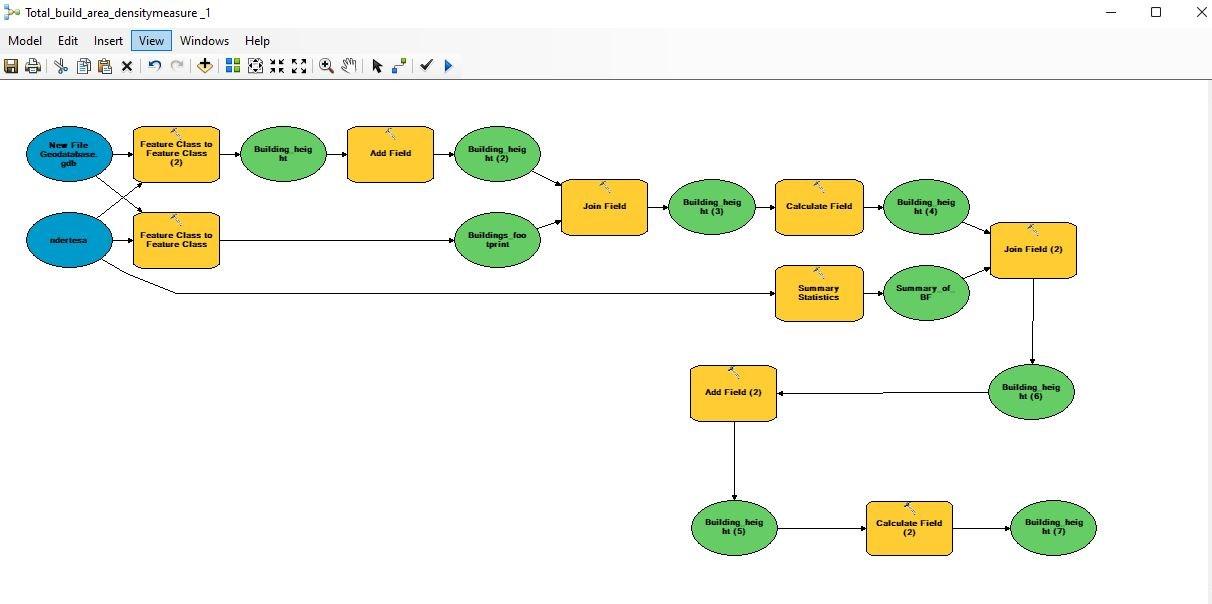

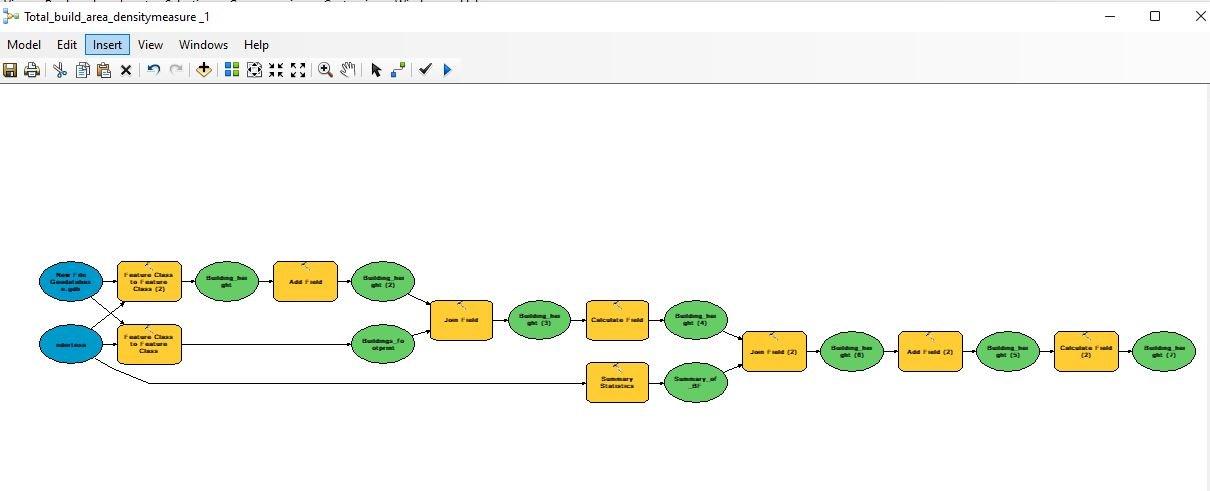
Figure 29 The formula for the total volume of the neighborhood
Calculating the total volume of built area is 1.9 for our first area
The build volume for the first area is 1.9 indexed which translates into low density in the normalization value, since it translates into as a low / low dense area.
200
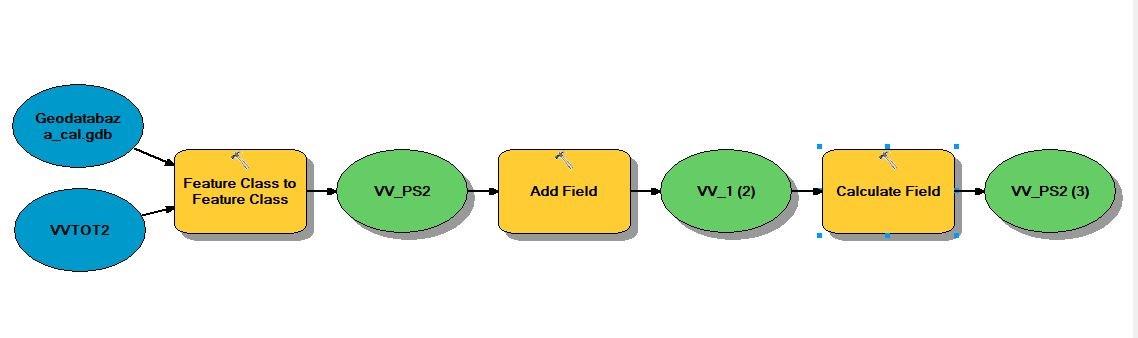
Area 2 calculations of the Volume of Building area:


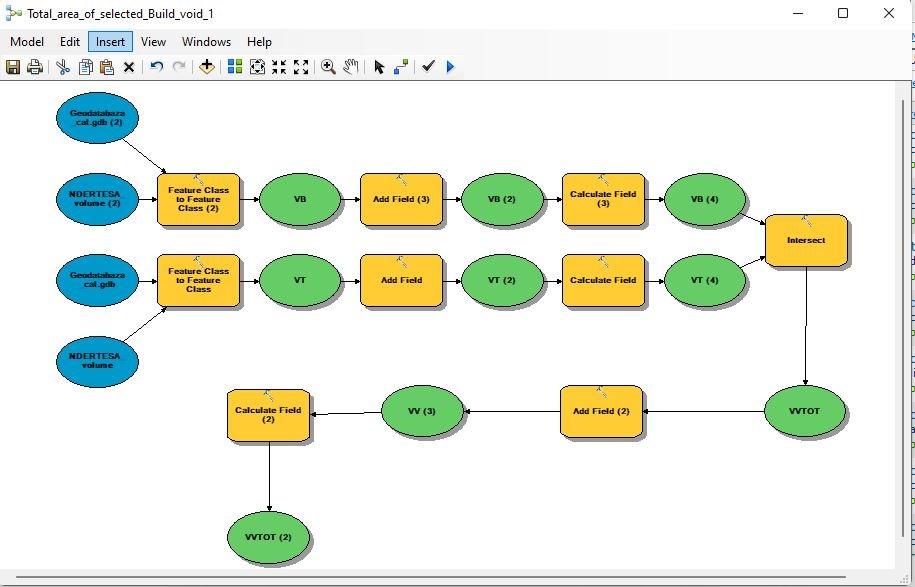
Equation 1 Model builder for the calculation of the build area which corresponds to density in our second area Source: Authors own elaboration
Calculating the total volume of built area is 10.9 for our second area.
The second area has the build volume 10.9 indexed which corresponds to high density, however the service level is bellow 2 which leaves the area dense but not with enough services within the 500-meter radius.
201
Area 3 calculations of the Volume of Building area:
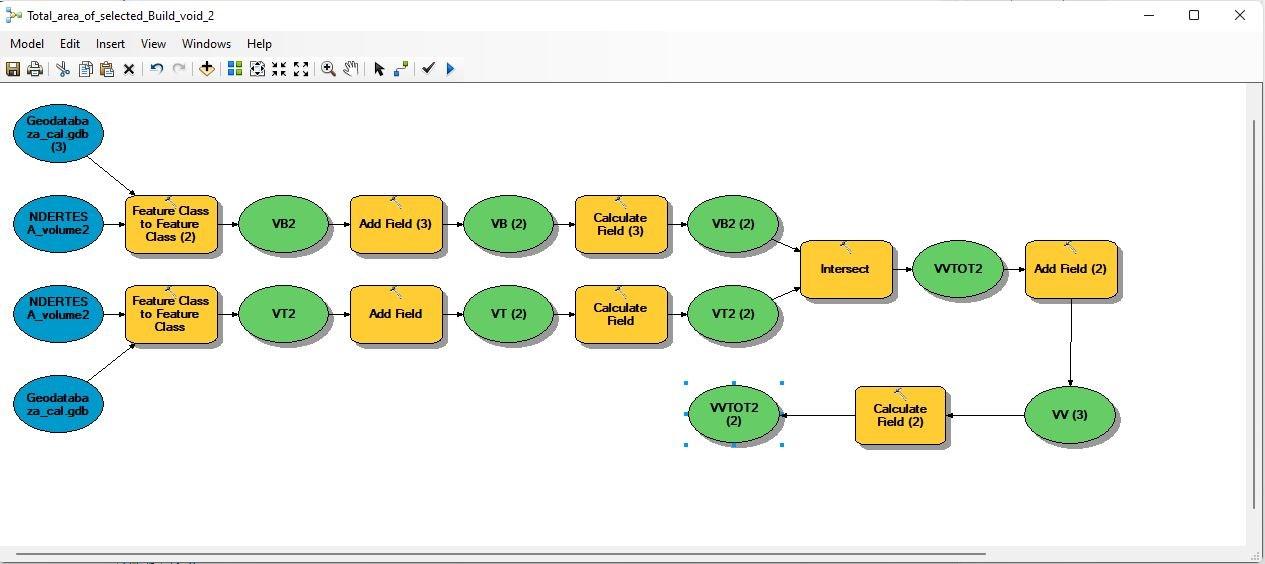
Equation 2 Model builder for the calculation of the build area which corresponds to density in our second area Source: Authors own elaboration
Calculating the total volume of built area is 4 for our third area
The density indexed of the third area corresponds to low/mid-level density for this area, however the services in the area have scored 1.8 which is very low considering that this area has also the smallest surface of the three areas we have considered.
202
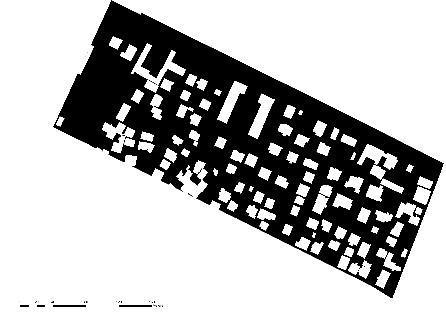
The volume of the area is only the first step, illustrating the measure of built area in proportion to the total area space, in a measure of build and void.
203

204

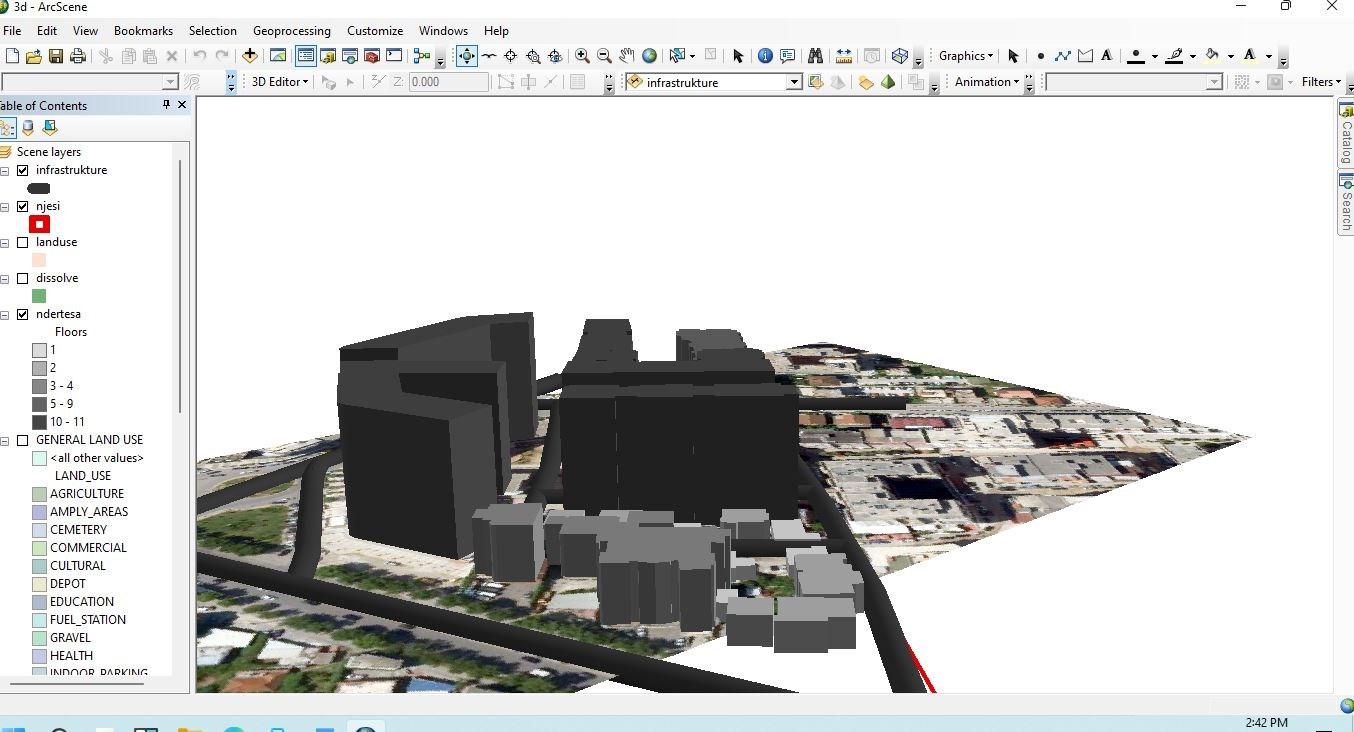
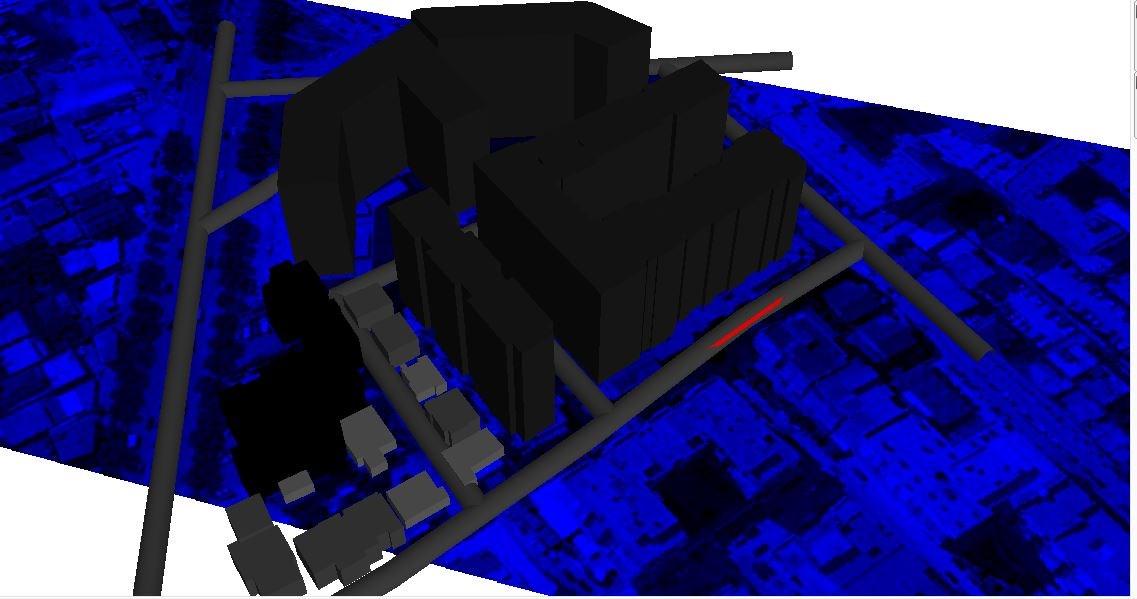
Figure 30 The illustration of Void and Build area for our test sites illustrated by ArcMap / Arc scene Created by the Author
After obtaining the first part of this formula, we will find the total volume of our neighborhood. After calculating the volume of built area in this second part of this formula, we can easily calculate the volume and void of the space in a percentage ratio. Calculate the volume of built space (Vv): ����= ���� x ��ℎ
Vt= Volume of the site Vb= volume of the buili area Vv= void space volume A = Area of Building footprint At = Total area of selected site
����= ∑,(����ℎ)
h = height of building
Ps= porosity (%)
205

Calculating the volume of built space for area 1: 156868.99- square meters
206

207
Calculating the volume of built space for area 2: 382896.98- square Meters

Calculating the volume of built space for area 3: 56970.21-meter square And finally measuring our unconventional density, therefore, density of buildings and the density of build void space through:
The measurement of the unconventional density considers the volume building and the volume and void of the area, in order to establish the Density of the area.
Density of area 1 = 82 %
208
Density of area 2 = 68 %

209
Density of area 3 = 66 %


Figure 31 The representation of the volume, two cases of the same volume represented into the example
In this study we have found that Density should be considered in relation to the volume, however in the above representation, we understand that this is not the case, because a volume influences Density qualitatively. For this reason, we consider the horizontal elements that influence indirectly density in the calculations bellow. Defining the calculation of density in the city considering surfaces, our calculating method broadly considers the total area surface of the buildings and the sum of the total free area and make a ratio between the two for the total analyses area.
210
The calculation expands into surfaces:
���� =∑ (�� . ��ℎ) ����=����+ ����
Ab = total area of Building footprint Av = total void area h = height of building p = Building perimeter Sr = Free vertical space of the building At = total area of analysis
MAX High volume of the building
Current building height
The calculations for the first area: In our first area the total height of the building as a data extracted by the calculation, however the free vertical space, in our case will be the data extracted by the Local development plan which establish the FAR and the max height of the buildings. In the first area the max floor heigh its 10 floors.
211


The free total area and total area of the analyses is equivalent to: 37708.4 for area 1
212
24928.64 for area 2
and 6179.81 for area 3 This will finally allow us to apply the formula of the surface.
213
As a final step is that the formula can apply the formula surface ratio giving the percentage as follows:

Total surface area for the is 45%
Total surface area is 60 %
214

Total surface area is 40%
Measuring coverage and gross floor area ratio:
Applying our measures to the selected area of our study, the final findings will be compared with the case studies from the American and European prospective. As these studies have been selected as successful cases. The finding will help us establish the missing components of TOD parameters.
215
Area 1 Area 2 Area 3 Area 4 Volume 35 30 25 20 15 10 5 0 surface
number of builings distribution factor
In the Density (porosity) spectrum diagram above the case studies outcomes measured by breaking down the calculation of the density, within each element has been attributed the findings of the automatization in Arcmap. The variation of the findings shows that area 2 and area 4 have a disproportion in the number of buildings and the total surface of the area. These findings clearly show that the area has a low distribution of services in attribution to the surface and volume of the area. This clearly shows the gap within this first parameter.
8.3 Measuring and investigating proximity to transit
In order to measure the proximity to transit in a classic scenario we would only divide the area into a grid of 15x15 (we could easily use the grip provided by the institute of statistics which can be found in:
216


