Behavioral Insights to End Global Poverty


Recommendations to The Life You Can Save
December 2020
Authors
Beshka Asanbaev
Nathan Babb
Benjamin Chin
Anthony Cilluffo
Olivia Hompe
Abyssinia Lissanu
David Wylie
Project Advisor
Varun Gauri
Behavioral Insights to End Global Poverty
Recommendations to The Life You Can Save
December 2020
Authors
Beshka Asanbaev
Nathan Babb
Benjamin Chin
Anthony Cilluffo
Olivia Hompe
Abyssinia Lissanu
David Wylie
Project Advisor
Varun Gauri
Graduate Policy Workshop
School of Public and International Affairs
Princeton University
All cover photos are from Pexels, and used under a Creative Commons (CC0) license.
BEHAVIORAL INSIGHTS TO END GLOBAL POVERTY Table of Contents Acknowledgements 5 Executive Summary 6 1. The Framework and the Goal 9 2. The Desired Behavioral Change 11 3. Context and Diagnostics 14 4. Intervention Design 22 5. The Intervention 35 6. Learning 51 Endnotes 56 Appendix 58 About the Team 63
Acknowledgements
This report benefitted from input and feedback from many people. The authors would like to express our deep thanks to the staff of The Life You Can Save for their generosity in sharing their time with us, for answering questions, and providing helpful comments. In particular, the team worked closely with:
Charlie Bresler, Executive Director
Neela Saldanha, Board member
Jon Behar, Strategic Advisor
Stacey Black, Director of marketing
Chantal Johnson, Social media manager
Llamil Silman, Chief Technology Officer
Also, the authors benefited from discussions with many behavioral science, social media, and user experience professionals, who were incredibly open with their experiences and giving with their insights. The authors met with:
Zeina Afif, World Bank Group eMBeD
Cynthia Borochuwicz, Inter-American Development Bank LACEA-BRAIN
Donald Braman, The Lab @ DC
Abigail Dalton, World Bank Group emBeD
Iason Gabriel, Deepmind
Jessica Leontarakis, Princeton University Office of Communications
Ammaarah martinus, Department of the Premier, Province of Western Cape
Ana maria muñoz Boudet, World Bank Group emBeD
Maddy Pryor, Princeton University Office of Communications
Saba Singh, Amazon music
Renos Vakis, World Bank Group emBeD
Hrag Vosgueritchian, World Bank Group emBeD
David Yokum, Brown University, The Policy Lab
All opinions and errors are our own.
5 A C k NOWLEDGE m ENTS
Executive Summary
The world of charitable giving is a world of redistribution: surplus aid and money from one place being directed to another place in need. motives for charitable donations are plentiful; whether donors are motivated by a feeling of duty, recognition, or altruism, global aid totaled upwards of $600 billion dollars in 2019.1
Our client, The Life You Can Save, is a foundation whose mission is to end global poverty. Ending global poverty comes through effective giving, and, in particular, through a group of nonprofits that The Life You Can Save has selected for their efficiency in saving “the most lives per dollar.” The Life You Can Save believes that extreme global poverty can be eradicated if each person that could donate a small amount actually does so. At present, the foundation finds that there is still considerable work to be done and that more people stand to benefit and contribute to ending global poverty.
Our report, Behavioral Insights to End Global Poverty, is a step in this direction. Our client is interested in using the tools of behavioral economics and decisionmaking sciences to ground their work going forward. We aim to better assess opportunities for our client to spread its message, attract new donors, and raise funds to end global poverty.
The Life You Can Save is an extension of the effective altruism community – an informal group of people connected by a shared desire to improve the world by
giving money to just and impactful causes. Our analyses found that the demographics of the effective altruism community and the visitors to the The Life You Can Save’s website are very similar; the group skews male, young (ages 25-34), educated, Western, white, and technology-oriented. Further, the demographics of the website visitors are almost entirely represented by the Anglophone countries of the United States, Australia, the Uk, Canada, and Ireland.
Our analyses show that The Life You Can Save’s donations are not driven by major world events, such as natural disasters. Rather, the bulk of their donations are received near the end of the tax year, particularly in the U.S. and Australia. Thus, The Life You Can Save’s donors indeed appear to be forward-looking: they are focused on long-term needs rather than emotionally salient events.
One of our main analytic findings relate website usage, donation likelihood, and point-of origin. Our analyses show that while the number of website visitors coming from social media channels is smaller than the client’s robust email base, those who do come from social media are more likely to donate. The share of donations resulting from email origin is nearly double that of social media and yet yields a lower likelihood of donation. We suggest that The Life You Can Save continue to view social media as an important growth opportunity.
6 BEHAVIORAL INSIGHTS TO END GLOBAL POVERTY
The “Best Charities” page of the website is doing well but maybe underperforming its true potential. There is healthy traffic towards this page, and it accounts for the second highest likelihood of receiving a donation after only the homepage, but it also has a high bounce rate, meaning that visitors quickly look at the page and then move on without further interactions. By looking at different types of visitors we posit that this could be due to information overload: that people go to this page to seek information, but decide not to engage further with the website due to limited bandwidth and the large quantity of content presented.
Our analyses also find that the visual presentation of charities does have an effect. This is true of the “All Charities” option and in particular for the Against malaria Foundation (AmF). AmF has a prime location on the “Best Charities” page and receives the second highest number of donations behind the “All Charities” option. The average donation to AMF ($128) is significantly smaller than “All Charities” ($254). We hypothesize that donors could be well-informed about the cost of a mosquito net and its effectiveness, but might feel less inclined to donate to all of the charities.
With our literature review, we present five behavioral principles and assess their relevance to the work of our client, using a comparison with peer organizations, Give Well and Charity Navigator. Specifically, these principles are choice architecture, social norms, empathy, overhead cost aversion, and anchoring. We believe that The Life You Can Save can expand its
influence and effectiveness by utilizing these principles more broadly. Give Well and Charity Navigator offer possible insights into how these principles can be implemented more effectively.
We ran a short social media test from November 16 to 30, 2020, to study different messaging grounded in the five principles. Due to several constraints, our experiments lack statistical power to make conclusions. Instead, the test offers suggestive evidence of our recommendations to simplify the messaging and to make social media “more social.” We find that of Facebook, Instagram, and Twitter, Facebook saw the largest treatment effects of our messaging as measured by reactions and sharing. Reactions jumped from an average of 5.8 per post in the control time period to 10.8 per post during treatment.
There is a considerable amount of content on The Life You Can Save’s website. Simplifying the presentation might be explored: we suggest a decision-tree quiz which can bring potential donors to a decision and reduce the cognitive load currently required to navigate the website. Charities could also be grouped by theme and not just title, which would reduce the amount of presented content.
The Life You Can Save is an effective charity aiming to end global poverty. We believe The Life You Can Save can become yet more effective with more attention to behavioral insights and principles.
7 Ex ECUTIVE S U mm ARY
8
BEHAVIORAL INSIGHTS TO END GLOBAL POVERTY
The Framework and the Goal 1
Mission
For decades, The Life You Can Save founder Peter Singer has made the moral argument that individuals in affluent nations need to re-think how they approach charitable giving. Singer’s reasoning is relatively straightforward: if individuals in high-income countries can prevent suffering and even death without having to sacrifice something nearly as important, then they should do so. Consequently, those in the United States and other developed countries should give substantially more, and they should also focus on giving to organizations that can do the most good.
As it stands, charitable giving in the United States is largely driven by local, ingroup interests. This parochial inclination ignores the vast differences in needs between those in high-income countries and those in extreme poverty around the globe, who are generally living on less than $1.90 per day. According to Giving USA, the top recipients of charitable donations in the United States in 2019 were religious institutions (28%) and educational institutions (14%); donations to international aid organizations, which include organizations that are not directly focused on helping the global poor comprised just 6% of total donations.2
Singer and the effective altruism community aim to change this by encouraging donors to focus on impact. In other words, how can a potential giver
maximize the total well-being enhanced, typically understood as the number of lives saved, for each dollar given? In taking this approach, it is apparent that optimal charity donations for those in high-income countries should not be limited to nearby locales – not when a $2 mosquito net can protect a couple in Nigeria from malaria and a $50 cataract surgery can restore sight to a child in India.
The Life You Can Save aims to push forward Singer’s message of giving more and giving more effectively. That is reflected in the organization’s two-fold mission:3
1. Introduce Singer’s ideas to new audiences
2. Inspire and empower individuals to make the greatest impact possible
Tools
The Life You Can Save wants everyone to do their part to end global poverty by donating to charities that make the greatest impact. As a result, one of the key services the organization provides is curating a list of best charities that have demonstrated themselves to be highly cost-effective. The Life You Can Save’s Panel of Experts defines effectiveness as: “robust evidence on the efficiency of its programs and its ability to execute good outcomes.”4 The Life You Can Save’s recommendations heavily draw on evaluations from GiveWell, which is a leading charitable evaluator that has
9 T HE F RA m EWOR k AND THE G OAL
been at the center of the effective altruism movement. Importantly, The Life You Can Save does not only curate a list of best charities, it also collects donations to directly support those charities. The Life You Can Save offers users the option to donate to specific charities or to spread their donation evenly among all their recommended charities.
Effective altruism is a new movement with a relatively homogenous following, as will be discussed below. Thus, one of The Life You Can Save’s main goals is to reach new audiences and broaden the effective altruism message and community, which may not be a primary goal of peer effective altruism organizations. They aim to do this by popularizing the effective altruism message in a way that can, in the words of Executive Director Charlie Bresler, appeal to both “the heart and the head.”
Singer’s book, The Life You Can Save, is one of the most important tools the organization has to spread their message. It makes a powerful case for the principles of effective altruism, while also being accessible and providing reasonable donation targets for readers. The book’s importance has risen since it was bought back from the publisher and re-released in December 2019. Now, the book can be downloaded free from The Life You Can Save website as an ebook and audiobook, which greatly enhances its potential reach. Beyond the book, The Life You Can Save engages with the public through its website, blog, podcast, newsletter, and social media channels.
10 BEHAVIORAL INSIGHTS TO END GLOBAL POVERTY
The Desired Behavioral Change 2
As explained in the previous section, The Life You Can Save has a twofold mission: “introduce the ideas from Peter Singer’s book to new audiences,” and “inspiring … and empowering them to make the greatest impact possible.”5 These goals are fundamentally behavioral: by reframing a person’s role in ending extreme poverty, The Life You Can Save changes the way people act toward the issue and their own altruistic responsibilities. most people who internalize The Life You Can Save’s message will give more to effective charities, likely donate more as a share of their income, and also act to spread effective altruism on their own. The Life You Can Save’s branding, “Smart Giving, Simplified,” also acknowledges the behavioral component of simplifying effective altruism that the organization sees as core to its mission.
Targeted Behaviors
keeping with The Life You Can Save’s two-part mission, our study evaluates and provides recommendations along the same two dimensions:
Increase engagement with effective altruism messages. One of Singer’s goals in writing The Life You Can Save, and in founding the charity, is to spread the effective altruism philosophy to new audiences. Doing so might require creating new messages that resonate with different audiences, presenting the same message in innovative ways or on new platforms, or some combination of the two.
Engagement can take many different forms. It includes sharing a post on social media, talking to a friend about effective altruism, thinking about the ideas and how they relate to one’s own life, and many other actions in between.
This report focuses on engagement with effective altruism messages on social media, using the options available within each respective platform. These typically include liking a post, sharing a post on their personal account, and following links provided in posts. Tracking engagement using these behaviors is a good starting point for several reasons. First, the social media content is amenable to rapid, easy, and essentially costless change. Second, they can be easily tracked over time and quantified, allowing simple analysis of what works. Finally, they are indicative of other actions that The Life You Can Save wants to change (such as talking to others about effective altruism offline) that are not as easy to measure.
Increase donations to effective charities and to The Life You Can Save itself. The goal of promoting effective altruism is to increase donations to effective charities. This is the fundamental action that will contribute to ending extreme poverty globally. The Life You Can Save also accepts donations to fund their own operations.
Given that The Life You Can Save’s goal is to end extreme poverty, there is
11 T HE D ESIRED B EHAVIORAL C HANGE
theoretically an upper limit on the amount that The Life You Can Save would need to increase its donations –– the amount needed to lift everyone in the world out of extreme poverty. While Singer argues that ending extreme poverty is within reach in this generation if Western citizens take their moral responsibilities to end it seriously,6 this goal is still very ambitious for The Life You Can Save and other global humanitarians. Therefore, The Life You Can Save’s donation goals should be for a steady percentage increase each year for the foreseeable future.
The Life You Can Save promotes effective charities over other U.S.-based charities as donations have greater impact internationally. For example, a cornea transplant cost $32,500 on average in 2020.7 This would potentially restore eyesight in one eye to one person. Due to lower costs and a lower level of required services to have an impact, this same amount would provide 650 cataract surgeries to reverse curable blindness if donated to the Fred Hollows Foundation.8 By giving that amount internationally instead of in the U.S., donors are likely to do more good for the same amount of money.
However, The Life You Can Save faces a challenge with soliciting donations: it is readily able to demonstrate the effectiveness of its recommended charities, but it also wants to raise money for their own operations. Placing itself in direct competition with their effective charities is a challenging position, especially given donor’s general aversion to giving to a charity’s overhead costs (see Section 4). The Life You Can
Save demonstrates the effectiveness of donations to itself by saying that every $1 given to The Life You Can Save raised on average $11.50 in return.9
Ultimately, some combination of donations to the effective charities and The Life You Can Save is likely the optimal option. The Life You Can Save itself promotes this option, such as through the 90/10 Fund, which gives 90% of the donation to effective charities while 10% of the donation is kept for The Life You Can Save’s operations.
Where We Focused
To facilitate these behavioral changes, we focused on The Life You Can Save’s social media presence, website, and newsletter. Two factors contribute to these being the most promising platforms to test and launch behavioral research at The Life You Can Save. First, there is a relatively low cost to changing content on these platforms, allowing rapid and iterative evaluation of different types of content and varying interventions. Second, these platforms are The Life You Can Save’s touchpoints with the largest number of followers.
But these are not the only potential platforms The Life You Can Save could use to change behaviors. For example, the organization’s Giving Games are an innovative, behaviorally-focused intervention toward promoting both identified goals.10 Giving Games use participatory learning and the endowment effect to “change giving at a cultural level”11 through changing participant’s philanthropic behavior. In a Giving
12 BEHAVIORAL INSIGHTS TO END GLOBAL POVERTY
Game, participants are given a small amount of real money that they choose how to allocate among charities. A vote is taken at the beginning of the event, then presentations are made for each of the charities on how they would use the donation. After that, another vote is taken on how donations should be allocated, with the participants making real donations to those charities. more details on the behavioral principles behind the Giving Games are discussed in Section 4.
While behavioral interventions are contextdependent, they can be carefully applied outside their original context. For example, our findings that personal stories increase engagement (see Section 4) can be incorporated into the charity descriptions to increase participant engagement. In other cases, the Giving Games already apply concepts that we later recommend
for The Life You Can Save’s other operations. For example, Giving Games avoid choice overload (see Section 4) by providing participants with three charity options. We recommend similar changes to the website’s “Best Charities” page in this report (see Sections 5 and 6).
Other potential platforms include The Life You Can Save’s podcast and celebrity events. All of these platforms have promise for future behavioral interventions. Regardless of the specific platform, the behavioral principles from this report are useful for all of The Life You Can Save’s touchpoints as well. The insights we provide are fundamentally related to improving processes to match with human behavior, although care should be taken when applying them outside their original context.
13 T HE D ESIRED B EHAVIORAL C HANGE
Context and Diagnostics 3
We turned to The Life You Can Save’s Google Analytics data to gain a better understanding of the population that currently engages with the website and how they do so. This context is important for diagnosing the bottlenecks that may be standing in the way of greater engagement and donations, as well as identifying potentially effective intervention areas. Our analysis led us to five main findings that have implications for how The Life You Can Save (TYLCS) can meet its goals of greater engagement and donations:
● TLYCS website users and donors have demographic similarities and differences with the core effective altruism community
● The timing of donations reveals that giving season and tax incentives drive the timing of giving
● The “Best Charities” page is the second most trafficked landing page but may be underperforming
● Social media represents a potential growth opportunity
● Charity choices show the influence of the layout of the “Best Charities” page
In this section, we briefly detail the findings listed above. Unless otherwise noted, the results described are based on Google Analytics data spanning the one-year period from November 1, 2019 to October 31, 2020.
Demographics of Website Users and Donors Versus Core Effective Altruism Community
Survey data indicate that the effective altruism community skews male, young (25-34), educated, Western, white, and technology-oriented.12 While data limitations prevent comparison with TLYCS website visitors across all those dimensions, we do know that TLYCS website users show a different gender breakdown than the self-identified effective altruists. Females make up a narrow majority of website users, compared to less than one-third of surveyed effective altruists (see Figure 3.1, Panel A).
However, TLYCS website users are young, similar to the broader effective altruism community, with 25-34 year-olds making up the largest share of TLYCS website users, followed by 18-24 yearolds (see Figure 3.1, Panel B). The 25-34 age group also shows the lowest bounce rates, meaning they are not only the most populous group but also engage with the website the most (see Appendix Figure A.1). While the age distribution of TLYCS website users follows the same general contours of the effective altruism community, it is not as concentrated in the youngest age brackets. In the latest survey, over 75% of effective altruists were in the 18-24 and 25-34 age brackets, compared to 50% of TLYCS website users.
14 BEHAVIORAL INSIGHTS TO END GLOBAL POVERTY
According to the 2019 Effective Altruism Survey, a plurality (39%) of effective altruists live in the United States, followed by the United kingdom, Germany, Australia, and Canada. The geographic distribution of TLYCS website users is roughly similar, as shown in Figure 3.2. most visitors are located in the United States, and the top five countries are the same with the exception of Ireland. Australia is notable for being the second largest source of website users despite having a smaller effective altruist presence than the United kingdom, for example. The fact that Peter Singer is Australian is likely a contributing factor.
We do see some differences when we look at the gender, age, and geographic distribution of those who donate through the TLYCS website as opposed to website users (see Appendix Figure A.2). Donors are more likely to be male compared to website users, though still not close to the male share of effective altruists. Donors are more dominated by Americans compared to website users, with nearly half of donors based in the United States.
Australia punches even further above its weight: Australians make up over one-quarter of website donors, while the United kingdom makes up just 5%. The age distribution of donors is slightly more skewed toward 25-34 year-olds. However, 35-44 year-olds have the large average donations, which likely speaks to their larger earnings (see Appendix Figure A.3).
In sum, TLYCS users and donors are similar but not identical in composition
15 C ONTE x T AND D IAGNOSTICS
Figure 3.1 Website Users and EA Community by Gender and Age Group Panel A Panel B
47 53 71 27 0 20 40 60 80 Male Female TLYCS Website Users EA Community Share by Gender in Group (%) 21 29 15 12 11 11 27 52 12 4 2 2 0 20 40 60 80 18-24 25-34 35-44 45-54 55-64 65+ TYLCS Website Users EA Community Share by Age in Group (%) 7 4 16 7 39 4 5 5 11 11 38 0 10 20 30 40 50 Germany Ireland Canada United Kingdom Australia United States TLYCS Website Users EA Community Share by Country in Group (%)
Figure 3.2 Website Users and EA Community by Country
to the effective altruism community. Additionally, TLYCS is currently limited to the Anglosphere, so there is a longterm growth potential in non-Anglophone European countries, as well as in middle income countries.
Donation Timing Reveals Giving Season and Tax Incentives Are Motivating
Website donations to TLYCS spike at two points in the year: at the end of December and at the end of June. Disaggregating donations by country reveals that the December spike is driven by US donors and the June spike is driven by Australian donors (see Figure 3.3). The lack of spike in Australia in December suggests the Christmas holiday is not by itself driving donations. Instead, the spikes align with

the end of each country’s tax year and “giving season.” While we cannot isolate the effects of giving season charitable campaigns and tax deductibility, it is clear that donors to TLYCS are responsive to that set of incentives.
In contrast, donors to TLYCS appear less motivated by discrete disasters. For example, Hurricane Dorian and the Australia Bushfires were two significant natural disasters in 2019 identified by the Center for Disaster Philanthropy.13 Figure 3.4 shows no change in donation activity around those events. However, we do see a general uptick in donations following the acceleration of COVID-19 transmission in the US. The magnitude of the COVID-19 event and TLYCS’s addition of a dedicated COVID-19 fund may have contributed to the uptick.

16 BEHAVIORAL INSIGHTS TO END GLOBAL POVERTY
Figure 3.3 Daily Website Donations in the US and Australia
Figure 3.4 Daily Website Donations and World Events
Another timing consideration is the day of the week of donations. The data does not indicate any statistically significant preference for weekdays versus the weekend with regard to donations. The number of average donations per day is heavily influenced by the day of the week that Dec. 30 and Dec. 31st fall on, so we do not read much into Tuesday being the highest donation day in the last year (see Appendix Figure A.4).
We wondered whether there might be a “payday effect” in which case those of working age might show an increase in donations on weekends relative to other age groups. Appendix Figure A.5 shows no evidence of donors being influenced positively by payday. If there were evidence of a payday effect, that would give credence to interventions increasing the salience of TLYCS around payday. Perhaps not surprisingly given the rational nature of effective altruism, TLYCS donors appear to be more geared toward planning than giving spontaneously.
In total, donations seem to be driven by giving seasons in the US and Australia and not by large calamities. There do not appear to be patterns in terms of the day of the week of donations, including no distinguishable “payday effect.”
Analysis of Landing Pages
The most heavily trafficked landing page – the first page that a website visitor sees – is unsurprisingly the homepage. As shown in Table 3.1, it is responsible for one-quarter of all sessions. The next most popular page is the “Best Charities”
page. There is a large drop-off between the “Best Charities” Page and the third most popular landing page, “The Book.” It is noteworthy that relatively well-trafficked pages like “The Book” and the “Positive Effects of Donating Money to Charity Blog” have a low bounce rate but also a very low donation rate. In contrast, those who land on the “Impact Calculator” page are fewer in number, but are more likely to donate.
The high bounce rate and low donation rate of the “Best Charities” page relative to the homepage stand out. However, visitors to the “Best Charities” page are more likely to be first-time visitors, so the discrepancy is in part due to the composition of visitors. Yet, restricting to only first-time visitors still results in a higher bounce rate (80% vs. 70%) and a lower donation rate (0.7% vs. 1.3%) for the“Best Charities” page. It may be the case that first-time visitors landing on the “Best Charities” page are different from those landing on the homepage, but there is suggestive evidence that the “Best Charities” page is underperforming compared to the homepage. This could be due to the number of charity choices on the “Best Charities” page.
The homepage does a good job of directing people to the “The Book” page. Nearly one-quarter of users who clickthrough on the homepage go to “The Book”. Further, the homepage accounts for nearly 90% of all traffic to “The Book”. However, people who come to the homepage are still most interested in investigating charities – over one-third of click-throughs from the homepage go to the “Best Charities” page or pages for specific charities.
17 C ONTE x T AND D IAGNOSTICS
The homepage and the “Best Charities” page are the most popular pages but the “Best Charities” page does worse than the homepage in terms of bounce rate and donation rate, which could be driven by the profusion of choices on the “Best Charities” page.
Social Media Is a Promising Growth Opportunity
Of the main acquisition channels, social media accounts for the smallest share of users to the website. Similarly, users acquired via social media make up a relatively small share of website donations
(see Figure 3.5, Panel A). However, the users acquired on social media are more likely than the average user to make a donation. In fact, Panel B of Figure 3.5 illustrates that the percentage of sessions resulting in a donation is greater for social media acquisitions than it is for email acquisitions – a group that we think would be similarly situated in terms of passive interest in TLYCS.
The majority of those accessing the website via social media are coming from Facebook. Facebook is even more dominant when it comes to the share of donations – users acquired via Facebook make up over 80% of donations acquired via social media. Twitter
18 BEHAVIORAL INSIGHTS TO END GLOBAL POVERTY
and Instagram Landing Pages % of All Sessions % of Sessions by First-Time Visitors Bounce % % of Sessions Resulting in Donation on Website Home Page 25% 78% 67% 1.93% Best Charities 17% 90% 79% 1.07% The Book 8% 76% 55% 0.21% Blog: Positive Effects of Donating money to Charity 5% 89% 56% 0.00% Causes to Support (make an Impact Page) 2% 94% 81% 0.11% Common Objections to Giving 2% 87% 88% 0.02% Book Download 2% 39% 63% 0.01% Private Podcast Setup Instructions 1% 47% 84% 0.03% Causes to SupportWomen's Charities 1% 91% 82% 0.67% Impact Calculator 1% 68% 69% 1.43% Take the Pledge (Calculate annual suggested donation) 1% 71% 36% 1.04%
Table 3.1 Landing Pages
follow with 8% and 3%, respectively, of donations acquired via social media. Social media seems to have outsized success in attracting recurring website donors, which constitute a small but valuable group. Figure 3.6 shows recurring donors and one-time donors broken down by the main acquisition channels. We see that social media accounts for a larger portion of recurring donors than it does of one-time donors. In order to produce this breakdown in Google Analytics, we were limited to examining three-month periods. However, the result appears to be robust to different three-month periods in the last year.
Another factor is that compared to other acquisition channels, social media skews much more heavily to mobile users. As shown in Panel A of Figure 3.7, mobile users make up about 30% of website users as well as website donors. Yet, mobile users make up nearly 70% of those acquired via social media. And in times of high-interest, like giving season, mobile
users appear to be more responsive, making up a much larger share of users in December than in the rest of the year (see Figure 3.7, Panel B). Consequently, enhancing social media engagement may open the door to a more elastic part of the market.
19 C ONTE x T AND D IAGNOSTICS
Panel A Panel B
Figure 3.5 Website Donations and Conversion Rates, by Main Acquisition Channels
4 4 5 9 32 44 0 10 20 30 40 50 Paid Search Referral Social Email Direct Organic Search Share of Donations (%) 0.35 1.03 1.56 1.4 1.87 1.68 0 0.5 1 1.5 2 Paid Search Referral Social Email Direct Organic Search Sessions Resulting in Website Donation (%) 49 5 29 4 10 3 36 6 37 6 4 8 0 10 20 30 40 50 60 Organic Search Paid Search Direct Referral Social Email Recurring Donors One-time Donors
Figure 3.6 Recurring and One-time Website Donors, by Major Acquisition Channel
Share of Website Donations Within Type (%)
Figure 3.7 Website Users by Device Type Panel A Panel B
Social media is not currently a major source of acquisition for the TLYCS website, but the data suggests it may be a particularly effective channel to target when it comes to increasing donations and broadening TLYCS’s reach. We think interventions geared toward social media are a promising avenue for testing.
Charity Choices Show the Influence of the Layout of the “Best Charities” Page
Website users interested in donating have an abundance of choices. They can donate to one of TLYCS’s more than 20 recommended charities, they can donate to all the charities, or they can donate to TLYCS itself. Panel A of Figure 3.8 shows the top charity choices among donors, as well as the TLYCS itself. The “All Charities’’ option is by far the most popular choice among donors in the last year, followed by the Against malaria Foundation. All other options are significantly less popular than the top two.
The layout of the “Best Charities” page likely plays a large role in the popularity of the “All Charities” option. It is the only visible option when a user opens the “Best Charities” page and it is also highlighted in yellow. In addition to the influence of the web page design, the popularity of the “All Charities” option may be aided by the fact that it removes the cognitive cost of choosing a specific charity.
Layout may also be a factor for the popularity of the Against malaria Foundation. It is positioned in the upperleft-most quadrant of the charity options grid, which is where people typically start when reading a table. The average donation amounts shown in Panel B of Figure 3.8 reveal that despite being a popular charity choice, the Against malaria Foundation receives significantly smaller donations, on average, compared to the other top charity choices. It is not clear why this is the case, but one hypothesis is that the low cost and effectiveness of mosquito nets is relatively well known. Therefore, small donors interested in
20 BEHAVIORAL INSIGHTS TO END GLOBAL POVERTY
3 29 69 4 31 65 0 20 40 60 80 Tablet Mobile Desktop Website Users Website Donors Share of Website Users and Website Donors (%) 0 25 50 75 100 Nov '19 Dec '19 Jan '20 Feb '20 Mar '20 Apr '20 May '20 Jun '20 Jul '20 Aug '20 Sep '20 Oct '20 Desktop Share Mobile Share Share of Desktop vs. Mobile Users Over Time (%)
Figure 3.8 Top Charity Choices Among Website Donors Panel
making impact may turn to the Against malaria Foundation as a familiar and perceived maximum impact option. Lastly, it’s worth noting that average donations to TLYCS operations are of similar size to those to the Against malaria Foundation.
In sum, the “All Charities” option is by far the most popular option for donations, which is likely driven in large part by the
layout of the “Best Charities” page. The Against malaria Foundation also likely benefits from the layout of the “Best Charities” page, but the substantially lower average donation amount suggests the Against malaria Foundation is particularly attractive to small donors.
21 C ONTE x T AND D IAGNOSTICS
236 251 261 272 295 342 418 476 896 1,658 0 1000 2000 TLYCS Fred Hollows Foundation Project Healthy Children Oxfam Evidence Action COVID-19 Fund Give Directly Fistula Foundation Against Malaria Foundation All Charities Number of Website Donations 123 264 193 208 180 256 249 239 128 254 0 100 200 300 TLYCS Fred Hollows Foundation Project Healthy Children Oxfam Evidence Action COVID-19 Fund Give Directly Fistula Foundation Against Malaria Foundation All Charities Average Website Donation Amount ($) 236 251 261 272 295 476 896 0 1000 2000 Fred Hollows Foundation Healthy Oxfam Evidence Action All
A Panel B
Intervention Design 4
In researching how to increase levels of charitable giving, we found that there are two well-studied challenges on the donor side: (1) donors rarely give as much as they would like, and (2) donors are often unable to articulate consistent, evidence-based approaches to choosing the recipients of their donations.14 From a behavioral perspective, charities must also vie for limited cognitive attention, as potential donors find themselves distracted by flashy advertising campaigns or diverted by events in their own lives. Given this multitude of obstacles, increasing charitable giving can feel like an insurmountable challenge, particularly for under-resourced charities that focus on less flashy, albeit necessary, causes.
In this literature review, we present findings from a survey of field-based or “field-like” experiments that utilize behavioral insights within the domain of charities and charity-adjacent organizations.
In pursuit of this goal, we will articulate findings from behavioral science literature as they relate to particular behavioral principles, namely: choice architecture, social norms, empathy, overhead cost aversion, and anchoring. These five fundamentals may be particularly important for The Life You Can Save because they are backed by multiple behavioral science studies; we offer more complete evidence for these strategies below. In choosing these five principles,
we thought about the full process of donation, from start to finish. What motivates a potential donor to give to charity (empathy and social norms)? How they can be guided through the donation process via careful website design (anchoring and choice architecture)? And what aspects of charity organizational structure may make donors less inclined to contribute (overhead cost aversion)?
The literature review is structured as follows: first, we will briefly discuss the five selected behavioral principles. Then, we will turn our attention to evidence of said behavioral principles. Finally, we will conclude by looking at the behavioral science principles at work on the websites of other charitable organizations of similar caliber and mission to The Life You Can Save.
Description of Selected Behavioral Principles
Our literature review focuses on evidence that maps onto five standard behavioral science principles: choice architecture, social norms, empathy, overhead cost aversion, and anchoring. Our process of selection was to provide evidence from field-experiments, as this is more applicable to the work of The Life You Can Save. Our goal is to offer opportunities via these studies to re-think future strategies and assess past work. For completeness, we briefly define these principles below before proceeding to summaries of their evidence.
22 BEHAVIORAL INSIGHTS TO END GLOBAL POVERTY
Choice Architecture refers to the practice of “organizing the context in which people make decisions.”15 From behavioral science, we know that people do not make decisions in a vacuum; rather, when presented with a decision, they will generally prefer to take the easiest option out of laziness, fear, or distraction.16 Thus, the designers who structure the decision-making process (i.e. choice architects) can steer participants towards particular choices via carefully thought-out strategies that account for different human tendencies, such as the desire to adopt simplifying strategies when choices become too numerous, to be unaware of different incentives for behavior, or to make simple human errors.17 In the context of The Life You Can Save, choice architecture is particularly salient to website navigation – the primary means of accessing information about the organization. We asked ourselves, does the website offer opportunities for default decision-making, and are there complicated choices that can be simplified?
Social Norms are the “informal rules that govern behavior in groups and society.”18 Whether with peers, social referents, or a broader community, social norms govern our actions by determining the bounds of acceptable and unacceptable behavior. Social norms incorporate both what people do (“descriptive norms”) and what people ought to do according to societal standards (“injunctive norms”).
Empathy is the ability to put oneself in another’s shoes, and as such is a powerful behavioral principle for charitable giving. In terms of different types of empathy, scholars such as Paul Bloom generally
distinguish between cognitive empathy and emotional empathy Cognitive empathy refers to the more cerebral process of assessing what other people are thinking, their personal motivations, their plans, and their beliefs. Conversely, emotional empathy is based on feelings: it helps you to feel the pain of others in less fortunate circumstances and to revel in the warmth of doing something good for someone else.19 At its best, empathy leads a well-off donor to contribute to something that will help someone else, without any expectation of self-benefit. However, empathy can also have downsides, which will be further explored below.
Overhead Cost Aversion refers to the reluctance and “negative feelings donors have [about contributing] towards a charity’s overheads costs.”20 It builds off of empathetic tendencies: donors want to help the community they feel pain for, not the professionals who organize and distribute that money to the cause. It is a behavioral bottleneck that can work against charities if not identified. Other charitable organizations like GiveWell and Charity Navigator are successful in part because they help publicize information that some donors may be seeking to assuage overhead cost aversion.
Anchoring is the tendency for people to focus “more than necessary on arbitrary values.”21 Charities often use anchoring principles when creating suggested donation sums (e.g. $10 or $20); a donor may not have thought about their optimal donation amount prior to looking on the website, but may donate the suggested anchor precisely because it was presented as the default option.
23 I NTERVENTION D ESIGN
Evidence of the Five Principles
Choice Architecture is most commonly understood from the opt-in, opt-out framework –– the setting of default options – used to great success. Testing different default options has been well studied, and to generally positive effect, in several domains such as investment decisions,22 insurance options,23 energy use,24 and organ donation.25 While the principle has been well demonstrated in these domains, its generalizability to settings of charitable organizations is an uncertainty our literature review aims to address.
Our review of the charitable giving literature suggests that choice architecture remains an important facet of design setting. Schulz et al’s study goal is to determine whether choice architecture can alter the extensive margin of donating to charities (i.e. whether to donate or not to donate).26 The researchers are interested in the intensive margin (amount donated conditional on donating) but do not find larger effects for this behavior. In a sample of 869 Swiss university students, each student fills out a sheet on whether they would donate or not; half are randomly provided a list of five charities and option to specify their own, while the other half are given no list and are asked to provide their own charity. Then, winners were randomly chosen and given approximately $90, and their donations were recorded.
Schulz et al. find that by providing a list to students, the likelihood of donation doubles and that the sum donated does not change conditional on the treatment.
Projecting to The Life You Can Save, this evidence supports the current approach
of listing the recommended charities. One area to consider is whether the number of charities presented is too many or just enough: this study used a list of five ––would these effects hold with a longer list?
Soyer and Hogarth analyze this question in the context of charitable giving.27 They vary the size of the list of charities between three options: lists of three, eight, and sixteen charities and randomly assign subjects to receive approximately $50, making sure that each treatment group is well represented. For this treatment condition, Soyer and Hogarth utilize a sample of 145 participants in Spain who were enrolled in an online market research panel. The list of eight is the original list of three plus five new (lesser known) charities. The same goes for the list of sixteen: it is built off of the previous list of eight with eight new additions. The researchers show that as the number of charities increases, so too does the sum donated. Further, they show that in the group with the smallest list size, only 25% of respondents donate the entirety of their winnings, whereas in the group with the largest list size, this figure jumps to 50%. moreover, when donors were provided with more options, they opted to spread more of the donation sum around (and kept less for themselves). This reduced the total amount of donations received among the original three charities.
These papers offer some suggestive evidence building off of our understanding of the principles of behavioral science: at some point there will be “too many charities,” too many options. Finding the right number to present is key. The Life You Can Save supports 22 charities and offers options to donate to one specific
24 BEHAVIORAL INSIGHTS TO END GLOBAL POVERTY
charity or to all partner charities at once. As will be discussed later in the report, The Life You Can Save may consider grouping charities by themes or regions of the world. These are two examples of grouping that would limit the size of presented options and to measure whether donations vary based on this design. Furthermore, the Soyer and Hogarth paper indicate that as the number of charities increases, so too does the amount donated, but in a decreasing manner to any individual charity. The Life You Can Save may want to consider this effect as it decides how many options it advertises in the future.
Social norms and social incentives are well-known design principles within the charitable giving space. For example, peer effects, i.e. the effects that behaviors sourced from a common group of people have on decision-making, is reliant on social norms. They reinforce the notions of what is acceptable behavior by rewarding actions that promote those behaviors. In a study by Smith, Windmeijer, and Wright, peer effects were studied to see if any effects on donation likelihood or amount were observed.28 They examine over 10,000 fundraising pages from runners in the London marathon to see how page navigation behavior was predictive of donation behavior. The primary mechanism at play was the ‘advertisability’ of a donor’s action: their name and donation amount are published on the donation page and this effect may affect future donors’ amounts.29 They find that, in addition to a slightly larger donation, successive donations tend to cluster within the distribution of peers: large donations elicit large donations and
small donations promote small donations. New donors do not seek to be the largest or smallest donor, but rather squarely within the middle. The researchers also posit that peer effects are highest within tight groups such as families, friends, and social groups.
In another contribution to the social norms and charitable giving literature, milkman and kessler study how the priming of different aspects of a donor’s identity affects donations.30 They focus on data provided by the American Red Cross from past fundraising efforts. In one analysis, they examined over 17,000 solicitation letters sent in January 2010 to previous donors who had not donated in the preceding 24 months. Half of the respondents were randomly assigned to receive a letter outlining their former gift, while the other half received no such reminder. This is the ‘previous donor prime.’ In a second analysis, the authors examine a fundraising round from 2009 in which the American Red Cross randomly assigned one of four different ‘community member prime’ solicitation letters to recipients who had never donated before. Instead of priming a previous donation, they study to what extent identifying people as a member of a state or city in the United States affected donation level. Milkman and Kessler find that both the ‘previous donor’ and ‘community member’ treatment primes increased donations by 20-30% over the control groups –a substantial effect in the charitable giving world. The Life You Can Save could potentially adopt these findings by engaging previous donors vis-a-vis a ‘previous donor’ prime and contact new, potential donors as particular members of
25 I NTERVENTION D ESIGN
a community – be that geographic (e.g. Queensland, Australia) or interest group (e.g. the effective altruism community).
Expanding our focus from identityspecific social norms – we turn to another behavioral science principle: reciprocity Reciprocity means that “in response to friendly actions, people are frequently much nicer and much more cooperative … [and] conversely, in response to hostile actions they are frequently much more nasty and even brutal.”31 This is applicable both for in-group and out-group behaviors and can be mapped onto the charitable giving environment. By receiving something (such as a small gift), charities can nudge potential donors into becoming active donors. Armin Falk studied whether reciprocity affected donation levels for a Swiss charity in a 2007 paper.32 With a sample of 10,000 solicitation letters, one third of recipients received a letter with a small gift, one third received a large gift, and the remaining third received no gift. Falk randomly assigned the letter plus gift condition (or no gift condition) and measured the groups’ reciprocal donation amounts. He found sizable effects to support the gift-exchange hypothesis: offering a gift resulted in larger returns and higher response rates. This was particularly true among small donations, which are much more attenuated to small behavioral nudges than are large donations; while both small and large donations are affected by the “warm-glow” effect, only large donations are primarily moved by outside motivations like reputational incentives.33 The Life You Can Save may think about adopting a similar gift-giving effort for particular, one-time fundraising drives.
Finally, the last important social incentive within this literature review is empathy As discussed above, while in popular parlance empathy only has good connotations, in terms of charitable giving, empathy (and particularly parochial empathy) can be an obstacle to giving generously to international causes. For example, Small, Loewenstein, and Slovic hypothesized that when donating to charitable causes, people do not value lives consistently. In order to test this hypothesis, they conducted four separate experiments with university students, with sample sizes ranging from 121 to 165. The students were asked to complete surveys for a $5 reward. After finishing the survey, students were then asked how much of that reward they were willing to donate to charity. Over the course of the four experiments, the researchers tested what kinds of victims prompted more donations, and whether informing students about differences in victim type would create divergent donation responses. Overall, the authors found evidence of the identifiable victim effect, in which more money and resources are dedicated to helping a single visible victim, even though more people would be helped if resources were dispersed or spent protecting future victims.34 On average, donations for identifiable victims were about $1.50 more than for other kinds of victims (108.8% increase compared to statistical victims and 66.4% increase compared to identifiable victims with statistics).35
This is an important finding for The Life You Can Save, as much of the organization’s work focuses on statistical victims in far-flung locales, who by virtue of their distance from Western donors
26 BEHAVIORAL INSIGHTS TO END GLOBAL POVERTY
and the decreased visibility of their circumstances are less likely to arouse empathy. Furthermore, even when the researchers prompted participants to think more deliberately about identifiable victims versus statistical victims, they found that support for identifiable victims decreased with more time to think and process (rather than feel), but low support for statistical victims remained virtually unchanged.
In another study on the limits of empathy, Sudhir, Roy, and Cherian emphasize that in-group versus out-group status matters a great deal in charitable giving. In a study with 185,000 prospective new donors in India, they found that participants were more likely to donate to certain kinds of identifiable victims, in this case elderly persons who were suffering from poverty. Prospective new donors were more inclined to donate to elderly victims who are members of the in-group (Hindus) rather than identifiable victims who are members of the out-group (in this example, Christians). Furthermore, the authors also find evidence for reference dependent sympathy. 36 Victims who are described as currently destitute, but previously well-off, generated 50% more donors and 33% more average donations than identifiable victims who were described as presently destitute, but whose past was left undefined.37 This is also important for The Life You Can Save, as most of those who are living in extreme poverty are chronically poor, and are less likely to have suffered a recent change in fortunes that might elicit more empathy.
Overhead cost aversion is also relevant to the conversation on charitable giving. We present three papers of empirical
findings relevant to this principle within the charitable giving space.
Gneezy et al. study whether charities with different levels of promoted overhead costs received significantly different levels of donations.38 Indeed, in their field experiment with 40,000 potential donors, participants who were randomly assigned the same charity with varying levels of overhead costs (0%, 5%, and 50%) decreased their rate of donation as the overhead ratio increased. The authors point to this drop-off in donations as a signal of disinterest in inefficiency. To tease out whether participants were actually dissuaded by inefficiency instead of overhead cost aversion, the researchers tweaked the experiment by explaining to participants that while the overhead ratios “are what they are (5% and 50%), the overhead costs have already been paid for by an outside donation, so 100% of your donation goes to the cause.” The results are striking. They find no significant difference in donations to the 5% and 50% charities in this second condition. One conclusion from this paper is the importance of advertising that overhead costs have been covered (if they have been), and also of reducing overhead costs wherever possible as a means of making the charity more attractive to prospective donors. Donors do not necessarily care if charities have high overheads; they just don’t want their own contributions to cover the overhead.
Caviola et al. continue in the line of research to suss out the difference between efficiency and overhead costs.39 They propose that evaluability bias influences decision making in the context
27 I NTERVENTION D ESIGN
of charitable giving: people tend to have a strong preference for charities with low overhead ratios (lower administrative expenses), but not for charities with high cost-effectiveness (greater number of saved lives per dollar), because the former attribute is easier to evaluate than the latter. In line with this hypothesis, they report the results of four studies with sample sizes ranging from 84 participants to 201 participants, which showed that when presented with a single charity, people are willing to donate more to a charity with low overhead ratio, regardless of cost-effectiveness. The evidence in this paper is weak, stemming from a small sample of online survey takers who may not be representative of the overall population. It does, however, raise interesting questions of how The Life You Can Save may decide to reframe itself, such as whether it continues to center a message of efficiency, or ‘smart giving,’ if that is not a message that strongly resonates with prospective donors.40
Lastly, Portillo and Stinn provide a fairly straightforward study measuring preferences of overhead cost aversion. 41 In a large sample of university undergraduate students in intro-level courses, the researchers examine an experimental setting where people are given money and information about two charities whose overhead costs are known. Respondents report feeling more favorable to the charity with lower overhead costs. When confronted with two charities with similar overhead costs, donors prefer to give to fundraising efforts instead of salary related expenses by a 2-1 margin (salary expenses are understood as overhead costs). Again, this
implies that overhead costs can have a larger than expected influence on whether or not prospective donors follow through with charitable giving.
The last principle of the literature review is anchoring, which is the tendency towards relying upon one specific piece of presented information (or “anchor”) when making decisions. Based on our review of the literature, we propose that The Life You Can Save harness anchoring to encourage certain desirable behaviors from donors, such as making recurring monthly donations. The Life You Can Save can also use anchoring to suggest a specific contribution amount from donors, which would be especially effective if they showed which percentage of donors contributes that amount (e.g. 95% of donors contribute $50 or month every month).
Behavioral science has shown ample evidence of anchoring as a bias that impacts everyday decision-making, from choosing between different T-shirts at a clothing store to making predictions about future stock market prices based on today’s market appraisals. To test the strength of anchoring bias in the charitable giving space, Hysenbelli, Rubaltelli, and Rumiati ran two experiments on Italian university students. In Experiment 1, the authors divided up 137 students into groups classified as No Anchor (NA), Low Anchor (LA), and High Anchor (HA). The students were then presented with information about an identifiable victim and asked what amount they would contribute to said victim. The authors observed statistically significant differences, with higher contributions coming out of the
28 BEHAVIORAL INSIGHTS TO END GLOBAL POVERTY
HA group. Experiment 2 of the paper builds two more dimensions into the conversation on anchoring: in-group versus out-group identity of the identifiable victim, as well the identity of other donors. Thus, the experiment has four conditions: two additional scenarios presented a needy African child rather than a needy Italian child, and two additional scenarios discussed average German contribution rather than average Italian contribution. Overall, the authors found that the HA condition still induces more gift giving than the LA condition or the NA condition, but also that contributions are higher when allocated for in-group members and anchored on in-group donation averages.42
As we will discuss in Section 5, the interventions that we propose for The Life You Can Save’s social media channels and long-term website redesign focus most heavily on anchoring, choice architecture, and social norms. From our initial social media testing, we found that donor testimonials were indeed an effective way to gain more engagement and excitement from the digital community of The Life You Can Save. As the evidence on social norms in the experiments above suggest, hearing from donors about their reasons for getting involved with effective altruism clearly resonated with digital users who likely shared some similarities with the donors in question. Looking towards future website redesigns, we see that the principles of anchoring and choice architecture offer promise for simplifying decision-making about giving via The Life You Can Save, particularly through the “Best Charities” page. The suggested interventions will quickly tailor strategies of giving to each potential donor’s needs,
allowing them to customize where they give, how frequently they give, and how much they give in a way that aligns with their values and their lifestyle.
Assessment of Peer Charity Evaluator Websites
We offer a comparative assessment of how effective altruism-focused organizations that are similar to The Life You Can Save have designed their websites. We compare the websites of GiveWell and Charity Navigator with a particular eye on how these organizations use the five behavioral principles outlined in the literature review.
GiveWell has an easy, approachable format for its homepage (see Figure 4.1). The color scheme is muted, the “Donate” button is flagged as a different color from everything else, the logo and topic areas are centered on the page, and the visitor is presented a large, static graphic ostensibly portraying work that one of its top charities engages in.
Charity Navigator’s homepage, while full of good information, instantly appears more dated in appearance compared to The Life You Can Save and GiveWell (see Figure 4.2). The font appears clunkier, there are no moving pictures to display the work of the charity, and the color scheme is darker and less inviting. However, some aspects of the homepage work quite well; for example, the “Support Charity Navigator” button is highlighted in bright red, which makes it easier to find for potential donors. Furthermore, for those who are familiar with effective altruism
29 I NTERVENTION D ESIGN


30 BEHAVIORAL INSIGHTS TO END GLOBAL POVERTY
Figure 4.1 GiveWell Homepage
Figure 4.2 Charity Navigator Homepage
Figure 4.3 The Life You Can Save Homepage
(like many of the donors to The Life You Can Save), the website prominently displays some buzzwords that can help to catch their attention: “make an impact,” “ensure your giving is impactful,” “learn about our compass rating system.” Charity Navigator also highlights its own accomplishments at the bottom of the homepage, which helps build credibility with prospective donors about the organization’s work and longevity.
The Life You Can Save’s homepage is bright and punchy. The font and pictures appear up-to-date and modern, and several slogans that reflect the values of effective altruism are immediately apparent: “Smart Giving, Simplified” and “Multiply your impact.” However, while the homepage has a lot of information, a casual viewer would not necessarily know to keep scrolling to find everything, and there’s not a lot of signage that would make this clear (i.e. “keep scrolling to read more” or using arrows to indicate that people should continue reading until the bottom of the webpage).
Principle 1: Choice Architecture
GiveWell’s homepage does not implement choice architecture via a default, optin opt-out model, but the framing of the website is simple and uncomplicated. When one hovers over the topic areas at the top, the visitor is not bombarded with choice overload of links. Careful attention has been paid to the framing of the homepage.
Choice architecture is also unclear on Charity Navigator’s homepage; their approach seems to be to offer as much information as possible, and to allow
prospective donors to sort through these options individually. However, the “hot topics” section on the homepage is helpful in that it broadly categorizes popular causes for donors to learn more about, like “breast cancer charities” or the “Beirut explosion.” Still, beyond the prominently displayed donation button on the homepage, it’s not clear how a prospective donor would move from learning this information to putting it into practice.
Similarly to Charity Navigator, it’s not clear what path is encouraged for visitors to the homepage of The Life You Can Save. Rather than clearly designating a path from point of entry to donation, it seems as though each tab (“Best Charities,” “Act Now,” “The Book,” etc. have myriad links and topics that can lead visitors all over the site in an unstructured fashion.
Principle 2: Social Norms
The social norms implemented by GiveWell appear to rely more on the community of donors than the recipients of aid. GiveWell seems to intuit that its target visitor is someone who does not need convincing about whether to donate so much as to where to donate. The social norms thus rely on the objective of the effectiveness of the donation and the visitor’s preference to center that and not on aspects such as popularity and what others may think is best.
Social norms are the most interesting section on the Charity Navigator homepage. Its “top ten lists” explicitly state such categories as the charities that are most popular, charities that are supported by celebrities, and the charities that are expanding most quickly. This is a clear attempt to influence prospective donors
31 I NTERVENTION D ESIGN
by letting them know about other donors’ preferences; one would imagine that for many people, knowledge of how their peers or how famous celebrities support Charity Navigator would be a big incentive to also participate.
Unlike the other two charities, The Life You Can Save appears to rely less on social norms as a means of encouraging charitable giving, with the exception of one section: Giving Games. In short, The Life You Can Save runs Giving Games that are designed to introduce potential donors to the methods of effective giving and to spread these concepts within a network of people. This creates more peer effects, as coworkers, friends, or families who play the Giving Games together may be more incentivized to give if they see how others within their networks respond to the game.
Principle 3: Empathy
Empathy is not widely used on the GiveWell homepage. Though there is a picture of a young child, the website proffers much more information about GiveWell itself with sections on “How We Work” and “Our mistakes” (emphasis added) and its charities. It gets right to the mission of the organization.
Empathy is also not widely leveraged on the homepage for Charity Navigator. Some of the “hot topics” might be classified as such because they involve more identifiable victims, but it’s not clear that personal stories are shared on this website as a means of building community.
Empathy is not used by The Life You Can on the “Best Charities” page. Currently, the website relies heavily upon presenting as
much information as possible to visitors, which can be overwhelming and difficult to sort through. A better strategy would be to share the personal stories of the people whose lives will be improved by the generosity of donors to The Life You Can Save and its partner charities.
Principle 4: Overhead Cost Aversion
Overhead cost aversion is not explicitly worked into the GiveWell website design but the spirit of the principle shows up in several instances. Similar to the above paragraph about empathy, the website goes to great length to advertise in which ways a donation benefits the charity. In fact, it is the guiding principle of GiveWell and the organization does a good job of advertising its mission both actively and passively. For example, GiveWell offers an Impact Calculator under their “Giving Effectively” tab which allows users to see how far their donation can go (see Figure 4.4).
Interestingly enough, for Charity Navigator, overhead cost aversion is also addressed within the aforementioned “top ten lists” section. Not only does Charity Navigator point to the most efficient charities, including ones with “perfect impact scores,” but they also note “10 charities overpaying their for-profit fundraisers” (see Figure 4.5). By delineating between these distinct groups, Charity Navigator can subtly steer prospective donors towards charities that are more aligned with effective altruism principles.
The Life You Can Save takes a similar approach to GiveWell. Under the “Best Charities” page, there is a subsection entitled “How We Curate Our Charities.”
32 BEHAVIORAL INSIGHTS TO END GLOBAL POVERTY


33 I NTERVENTION D ESIGN
Figure 4.4 GiveWell Impact Calculator
Figure 4.5 Charity Navigator Top Ten Lists
Figure 4.6 The Life You Can Save Impact Calculator
This subsection gives a clear and simple explanation of how The Life You Can Save defines effectiveness and chooses its partner charities; the criteria on efficiency is particularly useful, since it asks if a partner charities’ programs are costeffective and offering the most return for each dollar donated. On another section of the website, The Life You Can Save also includes a calculator so that prospective donors can understand the impact that their individual donations have (see Figure 4.6).
Principle 5: Anchoring
The GiveWell website does not use anchors. The website does not have suggestions of, for example, “giving $10 or $20.” Rather, they rely more heavily on the Impact Calculator, which allows the visitor to toggle with various donations in order to see how the size of their donation increases the effect of their giving. When one navigates to the donation section of the website, however, an anchor of $100 is filled in as a default giving option.
Conversely, Charity Navigator does use anchoring on its donation page. It offers two options for frequency: donors can either donate once or monthly. moreover, Charity Navigator includes suggested amounts –– $35, $50, $100, and $250 (along with an “other” option).
Like Charity Navigator, The Life You Can Save displays anchoring amounts on the donation page, ranging from $250 to $1,000. However, the donation page did not anchor the frequency of donations (e.g. monthly, yearly, one-time).
Conclusion
GiveWell does not widely use the five principles from the literature review, but they do use some elements effectively within their mission and framing. The organization may not be targeting feelings of empathy within a visitor if they believe the type of visitor to their website does not need emotional persuasion, only information to allow for the most costeffective donation. The website reflects this: there is an abundance of cost-benefit analyses on the charities and language centering on effectiveness.
Charity Navigator uses some but not all of the five behavioral science principles that we identified in this literature review. However, the website is a useful platform for finding out about effective and ineffective charities according to the guidelines of effective altruism; this is a valuable tool for those who may have just begun their charitable donation journey.
Finally, The Life You Can Save uses anchoring and social norms in different parts of the website. However, there is room to use the behavioral science principles, which will be further discussed in the sections below on social media and long-term website redesign.
34 BEHAVIORAL INSIGHTS TO END GLOBAL POVERTY
The Intervention 5
Understanding the characteristics and behavior of TLYCS’s potential donors, preliminary assessments of the behavioral bottlenecks they encounter, and the literature review, this section proposes several interventions. These interventions rely upon The Life You Can Save’s main touchpoints with the community: social media, their website, and the newsletter. Together, these interventions represent our suggestions for the most promising tests to start a long-term learning agenda.
Our team sought to test the proposed interventions by measuring the performance of a specific series of posts on TLYCS’s major social media platforms. This testing structure was designed within strict time constraints, which proved incompatible with conducting randomized controlled trials (RCTs) or A/B testing over a longer period of time . Therefore, our team developed a testing strategy over social media, which could provide nearterm, useful data on which to base more robust future social media RCTs or A/B testing, while operating within the confines of our compressed time window.
We also propose several interventions using the website and newsletter. A donation quiz will simplify the difficult choice for potential donors among the curated effective charities. Current newsletter subscribers can be leveraged to build The Life You Can Save’s community by inviting them to share the book. And focusing content at the top of
the homepage on specific impacts will promote website engagement, especially among new users.
Social Media Testing Structure
Our testing structure was composed of a series of test posts on Facebook, Twitter, and Instagram, posted from November 16 to 30, 2020. These test posts consisted of posts with a broad charity framing, with specific cause framing, donor testimonials, and a post centered around Peter Singer’s TED Talk on effective altruism. To remain consistent, the posts were all uploaded to the social media platforms around 12pm ET each day. The test posts were randomly rotated between the various components, and interspersed with a few exogenous control posts that TLYCS conducted as normal, for example a November 24 post for a virtual live crowdfunding event to be held December 7, a post about gratitude on November 25 (Thanksgiving) and a November 28 post about how to download Singer’s book.
Strategy
Given tight timelines, our team had to manage competing demands for broader insights on different types of framings and content, while attempting to maintain a degree of statistical power. Traditional RCT or A/B testing proved challenging over social media, and would probably best be conducted through social media advertising, to allow for small, specific tweaks that could be tested among
35 T HE I NTERVENTION
large populations. However, our team developed a next-best testing strategy for the near-term. The initial test posts should provide a launching point for further research and discussion, and lead to more robust testing strategies for the future as discussed in the final section of the report.
Our testing strategy was to maximize the compressed testing window by proposing four sets of two to five posts, so that we could compare across as well as within the categories. This would allow us to test a number of different framings and concepts, while still maintaining a degree of internal comparison, albeit largely qualitative. Because more than a single attribute varies across these posts, we could not directly target and test a specific behavioral insight without creating highly repetitive content, which itself risks confounding results. However, the content within a set of test posts was varied, providing us a glimpse into potential mechanisms to explain variation in post performance.
Post performance was measured by an array of engagement metrics on Hootsuite, against a baseline post performance. Baseline post performance was measured in three ways, by average post performance during the same window last November, controlling for number of followers, average post performance over the last three months, and other posts from TLYCS over the testing period.
Data and Interpretation
The social media test posts ran over a period of two weeks, from November 16 to 30, 2020. These tests included four posts on Instagram, nine posts on Twitter, and
eleven posts on Facebook. To analyze the relative performance of these posts we utilized post performance data from Hootsuite to calculate social media metrics for the test posts, which we compared to the average metrics for control posts TLYCS made during the testing window, averages from the previous three months (August 1 to October 31, 2020), and from the same two-week window last year (November 11 to 25, 2019), to control for seasonal patterns of giving.
As shown in Figure 5.1, Panels A and B, test posts on Twitter and Instagram performed similarly to control posts during the same window, averages from posts in the previous three months, and averages from posts in the same two-week window last year.
However, one notable difference (though not statistically significant, given the small sample sizes) was with reactions on Facebook. The test posts had nearly double the average reactions than the other posts TLYCS made during the twoweek testing window (averaging 10.8 average reactions per post, versus the 5.8 for the controls), and above the average Facebook reactions per post for the previous three months (8.0) and from this two-week period in November 2019 (7.5), as shown in Figure 5.1 Panel C.
This higher average was largely driven by elevated engagement with two of the donor testimonials (10 and 23 reactions per post, see Figure 5.2 Panels A and B, respectively) and a post about Singer’s TED Talk (30 reactions), as shown in Figure 5.2 Panel C.
36 BEHAVIORAL INSIGHTS TO END GLOBAL POVERTY
Note: November 2019 data not available for Instagram. These three posts were the reason for higher Facebook metrics in the test posts, relative to the average test post performance on Twitter and Instagram. Of these three high performing posts, only the first donor testimonial (Figure 5.2 Panel A) was posted on another platform, Twitter, where it performed above average, as well. These findings do not represent robust quantitative evaluation but rather a good starting point for further testing. In sum, donor stories performed well and appeared to drive social media engagement. They are likely a good starting point for building community and leveraging the “social” aspect of social media. Additionally, the TED Talk post with an impact framing performed well, notably because the post was not actually a video post. Its strong performance speaks to the power of video among social media supporters. It is also worth exploring how to splice and distribute clips of Singer, which could drive higher social media engagement.
Proposed Website and Newsletter Tests
It would be valuable for The Life You Can Save to use behavioral science interventions beyond just their social media accounts. Their website and newsletter offer possibilities for several highly-promising interventions to achieve the organization’s goals that could not be achieved using social media alone.
Simplifying Donation Decision Bottlenecks Through a Quiz
The Life You Can Save has taken the approach of providing as much information as possible about its partner charities on the website. For current adherents to the effective altruism approach, particularly those from the tech community, maximizing data and information is likely the best way to increase their participation. However, in order to expand its appeal
37 T HE I NTERVENTION
Nov. 2020 (tests) Nov. 2020 (controls) Aug. to Sep. 2020 Nov. 2019 1.1 2.3 1.5 3.5 1.3 3.0 0.7 1.9 Retweets Likes 0.4 32.3 0.8 24.6 0.0 26.3 Comments Likes * * 0.2 3.0 7.5 0.4 2.8 8.0 0.7 0.9 5.8 0.4 2.3 10.8 Comments Shares Reactions
Figure 5.1 Average Engagement per Post by Social Media Platform Panel A: Twitter Panel B: Instagram Panel C: Facebook
Figure 5.2 Most Popular Test Facebook Posts


38 BEHAVIORAL INSIGHTS TO END GLOBAL POVERTY
Panel A: Donor Testimonial 1
Panel B: Donor Testimonial 2
Panel C: Singer’s TED Talk
to a broader audience, The Life You Can Save will need to develop tools that help potential donors sort through donation options and charities more quickly and easily. We suggest that one of these tools be a decision-tree quiz, which will carefully guide prospective donors through a series of questions before creating a custom recommendation of donation amount, frequency, and charity type for each donor. This will reduce decision fatigue and give busy new donors an easier way to get involved.
Description of Behavioral Bottlenecks
As mentioned above, the most visited page on The Life You Can Save’s website is the section entitled “Best Charities.” This page lists all 23 partner charities, with a brief description of their work and links to learn more. Also, the page features a filtering tool, in which donors can sort by tax deductible status, broad categories describing the charities, and the country in which each charity operates.
However, unless potential donors are used to sorting through large quantities of information, the information presented on the “Best Charities” page can be incredibly daunting.
First, the donor has to browse through the information presented on the crowded “Best Charities” page. Then, they have to decide which charity is their preferred donation vehicle, or if they would like to give some amount to split between all of the partner charities. Finally, the donor has to decide on the amount to give, as well as the frequency. Clearly, this is a lengthy process, and at multiple points, it’s easy to see where a donor might choose to close
the website (which contributes to the high bounce rate) rather than donating. The identified bottlenecks are as follows:
Limited cognitive bandwidth. Behavioral science and common sense both tell us that the average person has many different topics occupying their thoughts at any given point in time. Given all of this mental noise, it’s important to make choices clear and easy for donors, who might otherwise be overwhelmed by the amount of information presented and leave the website without committing to a donation.
Choice architecture. Even if a prospective donor is excited about The Life You Can Save, the website doesn’t simplify the decision-making context for donors. For example, there are no clear nudges to donors to choose one donation option over another, and there doesn’t seem to be a good default option. Using the filters is somewhat helpful, but it’s not clear how donors should shift from understanding the purposes of each charity to actually making a donation.
Anchoring. The website also misses out on a good opportunity to anchor prospective donors to a specific donation quantity or a set frequency of giving. For example, the website could set the default donation option at $50/month, rather than having donors choose the amount and frequency themselves without guidelines.
Proposed Intervention and How It Addresses Bottleneck
The Life You Can Save’s current website design is predicated on two assumptions; donors prefer to have more information
39 T HE I NTERVENTION
than not, and donors require little guidance in making their decisions about which charities to support. While these assumptions may hold if the donor pool remains similar to its current composition (tech workers who are comfortable with cost/benefit analysis and like to see numbers and statistics), adhering to these established design principles may hamper long-term growth if potential new donors with different preferences are not reflected in an updated website design.
In place of the current system, we propose to guide prospective donors using a decision-tree quiz similar to Buzzfeed. Using no more than ten questions, the quiz will ask prospective donors about the topics they’re interested in, their annual budget for charity donation, and ways they prefer to connect with The Life You Can Save’s donor community. The quiz should be highlighted prominently on the “Best Charities” page with simple language, such as “Take a quick quiz to figure out the right charity for you!”
This quiz will address the bottlenecks discussed above in several ways. First, it will allow busy people who may not have time to read through the particularities of each charity to get a sense of which charity best matches their interests and priorities with regards to charitable giving. This will eliminate the need for donors to spend a long time on the website as well –- they can quickly view the charitable page, take the quiz, donate, and leave, a streamlined process that will appeal to busy professionals.
Second, the quiz will give prospective donors an actionable way to get involved,
with parameters set up beforehand. Rather than repeatedly urging donors to donate, but not providing advice on how much to give, the quiz can recommend a donation amount and frequency that works for the donor’s lifestyle.
Finally, the quiz can also be made shareable on various social media platforms, such as Facebook, Instagram, and Twitter. By encouraging donors to share their results, we can leverage social norms to encourage a set donation, which behavioral science has shown can be helpful for people in maintaining their commitment level. Sharing the quiz results would also attract other donors to The Life You Can Save, who will see the social norms of charitable donations promoted online by their friends and family. This may spark an interest in donating themselves and create a sense of fun around the process of donation.
A sample quiz is included in the appendix (see Appendix Figure A.6).
How to Test Intervention Effectiveness
Assessing the success of this intervention in increasing donations will depend on several workarounds and the types of questions offered towards the end of the quiz.
First, the Google Analytics of the “Best Charities” page can be compared before the quiz is available on the website, and after the quiz is launched. If time spent on this section increases, and more people navigate from this section towards the donation page, that will be an important finding.
40 BEHAVIORAL INSIGHTS TO END GLOBAL POVERTY
Second, the quiz can be designed with an explicit request for a donation at the end. After making the recommendation of which charity the donor should select and with what frequency the donation should be made, the final question can simply ask, “Are you ready to donate now?” Rather than assuming that donors will immediately move from finishing the quiz to making the donation, making this the default as part of the quiz’s choice architecture will hopefully make the donation process as seamless as possible. This can be measured by assessing donations before and after the creation of the quiz, and also measuring if more donations were made by new donors than before.
Finally, the quiz should ask potential donors how they found out about The Life You Can Save. While this might not be directly pertinent to simplifying donations decisions, it would provide valuable insight to The Life You Can Save on which messaging strategies are most effective at reaching the broadest group of donors. We can also monitor how many people choose to share their results on social media, which is a good proxy for seeing how many new people are being exposed to the concepts of effective altruism and The Life You Can Save.
Since creating a quiz can be done for free through Google or very cheaply with external software, even a small increase in donations from this intervention can be considered cost-effective.
Leveraging Social Referents and Gifting to Build the TLYCS Community
One of The Life You Can Save’s goals is to raise awareness of Singer’s ideas and build the effective altruism community. The Life You Can Save already has a burgeoning community surrounding it, comprising thousands of followers on social media and around 25,000 newsletter subscribers. All have expressed interest in Singer’s ideas and effective altruism. However, there are only limited and cognitively-taxing ways for individual users to build the movement, meaning that The Life You Can Save has to do all of the work. making it easier for current followers to bring new people into the community is an easy and cost-effective way to build the movement.
Description of Behavioral Bottlenecks
The Life You Can Save has a page on its website dedicated to sharing Singer’s book. This page has shortcuts to sharing the book on Twitter, Facebook, LinkedIn, WhatsApp, and via email. Users can also copy a link to the book download page and share using any other medium.
Several of the sharing shortcuts provide suggested content written by The Life You Can Save staff along with the website link. The content currently suggested by The Life You Can Save by platform is summarized in Table 5.1.
41 T HE I NTERVENTION
Table
Platform TLYCS’ suggested Content
Twitter
People struggle to live on less than you spend on a bottle of water. The new edition of #TheLifeYouCanSave by @PeterSinger shows how you can help change that - download it here for FREE today! #SmartGivingSimplified
https://www.thelifeyoucansave.org/the-book
WhatsApp Read a book, Save lives. The new edition of The Life You Can Save by Peter Singer shows how you can actually save lives - download it for FREE today
https://www.thelifeyoucansave.org/the-book
Email Subject: The Book - The Life You Can Save
Body: Get your free copy of #TheLifeYouCanSave and learn how you can help end world poverty.
https://www.thelifeyoucansave.org/the-book
#SmartGivingSimplified
On Facebook and LinkedIn, the link is shared as an article, which automatically shows a short preview text similar to the suggested content for Twitter, WhatsApp, and email.
Figure 5.3 is a journey map tracing the process from a member of The Live You Can Save’s current community deciding they want to share the book to the invitee
downloading the book. The bottlenecks targeted by this intervention are circled.
This is a cognitively taxing process for potential sharers. First, they need to decide they want to share the book. Then, they have to find out how to do so: by going to the website and finding the “Share the Book” page. This seems to be a significant bottleneck for potential
Figure 5.3 Journey Map for Sharing the Book

42 BEHAVIORAL INSIGHTS TO END GLOBAL POVERTY
5.1 Currently Suggested Content by TLYCS for Sharing the Book by Platform
sharers; the “Share the Book” page had only about 1,900 visitors in the last year, compared with over 58,400 to the main book download page.
There are also bottlenecks for the people who receive the message. An invitee needs to see the recommendation to download the book. This involves both being on the same platform that the invitee is as well as competing with all of the other content the invitee is seeing for their attention.
Next, the invitee needs to decide that the book recommendation is useful to them. This is a significant bottleneck for invitees that differs by platform. Although the available sharing options are presented together, they accomplish fundamentally different goals. The Twitter, Facebook, and LinkedIn options are all for public posts that function more as signals than as a personal recommendation. Everyone associated with the user will see the same message. It is unlikely they will consider it a recommendation made personally to them and feel a strong connection with it, even if sent by someone they know.
Additionally, the suggested content does not imply any kind of personal recommendation, even on platforms that are person-to-person (WhatsApp, email). None of the suggested content includes a first-person pronoun, and the uses of second-person pronouns (“you”) are all abstract – not meant for the recipient to interpret it as a conversation between the recommender and them. This limits the effectiveness of the recommendation.
Proposed Intervention and How It Addresses Bottlenecks
The Life You Can Save currently has about 25,000 email newsletter subscribers, all of whom have expressed interest in Singer’s ideas. Additionally, about 10,000 of those subscribers did so through the process for downloading the book. Therefore, they are a promising target population for encouraging peer-topeer sharing of the book.
To overcome the bottleneck requiring potential sharers to independently think of sharing the book, The Live You Can Save would send a one-time email to current newsletter subscribers, inviting them to share the book with their friends. Several sample emails, using different framing, are provided in the Appendix (see Appendix Figures A.7 and A.8). Subscribers interested in sharing the book can copy suggested content to simplify composing the email and send it to their friends using their own email address.
In addition to “nudging” current subscribers to share the book by reminding them of the option to do so, the email frames it as an unexpected gift. As shown in this report’s literature review, unexpected gifts often make the receiver feel an obligation for reciprocity. The email will remind subscribers of the impact that the book and Singer’s ideas made in their life and encourage them to share that gift with their friends.
Additionally, suggesting a limit on the number of people they can share the book is advantageous for several reasons. First, it makes the task of deciding who to share the book with easier – the
43 T HE I NTERVENTION
recommender only needs to think of one or two people who would enjoy the book. Additionally, it increases the perceived value of recommending the book. Because recommendations are portrayed as a limited resource, recommenders will try to maximize their value by only recommending the book to the people they think will get the most from it.
This intervention also improves the process for the people who are invited to download the book. Invitees will receive an email from someone they know with a personal message suggesting the book. This method is more likely to cause people to download the book because it comes as personally recommended by someone the invitee trusts (giving it a higher perceived benefit) and because of the power of free.
How to Test Intervention Effectiveness
Determining if these one-off email invitations are effective at leveraging the existing connections to build the community requires a careful testing strategy with several parts.
The first step is determining if the email invitation to current subscribers is effective at encouraging subscribers to share the book. It will be challenging to determine exactly how many times the book is shared given legal restrictions against The Life You Can Save sending emails without receiving permission from the address’s owner. Due to this consideration, the test has subscribers invite friends using suggested content through their own email. While this gets around the legal restriction, we lose the ability to accurately track the number of times the book is shared.
There are several indirect measures we can use instead. Through The Life You Can Save’s email vendor, we know if the email was opened. This is certainly an imperfect measure, as it is likely that only a small share of the people who open the email will share the book. We can also track how many people unsubscribe through the invitation email. This is a fairly drastic measure that lets us know that something about the invite (or the broader frequency of contact) is not what the recipient preferred.
Other options, each with advantages and downsides, include: asking senders to blind-copy The Life You Can Save on the email(s) they send, asking senders to share that they send a book invitation on social media while tagging The Life You Can Save in return for some prize (perhaps a thank-you email from Singer), and conducting polls of a random sample of newsletter subscribers about whether they’ve shared the book or not before and after they are invited to do so.
The main issue with all of the methods previously mentioned is that reporting that someone shared the book requires an extra step, that will likely have high-drop off – meaning measures derived from it are not accurate. Ideally, there would be some way that we can track interaction with the email without requiring a separate step from the sender. For example, we might include a button that automatically copies the suggested email – giving recipients an incentive to use it – while also reporting that it was clicked – giving us a fairly accurate measure of at least how many people shared the book (if not how many times it was shared).
44 BEHAVIORAL INSIGHTS TO END GLOBAL POVERTY
We can track the success of encouraging people to download the book in several ways. The most accurate is to include a unique link in the suggested content email. This means that only people who receive that email will follow that link. The unique link doesn’t necessarily need to take users to a new page, requiring the web developer’s time. Instead, it could be a simple redirect to the main book download page. An alternative option that is less accurate but easier to implement is to include the main book download page link in the invitation, as with all current share materials. This method won’t require any of the web developer’s time, but we won’t be able to precisely attribute changes in traffic to the book download page to the invitation campaign. Statistical methods can help us estimate a convincing counterfactual, but we cannot isolate the effect of the invitations from the effect of anything else happening at the same time (for example, a book club chooses to read the book for their next meeting).
Since this intervention is effectively costless to The Life You Can Save, even a small increase in book shares and downloads is cost-effective. If successful, The Life You Can Save can leverage similar campaigns to continue building the movement using community and giftgiving frames. Some examples include encouraging people to donate on behalf of a friend’s birthday or other special occasion, “gifting yourself” by donating on your own birthday, donating enough to cover the cost of sending the book to a “penpal” or reading group somewhere.
Impact-Focused Messages on Website Homepage
Behavioral and marketing researchers frequently find that messages focused on clear, concrete impacts are more effective than abstract messages. User experience designers also know that people are more likely to see and interact with content near the top of a webpage, especially if it is on the first screen that users see.
Optimizing the top screen of the homepage can improve the user experience for both new and returning users. Having impact-focused messages first will entice first-time users to stay while they are making a split-second, partially subconscious decision about whether to stay on the website or not. Impactfocused messages will also encourage returning users to interact with the website – by clicking through to another page or donating – by reminding them of the impact their donation will have.
Description of Behavioral Bottlenecks
Figure 5.4 shows The Life You Can Save’s website homepage for both desktop and mobile on November 27, 2020. The top of the page features a video on “Smart Giving Simplified,” which is echoed by the text accompanying the video. Below the bolded title of “Smart Giving, Simplified” is two sentences about The Life You Can Save’s mission.
Figure 5.5 shows the journey map that a new user follows when arriving at the website. The proposed intervention focuses on new users that arrive at the website without a set intention (ex. coming
45 T HE I NTERVENTION
to the website to download Singer’s book). The specific behavioral bottlenecks targeted are circled in red.
most people who have not yet been to The Life You Can Save’s website, here called “new users,” will know if they arrived at the website with a specific intention. For example, a new user might be looking to download Singer’s book, or heard about a specific charity from a friend and now wants to learn more. The primary behavioral bottleneck to these users achieving their goal is if they are unable to navigate the website. The Life You Can Save’s website is well organized, with intuitive navigation across the top bar and a search function. It is unlikely that many new users fail in their search for specific content.


A key group to target is new users who arrive at the website without a specific
intention. These users are more likely to come from social media links or organic Google searches for keywords such as “effective altruism,” “Peter Singer,” or “best charities.” Upon arriving at the website, these new users do not have a specific goal. Perhaps they want to learn more about The Life You Can Save, or read about effective charities, etc., but there are many ways to achieve these less specific goals.
These new users often make a splitsecond, partially subconscious decision about whether to stay on the website or not. According to Google Analytics data, 73% of homepage visitors are first-time visitors, while more than half (53%) of homepage visitors leave the website without visiting another page. Optimizing the website’s design, especially the top of the homepage – the first thing visitors see, and the only thing many visitors will see
46 BEHAVIORAL INSIGHTS TO END GLOBAL POVERTY
Figure 5.4 The Life You Can Save Website Homepage on Desktop and Mobile Panel B: Mobile Panel A: Desktop
– is key to better capturing the attention of new users and increasing website engagement.
The first behavioral bottleneck for new users without a specific reason for reaching the website is deciding whether the website applies to them. The key drivers for this are their personal identity (whether they identify with The Life You Can Save’s mission) and cognitive load (whether it is easy to find and understand information on the website). After deciding that the website applies to them, new users need to decide if they want to stay on the website.43 This is where it is key to capture the new user’s attention. Their decision to stay or leave will largely be based on cognitive load (whether it is easy to find and understand information on the website), salience (whether the content feels applicable to them at that moment), and empathy (whether they care about the potential ultimate recipients of their donation).

Returning users follow a similar process. Returning users who know what they
want will navigate to that information. Returning users who do not know what they want will, like new users, decide if the website applies to them and if they want to stay. Creating content that encourages returning users to stay on the website is both easier and more challenging than for new users. Given that they chose to return to the website, it is likely that returning users believe the website applies to them. However, content needs to be changed periodically to maintain its effect on returning users.
The current content at the top of the homepage is not focused on concrete impacts. The phrase “Smart Giving, Simplified” is potentially confusing to a new user unfamiliar with Singer’s ideas or effective altruism – what is “smart giving”? The first line of the paragraph below the title explains, but it is likely that many visitors will not read that content. Additionally, saying that “[w]e aim to create a world where…” is abstract and risks triggering a visitor’s incredulity that it is ever possible to eliminate suffering and extreme poverty.
47 T HE I NTERVENTION
Figure 5.5 Journey Map for New Users Interacting With Website
Panel A: Desktop
Panel B: Mobile
Proposed Intervention and How It Addresses Bottlenecks
The Life You Can Save can increase user engagement with the website homepage by focusing content at the top of the page on concrete impacts. Using a rotating feature of images and examples from the impact calculator is likely to maximize its effectiveness.

One possible implementation of this idea is shown in Figure 5.6. This proposal uses examples from the impact calculator to provide concrete examples of the impact people can have. It also frames donations in terms of what people can give up (here, a latte a week for a year). The illustrated example shows giving up a $4 latte each week for a year ($208), which the impact calculator shows will buy 104 bednets for the Against malaria Foundation, each of which protects two people (a total of 208 recipients) for up to three years.

The impact calculator is a unique and impressive asset that can be readily leveraged for providing examples of impacts. Although Figure 5.6 is static, the website version should cycle to a new “card” every five seconds or so. Each card will illustrate the impact of giving up something for different charities. Cycling cards will grab the visitor’s attention, as humans are naturally drawn to movement. It also makes the feature more appealing to returning visitors by providing new content. It is also easy to update the feature with new impact cards periodically to refresh the website.
There are other behavioral advantages to this design. The dropdown offering different items to sacrifice gets the user to ask, what else can I give up? The cycling cards begs the question, who else can I protect? The whole feature is set up to be partially interactive (the user chooses
48 BEHAVIORAL INSIGHTS TO END GLOBAL POVERTY
Figure 5.6 Impact-Focused Redesign Website Homepage on Desktop and Mobile
what to sacrifice), drawing them in and starting their relationship with The Life You Can Save by thinking about Singer’s ideas in a way that does not require any prior knowledge.
The “Learn More” button could go either to the “Best Charities” page, the page of the individual charity featured, the impact calculator, or any other applicable page. It could also be changed to a “Donate” button.
Figure 5.6 demonstrates the design on desktop as well as mobile. Recall that mobile uses are 31% of website users, and an even higher share during the high-traffic, high-donation giving season. Therefore, it is imperative that the design works on mobile as well.
The proposed design removes the “Smarter Giving, Simplified” branding from the top of the homepage. This is unlikely to significantly harm The Life You Can Save’s branding efforts, but several actions can be taken to mitigate this effect. The feature just below the cycling impact cards can be changed to “Smart Giving, Simplified” with links to an “About Us” page and social media accounts. Also, the “Smart Giving, Simplified” branding could be worked into the impact cards.
The attention-grabbing design of the impact cards addresses users’ cognitive load, while the relatable items to sacrifice are highly salient and the protection framing appeals to users’ identity and empathy.
How to Test Intervention Effectiveness
It is best to use an A/B test to evaluate the effectiveness of this intervention. In the A/B test, two versions of the website homepage would be live at the same time: one with the then-current homepage design, and the other with the cycling impact cards. Users would be randomized to see one version of the page or the other when navigating to the website. Since both pages are live at the same time, and users are randomly assigned to a homepage version, any observed differences (beyond sampling error) in website interaction are due to the different designs.
The key outcome to measure is engagement with the website. Google Analytics offers several useful metrics for this, but time spent on the website and the share of visitors that visit multiple pages are probably the most important. The evaluation should also consider subgroups of users, with the most relevant subgroup comparison being between first-time visitors and returning visitors.
If an A/B test is not possible, then an interrupted time series design could be used to estimate the effectiveness of the intervention. An interrupted time series design requires a long period of trend data for the key outcomes. It assumes that any deviation from the trend that is contemporaneous with the intervention is because of the intervention. The main drawback of this method is that it is impossible to separate the effect of the intervention with any other chance time effects (ex. Increased interest following Singer being interviewed on a podcast).
49 T HE I NTERVENTION
This intervention is low-cost to The Life You Can Save, requiring only web developer time. The research for the impacts is already done, and The Life You Can Save already has pictures they can use for the cards. This intervention will require fairly substantial up-front web development, but maintenance costs should be very low (only requiring changing out the cards periodically).
Why These Tests Are the Most Promising
As an operating charity with an important mission, it is important that The Life You Can Save can both learn to improve processes while devoting resources to only the most promising interventions. This chapter summarized several highlypromising interventions on social media and through the website. These tests should only be seen as a starting point for a behavioral science-inspired research and design agenda.
Our initial social media testing identified several promising strategies for The Life You Can Save. Posts highlighting donor stories did well, including two of the highest reaction posts on Facebook. The Facebook post about Singer’s TED talk also performed well. Together, the social media testing showed the power of highlighting personal stories and interactive content that leverages the unique strengths of social media platforms.
We also proposed three tests using two of The Life You Can Save’s most prominent other touchpoints with the community: the website and newsletter. The donation quiz optimizes the complicated choice architecture of choosing between the many curated effective charities. The invitation to share the book to newsletter subscribers crowdsources expanding The Life You Can Save’s community by leveraging reciprocity and social norms. And changing the top of the homepage to a cycling feature of impact-focused cards will increase engagement with the website by creating an engaging feature that aligns with visitors’ identity, is salient, and encourages empathy.
Broadly, we believe that these interventions are the most promising starting point for a long-term learning agenda. Each of these interventions is supported by original data collected by the team or by our review of the literature on behavioral science. Implementing and evaluating these interventions is the first step to actively leveraging behavioral science to increase donations and build The Life You Can Save’s community. Lessons learned from evaluating the effectiveness of these interventions should be used to improve them and for informing future interventions. Fully integrating behavioral science into The Life You Can Save’s operations requires a comprehensive learning agenda, the subject of Section 6.
50 BEHAVIORAL INSIGHTS TO END GLOBAL POVERTY
Learning 6
The interventions described in the last section represent a promising starting point for a broader learning agenda at The Life You Can Save. However, the success of any behavioral intervention is dependent upon the specific context that it is implemented in. Creating the optimal intervention for The Life You Can Save’s unique context requires constant evaluation and adaptation. In short, to get the most out of behavioral interventions, The Life You Can Save needs a long-term learning strategy.
Figure 6.1 shows that, in behavioral science, learning is an ongoing process. It begins with defining and diagnosing a behavioral bottleneck and researching past studies conducted on similar topics in similar contexts. Using that information, interventions are designed to address the behavioral bottleneck. The most promising

interventions are implemented and their results are evaluated to determine what works best among the set. Adapting the best intervention, or parts from several interventions, is key to long-term success. Periodically, the behavioral bottleneck should be reexamined to determine if the implemented intervention is still working as intended or if the behavioral bottlenecks need to be redefined and rediagnosed, starting the process again.
Consider the example of the email invitation to share the book intervention proposed in the last section. Evaluating the intervention may find that the most effective part of the intervention is the salient reminder to share the book, not the reciprocity or community building frames. In that case, an adaptation may be that The Life You Can Save continues to use email invitations to share the book, but
Source: World Bank. 2015. World Development Report 2015: mind, Society, and Behavior. Washington, DC: World Bank. doi: 10.1596/978-1-4648-0342-0.
51 L EARNING
Figure 6.1 Behavioral Science Learning Is an Ongoing Process
instead does so surrounding highly-salient events or holidays, such as campaigns around giving season, end of the school year/beginning of summer, or birthdays. By continually redesigning the intervention based on evaluation results, The Life You Can Save can maximize its effectiveness for their own operations and contribute to the body of behavioral science knowledge.
Our Recommendations for Long-Term Website Design
We conducted a market segmentation analysis of The Life You Can Save’s current users. Users include people who already have exposure to or are sympathetic to effective altruism. However, in keeping with The Life You Can Save’s unique place within the effective altruism community, the organization also appeals to people without any prior knowledge of effective altruism or Singer’s ideas. These two different broad categorizations of users require different strategies to appeal to them.
Currently, The Life You Can Save’s website is a trove of information on Singer’s ideas, the effective altruism movement, and the curated charities. This is great for motivated users who are knowledgeable about effective altruism; The Life You Can Save provides them a real service by conducting research and making it available publicly.
However, this level of detail can be intimidating for new users. With so many options, a new user can be intimidated and decide to leave the website. This is the behavioral paradox of choice discussed many times in this report.
One example is the “Best Charities” navigation menu, shown in Figure 6.2. It offers three broad categories (“Best Charities,” “Make An Impact,” and “Other”), with multiple options under each. All told, this single menu offers 34 sub-options under the broad categories. Confronted with this number of possibilities, only the most motivated users will quickly find their way to where they intend to go.

52 BEHAVIORAL INSIGHTS TO END GLOBAL POVERTY
Figure 6.2 Options Under The “Best Charities” Navigation Menu
Broadly, our recommendation for a longterm website design is to simplify pages and options to make it clear what the user is expected to do on that page This will highlight The Life You Can Save’s excellent and persuasive content while making it easier for users to move through the website to find the content they want. Several specific recommendations related to this are below:
Create a single “Donation” landing page. Currently, The Life You Can Save’s website has many different options for donations of various types. We propose to collect the different donation options on a singular “Donation” landing page, as a means of simplifying the choice architecture.
Organize charities by cause. Currently charities are listed by name, although only few of the charities are widely known (ex. Oxfam) or have a descriptive name (ex. Against malaria Foundation). Conversely, website visitors might be more likely to have some knowledge of specific causes (ex. malaria, reproductive health) and which causes they are passionate about. The Life You Can Save should present their curated charities by cause, similar to the current “Make An Impact”/“Causes To Support” page, to simplify the choice architecture and better align with prospective donors’ identity.
Include links to social media accounts on the book download page. Right now, after downloading Singer’s book, website visitors are encouraged to donate. However, this is a relatively costly action that people may not be willing to do early in their relationship with The Life You Can Save. Instead, the book download page
should prominently include links to follow The Life You Can Save on social media in order to start a longer-term relationship with the visitor. This capitalizes on the reciprocity norm felt by many people after receiving a gift by asking for something costless (following social media accounts) in return.
Optimize website design to maximize attention to key information. Like many modern, visually appealing websites, The Life You Can Save’s website is built from modules that “stack” on each other. The order of these modules is important, as user experience research finds that people are less likely to see content further down a page, and that users that do see that content are likely to be different from the “average” user. The Life You Can Save should experiment with the optimal order of modules, especially near the top of pages with high traffic (such as the “Best Charities” page and the homepage). What constitutes the “optimal” order is not objectively clear, and is likely to change over time. However, The Life You Can Save’s priority content, such as a link to download the book and social media accounts, should be prominent and near the top of the page.
Anchor donations using common consumption items. As explained in the interventions section, anchoring donations using common consumption items (such as a latte a week) can be an effective way to both increase donations and to spread Singer’s ideas. Getting the right anchor that both resonates with the potential donors’ identity and that maximizes the average donation requires additional research. For example, there
53 L EARNING
is a big value difference between giving up a latte a week for a year ($208) and a latte a day for a year ($1,460). However, fewer people might identify with a latte a day splurge than people identify with a latte a week. Other anchoring options should be explored, as well. keeping with the Google Analytics finding that The Life You Can Save website visitors are relatively more likely to search for travel and accommodations, one option may be giving up one vacation a year. But, how to value that vacation? It is possible that only a small share of website visitors can identify with giving up an expensive international vacation, while anchoring to a more modest domestic vacation might leave money on the table.
Our Recommendations for a Long-Term Social Media Plan
Currently, The Life You Can Save does not have a comprehensive social media strategy. As a first step toward creating one, we recommend using social media to study slogans and foster a sense of community. This leverages the unique advantages of social media while providing valuable insights to inform other aspects of The Life You Can Save’s communications.
Use social media to informally poll the resonance of different slogans. TLYCS currently uses several different messages, such as personal best, smart giving simplified, you don’t have to be brave to save lives, the head and the heart, etc. Social media polls can be run through posts on Facebook or Twitter, as well as on stories on Instagram.
While this approach remains a basic, informal method of testing, and would be constrained by its nature of only testing within a population of highly-engaged followers, it could provide a good baseline on which to justify future testing and refine potential hypotheses for A/B testing on the website. This type of testing is free and easy, and could also spark donor engagement with these platforms.
Use the social media channels in a more “social” way. This will increase engagement with and between donors on the platform to bolster the sense of community on TLYCS social media platforms. We recommend doing so through highlighting more donors testimonials, engaging followers in live virtual discussions with senior TLYCS members or Singer on timely effective altruism topics, or posting discussion or open-ended questions on stories to provide followers the opportunity to engage with these platforms on a more personal basis.
Our Recommendations for Future Behavioral Research
As previously mentioned, the analysis we conducted and interventions we suggest are only meant as a starting point for integrating behavioral science into The Live You Can Save’s operations. Continuing in-house behavioral research and evaluating interventions will maximize the value of the insights from this project. We offer some suggestions about how to conduct tests to support a culture of learning at The Life You Can Save.
54 BEHAVIORAL INSIGHTS TO END GLOBAL POVERTY
For future social media testing, we would recommend a period of at least one week per concept tested, in order to provide a statistically significant number of posts within a testing window. The challenge with testing over social media is balancing the need for control posts with a reticence to post redundant content. One avenue to address this would be through social media advertising, which is more conducive to traditional A/B testing.
Alternatively, The Life You Can Save could vary posts slightly over different social media platforms, and then could compare posts to average post performance on each site. Further analysis could determine if any marginal differences could be attributed to more targeted behavioral interventions, for example, posting the same content and framing with different photos attached on each social media platform.
The website naturally lends itself to A/B testing, which is a low-cost way to rigorously evaluate alternatives against
each other. Similarly to social media testing, we suggest a testing window of at least one week per concept to provide a large enough sample of visitors to the website. Testing each concept does not mean only one alternative against a control; a single A/B test can include multiple alternatives at once. The number of possible alternatives is limited by expected web traffic. The testing window should be set so that each alternative is expected to get a large enough sample to detect a reasonably small effect size.
While multiple alternatives are possible at once, only one test should be run at a time, and designers should also consider if there are other events (such as oneoff fundraisers) happening at the same time. These could all change either the composition of users on the website or the way that they interact with the website, meaning the sample is not representative of a typical user.
55 L EARNING
Endnotes
1 Of this total approximately half was sourced through public aid, such as governmental transfers, and half through private aid, such as individual gifts and contributions. Data on public aid sourced from the World Bank, “Total Official and Private Aid Flows:” https://data.oecd.org/drf/total-official-and-private-flows. htm; Data on private aid sourced from: Ruth McCambridge, “2020 Giving USA Report Both Surreal and Suggestive of Larger Change Needs,” Nonprofit Quarterly, June 16, 2020. https://nonprofitquarterly. org/2020-giving-usa-report-both-surreal-and-suggestive-of-larger-change-needs/
2 Ruth McCambridge, “2020 Giving USA Report Both Surreal and Suggestive of Larger Change Needs,” Nonprofit Quarterly, June 16, 2020. https://nonprofitquarterly.org/2020-giving-usa-report-both-surreal-andsuggestive-of-larger-change-needs/
3 The Life You Can Save, “Our Story,” accessed Dec. 4, 2020, https://www.thelifeyoucansave.org/our-story/
4 The Life You Can Save, “How We Curate Our Charities,” accessed Dec. 4, 2020, https://www.thelifeyoucansave.org/recommended-charities-methodology/
5 The Life You Can Save, “Our Story,” accessed Dec. 4, 2020, https://www.thelifeyoucansave.org/our-story/
6 Peter Singer, 2019, The Life You Can Save: How to Do Your Part to End World Poverty (10th Anniversary Edition), The Life You Can Save: Bainbridge Island, Wash.
7 T. Scott Bentley and Nick J. Ortner, 2020, “2020 U.S. Organ and Tissue Transplants: Cost Estimates, Discussion, and Emerging Issues,” milliman. https://milliman-cdn.azureedge.net/-/media/milliman/pdfs/ articles/2020-us-organ-tissue-transplants.ashx
8 The Life You Can Save, “Calculate The Impact You Can Have,” accessed Dec. 9, 2020, https://www. thelifeyoucansave.org/impact-calculator/
9 The Life You Can Save, “Best Charities,” accessed Dec. 9, 2020, https://www.thelifeyoucansave.org/ best-charities/
10 The Life You Can Save, “Giving Games,” accessed Dec. 4, 2020, https://www.thelifeyoucansave.org/ giving-games/
11 Jon Behar, “Are Giving Games a Better Way to Teach Philanthropy?” The Life You Can Save, May 8, 2017, https://www.thelifeyoucansave.org/blog/are-giving-games-a-better-way-to-teach-philanthropy/
12 Effective Altruism Survey 2019 Series: Community Demographics and Characteristics (Dec. 2019), Rethink Priorities, https://www.rethinkprojects.org/easurvey
13 Center for Disaster Philanthropy, “Disaster Profiles,” accessed Dec. 8, 2020. https://disasterphilanthropy.org/our-approach/disasters/
14 Dean Karlan, Piyush Tantia, and Sarah Welch, “Behavioral Economics and Donor Nudges: Impulse or Deliberation? (SSIR),” Stanford Social Innovation Review: Informing and Inspiring Leaders of Social Change, January 15, 2019, https://ssir.org/articles/entry/behavioral_economics_and_donor_nudges_impulse_or_deliberation, 1.
15 R.H. Thaler and Cass Sunstein. (2008). Nudge: Improving decisions about health, wealth, and happiness. New Haven, CT: Yale University Press.
16 Richard H. Thaler, Cass R. Sunstein, and John P. Balz, “Choice Architecture,” SSRN Electronic Journal, April 2, 2010, https://doi.org/10.2139/ssrn.1583509
17 Ibid.
18 Stanford Encyclopedia of Philosophy: https://plato.stanford.edu/entries/social-norms/
19 Paul Bloom, “Against Empathy,” Boston Review, April 10, 2019, http://bostonreview.net/forum/paulbloom-against-empathy
20 Javier E. Portillo, Joseph Stinn. “Overhead aversion: Do some types of overhead matter more than
56 BEHAVIORAL INSIGHTS TO END GLOBAL POVERTY
others?” Journal of Behavioral and Experimental Economics 72 (2018): Pages 40-50.
21 Dorina Hysenbelli, Enrico Rubaltelli, and Rino Rumiati, “Others’ Opinions Count, but Not All of Them: Anchoring to Ingroup versus Outgroup members’ Behavior in Charitable Giving,” Judgment and Decision Making 8, no. 6 (2013): pp. 686-687.
22 See H. Cronqvist, & R. Thaler. (2004). Design choices in privatized social security systems: learning from the Swedish experience. American Economic Review, 94, 424–428. and B. C. Madrian and D.F. Shea. (2001). The Power of Suggestion: Inertia in 401(k) Participation and Savings Behavior. Quarterly Journal of Economics, 116, 1149–1187.
23 See Johnson, E. J., Hershey, J., meszaros, J., & kunreuther, H. (1993). Framing, probability distortions, and insurance decisions. Journal of Risk and Uncertainty, 7, 35–53.
24 See kunreuther, H. (2014). Aiding Decision making to Reduce the Impacts of Climate Change. Journal of Consumer Policy, 37 (3), 397-411.
25 See Johnson, E. J., & Goldstein, D. G. (2003). Do defaults save lives? Science, 302, 1338–1339.
26 Jonathan F. Schulz, Petra Thiemann, and Christian Thöni. “Nudging generosity: Choice architecture and cognitive factors in charitable giving.” Journal of Behavioral and Experimental Economics 74 (2018): 139-145.
27 Emre Soyer and Robin M. Hogarth. “The size and distribution of donations: Effects of number of recipients.” Judgment and Decision Making 6, no. 7 (2011): 616.
28 Sarah Smith, Frank Windmeijer, and Edmund Wright, 2015. “Peer Effects in Charitable Giving: Evidence from the (Running) Field,” Economic Journal, Royal Economic Society, vol. 125(585), pages 10531071, June. http://www.bristol.ac.uk/media-library/sites/cmpo/migrated/documents/wp290.pdf
29 This approach is best understood as the mechanism for GoFundme’s website.
30 Judd B Kessler, and Katherine L. Milkman. “Identity in charitable giving.” Management Science 64, no. 2 (2018): 845-859.
31 Ernst Fehr and Simon Gächter. “Fairness and retaliation: The economics of reciprocity.” Journal of Economic Perspectives 14, no. 3 (2000): 159-181.
32 Armin Falk. “Gift exchange in the field.” Econometrica 75, no. 5 (2007): 1501-1511.
33 The warm-glow effect is the emotional reward of ‘doing something for someone else.’ It is the feeling one receives through an altruistic action.
34 Deborah A. Small, George Loewenstein, and Paul Slovic, “Sympathy and Callousness: The Impact of Deliberative Thought on Donations to Identifiable and Statistical Victims,” Organizational Behavior and Human Decision Processes 102, no. 2 (2007): p. 144, https://doi.org/10.1016/j.obhdp.2006.01.005
35 Ibid, 149.
36 According to reference dependent sympathy, victims who have experienced a sudden loss in their fortunes are generally viewed with more empathy than victims who are chronically poor, sick, etc.
37 K. Sudhir, Subroto Roy, Mathew Cherian (2016:) “Do Sympathy Biases Induce Charitable Giving? The Effects of Advertising Content,” Marketing Science 35(6): 866, https://doi.org/10.1287/mksc.2016.0989
38 Uri Gneezy, Elizabeth A. Keenan, and Ayelet Gneezy. “Avoiding overhead aversion in charity.” Science 346, no. 6209 (2014): 632-635, doi 10.1126/science.1253932.
39 Lucius Caviola, Nadira Faulmüller, Jim AC Everett, Julian Savulescu, and Guy Kahane. “The evaluability bias in charitable giving: Saving administration costs or saving lives?” Judgment and Decision Making 9, no. 4 (2014): 303.
40 The Life You Can Save’s website.
41 Portillo, Javier E., and Joseph Stinn. “Overhead aversion: Do some types of overhead matter more than others?” Journal of Behavioral and Experimental Economics 72 (2018): 40-50.
42 Dorina Hysenbelli, Enrico Rubaltelli, and Rino Rumiati, “Others’ Opinions Count, but Not All of Them: Anchoring to Ingroup versus Outgroup members’ Behavior in Charitable Giving,” Judgment and Decision Making 8, no. 6 (2013): pp. 686-687.
43 This additional step is important. For example, taxpayers would likely agree that the website of their country’s tax authority applies to them, but reading tax documents is not fun and people would likely avoid it unless they are forced to do so.
57 E NDNOTES
Context and Diagnostics
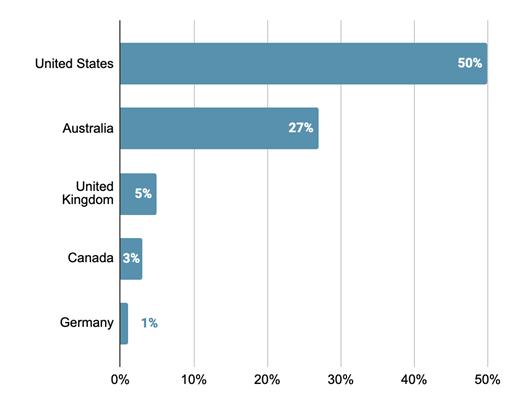


Appendix
Figure A.1 Website Bounce Rate by Age
Figure A.2 Demographics of Website Donors
Panel A. Website Donors by Gender
Panel B. Website Donors by Age
58 BEHAVIORAL INSIGHTS TO END GLOBAL POVERTY
Panel C. Website Donors by Country


59 A PPENDI x
Figure A.3 Total Website Donations and Donations per User by Age
Figure A.4 Number of Website Donations by Day of Week
Figure A.5 Number of Website Donations by Age and Day of Week
The Intervention
Figure A.6 Sample Questions for Decision-tree Quiz
Subject: Take the quiz. Join the movement.
Take this easy quiz to figure out your best charity match!
1. What charitable cause is most important to you?
a. Empowerment for women and girls
b. Preventing infectious diseases like malaria
c. Ending hunger & malnutrition
d. Improving charitable effectiveness
e. All of the above
2. Do you have a preference on the location of the charity?
a. Yes
b. No
3. What is your target donation amount?
a. $25/month
b. $50/month
c. $100/month
d. $200/month
e. more than $200/month
4. Are you ready to make your donation now?
a. Yes! I’m ready and excited to partner with The Life You Can Save.

b. Nope! I need a little more time.
Congratulations, you’ve been matched with Charity X!
Share your quiz results on Facebook, Instagram, and Twitter
60 BEHAVIORAL INSIGHTS TO END GLOBAL POVERTY
Figure A.7 Sample Email for Book Sharing, Gift-Giving Frame
Subject: Give The Life You Can Save to your friends for free
The Life You Can Save changed your life, and now you can change someone else’s
You’re already familiar with Peter Singer’s landmark ideas and now you can share the book with a friend. Together, we can build a community that is part of the solution: protecting others in extreme poverty while doing good in your own life.
For a limited time only, send Singer’s book to two of your friends or family members. They’ll be able to download the book for free, in whichever format they prefer (including an audiobook).
Simply copy the sample email below and send it to your friends. It’s that simple, and you can share Singer’s life-changing ideas.
Copy here:
Hi friend!
I want to share a special book recommendation with you. I read Peter Singer’s book, The Life You Can Save, and learned about how I can do more to help end extreme poverty around the world. You don’t need to be brave to save a life, we can do it easily just by changing the way that we donate to charity. I enjoy being a part of the solution while bringing fulfillment to my own life.
You can download the book for FREE here:
https://www.thelifeyoucansave.org/the-book/
I’m looking forward to talking with you about the book!
61 A PPENDI x
Figure A.8 Sample Email for Book Sharing, Community-Building Frame
Subject: We need your help to build the effective altruism movement
Help build our community by sharing The Life You Can Save today
Peter Singer’s transformative vision for the world includes everyone who can give, giving to effective charities. We need your help to build a community that is part of the solution: protecting others in extreme poverty while doing good in your own life.
For a limited time only, send Singer’s book to two of your friends or family members. They’ll be able to download the book for free, in whichever format they prefer (including an audiobook).
Simply copy the sample email below and send it to your friends. It’s that simple, and you can share Singer’s life-changing ideas.
Copy here:
Hi friend!
I want to share a special book recommendation with you. I read Peter Singer’s book, The Life You Can Save, and learned about how I can do more to help end extreme poverty around the world. You don’t need to be brave to save a life, we can do it easily just by changing the way that we donate to charity. I enjoy being a part of the solution while bringing fulfillment to my own life.
You can download the book for FREE here:
https://www.thelifeyoucansave.org/the-book/
I’m looking forward to talking with you about the book!
62 BEHAVIORAL INSIGHTS TO END GLOBAL POVERTY
About the Team
Beshka Asanbaev is a second year mPA student in the Economics and Public Policy track. Prior to attending Princeton, he worked in international education with Bridge International Academies and in the government of kyrgyzstan.
Nathan Babb is a second year mPA student in the Economics and Public Policy track. Prior to enrolling at Princeton he helped lead the Our Daily Bread breakfast ministry at Capitol Hill United methodist Church in Washington, DC.
Benjamin Chin is a second year mPA student in the Domestic Politics track. Prior to attending Princeton, he worked at the Center for medicare and medicaid Innovation where he was a lead policy analyst specializing in health care policy.
Anthony Cilluffo is a second year mPA student in the Economics and Public Policy track. Prior to attending Princeton, he was a research analyst at Pew Research Center focusing on social and demographic trends.
Olivia Hompe is a second year mPA student in the International Relations track. As a Scholars in the Nation’s Service Initiative (SINSI) fellow, she worked in defense and national security focused on the middle East and South Asia.
Abyssinia Lissanu is a second year mPA student in the International Relations track. As a Scholars in the Nation’s Service Initiative (SINSI) fellow, she worked in the U.S. Department of State for two years, focused on humanitarian assistance, governance, and human rights.
David Wylie is a second year mPA student in the Economics and Public Policy track. Prior to coming to Princeton he worked for three years as a research analyst at the Congressional Budget Office.
63 A BOUT THE T EA m

