Foreign
Direct Investment in Latin America and the Caribbean
2023


Thank you for your interest in this ECLAC publication
register if you would like to receive information on our editorial products and activities. When you register, you may specify your particular areas of interest and you will gain access to our products in other formats. www.issuu.com/publicacionescepal/stacks www.cepal.org/es/publicaciones/apps www.facebook.com/publicacionesdelacepal www.instagram.com/publicacionesdelacepal Register www.cepal.org/en/publications
Please
Foreign Direct Investment in Latin America and the Caribbean 2023
José Manuel Salazar-Xirinachs Executive Secretary
Raúl García-Buchaca
Deputy Executive Secretary for Management and Programme Analysis
Marco Llinás Vargas
Acting Chief, Division of Production, Productivity
Sally Shaw
Chief, Documents and Publications Division
and Management
The 2023 version of Foreign Direct Investment in Latin America and the Caribbean is the most recent edition of an annual series produced by the Unit on Investment and Corporate Strategies of the Division of Production, Productivity and Management of the Economic Commission for Latin America and the Caribbean (ECLAC). This year’s edition was prepared by Andrea Laplane, Stephania Mageste, Nikolas Passos and Nunzia Saporito, under the coordination of Cecilia Plottier. The databases were prepared by Leandro Cabello.
Comments and suggestions were received from José Manuel Salazar-Xirinachs, Marco Llinás Vargas, Martín Abeles, Vianka Aliaga, Jennifer Alvarado, Hugo Beteta, Horacio Castellaro, Pablo Chauvet, Martín Cherkasky, Carlos de Miguel, Marco Dini, Marina Gil, José Javier Gómez, Álvaro Lalanne, Mauricio León, Santiago Lorenzo, Jorge Mario Martínez, Georgina Núñez, Leda Peralta, Gabriel Porcile, Daniel Taccari, Joseluis Samaniego, Jeannette Sánchez, Cecilia Vera and Paul Wander.
Thanks are due to the government authorities and executives of companies consulted, for their inputs for the preparation of this document. Any comments or suggestions concerning the contents of this document should be addressed to Cecilia Plottier (maria.plottier@cepal.org).
The boundaries and names shown on the maps included in this publication do not imply official acceptance or endorsement by the United Nations.
ISBN: 978-92-1-122122-0 (print)
United Nations publication
• ISBN: 978-92-1-002237-8 (pdf)
Sales No.: E.23.II.G.3 • LC/PUB.2023/8-P
• Distribution: G
• ISBN: 978-92-1-358426-2 (ePub)
• Copyright © United Nations, 2023
Printed at United Nations, Santiago • S.23-00389
• All rights reserved
Explanatory notes for graphs and tables:
Three dots indicate that data are not available or are not separately reported.
A dash indicates that the amount is nil or negligible.
A full stop is used to indicate decimals.
The word “dollars” refers to United States dollars, unless otherwise specified.
A slash between years (e.g. 2022/2023) indicates a 12-month period falling between the two years.
Individual figures and percentages in graphs and tables may not always add up to the corresponding total because of rounding.
This publication should be cited as: Economic Commission for Latin America and the Caribbean (ECLAC), Foreign Direct Investment in Latin America and the Caribbean, 2023 (LC/PUB.2023/8-P), Santiago, 2023.
Applications for authorization to reproduce this work in whole or in part should be sent to the Economic Commission for Latin America and the Caribbean (ECLAC), Documents and Publications Division, publicaciones.cepal@un.org. Member States and their governmental institutions may reproduce this work without prior authorization, but are requested to mention the source and to inform ECLAC of such reproduction.
2 Economic Commission for Latin America and the Caribbean (ECLAC) Chapter I
3 Foreign Direct Investment in Latin America and the Caribbean • 2023 Chapter I Contents Executive summary ..................................................................................................................................................................... 9 Chapter I Foreign direct investment in Latin America and the Caribbean 2023 19 A. Global foreign direct investment in 2022 did not maintain the growth seen in 2021 21 B. Record rebound of FDI in Latin America and the Caribbean 25 1. Main recipient countries, components and impact on the balance of payments 25 2. Mergers and acquisitions: greater interest in investing in companies that operate in the region 30 3. Announcements of FDI projects recovered, but not to the highs recorded prior to the COVID-19 pandemic 31 4. FDI inflows by sector: services maintained its leading position and flows into natural resources and manufacturing recovered 33 5. FDI by country of origin: the United States and the European Union are still the main investors in the region 39 C. FDI outflows from Latin America and the Caribbean: outward investment hit record highs 43 D. Policies to attract investment 48 E. Conclusions 53 F. Analysis of FDI inflows by country 55 1. Brazil 55 2. Mexico 56 3. Other South American countries 57 4. Central America 59 5. The Caribbean 60 Bibliography 62 Annex I.A1 65 Chapter II Foreign direct investment in non-renewable energies in Latin America and the Caribbean: challenges for the energy transition 83 Introduction 85 A. The importance of non-renewable energy sources in the energy transition 86 1. Most final energy consumption is obtained from non-renewable sources 86 2. A secure energy transition requires planning and major investments 89 B. Geographically concentrated reserves and a market dominated by large corporations 92 1. Some countries in the region have large reserves but face challenges in exploiting them 92 2. A lucrative industry in which large state-owned corporations coexist with transnationals 95 C. An industry that generates large foreign capital flows 101 1. North America and Europe lead investments worldwide 101 2. Transnationals from other regions lead investments in Latin America and the Caribbean 108 D. Challenges and opportunities for Latin America and the Caribbean 122 1. An unavoidable risk factor: stranded assets in the context of the energy transition 122 2. Opportunities in an energy transition future: carbon dioxide capture and storage technologies 123 3. Generating value with hydrocarbons: opportunities to promote productive development 125 E. Conclusions 128 Bibliography 130 Chapter III Foreign direct investment in renewable energies: strategies to advance the energy transition in Latin America and the Caribbean 137 Introduction 139 A. The importance of renewable energy investment for the energy transition and attainment of the Sustainable Development Goals 140 1. The organization of renewable energy value chains: a sector in which technology production is highly concentrated 144 2. The mobilization of different funding sources in developing countries for the energy transition 147
4 Economic Commission for Latin America and the Caribbean (ECLAC) Chapter I Contents B. Global trends in renewable energy foreign direct investment 151 1. Wind energy: the sector attracting the world’s largest foreign direct investment announcements 155 2. Solar energy: public policies and falling costs have driven the sector’s internationalization 158 3. Green hydrogen and other clean technologies: the boom in 2022 161 4. Other energy sources 162 5. Mergers and acquisitions: a strategic tool for market access 163 C. Opportunities for the development of renewable energies in Latin America and the Caribbean 165 D. Renewable energy foreign direct investment in the region: dominated by two technologies in three countries 169 1. Solar energy 173 2. Wind energy 178 3. Other energy sources: hydropower and biomass 182 E. Policy approaches for promoting renewable energy and attracting foreign direct investment 184 1. Long-term strategies and goals 185 2. Feed-in tariffs 186 3. Auctions 186 4. Financial and fiscal incentives 187 5. Portfolio standards and quotas 188 6. Direct public sector investment 188 7. Local content requirements 189 8. Research and development and demonstration projects 190 9. Guidelines for policy design 190 F. Conclusions 191 Bibliography 193 ECLAC recent publications 199 Tables Table I.1 World (selected countries and regions): FDI inflows, 2018–2022 21 Table I.2 Latin America and the Caribbean: FDI inflows, by recipient country and subregion, 2013–2022 26 Table I.3 Latin America and the Caribbean: 20 largest cross-border mergers and acquisitions, 2022 36 Table I.4 Latin America and the Caribbean (selected countries): outward FDI, 2013–2017 and 2018–2022 43 Table I.5 Latin America and the Caribbean: 10 largest cross-border mergers and acquisitions by trans-Latin companies, 2022 45 Table I.A1.1 Latin America and the Caribbean: FDI inflows by country, 2003–2022 65 Table I.A1.2 Latin America and the Caribbean: FDI inflows by destination sector, 2008–2022 67 Table I.A1.3 Latin America and the Caribbean: FDI inflows by country or territory of origin, 2007–2022 71 Table I.A1.4 Latin America and the Caribbean: FDI inflows by component, 2007–2022 76 Table I.A1.5 Latin America and the Caribbean: FDI stock by country, 2001–2022 81 Table I.A1.6 Latin America and the Caribbean: FDI outflows by country, 2002–2022 82 Table II.1 Energy sources 86 Table II.2 Latin America and the Caribbean: total energy production and consumption by source, 2021 94 Table II.3 Largest firms in the non-renewable energies sector worldwide by income, 2021 98 Table II.4 Latin America and the Caribbean: largest firms in the non-renewable energies sector by income, 2020 99 Table II.5 Ten largest cross-border mergers and acquisitions in the non-renewable energies sector worldwide, 2015–2022 106 Table II.6 Latin America and the Caribbean: 10 largest cross-border mergers and acquisitions in the non-renewable energies sector, 2015–2022 113 Table II.7 Latin America and the Caribbean: 10 largest cross-border project announcements in the non-renewable energies sector (2015–2022) 114
5 Foreign Direct Investment in Latin America and the Caribbean • 2023 Chapter I Contents Table III.1 Top 10 investors in wind energy worldwide, 2005–2022 157 Table III.2 Top 10 solar energy investors worldwide, 2005–2022 160 Table III.3 Latin America and the Caribbean: top three renewable energy investors, 2005–2022 170 Table III.4 Latin America and the Caribbean: leading countries for solar energy investment, 2005–2022 175 Table III.5 Latin America and the Caribbean: largest solar energy mergers and acquisitions, 2005–2022 176 Table III.6 Countries originating the largest investments in wind energy, 2005–2022 179 Table III.7 Main wind energy mergers and acquisitions, 2005–2022 180 Table III.8 Policy approaches most commonly used around the world to attract international investment and develop the renewable energy sector 185 Figures Figure 1 Latin America and the Caribbean: FDI inflows, 2010–2022 11 Figure I.1 FDI project announcements, by region, 2010–2019, 2020, 2021 and 2022 22 Figure I.2 Global FDI project announcements, main sectors, 2006–2022 23 Figure I.3 United States: FDI project announcements, by region of destination, 2005–2022 24 Figure I.4 United States: FDI project announcements in the software and computer services sector, by major country of destination, 2005–2022 24 Figure I.5 Latin America and the Caribbean: FDI inflows, 2010–2022 26 Figure I.6 Latin America and the Caribbean: FDI inflows, by component, 2010–2022 28 Figure I.7 Latin America and the Caribbean: FDI stock and average return, 2010–2022 29 Figure I.8 Latin America and the Caribbean: balance-of-payments current account, by component, 2010–2022 30 Figure I.9 Latin America and the Caribbean: cross-border mergers and acquisitions, 2012–2022 31 Figure I.10 Latin America and the Caribbean: cross-border mergers and acquisitions, by country of destination, 2022 31 Figure I.11 Latin America and the Caribbean: FDI project announcements, 2005–2022 32 Figure I.12 Latin America and the Caribbean: FDI project announcements, main countries, 2021 and 2022 33 Figure I.13 Latin America and the Caribbean (12 countries): sectoral distribution of FDI inflows, 2010–2022 34 Figure I.14 Latin America and the Caribbean: cross-border mergers and acquisitions, by sector, 2006–2022 35 Figure I.15 Latin America and the Caribbean: FDI project announcements, by sector, 2022 38 Figure I.16 Latin America and the Caribbean (11 countries): distribution of FDI inflows, by origin, 2015–2022 40 Figure I.17 Latin America and the Caribbean: cross-border mergers and acquisitions, by country or region of origin, 2011–2015, 2016–2020, 2021 and 2022 41 Figure I.18 Latin America and the Caribbean: FDI project announcements, by country of origin, 2021 and 2022 42 Figure I.19 Latin America and the Caribbean: announced FDI projects from selected countries or regions, 2005–2022 43 Figure I.20 Latin America and the Caribbean (7 countries): stock of outward FDI, 2010–2022 44 Figure I.21 Latin America and the Caribbean: cross-border mergers and acquisitions by trans-Latin companies, 2012–2022 45 Figure I.22 Latin America and the Caribbean: foreign investment projects announced by trans-Latin companies, 2012–2022 47 Figure I.23 FDI project announcements by trans-Latin companies, by sector, 2021 and 2022 47 Figure I.24 Latin America and the Caribbean: mergers and acquisitions and project announcements by trans-Latin companies, by target region, 2022 48 Figure II.1 Total oil and natural gas consumption by sector, 2019 87 Figure II.2 Total final energy consumption by energy product, 2000–2020 88 Figure II.3 World and Latin America and the Caribbean: energy sources used for electric power generation, 2020 88 Figure II.4 Latin America and the Caribbean: total energy supply by source, 2020 89 Figure II.5 Global fossil fuel reserves by region, 2021 93
6 Economic Commission for Latin America and the Caribbean (ECLAC) Chapter I Contents Figure II.6 Fossil energy production and consumption, 2021 94 Figure II.7 Latin America and the Caribbean: net production of oil, coal and natural gas, 2021 95 Figure II.8 Global cross-border mergers and acquisitions and project announcements in the oil, coal and natural gas sector, 2015–2022 102 Figure II.9 Global project announcements in the oil, coal and natural gas sector by region of destination and stage of value chain, 2005–2022 103 Figure II.10 Global project announcements in the energy sector, 2005–2022 104 Figure II.11 Global project announcements in the oil, coal and natural gas sector by stage of value chain, 2005–2022 104 Figure II.12 Global project announcements in the oil, coal and natural gas sector by region of destination and origin, 2005–2022 105 Figure II.13 Global trend in cross-border mergers and acquisitions in the energy sector (2015–2022) 106 Figure II.14 Mergers and acquisitions in the oil, coal and natural gas sector by region of origin and destination, 2015–2022 107 Figure II.15 Latin America and the Caribbean (selected countries): FDI inflows in the hydrocarbons sector (2000–2022) 108 Figure II.16 Latin America and the Caribbean: cross-border mergers and acquisitions and project announcements in the oil, coal and natural gas sector, 2015–2022 112 Figure II.17 Latin America and the Caribbean: project announcements and mergers and acquisitions in the oil, coal and natural gas sector, 2015–2022 112 Figure II.18 Latin America and the Caribbean: project announcements in the oil, coal and natural gas sector by stage of value chain and amount, 2005–2022 118 Figure II.19 Latin America and the Caribbean: project announcements in the oil, coal and natural gas sector by stage of value chain and country, 2015–2022 119 Figure II.20 Latin America and the Caribbean: mergers and acquisitions in the oil, coal and natural gas sector by stage of value chain and country, 2015–2022 119 Figure II.21 Latin America and the Caribbean: project announcements in the oil, coal and natural gas sector by stage of value chain and country of origin, 2015–2022 120 Figure II.22 Latin America and the Caribbean: mergers and acquisitions by stage of value chain and country origin, 2015–2022 121 Figure II.23 Selected countries: operational carbon dioxide capture and storage projects, 2022 124 Figure III.1 Installed renewable energy capacity worldwide, in absolute terms and as a proportion of electricity capacity, 2000–2022 141 Figure III.2 Installed renewable energy capacity worldwide, by technology, 2022 142 Figure III.3 Leading producers of wind turbines worldwide, 2021 146 Figure III.4 Leading solar panel-producing countries, 2021 146 Figure III.5 Annual investment in renewable energies worldwide, by technology, 2013–2022 148 Figure III.6 Domestic and international investment in renewable energies in the different regions of the world as shares of the total, 2013–2020 150 Figure III.7 Renewable and non-renewable energy investment project announcements worldwide, 2005–2022 151 Figure III.8 Foreign direct investment announcements in the energy sector worldwide, 2020–2022 152 Figure III.9 Announcements of foreign direct investment projects in renewable and non-conventional energies worldwide, by destination region, 2005–2022 153 Figure III.10 Renewable energy project announcements worldwide, by technology, 2005–2022 155 Figure III.11 Wind energy project announcements worldwide, 2005–2022 156 Figure III.12 Solar energy project announcements worldwide, 2005–2022 158 Figure III.13 Solar power project announcements worldwide, by destination region, 2005–2013 and 2014–2022 159 Figure III.14 Announcements of foreign direct investment in green hydrogen and other clean technologies worldwide, 2016–2022 161 Figure III.15 Characteristics of mergers and acquisitions in the renewable energy sector worldwide, 2015–2022 164
7 Foreign Direct Investment in Latin America and the Caribbean • 2023 Chapter I Contents Figure III.16 Latin
technology, 2021 166 Figure III.17 Latin America and the Caribbean (24 countries): renewable energy investment project announcements, 2005–2022 169 Figure III.18 Latin America and the Caribbean (24 countries): value of renewable energy investment project announcements as a proportion of the total, by technology, 2005–2022 171 Figure III.19 Latin America and the Caribbean: cross-border renewable energy mergers and acquisitions, by region of origin, 2006–2022 172 Figure III.20 Latin America and the Caribbean (14 countries): cross-border renewable energy mergers and acquisitions, by technology, 2005–2021 173 Figure III.21 Latin America and the Caribbean (19 countries): solar energy investment project announcements, 2008–2022 174 Figure III.22 Latin America and the Caribbean (14 countries): wind energy project announcements, 2006–2022 178 Figure III.23 Latin America and the Caribbean: hydropower investment project announcements, 2005–2022 182 Figure III.24 Latin America and the Caribbean: biomass and bioenergy investment project announcements, 2005–2022 183 Boxes Box I.1 High interest rates and the growth of intercompany loans 28 Box II.1 The role of the energy sector in the net zero CO2 emission targets 90 Box II.2 Latin America and the Caribbean: new discoveries and unconventional hydrocarbon sources 109 Box II.3 Changes in the strategy of a large state-owned firm: the case of Petrobras 116 Box III.1 European Union and United States: investments and production development strategies to accelerate the energy transition 142 Box III.2 China: production development policies for renewables 148 Box III.3 Incentives for the development of emerging technologies: wind power in the United Kingdom and the United States 155 Box III.4 Renewable electricity generation: the case of Uruguay 166 Box III.5 Solar photovoltaic energy in Chile 176 Box III.6 Wind energy in Brazil 180 Diagrams Diagram III.1 Renewable energies: stylized value chain of the sector 145 Diagram III.2 Renewable energy foreign direct investment announcements worldwide, by origin and destination regions, 2005–2022 154 Diagram III.3 Mergers and acquisitions in the renewable energy sector, by regions of origin and destination, 2015–2022 165 Diagram III.4 Strategies to promote the energy transition and related capacity-building 193 Map Map III.1 Latin America and the Caribbean: current photovoltaic and wind power potential, 2023 168
America
and the Caribbean: distribution of installed electricity generation capacity, by
Executive summary
9 Foreign Direct Investment in Latin America and the Caribbean • 2023 Chapter I
10 Economic Commission for Latin America and the Caribbean (ECLAC) Chapter I
A. Overview of foreign direct investment in Latin America and the Caribbean
In 2022, global foreign direct investment (FDI) inflows fell by 12% compared to 2021 and totalled US$ 1.29 trillion, a decline that was due largely to significant divestments in Luxembourg. Excluding Luxembourg, the increase in global FDI inflows in 2022 was 11%. The value of cross-border mergers and acquisitions worldwide fell by 6% in 2022 compared to the previous year, owing mainly to weaker sales of companies in the United States, the European Union and Asia (down by 53%, 8% and 17%, respectively) (UNCTAD, 2023). However, FDI announcements —which reflect future investment plans— rose in 2022, mainly in technologically and politically strategic sectors, most notably the renewable energy sector. The value of FDI project announcements worldwide jumped by 64% to around US$ 1.2 trillion.
In Latin America and the Caribbean, meanwhile, there was a record rebound of foreign direct investment. In 2022, FDI inflows to the region grew by 55.2% compared to 2021, reaching a record high of US$ 224.579 billion. Since 2013, annual FDI inflows to the region have remained below US$ 200 billion, meaning that the recovery in 2022 marks an important investment milestone for the preceding decade. This recovery was seen in the main recipient economies and was characterized by a marked interest in services, renewed interest in hydrocarbons and continued interest in manufactures in the countries that have built the largest capacity. With this increase, FDI inflows to the region also rose, to 4.0% of GDP (see figure I).
Source: Economic Commission for Latin America and the Caribbean (ECLAC), on the basis of official figures and estimates as at 30 June 2023.
Note: Information computed in accordance with International Monetary Fund (IMF), Balance of Payments and International Investment Position Manual: Sixth Edition (BPM6), Washington, D.C., 2009, except in the cases of Guyana, Paraguay and Peru. No information is available for the Bolivarian Republic of Venezuela from 2016 onward. No 2022 data are available for Barbados and Haiti.
Brazil was the main recipient of FDI inflows in the region (41% of the total), followed by Mexico (17%). Inflows were higher in both countries than in 2021, although growth was stronger in Brazil, which accounted for 56% of the year-on-year change for the entire region. Thus, South America recorded the highest increase in FDI inflows compared with 2021.
11 Foreign Direct Investment in Latin America and the Caribbean • 2023 Chapter I Executive summary
Figure 1
224.58 4.0 0 1 2 3 4 5 6 7 0 50 100 150 200 250 2010 2011 2012 2013 2014 2015 2016 2017 2018 2019 2020 2021 2022 FDI inflows FDI inflows as a percentage of GDP (right scale)
Latin America and the Caribbean: FDI inflows, 2010–2022
(Billions of dollars and percentages of GDP)
All FDI components grew in 2022 relative to 2021, with the strongest growth recorded in reinvested earnings and intercompany loans. Reinvested earnings became the main component of FDI in the region, accounting for 43% of the total, following growth of 50% compared with the previous year. One possible explanation is that the effects of the coronavirus disease (COVID-19) pandemic likely prompted many companies to retain earnings in 2020, and subsequently direct these earnings towards a resumption of activities in 2021 and 2022. Equity, the second largest component, accounted for 36% of FDI inflows to the region in 2022, up by 22% compared to 2021. Of the three components, intercompany loans registered the strongest growth (283%), and accounted for 21% of all FDI inflows in the region.
The analysis of mergers and acquisitions in the region shows that there was an increase in foreign investors’ interest in companies operating in the region. Compared to 2021, cross-border mergers and acquisitions in Latin America and the Caribbean increased in 2022, both in number (to 327, up by 7%) and in value (to US$ 30.147 billion, 57% higher). Despite this promising trend, the amount mobilized remains below pre-pandemic levels. Brazilian assets once again attracted the most interest from transnational firms, as 31% of the deals completed in the region in 2022 took place in the country, representing growth of 18% with respect to the sluggish performance of 2021. Mexico ranks second with 29%. In almost all of the countries, more deals were closed in 2022 than in 2021. The case of Jamaica is noteworthy as the country posted a ten-year record amount for transactions —US$ 1.6 billion, linked to a sale in the telecommunications sector.
Announcements of investment projects in 2022 reflected an improved outlook for future investments. After falling in 2020 and 2021, the value of new FDI projects in the region increased by 92.5% in 2022, to close to US$ 100 billion. The number of announced projects also increased (by 15.3%), to 1,413. However, the number and value of announced projects both remained below the record levels seen in 2018 and 2019. The value of the announced projects was primarily concentrated in large projects, essentially in the oil and gas, mining and renewable energy sectors.
Analysis of FDI inflows in countries for which sectoral data are available shows that in 2022, services accounted for the largest share (54%), followed by manufacturing (30%) and natural resources (17%). The lowest relative growth recorded was in investments in services (35%). Regardless, with this rate, services was the only sector above historical averages, and even the 2022 level was 10% higher than the previous peak reached in 2017. Growth in services was largely even across the region, increasing by 47% in Mexico, 32% in Brazil and 28% in the other countries, on average.
Manufacturing investments, which followed a downward trend in previous years, grew by 46% relative to 2021, but remained 17% lower than 2019 levels. There was no reversal in the long-term trend of declines in manufacturing investments, seen since 2013, and levels remained 50% below the peak reached in 2013. The highest rate of year-on-year growth was in Brazil (157%), but the country also recorded the most significant long-term decline in manufacturing investment (down from an average of US$ 36 billion between 2010 and 2014 to US$ 19.642 billion in 2022).
With regard to FDI outflows from Latin America and the Caribbean, in 2022, they jumped to a record US$ 74.677 billion, up 80% compared to the previous year. This figure, which reflects mainly significant increases in outward investment from Brazil and Mexico, is the highest since the series was first compiled in the 1990s, and over US$ 30 billion more than the amount invested in 2021. It is partly a consequence of investments announced in 2019 being postponed because of the COVID-19 pandemic. Lastly, the challenge of attracting and retaining FDI that contributes to sustainable and inclusive development in the region remains as relevant as ever, and countries must make efforts to enact the right kind of policies if they are to have FDI that supports their development process and allows for the realization of the potential of FDI to build capacities, create quality jobs, transfer technology and enhance the diversification and sophistication of the production mix. One of the main reasons given for using public resources to attract investment is the potential of FDI to drive production linkages and transfers of knowledge and technology, and thus support economic growth (ECLAC, 2010).
12 Economic Commission for Latin America and the Caribbean (ECLAC) Chapter I Presentación Executive summary
In Latin America and the Caribbean as in the rest of the world, policy instruments have progressively become more diversified, however the main incentives for attracting investment are still grounded in tax-related measures. Although tax incentives can influence investment decisions to some degree, they are not enough to attract investment. A combination of diverse factors is required, including infrastructure, production capacity, a skilled workforce and a set of complementary activities along the value chain, meaning that efforts to attract FDI must be coordinated with actions usually taken under production development policies and agendas.
However, Latin American and Caribbean countries have only relatively recent experience in policies to attract investment, and they must improve policy design in order to attract investment and strengthen the relevant institutional capacity. It will be key to boost the coordination of efforts to attract FDI with production development strategies and to begin using FDI more deliberately as a strategic tool to further sustainable development processes.
B. Foreign direct investment in non-renewable energies: challenges for the energy transition in Latin America and the Caribbean
Internationally concerted efforts to rapidly mitigate climate change have generated major pressure to divest from the hydrocarbons sector. The commitments made by countries and firms to reduce their greenhouse gas (GHG) emissions, over the coming decades, have placed the search for renewable energy sources at the heart of their decarbonization strategies. However, in the face of rising energy prices driven mainly by the conflict between the Russian Federation and Ukraine, the energy transition debate has taken on a new dimension, related primarily to energy security. Despite international efforts to decarbonize the sector, there has been a tentative resumption of FDI flows in non-renewables, especially in response to the rebound in hydrocarbon prices, the discovery of non-conventional energy sources and the dissemination and lower cost of the technologies needed to make their exploitation and commercialization viable. Moreover, the insufficient investment levels in renewables registered since 2015 indicate that non-renewables will continue to be a significant source of energy in the coming decades (IEA, 2022) and that firms are likely to continue to invest in the exploration, refining and commercial exploitation of hydrocarbons.
Globally, greenfield investment announcements have generally outweighed purchases of existing assets in recent years. Although the figures are not directly comparable owing to their nature (the former are investment intentions, while asset purchases via mergers and acquisitions refer to completed transactions) and reflect high volatility, project announcements have been the main vehicle through which firms in the non-renewable energies sector have internationalized their businesses.
Latin America and the Caribbean is the region that receives the fifth largest amount of investment in the sector, absorbing 9% of the total; and it is the lowest ranked region of origin in terms of projects (2% in total). As in the rest of the world, the internationalization of the region’s oil, coal and natural gas sector has been dominated by new investment project announcements. Nonetheless, during the period under review, the region was the destination of investment announcements in greenfield projects averaging approximately US$ 9.15 billion per year, compared to an average of US$ 5.723 billion per year in the case of mergers and acquisitions. However, the inherent volatility of the hydrocarbons sector makes it difficult to identify a clear pattern or trend, since large announcements or transactions generate significant year-on-year variations in total amounts.
Comparing the amounts of project announcements and cross-border mergers and acquisitions in Latin America and the Caribbean in 2015–2022 reveals that transnational oil and gas firms wishing to
13 Foreign Direct Investment in Latin America and the Caribbean • 2023 Chapter I Executive summary
invest in the countries of the region tend to use different instruments, depending on the stage of the value chain in which the venture is located, and on whether they have a pre-existing presence in the destination country. Moreover, the investments tend to complement each other, whether they are related to different modalities (mergers and acquisitions or greenfield projects) or to different stages of the value chain. Investments in the prospecting, exploration, production and decommissioning (upstream) stage of the oil, coal and natural gas value chain are usually the starting point from which transnational firms execute their strategy in Latin America and the Caribbean. This defines the growth of their investments in the expansion of existing projects, other similar ventures, or other stages of the value chain —the stage consisting of crude oil and natural gas transportation and storage activities (midstream) or that comprising the refining or processing of crude oil and natural gas, together with its distribution, sale, and final use (downstream)— which promote the processing and distribution of the extracted hydrocarbons.
Between 2010 and 2021, the amounts announced in renewable energy projects in Latin America and the Caribbean outstripped those of non-renewables, with the latter’s share dwindling from 24% of total announcements in 2005, to just 5% in 2021. Nonetheless, an increase in the amount of announcements of oil, gas and coal projects in the region in 2022, driven by a large project in Guyana, meant that this total outweighed that of renewable energy announcements for the first time in over 10 years. As a result, the non-renewables sector remains a leading sector in terms of future investment prospects in the region.
The importance of petroleum assets in the region has also generated a substantial volume of cross-border mergers and acquisitions. In 2022, the oil, natural gas and coal sector generated the third largest number of such transactions in Latin America and the Caribbean, accounting for 21% of the total (while renewables ranked fifth with 5%).
Inward FDI in the non-renewable energies sector in Latin America and the Caribbean reflects not only the high volatility inherent to the sector, which stems mainly from fluctuations in the prices of such energy sources on international markets, but also the discovery of new hydrocarbon sources in the region and changes in the structure of local markets. The regulation of foreign capital inflows into the industry is a key factor in understanding the dynamics of FDI in the sector. However, investments in the sector are subject to uncertainties. One of the main risk factors is stranded assets, which are assets that have suffered from unanticipated or premature write-downs, devaluations, or conversion to liabilities (Caldecott and others, 2016) as a result of some exogenous factor. In the context of the energy transition, fossil fuel reserves and other capital investments for the exploration, production and refining of these energy sources can be rendered inoperable, because of the need to fulfil climate commitments. As a result, they become liabilities before the end of the payback period, or the corresponding installations have to be decommissioned prematurely, turning them into stranded assets (Nunes and Costa, 2021). Depending on the country context, the inclusion of this type of risk in project feasibility calculations may cause hesitation in short-term investments and even instability in the financial markets (Nunes and Costa, 2021). In the region, the amount of capital to be withdrawn prematurely from the energy sector over the next 30 years is estimated at between US$ 37 billion and US$ 90 billion (Binsted and others, 2020).
Other key elements in the analysis of future investments in the non-renewable energies value chain in the context of the energy transition include carbon dioxide capture and storage and carbon capture, utilization and storage technologies. These technologies are based on processes that separate CO2 from industrial emission sources, and store and isolate it from the atmosphere over the long term, or that enable captured carbon to be used in industrial processes (IPCC, 2005). The region has the geological potential for applying these technologies, particularly in the context of new installations (Nunes and Costa, 2021). However, the costs of these technologies remain high, and no large-scale commercial projects have yet been implemented at the global level, despite recently announced incentives in some countries, notably the United States.
14 Economic Commission for Latin America and the Caribbean (ECLAC) Chapter I Presentación Executive summary
This scenario gives the region’s governments an even more important role. First, they are responsible for defining the regime under which non-renewable resources will be exploited, their exploitation policy and how the revenues from the activity will be used to the benefit of society. They must also play an active role in defining how these resources will be maximized, either by promoting economic activities in other stages of the hydrocarbon value chain, or beyond, by fostering the productive development of other sectors. In addition, they have a role in evaluating the feasibility of providing incentives for the large-scale adoption of technologies such as carbon capture and storage or carbon capture, utilization and storage, which are essential for the future of the hydrocarbons industry. Second, governments must be the lead actors in coordinating strategies to achieve a successful energy transition in the region. They are responsible for making sure that non-renewable energy activities are reduced radically, as required by the climate commitments, while managing to mitigate their negative effects and their economic and social costs, especially in terms of investments, employment and income. One of their central functions is to develop long-term policies that promote investments in renewable energy sources, so that the transition is rapid and secure, and does not leave the region lagging behind in a context in which energy from clean sources is a factor of competition. International cooperation also has a key role, as a source of both guidelines and know-how, and resources and technologies that make a just energy transition possible.
C. Foreign direct investment in renewable energies: strategies to advance the energy transition in Latin America and the Caribbean
Renewable energies have been one of the main drivers of international investment. In 2005, foreign investment announcements in this area accounted for only 6% of total energy-related foreign investment announcements worldwide by value; in 2022, they accounted for 80%.
The interest of international companies in renewable energy sources was mainly driven by the increasing competitiveness of the sector. The cost of generating renewable energy, and in particular photovoltaic solar and wind power, has decreased worldwide because of technological advances. Between 2010 and 2020, global average levelized costs fell by 85% for photovoltaic solar energy projects, 56% for onshore wind projects and 48% for offshore wind projects (IEA, 2022).
Developed countries have managed to combine policies to develop their domestic markets with the search for new international markets, with the result that these countries are the leading international renewable energy investors and the development of the technologies for producing renewable energy is concentrated therein. Between 2005 and 2022, FDI announced by European companies accounted for 61% of the total in the sector. Companies from Europe, in particular Italy, Spain and France, have been the leading investors in all regions of the world except Asia and the Pacific, where intraregional investments dominate.
Solar and wind technologies have cemented their dominance at global level, accounting for the bulk of FDI project announcements. Between 2005 and 2022, wind energy attracted FDI projects worth US$ 570 billion, solar energy projects worth US$ 444 billion, and biomass and biofuel energy projects worth US$ 170 billion. The three technologies accounted for 70% of all announced FDI in the sector. Developed countries’ policy agendas for advancing the energy transition have had a significant impact on emerging green technologies, especially storage technologies and green hydrogen. Since 2016, these technologies have mobilized US$ 210 billion in announcements, or 14% of the total, and in 2022 they accounted for about 40% of the announced amount of global FDI.
15 Foreign Direct Investment in Latin America and the Caribbean • 2023 Chapter I Executive summary
In Latin America and the Caribbean, the renewable energy sector has been among those attracting the most investment, ranking third by the amounts announced. In the period 2005–2022, there were more than 800 FDI project announcements involving this sector in the region, worth a total of almost US$ 170 billion. Between 2010 and 2021, announced investments in clean energy outstripped investment in fossil energy.
The main destination countries have been Brazil, Chile, Mexico, Panama and Peru, together attracting more than 80% of all announcements in the region. However, in most countries of the region, FDI has been reshaped, with a shift towards renewable energies. Companies from European Union countries were responsible for 63% of the value of all renewable energy FDI projects announced in the region between 2005 and 2022. In line with the global trend, solar and wind technologies attracted the largest number of FDI projects and accounted for more than 70% of the value of all investment in renewable energies.
Renewable energy investment announcements in the region peaked in 2019 at more than 120 projects totalling US$ 20.5 billion. Since the outbreak of the COVID-19 pandemic, there has been a marked slowdown caused by two main factors: the rising cost of capital to implement solar and wind projects, and the reshaping of the energy agenda in Europe and the United States. In 2022, renewable energy project announcements rebounded, growing by 30% over 2021, with 37 projects worth a total of US$ 10.4 billion announced.
The countries of Latin America and the Caribbean are very well positioned to take advantage of the energy transition, since they have well-developed energy markets and great potential in terms of their endowment of renewable energy resources. The region’s countries have progressively greened their electricity generation mix in recent decades, so that it is now among the world’s cleanest. However, renewable energy generation has been dominated by the large installed hydroelectric capacity in those countries. The effects of climate change and alterations in rainfall intensity are increasing the vulnerability of water sources, requiring renewable energy generation sources to be diversified beyond hydropower (IEA, 2021). Expansion of the installed capacity of other technologies, in particular solar and wind power, represents a major opportunity to accelerate the region’s energy transition and diversify its energy mix.
Furthermore, international experience shows that the energy sector can create production linkages in sectors related to the transition. For one thing, activities associated with the renewable energy value chain, from critical minerals and technology development to the provision of engineering, construction and maintenance services, represent an opportunity to strengthen production capabilities and develop new service sectors. For another, clean energy can increase the region’s energy efficiency and encourage more energy-intensive production activities, as in the case of green hydrogen. A growing supply of renewable energy sources will not only be essential to meet the region’s rising demand, but could also become a strategic asset to attract investment in other sectors, not just renewable energy. Major financing needs will have to be met if the energy transition in the countries of Latin America and the Caribbean is to advance. Given that there is little fiscal space in the region’s countries to increase investment in renewable energy on the scale needed to achieve the energy transition, it is essential for governments to have the right policies and instruments in place to attract private investment from the region and the world. According to the International Renewable Energy Agency (IRENA, 2021), investment in the sector will need to double by 2030 and then grow yet further to three times current levels if the goals set are to be achieved.
Although Latin America and the Caribbean has been a strategic destination for renewable energy investments, if it is to secure the resources it needs to carry forward the energy transition, it will have to implement medium- and long-term strategies that mobilize domestic and international investment in renewable energy development. FDI can play a vital role in accelerating the energy transition, facilitating technology transfer and enabling emerging technologies. However, investment policies
16 Economic Commission for Latin America and the Caribbean (ECLAC) Chapter I Presentación Executive summary
need to be designed in the broader context of energy transition policies, taking into account the drivers of investment, market forces and international technology development to calibrate the toolbox and steer investments towards priority technologies, sectors or stages of the chain. These agendas need to be supported by institutional mechanisms that facilitate coordination between different parts of the public sector, between the public and private sectors, and between the different levels.
The Economic Commission for Latin America and the Caribbean (ECLAC, 2023) has identified the energy transition as one of the strategic areas of action to spur the region’s recovery. A successful energy transition could become a comparative advantage in efforts to attract investment in other sectors, such as energy-intensive industries, and to attract activities that complement renewable energies, such as those related to green hydrogen and the development of carbon-neutral technologies. In a very dynamic international market, the countries of the region have a great opportunity to make progress with this important challenge.
Bibliography
AIE (Agencia Internacional de Energía) (2022), World Energy Outlook 2022, Paris. (2021), Climate Impacts on Latin American Hydropower, Paris.
Binsted, M. y otros (2020), “Stranded asset implications of the Paris Agreement in Latin America and the Caribbean”, Environmental Research Letters, vol. 15, Nº 4, abril.
Caldecott, B. y otros (2016), Los activos abandonados: el desafío del riesgo climático. Resumen ejecutivo, Banco Interamericano de Desarrollo (BID), Washington, D.C.
CEPAL (Comisión Económica para América Latina y el Caribe) (2023), América Latina y el Caribe en la mitad del camino hacia 2030: avances y propuestas de aceleración (LC/FDS.6/3), Santiago. (2010), La Inversión Extranjera Directa en América Latina y el Caribe, 2009 (LC/G.2447-P), Santiago.
IPCC (Grupo Intergubernamental de Expertos sobre el Cambio Climático) (2005), IPCC Special Report on Carbon Dioxide Capture and Storage, B. Metz y otros (eds.), Cambridge University Press.
IRENA (Agencia Internacional de Energías Renovables) (2021), World Energy Transitions Outlook: 1.5°C Pathway, Abu Dabi.
Nunes, R. de C. y H. K. de M. Costa (2021), “Chapter 5 - Carbon capture and storage technologies and efforts on climate change in Latin American and Caribbean countries”, Carbon Capture and Storage in International Energy Policy and Law, H. K. de M. Costa y C. Arlota (eds.), Elsevier.
UNCTAD (Conferencia de las Naciones Unidas sobre Comercio y Desarrollo) (2023), Investment Trends Monitor, Nº 44.
17 Foreign Direct Investment in Latin America and the Caribbean • 2023 Chapter I Executive summary
IForeign direct investment in Latin America and the Caribbean 2023
A. Global foreign direct investment in 2022 did not maintain the growth seen in 2021
B. Record rebound of FDI in Latin America and the Caribbean
C. FDI outflows from Latin America and the Caribbean: outward investment hit record highs
D. Policies to attract investment
E. Conclusions
F. Analysis of FDI inflows by country
Bibliography
Annex I.A1
19 Foreign Direct Investment in Latin America and the Caribbean • 2023 Chapter I
CHAPTER
20 Economic Commission for Latin America and the Caribbean (ECLAC) Chapter I
A. Global foreign direct investment in 2022 did not maintain the growth seen in 2021
After bouncing back in 2021, cross-border investments worldwide faced new headwinds in 2022. Multiple international crises, the conflict in Ukraine, high inflation, interest rate hikes in advanced economies and uncertainties in the financial system weighed on global foreign direct investment (FDI) inflows, which in 2022 fell by 12% compared to 2021 and totalled US$ 1.29 trillion (see table I.1). This decline was due largely to major divestments in Luxembourg, a global financial centre. Excluding Luxembourg, the increase in global FDI inflows in 2022 was 11%.
World (selected countries and regions): FDI inflows, 2018–2022 (Billions of dollars)
Source: Economic Commission for Latin America and the Caribbean (ECLAC), on the basis of United Nations Conference on Trade and Development (UNCTAD), “Annex table 1: FDI flows, by region and economy (2017–2022)”, World Investment Report 2023, 2023 [online] https://unctad.org/publication/world-investment-report-2023.
The United States and China remained the chief recipients of FDI, although investments decreased in the former and increased in the latter, while Brazil was the world’s fifth largest destination. The European Union, which has traditionally attracted a large share of investment, registered negative inflows in 2022. However, excluding the divestments in Luxembourg, FDI inflows into the European Union grew by 55% in 2022, with Sweden and France attracting the most investments.
The financial environment, including the deterioration of financing conditions due to the increase in interest rates by the main central banks, has had a significant impact on mergers and acquisitions. Rising interest rates virtually shut down leveraged finance markets as banks and other lenders faced a large backlog of transactions requiring financing (Morgan Stanley, 2023). In addition, the indirect effects of the conflict in Ukraine could have more profound and far-reaching consequences for multinational companies, which may have been felt in 2022 or could be reflected later (OECD, 2022a; Liu, 2022). The negative effects on multinational companies more exposed to the Russian Federation
21 Foreign Direct Investment in Latin America and the Caribbean • 2023 Chapter I
Table I.1
2018 2019 2020 2021 2022 Share in 2022 (Percentages) Variation 2022/2021 (Percentages) United States 203.234 229.929 95.882 387.780 285.057 22 -26 China 138.306 141.225 149.342 180.957 189.132 15 5 Singapore 73.561 97.484 72.903 131.151 141.211 11 8 Hong Kong, China 104.246 73.714 134.710 140.186 117.725 9 -16 Brazil 78.163 69.174 37.786 46.439 91.502 7 97 Australia 67.568 38.886 13.583 20.899 61.629 5 195 India 42.156 50.558 64.072 44.763 49.355 4 10 European Union (27 countries) 309.973 600.079 115.623 152.381 -124.948 -10 -182 Luxembourg -83.336 163.718 9.839 25.123 -322.054 -25 -1.382 Netherlands (Kingdom of the) 99.381 -1.140 -86.507 -77.453 -67.340 -5 -13 Sweden 5.269 8.761 21.514 21.133 45.963 4 117 France 41.833 13.100 11.359 30.885 36.413 3 18 European Union (excl. Luxembourg) 393.309 436.361 105.784 127.258 197.106 55 World (excl. Luxembourg) 1.458.773 1.544.112 952.144 1.453.014 1.616.792 11 World 1.375.437 1.707.830 961.983 1.478.137 1.294.738 -12
may spread through the value chain, affecting bank liquidity and solvency, tightening global financial conditions, increasing borrowing costs for emerging and developing economies, and leading to financial strain (Liu, 2022). Rising commodity prices and inflation may also slow global growth and private investment if interest rates are raised in advanced economies, while elevated uncertainty and geopolitical risks may damp investor confidence, discourage new investment, and cause some companies to limit their operational footprint (Liu, 2022).
In this context, the value of cross-border mergers and acquisitions worldwide fell by 6% in 2022 compared to the previous year, owing mainly to weaker sales of companies in the United States, the European Union and Asia (down by 53%, 8% and 17%, respectively) (UNCTAD, 2023). In Latin America and the Caribbean, meanwhile, mergers and acquisitions increased with respect to 2021, as will be discussed in detail below.
Unlike capital movements and cross-border mergers and acquisitions, FDI announcements —which reflect future investment plans— rose in 2022, mainly in technologically and politically strategic sectors, and owing to the increase in the value of projects, primarily in renewable energies. The value of FDI project announcements worldwide jumped by 64% to around US$ 1.2 trillion, well above the average of the 2010 decade (see figure I.1). Project announcements increased in all regions of the world, most notably in Africa and the Middle East. In Africa, the announcement of 69 large-scale renewable energy projects accounted for the growth and represented more than 60% of the total value of projects announced for the region.
With regard to new projects by sector, energy accounted for a large share of the investment announcements for 2022. Chapters II and III of this report analyse the main reasons behind the recent trend in FDI in non-renewable and renewable energies in the world and in the region. Renewable energies accounted for a record share of total FDI project announcements (29%), after having more than doubled in value (160%) (see figure I.2). However, the coal, oil and natural gas sector recorded the highest year-on-year growth in amounts announced (524%) and became the second largest sector in 2022 (9% of the total). After recording exceptional growth in 2021, semiconductor investment
22 Economic Commission for Latin America and the Caribbean (ECLAC) Chapter I
Figure I.1
0 0.2 0.4 0.6 0.8 1.0 1.2 1.4
FDI project announcements, by region, 2010–2019, 2020, 2021 and 2022 (Trillions of dollars)
2010–2019 (annual average) 2020 2021 2022
Total Europe Asia and the Pacific Africa and the Middle East North America
Latin America and the Caribbean
Source: Economic Commission for Latin America and the Caribbean (ECLAC), on the basis of Financial Times, fDi Markets [online database] https://www.fdimarkets.com/.
announcements remained strong and even increased by a further 9% in 2022, accounting for 8% of global amounts announced. Electronic components and software and computer services also recorded considerable growth, 92% and 81%, respectively.
The metals sector also saw a sharp increase (218%) and accounted for 5% of the value of FDI project announcements. While all minerals subsectors grew, the most notable increase was seen in iron and steel production, followed by copper, nickel, lead and zinc mining. Non-ferrous metal production, which includes projects related to the battery supply chain, also registered remarkable and record high growth. Latin America accounted for just 11% of the projects announced in the metals sector, while Asia and the Pacific (34%) and North America (20%) were the main destinations.
Mounting geopolitical tensions and recent crises have resulted in greater scepticism towards multilateralism and the growing appeal of inward-looking policies, mainly in advanced economies (IMF, 2023). Events such as the decision by the United Kingdom of Great Britain and Northern Ireland to leave the European Union, or “Brexit”, trade tensions between the United States and China, and the conflict in Ukraine, could lead to geoeconomic fragmentation, which could affect FDI flows.
Against this backdrop, companies are adopting new strategies to manage their global supply chains, including the transfer of global supply chain operations to countries geographically close to the country of origin (nearshoring) and moving supply chain operations from one country back to the country of origin (reshoring).
According to the International Monetary Fund (IMF, 2023), FDI flows are increasingly concentrated in geopolitically aligned countries, especially in strategic sectors, such as semiconductors. Geopolitical alignment plays a significant role in driving FDI, particularly for emerging and developing economies, and, according to IMF (2023), has become more important since 2018, with the resurgence of trade tensions between the United States and China.
In this regard, the number of investment projects of United States companies in China has declined considerably over the past decade, reaching the lowest point in 2022, with only 74 projects worth
23 Foreign Direct Investment in Latin America and the Caribbean • 2023 Chapter I
Figure I.2
0 50 100 150 200 250 300 350 400 Renewable energies Coal, oil and natural gas Semiconductors Electronic components Property sector Metals 2006–2010 (annual average) 2011–2015 (annual average) 2016–2020 (annual average) 2021 2022 Transport and storage Software and computer services
Global FDI project announcements, main sectors, 2006–2022 (Billions of dollars)
Source: Economic Commission for Latin America and the Caribbean (ECLAC), on the basis of Financial Times, fDi Markets [online database]
https://www.fdimarkets.com/.
approximately US$ 3.7 billion (in 2006, 425 projects worth approximately US$ 24 billion were registered). By contrast, there was a notable increase in announcements in Europe and a moderate increase in those in Asia and the Pacific and in Latin America and the Caribbean (see figure I.3).
Source
In terms of the number of projects announced by United States-based companies, software and computer services was the leading sector, followed by business services and communications. In the three main sectors, China’s share of the number of projects announced has decreased, while those of India and Europe have grown sharply. In the software and computer services sector, Mexico’s share of announced projects has trended slightly upward (see figure I.4).
Source: Economic Commission for Latin America and the Caribbean (ECLAC), on the basis of Financial Times, fDi Markets [online database] https://www.fdimarkets.com/.
24 Economic Commission for Latin America and the Caribbean (ECLAC) Chapter I
Figure I.3
(Percentages) 0 10 20 30 40 50 60 70 80 90 100 2005 2006 2007 2008 2009 2010 2011 2012 2013 2014 2015 2016 2017 2018 2019 2020 2021 2022 Europe Asia and the Pacific (excluding China) Latin America and the Caribbean Africa and the Middle East China
United States: FDI project announcements, by region of destination, 2005–2022
: Economic Commission for Latin America and the Caribbean (ECLAC), on the basis of Financial Times, fDi Markets [online
https://www.fdimarkets.com/.
database]
Figure I.4
(Number) 0 100 200 300 400 500 600 700 800 2017 2018 2019 2020 2021 2022 India United Kingdom Germany Canada Ireland France Australia Singapore Mexico China 2005–2010 (annual average) 2011–2016 (annual average)
United States: FDI project announcements in the software and computer services sector, by major country of destination, 2005–2022
The effects of nearshoring in Latin America are still unclear, and are expected to be felt more in Central America and the Caribbean, especially in Mexico, owing to trade agreements and the shared border (Garrido, 2022). Although still an emerging phenomenon, the number of companies that have downsized or shut down operations in one country to relocate them to other countries has been increasing over the past decade. According to data available on the Financial Times database, fDi Markets, the number of project announcements involving relocations rose from 23 in 2013 to 132 in 2022. The largest number of project relocations, 173, was recorded in 2018, while the highest overall value, US$ 10 billion, was recorded in 2022. These figures are still low, and between 2003 and 2022, relocations accounted for less than 2% of the total number of projects announced worldwide. United States-based companies announced the highest number of relocations —nearly 200— followed by the United Kingdom and Germany. In terms of the destination for relocation, the United States was also the preferred option, accounting for more than 300 projects over the period. Notably, more than 49 projects were relocated to Mexico between 2003 and 2022. Half of these projects were announced by United States-based companies and are linked to the development of manufacturing activities. The automotive sector and the machinery and equipment industry stand out, among others. Although various factors can trigger a relocation from one country to another, the presence of productive capacity throughout supply chains and of specialized suppliers are significant factors.
B. Record rebound of FDI in Latin America and the Caribbean
1. Main recipient countries, components and impact on the balance of payments
In 2022, FDI inflows to Latin America and the Caribbean grew by 55.2% compared to 2021, reaching a record high of US$ 224.579 billion. Since 2013, annual FDI inflows to the region have remained below US$ 200 billion, meaning that the recovery in 2022 marks an important investment milestone for the preceding decade. This recovery was seen in the main recipient economies and was characterized by a marked interest in services, renewed interest in hydrocarbons and continued interest in manufactures in the countries that have built the largest capacity. With this increase, FDI inflows to the region also rose, to 3.9% of GDP (see figure I.5).
Brazil was the main recipient of FDI inflows in the region (41% of the total), followed by Mexico (17%), and inflows were higher in both countries than in 2021 (see table I.2), although growth was stronger in Brazil, which accounted for 56% of the year-on-year change for the entire region. Thus, South America recorded the highest increase in FDI inflows compared with 2021. The Plurinational State of Bolivia was the only country in the subregion that did not register higher inflows. Apart from Brazil, the other main recipients were Chile, Colombia, Argentina and Peru. Investment inflows to Central America declined, but reflected mixed trends from one country to the next. The extraordinary FDI inflow to Guatemala in 2021 from a sale in the telecommunications sector partially accounts for the negative change in the subregion, while in Costa Rica, which was the Central American country with the largest inflows, levels remained nearly the same as in 2021. The change in FDI inflows in the Caribbean was positive, driven mainly by higher levels of investment in the Dominican Republic, which despite the greatest increase ranked second as a recipient country after Guyana, while investment fell in countries in the Organisation of Eastern Caribbean States (OECS). Section I.F presents a detailed analysis of the trend for each country.
25 Foreign Direct Investment in Latin America and the Caribbean • 2023 Chapter I
Source: Economic Commission for Latin America and the Caribbean (ECLAC), on the basis of official figures and estimates as at 30 June 2023.
Note: Information computed in accordance with International Monetary Fund (IMF), Balance of Payments and International Investment Position Manual: Sixth Edition (BPM6), Washington, D.C., 2009, except in the cases of Guyana, Paraguay and Peru. No information is available for the Bolivarian Republic of Venezuela from 2016 onward. No 2022 data are available for Barbados and Haiti.
26 Economic Commission for Latin America and the Caribbean (ECLAC) Chapter I
Figure I.5
dollars
224.58 4.0 0 1 2 3 4 5 6 7 0 50 100 150 200 250 2010 2011 2012 2013 2014 2015 2016 2017 2018 2019 2020 2021 2022 FDI inflows FDI inflows as a percentage of GDP (right scale)
Latin America and the Caribbean: FDI inflows, 2010–2022 (Billions of
and percentages of GDP)
Table I.2
of dollars and
Country 2013–2017 2018 2019 2020 2021 2022 Absolute change 2022–2021 Relative change 2022–2021 (Percentages) Share in 2022 (Percentages) South America 124 979 119 515 110 787 62 954 91 351 166 094 74. 743 81.8 74.0 Argentina 8 285 11 717 6 649 4 884 6 903 15 408 8 506 123.2 6.8 Bolivia (Plurinational State of) 802 302 -217 -1 129 584 -26 -610 -104.5 0.0 Brazil 74 169 78 163 69 174 37 786 46 439 91 502 45 063 97.0 40.7 Chile 16 203 7 943 13 579 11 447 15 933 20 865 4 932 31.0 9.3 Colombia 14 312 11 299 13 989 7 459 9 561 16 869 7 307 76.4 7.5 Ecuador 843 1 389 979 1 095 647 829 182 28.1 0.4 Paraguay 620 218 402 95 207 474 266 128.7 0.2 Peru 7 078 5 873 4 760 791 7 420 10 848 3 429 46.2 4.8 Uruguay 1 983 1 727 1 470 526 3 657 9 325 5 668 155.0 4.2 Venezuela (Bolivarian Republic of) 684 886
Latin America and the Caribbean: FDI inflows, by recipient country and subregion, 2013–2022 (Millions
percentages)
Source: Economic Commission for Latin America and the Caribbean (ECLAC), on the basis of official figures and estimates as at 30 June 2023.
a In calculating the absolute and relative differences, those countrires for which no data are available for 2022 are excluded from 2021.
Analysis of FDI shows that all components grew in 2022 relative to 2021, but reinvested earnings and intercompany loans recorded the strongest growth. For the first time since 2010, reinvested earnings became the main component of FDI in the region (43% of the total), following growth of 50% in 2022 compared with the previous year. One possible explanation for the increase in this component is that because of the extraordinary slowdown in economic activity caused by the coronavirus disease (COVID-19) pandemic, many companies may have retained earnings in 2020. In 2021 and 2022, given the gradual economic recovery in the countries of the region, companies may have directed these earnings towards a resumption of activities (see figure I.6).
27 Foreign Direct Investment in Latin America and the Caribbean • 2023 Chapter I Country 2013–2017 2018 2019 2020 2021 2022 Absolute change 2022–2021 Relative change 2022–2021 (Percentages) Share in 2022 (Percentages) Mexico 37 526 37 857 29 906 31 519 33 478 38 932 5 455 16.3 17.3 Central America 11 551 12 526 10 232 1 804 11 144 9 813 -1 331 -11.9 4.4 Costa Rica 2 990 3 015 2 719 2 103 3 593 3 673 81 2.2 1.6 El Salvador 424 826 636 272 308 -101 -409 -132.7 0.0 Guatemala 1 291 981 976 935 3 462 1 352 -2 109 -60.9 0.6 Honduras 1 236 1 380 947 224 800 1 082 281 35.2 0.5 Nicaragua 1 007 838 503 747 1 220 1 294 74 6.0 0.6 Panama 4 604 5 487 4 451 -2 477 1 761 2 513 752 42.7 1.1 The Caribbean a 6 237 5 979 7 227 7 531 9 008 9 740 969 11.0 4.3 Antigua and Barbuda 102 205 128 77 245 196 -49 -19.9 0.1 Bahamas 1 603 947 611 897 1 052 1 255 203 19.3 0.6 Barbados 321 242 215 262 237 0 Belize 76 118 94 76 125 134 8 6.4 0.1 Dominica 22 78 63 22 34 28 -6 -16.5 0.0 Dominican Republic 2 476 2 535 3 021 2 560 3 197 4 010 814 25.5 1.8 Grenada 123 186 204 136 140 160 20 14.5 0.1 Guyana 167 1 232 1 695 2 060 4 454 4 389 -65 -1.5 2.0 Haiti 167 105 55 Jamaica 774 775 665 265 320 319 -1 -0.2 0.1 Saint Kitts and Nevis 119 40 62 6 26 16 -11 -41.2 0.0 Saint Lucia 113 46 76 48 86 67 -19 -22.2 0.0 Saint Vincent and the Grenadines 129 40 69 65 160 86 -74 -46.1 0.0 Suriname 203 131 84 1 -133 -5 127 -96.0 0.0 Trinidad and Tobago -157 -700 184 1 056 -935 -914 21 2.3 -0.4 Total a 180 292 175 877 158 153 103 807 144 981 224 579 79 835 55.2 100.0
Figure I.6
Source: Economic Commission for Latin America and the Caribbean (ECLAC), on the basis of official figures and estimates as at 30 June 2023.
Note: Barbados and the Bolivarian Republic of Venezuela are not included because data for these countries are not available for 2022. El Salvador, Guyana, Haiti and Jamaica are also excluded because data by component are not available. The data by component for the Plurinational State of Bolivia represent gross FDI inflows.
Equity, the second largest component, accounted for 36% of FDI inflows to the region in 2022, up by 22% compared to 2021. Although this component approached 2019 values in 2022, it remained below the levels observed prior to 2013. Bearing in mind that the investments of new companies are included in this component, either through greenfield projects or mergers and acquisitions, stronger momentum in equity inflows would be a better indicator of the greater presence of multinational companies in the region.
Of the three components, intercompany loans registered the strongest growth (283%), and accounted for 21% of all FDI inflows in the region. Brazil stands out in that regard —intercompany loans were negative in 2021, at - US$ 466 million, while in 2022, they amounted to US$ 21.075 billion (see section I.F and box I.1).
Box I.1
High interest rates and the growth of intercompany loans
It is essential to understand the reasons behind the growth in intercompany loans, which reflect lending between subsidiary and parent companies, in foreign direct investment (FDI) inflows in Latin America and the Caribbean in 2022. De Camino, Pérez-Caldentey and Vera (2023) argue that there are three reasons for FDI to take the form of intercompany loans, relating to: (i) taxes (minimizing taxes on earnings), (ii) the carry trade (leveraging differences in interest rates), and (iii) the economic cycle. Global interest rate rises could also be an important driver. The benchmark interest rate hikes implemented in developed countries to dampen inflation have increased financing costs for emerging economies (Arteta, Steven and Ulrich, 2022), including in Latin America and the Caribbean. This may have prompted a rise in intercompany loans, which include more robust guarantees by parent companies, as a way of facilitating local subsidiaries’ access to financing (KPMG, 2022).
28 Economic Commission for Latin America and the Caribbean (ECLAC) Chapter I
Equity Reinvested earnings Intercompany loans 0 20 40 60 80 100 2010 2011 2012 2013 2014 2015 2016 2017 2018 2019 2020 2021 2022
Latin America and the Caribbean: FDI inflows, by component, 2010–2022 (Billions of dollars)
There is increasing evidence that the non-financial corporate sector, in addition to financing its own operations, is acting as a financial intermediary, capturing liquidity from international equity markets and investing it both in-country and abroad (De Camino, Pérez-Caldentey and Vera, 2023). However, these intercompany loans tend to be short-term and are more likely to be suddenly called in than equity investments, which can lead to greater financial instability (De Camino, Pérez-Caldentey and Vera, 2023).
Source: C. Arteta, K. Steven and F. Ulrich, “How do rising U.S. interest rates affect emerging and developing economies? It Depends”, Policy Research Working Paper, No. 10258, World Bank, 2022; C. De Camino, E. Pérez-Caldentey and C. Vera, “Non-financial corporations as financial intermediaries and their macroeconomic implications: an empirical analysis for Latin America”, Foreign Exchange Constraint and Developing Economies, Edward Elgar Publishing, 2023 and KPMG, “Implications of rising interest rates on intercompany financing”, 2022 [online] https://kpmg.com/be/en/home/insights/2023/01/ctx-risinginterest-rates-and-intercompany-financing.html.
In 2022, the region’s FDI stock amounted to US$ 2.86 trillion and was concentrated in Brazil (36%), Mexico (25%), Chile (10%), Colombia (8%), Peru (5%) and Argentina (4%). FDI income for 2022, which is to say the returns generated by these investments in the year, totalled US$ 172.260 billion, meaning an average rate of return on FDI of 6.3%, above the rate for 2021 and the highest since 2013 (see figure I.7).1 Commodity price increases, which have boosted the income of foreign companies that export them, contributed to the growth in income.
Source: Economic Commission for Latin America and the Caribbean (ECLAC), on the basis of official figures and estimates as at 30 June 2023.
Note: The Bahamas, Barbados, the Bolivarian Republic of Venezuela, Haiti, Peru, Suriname and Trinidad and Tobago are not included because data for these countries are not available for 2022. Guyana is also excluded because the corresponding data for the calculation are not available.
1 The average rate of return is calculated as the ratio of FDI income to FDI stock. Only the 10 countries for which 2022 FDI income data are available were used for the calculation.
29 Foreign Direct Investment in Latin America and the Caribbean • 2023 Chapter I
Figure I.7
FDI stock Average return on FDI (right scale) 0 3 6 9 12 0 0.5 1.0 1.5 2.0 2.5 3.0 2010 2011 2012 2013 2014 2015 2016 2017 2018 2020 2021 2019 2022
Latin America and the Caribbean: FDI stock and average return, 2010–2022 (Trillions of dollars and percentages)
The income generated by FDI stock is one of the components that negatively affect the current account of the balance of payments. The current account of the balance of payments of Latin America and the Caribbean has been in deficit since 2010. In 2022, the deficit stood at 2.6% of GDP and the income balance was the component with the largest deficit, as has historically been the case, at 3.3%. Within income, the deficit for FDI income amounted to 2.1% of GDP (see figure I.8), representing a smaller impact on the overall deficit than in 2021.
2. Mergers and acquisitions: greater interest in investing in companies that operate in the region
Compared to 2021, cross-border mergers and acquisitions in Latin America and the Caribbean increased in 2022, both in number (to 327, up by 7%) and in value (to US$ 30.147 billion, 57% higher). Despite this promising trend, the amount mobilized remains below pre-pandemic levels (see figure I.9).
Brazilian assets once again attracted the most interest from multinationals, as 31% of the deals completed in the region in 2022 took place in the country, representing growth of 18% with respect to the sluggish performance of 2021. Mexico ranks second with 29%, and is followed by Chile and Argentina (see figure I.10). In almost all of the countries, more deals were closed in 2022 than in 2021. The case of Jamaica is noteworthy as the country posted a ten-year record amount for transactions— US$ 1.6 billion, linked to a sale in the telecommunications sector (see section I.B.4.a).
30 Economic Commission for Latin America and the Caribbean (ECLAC) Chapter I
Figure I.8
0.9 1.1 0.7 0.1 -0.2 - 0.9 0.2 0.6 0.2 0.2 1.8 0.3 -0.3 -1.3 -1.3 -1.4 -1.5 -1.5 -1.4 -1.2 -1.2 -1.2 -1.0 - 1.1 -1.2 -1.5 -2.3 -2.3 -2.2 -1.7 -1.7 -1.4 -1.6 -1.7 -2.2 -2.0 -1.8 -2.3 -2.1 -0.6 -0.7 -0.7 -0.8 -0.9 -1.0 - 0.9 -1.0 -1.0 -1.1 -1.1 -1.1 -0.9 -0.2 -0.1 0 -0.1 -0.1 -0.1 -0.1 -0.2 -0.1 -0.1 -0.2 -0.1 -0.1 1.2 1.1 1.0 1.0 1.1 1.3 1.5 1.5 1.7 1.8 2.3 2.5 2.4 -2.2 -2.2 -2.7 -3.0 -3.3 -3.6 -2.2 -1.8 -2.7 -2.2 0.2 -2.0 -2.6 -6 -5 -4 -3 -2 -1 0 1 2 3 4 5 2010 2011 2012 2013 2014 2015 2016 2017 2018 2019 2020 2021 2022 Goods Services Income from direct investment Income from portfolio investments Income from other investments Current transfers Current account Source: Economic Commission for Latin America and the Caribbean (ECLAC), on the basis of official figures.
Latin America and the Caribbean: balance-of-payments current account, by component, 2010–2022 (Percentages of GDP)
3. Announcements of FDI projects recovered, but not to the highs recorded prior to the COVID-19 pandemic
In 2022, announcements of new investment projects suggested an improved outlook for future investments. After falling in 2020 and 2021, the value of new FDI projects in the region increased by 92.5% in 2022, to close to US$ 100 billion (see figure I.11). The number of announced projects also increased (by 15.3%), to 1,413. However, the number and value of announced projects both remained below the record levels seen in 2018 and 2019.
31 Foreign Direct Investment in Latin America and the Caribbean • 2023 Chapter I
Figure I.9
0 100 200 300 400 500 600 0 10 20 30 40 50 60 70 80 2012 2013 2014 2015 2016 2017 2018 2019 2020 2021 2022 Value Number of operations (right scale)
Latin America and the Caribbean: cross-border mergers and acquisitions, 2012–2022 (Millions of dollars and number)
Source: Economic Commission for Latin America and the Caribbean (ECLAC), on the basis of data from Bloomberg.
Figure I.10
(Percentages of the
Brazil (30) Mexico (29) Chile (15) Argentina (12) Colombia (5) Jamaica (5) Panama (2) Costa Rica (1) Otros (0)
Latin America and the Caribbean: cross-border mergers and acquisitions, by country of destination, 2022
total amount)
Source: Economic Commission for Latin America and the Caribbean (ECLAC), on the basis of data from Bloomberg.
The value of the announced projects was primarily concentrated in large projects, essentially in the oil and gas, mining and renewable energy sectors. Fourteen projects had a value of at least US$ 1 billion. These megaprojects accounted for 41% of the total investment, and 80% of the total amount of the announced projects came from the 170 largest projects. In the case of smaller projects, approximately two thirds of the 1,413 identified had a value of less than US$ 20 million, and 98% of the projects did not exceed US$ 400 million.
In 2022, the rise in FDI project announcements in Latin America and the Caribbean was mainly a result of a higher number of projects in Mexico, Brazil, Guyana and Panama (see figure I.12). The growth in Mexico (135%) contributed the most to the overall increase. Growth in announced investments in Guyana put the country in third place among the countries with the highest value announcements. This position is a result of hydrocarbon production in the country, which has led to announcements of large investments. In fact, six investment projects in Guyana were announced in 2022, including an oil exploration project announced by the United States company ExxonMobil for US$ 10 billion. To give an idea of the size of these projects with respect to the country’s economy, in 2021 Guyana had a GDP of US$ 6.816 billion and a population of 800,000 (CEPALSTAT,
2021).
In South America, significant increases in FDI project announcements were recorded in Brazil (33%) and Argentina (18%). However, growth in the subregion was just 11%, well below that recorded in Central America and the Caribbean. The value of announcements declined in Colombia, Peru, Ecuador, the Plurinational State of Bolivia and Uruguay. Although the number of announcements in Colombia rose by 9% from 2021 to 2022, the amounts of the announcements fell by 60%. The number and amounts of announcements also declined sharply in the Plurinational State of Bolivia and Peru.
32 Economic Commission for Latin America and the Caribbean (ECLAC) Chapter I
Figure I.11
Number of projects Billions of dollars
0 20 40 60 80 100 120 140 0 200 400 600 800 1 000 1 200 1 400 1 600 1 800 2 000 2005 2006 2007 2008 2009 2010 2011 2012 2013 2014 2015 2016 2017 2018 2019 2020 2021 2022
Latin America and the Caribbean: FDI project announcements, 2005–2022 (Billions of dollars and number of projects)
(right scale)
Source: Economic Commission for Latin America and the Caribbean (ECLAC), on the basis of Financial Times, fDi Markets [online database] https://www.fdimarkets.com/.
4. FDI inflows by sector: services maintained its leading position and flows into natural resources and manufacturing recovered
One key to understanding how FDI may be contributing to sustainable development is analysis of which economic activities receive such capital, because some activities can have a greater impact on the diversification and technological sophistication of the countries of Latin America and the Caribbean, as well as on their energy transitions.
In this regard, use of the information offered by national accounts is limited. Firstly, few countries in the region report data by FDI destination (11 had such data in 2022). Secondly, the level of aggregation is high, meaning that it is only possible to determine whether investments were in services (generally in sectors such as financial services, electricity, gas and water, trade and ICT services), manufacturing (whose main sectors have traditionally been refining, the automotive industry, metallurgy, food and beverages, and the chemical industry) or natural resources (generally oil and gas or metal mining).
In this section, aggregate analysis of national accounts data is therefore accompanied by an analysis of cross-border mergers and acquisitions completed in 2022 and investment project announcements by foreign companies. Mergers and acquisitions are not necessarily reflected in capital inflows in the balance of payments, either because of business trends or because they are purchases of assets already owned by foreign companies, but they do allow for identification of the activities that attract most interest from international capital. Similarly, announcements of investment projects are indicators of interest from certain companies in expanding into the region, but they do not mean that the investments will be made and do not provide information on when the investment will be made.
With respect to FDI inflows, in 2022, services accounted for the largest share (54%), followed by manufacturing (30%) and natural resources (17%). Following the effects of the pandemic, which hurt investments in manufacturing and natural resources, all three sectors grew in 2022 (see figure I.13).
33 Foreign Direct Investment in Latin America and the Caribbean • 2023 Chapter I
Figure I.12
2022 2021 0 5 10 15 20 25 30 35 40 45 Other countries Peru Colombia Costa Rica Dominican Rep. Panama Argentina Chile Guyana Brazil Mexico
Latin America and the Caribbean: FDI project announcements, main countries, 2021 and 2022 (Billions of dollars)
Source: Economic Commission for Latin America and the Caribbean (ECLAC), on the basis of Financial Times, fDi Markets [online database] https://www.fdimarkets.com/.
Figure I.13
Latin
Source: Economic Commission for Latin America and the Caribbean (ECLAC), on the basis of official figures and estimates as at 30 June 2023.
Note: The countries are Brazil, Colombia, Costa Rica, the Dominican Republic, Ecuador, El Salvador, Guatemala, Guyana, Honduras, Jamaica, Mexico and Plurinational State of Bolivia. These are the countries that have sectoral information for 2022. The information for Brazil does not include the reinvested earnings component. Sectoral data for Costa Rica and Mexico are computed using the approach of International Monetary Fund (IMF), Balance of Payments and International Investment Position Manual: Fifth Edition (BPM5), Washington, D.C., 1993.
The lowest relative growth recorded was in investments in services (35%). Regardless, with this rate, services was the only sector above historical averages, and even the 2022 level was 10% higher than the previous peak reached in 2017. Growth in services was largely even across the region, with rises of 47% in Mexico, 32% in Brazil and 28% in the other countries, on average. In Mexico, there was unusual growth in investment as a result of a large merger in the film and video industry, which will be discussed later, and another in air transport. In Brazil, the most noteworthy growth was in non-financial holding companies and financial services, electricity and gas services, and ICT services. Manufacturing investments, which followed a downward trend in previous years, grew by 47% relative to 2021, but remained below 2019 levels (17% lower). The long-term trend of declines in manufacturing investments, seen since 2013, did not reverse, with levels still below the peak reached in 2013 (50% lower). The highest rate of year-on-year growth was in Brazil (157%), but the country also recorded the most significant long-term decline in manufacturing investment (down from an average of US$ 36.000 billion between 2010 and 2014 to US$ 19.642 billion in 2022). In 2022, the largest inflows were in coke refining, petroleum derivatives and biofuels, and the automotive industry. Growth in Mexico was lower (9%), transport equipment manufacturing being the sector that attracted the most FDI, although for a smaller amount than in 2021; larger investments were made in base metal industries and the food industry. In both countries, inward FDI in manufacturing was below the average for 2010–2014. In the other countries analysed, manufacturing investments were smaller than in 2021.
Investment in natural resources, which has followed a downward trend since 2010, returned to growth (79%), in line with the average levels for 2015–2019. In fact, in percentage terms, it was the fastest growing sector in 2022. This was a result of an increase in investment in most countries, and above all in Brazil, where there was significant growth in inflows to oil and gas extraction. However, in
34 Economic Commission for Latin America and the Caribbean (ECLAC) Chapter I
Natural resources Manufactures Services 0 10 20 30 40 50 60 70 80 2010 2011 2012 2013 2014 2015 2016 2017 2018 2019 2020 2021 2022
America and the Caribbean (12 countries): sectoral distribution of FDI inflows, 2010–2022 (Billions
of dollars)
Mexico flows declined after more than doubling in 2021. Inflows into natural resources in Colombia also contributed to this growth (228%), as a result of larger investments in the oil and mining and quarrying sectors.
(a) Mergers and acquisitions: increased interest in natural resources and information and communications
Mergers and acquisitions in 2022 focused on three activities: information and communications (33% of total value), mining and quarrying (22%), and manufacturing (17%). This distribution by sector represents a change with respect to 2021 and previous years, in three main ways (see figure I.14). Firstly, the information and communications sector’s share is the largest on record, owing to the merger between the Mexican company Televisa and the United States company Univision, for a total of US$ 4.8 billion. The merger created TelevisaUnivision, the largest Spanish-language media group in the world (Televisa, 2022). Secondly, acquisitions of electricity, gas and water supply companies, which expanded significantly in prior years, declined in 2022. Lastly, the renewed interest in natural resources reached levels not seen since the first half of the 2010s.
In the information and communications sector, the merger between Mexico’s Televisa Group and the United States’ Univision, mentioned above, accounted for the growth. This transaction entailed record amounts for the sector, both regionally and for Mexico, highlighting growing interest from multinational media groups in the Latin American market (El Economista, 2022a; Televisa, 2022). The second largest transaction (see table I.3), in this case in the telecommunications sector, was the purchase from a Jamaican company of assets not physically located in the region. Australian telecommunications giant Telstra acquired the Digicel Pacific division of Jamaican company Digicel for US$ 1.6 billion.2
35 Foreign Direct Investment in Latin America and the Caribbean • 2023 Chapter I
Figure I.14
Other activities Transport and storage Information and communications Electricity, gas and water supply Mining and quarrying Manufacturing Financial and insurance activities 0 10 20 30 40 50 60 2006–2010 (annual average) 2011–2015 (annual average) 2016–2020 (annual average) 2021 2022
Latin America and the Caribbean: cross-border mergers and acquisitions, by sector, 2006–2022 (Billions of dollars)
Source: Economic Commission for Latin America and the Caribbean (ECLAC), on the basis of data from Bloomberg.
2 The Government of Australia financed the transaction through Export Finance Australia. Digicel Pacific is a division of the Jamaican company that operates in six South Pacific countries: Fiji, Nauru, Papua New Guinea, Samoa, Tonga and Vanuatu (Digicel Pacific, 2022; PRNewswire, 2022). The transaction is still subject to international arbitration in Singapore owing to a dispute over a tax imposed by Papua New Guinea.
Table I.3
Latin America and the Caribbean: 20 largest cross-border mergers and acquisitions, 2022
The Chilean telecommunications market also displayed buoyant growth in 2022, as local and cross-border deals reflected restructuring and portfolio optimization by companies in the sector. In addition to transactions among domestic companies (such as the merger of VTR and Claro), 3,800 telecommunications towers owned by the company WOM were sold to the United States’ Phoenix Tower International. The assets were sold to increase the efficiency of WOM’s operations,
36 Economic Commission for Latin America and the Caribbean (ECLAC) Chapter I
Company Country of origin Assets acquired Percentages Country of assets Sector Amount (Millions of dollars) Univision Communications Inc. United States Grupo Televisa S.A.B. 31.15 Mexico Information and communications 4 800 Telstra Corp. Ltd. Australia Digicel Pacific Ltd. 100 Jamaica Telecommunications 1 600 Prosus NV Netherlands (Kingdom of the) iFood.com Agency Restaurants Online SA 33 Brazil Computer programming, consultancy and related activities 1 505 South32 Ltd. Australia Sierra Gorda project 45 Chile Mining and quarrying support service activities 1 550 Mondelez International Inc. United States Ricolino SA de CV 100 Mexico Manufacture of food products 1 300 Indorama Ventures Public Company Limited Thailand Oxiteno SA Industria e Comercio 100 Brazil Manufacture of chemicals and chemical products 1 300 SoFi Technologies Inc. United States Technisys SA 100 Argentina Computer programming, consultancy and related activities 1 100 Westrock Co United States Grupo Gondi SA de CV 68 Mexico Manufacture of paper and paper products 970 Ganfeng Lithium Group Co Ltd. China LitheA Inc 100 Argentina Mining of metal ores 962 Phoenix Tower International LLC United States Portfolio of 3,800 telecommunication sites in Chile 100 Chile Telecommunications 930 Grupo Energía Bogota SA ESP, Argo Energia Empreendimentos e Participações SA Colombia Quantum Participações SA 50 Brazil Electricity, gas and water supply 836 Rio Tinto PLC Australia Rincón lithium project 100 Argentina Mining and quarrying (lithium) 825 Equinix Inc United States Four data centres owned by Empresa Nacional de Telecomunicaciones (Entel) 100 Chile and Peru Data centres 735 Innergex Renewable Energy Inc Canada Aela Generación S.A. Aela Energía SpA 100 Chile Renewable energies 691 Darling Ingredients Inc United States Fasa America Latina Participações Societarias S/A 100 Brazil Agriculture, livestock, forestry and fisheries 541 Inversiones Cachagua SpA United States AES Andes SA 31.16 Chile Electricity, gas and water supply 522 Lundin Mining Corp Canada Josemaria Resources Inc 100 Argentina Mining and quarrying (copper) 497 Aena Spain 11 Brazilian airports 100 Brazil Transport and storage 471 EuroChem Switzerland Phosphate projects in Serra do Salitre 100 Brazil Mining and quarrying 452 Lukoil Russian Federation (the) Area 4 offshore project in Mexico 50 Mexico Extraction of crude oil and natural gas 435 Source: Economic Commission for Latin America and the Caribbean (ECLAC), on the basis of data from Bloomberg.
and the transaction will be finalized in 2024, making the United States company the largest owner of communication towers in Chile (El Economista, 2022b; La Tercera, 2022). Another key event in the Andean country’s telecommunications sector was the recent sale of four data centres belonging to the Chilean telecommunications company Entel (three in Chile and one in Peru) to the United States company Equinix. This strategic sale allows Entel to redirect its resources and services to a more efficient portfolio, while enabling Equinix to expand its global presence, especially in the four-country Pacific Alliance trade bloc (Entel, 2022).
Interest in natural resource exploitation in the region remained strong, and 4 of the 20 largest operations of the year were related to this activity (see table I.3). The biggest was the acquisition by Australia-based South32 Limited of an interest in the Sierra Gorda SCM copper and molybdenum mining company in Chile from Sumitomo Metal Mining of Japan and its parent company, Sumitomo Corporation. Following the transaction, South32 holds a 45% stake in the company, while KGHM Polska Miedz S.A. of Poland retains a 55% stake. The transaction represents a strategic review of the Japanese group’s portfolio, as well as South32’s first foray into Chile. Prior to this transaction, South32 was already operating in Brazil and Colombia, so this new acquisition represents a significant expansion of its presence in Latin America (SGSCM, 2022; LexLatin, 2021).
The exploration and production of lithium and its compounds accounted for two other significant operations in Argentina. The larger of these operations was the acquisition of the Argentine company LitheA Inc. by China-based Ganfeng Lithium Group. The goal of Ganfeng, the largest producer of lithium compounds in China and a key supplier to Tesla, the United States-based electric vehicle producer, is to access lithium reserves in Salta Province to produce essential battery materials (Reuters, 2021). In the same region, the Australia-based mining company Rio Tinto acquired the Rincon Mining lithium exploration project. According to the company, the project is expected to be long-term and low-carbon, thanks to an innovative technology applied by Rio Tinto to extract the metal, which has the potential to increase its recovery yield. A pilot plant is already operating in the region, and the company plans to invest approximately US$ 100 million over the next two years to further explore the project’s potential, with a further US$ 1 billion planned for the construction of a commercial plant (Government of the Province of Salta, 2022; Rio Tinto, 2022).
In mining and quarrying (although some manufacturing activities are included), the fertilizer company EuroChem, of the Russian Federation and Switzerland, has bought a phosphate mine and a processing plant for the production of fertilizers located in the State of Minas Gerais, Brazil, from the Norway-based company Yara. The project, called “Serra do Salitre”, comprises an open-pit mine and a plant at an advanced stage of development. EuroChem plans to invest an additional US$ 450 million to complete the project, which includes the construction of a sulfuric acid plant and a phosphoric acid plant, along with a storage facility for granular fertilizers, among other products. The project is expected to be fully operational in 2024, taking advantage of the record price hikes in the fertilizer market as a result of sanctions imposed on Belarus and the Russian Federation, which are major producers, owing to their involvement in the conflict with Ukraine since early 2022. The acquisition is part of EuroChem’s growth strategy in South America, given the agricultural importance of the region (Baffes and Chian Koh, 2023; EuroChem, 2022; Yara, 2021).
Three subsectors of the manufacturing sector stood out: the chemical industry (30% of total mergers and acquisitions in the industrial sector), the food industry (29%) and paper and paper product manufacturing (26%). A notable transaction in the chemical industry is the sale of 100% of the assets of the Brazil-based petrochemical company Oxiteno, belonging to Ultrapar Participações, to Indorama Ventures of Thailand, allowing the company to consolidate its position as the leading producer of surfactants in the Americas (Oxiteno, 2022). In the food industry, the United States-based giant Mondelez International acquired the assets of Mexico’s Ricolino from Grupo Bimbo, also of Mexico, thus acquiring not only two brands with a strong presence in the Mexican market, but also six plants and the distribution chain, and doubling the size of its operations in the Mexican market (Noguez, 2022a).
37 Foreign Direct Investment in Latin America and the Caribbean • 2023 Chapter I
In paper and paper product manufacturing, United States-based WestRock acquired the remaining 67.7% of the share capital of Grupo Gondi, the Mexican paper, corrugated cardboard and high graphics company. The operation includes four paper mills, nine corrugated packaging plants and six high graphic plants in Mexico (WestRock, 2022). The United States-based company had already begun establishing a joint venture with the Mexican group in 2015, when it bought 32.3% of the company’s shares (LexLatin, 2023).
(b) FDI project announcements: hydrocarbon and automotive sectors outperform renewable energy
The breakdown of FDI announcements by sector also changed with respect to 2021 and previous years. For the first time since 2010, coal, oil and gas project announcements accounted for the largest share, at 24% of the total amount, growing more than ninefold on the prior year (see figure I.15). There was also significant interest in the automotive and auto parts, renewable energy and technology-intensive industries, which together accounted for more than one third of the announced amount of investment. The telecommunications sector, which was the leading sector in terms of announcements in 2021, experienced a significant decline (52%), ending the growth trend of the previous year.
Source: Economic Commission for Latin America and the Caribbean (ECLAC), on the basis of Financial Times, fDi Markets [online database] https://www.fdimarkets.com/.
Two energy sectors —coal, oil and gas and renewable energy— became more important in 2022 owing to higher global energy prices, and also to the ongoing energy transition efforts (for a detailed analysis of FDI in energy in the region, see chapters II and III). The growth in coal, oil and gas mainly came from large projects announced in Guyana and Mexico, which together totalled over US$ 22 billion and accounted for 93% of the total for projects in the sector. The renewable energy sector ranked third, with an amount close to US$ 11 billion and 40% growth on the previous year. However, the sector remains well below the levels seen in 2019, when renewable energy projects totalled more than US$ 20 billion.
The largest renewable energy project was announced by the United States company SGP BioEnergy in Panama, with investments for an amount of US$ 2.473 billion in the Ciudad Dorada biorefinery. The project, a partnership with Panama Oil Terminals and the Government of Panama, will have
38 Economic Commission for Latin America and the Caribbean (ECLAC) Chapter I
Figure I.15
Coal, oil and gas (24) Automobiles and auto parts (13) Renewable energy (11) Technology-intensive industries (7) Metals (7) Other natural resource-intensive sectors (6) Transport and storage (5) Food, beverage and tobacco (5) Financial services (5) Telecommunications (4) Labour-intensive sectors (3) Software and computer services (3) Hotels and tourism (3) Other (4)
Latin America and the Caribbean: FDI project announcements, by sector, 2022 (Percentages of the total amount)
a production capacity of 180,000 barrels per day, making it the largest aviation biofuel production platform in the world (Ministry of Trade and Industry, 2022). The second largest announcement was that by InterEnergy of the United Kingdom, through Consorcio Energético Punta Cana-Macao (CEPM), a US$1 billion project for wind and solar generation in the Dominican Republic. In addition to the coal, oil and gas sector, other extractive sectors grew significantly in 2022. These included metals (134%), minerals (1,174%) and other natural-resource-intensive products (138%). Of note is the minerals sector, which underwent a record decline in 2020 to announcements for a total of US$ 4 million, but whose announcements amounted to close to US$ 840 million in 2022 (1% of the total). Interest from multinational companies in extracting lithium in Argentina is behind these announcements. For instance, the United States company Livent announced an investment of US$ 510 million to expand its lithium operation in Argentina and the China-based corporation Zijin Mining Group announced it will invest US$ 380 million in its lithium operation in the country. In the automotive and auto parts sectors, the main announcement came from Tesla Motors, the United States producer of electric vehicles, which announced a new plant in Monterrey, Mexico, to manufacture new generation vehicles, with an expected investment of US$ 5 billion and creation of 7,000 direct jobs. When selecting the location, the company favoured proximity to the United States and the pre-existing value chains there (Bloomberg Línea, 2023). Construction of the Tesla plant may drive new investment from specialized suppliers. For example, the AGP Group, which specializes in glazing, announced that it will invest US$ 800 million in Santa Catarina, Mexico (Vanguardia, 2023).
Technology-intensive industries ranked fourth, with 7% of the total amount of the announced projects. The largest announcements were in the industrial equipment, electronic components, consumer electronics and aerospace sectors. Mexico was the main recipient of investment in high-tech industries, accounting for 78% of projects in industrial equipment, 93% of electronic components, 80% of consumer equipment, 89% of aerospace and 93% of semiconductors. One key project was that of the Chinese solar panel manufacturer Solarever, which already operated in Mexico and announced a US$ 1 billion investment in the State of Jalisco to manufacture batteries for electric cars. Meanwhile, Costa Rica was the main destination for medical equipment, attracting 52% of the total announced amount. The two countries have existing manufacturing capacity for these industries, which has led to growing interest among international investors.
The aerospace and semiconductor sectors grew considerably from 2021 to 2022. In aerospace, the investment projects announced in the States of Chihuahua, Querétaro and Jalisco in Mexico accounted for 89% of the total projected amount for the sector, or US$ 829 million. The only aerospace project announced outside Mexico was in Brazil, for an amount of US$ 94 million. The United States company Jabil, which already has large facilities in Mexico, announced a US$ 400 million investment in the semiconductor sector in Jalisco.
5. FDI by country of origin: the United States and the European Union are still the main investors in the region
The origin of FDI can be identified only imprecisely through national accounts statistics, as they record the immediate origin of the capital and not the ultimate origin of the company making the investment. As a result, investments made from Luxembourg or the Kingdom of the Netherlands —which are often selected by multinational companies to invest in third countries owing to their tax systems— are frequently overrepresented. Therefore, national accounts data have been supplemented with data on mergers and acquisitions and investment project announcements.
An analysis of the nine countries that reported the origin of FDI inflows in 2022 reveals that the United States and the European Union remained the main investors, but with some changes in their respective shares. The United States retained its position as the region’s main investor (38% of the
39 Foreign Direct Investment in Latin America and the Caribbean • 2023 Chapter I
total), with growth of 34% in FDI inflows with respect to 2021 (see figure I.16). These investments were mainly in Mexico (46%) and Brazil (31%). United States investments in Colombia grew substantially, by 220%, making the country the third largest recipient of United States investment in Latin America.
China and Hong Kong, China Canada Other origins Latin America and the Caribbean Netherlands (Kingdom of the) and Luxembourg European Union (excluding the Kingdom of the Netherlands and Luxembourg) United States
Source: Economic Commission for Latin America and the Caribbean (ECLAC), on the basis of official figures and estimates as at 30 June 2023.
a The countries are Brazil, Colombia, Costa Rica, the Dominican Republic, Ecuador, El Salvador, Guatemala, Honduras, Mexico, Plurinational State of Bolivia and Trinidad and Tobago which have sector-level data for 2022. The information for Brazil does not include the reinvested earnings component. Sectoral data for Costa Rica and Mexico are computed using the approach of International Monetary Fund (IMF), Balance of Payments and International Investment Position Manual: Fifth Edition (BPM5), Washington, D.C., 1993.
The share of the United States and the European Union (excluding the Kingdom of the Netherlands and Luxembourg) declined, because of strong growth in investment from Latin America and the Caribbean and the Kingdom of the Netherlands and Luxembourg. Investments from the European Union (excluding the Kingdom of the Netherlands and Luxembourg) grew by 20%, while growth for the Kingdom of the Netherlands and Luxembourg was 101%.
Investment originating from Latin America and the Caribbean grew by 136% in 2022. Growth in investment from Chile, Argentina, Uruguay and Panama contributed 81 percentage points of the growth. Brazil, Colombia and Mexico were the main destinations for investments originating from Latin America and the Caribbean, at 34%, 24% and 20% of the total, respectively. In the case of Colombia, 51% of investments from the region originated from Panama, where intermediary investment companies operate, investing capital whose ultimate origin is not identifiable. In Brazil, the main Latin American and Caribbean investors were Chile, Uruguay and the Bahamas, which invested 56%, 18% and 11% of the total, respectively. The Bahamas and Uruguay are also markets where financial intermediation companies play a prominent role in cross-border capital movements. Given that these countries with capital in transit account for a large share of investments, by countries of origin, in Latin America and the Caribbean, it is not immediately clear whether the growth in the share of intraregional investment is a reflection of activity by companies from the region. However, as examined in section I.C, capital outflows from the region reached record levels. The investment from Chile in Brazil, at US$ 3.066 billion, is likely related to the investment of Celulosa Arauco y
40 Economic Commission for Latin America and the Caribbean (ECLAC) Chapter I
Figure I.16
(Percentages) 24 24 21 17 22 10 9 12 10 7 9 14 12 13 10 11 26 38 40 38 5 6 7 4 1 1 4 3 0 10 20 30 40 50 60 70 80 90 100 2015-2019 2020 2021 2022
Latin America and the Caribbean (11 countries):a distribution of FDI inflows, by origin, 2015–2022
Constitución (see section I.C). Investments originating from the region also grew significantly in Ecuador (303%) and the Dominican Republic (115%), owing mainly to investments originating from Uruguay and Mexico, respectively.
(a) Mergers and acquisitions: lower amounts from China and the European Union
In terms of countries of origin of the multinational companies that have acquired assets in the region, the share in total investment of firms from the United States increased in 2022 to 43%, compared to an average since 2011 of 20% (see figure I.17). They were followed, in order, by companies from Australia (16%), the European Union (9%) and Canada (8%). This marked a striking drop in the total amount of acquisitions from European Union companies, which between 2011 and 2020 had accounted for 21% of the total, as well as from China and Hong Kong, China, which accounted for 14% of the total in the same period. In fact, 2022 was the year with the lowest monetary amount for Chinese acquisitions in the region since 2013 and the fewest deals since 2011. In the case of companies from the European Union, the number of deals recovered (56 compared to 43 in 2021), but remains below the average for previous years (81 per year between 2011 and 2019).
(b) FDI project announcements: megaprojects drove changes
In 2022, announced investments originating from the United States and Australia grew considerably in terms of value (see figure I.18). The United States remained in the leading position, with a share of 38% of the total (a rise of 186% on 2021). The most noteworthy projects originating from the United States include oil extraction projects in Guyana and automotive industry projects in Mexico. In addition to the importance of the coal, oil and gas sector (39% of the announced amount for the country), automobiles and auto parts (16%) and renewable energies (10%) stood out, with significant growth in announcements in the energy sector (renewable and non-renewable).
41 Foreign Direct Investment in Latin America and the Caribbean • 2023 Chapter I
Figure I.17
(Billions of dollars) Other countries European Union Australia United States Switzerland Colombia China and Hong Kong, China Chile Canada 0 10 20 30 40 50 60 2011–2015 (annual average) 2016–2020 (annual average) 2021 2022
Latin America and the Caribbean: cross-border mergers and acquisitions, by country or region of origin, 2011–2015, 2016–2020, 2021 and 2022
Source: Economic Commission for Latin America and the Caribbean (ECLAC), on the basis of data from Bloomberg.
With fewer announcements, Australia ranked second, with 8% of the total amount. The main investments in the region announced by Australian companies focused on coal, oil and gas in Mexico, metals in Chile and renewable energy in Brazil. The largest project was announced by Woodside in Mexico, originating from a partnership with PEMEX to explore the Trion offshore oil project in the deepwater Gulf of Mexico, estimated at US$ 4.500 billion (BHP, 2022; Reuters, 2023). The Australian group BHP announced investments of US$ 2.460 billion in copper extraction in Chile. In the past, Australian investments in the region have centred on minerals, oil and gas. In fact, Australia’s third largest investment in 2022 in the renewable energy sector in Brazil was related to the mining sector. Macquarie Asset Management’s US$ 700 million project is for a wind and solar power plant in north-eastern Brazil (Piauí and Pernambuco), and the generated energy will be supplied to a bauxite mine and for aluminium production in the Amazon region of the State of Pará. These extractive investments generally focus on the respective traditional sectors of national economies; they do not constitute structural changes, but rather a deepening of existing extractive production structures.
Announced investments by European Union companies recovered slightly in 2022 (7%), but failed to return to pre-pandemic levels (see figure I.19). The rise came from growth in announcements from Germany (86%) and France (11%), despite a decline in those from Spain (7%). Announcements by Spanish companies in Latin America and the Caribbean, which used to rank second in the region, have not yet returned to pre-pandemic levels. Over the 10 years prior to the pandemic, Spain accounted for an average of 12% of announcements in the region, while in 2022 it accounted for just 3%. By contrast, announced investments from China and Hong Kong, China maintained the level seen in the past, accounting for around 5% of the total value. In 2019, announced Chinese investments in the region reached a record high (11% of the total), but after the pandemic they did not return to those levels.
42 Economic Commission for Latin America and the Caribbean (ECLAC) Chapter I
Figure I.18
2022 2021 0 5 10 15 20 25 30 35 40 45 Switzerland Spain France Chile Japan United Kingdom China Germany Australia United States
Latin America and the Caribbean: FDI project announcements, by country of origin, 2021 and 2022 (Billions of dollars)
Source: Economic Commission for Latin America and the Caribbean (ECLAC), on the basis of Financial Times, fDi Markets [online database] https://www.fdimarkets.com/.
Source: Economic Commission for Latin America and the Caribbean (ECLAC), on the basis of Financial Times, fDi Markets [online database] https://www.fdimarkets.com/.
C. FDI outflows from Latin America and the Caribbean: outward investment hit record highs
In 2022, the amount invested abroad by trans-Latin companies jumped by 80% compared to the previous year, to a record US$ 74.677 billion. This figure is the highest since the series was first compiled in the 1990s, and over US$ 30 billion more than the amount invested in 2021 (see table I.4). The growth came mainly from significant increases in outward investment from Brazil and Mexico, and this trend is partly a consequence of investments announced in 2019 being postponed because of the COVID-19 pandemic.
Latin America and the Caribbean (selected countries): outward FDI, 2013–2017 and 2018–2022 (Millions of dollars and percentage rates of change)
Source: Economic Commission for Latin America and the Caribbean (ECLAC), on the basis of official figures and estimates as at 30 June 2023.
43 Foreign Direct Investment in Latin America and the Caribbean • 2023 Chapter I
Figure I.19
(Billions of dollars) 0 10 20 30 40 50 60 2005 2006 2007 2008 2009 2010 2011 2012 2013 2014 2015 2016 2017 2018 2019 2020 2021 2022 European Union United States China and Hong Kong, China
Latin America and the Caribbean: announced FDI projects from selected countries or regions, 2005–2022
Table I.4
2013–2017 (Annual average) 2018 2019 2020 2021 2022 Absolute change 2020–2021 (Amounts) Relative change 2021–2022 (Percentages) Share of total regional FDI, 2022 (Percentages) Argentina 1 326 1 726 1 523 1177 1537 2076 540 35.1 2.8 Brazil 15 084 2 025 22 820 -3 467 16 239 30 694 14 455 89.0 41.1 Chile 9 133 1 847 10 345 6 398 13 946 12 776 -1 171 -8.4 17.1 Colombia 4 795 5 126 3 153 1 733 3 181 3 402 221 6.9 4.6 Mexico 9 112 12 121 5 969 5 578 401 17 371 16 970 4 231.8 23.3 Uruguay 1 542 2 456 79 -491 1 893 6 051 4 158 219.6 8.1 Other countries 2 676 560 1 737 -278 4283 2307 -1976 -46.0 3.1 Latin America and the Caribbean 43 667 25 860 45 626 10651 41481 74677 33196 80.0 100
In 2022, outward FDI by Brazilian companies topped US$ 30 billion for the first time since 2013, accounting for 41.1% of the region’s total. In the case of Mexico, the increase was substantial, as outward FDI rose from a particularly low level in 2021 to US$ 17.371 billion in 2022. Investments by Mexican companies therefore accounted for 23.3% of total Latin American and Caribbean investments abroad. In the case of Chile, although outward foreign investments declined by 8% in 2022, they were still above the average for the preceding decade and the country remains the third leading source of outward FDI from the region, with 17% of the total in 2022. Although Uruguay appears as a significant source of investment in 2022, it sometimes operates as a transit country for capital, so the ultimate owner of companies may be registered in another country (Uruguay XXI, 2022). Therefore, the figure attributed to the country does not necessarily reflect the activity of Uruguayan companies investing abroad. There was also growth in outward investments by Argentine multinationals (35%), with levels much higher than those recorded over the preceding decade.
In 2022, the stock of investments of trans-Latin companies abroad grew by 4% to US$ 1.06 trillion. Brazil and Mexico were the countries with the largest shares, at 46% and 23%, respectively (see figure I.20), and were followed by Chile, which accounted for 14%. The country with the strongest growth in its share of the investment stock was Uruguay, at 22%, continuing the trend of high growth in outward FDI reported by the country in 2022.
As in previous editions of this report, to better capture the behaviour of multinational corporations in the region, the information from national accounts must be complemented by unofficial data sources, with a view to understanding the specific patterns in some foreign investments. In terms of Latin American companies acquiring assets in other countries in the region, 2022 saw the lowest number of mergers and acquisitions in a decade (including the duration of the COVID-19 pandemic), with 133 deals completed, 18% less than the prior year. However, despite this drop, the total value of the deals was 2% higher, at US$ 9.095 billion (see figure I.21).
44 Economic Commission for Latin America and the Caribbean (ECLAC) Chapter I
Figure I.20
Bolivia (Plur.
Uruguay Argentina Colombia Chile Mexico Brazil 0 0.2 0.4 0.6 0.8 1.0 1.2 2010 2011 2012 2013 2014 2015 2016 2017 2018 2019 2020 2021 2022
Latin America and the Caribbean (7 countries):a stock of outward FDI, 2010–2022 (Trillions of dollars)
State of)
Source: Economic Commission for Latin America and the Caribbean (ECLAC), on the basis of official figures and estimates as at 30 June 2023.
a The countries included are those for which information is available up to 2022.
The largest deal by trans-Latin companies in 2022 involved the sector related to public services and more specifically to renewable energy, which accounts for the second largest proportion of such transactions (26% of the total). Actis, a United Kingdom investment fund specializing in sustainable infrastructure, sold 100% of the assets of Echoenergia, Brazil’s largest independent renewable energy platform, to the Brazilian public service company Equatorial Energia. Valued at around US$ 1.200 billion, the transaction is considered the largest ever recorded in the renewable energy sector in Brazil (Actis, 2022; Norton Rose Fulbright, 2021)3 (see table I.5).
45 Foreign Direct Investment in Latin America and the Caribbean • 2023 Chapter I
(Billions of dollars and number) Value Number (right scale) 0 50 100 150 200 250 300 350 400 450 0 10 20 30 40 50 60 2012 2013 2014 2015 2016 2017 2018 2019 2020 2021 2022
Figure I.21 Latin America and the Caribbean: cross-border mergers and acquisitions by trans-Latin companies, 2012–2022
Source: Economic Commission for Latin America and the Caribbean (ECLAC), on the basis of data from Bloomberg.
Table I.5
Company Country of origin Assets acquired Percentage Country of assets Sector Amount (Millions of dollars) Equatorial Energia SA Brazil Echoenergia Participações SA 100 Brazil Renewable energies 1 254 Compañía Siderúrgica Nacional (CSN) Brazil CSN Cimentos Brasil SA 100 Brazil Cements and aggregates 1 025 Grupo Energia Bogotá SA ESP, Argo Energia Empreendimentos e Participações SA Colombia Quantum Participações SA 50 Brazil Electricity, gas and water supply 836 Cencosud SA Chile The Fresh Market Holdings Inc 67 United States Retail trade 676
Latin America and the Caribbean: 10 largest cross-border mergers and acquisitions by trans-Latin companies, 2022
3 This is the third divestment by Actis in Latin America and the Caribbean in the last two years: in 2021 it sold the assets of Saavi Energía in Mexico to Global Infrastructure Partners and in 2022 it participated in the sale of Aela Energía, in Chile, to Innergex Renewable Energy (Actis, 2022).
Source: Economic Commission for Latin America and the Caribbean (ECLAC), on the basis of data from Bloomberg.
a Transport and storage of crude oil and natural gas (midstream).
b Refining or processing of crude oil and natural gas, distribution, sale and final use (downstream).
Also in the public services sector, Grupo Energía Bogotá (GEB) and its Brazilian subsidiary Argo Energia Empreendimentos e Participações S.A. have acquired the assets of Quantum Participações, which belonged to the Brookfield group. The transaction covers five electricity transmission concessions in Brazil and was valued at US$ 836 million, doubling the Colombian group’s presence in the country, with an emphasis on the north-east region, which has high potential for renewable energy generation (AméricaEconomía, 2022a; Semana, 2022).
Analysis by sector of mergers and acquisitions by trans-Latin companies shows that the manufacturing industry is the top target for acquisitions by multinational companies in the region, with a 38% share of total transactions in 2022. The main subsector was cement production, driven by the acquisition of CSN Cimentos Brasil SA, owned by Swiss giant LafargeHolcim, by Brazilian steelmaker Companhia Siderúrgica Nacional (CSN).
In the industrial sector, there were two transactions linked to the petrochemical industry that are worth highlighting. Mexican company Alpek, which specializes in industrial resins and polyethylene terephthalate (PET) products, has acquired 100% of the assets of Octal Holding & Co Saoc, including a recycling centre in the United States and resin and thermoform packaging plants in Oman and Saudi Arabia. The deal not only increases the Mexican company’s geographic coverage and capacity, but also forms part of its sustainability strategy, by expanding use of low-carbon technologies and addressing customers’ recycling needs (Mundo PMMI, 2022).
In terms of foreign investment projects announced by trans-Latin companies, the amount of investment announced grew by 46% compared to 2021. The quantity and value of the announcements are still below pre-pandemic levels, although there is a positive trend in the number of announcements over time and stability in average investment values (see figure I.22).
In terms of the distribution by sector of the foreign investment projects announced by companies from the region, natural-resource-intensive industries stand out, accounting for 27% of the total investment amount announced in 2022. This high proportion is primarily a result of plans by the Chilean company Celulosa Arauco y Constitución to invest US$ 3.000 billion in construction of a pulp mill in Mato Grosso do Sul (Brazil). The plant is expected to start operating in 2025 and create 3,000 direct jobs (Arauco Brasil, 2022) (see figure I.23).
46 Economic Commission for Latin America and the Caribbean (ECLAC) Chapter I Company Country of origin Assets acquired Percentage Country of assets Sector Amount (Millions of dollars) Alpek SAB de CV Mexico Octal Holding & Co Saoc 100 Oman and the United States Chemical industry 620 Petróleos Mexicanos (PEMEX) Mexico Deer Park Refining LP 50 Mexico Oil, coal and natural gasa 596 Cosan SA Brazil Petrochoice Holdings Inc 100 United States Oil, coal and natural gasb 479 Itaú CorpBanca Chile SA Chile Itaú CorpBanca Colombia SA 33 Colombia Financial services 414 Infraestrutura Brasil Holding XVII SA Brazil Contour Global do Brasil Participações SA 100 Brazil Electricity, gas and water supply 320 Empresas CMPC SA Chile Carta Fabril SA 33 Brazil Manufacture of paper and paper products 241
Source: Economic Commission for Latin America and the Caribbean (ECLAC), on the basis of Financial Times, fDi Markets [online database] https://www.fdimarkets.com/.
Source: Economic Commission for Latin America and the Caribbean (ECLAC), on the basis of Financial Times, fDi Markets [online database] https://www.fdimarkets.com/.
Announcements in labour-intensive industries, divided into the consumer products, construction materials and textile sectors, also grew considerably. The second largest announced project in 2022 was in the construction materials sector, by Grupo Cementos de Chihuahua (GCC), a Mexican company that plans to expand its cement production in the State of Texas (United States), with an investment of US$ 750 million.
47 Foreign Direct Investment in Latin America and the Caribbean • 2023 Chapter I
Figure I.22
(Billions of dollars and number) Number (right scale) Value 0 50 100 150 200 250 300 350 400 450 0 2 4 6 8 10 12 14 16 18 20 2012 2013 2014 2015 2016 2017 2018 2019 2020 2021 2022
Latin America and the Caribbean: foreign investment projects announced by trans-Latin companies, 2012–2022
Figure I.23
(Billions of dollars) 2021 2022 0 0.5 1.0 1.5 2.0 2.5 3.0 3.5 4.0 Other natural- resource-intensive sectors Labour-intensive sectors Food, beverage and tobacco Telecommunications Software and computer services Transport and storage Financial services Automobiles and auto parts Metals Hotels and tourism Technology-intensive industries Renewable energy Chemicals All other sectors
FDI project announcements by trans-Latin companies, by sector, 2021 and 2022
The amount of investment in telecommunications, which was the most important sector in 2021, declined by 39% in 2022. Nonetheless, the sector had the third largest announced project in the region, that planned by Claro Costa Rica, a subsidiary of Mexico’s América Móvil. The project is to expand a submarine cable connecting several countries in the region, for a total amount of US$ 500 million throughout Latin America (DPL News, 2022).
The top destination for foreign investment from countries of Latin America and the Caribbean —driven by investment announcements from trans-Latin companies— is the region itself, as it accounts for 61% of the value of announced projects, followed by North America (23%). The picture is different for mergers and acquisitions, however, with North American assets attracting the most trans-Latin companies (31%), followed by Europe (30%) and then Latin America and the Caribbean (26%) (see figure I.24).
D. Policies to attract investment
One of the main reasons given for using public resources to attract investment is the potential of FDI to drive production linkages and transfers of knowledge and technology, and thus support economic growth (ECLAC, 2010). In broader terms, investment flows can also contribute to sustainable development by favouring inclusion, creation of quality jobs and environmental conservation, in addition to driving innovation and increasing productivity and competitiveness, among other effects. However, these potential benefits do not occur automatically or spontaneously, but depend on an appropriate context and stimulus measures.
Over the past few decades, attention has increasingly been paid to how to focus public policies and institutions to effectively attract quality FDI. Quality FDI can be understood as that which drives increased productivity, innovation and incorporation of new technology, and is oriented towards sustained, inclusive and sustainable economic growth (ECLAC, 2020). In other words, FDI contributes
48 Economic Commission for Latin America and the Caribbean (ECLAC) Chapter I
Figure I.24
(Percentages) 0 10 20 30 40 50 60 70 Mergers and acquisitions 31 26 30 13 23 61 8 8 Project announcements North America Latin America and the Caribbean Europe Africa, Asia, and Oceania
Latin America and the Caribbean: mergers and acquisitions and project announcements by trans-Latin companies, by target region, 2022
Source: Economic Commission for Latin America and the Caribbean (ECLAC), on the basis of Financial Times, fDi Markets [online database] https://www.fdimarkets.com/ and Bloomberg.
to capacity-building in the recipient country, for example, in terms of creation of quality jobs and formation of production linkages, or research and development, innovation and technologies. If FDI and the policies to attract it form part of a national development plan, their quality can be assessed in terms of the impact that FDI can have on fulfilment of the plan’s main objectives.
The interest in attracting this type of foreign capital has been reflected in an international tendency to adopt more sophisticated policy frameworks that are integrated into a vision for the future and coordinated with other policies that enable progress towards the specific development priorities of each area. This involves the efficient combination of different measures and instruments, including the design and implementation of different financial and fiscal incentives, and the development of mechanisms to mitigate the risk of investment projects and facilitate access to financing. This can be done, for example, by establishing legal, regulatory and policy frameworks that foster the credibility, predictability and confidence needed to attract private sector investment. More complex policy has been accompanied by construction of more robust institutional frameworks for FDI, with most countries in the world establishing agencies to attract investment.
Because governments have different priorities, resources and policy options, international experience shows that there is no one-size-fits-all approach for all countries. Instead, approaches, strategies, instruments and means of implementing them differ and are better or worse suited depending on the specific conditions of each context, the level of development and existing capacities.
Latin American and Caribbean countries have only relatively recent experience in policies to attract investment, and the importance attached to them has increased, especially since the efforts to further liberalize their economies in the 1990s. These policies have evolved over time in response to changes in the global economic environment and the region’s own economic and political conditions.
Over the past two decades, many countries have begun advancing in designing more active, strategic policies to attract and encourage FDI. They have progressed from adopting general measures with no specific sectoral focus (for example, entry regulations and initiatives to eliminate red tape) towards measures that focus more on priority sectors or areas for productive development, even though the panorama remains uneven and there is room for more targeted action.4 More recently, a novel —albeit incipient and slow— trend has been observed in policies to attract investment to the region, this time looking at the contribution of FDI to sustainable development.
Although in Latin America as in the rest of the world, policy instruments have progressively become more diversified, the main incentives for attracting investment are still grounded in tax-related measures. Lowering corporate income tax is the most common tax incentive in the region, accounting for more than half the incentives offered between 2011 and 2021 (UNCTAD, 2022). This type of incentive may be based on earnings, providing tax breaks on profits, or on capital investment spending, providing reductions after the fact through deductions, accelerated depreciation schemes, tax credits or other mechanisms. Incentives based on capital investment have greater potential to promote reinvestment while enhancing integration with the local economy. However, this type of instrument remains uncommon in Latin America and the Caribbean, accounting for only one third of all new income tax-based incentives in the region between 2011 and 2022 (UNCTAD, 2022).
Although tax incentives can influence investment decisions to some degree, they are not enough to attract investment. Generally speaking, in addition to tax incentives, a set of diversified instruments is needed to de-risk investment. In terms of decisions to invest, it has proven essential to have infrastructure, productive capacity, a skilled workforce and a set of complementary activities along the value chain, among other elements, meaning that efforts to attract FDI must be coordinated with actions usually taken under productive development policies and agendas in order to address the
49 Foreign Direct Investment in Latin America and the Caribbean • 2023 Chapter I
4 This is even truer in light of studies that suggest that investment promotion agencies with strongly targeted strategies and working methods are those with the greatest influence on the investment decisions of multinational corporations when setting up in a given country (in this regard, see, for example, Volpe Martincus and others, 2021).
bottlenecks that limit both the attractiveness of investing and any possible returns. The implementation of special economic zones is an example of this. A study by Frick and Rodríguez-Pose (2023) on implementing these zones in Africa, Asia and Latin America shows that good industrial infrastructure, a strategic location and quality services made it easier to attract investment. However, the availability of instruments such as tax incentives and corporate income tax exemptions was not the most relevant factor for investors, although their importance might have been underestimated if they were taken for granted (Frick and Rodríguez-Pose, 2023). Although the authors do not explicitly say so, it can be deduced from the study that in order to attract FDI, it is important to use a strategic combination of instruments.
Despite the various advances in policies to attract investment, with their strengths and weaknesses depending on the context, FDI inflows to Latin America and the Caribbean continue to fluctuate, remaining uneven and alternating between periods of growth and deceleration. In general, market forces have nudged FDI towards the predominant sectors in the economies of the region, and instances of knowledge and technology transfer have been limited to certain, more dynamic sectors, with marked differences between countries and even between regions within countries. However, with some exceptions, the countries of the region have not succeeded in using FDI to bring about structural change and productive development. In the current regional context, marked by low growth and difficulties linked to the green transition and the creation of quality jobs, the challenge of attracting and retaining FDI that contributes to the region’s development remains as relevant as ever.
The progress made in establishing national and subnational investment promotion agencies stands out among the efforts of the governments of the region in that regard. More than 20 of the 33 countries of the region have national investment promotion agencies (Volpe Martincus and others, 2021). The proliferation of specialized agencies is a response to the challenge faced by recipient countries of reporting on their features and advantages so that foreign investors will consider them. This general aim usually encompasses three goals: showcasing the advantages of a given location, providing relevant information to potential investors, and facilitating the process by which foreign companies make decisions, set up operations in the country and possibly expand (ECLAC, 2007). The good practices of investment promotion agencies include a cycle comprising several stages: strategic vision, attraction, entry and establishment, retention and expansion, and linkages and spillovers.5
The agencies of the region are quite varied in terms of institutional form, size and dedicated resources. In general, however, they are autonomous public entities that are linked with ministries of trade, investment or industry. Being relatively recent additions to the institutional frameworks of the region and in light of the structural limitations proper to their context, it is not surprising that investment promotion agencies in the region have fewer resources than their peers in the countries of the Organisation for Economic Co-operation and Development (OECD). According to Volpe Martincus and others (2021), the median investment promotion agency in Latin America and the Caribbean has a total budget of US$ 4.2 million, around one third that of the median investment promotion agency in OECD. In addition, the median number of staff promoting investments in the region is 21, nearly half that of the investment promotion agencies in OECD. Given these limitations, it is even more important to address efficiency in policy design and implementation in order to attract investment.
As they pursue their objectives, the tasks of the investment promotion agencies of the region include disseminating information, facilitating and retaining investments, conversing with and supporting foreign investors, building up the image of the country and promoting policy (ECLAC, 2007; Volpe Martincus and others, 2021). As such, and although there is still room for improvement in that regard, these agencies can support the implementation of governments’ FDI priorities in terms of regions, functions, sectors, types of companies and specific projects (Gligo, 2007).
50 Economic Commission for Latin America and the Caribbean (ECLAC) Chapter I
5 According to the World Bank model. See Heilbron and Aranda-Larrey (2020).
Historically, FDI inflows to the region have gone to various sectors, from manufacturing and infrastructure to services and, to a greater degree, natural resources and agriculture, depending on the subregion being analysed. However, a brief quantitative analysis of policies to attract investment indicates a growing effort to target specific sectors. Data from the United Nations Conference on Trade and Development (UNCTAD)6 show that, between 2010 and 2021, most of the measures adopted in the region to attract foreign direct investment (58%) were aimed at specific sectors, while 42% were general, with no sectoral differentiation. When a particular sector was prioritized, it was usually energy (27 measures), followed by transport (14), mining (9), telecommunications (6) and agriculture (5). A look at the strategic priorities of investment promotion agencies in Latin America and the Caribbean in particular shows efforts in recent years to reorient the methods used to attract investment. In 2018, the highest-profile sectors were agriculture and agroindustry, tourism and hospitality, infrastructure and construction, and manufacturing. By 2022, although these sectors remained important, there had also been some changes. Natural resources, information and communications technology (ICT), and health and life sciences rose the most among agency priorities. In second place in terms of gains were renewable energy, the environment and logistics. Infrastructure and construction, the highest priorities in 2018 for investment promotion agencies, fell the most in 2022.
These new priorities could indicate a growing concern among the governments of the region to respond to global challenges and the opportunities of the digital and green transitions, which have gained prominence following the pandemic and the conflict in Ukraine. The priorities of investment promotion agencies and the main target sectors for mergers and acquisitions and investment project announcements (see sections I.B.4.1 and I.B.4.2) are now somewhat aligned: opportunities in information and communications, natural resources and renewable energies have been identified by both public and private agents.
The increase in the number of operations and announcements related to conventional energy sources, such as oil and gas, is a reflection of market logic. In this regard, one challenge to keep in mind is the need to create incentives so that inflows of foreign capital aimed at non-renewable energies consider the energy transition objectives of countries and the region, in particular with regard to incentives for clean and renewable energy production and for the funds originating from oil and natural gas exploration and production to be used for the sustainable development of other sectors of the economy (FDI in non-renewable energy and the main challenges for the region are analysed in greater detail in chapter II).
As analysed in chapter III, the fact that renewable energy has become a priority for investment promotion agencies and investors reflects the strategic priorities of countries, the abundant natural resources of the region, and the growing demand for clean energy, in a context that is also marked by international environmental commitments. In particular, achieving the Sustainable Development Goals of the 2030 Agenda demands an accelerated transformation of the energy mix, which can only be realized by stepping up investment in renewable energy. To achieve this, the countries of the region are applying deliberate policies to attract investment, using a range of instruments: tax and financial incentives (some general and others specific to renewable energies), regulatory measures, and increasingly other market-related tools, such as green bonds and alternative sustainability certifications, as a way to complement and create synergies with policies to attract investment in renewable energies, while at the same time seeking to overcome fiscal constraints (Podestá and others, 2022). In fact, successful examples of attracting investment in renewable energy, as in Chile and Uruguay, in particular in promoting solar and wind power, show that although economic instruments are important, they are not enough. Long-term policies, programmes for research and development and innovation, and certain regulations are highly complementary and efficient, and should be considered (see chapter III for more details).
51 Foreign Direct Investment in Latin America and the Caribbean • 2023 Chapter I
6 The study by UNCTAD (2022) includes 166 policies implemented by countries in the region between 2010 and 2021.
The example of renewable energies illustrates the potential of FDI to make a major contribution to both sustainable and productive development. However, for that potential to be realized, certain challenges must be addressed. In terms of productive development, international literature and experience suggest certain points worthy of attention that could inspire the governments of Latin America and the Caribbean in their efforts to improve the design of policies to attract investment and strengthen institutional capacity. These points are:
• Promote active, comprehensive and long-term policies. The most successful countries adopt more active and comprehensive policies, meaning deliberate measures to attract quality investment that are consistent with national development needs and priorities (ECLAC, 2007). This presupposes a shared vision of the future of a country’s development and the role of FDI, which can lay the groundwork for guiding investment attraction policies (public, private, domestic and foreign) and coordinating those policies with other components of development policy (such as the macroeconomic, productive development, environmental and social aspects). In addition, defining long-term strategic objectives is key for the predictability and stability that investors seek when mobilizing resources and choosing where to place their assets.
• Create an enabling environment for productive FDI and focus on strategic sectors. Broadly speaking, FDI flows depend on a series of sector-specific macroeconomic and policy factors. Indeed, human capital, local financial market development, private sector strength and development, competition, and the availability and quality of general and specific infrastructure, among other factors, are key for enabling FDI to make a positive impact on productivity and economic growth. Countries have a variety of measures at their disposal to influence these factors, as well as to encourage (or discourage) investment, and as mentioned, they have mainly been used to select strategic sectors. By doing so, governments seek to leverage positive externalities in terms of knowledge generation, employment, productive linkages, technology transfer and high social and environmental performance, while at the same time mitigating risks. There is no doubt that targeting is important and must be tailored to the priorities of each context. However, it should be borne in mind that, on their own, policies to attract FDI are not sufficient to improve the results of FDI as a means for transferring knowledge and technology to recipient countries, and must be complemented by policies to strengthen local capacity to absorb investment (education, institutional frameworks, and the development of physical, scientific and technological infrastructure). It is therefore key to create a framework for efforts to attract FDI through the productive development policies7 of countries and their territories. Along those lines, it could be useful to align efforts to attract FDI with the work on cluster initiatives being undertaken in many countries in the region, in particular to attract investment to complement or strengthen missing or weak links in local value chains (Llinás Vargas, 2021).
• Leverage incentives, evaluation and adaptation to promote sustainable development. For some years now, there has been greater recognition of the role of FDI as a way to support the achievement of the Sustainable Development Goals (SDGs) rather than as an end unto itself (ECLAC, 2023; UNCTAD, 2015; OECD, 2022b). At the institutions working to attract FDI, this is reflected in a stronger focus on the design of policy instruments and on appropriately linking and coordinating them. In the energy sector, specifically, this means developing an integrated strategy for the entire energy mix and reconciling the investment attraction mechanisms geared towards transforming the conventional energy industry so that more environmentally friendly standards are adopted, with incentives aimed at progressively increasing the share of non-conventional renewable energies. It is also key to continuously assess and monitor the measures implemented
52 Economic Commission for Latin America and the Caribbean (ECLAC) Chapter I
7 Productive development policies, also known in the literature as industrial policies, include the set of instruments (incentives, regulations and other forms of participation) through which States promote the development of certain activities or economic agents in accordance with national development priorities.
and the economic, social and environmental effects of investment on sustainable development. By using these tools, agencies can analyse their efforts and adjust them to enhance their impact based on pre-established goals and priorities.
• Deepen the focus on the multiple levels of investment mobilization and stakeholder coordination. Placing productive and sustainable development at the centre of policies to attract FDI requires attention to the global, regional, national and subnational dynamics that affect capital flows. The success of policies and institutions in attracting investment depends on a whole-of-government approach that ensures coordinated, consistent and flexible efforts between different areas and ministries and at different levels of public administration. At the subnational level, local investment promotion agencies can contribute to attracting FDI and creating jobs in less developed regions. This enables them to respond to development challenges that are more geographically localized, especially in larger and very heterogeneous countries. Against this backdrop, ensuring the long-term sustainability of institutions remains a challenge. Lastly, it is equally important to promote coordination between the public and private sectors and between national and subnational governments. In particular, improving coordination between national and local investment promotion agencies in attracting FDI will be key.
In the current global context, which is characterized by a growing and renewed interest in productive development policies, many countries are analysing investment attraction and promotion strategies in light of needs related to the energy transition, human capital and the development of productive capacities and value chains. As an example, COVID-19 recovery packages in the United States and the European Union combine programmes and instruments to direct investment —national and international— towards activities that promote the green transition and the development of local technology and capacities. Among the most common instruments are sectoral and technological incentives, initiatives to localize productive activities related to new technologies and evaluation mechanisms for investments that are considered strategic.
Similarly, for developing countries, which generally have lower capacity and less mature markets, it is essential for FDI to be framed by productive development strategies in order to generate synergies and avoid conflicting incentives. In general, by defining priorities and subsidy and incentive schemes, productive development policies play a critical role in directing investment towards specific sectors, technologies and activities. At the same time, investment policies —tailored to the needs of each country— can provide incentives and regulatory instruments for developing specific industries and sectors, integrating national industries into global and regional value chains, attracting cutting-edge technologies, transferring technology and knowledge and strengthening existing capacity.
In this context, there is an urgent need in the countries of Latin America and the Caribbean for productive development strategies for the recovery and the green transition that use FDI as a strategic tool to develop capacity and technological sophistication, fine-tuning instruments in keeping with the development needs of each country and maximizing the benefits of FDI for sustainable development.
E. Conclusions
The global FDI panorama was uneven in 2022. The main recipient of investments, the United States, received less FDI than in 2021, while China, Latin America and the Caribbean, Singapore, Australia, India and some countries in the European Union recorded significant investment growth. Multiple successive crises around the world, inflation, and high interest rates weighed on cross-border investments. However, elevated commodity prices and the search for investment in energy —whether to secure supply or advance towards the energy transition— and in technologically strategic sectors, such as semiconductors and electronic components, spurred companies to seek investments abroad.
53 Foreign Direct Investment in Latin America and the Caribbean • 2023 Chapter I
In this scenario, Latin America and the Caribbean saw inflows of US$ 224.579 billion in 2022, an all-time high. The marked growth in FDI inflows to Brazil, the top recipient country in the region and fifth worldwide in 2022, had the greatest impact on this increase, although FDI inflows were also up in nearly all the countries of South America, Mexico, several countries in Central America and the main recipient countries in the Caribbean.
From the perspective of investment components, recovery in the region was characterized by strong year-over-year growth in reinvested earnings and intercompany loans, while growth in equity was more subdued (despite which it remained the second largest component). From the point of view of productive development, inflows of investment through equity may be a better reflection of growing interest from new companies in setting up operations in the region, since both reinvested earnings and loans between subsidiaries and parent companies reflect established trends for companies in the region. In this sense, the recovery in 2022 was driven mainly by the activity of multinational corporations that are well-established in the countries of Latin America and the Caribbean and have decided to expand operations. This pattern makes sense when taking into consideration the post-pandemic recovery, and it is unclear whether it will continue in 2023.
In terms of sectors, the bulk of inflows over the past three years was concentrated in services, and 2022 was no exception. Investments were highest in financial services, electricity, gas and water, information and communications, and transport-related services. Investment in manufactures grew strongly in the countries and sectors that have built up capacity over the years, a process supported and driven at times by public policies, maintaining multinationals’ interest in investing in those areas. There was renewed interest in 2022 in investing in natural resource exploitation in the region, which has been linked to a significant degree with the growing interest in the energy sector. Not only is this interest reflected in stronger FDI inflows, which grew after a two-year decline in the context of a downtrend, it has also affected the outlook for new investments.
Both globally and in the region, the energy sector played a key role in FDI project announcements. Renewable energies ranked first at the global level in the number of announcements, accounting for 29% of the total by value, and third in announcements at the regional level, with 11% of the value, while the coal, oil and gas sector was in second place globally by number of announcements, accounting for 9% of the value, and in first place at the regional level, with 24% of the value.
These investments are consistent not only with higher energy demand, against a backdrop of economic activity recovery following the critical phase of the COVID-19 pandemic, but also with meeting the demand of the 700 million people who lack access to modern sources of energy, in line with Sustainable Development Goal 7.8
Although the level of investment in general and of FDI in particular remains insufficient to enable a reliable and affordable energy transition and meet global and regional energy and climate goals, the global appetite for renewable energies is influencing foreign investors’ interest in other sectors in the region. Of the 20 largest mergers and acquisitions recorded in Latin America and the Caribbean in 2022, 4 were related to the mining of copper and lithium, metals that are essential in the renewable energy value chain and, as a consequence, in enabling the energy transition. Given the importance of the energy sector, chapters II and III of this report contain an analysis of FDI trends in the non-renewable and renewable energy sectors, respectively, in the context of the energy transition.
Lastly, the challenge of attracting and retaining FDI that contributes to sustainable and inclusive development in the region remains as relevant as ever, and countries must make efforts to enact the right kind of policies if they wish to attract and retain FDI that supports their development process and allows for the realization of the potential of FDI to build capacities, create quality jobs, transfer technology and enhance the diversification and sophistication of the production mix. As proposed in
8 Ensure access to affordable, reliable, sustainable and modern energy for all.
54 Economic Commission for Latin America and the Caribbean (ECLAC) Chapter I
section I.D, the countries of the region must improve policy design in order to attract investment and strengthen the relevant institutional capacity, and it will be key to boost the coordination of efforts to attract FDI with productive development strategies and to begin using FDI more deliberately as a strategic tool to further sustainable development processes.
F. Analysis of FDI inflows by country
This section presents a brief analysis of the year-on-year investment trends for the countries for which 2022 data are available, based on the components of FDI, the sectors receiving investment and the countries of origin, while highlighting some of the major milestones for each country that have not yet been mentioned in other sections of the document. Specific quantitative information for each country is available in the annex.
1. Brazil
In 2022, the value of investments received in Brazil compared to 2021 almost doubled (a 97% increase), with FDI inflows of US$ 91.502 billion,9 following two years when figures were well below the historical average. This renewed interest of foreign capital investors in the country was reflected in all three FDI components, which grew compared to the previous year: equity remained the primary component (40% of the total, up by 22% relative to 2021 in terms of value), followed by reinvested earnings (37% of the total, up by 100% compared to 2021) and lastly intercompany loans (23%), which recorded the strongest growth after registering negative figures in 2021.
Unlike in 2021, when only FDI in services increased, in 2022, all major sectors of activity received more investment.10 In line with the historical trend, multinational companies focused on services, which received 50% of FDI (32% higher than the amount recorded in 2021), followed by manufactures (34%) and natural resources (15%). While manufacture inflows were nearly triple the amount invested in 2021 (up by 157%), these inflows have not yet returned to pre-pandemic levels. Natural resource inflows rebounded after recording negative inflows in 2021, but are still below the average of the past decade.
Notwithstanding the above, one noteworthy element in 2022 was the importance of investments in hydrocarbons, in both natural resources and manufactures. Oil and gas extraction (13% of total FDI), together with refining of coke, petroleum products and biofuels (16%), accounted for 29% of total FDI inflows. These were followed by non-financial holding companies and financial services (both representing 8% of the total), the automotive industry (7%), electricity and gas services (7%), ICT services (4%), trade (4%), the chemicals industry (3%) and mining support services (2%). These 10 sectors accounted for 73% of total inflows in 2022 and trade was the only activity in which foreign capital inflows decreased compared to 2021. Notably, inflows related to ICT services exceeded US$ 2 billion in 2022 and 2021, compared to annual investments of roughly US$ 700 million in the past decade.
The growing interest in the Brazilian ICT market is reflected in the third largest merger and acquisition of assets in the region (see table I.3), which does not constitute an FDI inflow into the country as the transaction involved two foreign companies. Just Eat Takeway, based in the Kingdom of the Netherlands, sold its remaining minority stake in Brazil-based iFood to Prosus, also based in the
9 These figures correspond to those compiled according to Balance of Payments and International Investment Position Manual: Sixth Edition (BPM6), Washington, D.C., 2009, and differ from the results based on the figures compiled in IMF, Balance of Payments and International Investment Position Manual: Fifth Edition (BPM5), 1993.
10 The sectoral composition corresponds to equity and intercompany loans, since the data by sector reported by Brazil do not include reinvested earnings.
55 Foreign Direct Investment in Latin America and the Caribbean • 2023 Chapter I
Kingdom of the Netherlands, for US$ 1.5 billion. iFood, the market leader in Brazil, had already been receiving financial support since 2013 from Prosus, which was betting on the growth potential of the Brazilian market, which only intensified during the COVID-19 pandemic (Reuters, 2022; The Sunday Times, 2021).
The two countries that accounted for most of the FDI in Brazil were the Kingdom of the Netherlands, representing 25% of the total and reflecting a recovery from the negative figure for 2021, and the United States, accounting for 24% of the total and a 15% increase compared to 2021. Other notable investors that invested more heavily in 2022 compared to the previous year were France, which accounted for 8% of the total and injected the largest amount since 2010, Spain (6% of the total), Chile (5%), Hong Kong, China (5%) and the United Kingdom (4%).
One point to consider when analysing figures on the origin of investment is that national accounts reflect the immediate origin of capital, not the ultimate controller. As previously mentioned, investments from the Kingdom of the Netherlands do not necessarily reflect the activity of companies from that country, but rather the fact that its financial market makes it favourable for cross-border investments by companies based in other countries. According to estimates by the Central Bank of Brazil, the stock of investment of the Kingdom of the Netherlands in Brazil by immediate origin of capital is US$ 125.9 billion as of 2021, while the stock as ultimate controller of capital is substantially lower and amounts to US$ 19 billion. The reverse is true in the case of China, which plays a smaller role as an immediate origin of capital, but, as the ultimate controller, the stock of Chinese capital in Brazil is estimated at US$ 29.9 billion as of 2021 (Central Bank of Brazil, 2023). Considering the ultimate controller of capital, the United States has the largest position in Brazil (US$ 191.6 billion), followed by Spain (US$ 47.9 billion) and France (US$ 37.9 billion).
2. Mexico
In 2022, FDI inflows to Mexico increased for the third consecutive year and US$ 38.932 billion was received, 16% more than in 2021.11 The main components of this investment were equity and reinvested earnings, which accounted for 46% and 42% of the total, respectively, both up from the previous year (by 31% and 28%, respectively). Income from intercompany loans accounted for a smaller share (12%), and even less capital was received than in the previous year for this item (-33%).
Since 2017, services have overtaken manufactures as the top target of FDI and this situation continued in 2022. Services accounted for 56% of total inflows, the highest share since 2010, and received more investment than in 2021 (an increase of 47%).12 Manufacturing inflows recorded a smaller increase (9%) and accounted for 38% of the total. Investments in natural resources, meanwhile, trended downward (-59%), although this is due mainly to the fact that the value of 2021 was a record high, and the total received in 2022 is in line with the average investments received by the sector in the past decade.
In 2022, investments in the film and video industry (15% of the total, compared to only 0.2% between 2010 and 2021) and air transport (6% of the total, compared to 0.3% between 2010 and 2021) were particularly noteworthy. Investment figures for the film industry are explained by the merger between Grupo Televisa of Mexico and Univision of the United States, while those relating to air transport are due to restructuring at Aeromexico. Beyond these one-off events, investments in financial and insurance services (13% of the total) and in transport equipment manufacturing (12% of the total)
11 These figures correspond to those compiled according to Balance of Payments and International Investment Position Manual: Sixth Edition (BPM6), Washington, D.C., 2009, and differ from the results based on the figures compiled in IMF, Balance of Payments and International Investment Position Manual: Fifth Edition (BPM5), 1993.
12 Mexico presents information on FDI inflows by sector and origin according to IMF, Balance of Payments and International Investment Position Manual: Fifth Edition (BPM5), 1993.
56 Economic Commission for Latin America and the Caribbean (ECLAC) Chapter I
have stood out, reflecting the importance of the automotive industry for attracting investment in Mexico, although in both cases less investment was received than in 2021 (5% and 21% less, respectively). In this regard, the announcement of the US$ 5 billion investment project by electric vehicle manufacturer Tesla, which plans to build a factory in the State of Monterrey, further highlights the potential of the automotive industry to attract investment to Mexico. Other notable activities were related to basic metals (6%), mining (5%), transport-related services (4%), civil engineering construction (4%), the food industry (4%), and short-term accommodation and food and beverage preparation services (4%). Together, these 10 service and manufacturing activities accounted for 74% of total inflows in the country, with most of them seeing an increase in inflows compared to 2021 (except for mining and restaurants and hotels).
The United States was the main source of FDI in Mexico in 2022 (57% of the total) and more investment was received than in 2021 from that country (an increase of 54%). Other major investors that also increased investment in Mexico were Canada and Argentina, which accounted for 10% and 6% of investment, respectively. By contrast, lower investments were received from Spain (-64%), which went from being the second largest investor in previous years to the sixth largest in 2022, with 4% of investments.
3. Other South American countries
Chile received the third largest amount of FDI in 2022, US$ 20.865 billion, which was 31% higher than inflows in 2021 and the biggest amount received in the last seven years. Reinvested earnings were the largest component (52% of the total), reflecting a 138% increase. Equity income declined (by 19%) and accounted for 42% of the total, while intercompany loans also grew, but accounted for a small share (6%).
To date, there is no information available on the sectors or origin of FDI inflows in 2022, so it is not possible to identify where these resources were directed to or which country they came from.
In terms of mergers and acquisitions, as mentioned above, foreign interest in Chilean assets in the mining and natural resource extraction sectors is noteworthy. In recent years, foreign investors have also been interested in sectors related to renewable energies in the country, and 2022 was no different. One example is the acquisition by Canada-based Innergex of the Chilean operations of the global sustainable infrastructure investment group Aela Energy, owned by Actis (60%) and Mainstream Renewable Power (40%), for US$ 691 million. Aela Energy has grown to become the largest independent power producer in Chile (Mainstream Renewable Power, 2022).
In 2022, Colombia received US$ 16.869 billion in FDI, up 76.4% from 2021, which was the highest value in the last 20 years. All components recorded an increase, with equity showing the strongest growth (139%) and accounting for the largest share of the total (46%). Reinvested earnings also grew (by 68%) to 38% of the total, while intercompany loans accounted for 16% of FDI.
This growth was explained mainly by higher inflows in services and natural resources, while manufacturing inflows decreased. FDI in services accounted for 65% of the total, with an increase of 71% compared to 2021. A positive trend was also recorded in natural resources (up by 228%), which accounted for 28% of inflows. By contrast, investments in manufactures decreased (by 28%) and fell to 7% of total FDI, compared to 14% over the 2010–2021 period, on average.
There was no change in major FDI source countries in 2022. Investments from the United States (29% of the total), Spain (16%) and Panama (12%) accounted for 57% of FDI inflows to Colombia, and in all cases, inflows were higher than in 2021. Interestingly, China was among the top investors for the first time, with that country placing eleventh and accounting for 2% of the total (compared to 0.2% between 2010 and 2021).
57 Foreign Direct Investment in Latin America and the Caribbean • 2023 Chapter I
FDI inflows in Argentina more than doubled (123.2%) compared to 2021, totalling US$ 15.408 billion, the highest level seen since 2012. Intercompany loans accounted for the largest share of FDI (57%), followed by reinvested earnings (37%), with both components recording increases compared to 2021. As a result, equity accounted for only a small share (5%) and the amount received was slightly lower than in 2021 (down by 3%).
Argentina does not provide information on FDI by sector or origin, so it is not possible to identify the target or origin of these resources. However, when analysing the mergers and acquisitions registered in the country in 2022, along with the investment projects announced the same year, foreign investors’ interest in the lithium extraction and exploration sector is clear, as detailed in previous sections. There are also major investment projects targeting hydrocarbons in Argentina, and these are concentrated in the Vaca Muerta unconventional oil and gas formation.
Another significant operation in Argentina was the purchase by the United States-based SoFi Technologies Inc, a technology platform for financial services and products, of 100% of the shares of the Argentine technofinance company Technisys SA, a provider of cloud-based banking platforms, whose shares are listed on NASDAQ. The deal, valued at US$ 1.1 billion, was considered the largest bank acquisition of an IT company since 2012 (AméricaEconomía, 2022b; S&P, 2022).
FDI inflows to Peru totalled US$ 10.848 billion, 46% more than in 2021. FDI in the country had not exceeded US$ 10 billion since 2012. All components recorded an increase in investment, but the lion’s share of inflows corresponded to reinvested earnings (79% of the total), which were 23% higher than in 2021. The second largest component was equity (11% of the total), which recovered after registering negative inflows in 2021, while inflows corresponding to intercompany loans increased, but accounted for a smaller share of the total (10%).
The country does not provide information on FDI by sector or origin, so it is not possible to identify the target or origin of these resources.
In terms of new projects, the largest was that announced by the Spanish company Acciona Energía, which will invest close to US$ 180 million to build its first wind farm in the country.
Uruguay received record investments of US$ 9.325 billion in 2022, almost triple that of 2021 (an increase of 155%). As in Argentina, intercompany loans accounted for most of the FDI in Uruguay (52%), reflecting a strong recovery after registering negative figures in 2021. Reinvested earnings were the second largest component of FDI inflows (37%), followed by equity (11%). Inflows in all three components grew compared to 2021.
To date, there is no information available on the sector or origin of FDI inflows in 2022, so it is not possible to identify the target or origin of these resources. However, on the basis of announced investment projects, renewable energies accounted for a significant share of FDI in the country. In 2022, Germany-based Enertrag announced a US$ 628 million project, the first green hydrogen exploitation project in the country, which would involve the conversion of green hydrogen into ethanol through wind and solar plants, an electrolyzer and conversion facilities (Uruguay XXI, 2022). In Ecuador, FDI inflows increased compared to 2021 (by 28.1%) to US$ 829 million. This total includes higher FDI inflows of equity.
The growth was explained by bigger investments in services (163%), which received US$ 888 million. Negative inflows in natural resources (-US$ 137 million) explained the total figure received, while investments in manufacturing declined relative to 2021 (81%).
The main source of FDI was Uruguay, which accounted for US$ 722 million. By contrast, inflows from Canada were negative (-US$ 347 million dollars). Investment from other countries (the main ones were China, Spain, Mexico and the United States), did not exceed US$ 60 million.
58 Economic Commission for Latin America and the Caribbean (ECLAC) Chapter I
FDI in Paraguay was higher than in 2021 (129%) and totalled US$ 474 million. Most of the inflows corresponded to reinvested earnings (64% of the total), which were 61% higher than in 2021. These were followed by equity (33% of the total), which fell by 31% compared to the previous year. Intercompany loans rebounded after falling sharply in 2021, but accounted for just 3% of total FDI received by the country in 2022.
To date, there is no information available on the sector or origin of FDI inflows in 2022, so it is not possible to identify the target or origin of these resources.
In the Plurinational State of Bolivia, negative FDI inflows were recorded in 2022 (-US$ 26 million), which was a significant decrease compared to the inflows received in 2021 (105%). This trend was explained by divestments in hydrocarbons (US$ 307 million), and to a lesser extent in manufactures (US$ 12 million). Investment trends were positive for other economic activities, mainly mining (US$ 158 million) and financial intermediation (US$ 73 million) (Central Bank of Bolivia, 2023).
4. Central America
With FDI inflows of US$ 3.673 billion in 2021, Costa Rica was the leading FDI recipient in Central America. This figure is higher than the amount received in 2021 (2.2% variation) and in line with the highest amounts received by the country. Reinvested earnings accounted for the largest share of FDI (71% of the total) and grew by 30%. Equity (18% of the total) and intercompany loans (12% of the total) fell by 28% and 39%, respectively.
The majority of investments targeted manufactures (68% of the total), although flows were weaker than the level received in 2021 (down by 15%), while investments in services were stronger than in the previous year (12%) and represented 33% of the total.13
Investments are highly concentrated by origin. The United States accounted for 73% of the total, although flows from that country declined (by 12%), while investment from Switzerland increased, accounting for 9% of the total. Other notable sources of investment were Colombia (3%), Mexico (2%), Spain (1%) and Germany (1%).
In 2022, Panama was the second largest recipient of FDI in Central America, with US$2.513 billion, up 43% from 2021. While this recovery is significant, FDI inflows remain below pre-pandemic levels. Reinvested earnings and intercompany loans were the main components of FDI, both of which grew relative to 2021, while equity inflows were negative. As there is no information available on FDI by sector or origin for 2022, it is not possible to determine where FDI inflows were directed or where they originated.
In terms of future prospects, there was a significant change in 2022 compared to 2021. Large-scale projects were announced in the renewable energy and transport and storage sectors, totalling some US$ 4.3 billion. In addition to the bioenergy production megaproject mentioned above (see section I.B.4.b), Switzerland-based Mediterranean Shipping Company (MSC) announced a project to build a container terminal in Panama, with an estimated investment of US$ 1.4 billion.
In 2022, FDI inflows to Guatemala totalled US$ 1.352 billion, lower than the previous year (down by 61%). While 2021 was a record year owing to a large telecoms acquisition, the value of inflows in 2022 is still higher than the levels seen between 2015 and 2020. Reinvested earnings accounted for the lion’s share of FDI in 2022 (84% of the total), but decreased by 7% compared to the previous year. Meanwhile, the second largest component, intercompany loans (which accounted for 12% of
59 Foreign Direct Investment in Latin America and the Caribbean • 2023 Chapter I
13 Information by sector and origin is presented according to IMF, Balance of Payments and International Investment Position Manual: Fifth Edition (BPM5), 1993.
the total), grew by 390%. Equity inflows decreased by 98% compared to the record inflows seen in 2021, meaning these once again represented the smallest share of FDI inflows into the country (accounting for just 4%).
Most investments were directed towards services (77% of the total), despite the fact that they decreased (by 67%). Investments in manufactures were also lower (down by 45%), representing 12% of the total, while investments in natural resources increased (354%), representing 7% of the total.
Inflows originated mainly from five countries, which accounted for 79% of the total: the United States (19%), Colombia (19%), Luxembourg (16%), Mexico (14%) and Panama (10%). Of these, only the United States and Mexico increased investments in 2022.
Nicaragua received US$ 1.294 billion in FDI in 2022, 6% more than the previous year. The growth was due to a 54% increase in inflows corresponding to reinvested earnings (73% of the total). The other components, equity (24% of the total) and intercompany loans (3%), fell by 14% and 84%, respectively, compared to the FDI inflows recorded in 2021.
The country does not provide information on FDI by sector or origin, so it is not possible to identify the target or origin of these resources.
FDI in Honduras in 2022 totalled US$ 1.082 billion, 35% higher than in the previous year. Most of the FDI corresponded to reinvested earnings (75% of the total), although investments in this component were lower than in 2021 (down by 32%). Meanwhile, inflows from intercompany loans and equity increased, although the share of equity was very small (1% of the total).
Services accounted for the majority of investments (91%), followed by natural resources, which also reflected a positive trend. By contrast, manufacturing recorded negative inflows, although the amount was small (-US$ 24 million).14
Three countries accounted for 71% of FDI in 2022: Panama (29%), the United States (23%) and Colombia (19%), and only Colombia reflected a reduction in investment compared to the previous year.
El Salvador recorded negative FDI inflows in 2022 (- US$ 101 million), representing a variation of -133% compared to 2021. This situation is explained by divestment in the manufacturing sector (-US$ 294 million), which was not offset by investment in services, which also declined compared to 2021 (-35%).
The decrease in investment from Spain and Panama largely explains the performance in 2022, with negative inflows (-US$ 321 million from Spain and -US$ 32 million from Panama). Mexico accounted for the largest investment, followed by the United States, Honduras and Switzerland, with smaller amounts.
One acquisition involving countries in the subregion was the sale of Mexico-based cement company CEMEX’s assets in Costa Rica and El Salvador to Cementos Progreso Holdings of Guatemala. The transaction, which was intended to optimize the global portfolio of CEMEX, was valued at US$ 329 million (CEMEX, 2021; Forbes Mexico, 2022).
5. The Caribbean
Once again, in the Caribbean, Guyana recorded the highest FDI inflows, which totalled US$ 4.389 billion in 2022. The result is similar to the record inflows in 2021 (only a -1.5% change). The performance is due, once again, to foreign investors’ interest in the country’s hydrocarbon sector. Hence, the natural resources sector accounted for 99% of FDI inflows into the country in 2022, although inflows into the sector were 2% lower than in 2021. Manufactures (which represent 1% of the total) also recorded a drop, of 9%.
60 Economic Commission for Latin America and the Caribbean (ECLAC) Chapter I
14 Information by sector and origin is presented according to IMF, Balance of Payments and International Investment Position Manual: Fifth Edition (BPM5), 1993.
The project announcements registered in 2022 indicate that the country’s hydrocarbon sector will continue to receive large investments in the coming years. In this connection, the United States-based oil company ExxonMobil announced a US$ 10 billion investment project in the country.
The Dominican Republic received US$ 4.01 billion in FDI, 25% higher than in 2021 and the highest level in the last 30 years. An examination of FDI components shows that the result was due to a 39% increase in equity, which accounted for 56% of total inflows. Meanwhile, reinvested earnings (36% of the total) fell by 14% compared to the previous year. Intercompany loans were the smallest component (8% of the total), although they recorded a significant increase compared to the negative result obtained in 2021.
With regard to sectors, the 29% growth in services was notable, and derived from record inflows in 2022, totalling US$ 3.034 billion and representing 76% of total FDI inflows into the country. The sector is expected to continue its upward trajectory in the coming years, given the momentum in some segments. Through a green loan from the Bank of America and multilateral banks, Consorcio Energético Punta Cana-Macao (CEPM), part of the InterEnergy group, announced that it plans to invest US$ 1 billion to increase its renewable energy generation capacity in the Dominican Republic. The announcement, made at the twenty-seventh session of the Conference of the Parties to the United Nations Framework Convention on Climate Change (COP 27), held in Egypt in 2022, is in line with the company’s “net zero” strategy and would make CEPM one of the world’s first zero-emission, 100% renewable electric utilities, contributing to ambitions related to sustainable tourism in the Dominican Republic (Bank of America, 2022; Revista Mercado, 2022).
The second most representative sector was manufacturing, which accounted for 15% of the total and received 95% more inflows in 2022 than the previous year. By contrast, inflows into the natural resources sector (representing 9% of the total) dropped by 30% compared to 2021.
The United States remains the largest foreign investor in the Dominican Republic, accounting for 38% of total inflows in 2022. In addition, FDI inflows originating in that country grew by 8% over the previous year. With respect to inflows from other countries, the 63% growth in capital from Spain is notable, representing 9% of the total invested in the Dominican Republic in 2022, behind only Mexico (accounting for 10% of the total and representing 1% growth in the year analysed) and Canada (also with 9%, representing a 4% decrease).
The Bahamas was the third largest recipient of FDI in the Caribbean, with a total of US$ 1.255 billion in 2022, up 19% from 2021. This was mainly driven by intercompany loans, which increased by 25%.
Jamaica received the fourth largest amount of FDI in the Caribbean, with a total of US$ 319 in 2022. This figure was similar to the amount received in 2021 (-0.2%) and investment has still not returned to pre-pandemic levels. Tourism attracted the most investment in the country (51% of the total amount), and as a result, services accounted for the bulk of FDI inflows (59% of the total), reflecting a 15% increase compared to 2021.
FDI inflows to Belize in 2022 totalled U$ 134 million, the highest level since 2014 and 6% higher than in 2021. This increase was due mainly to equity, for which inflows accounted for 88% of FDI received by Belize in 2022 and recorded 319% growth compared to the previous year. Reinvested earnings grew by 18% and represented 12% of the total, while intercompany loans were not representative. In 2022, the Organization of Eastern Caribbean States (OECS), comprising Antigua and Barbuda, Dominica, Grenada, Saint Lucia, Saint Kitts and Nevis, and Saint Vincent and the Grenadines, failed to sustain the recovery in FDI inflows seen in 2021. Overall, the countries received US$ 553 million, 20% less than the previous year. Investment was weaker in all countries except Grenada.
FDI in Antigua and Barbuda totalled US$ 196 million in 2022, lower than the previous year (-20%), but in line with the levels received in the years prior to the pandemic. Investment inflows into Grenada continued to recover following the decline in 2020, and totalled US$ 160 million, up by 14%
61 Foreign Direct Investment in Latin America and the Caribbean • 2023 Chapter I
compared to 2021. After recovering sharply in 2021, FDI in Saint Vincent and the Grenadines totalled US$ 86 million in 2022, down 46% from the previous year. Investments in Saint Lucia also decreased (by 22%), totalling US$ 67 million in 2022. FDI inflows to Dominica amounted to US$ 28 million in 2022, down 16% from the previous year. In 2022, Saint Kitts and Nevis was unable to sustain the recovery in investment in the aftermath of the pandemic and received US$ 16 million in FDI, down 41% from 2021.
FDI inflows to Suriname remained negative in 2022 (- US$ 5 million). However, the variation was positive compared to 2021 (96%), when this figure had been higher.
Lastly, Trinidad and Tobago recorded negative FDI inflows (-US$ 914 million) in 2022. An analysis of the components of FDI shows that the most significant disinvestments were due to the repayment of intercompany loans. The origins of these disinvestments were mostly from the United Kingdom (negative inflows of US$ 2.232 billion), as well as from Canada, Barbados, the Kingdom of the Netherlands and Saint Lucia. Meanwhile, investments from the United States amounted to US$ 1.337 billion.
Bibliography
Actis (2022), “Actis Exits Brazil’s Largest Independent Renewables Platform, Echoenergia”, 4 Abril [online]
https://www.act.is/2022/04/04/actis-exits-brazils-largest-independent-renewables-platform-echoenergia/.
AméricaEconomía (2022a), “Argo Energia y Grupo Energía Bogotá adquieren cinco líneas de transmisión a Brookfield por US$ 835 M”, August [online] http://www.americaeconomia.com/argo-energia-y-grupoenergia-bogota-adquieren-cinco-lineas-de-transmision-brookfield-por-us-835-m. (2022b), “Technisys se transforma en un nuevo unicornio argentino y es adquirida por SoFi por US$ 1.100M”, 24 February [online] http://www.americaeconomia.com/negocios-industrias/multilatinas/technisys-setransforma-en-un-nuevo-unicornio-argentino-y-es.
Arauco Brasil (2022), “ARAUCO Assina Termo de Acordo Com Governo Do MS Para Plano de Investir US$ 3 Bilhões em Fábrica de Celulose No Brasil”, 22 June [online] https://www.arauco.cl/brasil/arauco-assina-termode-acordo-com-governo-do-ms-para-plano-de-investir-us-3-bilhoes-em-fabrica-de-celulose-no-brasil/.
Baffes, J. and W. Chian Koh (2023), “Fertilizer Prices Ease but Affordability and Availability Issues Linger”, 5 January [online] https://blogs.worldbank.org/opendata/fertilizer-prices-ease-affordability-and-availability-issues-linger. Bank of America (2022), “Consorcio Energetico Punta Cana Macao (CEPM), an InterEnergy Company, to Secure a Green Loan from Bank of America and a Multilateral Development Bank to Advance Its Ambition to Achieve Net Zero by 2030”, 7 November [online] https://newsroom.bankofamerica.com/content/newsroom/pressreleases/2022/11/consorcio-energetico-punta-cana-macao--cepm---an-interenergy-com.html.
BHP (2022), “Fusión de Petróleo de BHP Con Woodside” [online] https://www.bhp.com/es/about/our-businesses/ woodside-bhp-merger.
Bloomberg Línea (2023), “Tesla iniciará construcción de Gigafactory en Nuevo León en marzo con US$6.000 millones”, 2 March [online] https://www.bloomberglinea.com/2023/03/02/tesla-iniciara-construccion-de-gigafactoryen-nuevo-leon-en-marzo-con-us6000-millones/.
CEMEX (2021), “CEMEX to Divest Its Operations in Costa Rica and El Salvador”, 29 December [online] https:// www.cemex.com/w/cemex-to-divest-its-operations-in-costa-rica-and-el-salvador.
Central Bank of Bolivia (2023), Avance de cifras 2022. Balanza de Pagos y Posición de Inversión Internacional [online] https://www.bcb.gob.bo/webdocs/publicacionesbcb/2023/04/55/Avance%20BoP%202022.pdf.
Central Bank of Brazil (2023), Relatório de Investimento Direto 2022 [online] https://www.bcb.gov.br/ publicacoes/relatorioid.
CEPALSTAT (2021), “Statistics and Indicators. Economic” [online] https://statistics.cepal.org/portal/cepalstat/ dashboard.html?theme=2&lang=en.
Digicel Pacific (2022), “Telstra Acquires Digicel Pacific”, 14 July [online] https://www.digicelpacific.com/news/ telstra-acquires-digicel-pacific.
DPL News (2022), “Cable submarino de América Móvil llega a Costa Rica”, 30 November [online] https://dplnews. com/cable-submarino-amx-1-llega-a-costa-rica/.
62 Economic Commission for Latin America and the Caribbean (ECLAC) Chapter I
ECLAC (Economic Commission for Latin America and the Caribbean) (2023), Halfway to 2030 in Latin America and the Caribbean: progress and recommendations for acceleration (LC/FDS.6/3), Santiago.
(2020), Foreign Direct Investment in Latin America and the Caribbean, 2020 (LC/PUB.2020/15-P), Santiago.
(2010), Foreign Direct Investment in Latin America and the Caribbean, 2009 (LC/G.2447-P), Santiago.
(2007), Foreign Direct Investment in Latin America and the Caribbean, 2006 (LC/G.2336-P), Santiago.
El Economista (2022a), “Fusión de Televisa y Univisión dio empuje histórico a IED en sector de video”, 3 June [online] https://www.eleconomista.com.mx/empresas/Fusion-de-Televisa-y-Univision-dio-empuje-historicoa-IED-en-sector-de-video-20220603-0006.html.
(2022b), “Con condiciones, aprueban fusión de Claro y VTR en Chile”, 5 October [online] https://www. eleconomista.com.mx/empresas/Chile-autoriza-empresa-conjunta-entre-America-Movil-y-Liberty-LatinAmerica-20221005-0047.html.
Entel (2022), “Entel acuerda venta de data centers en Chile y Perú a Equinix por un monto equivalente a US$ 736 Millones”, 18 March [online] https://informacioncorporativa.entel.cl/comunicados-de-prensa/ posts/entel-acuerda-venta-de-data-centers-en-chile-y-peru-a-equinix-por-un-monto-equivalente-aus-736-millones.
EuroChem (2022), “EuroChem completes acquisition of Serra do salitre phosphate Project”, 23 February [online] https://www.eurochemgroup.com/media-announcements/eurochem-completes-acquisition-of-serra-dosalitre-phosphate-project/.
Frick, S. A. and A. Rodríguez-Pose (2023), “What draw investments to special economic zones? Lessons from developing countries”, Regional Studies [online] https://doi.org/10.1080/00343404.2023.2185218.
Garrido, C. (2022), “México en la fábrica de América del Norte y el nearshoring”, Project Documents (LC/MEX/TS.2022/15/-*), Mexico City, Economic Commission for Latin America and the Caribbean (ECLAC).
Gligo, N. (2007), “Políticas activas para atraer inversión extranjera directa en América Latina y el Caribe”, serie Desarrollo Productivo, Nº 175 LC/L.2667-P), Santiago, Economic Commission for Latin America and the Caribbean (ECLAC), January.
Government of the Province of Salta (2022), “Directivos de la minera Río Tinto informaron a Sáenz aspectos sobre la compra del proyecto Rincón”, 27 January [online] https://www.salta.gob.ar/prensa/noticias/ directivos-de-la-minera-rio-tinto-informaron-a-saenz-aspectos-sobre-la-compra-del-proyecto-rincon-80323.
Heilbron, A. and Y. Aranda-Larrey (2020), Strengthening Service Delivery for Investment Promotion Agencies: The Comprehensive Investor Services Framework, Washington D.C., World Bank.
IMF (International Monetary Fund) (2023), World Economic Outlook: A Rocky Recovery, Washington, D.C.
La Tercera (2022), “WOM Concreta Venta de Torres a Estadounidense Phoenix Tower International”, 16 August [online] https://www.latercera.com/pulso/noticia/wom-concreta-venta-de-torres-a-estadounidensephoenix-tower-international/6AHH7QZHP5HQDG75XZSAXYY77Y/.
LexLatin (2023), “WestRock completa la adquisición de Grupo Gondi”, 1 May [online] https://lexlatin.com/ noticias/westrock-grupo-gondi.
(2021), “Las firmas detrás de una de las adquisiciones más grandes del sector minero”, 26 October [online] https://lexlatin.com/noticias/las-adquisiciones-mas-grandes-del-sector-minero.
Liu, Y. (2022), “Effects on global FDI”, The Impact of the War in Ukraine on Global Trade and Investment, M. Ruta (ed.), Washington, D.C., World Bank.
Llinás Vargas, M. A. (2021), Iniciativas clúster: una forma concreta y efectiva de “mover la aguja” de la productividad, Bogota, Puntoaparte Editores.
Mainstream Renewable Power (2022), “Actis and Mainstream Realise Investment in Chile Renewable Energy IPP”, 4 February [online] https://www.mainstreamrp.com/insights/actis-and-mainstream-realise-investment-inchile-s-largest-renewable-energy-ipp-aela-energia/.
Ministry of Trade and Industry (2022), “Ministro Alfaro Boyd participa en primera palada de refinería de biocombustibles en Colón” [online] https://mici.gob.pa/2022/10/11/ministro-alfaro-boyd-participa-enprimera-palada-de-refineria-de-biocombustibles-en-colon/.
Morgan Stanley (2023), M&A Outlook: 4 Trends to Watch as Deal-Making Accelerates [online] https://www. morganstanley.com/ideas/mergers-and-acquisitions-outlook-2023-trends.
Mundo PMMI (2022), “Alpek compra a Octal Holding”, 16 February [online] https://www.mundopmmi.com/ empaque/inteligencia-de-negocios/article/22056385/alpek-compra-a-octal-holding.
Noguez, R. (2022a), “Mondelēz concreta compra de Ricolino a Grupo Bimbo por US$ 1.367 millones”, Forbes Chile, 2 November [online] https://forbes.cl/negocios/2022-11-02/bimbo-da-el-adios-final-a-paleta-payasomondelez-concreta-compra-de-ricolino/. (2022b), “Cemex dice adiós a Costa Rica y El Salvador, vende sus activos por 328 mdd”, Forbes Mexico, 31 August [online] https://www.forbes.com.mx/cemex-dice-adios-a-costa-rica-y-el-salvador-vende-susactivos-por-328-mdd/.
63 Foreign Direct Investment in Latin America and the Caribbean • 2023 Chapter I
Norton Rose Fulbright (2021), “Cross-Border Team Advises Equatorial Energia in Purchase of Echoenergia Participações”, 4 November [online] https://www.nortonrosefulbright.com/en-nl/news/22f5c4d2/crossborder-team-advises-equatorial-energia.
OECD (Organisation for Economic Co-operation and Development) (2023), “Foreign Direct Investment in Figures-OECD”, April [online] https://www.oecd.org/investment/investmentnews.htm.
(2022a), International investment implications of Russia’s war against Ukraine, Paris, OECD Publishing [online] https://doi.org/10.1787/a24af3d7-en.
(2022b), FDI Qualities Policy Toolkit, 2022, Paris, OECD Publishing.
Oxiteno (2022), “Indorama Ventures completa la adquisición de Oxiteno con sede en Brasil, extendiendo el perfil de crecimiento a mercados atractivos de surfactantes”, 4 April [online] https://oxiteno.com/mx/es/ indorama-ventures-completa-la-adquisicion-de-oxiteno-con-sede-en-brasil-extendiendo-el-perfil-decrecimiento-a-mercados-atractivos-de-surfactantes/.
Podestá, A. and others (2022), “Políticas de atracción de inversiones para el financiamiento de la energía limpia en América Latina”, Project Documents (LC/TS.2022/116), Santiago, Economic Commission for Latin America and the Caribbean (ECLAC).
PRNewswire (2022), “DIGICEL completes sale of pacific operations to TELSTRA”, 14 July [online] https://www. prnewswire.com/news-releases/digicel-completes-sale-of-pacific-operations-to-telstra-301586496.html.
Reuters (2023), “CERAWEEK-Woodside on Track for Decision on Trion in Mexico This Year”, 8 March [online] https:// www.reuters.com/business/energy/ceraweek-woodside-track-decision-trion-mexico-this-year-2023-03-08/. (2022), “Just Eat Takeaway Soars on $1.8 Billion IFood Stake Sale to Prosus”, 19 August [online] https:// www.reuters.com/markets/deals/prosus-buy-ifood-stake-just-eat-takeaway-up-18-bln-euros-2022-08-19/. (2021), “China’s Ganfeng Gets Green Light for Argentina Lithium Plant” [online] https://www.reuters.com/ article/us-ganfeng-lithium-argentina-idUSKCN2EC1XU.
Revista Mercado (2022), “CEPM anuncia que va por generación de energía ‘carbon-free’”, 20 January https:// www.revistamercado.do/turismo/consorcio-energetico-punta-cana-macao-va-por-generacion-de-energia100-renovable.
Rio Tinto (2022), “Rio Tinto Completes Acquisition of Rincon Lithium Project”, 29 March [online] https://www. riotinto.com/en/news/releases/2022/rio-tinto-completes-acquisition-of-rincon-lithium-project.
Semana (2022), “Grupo Energía Bogotá firmó acuerdo con Brookfield para adquirir acciones de cinco concesiones de transmisión”, 30 July [online]
https://www.semana.com/economia/empresas/articulo/grupo-energiabogota-firmo-acuerdo-con-brookfield-para-adquirir-acciones-de-cinco-concesiones-de-transmision/202229/.
SGSCM (Sierra Gorda SCM) (2022), “Sierra Gorda SCM” [online] https://www.sgscm.cl/es/nosotros.
S&P (2022), “SoFi’s Acquisition of Technisys Represents Largest Bank-Infotech Deal since 2012”, 2 November [online] https://www.spglobal.com/marketintelligence/en/news-insights/latest-news-headlines/sofi-sacquisition-of-technisys-represents-largest-bank-infotech-deal-since-2012-72771674.
Televisa (2022), “Univision and Televisa Complete Transaction to Create ‘TelevisaUnivision’, the World’s Leading Spanish-Language Media and Content Company”, January [online] https://www.televisair.com/~/media/ Files/T/Televisa-IR/Cartas/Letter%20to%20Shareholders-09052022.pdf.
The Sunday Times (2021), “Just Eat Is a Tasty Starter for IFood, the Brazilian main course”, 18 April [online] https://archive.ph/mM84s.
UNCTAD (United Nations Conference on Trade and Development) (2023), Investment Trends Monitor, No. 44. (2022), “Corporate income taxes and investment incentives: A global review”, Investment Policy Monitor, Special issue, 8 July [online] https://unctad.org/system/files/official-document/diaepcbinf2022d3_en.pdf. (2015), Investment Policy Framework for Sustainable Development, Ginebra.
Uruguay XXI (2022), “Informe Unión Europea” [online] https://www.uruguayxxi.gub.uy/uploads/informacion/70407 d934ce3695fa13b03159c517ad9c0b68cc4.pdf.
Vanguardia (2023), “Llega a Nuevo León otro proveedor para Tesla”, 23 February [online] https://vanguardia. com.mx/dinero/llega-a-nuevo-leon-otro-proveedor-para-tesla-AD6533057.
Volpe Martincus, C. and others (2021), Making the Invisible Visible: Investment Promotion and Multinational Production in Latin America and the Caribbean, Washington, D.C., Inter-American Development Bank (IDB). WestRock (2022), “WestRock to Acquire Remaining Interest in Grupo Gondi”, 27 July [online] https://ir.westrock. com/press-releases/press-release-details/2022/WestRock-to-Acquire-Remaining-Interest-in-Grupo-Gondi/ default.aspx.
Yara (2021), “Yara continues its transformation with divestment of salitre phosphate mining project in Brazil”, 1 August [online] https://www.yara.com/corporate-releases/yara-continues-its-transformation-withdivestment-of-salitre-phosphate-mining-project-in-brazil/.
64 Economic Commission for Latin America and the Caribbean (ECLAC) Chapter I
Annex I.A1
Table I.A1.1
Latin America and the Caribbean: FDI inflows by country, 2003–2022a
65 Foreign Direct Investment in Latin America and the Caribbean • 2023 Chapter I
2003 2004 2005 2006 2007 2008 2009 2010 2011 2012 2013 2014 2015 2016 2017 2018 2019 2020 2021 2022 Antigua and Barbuda 179 95 238 361 341 161 85 101 68 138 101 46 114 97 151 205 128 77 245 196 Argentina 1 652 4 125 5 265 5 537 6 473 9 726 4 017 11 333 10 840 15 324 9 822 5 065 11 759 3 260 11 517 11 717 6 649 4 884 6 903 15 408 Bahamas 713 804 1 054 1 492 1 623 1 512 646 1 097 1 409 1 034 1 590 3 551 713 1 260 901 947 611 897 1 052 1 255 Barbados 185 228 390 342 476 615 255 446 456 527 118 592 418 269 206 242 215 262 237Belize -10.9 111 127 109 143 170 109 97 95 189 95 153 65 44 24 118 94 76 125 134 Bolivia (Plurinational State of) 197 85 -287.8 281 366 513 423 643 859 1 060 1 750 657 555 335 712 302 -216.6 -1 129.5 584 -26.4 Brazil 10 123 18 161 15 460 19 418 44 579 50 716 31 481 82 390 102 427 92 568 75 211 87 714 64 738 74 295 68 885 78 163 69 174 37 786 46 439 91 502 Chile 3 486 4 969 5 991 4 755 10 545 18 812 12 750 14 849 26 369 31 802 21 121 25 528 17 766 11 363 5 237 7 943 13 579 11 447 15 933 20 865 Colombia 1 720 3 116 10 235 6 751 8 886 10 564 8 035 6 430 14 647 15 040 16 210 16 169 11 621 13 858 13 701 11 299 13 989 7 459 9 561 16 869 Costa Rica 575 794 861 1 469 1 896 2 078 1 615 1 907 2 733 2 696 3 205 3 242 2 956 2 620 2 925 3 015 2 719 2 103 3 593 3 673 Dominica 32 27 32 29 48 57 58 43 35 59 25 12 7 42 23 78 63 22 34 28 Dominican Republic 613 909 1 123 1 085 1 667 2 870 2 165 2 024 2 277 3 142 1 991 2 209 2 205 2 407 3 571 2 535 3 021 2 560 3 197 4 010 Ecuador 872 837 493 271 194 1 057 309 166 646 567 727 772 1 323 764 630 1 389 979 1 095 647 829 El Salvador 123 366 398 267 1 455 824 366 -225.6 218 466 179 306 396 348 889 826 636 272 308 -100.9 Grenada 91 66 73 96 172 141 104 64 45 34 114 84 154 109 153 186 204 136 140 160 Guatemala 263 296 508 592 745 738 522 658 1 219 1 270 1 479 1 442 1 231 1 174 1 130 981 976 935 3 462 1 352 Guyana 26 30 77 102 152 178 164 198 247 294 214 255 122 32 212 1 232 1 695 2 060 4 454 4 389 Haiti 14 6 26 161 75 30 55 186 114 174 159 94 104 93 385 105 55 - -Honduras 403 547 600 669 928 1 006 509 969 1 014 1 059 1 069 1 704 1 317 1 147 941 1 380 947 224 800 1 082 Jamaica 721 602 682 882 866 1 437 541 228 218 413 545 582 925 928 889 775 665 265 320 319 Mexico 18 158 25 143 25 162 22 124 31 019 29 753 19 652 30 525 23 895 18 232 50 928 28 438 36 250 38 899 33 114 37 857 29 906 31 519 33 478 38 932
(Millions of dollars)
Source: Economic Commission for Latin America and the Caribbean (ECLAC), on the basis of official figures and estimates as at 30 June 2023. a Data are compiled using the methodology of International Monetary Fund (IMF), Balance of Payments and International Investment Position Manual: Sixth Edition (BPM6), Washington, D. C., 2009, except in the case of the Bolivarian Republic of Venezuela, Guyana, Paraguay and Peru. The methodology of the fifth edition (2004) is used in part of the series for the following countries: Antigua and Barbuda, Dominica, Grenada, Plurinational State of Bolivia, Saint Kitts and Nevis, and Saint Lucia (2003–2013); Argentina (2003–2005); Dominican Republic (2003–2009); Ecuador (2003–2015); Guatemala (2003–2007); Honduras (2003–2012); Mexico and Nicaragua (2003–2005); Panama (2003–2014); Suriname (2003–2016); Trinidad and Tobago (2003–2010); and Uruguay (2003–2011).
66 Economic Commission for Latin America and the Caribbean (ECLAC) Chapter I 2003 2004 2005 2006 2007 2008 2009 2010 2011 2012 2013 2014 2015 2016 2017 2018 2019 2020 2021 2022 Nicaragua 201 250 241 287 382 627 434 490 936 776 965 1 077 967 989 1 035 838 503 747 1 220 1 294 Panama 771 1 012 1 027 2 498 1 777 2 402 1 259 2 363 3 132 2 980 3 943 4 459 5 058 5 585 3 977 5 487 4 451 -2 477 1 761 2 513 Paraguay 28 70 42 161 443 342 156 707 603 773 366 891 582 741 523 218 402 95 207 474 Peru 1 335 1 599 2 579 3 467 5 491 6 924 6 431 8 455 7 682 14 182 9 571 4 263 7 337 6 805 7 413 5 873 4 760 791 7 420 10 848 Saint Kitts and Nevis 78 63 104 115 141 184 136 119 112 110 139 157 128 121 48 40 62 6 26 16 Saint Lucia 112 81 82 238 277 166 152 127 100 78 95 65 152 162 90 46 76 48 86 67 Saint Vincent and the Grenadines 55 66 41 110 121 159 111 97 86 115 160 124 124 71 165 40 69 65 160 86 Suriname -76.1 -37.3 28 -163.4 -246.7 -231.4 -93.4 -247.7 70 174 188 164 267 300 96 131 84 1 -132.7 -5.4 Trinidad and Tobago 808 998 940 883 830 2 801 709 549 41 -1 904.3 -1 130.0 661 177 -23.6 -470.9 -700.2 184 1 056 -935 -914 Uruguay 416 332 847 1 493 1 329 2 106 1 529 2 289 2 504 6 394 987 4 085 2 673 -515.7 2 687 1 727 1 470 526 3 657 9 325 Venezuela (Bolivarian Republic of) 2 040 1 483 2 589 -508.0 3 288 2 627 -983.0 1 574 5 740 5 973 2 680 -1 028.0 769 1 068 -68.0 886 … … … … Total 45 903 67 234 77 028 75 373 126 484 151 062 93 700 170 651 210 839 215 737 204 615 193 535 172 969 168 648 161 693 175 877 158 153 103 807 144 981 224 579
Table I.A1.2
Latin America and the Caribbean: FDI inflows by destination sector, 2008–2022a (Millions
dollars)
67 Foreign Direct Investment in Latin America and the Caribbean • 2023 Chapter I
of
2008 2009 2010 2011 2012 2013 2014 2015 2016 2017 2018 2019 2020 2021 2022 Argentinab Natural resources 1 537 946 2 741 1 056 6 586 5 084 -828.6 2 141 352 Manufactures 5 477 264 3 991 4 096 3 963 3 841 5 850 6 420 -1 577.5 Services 5 126 2 556 4 140 5 830 6 295 4 511 6 454 6 704 1 620 Belize Natural resources 37 7 13 31 101 22 10 12 28 10 21 - - -Manufactures - - - - - - - - - - - - - -Services 117 93 79 59 82 64 113 40 10 7 86 79 67 119Other 16 9 5 5 6 9 30 13 6 7 11 15 9 9Bolivia (Plurinational State of) c Natural resources 859 420 531 622 1 166 1 550 1 558 916 372 638 448 221 2 495 491 Manufactures 154 74 276 240 119 317 390 23 137 260 147 148 39 380 208 Services 290 193 128 171 220 162 173 227 592 312 309 206 124 177 231 Brazild Natural resources 11 210 4 288 20 278 8 901 10 140 17 180 9 391 5 924 10 140 5 030 10 644 11 448 5 283 -244.0 8 892 Manufactures 9 763 9 952 25 852 33 551 37 580 39 323 42 484 34 349 37 025 21 383 33 494 24 905 14 539 7 646 19 642 Services 9 091 5 667 7 233 28 574 27 494 23 873 34 583 31 952 22 631 32 317 17 609 12 002 12 298 21 889 28 868 Other - - 223 207 162 123 82 144 157 106 85 67 157 244 258 Chile Natural resources 4 599 6 062 6 053 12 673 13 184 6 152 6 591 8 966 1 017 993 -1 570.5 1 666 2 435 4 598Manufactures 1 570 28 1 572 -54.1 1 107 1 465 3 630 526 303 -275.9 -223.9 328 -297.8 197Services 8 725 7 092 7 805 12 918 14 288 10 758 14 318 7 759 7 175 636 8 822 8 438 5 893 9 636Other 256 674 589 -1 387.2 3 224 2 747 989 515 2 868 3 884 915 3 147 1 175 821Colombia Natural resources 5 176 5 670 4 976 7 236 7 972 8 513 7 091 3 264 2 501 4 339 3 931 4 482 1 089 1 431 4 690 Manufactures 1 696 1 260 210 1 108 1 925 2 138 2 826 2 638 1 844 2 368 1 310 1 499 894 1 719 1 239 Services 3 693 1 105 1 244 6 303 5 143 5 560 6 252 5 718 9 513 6 994 6 058 8 008 5 476 6 411 10 939
68 Economic Commission for Latin America and the Caribbean (ECLAC) Chapter I 2008 2009 2010 2011 2012 2013 2014 2015 2016 2017 2018 2019 2020 2021 2022 Costa Rica Natural resources 71 78 -3.2 -18.7 20 2 13 403 110 34 93 5 -60.1 -61.1 7 Manufactures 431 373 980 887 399 329 614 622 953 1 269 1 352 1 668 1 163 2 425 2 056 Services 1 696 875 530 1 548 1 847 2 392 2 271 1 726 1 138 1 481 1 038 1 119 650 887 994 Other 122 118 176 45 -7.8 19 27 1 3 -6.1 5 20 10 -20.5 -13.1 Dominican Republic Natural resources 357 758 240 1 060 1 169 93 -38.5 6 486 410 185 225 -6.5 536 377 Manufactures 574 280 566 355 1 257 404 607 368 413 1 365 540 356 441 307 600 Services 1 938 1 128 1 218 862 716 1 494 1 640 1 831 1 508 1 796 1 811 2 440 2 125 2 354 3 034 Ecuador Natural resources 265 58 189 380 243 274 724 628 509 193 878 524 525 116 -136.8 Manufactures 198 118 120 122 136 138 108 264 38 144 105 110 37 194 37 Services 595 133 -143.1 142 189 315 -59.9 431 217 293 406 345 533 338 888 El Salvador Natural resources 31 9 1 -0.6 - - - - - - - - - -Manufactures 28 92 -65.3 149 -47.3 289 82 291 268 458 586 51 68 19 -294.0 Services 479 243 -224.8 66 488 -149.3 246 80 80 374 159 553 252 256 166 Other (maquila) 365 21 59 4 29 35 -22.5 28 -1.4 58 81 33 -28.3 38 34 Guatemala Natural resources 209 110 147 391 461 440 51 23 59 -49.6 -98.2 64 16 20 92 Manufactures 76 23 199 187 132 190 197 238 242 277 274 227 263 285 157 Services 447 383 290 711 644 789 1 159 963 881 804 713 660 571 3 110 1 035 Other 6 6 23 -69.2 33 60 37 8 -6.6 99 92 26 84 47 67 Guyana Natural resources 87 65 94 108 122 173 113 59 41 161 1 138 1 480 985 4 416 4 345 Manufactures 12 8 16 30 44 10 31 13 4 2 6 30 26 44 40 Services 62 77 70 92 113 17 44 17 5 41 12 6 32 10 9 Other 17 14 18 17 14 14 67 33 8 8 76 197 - - -
69 Foreign Direct Investment in Latin America and the Caribbean • 2023 Chapter I 2008 2009 2010 2011 2012 2013 2014 2015 2016 2017 2018 2019 2020 2021 2022 Honduras Natural resources 4 10 84 62 41 70 72 64 -94.0 -67.0 57 9 6 62 94 Manufactures 267 98 341 392 426 325 667 385 430 635 -37.4 -110.3 70 119 -23.5 Services 736 402 545 560 591 665 678 755 803 607 942 600 343 557 753 Jamaica Natural resources 152 54 31 57 107 87 56 82 118 237 403 342 65 35 29 Manufactures - - - - - - - - - - - - - -Services 453 292 155 93 100 155 139 369 371 214 106 120 171 163 188 Other 832 195 42 68 206 303 387 474 439 438 266 203 90 122 102 Mexico Natural resources 4 788 1 364 1 557 1 303 3 038 6 011 2 922 1 975 1 332 2 013 1 963 2 218 1 882 5 161 2 128 Manufactures 8 860 8 128 14 579 11 837 10 010 31 069 19 054 18 609 18 309 15 592 16 184 15 921 11 284 12 524 13 710 Services 15 855 8 357 11 054 12 492 8 721 11 275 8 376 15 359 11 548 16 412 15 953 16 438 15 040 13 869 20 378 Nicaragua Natural resources 57 47 77 191 123 272 109 32 -11.8 29 105 136 - -Manufactures 122 70 108 226 302 234 246 280 378 234 110 25 - -Services 447 318 323 550 347 350 378 501 385 541 438 219 - -Other - - - - 22 125 151 137 147 232 184 124 - -Panama Natural resources -59.0 -33.9 77 94 1 164 468 27 1 679 730 2 043 1 527 918 -346.3 -114.5 Manufactures 161 104 -113.8 298 520 142 250 -7.6 221 316 27 117 -69.9 234 Services 2 106 1 190 2 760 2 761 1 526 2 957 4 182 2 885 3 795 1 818 3 466 2 885 566 1 807 Paraguay Natural resources 3 16 7 43 64 109 63 -129.4 138 6 -48.1 -3.7 -43.0 30Manufactures 114 2 373 264 177 -18.7 -1.3 134 161 187 177 307 44 121Services 192 75 248 367 527 410 602 439 342 147 35 29 109 41 -
Source: Economic Commission for Latin America and the Caribbean (ECLAC), on the basis of official figures and estimates as at 30 June 2023.
a Data are compiled using the methodology of International Monetary Fund (IMF), Balance of Payments and International Investment Position Manual: Sixth Edition (BPM6)
except in the case of Costa Rica, Honduras, Mexico, Panama and Paraguay. The methodology of the fifth edition (2004) is used in part of the series for Ecuador (2008–2015).
b According to data from the Central Bank of the Argentine Republic.
c Gross FDI flows, excluding divestments.
d Data do not include reinvested earnings.
70 Economic Commission for Latin America and the Caribbean (ECLAC) Chapter I 2008 2009 2010 2011 2012 2013 2014 2015 2016 2017 2018 2019 2020 2021 2022 Uruguay Natural resources 604 253 329 383 435 342 43 42 182 -88.9 -43.0 -61.1 55 98Manufactures 261 242 131 190 568 507 677 163 -759.1 -90.9 200 481 506 1 420Services 1 068 1 027 1 037 1 482 1 035 3 373 1 441 883 -1 205.6 -436.5 -115.5 1 625 202 802Other 238 71 820 572 36 32 32 20 29 -9.4 -22.1 41 -4.8 -19.2Total Natural resources 29 986 20 180 37 422 34 572 46 136 46 841 27 967 26 087 18 008 15 932 19 635 23 672 11 885 16 578 21 009 Manufactures 29 763 21 113 49 133 53 878 58 620 80 700 77 712 65 314 58 390 44 122 54 250 46 063 29 007 27 635 37 371 Services 53 114 31 205 38 491 75 580 70 367 68 970 82 991 78 638 61 408 64 354 57 848 55 773 44 453 62 425 67 483 Other 1 851 1 108 1 955 -537.7 3 725 3 467 1 779 1 373 3 649 4 817 1 692 3 872 1 492 1 242 448
Washington, D. C., 2009,
,
Table I.A1.3
Latin America and the Caribbean: FDI inflows by country or territory of origin, 2007–2022a (Millions
dollars)
71 Foreign Direct Investment in Latin America and the Caribbean • 2023 Chapter I
of
2007 2008 2009 2010 2011 2012 2013 2014 2015 2016 2017 2018 2019 2020 2021 2022 Argentinab Spain 2 191 812 1 248 1 166 217 2 835 2 354 -2 323 3 310 1 275 Panama 592 1 153 107 476 840 3 170 2 345 2 629 1 621 477 Venezuela (Bolivarian Republic of) 103 372 664 48 -8 450 1 249 722 329 332 Bermuda 200 116 515 730 273 403 369 336 65 151 Chile 560 862 245 1 080 1 085 1 255 590 838 929 120 Samoa 229 256 -107 368 167 -65 -79 18 276 95 Mexico 549 545 123 309 407 611 -94 312 381 68 Germany 385 342 317 578 221 525 927 749 528 62 Bolivia (Plurinational State of)c Peru 35 26 40 82 12 56 102 442 -5 247 13 145 37 121 254 217 Spain 50 25 145 271 235 364 676 537 369 164 167 208 274 64 159 157 Sweden 242 339 22 169 280 178 347 15 79 -13 413 212 40 -154 286 139 Netherlands (Kingdom of the) 20 20 10 1 5 31 15 3 0 -13 -3 47 45 60 74 104 Bermuda 1 19 14 10 9 31 17 -4 -1 -7 12 10 28 8 8 52 Brazild Netherlands (Kingdom of the) 6 840 3 136 3 803 2 762 18 693 15 365 23 614 24 650 23 907 23 885 8 327 18 416 6 742 5 024 -1 555 14 199 United States 2 851 2 207 1 277 7 180 4 531 20 926 10 715 11 530 10 159 8 614 14 820 10 310 7 698 10 399 11 963 13 786 France 1 118 2 167 1 895 3 007 4 352 2 827 2 981 3 947 -477 3 347 4 656 3 171 4 070 2 615 723 4 795 Spain 1 732 2 594 3 016 632 9 965 2 450 2 180 6 356 5 311 2 482 753 2 979 2 231 1 543 -632 3 266 Chile 690 -8 971 1 459 1 686 2 210 3 316 1 385 726 418 1 395 857 3 675 596 936 3 067 Hong Kong, China 13 35 34 810 2 187 151 431 308 272 226 1 082 944 216 83 2 185 2 623 United Kingdom 816 582 990 1 451 3 302 2 606 1 745 1 904 1 855 -1 735 1 299 592 2 899 -1 181 133 2 455 Norway 255 184 671 1 322 1 014 810 450 462 2 461 2 019 895 1 467 2 413 981 2 219 2 060
72 Economic Commission for Latin America and the Caribbean (ECLAC) Chapter I 2007 2008 2009 2010 2011 2012 2013 2014 2015 2016 2017 2018 2019 2020 2021 2022 Chile Italy 0 0 316 392 268 25 -138 58 69 2 495 17 1 043 2 094 258 7 409 Canada 0 0 423 515 3 244 2 227 2 430 3 129 -1 226 326 1 104 2 661 1 348 1 882 2 832 Belgium 0 0 84 74 12 366 373 337 0 182 -53 -166 160 181 2 798 Netherlands (Kingdom of the) 0 0 2 036 -847 1 313 3 537 6 496 2 098 1 796 531 332 1 216 1 779 923 2 394 United Kingdom 0 0 23 1 042 1 598 2 462 -325 1 191 2 915 926 2 332 3 179 1 333 1 950 1 476 Colombia United States 2 697 2 874 2 343 1 593 2 154 2 476 2 838 2 240 2 123 2 099 2 172 2 410 2 475 1 843 1 553 4 976 Spain 572 1 040 830 113 1 164 628 884 2 214 1 324 1 463 2 612 1 677 2 536 1 709 1 418 2 737 Panama 839 1 141 789 1 368 3 508 2 395 2 040 2 436 1 650 1 433 1 429 1215 968 598 618 1 982 Anguilla 1 304 1 224 920 337 482 598 856 -163 -191 -237 35 295 500 11 313 1 380 Switzerland 122 140 166 180 994 698 2 096 2 804 958 731 741 877 1 154 583 1 057 955 United Kingdom 1 580 1 505 1 400 949 1 408 1 357 1 400 1 088 718 879 1 260 1 248 989 285 411 934 Costa Rica United States 803 1 352 1 008 1 107 1 499 907 449 796 1 263 764 1 611 1 631 1 962 1 163 2 547 2 230 Switzerland 35 79 -36 68 5 -3 -7 36 -43 40 117 122 54 -15 71 287 Colombia 30 49 6 98 138 104 57 170 135 84 195 69 104 37 206 92 Mexico 69 16 5 40 172 225 160 234 114 115 136 85 94 15 10 61 Spain 30 119 68 28 247 301 211 270 95 119 111 21 44 49 60 36 Germany 29 51 9 20 9 -11 29 40 60 39 -27 1 25 13 88 30 Dominican Republic United States 536 360 455 1 055 499 252 374 321 405 356 732 709 937 730 1 410 1 521 Mexico -124 1 055 273 433 73 -32 6 244 -19 118 -45 -80 609 337 392 394 Canada 113 383 773 696 1 126 851 143 158 91 480 473 329 259 80 380 366 Spain 605 181 151 203 137 128 33 7 32 281 206 288 355 194 213 347
73 Foreign Direct Investment in Latin America and the Caribbean • 2023 Chapter I 2007 2008 2009 2010 2011 2012 2013 2014 2015 2016 2017 2018 2019 2020 2021 2022 Ecuador Uruguay 2 -37 -13 40 3 6 115 62 43 0 61 90 27 62 2 772 China 85 47 56 45 80 86 94 79 114 62 98 61 28 58 76 59 Spain 85 190 51 -17 52 50 71 67 71 102 81 169 149 235 -28 43 Mexico -40 313 621 279 70 83 91 4 2 8 7 62 6 -2 37 37 United States 50 -29 -607 -535 12 94 42 10 186 88 35 60 74 87 83 31 Netherlands (Kingdom of the) 8 -8 -4 11 7 11 48 76 293 390 42 154 90 -18 -19 31 El Salvador Mexico 0 0 0 -49 48 99 13 -36 2 -80 35 74 33 -83 -37 152 United States 499 129 74 -99 23 3 31 116 248 49 24 354 215 -24 142 77 Honduras 0 0 0 -4 0 31 -1 8 -14 46 157 -11 -12 29 59 46 Guatemala United States 0 224 132 280 151 232 207 372 359 299 263 292 236 96 121 261 Colombia 0 15 18 18 184 50 194 161 129 124 234 154 176 228 337 254 Luxembourg 0 36 19 1 10 18 -5 73 70 63 22 23 31 41 2 248 221 Mexico 0 75 44 79 97 98 231 181 111 202 203 102 108 -13 167 193 Panama 0 9 5 9 15 28 9 27 53 19 -24 52 24 178 209 139 Honduras 0 3 31 -35 16 23 61 31 62 31 14 34 35 26 41 58 Republic of Korea 0 4 20 52 45 35 104 63 38 48 86 40 26 15 -22 41 Honduras Panama 22 16 1 14 16 22 63 152 232 273 156 188 89 56 132 237 United States 460 449 92 185 141 173 128 -256 140 -4 564 -15 -43 248 110 191 Colombia 0 0 0 0 20 22 31 128 97 99 31 106 105 156 169 160 Guatemala 15 44 14 61 44 52 37 88 60 158 56 40 121 72 133 60 Spain 0 3 0 -1 2 2 4 4 1 0 1 9 2 -4 -7 36 El Salvador 9 3 11 17 21 25 26 22 16 20 5 17 26 3 16 22
74 Economic Commission for Latin America and the Caribbean (ECLAC) Chapter I 2007 2008 2009 2010 2011 2012 2013 2014 2015 2016 2017 2018 2019 2020 2021 2022 Mexico United States 15 281 11 431 7 775 10 828 13 555 9 765 16 830 10 415 18 271 11 017 15 510 11 731 12 347 11 005 13 326 20 514 Canada 1 685 4 546 2 154 1 970 1 335 1 465 5 108 2 982 1 223 2 586 3 929 4 805 3 131 3 420 3 287 3 696 Argentina 1 927 113 9 -7 155 437 82 356 512 294 350 1 095 615 664 -464 2 321 Japon 710 899 708 1 204 846 2 019 1 694 2 563 2 168 2 012 2 425 2 289 1 532 1 338 1 367 2 171 United Kingdom 572 993 56 481 291 388 1 452 296 900 489 200 314 832 790 1 242 1 702 Spain 4 427 5 063 2 464 3 826 2 586 -1 555 -151 3 712 3 672 3 407 2 369 4 100 4 308 4 016 4 395 1 590 Republic of Korea 279 731 162 362 497 468 473 612 1 013 1 126 259 705 175 609 718 650 Nicaragua United States 84 126 88 88 159 121 244 Mexico 128 164 48 90 115 149 125 Venezuela (Bolivarian Republic of) 47 132 147 29 45 210 108 Panama 5 4 1 1 34 78 77 … … … … … … … … … Spain 45 59 25 33 116 -19 74 … … … … … … … … … Panama Colombia 134 60 135 82 486 9 29 1 162 659 913 446 856 780 357 596 Switzerland 146 122 301 444 216 152 232 244 161 232 547 -41 -13 -166 353 Netherlands (Kingdom of the) 22 420 0 126 -114 244 -2 109 398 -152 -26 266 181 108 247 Germany 8 2 13 15 106 113 92 45 14 -5 43 -7 96 -88 130 … Mexico 60 69 154 -9 171 -51 367 20 95 -10 224 2 -37 -177 118 … Brazil 5 59 33 -2 20 0 0 37 154 64 -50 -170 77 -267 104 China 1 6 3 -3 1 2 2 41 33 125 52 31 42 -65 97
Source: Economic Commission for Latin America and the Caribbean (ECLAC), on the basis of official figures and estimates as at 30 June 2023.
a Data are compiled using the methodology of International Monetary Fund (IMF), Balance of Payments and International Investment Position Manual: Sixth Edition (BPM6), Washington, D. C., 2009, except in the case of Costa Rica, Honduras, Mexico, Panama and Paraguay. The methodology of the fifth edition (2004) is used in part of the series for Ecuador (2007‒2015).
b According to data from the Central Bank of the Argentine Republic.
c Gross FDI flows, excluding divestments.
d Data do not include reinvested earnings.
75 Foreign Direct Investment in Latin America and the Caribbean • 2023 Chapter I 2007 2008 2009 2010 2011 2012 2013 2014 2015 2016 2017 2018 2019 2020 2021 2022 Paraguay United Kingdom -6 12 22 6 -4 32 28 53 57 97 -6 -10 -222 -5 146 Brazil 28 38 14 83 59 163 146 151 95 -14 91 53 93 73 139 Colombia 0 1 1 0 -1 0 1 18 22 19 21 22 25 16 87 … Chile 11 18 12 30 33 -18 38 33 -9 12 0 9 58 18 44 … Mexico -19 -71 0 -8 0 92 -10 39 -4 28 19 8 10 0 29 Venezuela (Bolivarian Republic of) 53 11 31 208 70 55 47 44 31 16 8 29 12 11 30 141 Trinidad and Tobago United States 574 403 469 363 -12 -16 -520 -153 13 26 0 -15 74 1 008 -402 1 337 United Kingdom 159 146 152 118 -222 -292 -206 -706 180 232 -455 -353 119 257 373 -2 232 Uruguay Brazil 56 86 183 110 108 331 515 -252 534 -884 167 -1 201 468 -1 643 4 432 Argentina 282 373 534 432 588 195 308 -148 159 -151 417 -91 133 -394 576 Singapore 0 0 0 0 0 58 104 -165 240 106 532 372 110 216 398 Luxembourg 0 3 4 12 10 -726 102 -140 67 281 -82 -53 -2 012 1 095 385 Spain 81 153 232 55 75 208 437 886 -69 568 737 3 814 443 278 338 Bermuda 0 0 7 223 -59 -55 -146 -334 -270 258 -77 -389 -351 69 173
Table I.A1.4
Latin America and the Caribbean: FDI inflows by component, 2007–2022 (Millions of
76 Economic Commission for Latin America and the Caribbean (ECLAC) Chapter I
dollars) 2007 2008 2009 2010 2011 2012 2013 2014 2015 2016 2017 2018 2019 2020 2021 2022 Antigua and Barbuda Equity 328 149 79 96 61 110 65 67 94 94 156 209 128 93 255 193 Intercompany loans 0 0 1 1 2 6 29 -25 -6 -4 7 3 9 15 -18 -6 Reinvested earnings 12 12 5 5 5 22 7 5 26 8 -11 -8 -9 -31 7 8 Argentina Equity 2 578 4 552 2 133 2 504 4 508 4 861 2 784 -112 1 319 3 716 1 958 3 259 2 231 1 373 854 826 Intercompany loans 1 846 4 777 -1 010 3 507 2 600 3 120 -783 -945 2 382 -4 732 2 422 1 424 167 839 1 112 8 807 Reinvested earnings 2 050 396 2 894 5 322 3 732 7 343 7 821 6 121 8 058 4 276 7 137 7 034 4 251 2672 4 937 5 775 Bahamas Equity 887 1 032 753 960 971 575 868 617 408 511 351 573 373 417 252 252 Intercompany loans 736 481 -107 137 438 458 723 2 934 304 749 550 374 238 480 799 1 003 Reinvested earnings 0 0 0 0 0 0 0 0 0 0 0 0 0 0 0 0 Barbados Equity 420 340 140 393 227 230 135 307 398 82 295 321 311 310 215 Intercompany loans 24 231 103 41 324 113 -110 -76 -190 -260 -192 -165 -154 -100 -27 Reinvested earnings 32 45 13 13 -95 184 92 361 210 447 102 85 58 53 49 Belize Equity 100 141 80 80 103 193 101 145 57 29 2 94 57 68 28 118 Intercompany loans 13 8 6 2 1 0 0 0 0 0 0 0 0 0 0 0 Reinvested earnings 30 21 23 15 -8 -4 -6 7 7 15 22 24 37 8 13 16 Bolivia (Plurinational State of)a Equity 27 45 0 1 5 19 17 313 20 406 152 70 126 36 70 52 Intercompany loans 654 850 177 141 130 282 331 889 741 568 417 438 345 350 444 235 Reinvested earnings 272 407 509 793 899 1 204 1 682 919 405 127 640 397 103 -221 538 644
77 Foreign Direct Investment in Latin America and the Caribbean • 2023 Chapter I 2007 2008 2009 2010 2011 2012 2013 2014 2015 2016 2017 2018 2019 2020 2021 2022 Brazil Equity 26 074 30 064 19 906 40 117 54 782 52 836 42 152 47 501 49 520 44 512 53 950 40 992 42 878 28 118 29 998 36 584 Intercompany loans 18 505 20 652 11 575 13 470 16 451 22 541 38 346 39 040 22 851 25 440 4 886 20 840 5 543 4 209 -446 21 075 Reinvested earnings ... ... ... 28 803 31 194 17 192 -5 288 1 174 -7 632 4 342 10 049 16 330 20 753 5 459 16 887 33 843 Chile Equity 2 622 7 775 1 905 4 662 10 911 8 532 4 778 10 506 6 494 6 148 2 075 2 476 6 361 5 245 10 990 8 851 Intercompany loans 866 3 086 1 144 3 856 3 233 11 067 8 714 9 619 9 785 2 552 -943 -795 1 846 936 415 1 237 Reinvested earnings 7 058 7 951 9 701 6 332 12 225 12 203 7 629 5 404 1 488 2 663 4 105 6 262 5 372 5 267 4 528 10 777 Colombia Equity 7 024 7 861 4 903 3 733 8 282 9 091 9 755 9 181 7 423 6 399 8 053 4 558 7 285 3 386 3 269 7 807 Intercompany loans -121 47 731 -635 1 872 1 239 2 368 2 493 2 006 4 672 1 794 1 604 2 411 2 527 2 485 2 680 Reinvested earnings 1 983 2 657 2 400 3 332 4 493 4 710 4 087 4 495 2 191 2 787 3 854 5 137 4 293 1 546 3 807 6 381 Costa Rica Equity 1 377 1 594 1 050 818 959 852 1 704 1 352 1 180 414 685 769 507 461 900 652 Intercompany loans -2 39 -174 150 711 1 136 714 912 665 1 153 573 794 574 511 693 425 Reinvested earnings 521 446 471 497 509 708 788 978 1 110 1 054 1 667 1 452 1 638 1 130 2 000 2 596 Dominican Republic Equity 1 616 2 199 704 667 804 1 256 233 955 995 1 126 2 403 1 513 1 583 1 688 1 629 2 257 Intercompany loans -446 278 1 096 554 468 904 471 -166 18 66 -162 -141 225 -330 -82 327 Reinvested earnings 498 394 365 803 1 005 982 1 286 1 420 1 192 1 214 1 331 1 164 1 213 1 201 1 650 1 425 Dominica Equity 28 39 39 28 25 45 16 6 8 36 26 60 52 39 37 27 Intercompany loans 9 9 13 13 7 9 4 2 -7 0 15 0 -2 0 -3 -1 Reinvested earnings 10 9 6 3 2 4 5 4 6 6 -19 18 13 -17 0 2 Ecuador Equity 151 229 278 265 252 227 424 848 985 679 521 470 431 837 579 1 171 Intercompany loans -368 530 -225 -312 66 40 -7 -390 51 -115 -52 687 379 100 -73 -487 Reinvested earnings 411 298 256 213 328 301 310 314 287 200 161 232 170 157 142 145
78 Economic Commission for Latin America and the Caribbean (ECLAC) Chapter I 2007 2008 2009 2010 2011 2012 2013 2014 2015 2016 2017 2018 2019 2020 2021 2022 Grenada Equity 140 128 97 56 39 29 109 58 122 85 122 123 149 130 118 120 Intercompany loans 17 1 2 3 1 0 0 14 -2 20 -6 24 5 -12 -2 4 Reinvested earnings 15 12 5 5 5 5 5 12 34 4 38 40 49 19 23 36 Guatemala Equity 260 177 -33 168 405 448 288 439 772 157 112 212 31 53 2209 53 Intercompany loans -30 153 175 -136 149 318 382 269 -255 392 250 -57 46 40 34 166 Reinvested earnings 515 408 381 626 666 505 809 734 714 625 768 825 899 841 1 219 1 133 Honduras Equity 220 568 84 29 284 310 174 248 137 201 474 120 27 -18 -333 13 Intercompany loans 203 -40 65 378 56 52 250 540 342 -34 79 614 231 -73 -60 257 Reinvested earnings 505 479 360 562 674 697 645 917 838 981 388 647 689 314 1 193 812 Mexico Equity 18 027 13 053 11 008 15 636 9 699 4 316 22 039 5 763 13 449 10 992 11 940 11 323 13 529 6 742 13 665 17 960 Intercompany loans 4 483 7 370 3 278 9 583 3 439 3 251 10 392 4 639 10 846 17 225 9 193 13 220 -1 802 8 642 7 154 4 799 Reinvested earnings 8 510 9 329 5 365 5 306 10 756 10 664 18 497 18 037 11 955 10 682 11 981 13 313 18 179 16 135 12 659 16 173 Nicaragua Equity 0 0 0 0 0 567 360 686 595 446 630 496 247 226 359 308 Intercompany loans 0 0 0 0 0 29 321 235 145 209 55 40 109 44 247 39 Reinvested earnings 0 0 0 0 0 180 285 157 227 335 351 302 147 477 615 946 Panama Equity 719 918 898 948 759 1561 1614 687 77 923 -24 31 -25 -668 119 -123 Intercompany loans 178 136 105 540 1 224 682 550 343 1 599 2 258 2 211 3 557 2 756 -1108 -494 1 253 Reinvested earnings 879 1 348 257 874 1 150 737 1 779 3 429 3 382 2 404 1 790 1 900 1 720 -700 2 135 1 383 Paraguay Equity 22 130 197 112 629 350 445 598 370 320 368 187 282 273 226 157 Intercompany loans 282 -11 -91 292 101 232 -290 31 244 295 178 -265 291 64 -207 14 Reinvested earnings 139 223 49 303 -127 191 211 262 -33 125 -23 296 -170 -242 188 303
79 Foreign Direct Investment in Latin America and the Caribbean • 2023 Chapter I 2007 2008 2009 2010 2011 2012 2013 2014 2015 2016 2017 2018 2019 2020 2021 2022 Peru Equity 733 2 981 1 828 2 445 896 5 387 3 013 -1 786 4 060 2 574 1 944 1 763 2 965 486 -84 1 161 Intercompany loans 924 656 -782 693 2 117 1 459 2 300 2 460 401 906 173 -811 1 404 175 570 1 130 Reinvested earnings 3 835 3 287 5 385 5 317 4 670 7 337 4 258 3 589 2 876 3 325 5 297 4 921 392 129 6 933 8 557 Saint Kitts and Nevis Equity 135 178 132 116 107 106 137 161 132 113 34 39 78 14 19 26 Intercompany loans 3 3 1 1 1 2 0 -7 -7 0 8 -5 2 -5 2 -7 Reinvested earnings 2 2 2 2 4 1 1 2 3 9 6 6 -18 -3 5 -3 Saint Lucia Equity 254 135 135 109 80 54 76 25 83 136 68 64 40 44 57 43 Intercompany loans 8 21 13 13 15 16 10 2 11 11 15 -31 17 10 8 9 Reinvested earnings 15 11 3 4 5 8 9 38 58 14 7 12 18 -7 21 15 Saint Vincent and the Grenadines Equity 102 142 100 91 79 112 157 99 123 99 167 62 77 71 149 74 Intercompany loans 8 8 8 2 2 2 2 15 4 -15 11 -10 2 3 5 5 Reinvested earnings 11 9 2 4 4 1 1 10 -3 -14 -13 -12 -11 -8 7 7 Suriname Equity 0 0 0 0 0 0 0 0 0 0 -205 -184 -276 -265 -295 -212 Intercompany loans -247 -231 -93 -248 -51 113 71 -21 186 254 55 89 96 -32 31 55 Reinvested earnings 0 121 11 69 27 1 291 1 519 246 226 264 298 131 152 Trinidad and Tobago Equity 554 2 322 426 309 517 -251 -1 899 518 -223 -268 -367 -790 137 669 -1 040 -332 Intercompany loans -21 -16 -12 -11 -476 -1 653 769 143 400 245 -104 90 47 387 105 -582 Reinvested earnings 297 495 296 251 0 0 0 0 0 0 0 0 0 0 0 0 Uruguay Equity 550 1 012 990 1 617 1 412 1 242 2 057 1 708 1 422 1 019 646 277 636 905 741 1 045 Intercompany loans 448 540 82 8 263 2 676 -1 704 1 569 2 501 -924 854 332 1 445 -187 -398 4 806 Reinvested earnings 331 554 457 664 828 2 476 634 809 -1 250 -610 1 187 1 117 -611 -192 3 314 3 475
Source: Economic Commission for Latin America and the Caribbean (ECLAC), on the basis of official figures and estimates as at 30 June 2023.
a Data are compiled using the methodology of International Monetary Fund (IMF), Balance of Payments and International Investment Position Manual: Sixth Edition (BPM6), Washington, D. C., 2009, except in the case of the Bolivarian Republic of Venezuela, Guyana, Paraguay and Peru. The methodology of the fifth edition of (2004) is used in part of the series for the following countries: Antigua and Barbuda, Dominica, Grenada, Plurinational State of Bolivia, Saint Kitts and Nevis, and Saint Lucia (2003–2013); Argentina (2003–2005); Dominican Republic (2003–2009); Ecuador (2003–2015); Guatemala (2003–2007); Honduras (2003–2012); Mexico and Nicaragua (2003–2005); Panama (2003–2014); Suriname (2003–2016); Trinidad and Tobago (2003–2010); and Uruguay (2003–2011).
80 Economic Commission for Latin America and the Caribbean (ECLAC) Chapter I 2007 2008 2009 2010 2011 2012 2013 2014 2015 2016 2017 2018 2019 2020 2021 2022 Venezuela (Bolivarian Republic of) Equity -806 302 -3 348 -1 319 -495 -307 -79 67 123 21 20 20 Intercompany loans 773 -11 367 1 457 2 752 3 292 1 784 -1 605 1 051 622 -1 440 -697 Reinvested earnings 3 321 2 336 1 998 1 436 3 483 2 988 975 510 -405 425 1 352 1 563 Total Equity 64 143 78 064 44 484 74 641 96 300 92 749 91 524 80 957 90 142 80 969 86 555 69 106 80 222 50 733 64 986 79 083 Intercompany loans 28 744 39 565 16 446 33 500 35 896 51 387 65 638 62 913 56 068 51 552 20 847 41 152 16 231 17486 12 294 47 244 Reinvested earnings 31 252 31 126 31 205 61 486 76 529 70 651 46 590 49 735 27 034 36 964 52 412 63 283 59 440 34 285 63 004 94 602
Table I.A1.5 Latin America and the Caribbean: FDI stock by country, 2001–2022 (Millions
of dollars and percentages of GDP)
Source: Economic Commission for Latin America and the Caribbean (ECLAC), on the basis of official figures and estimates as at 30 June 2023.
81 Foreign Direct Investment in Latin America and the Caribbean • 2023 Chapter I
2001 2005 2012 2013 2014 2015 2016 2017 2018 2019 2020 2021 2022 2001 2005 2012 2013 2014 2015 2016 2017 2018 2019 2020 2021 2022 Argentina 79 504 55 139 98 706 88 338 89 716 79 773 74 868 80 700 72 589 70 458 85 269 100 119 116 698 27 27 17 14 16 12 13 13 13 16 22 21 19 Belize 355 608 1 738 1 833 1 986 2 051 2 095 2 119 2 237 2 331 2 409 2 538 2 671 32 43 91 90 93 93 93 93 97 96 116 102 90 Bolivia (Plurinational State of) 5 893 4 905 8 809 10 992 11 785 11 598 11 565 12 241 11 835 11 710 10 276 10 586 10 131 72 51 33 36 36 35 34 33 29 29 28 26 24 Brazil 121 949 181 344 731 175 724 781 725 872 568 226 703 328 767 757 737 894 873 979 765 401 901 421 1 027 977 22 20 30 29 30 31 39 37 38 47 52 55 54 Chile 78 089 204 775 210 344 222 558 222 984 236 752 257 748 254 160 257 709 260 715 256 468 274 633 64 77 76 86 92 95 93 86 92 102 81 91 Colombia 15 377 36 987 112 949 128 213 141 810 149 073 164 428 179 334 188 833 204 916 212 299 219 677 233 919 16 25 30 34 37 51 58 58 56 63 78 69 68 Costa Rica 3 600 7 510 22 960 26 938 30 788 34 278 37 309 40 788 44 524 47 753 50 129 53 721 57 380 23 37 49 53 59 61 63 67 71 74 80 83 81 Dominican Republic 25 143 26 660 29 035 31 309 33 820 37 396 40 209 43 038 45 499 48 849 52 810 41 43 43 44 45 47 47 48 58 52 46 Ecuador 6 876 9 861 13 072 13 799 14 571 15 894 16 671 17 300 18 689 19 668 20 763 21 410 22 240 28 24 15 15 14 16 17 17 17 18 21 20 19 El Salvador 2 252 4 167 8 763 8 895 9 314 9 995 10 178 10 351 10 877 11 591 11 832 12 811 12 863 18 28 41 40 41 43 42 41 42 43 47 44 40 Guatemala 3 319 7 071 9 094 10 872 12 228 13 850 15 099 15 587 16 670 17 574 21 367 22 507 12 14 17 19 20 21 21 21 22 23 25 24 Haiti 99 150 900 1 061 1 160 1 265 1 370 1 745 1 850 1 925 2 2 7 7 8 9 10 11 12 14 Honduras 1 585 2 870 9 646 10 671 12 018 13 564 14 900 15 461 16 503 17 029 17 421 18 252 19 104 21 29 52 58 61 65 69 67 69 68 73 64 60 Jamaica 3 931 6 918 12 119 12 664 13 246 14 171 15 077 15 829 16 557 17 222 17 487 17 808 18 126 43 62 82 89 95 100 107 107 105 109 127 122 106 Mexico 212 374 461 350 507 876 502 688 478 453 486 671 544 480 570 381 616 321 592 508 641 678 702 040 24 38 40 38 41 45 47 47 49 54 50 50 Nicaragua 1 565 2 461 5 154 5 892 6 471 7 208 7 935 8 620 9 056 9 240 9 986 11 206 12 500 29 39 49 54 54 57 60 63 70 73 79 79 80 Panama 7 314 10 167 26 762 30 677 35 135 39 629 44 839 55 110 59 869 65 937 62 914 62 118 64 631 56 59 64 65 68 71 75 85 89 95 110 92 84 Paraguay 1 016 1 127 5 560 5 641 6 751 6 315 7 172 8 058 7 937 7 865 7 557 7 910 8 384 12 10 17 15 17 17 20 21 20 21 21 20 20 Peru 11 835 15 889 70 032 79 603 83 866 91 203 98 008 105 421 111 294 116 054 116 845 124 265 135 114 23 21 36 40 42 48 51 50 50 51 58 56 54 Suriname 1 035 1 232 1 397 1 477 1 894 2 034 2 173 2 266 2 275 2 144 2 142 19 22 25 29 57 57 54 54 55 66 59 Trinidad and Tobago 10 984 10 413 10 368 10 049 9 545 9 083 8 452 8 455 10 496 9 701 41 36 35 37 41 38 35 35 50 40 0 Uruguay 2 406 2 844 43 047 42 892 46 951 47 419 46 563 50 404 51 257 51 599 49 868 51 969 62 533 11 15 77 68 75 81 81 78 78 83 93 85 88 Venezuela (Bolivarian Republic of) 39 074 44 518 40 180 33 018 32 016 28 142 23 569 22 175 22 918 32 31 11 10 12 19 12 14 17 Total 304 630 681 246 1 921 932 1 991 526 2 040 372 1 876 304 2 062 404 2 259 255 2 275 684 2 473 738 2 369 523 2 596 017 2 858 403 15 26 32 33 34 37 41 41 43 49 55 53 51
Table I.A1.6
Latin America and the Caribbean: FDI outflows by country, 2002–2022 (Millions
of dollars)
Source: Economic Commission for Latin America and the Caribbean (ECLAC), on the basis of official figures and estimates as at 30 June 2023.
82 Economic Commission for Latin America and the Caribbean (ECLAC) Chapter I
2002 2003 2004 2005 2006 2007 2008 2009 2010 2011 2012 2013 2014 2015 2016 2017 2018 2019 2020 2021 2022 Antigua and Barbuda 14 13 15 17 2 2 2 4 5 3 4 6 6 14 38 12 -1 -11 2 -4 -11 Argentina -627 774 676 1 311 2 439 1 504 1 391 712 965 1 488 1 055 890 1 921 875 1 787 1 156 1 726 1 523 1 177 1 537 2 076 Bahamas 40 72 169 143 333 459 410 217 150 524 158 277 2 679 170 359 151 117 148 157 66 226 Barbados 25 25 54 157 44 82 73 27 345 556 39 40 -229 52 -194 -28 9 28 8 28 0 Belize 0 0 0 1 1 1 3 0 1 1 1 1 3 0 2 0 1 2 4 2 1 Bolivia (Plurinational State of) 3 3 3 3 3 4 5 -4 -29 0 77 -255 -33 -2 89 80 -84 48 -111 91 -336 Brazil 2 479 229 9 822 2 910 28 798 17 061 26 115 -4 552 26 763 16 067 2 083 15 644 20 607 3 134 14 693 21 341 2 025 22 820 -3 467 16 239 30 694 Chile 0 1 819 1 951 1 997 2 027 4 361 8 463 5 806 8 561 16 892 19 935 9 323 10 080 15 851 7 876 2 535 1 847 10 345 6 398 13 946 12 776 Colombia 857 938 192 4 796 1 268 1 279 3 085 3 505 5 483 8 420 -606 7 652 3 899 4 218 4 517 3 690 5 126 3 153 1 733 3 181 3 402 Costa Rica 132 152 206 150 219 430 197 274 318 405 894 804 424 414 493 273 581 24 459 447 701 Dominica 1 0 1 13 3 7 0 1 1 0 0 2 -2 -12 1 -1 0 0 0 0 0 El Salvador 0 0 0 0 0 0 0 0 0 0 0 0 0 0 0 0 0 0 0 0 0 Grenada 3 1 1 3 6 16 6 1 3 3 3 1 7 19 17 4 18 24 -19 -2 6 Guatemala 0 0 0 0 0 0 17 31 50 80 44 30 55 183 209 196 201 180 149 476 389 Honduras 7 12 -6 1 1 2 -1 4 -1 2 208 78 390 365 247 -94 485 419 -103 418 402 Jamaica 74 116 52 101 85 115 76 61 58 75 90 75 59 34 270 34 13 446 7 56 60 Mexico -3 037 1 161 4 559 5 835 6 676 8 332 688 11 663 17 895 11 573 18 775 18 032 5 594 10 978 7 870 3 085 12 121 5 969 5 578 401 17 371 Panama 0 0 0 0 0 0 0 0 0 176 -274 331 329 1 091 933 -338 570 725 -2 535 131 -166 Paraguay 0 0 0 0 0 0 33 63 143 -10 -91 176 448 254 273 441 -1 -130 -24 112 251 Peru 0 -60 0 0 0 -66 -736 -411 -436 -343 2 308 237 837 -663 1 526 1 422 -790 -435 1 631 1 729 -448 Saint Kitts and Nevis 1 2 7 11 4 6 6 5 3 2 2 2 5 -5 -3 6 29 12 3 -2 23 Saint Lucia 5 5 5 4 4 6 5 6 5 4 4 3 -32 23 12 -6 -9 45 -6 -27 41 San Vicente y las Granadina 0 0 0 1 1 2 0 1 0 0 0 0 5 8 -9 21 7 5 2 2 6 Suriname 0 0 0 0 0 0 0 0 0 0 0 0 0 0 0 -2 12 92 1 -9 -13 Trinidad and Tobago 106 225 25 341 370 0 700 0 0 67 189 63 -18 128 -25 -12 65 114 98 768 1 173 Uruguay -14 -15 -18 -36 1 -89 11 -16 60 7 4 154 -2 058 1 838 1 898 1 308 4 724 2 456 79 -491 1 893 6 051 Venezuela (Bolivarian Republic of) 1 026 1 318 619 1 167 1 524 -495 1 311 2 630 2 492 -370 4 294 752 1 024 -399 -1 041 -2 234 -661 0 0 0 0 Total 1 095 6 793 18 336 18 925 43 808 33 019 41 860 20 027 62 834 55 621 53 346 52 104 49 896 38 631 41 248 36 454 25 860 45 626 10 651 41 481 74 677
CHAPTER II
Foreign direct investment in non-renewable energies in Latin
America and the Caribbean: challenges for the energy transition
Introduction
A. The importance of non-renewable energy sources in the energy transition
B. Geographically concentrated reserves and a market dominated by large corporations
C. An industry that generates large foreign capital flows
D. Challenges and opportunities for Latin America and the Caribbean
E. Conclusions
Bibliography
83 Foreign Direct Investment in Latin America and the Caribbean • 2023 Chapter II
84 Economic Commission for Latin America and the Caribbean (ECLAC) Chapter II
Introduction
Internationally concerted efforts to rapidly mitigate climate change have generated major pressure to divest from the hydrocarbons sector. The commitments made by countries and firms to reduce their greenhouse gas (GHG) emissions, over the coming decades, have placed the search for renewable energy sources at the heart of their decarbonization strategies. However, in the face of rising energy prices driven mainly by the conflict between the Russian Federation and Ukraine, the energy transition debate has taken on a new dimension, related primarily to energy security.
Against this backdrop, despite international efforts to decarbonize the sector, it is projected that non-renewables will continue to be a significant source of energy in the coming decades, mainly because of their importance for energy security; and firms are likely to continue to invest in the exploration, refining and commercial exploitation of hydrocarbons. It is essential to assess investment trends in the sector, and the way Latin America and the Caribbean engages with this scenario, to understand how the region participates in global decarbonization initiatives and whether it is prepared for the uncertainties associated with the energy transition.
Although renewable energies in Latin America and the Caribbean have received substantial investment in recent years, the region’s oil, natural gas and coal sectors continue to receive significant amounts of foreign direct investment (FDI). Both conventional and unconventional hydrocarbon deposits have been discovered in the region, such as the Stabroek blocks in Guyana, the pre-salt layer in Brazil and the Vaca Muerta oil shale deposits in Argentina; and these have represented a major source of capital inflows and stimulus for the recovery of economic activity. In Guyana, for example, FDI inflows driven by the hydrocarbons sector grew by 116% in 2021 relative to the previous year’s level, representing 65% of GDP (ECLAC, 2021 and 2022).
The importance of petroleum assets in the region has also generated a substantial volume of cross-border mergers and acquisitions (M&A). In 2022, the oil, natural gas and coal sector generated the third largest number of M&A transactions in Latin America and the Caribbean, accounting for 21% of the total (while renewables ranked fifth with 5%). Investor interest has extended beyond existing assets, for many transnational firms have announced greenfield investment projects, albeit decreasingly until 2022. Since 2010, the amounts announced in renewable energy projects in the region have surpassed those of non-renewables, with the latter’s share dwindling from 24% of total announcements in 2005, to just 5% in 2021. Nonetheless, an increase in announcements of oil, gas and coal projects in the region in 2022, spearheaded by a large project in Guyana, meant that they outweighed renewable energy announcements for the first time in over 10 years. As a result, it remains a leading sector in terms of future investment prospects in the region.
Investments in the sector are subject to uncertainties related to international commitments on transitioning to clean and renewable energy sources; the region’s still incipient environmental and financial regulation; and energy security considerations —both global and regional. The foregoing scenario frames the analysis of this chapter on trends in FDI in the non-renewable energies sector in Latin America and the Caribbean, with a view to providing inputs for decision-making by the region’s governments in relation to the energy transition. Countries that possess hydrocarbon resources face a trade-off between sustainable development and growth driven by the extraction of non-renewable resources.
This chapter analyses some of the factors that are relevant in addressing this problem. Section A provides a brief discussion on one of the greatest dilemmas in the global energy domain, and addresses the position of Latin America and the Caribbean in this regard: there is an urgent need to promote an energy transition to meet internationally established climate goals; but there is also growing global demand for energy and no capacity to satisfy this demand today from renewable sources. To complete this dilemma, an appetite to explore and produce fossil fuels still exists in countries
85 Foreign Direct Investment in Latin America and the Caribbean • 2023 Chapter II
where the revenues to be extracted from such resources are of vital importance in overcoming the challenges of inclusive and fair development. Section B makes a brief overview of the sector at the global level, considering reserves and the production and consumption of non-renewable energies, and the value chain of the oil and natural gas industry,1 followed by a presentation of the leading firms in the sector at the global and regional levels. Section C then analyses global and regional FDI trends in the sector; and, lastly, section D analyses the challenges and opportunities facing Latin America and the Caribbean —including the challenges posed by stranded assets and the need to consider carbon dioxide capture and storage technologies. This section also considers the best instruments to enable the exploitation of resources such as oil and natural gas to make a more significant contribution to productive development in the region.
A. The importance of non-renewable energy sources in the energy transition
1. Most final energy consumption is obtained from non-renewable sources
As their name suggests, non-renewable energy sources are finite or exhaustible, since they are being consumed faster than nature can replace them (EIA, 2022a; EPE, n.d.). Non-renewables include fossil fuels (mainly coal, oil, natural gas and their by-products), along with nuclear energy, which will not be considered in this analysis (see table II.1).
Coal Oil
Heavy oil
Tar sands
Bituminous shale
Natural gas
Methane hydrates
Renewables
Nuclear energy
Hydropower
Solar energy
Wind energy
Biomass
Geothermal energy
Ocean energy
Source: Economic Commission for Latin America and the Caribbean (ECLAC), on the basis of Empresa de Pesquisa Energética (EPE), “Fontes de energia” [online] https://www.epe.gov.br/pt/abcdenergia/fontes-de-energia and G. J. Suppes and T. S. Storvick, Sustainable Power Technologies and Infrastructure: Energy Sustainability and Prosperity in a Time of Climate Change, Elsevier, 2016.
1 Although global coal consumption increased by 6% in 2021 over the previous year, and is expected to grow by a further 1.2% in 2022 (reaching 8,025 Mt, which represents a record since 2013, according to the International Energy Agency (IEA, 2022d)) it is used relatively little as an energy source in Latin America and the Caribbean. Furthermore, although coal is a fossil fuel like oil and gas, it has different extraction methods and a completely different value chain, different market dynamics and regulatory frameworks governing its extractive production and consumption. For these reasons, the following sections will not analyse the coal value chain, nor consider the market dynamics of this fossil fuel.
86 Economic Commission for Latin America and the Caribbean (ECLAC) Chapter II
Energy sources Non-renewables Fossil sources
Table II.1
Fossil fuels are the world’s main energy source, not only because of their high energy yield and the rapid development and spread of exploration, production and distribution infrastructures (mining in the case of coal; or onshore and offshore platforms, power plants, pipelines, tankers, railways, roads, among others), but also because of their versatility of use and feasibility of transportation and storage. Fossil energy sources are used widely to generate electricity and heat, but also as fuel in combustion engines, as raw material for the petrochemical industry and in the production of synthetic nitrogen (EPE, n.d.; Smil, 1994). In 2019, transportation accounted for 65% of final consumption of oil and 7% of the consumption of natural gas. In manufacturing, oil and natural gas are used mainly to power industrial processes (7% of final consumption of oil and 38% in the case of natural gas); or else they serve as industrial inputs (“non-energy use”), primarily in the petrochemical industry (17% of final consumption of oil and 12% of natural gas) (IEA, 2021a; SBTi, 2020) (see figure II.1).
Source: Economic Commission for Latin America and the Caribbean (ECLAC), on the basis of International Energy Agency (IEA), “Final consumption”, Key World Energy Statistics 2021, Paris, 2021. Note: One exajoule is equivalent to 277,778 GWh.
Fossil fuels are today’s most heavily consumed energy source (see figure II.2). According to the International Energy Agency (IEA, 2022a), 65% of global energy consumption came directly from fossil sources in 2020, primarily oil derivatives (38% of total consumption), natural gas (17%) and coal, peat and bituminous shale (10%). Electricity production represented 20% of world energy consumption in the same year, and renewable energies accounted for 17%.
Fossil sources are also very important. In 2020, 62% of electricity was generated from fossil fuels, 28% from renewables and 10% from nuclear energy (see figure II.3A). In the same year, the electricity sector absorbed 59% of all coal used globally, along with 34% of natural gas, 4% of oil, 52% of all renewables and nearly 100% of nuclear energy (IEA, 2022d).
87 Foreign Direct Investment in Latin America and the Caribbean • 2023 Chapter II
Figure II.1
0 20 40 60 80 100 120 Non-energy use Residential use Transport Manufacturing industry Commerce and public utilities Other uses Oil Natural gas
Total oil and natural gas consumption by sector, 2019 (Exajoules)
Total final energy consumption by energy product, 2000–2020 (Exajoules)
Renewable sources and residues
Natural gas
Coal, peat and bituminous shale Crude oil, liquefied natural gas (LNG), and raw materials
Petroleum derivatives
Source: Economic Commission for Latin America and the Caribbean (ECLAC), on the basis of “World energy balances highlights”, 2022 [online] https://www.iea.org/data-and-statistics/data-product/world-energy-balances-highlights.
Figure II.3
World and Latin America and the Caribbean: energy sources used for electric power generation, 2020 (Percentages of gigawatt hours)
A. World B. Latin America and the Caribbean
Nuclear energy (2)
Renewable sources (28)
Nuclear energy (10)
Fossil fuels (62)
Fossil fuels (36)
Renewable sources (62)
Source: Economic Commission for Latin America and the Caribbean (ECLAC), on the basis of “World energy balances highlights”, 2022 [online] https://www.iea.org/data-and-statistics/data-product/world-energy-balances-highlights and Latin American Energy Organization (OLADE), Panorama Energético de América Latina y el Caribe 2021, Quito, 2022.
In contrast, in Latin America and the Caribbean, 62% of electricity is generated from renewables, mainly hydropower, which accounts for 46% of the total (see figure II.3B). Apart from the prominence of renewables in power generation, the predominance of the various sources in the energy balance is broadly the same as in the rest of the world: in 2020, 65% of the energy supplied came from fossil sources, with 30% derived from oil, 30% from natural gas and 5% from coal (OLADE, 2022) (see figure II.4).
88 Economic Commission for Latin America and the Caribbean (ECLAC) Chapter II
Figure II.2
0 50 100 150 200 250 300 350 400 450 2000 2001 2002 2003 2004 2005 2006 2007 2008 2009 2010 2011 2012 2013 2014 2015 2016 2017 2018 2019 2020
Heat
Electricity
2. A secure energy transition requires planning and major investments
Compounding the fact that fossil sources are finite, the use of fossil energy is associated with high rates of greenhouse gas (GHG) emissions into the atmosphere. According to the Intergovernmental Panel on Climate Change (IPCC, 2022a), 64% of global anthropogenic emissions2 in 2019 came from carbon dioxide (CO2) produced by the burning of fossil fuels and industrial activities. Another 18% came from methane, with the energy sector accounting for approximately 40% of total emissions of this gas (second only to agriculture) (IEA, 2022c). Apart from contributing to the rise in global temperatures, the burning of fossil fuels generates other externalities, such as ocean acidification and the emission of particulate matter, which is extremely harmful to human health (Bertrand, 2021). It is therefore urgent to rethink and redesign the predominant use of these energy sources in the global energy matrix.
In addition, the commitments made by individual countries under the 2015 Paris Agreement necessitate the transformation of the global energy matrix. To achieve this, total investment in energies needs to be increased, retargeting existing capital towards clean and renewable energy sources, and increasing the direct financing of these technologies. Investment in the sector is expected to grow from 2.5% of GDP today to 4.5% in 2030, mainly in power generation and the associated infrastructures. This investment is likely to come mainly from private sources, influenced, naturally, by public policy and government incentives (IEA, 2021b).
According to projections by BloombergNEF (2022) and IEA (2021b), the coming decades will see a reorganization of the energy market. While total energy consumption is expected to increase, including to meet the demand of the 700 million people who do not have access to modern energy sources, there will be a drastic reduction in the use of fossil fuels (United Nations, 2021). To achieve
2 GHG emissions can be either anthropogenic, that is caused by human activities, or non-anthropogenic (in other words, natural). The latter are produced by plant respiration and decomposition, the release of GHGs by the oceans, forest fires, swamps, and other sources. They are challenging to measure, because of their variability and the size of the emitting sources; there is also no consensus on their magnitude (ICOS n.d.; Yue and Gao 2018). Efforts to mitigate the effects of climate change focus on anthropogenic emissions, in other words those caused mainly by the burning of fossil fuels, deforestation, agriculture, and industrial activities, which have unequivocally caused global warming (ICOS n.d.; IPCC 2023).
89 Foreign Direct Investment in Latin America and the Caribbean • 2023 Chapter II Figure
Natural gas (30) Coal (5) Hydropower (9) Geothermal (1) Nuclear energy (1) Other primary sources a (24) Oil (30)
II.4 Latin America and the Caribbean: total energy supply by source, 2020 (Percentages)
Source: Economic Commission for Latin America and the Caribbean (ECLAC), on the basis of Latin American Energy Organization (OLADE), Panorama Energético de América Latina y el Caribe 2021, Quito, 2022. a Biogas, vegetable waste, sugarcane products, firewood, solar and wind energy.
net zero GHG emissions by 2050 (see box II.1), major changes are needed in the global energy matrix, especially in the manufacturing sector, where electricity consumption is set to rise from 20% in 2022 to 35% in 2050 under the net zero scenario. In the same year, coal and natural gas consumption will account for just 5% and 8% of the mix, respectively (BloombergNEF, 2022). This would represent a total investment opportunity of US$ 194 trillion by 2050, in both demand and supply-side projects. Of this total, an estimated 47% would be channelled to the electric vehicle industry and 24% to low-carbon power generation. Considering investments in energy supply alone, for every dollar spent on fossil fuel production in 2030, US$ 2.9 would be invested in clean energy sources, rising to US$ 4.9 in the 2030s and US$ 9.7 in the 2040s (BloombergNEF 2022).
Box II.1
The role of the energy sector in the net zero CO2 emission targets
Climate change is already having tangible effects on people, economies and ecosystems around the world, owing especially to the increased prevalence of extreme weather events. The decade between 2011 and 2022 is considered the warmest on record; and the greater intensity and frequency of such phenomena, including more severe storms, increased droughts, species loss and food shortages, are direct consequences of climate change (United Nations, n.d.).
To mitigate these effects, 196 countries signed the Paris Agreement in 2015 (which entered into force in 2016) to limit global warming to well below 2ºC, with ambitions of 1.5ºC, compared to pre-industrial levels (UNFCCC, n.d.). The chances of restricting global warming to 1.5ºC are greater if the net zero CO2 emissions target is achieved by 2040 (IPCC, 2022).
According to the IPCC (2022) definition, net-zero CO2 emissions are the level at which all anthropogenic CO2 emissions are globally balanced by anthropogenic CO2 removal over a given period. To attain this level, the first step is to adopt emission mitigation measures, which consist of reducing GHGs released into the atmosphere. The energy sector has a key role to play in this regard, since 75.6% of current emissions are associated with this sector. The remaining GHG emissions would be offset by actions to remove carbon from the atmosphere, which can occur through reforestation or the development and diffusion of carbon capture and storage technologies, among other measures (Ge, Friedrich and Vigna, 2020; Levin and others, 2023).
In the case of CO2 emissions related to energy combustion and industrial processes, according to the IEA net zero CO2 emissions scenario (IEA, 2022), CO2 emissions would have to be reduced from the current 36.8 Gt to 23 Gt in 2030 and to zero in 2050, with an additional 75% reduction in energy-related methane emissions in 2030. These scenarios pose a major challenge, given the levels of ambition implied in current policies.
The first step to achieving zero net CO2 emissions by mid-century requires eliminating all use of fossil fuels from the global energy matrix, and shifting to energy sources that are considered clean, such as wind, solar, other renewable energy sources and nuclear energy (BloombergNEF, 2022). In addition, the widespread adoption of energy efficiency measures is considered essential, first and foremost in terms of the use of new construction and insulation materials. This will need to be matched by the use of new technologies and more efficient installations, and a change in society’s behaviour involving the adoption of new production and consumption habits. Another necessary measure is the electrification of machinery and equipment that previously operated with combustion engines, powered by natural gas or other fossil or less efficient fuels, both from the industrial point of view and at the individual level. Examples include new domestic electric heaters and electric stoves to replace those that burn gas or biomass. Moreover, in the transport sector, greater use will need to be made of electric vehicles and, in manufacturing, the efficient use of raw materials for which production is energy-intensive, such as cement and steel (IEA, 2022).
In this context, the demand for fossil fuels by 2050 is likely to be met by current assets and projects already approved, without the need for new investments or new oil exploration and exploitation projects (IEA 2022). Moreover, enterprises in the oil and gas exploration and production sector must not only invest in more efficient processes to reduce their operational emissions; they must also reduce their own production and sale of fossil
90 Economic Commission for Latin America and the Caribbean (ECLAC) Chapter II
fuels, and increase their investments in low-carbon energy sources and technologies to remove carbon from the atmosphere (International Investors Group on Climate Change, 2021). However, the large producers do not display clear, ambitious and transparent targets and strategies for transitioning their business model to the sector’s requirements. According to the World Benchmarking Alliance (WBA, 2021), of the 100 key firms in the sector that are evaluated in its benchmarking exercise, only 13 have low-carbon transition plans that extend at least 20 years into the future. Four of these are the oil giants Eni, Equinor, Shell and TotalEnergies.
Source: Economic Commission for Latin America and the Caribbean (ECLAC), on the basis of United Nations, “Causes and effects of climate change”, n.d. [online] https://www.un.org/en/climatechange/science/causes-effects-climate-change; United Nations Framework Convention on Climate Change (UNFCCC), “The Paris Agreement: What is the Paris Agreement?”, n.d. [online] https://unfccc.int/process-and-meetings/the-paris-agreement/the-paris-agreement; Intergovernmental Panel on Climate Change (IPCC), “Global Warming of 1.5°C”, An IPCC Special Report on Impacts of Global Warming of 1.5°C above Pre-Industrial Levels in Context of Strengthening Response to Climate Change, Sustainable Development, and Efforts to Eradicate Poverty, Cambridge University Press, 2022; M. Ge, J. Friedrich and L. Vigna, “4 charts explain greenhouse gas emissions by countries and sectors”, World Resources Institute (WRI), 6 February 2020 [online https://www.wri.org/insights/4-charts-explaingreenhouse-gas-emissions-countries-and-sectors; K. Levin and others, “What does ‘net-zero emissions’ mean? 8 common questions, answered”, WRI, 20 March 2023 [online] https://www.wri.org/insights/net-zero-ghg-emissions-questionsanswered; International Energy Agency (IEA), World Energy Outlook 2022, Paris, 2022; BloombergNEF, “New Energy Outlook 2022. Executive summary”, 2022 [online] https://bnef.turtl.co/story/neo–2022/page/3?teaser=yes; Institutional Investors Group on Climate Change (IIGCC), Net Zero Standard for Oil and Gas Companies, 2021; and World Benchmarking Alliance (WBA), Climate and Energy Benchmark in Oil and Gas: Insights Report, 2021.
Despite the emphasis on investments in renewables, to achieve a safe and orderly energy transition it is necessary to plan the demand for and supply of non-renewable energy in the short, medium and long terms (IEA, 2022d). In a scenario in which electricity generated from renewable sources predominates, large-scale investments will be needed in transmission and distribution infrastructure, such as underground and submarine transmission cables, high voltage direct current (HVDC) lines, and others. These investments require both large-scale resources and also time to become viable (BloombergNEF, 2022). However, since 2015, the level of investment in clean energy has been below that needed to transform the global energy system (IEA, 2022d).
Another challenge is the fact that the supply of some renewable energy sources, such as solar and wind, is highly variable; and this variability will likely be intensified by changes in weather patterns. Nonetheless, it can be mitigated by improvements in stationary energy storage technologies (IEA, 2022d), supported by non-intermittent generation and interconnectivity between different regions. On this point, stationary storage sources (batteries) are already facing production bottlenecks, because they rely on metals such as lithium, cobalt and nickel, some of which are relatively scarce in nature. According to BloombergNEF (2022), the energy transition will demand 17.5 times more lithium in 2050 than was consumed in 2020. Jiménez and Sáez (2022) suggest that the demand for lithium already exceeded supply in 2021; and, although new exploration projects for the metal, in conjunction with recycling technologies, offer solutions for overcoming this bottleneck, the short-term scenario is uncertain. According to ECLAC estimations, the expansion of electricity capacity in Latin America and the Caribbean over the next 10 years, with an emphasis on renewable energies and regional integration, is projected to require 611,000 tons of copper, 53,300 tons of nickel, 2,500 tons of cobalt and 2,100 tons of lithium (ECLAC, 2023a).
All of these factors suggest that non-renewable energies will remain important in the coming decades. This will contribute not only to the avoidance of major imbalances between energy supply and demand, the consequences of which were seen in 2022 owing to interruptions in the supply of natural gas in the context of the conflict between the Russian Federation and Ukraine, but also to ensuring sufficient flexibility to adapt to global shocks and the way investments are allocated, thereby contributing to energy security (IEA, 2022d).
91 Foreign Direct Investment in Latin America and the Caribbean • 2023 Chapter II
However, for non-renewable sources to guarantee energy security in the period in which the transition is made, the sector needs investment. Even if, in the net zero GHG emissions scenarios, investments in the non-renewable energies sector are limited to current assets and already approved projects, that is without prospecting or exploring for new oil, coal or natural gas reserves, the International Energy Agency states that the lack of resources allocated to the non-renewable energies sector, coupled with investments in renewables that are insufficient to meet energy demand in the medium and long terms, would limit energy supply and pose risks to the global energy market balance in the short term (IEA, 2022d).
In this context, Latin American and Caribbean countries face a number of opportunities and challenges. The recent discoveries of sedimentary basins and unconventional hydrocarbon reserves have the potential to attract FDI and generate employment and income, which are crucial for achieving the Sustainable Development Goals (SDGs). Moreover, the sophistication and diversification of the productive apparatus will be enhanced if policies are implemented to promote them. There are also possibilities for attracting investments in industries related to the other stages of the oil and natural gas value chain. These relate, primarily, to the infrastructure needed for the exploration and commercial exploitation of these hydrocarbons —including the construction and operation of oil and gas pipelines, refineries, storage, processing and export terminals, and associated industries, among other items. On the other hand, given the properties of natural gas as a versatile and less polluting hydrocarbon, its privileged use as a non-renewable energy source in the context of the energy transition makes investing in reserves in Argentina (Vaca Muerta) and in Brazil’s deep waters, an attractive proposition (Arroyo, 2019).
This optimism should be treated with caution, however. If the climate commitments made internationally are actually fulfilled, a lower global demand for oil in the coming years could make its price even more volatile, with a strong downward trend. This would be especially worrisome for the region, since oil and natural gas extraction in unconventional reserves is more expensive and, therefore, could become financially unviable. As a result, investments in exploration and exploitation activities could decrease, and some already discovered reserves could become stranded assets, which would make pre-existing investments extremely unprofitable. This would lead to a decrease in activity in the hydrocarbons sector and, consequently, to a reduction in revenues obtained from the extraction, production, and commercial exploitation of hydrocarbons (Arroyo, 2019).
Accordingly, it is very important to examine investment trends in the oil, coal and natural gas sector, with a special focus on Latin America and the Caribbean. This would afford an understanding of the region’s position and provide insights into how policy makers can leverage these investments to promote economic and social development, without losing sight of the context of the energy transition.
B. Geographically concentrated reserves and a market dominated by large corporations
1. Some countries in the region have large reserves but face challenges in exploiting them
Although final energy use is essentially local, whether stationary (in households, industry, commerce) or mobile (transportation) within the borders of a country or region, the international energy trade is an important component of global exchanges. Given their high energy density and versatility,
92 Economic Commission for Latin America and the Caribbean (ECLAC) Chapter II
non-renewable energy sources (oil, coal and natural gas) are international commodities which are highly profitable to explore, extract, produce and sell. In 2021, exports of these commodities totalled US$ 2.4 trillion at current prices, representing 11.1% of total global exports. Oil alone, in all its forms, accounted for 9.3% (United Nations, 2022).
The reserves of these hydrocarbon resources are highly concentrated geographically. In 2021, half of the world’s proven oil and natural gas reserves were located in the Middle East, while global coal reserves were relatively less concentrated, with 40% of the total found in Asia and 35% in European countries (see figure II.5). Latin America and the Caribbean is the region with the second largest reserves of oil (20%) and has the fourth largest natural gas reserves (5%).
In terms of geographic distribution, the production and consumption of fossil fuels does not coincide with the location of the main reserves. China, Hong Kong (China) and Macao (China) lead the world’s production and consumption, mainly owing to coal production in China. These territories accounted for more than one fifth of fossil fuel production and almost one third of world consumption in 2021 (see figure II.6). The United States is the world’s largest oil producer (20% of the global total in 2021), followed by Saudi Arabia (11%) (EIA, 2022b). Latin America and the Caribbean’s share in both production and consumption is 5% —similar to its share of global reserves in natural gas, but substantially lower in the case of oil production.
Production and consumption data show that Latin America and the Caribbean is a relatively self-sufficient region. It is a net exporter of fossil energy sources overall, but not in the case of natural gas: in 2021, it consumed 2.4 quads more than it produced (see table II.2). In fact, demand for this fuel has been outpacing production since 2003, mainly owing to its use as an input for electric power generation, especially in the manufacturing sector (OLADE, 2015).
93 Foreign Direct Investment in Latin America and the Caribbean • 2023 Chapter II
Figure II.5
Global fossil fuel reserves by region, 2021
7 13 20 2 1 0 50 1 0 8 0 5 4 31 0 48 3 0 2 1 2 17 25 19 2 23 10 0 10 20 30 40 50 60 Africa Other European countries Oceania Middle East European Union Oil reserves (billion barrels) Natural gas reserves (trillion cubic feet) Coal reserves (millions of short tons) North America Other Asia and Pacific economies China, Hong Kong (China) and Macao (China) Latin America
(Percentages of the world total)
and the Caribbean
Source: Economic Commission for Latin America and the Caribbean (ECLAC), on the basis of data from the United States Energy Information Administration (EIA).
Source: Economic Commission for Latin America and the Caribbean (ECLAC), on the basis of data from the United States Energy Information Administration (EIA).
Note: A quad is a unit of energy equal to 1 quadrillion (1015) British thermal units (BTUs).
Source: Economic Commission for Latin America and the Caribbean (ECLAC), on the basis of data from the United States Energy Information Administration (EIA).
This situation of apparent equilibrium in the region as a whole does not extend to all producing countries. Only six were net exporters of oil, coal and natural gas in 2021: the Bolivarian Republic of Venezuela, Colombia, Ecuador, the Plurinational State of Bolivia, Trinidad and Tobago and Suriname. The remainder, including some of the region’s major hydrocarbon producers, such as Argentina, Brazil and Mexico, consumed more than they produced (see figure II.7). The region is highly heterogeneous, and even the availability of resources, sector regulations, the domestic consumption market and business actors vary greatly between producing countries. This forms a diverse panorama, but a number of common challenges can be described.
94 Economic Commission for Latin America and the Caribbean (ECLAC) Chapter II
Figure II.6
of
Production of oil, coal and natural gas Consumption of oil, coal and natural gas 6 19 5 22 14 4 17 12 1 4 18 5 28 8 1 8 19 9 0 5 10 15 20 25 30
Fossil energy production and consumption, 2021 (Percentages
total quads)
Africa North America Latin America and the Caribbean China, Hong Kong (China) and Macao (China)
Other European countries
Oceania Middle East European Union Other Asia and Pacific economies
Table II.2
Total energy production Total energy consumption Oil and other liquids 16.4 14.5 Nuclear and renewables 8.7 8.8 Natural gas 6.3 8.7 Coal 1.8 1.4 Total energies 33.1 33.4
Latin America and the Caribbean: total energy production and consumption by source, 2021 (Quads)
Despite the region’s key position in terms of world oil reserves and the overall balance between production and consumption, it faces major challenges as a hydrocarbon producer. These include the declining productivity of its conventional reserves, which raises the need for continuous investment to maintain competitive and efficient production, even in more mature wells. There is also the problem of guaranteeing the viability of extracting oil and natural gas from unconventional reserves in a context of volatile hydrocarbon prices (see box II.2). Thus, to achieve a productive and internationally competitive sector, it is essential to attract investments that enable innovative exploration and production technologies to be developed and logistical improvements to be made (Bulgheroni, 2017).
Lastly, as will discussed section D, foreign direct investment in the sector is not always directed to where the world’s largest reserves are located.
2. A lucrative industry in which large state-owned corporations coexist with transnationals
(a) The hydrocarbon industry value chain
The oil and natural gas value chain consists of three well-defined stages, which are described below. Despite some similarities, each of the sources has specific features.3 Nonetheless, a firm in the sector may integrate its actions in more than one stage of the value chain, as explained below (Tordo, Tracy and Arfaa, 2011).
3 Crude oil and natural gas are often extracted concomitantly, giving rise to the notion of “associated gas” (McLean, Charles and Rajkumar 2021).
95 Foreign Direct Investment in Latin America and the Caribbean • 2023 Chapter II
Oil Natural
-2.5 -2.0 -1.5 -1.0 -0.5 0 0.5 1.0 1.5 2.0 2.5 Antigua and Barbuda Argentina Barbados Belize Bolivia (Plur. State of) Brazil Chile Colombia Costa Rica Cuba Dominica Dominican Rep. Ecuador El Salvador Grenada Guatemala Guyana Haiti Honduras Jamaica Mexico Nicaragua Panama Paraguay Peru Saint Kitts
Saint Lucia Saint Vincent and the
Suriname Bahamas Trinidad and Tobago Uruguay Venezuela (Bol.
Figure
II.7 Latin America and the Caribbean: net production of oil, coal and natural gas, 2021
(Quads)
gas Coal
and Nevis
Grenadines
Rep. of)
Source: Economic Commission for Latin America and the Caribbean (ECLAC), on the basis of data from the United States Energy Information Administration (EIA).
Activities of prospecting, exploration (both on and offshore, and both conventional and unconventional),4 production and decommissioning (upstream) form the first stage. This is the stage of highest risk in the industry’s value chain and, consequently, the stage of highest potential return (Álvarez and others, 2018; IRBC, 2019).
The second stage consists of crude oil and natural gas transportation and storage activities (midstream). The transportation of crude oil comprises all the infrastructure necessary to move it from the point of production to the refineries. It requires crude oil storage terminals, pipelines and oil tankers, among other items. The transportation of natural gas requires an infrastructure network consisting of pipelines and terminals. Given its physical properties, natural gas has to be transported and stored under high pressure, which requires specific and more expensive infrastructures. Liquefaction, one of the first stages in its processing, makes it easier and safer to transport, thereby expanding the markets for this energy source. Natural gas can also be transported in tanker trucks. Although this modality is more expensive and less flexible in terms of demand and supply, it enables the fuel to reach more distant markets (Álvarez and others, 2018; McLean, Charles, and Rajkumar, 2021).
Activities in the third stage comprise the refining or processing of crude oil and natural gas, together with its distribution, sale, and final use (downstream). The refining process, which is not necessarily done in the producing country, adds value by transforming crude oil into petroleum products such as gasoline, diesel or liquefied petroleum gas (LPG) for final consumption (Álvarez and others, 2018). Although refining activities provide an economically attractive opportunity for non-producing countries to enter the hydrocarbons value chain, the activity is only economically viable if operating costs are low, as it depends on the difference between crude oil prices and the average price of refinery products, known as the “crack spread” (McLean, Charles, and Rajkumar, 2021).
The refined products reach their end-consumers through various channels, including distribution to gas stations, supply to aircraft and ships, and inputs for industry (Álvarez and others 2018).
Both oil and its derivatives and natural gas can be transformed into a wide range of products in the petrochemical industry. These include synthetic fibres, tyres, plastics, packaging, fertilizers, digital devices and many articles, the manufacture of which generated 12% of global oil demand in 2018 (IEA, 2018). Despite its crucial importance, the study of the petrochemical sector is beyond the scope of this analysis.
(b) The leading firms in the hydrocarbon market
Broadly speaking, the firms in the sector can be divided into national (state-owned) oil companies and international oil companies. Examples of large state-owned firms include Saudi Aramco of Saudi Arabia, Rosneft of the Russian Federation and the China National Petroleum Corporation (CNPC). The second category includes the western giants TotalEnergies (France), BP (United Kingdom), Shell (United Kingdom/Kingdom of the Netherlands), Chevron and Exxon Mobil (both United States), also known as “big oil” (Guttman, 2020).
Some national oil companies operate only in the upstream stage of the domestic market, such as the National Iranian Oil Company (NIOC) of the Islamic Republic of Iran; others are firms with highly vertical and international operations (“quasi-international firms”), as exemplified by Petronas of Malaysia. Their evolution and expansion will depend above all on government strategy, related, for example, to the need to diversify the country’s energy supply and to support the political and strategic decisions of the respective host country government (Guttman, 2020; Ledesma 2009).
96 Economic Commission for Latin America and the Caribbean (ECLAC) Chapter II
4 Unconventional hydrocarbons include heavy oils, tar sands, and bituminous shale (see box II.2).
National or state-owned oil companies control an estimated 85% of the world’s hydrocarbon reserves, which affords them a comfortable monopolistic position. In contrast, international oil companies are forced to expand their access to international reserves by participating actively in exploration, and in research and development, especially with regard to new technologies (Guttman, 2020; Electricidad 2010).
International oil companies tend to operate in a more efficient and short-term results-oriented manner, which often facilitates their access to financial resources (Guttman, 2020; Ledesma, 2009) but it also leaves them more vulnerable to transactional risks, and especially reputational risks, and those related to changes in legislation and financing regulations owing to issues such as climate change.
There are other factors that influence the structure and integration strategies of firms participating in the hydrocarbon value chain. In particular, horizontal integration is sought mainly to achieve economies of scale, which are crucial in an industry in which investments are highly capital-intensive. The main objectives include not only reducing operating costs and sharing infrastructure, but also accessing new markets and reducing the risk associated with investments concentrated in a single country, especially in a sector that is highly susceptible to geopolitical conflicts (Tordo, Tracy and Arfaa, 2011).
In contrast, vertical integration focuses first and foremost on optimizing logistical operations: for example, in the case of oil, the aim is to integrate the extraction, production, storage and refining stages; or, in the case of natural gas, the aim is to integrate extraction, storage, liquefaction and transportation. This makes it possible to mitigate the risks associated with either the geological specifics of the product5 or the ease with which it can be exported, or both (Tordo, Tracy and Arfaa, 2011).
The vertical and horizontal integration decisions of firms in the hydrocarbon market are also influenced by the international price of these raw materials. When prices are falling, firms in the sector tend to consolidate their operations in the same geographic region, taking advantage of economies of scale and lower operating costs. In periods of rising prices, firms attempt to enter new markets, either geographically or in relation to the product (for example: the acquisition of firms operating in the exploration and production of unconventional resources by firms specialized in conventional exploration, as occurred in the United States in the decade of 2000) (Evans, Nyquist, and Yanosek, 2016).
Whatever their shareholding arrangement or scope of operation, both national and international oil companies have come under intense international public scrutiny. At the World Economic Forum in Davos in January 2023, United Nations Secretary General Antonio Guterres declared that the business model of fossil fuel firms is “inconsistent with human survival” (United Nations, 2023). Despite this, the major western firms in the sector (BP, Chevron, ExxonMobil, Shell and Total Energies) earned income of US$ 200 billion in 2022. The Arab firm Saudi Aramco alone reported net income of US$ 130.23 billion in the first nine months of 2022 (Saudi Aramco, 2022; Bousso and Valle, 2023; The New York Times, 2022).
These are all large firms; and, in fact, 22 of the world’s 100 largest firms (by revenue) in 2022 were in the energy sector (Fortune, 2022), with 64% of them operating vertically in the oil and natural gas sector (see table II.3). Of these 22, nine were of European origin (41%), seven were Chinese state-owned (32%), and five (23%) were from the United States.
97 Foreign Direct Investment in Latin America and the Caribbean • 2023 Chapter II
5 An example is the oil extracted from Kuwait, which is considered very heavy and difficult to refine. The fluctuation of its market demand has led this Arab country to invest in the storage and refining stages to boost its product’s participation in the international market (Tordo, Tracy and Arfaa, 2011).
Table II.3
Largest firms in the non-renewable energies sector worldwide by income, 2021
Source: Economic Commission for Latin America and the Caribbean (ECLAC), on the basis of Fortune, Global 500”, 2022 [online] https:// fortune.com/ranking/global500/; Bloomberg; Financial Times, fDi Markets, and reports from the respective companies.
Notes: The electricity suppliers included are those that use some type of non-renewable energy in their generation. The firms in the shaded rows are national oil companies.
a Prospecting, exploration, production and decommissioning activities (upstream); crude oil and natural gas transportation and storage activities (midstream); and crude oil and natural gas refining or processing, distribution, sale and end-use activities (downstream).
b Midstream and downstream activities.
In Latin America and the Caribbean, firms in the hydrocarbons sector represent a much smaller share of the largest firms than is the case globally: of the 100 largest firms in the region by total sales revenue, 11 were in the oil and natural gas sector in 2020 (table II.4).
98 Economic Commission for Latin America and the Caribbean (ECLAC) Chapter II
Fortune 500 Firm Parent firm country Sector of operation Income (Millions of dollars) Number of employees (worldwide) 3 State Grid Corporation of China China Electricity supply 460 685 871 145 4 China National Petroleum Corporation (CNPC) China Oil and gasa 435 279 398 440 5 Sinopec Group China Oil and gasa 384 800 385 691 6 Saudi Aramco Saudi Arabia Oil and gasa 359 095 70 496 12 ExxonMobil United States Oil and gasa 276 692 62 000 15 Shell United Kingdom Oil and gasa, Renewables 261 504 87 000 23 Glencore Switzerland Coal, oil and gasa 203 751 81 706 27 TotalEnergies France Oil and gasa 184 634 101 279 35 BP United Kingdom Oil and gasa, hydrogen 157 739 67 600 37 Chevron United States Oil and gas 155 606 43 846 49 Marathon Petroleum Corporation (MPC) United States Oil and gasa 119 983 17 800 52 Gazprom Russian Federation Oil and gasa 138 979 477 600 56 Fortum Finland Electricity supply 132 943 7 712 65 China National Offshore Oil Corporation (CNOOC) China Oil and gasa 126 938 80 957 67 LUKOIL Russian Federation Oil and gasa 128 038 “+” 100 000 69 Shandong Energy Group China Coal 113 179 689 74 Phillips 66 United States Oil and gasb 111 476 14 000 82 Valero Energy United States Oil and gasb 113 977 9 743 85 China Energy Investment (CHN Energy) China Coal 100 408 350 000 89 China Southern Power Grid (CSG) China Electricity supply 104 118 282 006 90 Enel Italy Electricity supply 99 475 65 124 95 Électricité de France (EDF) France Electricity supply 99 897 197 390
Table II.4
Latin America and the Caribbean: largest firms in the non-renewable energies sector by income, 2020
Source: Economic Commission for Latin America and the Caribbean (ECLAC), on the basis of AméricaEconomía, “Conozca las 500 Mayores Empresas de América Latina 2021”, 2022 [online] http://www.americaeconomia.com/negocios-industrias/multilatinas/ conozca-las-500-mayores-empresas-de-america-latina-2021and data from Bloomberg; Financial Times, fDi Markets, and reports from the respective companies.
Notes: The firms in the shaded rows are national oil companies.
a Prospecting, exploration, production and decommissioning activities (upstream); crude oil and natural gas transportation and storage activities (midstream); and crude oil and natural gas refining or processing, distribution, sale and end-use activities (downstream).
b Downstream activities.
c 2016 data.
d 2020 data.
Six of these firms (55% of the total) operate vertically throughout the value chain of the oil and natural gas industry. All of these are national oil companies or firms of mixed ownership, except for Copec of Chile.6 Vertical integration proves advantageous for firms operating in markets that are particularly vulnerable to variations in the price of oil, such as Latin America and the Caribbean. This strategy ensures market share in crude oil production in periods when prices are unfavourable; and it secures the supply of crude oil to refineries at times when prices are more competitive (Al-Moneef, 1998). In general, the region displays the coexistence of different degrees of openness to international capital in the hydrocarbon market, reflecting not only historical but also political conditions and the availability of reserves of the resources in question. In this context, the weight of state-owned firms operating in the hydrocarbons sector will vary, both in terms of market concentration and in their role as key promoters of exploration and exploitation activities, and also as market regulators. It is also important to note that, of the 11 firms highlighted, five are Brazilian (45% of the total). This reflects the size of the hydrocarbon market in Brazil, which is currently the largest oil producer in the region. Although the Brazilian market was liberalized in the second half of the 1990s, the state-owned Petrobras still accounts for 70% of production and remains the leading operator of conventional and unconventional hydrocarbon exploration fields (Campodónico, 2004; Carpenter, 2023; Serrani, 2013).
The second largest firm in the region’s hydrocarbons sector, Petróleos Mexicanos (PEMEX), was created in 1938 and was responsible not only for defining Mexican policy in the sector, but also for managing the foreign assets that were expropriated in that year. Since then, the company has held
99 Foreign Direct Investment in Latin America and the Caribbean • 2023 Chapter II
Fortune 500 rank Firm Parent firm country Sector of operation Income (Billions of dollars) Employees (worldwide) 1 Petrobras Brazil Oil and natural gasa 53.282 370 955 4 Petróleos Mexicanos (PEMEX) Mexico Oil and gasa 44.676 134 500 13 Servgás Distribuidora de Gás Brazil Natural gasa 19.492 176 686 15 Petrobras Distribuidora (Vibra Energia) Brazil Oil and natural gasa 15.961 101 465 16 Ultrapar Brazil Natural gasa 15.931 105 794 22 Ecopetrol Colombia Oil and natural gasa 13.590 10 920c 25 Copec Chile Oil and natural gasa 13.129 38 000 28 Ipiranga Produtos de Petróleo Brazil Oil and natural gasb 12.619 3 355 40 YPF Argentina Oil and natural gasa 9.581 22 932d 77 EP Petroecuador Ecuador Oil and natural gasa 6.146 3 712 100 Primax Peru Oil and natural gasb 4.986 6 019
6 Copec conducts its oil exploration, extraction and production operations through Compañía Latinoamericana Petrolera S.A. (CLAPSA), a subsidiary that operates mainly in Ecuador and Colombia —in which Copec owns 60% of the share capital (Copec 2007).
7 In 1969, the Colombian Congress adopted Law 20, which replaced the concessions regime with association contracts. At that time, the royalties for hydrocarbon exploration activities were increased from 11.5% to 20%, and the remainder began to be shared equally between the beneficiary and Ecopetrol (Espinasa, Medina, and Tarre, 2016).
100 Economic Commission for Latin America and the Caribbean (ECLAC) Chapter II
dioxide capture, utilization, and storage and those of hydrogen (DW, 2022; Martinez Ortiz and Delgado, 2021).
Other state-owned oil companies in the region include Empresa Pública de Hidrocarburos del Ecuador (Petroecuador) in Ecuador, and both Petroperú S.A. and Perupetro S.A. in Peru. Created in 1989 to invigorate hydrocarbon management in the country, Petroecuador began its activities by operating in all phases of the hydrocarbon value chain. The firm assumed the responsibilities of the consortium formed by Corporación Estatal Petrolera Ecuatoriana (CEPE) and Texaco of the United States, established during the nationalization process in the early 1970s. It also took over the management of refineries and pipeline systems. In 2010, Petroecuador underwent a reorganization in which it ceased to operate as a holding company and was consolidated as a public enterprise. Today, Petroecuador is one of the largest firms in Ecuador and is dedicated to the exploration, production, transportation and commercial exploitation of oil and natural gas (EP Petroecuador, 2013). It is also worth noting the different amendments of the hydrocarbon laws in Ecuador with the aim of increasing the share of windfall profits obtained from the rise in the price of oil. In 2006, it was established that 50% of these profits should be delivered to the treasury by the firms operating in the sector. In 2007 the share was raised to 99%, still leaving open the possibility of renegotiation of contracts, which changed the operating conditions for transnational companies in the country (EP Petroecuador, 2013).
In Peru, the sector has two state-owned companies under private law: Petroperú S.A.
and Perúpetro S.A.
Founded in 1969 as part of the nationalization of hydrocarbons in the country, Petroperú S.A. operates in the transportation, refining, distribution and marketing of fuels and other petroleum derivatives in the country. In other words, its operations are mainly in the midstream and downstream stages of the hydrocarbon value chain (Petroperú, 2023). Perúpetro S.A. was created in 1993 as part of the reformulation of the country’s energy and mining sector. Its objective is to represent the Peruvian State in the promotion, negotiation and supervision of contracts for the exploration and exploitation of hydrocarbons in the country (Perúpetro, n.d.).
C. An industry that generates large foreign capital flows
1. North America and Europe lead investments worldwide
Investments in fossil energy are capital-intensive and take a long time to reach maturity; and they are generally sensitive to the prospects for international fossil fuel prices. Thus, the fall in fossil fuel prices that occurred in 2014 and 2015 reduced long-term investments in the sector, especially in the upstream segment: from US$ 890 billion in 2014, investments fell by 45% between 2014 and 2016 and by a further 30% between 2019 and 2020, to reach a level of US$ 353 billion. The drop in total energy consumption resulting from the coronavirus disease (COVID-19) pandemic caused oil and natural gas prices to fall sharply, reaching an average level of US$ 44 per barrel of crude oil in 2020 (IEA, 2022b and 2022d).
In the early months of 2022, a rapid recovery of demand combined with the conflict in Ukraine pushed prices higher; and in 2022 the price of a barrel of crude oil climbed back to US$ 105. This boosted a number of trends that were already visible in the global energy markets, especially in relation to increased trade in minerals that are critical for battery production; and it hastened the development of hydrogen as an energy source. It also highlighted the strategic needs of countries to reduce their reliance on imported fossil energy sources— associated with commitments to mitigate the effects of climate change (IEA, 2022b and 2022d).
101 Foreign Direct Investment in Latin America and the Caribbean • 2023 Chapter II
In this context, there has been a tentative resumption of FDI flows in the sector, especially in response to the discovery of non-conventional energy sources and the dissemination and lower cost of the technologies needed to make their exploitation and commercialization viable.
An initial characteristic of cross-border investments in this sector is that, in terms of amount, new project announcements have generally outweighed purchases of existing assets in recent years. Although the figures are not directly comparable owing to their nature (the former are investment intentions, while mergers and acquisitions refer to completed transactions), project announcements have been the main vehicle through which firms in the non-renewable energies sector have internationalized their businesses. They have proven highly volatile, however (see figure II.8).
Source: Economic Commission for Latin America and the Caribbean (ECLAC), on the basis of data from Financial Times, fDi Markets, and Bloomberg.
The larger size of project announcements reflects not only the scale of investments associated with the discovery of new oil and natural gas reserves, including the infrastructure needed for their production and commercial exploitation, but also the fact that large cross-border mergers and acquisitions took place in periods preceding this study’s the analysis horizon. Moreover, a recent trend in the sector consists of M&A in domestic markets, especially in the United Sates, which are not covered by this study.
Another peculiarity is that the geographic concentration of oil, gas and coal reserves, and also of their consumption and production, have not necessarily been the factors determining where the largest greenfield project announcements were made. In fact, the largest volumes of investments announced in the upstream phase of the oil, natural gas and coal value chain between 2005 and 2022 targeted Africa (22%) and the other Asia-Pacific economies (17%). This mainly reflected the impact of two large projects, one in Angola and the other in Kazakhstan (see figure II.9). The Middle East, where the largest reserves are located, received just 11% of total project announcements in the upstream phase of the value chain in the period analysed, while Latin America and the Caribbean accounted for 14%. Despite their significant participation in the downstream stage, Middle Eastern
102 Economic Commission for Latin America and the Caribbean (ECLAC) Chapter II
Figure II.8
0 20 40 60 80 100 120 140 160 2015 2016 2017 2018 2019 2020 2021 2022 Project announcements Mergers and acquisitions
Global cross-border mergers and acquisitions and project announcements in the oil, coal and natural gas sector, 2015–2022 (Billions of dollars)
countries receive the same share of announcements as countries in Africa (13%), and much less than countries in the Asia-Pacific economies other than China, Hong Kong (China) and Macao (China). As this is an intermediate and very small sector of the oil and natural gas value chain, project announcements classified as midstream do not appear separately from investments in the preceding or succeeding stages of the value chain and, as such, are not present in the database examined.
Africa North America Latin America and the Caribbean China, Hong Kong (China) and Macao (China)
Other European countries Oceania
Other Asia and Pacific economies European Union Middle East
Source: Economic Commission for Latin America and the Caribbean (ECLAC), on the basis of data from Financial Times, fDi Markets. Note: Prospecting, exploration, production and decommissioning activities (upstream); crude oil and natural gas refining or processing activities, distribution, sale and final use (downstream).
The geographical composition can be explained by the fact that FDI flows to oil-producing countries are positively related to market expansion, trade openness, infrastructure endowment and favourable oil price dynamics (Eissa and Elgammal 2020; Yazdanian, 2014). However, Eissa and Elgammal (2020) concluded that the presence of high levels of reserves reduces FDI attraction, owing to the market structure in these countries and the importance of large local national oil companies in the countries’ investments, which enables them to avoid the prevalence of FDI as a funding source. Above all in comparison to other regions, the Middle East has firms that can finance the investments needed in the sector with their own resources or funding. The size of the firms in question is again relevant here: in 2022, Saudi Aramco was the firm with the largest market value in the world, US$ 2.43 trillion in market capitalization in May 2022, surpassing tech giants such as Apple (The Guardian, 2022).
Over a longer time horizon (2005–2022) and compared to project announcements in renewables, project announcements in the oil, coal and natural gas sector crested in 2008, with announced investments close to US$ 280 billion, before dropping back. As of 2019, the renewable energy sector surpassed the conventional energy sector in terms of total value announced, attaining historic levels in 2022 for the energy sector as a whole (see figure II.10). Chapter III contains a discussion of global and regional investments in renewable energies.
103 Foreign Direct Investment in Latin America and the Caribbean • 2023 Chapter II
Figure II.9
of
22 13 10 10 14 7 1 3 12 5 10 5 11 13 17 35 2 9 0 5 10 15 20 25 30 35 40 Upstream Downstream
Global project announcements in the oil, coal and natural gas sector by region of destination and stage of value chain, 2005–2022 (Percentages
total amount)
: Economic Commission for Latin America and the Caribbean (ECLAC), on the basis of data from Financial Times, fDi Markets.
In terms of the stages of the value chain that have become most internationalized through the installation of new capacities, the downstream stage (62%) has been dominated by project announcements in oil, coal and natural gas in the period analysed (see figure II.11).
Source: Economic Commission for Latin America and the Caribbean (ECLAC), on the basis of data from Financial Times, fDi Markets. Note: Prospecting, exploration, production and decommissioning activities (upstream); crude oil and natural gas refining or processing activities, distribution, sale and final use (downstream).
In the downstream stage, the Anglo-Dutch firm, Shell, invested US$ 27.787 billion in its Canadian subsidiary, with a view to building and operating an LNG export facility in Canada in 2018 (Shell Canada, 2018).
In the upstream stage (38% of the total), two key projects were the US$ 36.8 billion investment in the Tengiz oil field in Kazakhstan by Chevron, of the United States, and other associated companies
104 Economic Commission for Latin America and the Caribbean (ECLAC) Chapter II
Figure II.10
(Billions of dollars) 0 50 100 150 200 250 300 350 2005 2006 2007 2008 2009 2010 2011 2012 2013 2014 2015 2016 2017 2018 2019 2020 2021 2022 Oil, coal and natural gas Renewable energies
Global project announcements in the energy sector, 2005–2022
Source
Figure II.11
Downstream (62) Upstream (38)
Global project announcements in the oil, coal and natural gas sector by stage of value chain, 2005–2022 (Percentages of amount)
in 2016 (Nurshayeva, 2016); and the largest foreign investment by a Japanese company thus far, namely that of INPEX in 2006, which invested US$ 32.5 billion in the Ichthys natural gas field in Australia (Austrade, 2023).
Firms based in the European Union account for the largest proportion of the total announced amount (26%), mainly French and Dutch enterprises (8% and 6%, respectively); while the main region of destination for these investments are the Asian economies, excluding China, Hong Kong (China) and Macao (China), which received 27% of the total. This reflects the importance of international oil companies for international capital flows in the sector, since most of these firms are based in advanced economies. Latin America and the Caribbean is the region that receives the fifth largest amount of investment in the sector, absorbing 9% of the total; and it is the lowest ranked region of origin in terms of projects (2% in total) (see figure II.12).
Figure II.12
Global project announcements in the oil, coal and natural gas sector by region of destination and origin, 2005–2022
(Percentages of amount)
A. Region of destination
European Union (7)
Oceania (7)
Other European countries (7)
Latin America and the Caribbean (9)
North America (10)
China, Hong Kong (China) and Macao (China) (3)
B. Region of origin
Other Asia and Pacific economies (27)
Middle East (13)
Africa (17)
Africa (2) Latin America and the Caribbean (2) China, Hong Kong (China) and Macao (China) (3)
Middle East (8)
Oceania (2)
European Union (26)
Other European countries (16)
North America (18)
Other Asia and Pacific economies (19)
Of the total number of mergers and acquisitions in the energy sector worldwide between 2015 and 2022,8 56% were in the oil, coal and natural gas sector. Following the boom in 2016, driven mainly by the US$ 61.871 billion mega-merger between Shell and BG Group, the amount of transactions in the sector declined, albeit posting a slight recovery in 2022, owing mainly to the Saudi Aramco gas pipeline lease and leaseback arrangement with a consortium formed by BlackRock Real Assets and Hassana Investment Company for US$ 15.5 billion (Saudi Aramco, 2021).
The predominance of conventional energy sources over renewables in cross-border M&A has been sustained continuously since 2015, except in 2021 (see figure II.13). At that time, falling international oil and natural gas prices, associated mainly with the effects of the COVID-19 pandemic, acted as a disincentive for the sector. Nonetheless, a change can be detected in the mergers and acquisitions strategy of firms in the conventional energy sector, which have redirected their interests away from building resilience towards the purchase of low-carbon assets, thus already targeting their long term towards the energy transition (Deloitte, 2023).
105 Foreign Direct Investment in Latin America and the Caribbean • 2023 Chapter II
Source: Economic Commission for Latin America and the Caribbean (ECLAC), on the basis of data from Financial Times, fDi Markets.
8 Considered in the Bloomberg database as encompassing oil, coal and natural gas; electricity and gas supply; and renewable energies.
Source: Economic Commission for Latin America and the Caribbean (ECLAC), on the basis of data from Bloomberg.
Table II.5 lists the top 10 cross-border mergers and acquisitions in the non-renewable energies sector in 2015–2022. The firms in question are located mainly in advanced economies (Canada, Sweden, the United Kingdom and the United States), except for three transactions with firms acquired in Saudi Arabia, the Russian Federation and India.
Table II.5
Ten largest cross-border mergers and acquisitions in the non-renewable energies sector worldwide, 2015–2022
(Percentages and billions of dollars)
106 Economic Commission for Latin America and the Caribbean (ECLAC) Chapter II
Figure II.13
(Billions of dollars) 0 20 40 60 80 100 120 140 2015 2016 2017 2018 2019 2020 2021 2022 Oil, coal and natural gas Supply of electricity and gas Renewable energies
Global trend in cross-border mergers and acquisitions in the energy sector (2015–2022)
Year Firm Country of origin Assets acquired Percentage Country of assets Industry Amount (Billions of dollars) 2016 Shell Netherlands BG Group 100 United Kingdom Oil and natural gasa 70.050 2017 Enbridge Inc Canada Spectra Energy 100 United States Oil and natural gasb 28.000 2021 Seven & i Holdings Japan Speedway 100 United States Oil and natural gasc 21.000 2018 Energy Capital Partners (ECP), Access Industries, Canada Pension Plan Investment Board United States, Canada Calpine Corporation 100 United States Electric power generation from natural gasc 17.138 2022 BlackRock Real Assets, Hassana Investment Company and others Singapore, Saudi Arabia, China, United States Saudi Aramco gas supply 49 Saudi Arabia Oil and natural gasa 15.500 2022 Aker BP Norway Lundin Energy 100 Sweden Oil and natural gasa 13.900 2015 Repsol Spain Talisman Energy Inc (Repsol Oil & Gas Canada) 100 Canada Oil and natural gasa 12.949 2016 Rosneft, Trafigura Group and others Russian Federation, India Nayara Energy 98 India Oil and natural gasc 12.909
Source: Economic Commission for Latin America and the Caribbean (ECLAC), on the basis of data from Bloomberg.
a Prospecting, exploration, production and decommissioning activities (upstream).
b Crude oil and natural gas transportation and storage activities (midstream).
c Crude oil and natural gas refining or processing activities, distribution, sale and final use (downstream).
In terms of the total number of mergers and acquisitions, North America continues to dominate the top 10 transactions. Firms from this region acquired the most assets in the oil, coal and natural gas sector (30% in total), with Canadian firms accounting for 21% of all transactions in the sector). Among the latter, US$ 91.853 billion (80% of the total) occurred in the midstream stage of the sector’s value chain. In second place, European Union firms have made significant cross-border acquisitions (27% of the total amount), including purchases by Dutch firms, mainly due to the mega-operations of Shell (now Anglo-Dutch), as shown in table II.4.
North America is the destination of the main transactions (40% of the total amount), with the United States accounting for 35% of the total. Assets in non-EU European countries accounted for 19% of total transactions in value terms in the period analysed, mainly in the United Kingdom (14%) and the Russian Federation (5%) (see figure II.14).
Mergers and acquisitions in the oil, coal and natural gas sector by region of origin and destination, 2015–2022
(Percentages of amount)
A. Region of origin
China, Hong Kong (China) and Macao (China) (3)
Middle East (4)
Oceania (4)
Other Asia andPacific economies
(12)
Latin America and the Caribbean (1)
B. Region of destination
Africa and other countries (1)
North America (30)
Oceania (4)
China, Hong Kong (China) and Macao (China) (1) Africa and other countries (5)
Other Asia and Pacific economies (6)
Latin America and the Caribbean (7)
Middle East (8)
Other European countries (18)
European Union (27)
European Union (10)
Other European countries (19)
North America (40)
107 Foreign Direct Investment in Latin America and the Caribbean • 2023 Chapter II Year Firm Country of origin Assets acquired Percentage Country of assets Industry Amount (Billions of dollars) 2016 TC Energy Corporation Canada Columbia Pipeline Group Inc 100 United States Oil and natural gasb 12.026 2016 Acquisition among several firms Switzerland, Qatar Rosneft Oil Co PJSC 19.5 Russian Federation Oil and natural gasa b c 11.281
Figure II.14
Source: Economic Commission for Latin America and the Caribbean (ECLAC), on the basis of data from Bloomberg.
The momentum of cross-border capital movements in the oil and natural gas sector has thus been concentrated in the United States and Europe, which are the origin and destination of over half (by amount) of transactions closed between 2015 and 2022. The regions ranked next are the Middle East and Latin America and the Caribbean as destinations for the investments, and the other Asia-Pacific economies and Oceania as the origin of the capital invested.
2. Transnationals from other regions lead investments in Latin America and the Caribbean
Inward FDI in the non-renewable energies sector in Latin America and the Caribbean reflects not only the high volatility inherent to the sector, which stems mainly from fluctuations in the prices of such energy sources on international markets, but also the discovery of new hydrocarbon sources in the region and changes in the structure of local markets. The regulation of foreign capital inflows into the industry is a key factor in understanding the dynamics of FDI in the sector.
It is possible to identify FDI entering the hydrocarbons sector in six of the region’s countries (Brazil, Colombia, Guyana, Mexico, the Plurinational State of Bolivia, and Trinidad and Tobago).9 Between 2000 and 2022, these six countries absorbed an annual average of US$ 7.214 billion channelled to the sector; and, despite high volatility, Brazil and Colombia generally receive much larger volumes of FDI in the sector than the other countries (figure II.15).
Source: Economic Commission for Latin America and the Caribbean (ECLAC), on the basis of official data.
Larger inflows in certain years may be associated with the discovery of oil reserves. An example is Guyana since 2018, where average FDI inflows in the sector rose from US$ 6 million per year in the decade between 2002 and 2011 to US$ 814 million per year in 2012–2021. Since then, FDI in the sector has accounted on average for more than 90% of the country’s total inflows. In the case of Brazil, large inflows occurred following the discovery of the pre-salt reserves in 2006 and after changes were made to the sector regulatory framework, starting in 2016.
9 Countries that publish FDI statistics with a level of disaggregation that is sufficient for sectoral analysis.
108 Economic Commission for Latin America and the Caribbean (ECLAC) Chapter II
Figure II.15
2000 2001 2002 2003 2004 2005 2006 2007 2008 2009 2010 2011 2012 2013 2014 2015 2016 2017 2018 2019 2020 2021 2022 -4 -2 0 2 4 6 8 10 12
Brazil Colombia Guyana Mexico
Latin America and the Caribbean (selected countries): FDI inflows in the hydrocarbons sector (2000–2022) (Billions of dollars)
Bolivia (Plur. State of)
Trinidad and Tobago
In Brazil and Mexico, the hydrocarbons sector absorbed smaller share of total FDI inflows than the other sectors in the last decade (just 10% and 2%, respectively). In contrast, in the Plurinational State of Bolivia, FDI inflows in the hydrocarbons sector averaged 44% of the total between 2012 and 2022, peaking at 69% in 2013. Although declining since then, the sector still receives a large share of total inflows (17% in 2021).
In Colombia, FDI in the oil sector increased after the sector was restructured in June 2003.10 At that time, the state-owned Empresa Colombiana de Petróleo became Ecopetrol S.A. and ceased to perform regulatory functions. The latter were taken over by the National Hydrocarbons Agency (ANH), which was created at the same time. This change also signalled the country’s incursion into the concessions regime, with the adoption of exploration and production contracts that became more attractive for international investment than the previously existing association arrangement (Espinasa, Medina and Tarre, 2016).
In Mexico, FDI in the oil sector has historically been heavily regulated, except between 2013 and 2018, when mechanisms aimed at loosening the PEMEX monopoly were in operation and attracted large amounts of FDI. From an average of US$ 17 million per year of inward FDI in oil and gas extraction between 2005 and 2013, average inflows grew to US$ 696 million per year in 2014–2022. It is worth noting that only US$ 190 million was reported in the latter year, the smallest inflow since 2013, which may be a result of recent amendments to the Mexican law liberalizing the oil market (Jaramillo, 2021) (see box II.2).
Box II.2
Latin America and the Caribbean: new discoveries and unconventional hydrocarbon sources
Since the middle of the 2000 decade, several of the region’s countries have discovered unconventional reserves with potential for near-term oil and natural gas production, which has already attracted international investors. Unconventional reserves contain oil or natural gas held in low permeability reservoirs, which are considered relatively immobile and therefore cannot be extracted by traditional methods. These hydrocarbons generally need to undergo dilution or upgrading processes before they can be put to commercial use (ISC/World Petroleum Council, 2013; Gordon, 2012). The production of unconventional oil or natural gas is therefore costly and requires a higher return on resources and know-how. This makes it a viable investment only in a context of favourable prices and a future scenario that involves continued expansion of fossil fuel demand (ECLAC, 2022; EIA, 2023). Reserves of this type include the pre-salt deposits in Brazil, deepwater blocks in Guyana and the Vaca Muerta shale reserves in Argentina.
Brazil - Pre-salt
The pre-salt is a sequence of sedimentary rocks formed more than 100 million years ago in the South Atlantic where oil and natural gas deposits have formed under a 2,000-metre-thick layer of salt (Petrobras, n.d.). In 2006, Brazil’s state-owned Petrobras announced the discovery of the first large reserves of commercially valuable light oil in deep rock layers beneath this thick layer of salt. This discovery placed Brazil among the world’s leading oil fields and led to the creation of a new regulatory framework to manage the assets in question, including the production sharing system, the sovereign Social Fund, and the creation of Pré-Sal Petróleo S.A (a state-owned firm to manage the assets), among other measures related to the discovery (Viana, 2012).
Since the first discoveries, six rounds of bidding have been held for pre-salt exploration under production sharing arrangements. A total of 15 blocks were awarded to consortiums formed by 29 foreign firms, culminating in the collection of some US$ 12.882 billion in signing bonuses and about US$ 1.067 billion for the minimum exploratory programme (which includes the commitment to carry out activities such as seismic surveys and the drilling of exploratory wells) (ANP, n.d. and 2021).
109 Foreign Direct Investment in Latin America and the Caribbean • 2023 Chapter II
10 Decree 1760 of 26 June 2003.
However, management of the pre-salt blocks and their resources has proven complex. The 2019 bid under the sharing arrangement was considered disappointing by the Brazilian government. This gave rise to discussions on exploration regimes for the pre-salt blocks, considering whether other arrangements, such as the concession regime, could attract more international interest (Nogueira, Viga Gaier and Slattery, 2019). Given the unsatisfactory performance of the state-owned firm’s asset sale program and the international conjuncture of the sector, the new management of the state-owned firm and the newly appointed Brazilian government are expected to bring the issue to the table for discussion.
Guyana - Stabroek
Following the first discoveries of offshore oil deposits in 2015, arising from the exploration and exploitation activities of ExxonMobil of the United States, Guyana has been expanding not only its oil reserves each year, but also the oil produced and the revenues derived from the resources (El Observador, 2022). The share of the oil, coal and natural gas sector in Guyana’s FDI flows averaged 71% between 2016 and 2021, when the first investments linked to discoveries in the Stabroek block were made (ECLAC, 2022). Projections indicate that Guyana will consolidate its position as the world’s fourth largest offshore oil producer by 2035, ahead of countries such as the United States, Mexico and Norway (El Observador, 2022).
The dynamic performance of the sector is supported by the volume of greenfield project announcements in the country. According to the fDi Markets database, whereas projects totalling US$ 8 million were announced in Guyana in 2020 (the first investments in the sector since 2013), a total of US$ 33 million was announced in 2021, and in 2022 the figure surged to US$ 10.033 billion. All of these investments were made in the initial (upstream) phase of the value chain.
In a hydrocarbon market that is increasingly competitive, in terms of both price and carbon intensity, Guyana’s oil is highly competitive. Most of the resources extracted in the country are of the light variety, with low exploration costs and an emissions intensity below the world average (Forbes 2020; El Observador, 2022).
Royalties and tax revenues from exploration of the resource are projected to total US$ 13 billion by 2029 (Forbes, 2020). These figures highlight the economic importance of oil production for Guyana, and the potential for the country’s future productive development represented by the use of these resources.
Argentina - Vaca Muerta
Located in the Argentine province of Neuquén, Vaca Muerta is a geological formation of about 30,000 square kilometres containing oil and natural gas at a depth of more than 2,500 metres (YPF, n.d.). Although the reserves located in the formation have been known about since 1931, it was only in 2010 that the first wells were drilled and the feasibility of exploiting the enormous oil and natural gas potential found there was discovered (IAPG, n.d.).
Located in a shale-type geological formation, with very little porosity and virtually impermeable, its extraction only gained momentum with the spread of exploration technologies such as fracking, developed and widely employed in the United States in a context of high oil prices, when this became economically viable (López Anadón, 2015).
According to the Argentine government, in 2018 Vaca Muerta contained the second largest unconventional natural gas reservoir in the world and the fourth largest unconventional oil reservoir. Thirty-one firms are expected to have a stake in the venture, with Argentina’s state-owned YPF holding the concession for 40% of the Vaca Muerta area. Nonetheless, its development has been attracting great attention from international investors: since 2010, the province of Neuquén has received 49% of the total amount of project announcements in the oil and gas sector in Argentina. This includes two key projects launched by foreign firms. The first is an investment by Chevron, amounting to US$ 16.2 billion over a 35-year period. Although the project covers only 1% of Vaca Muerta, the province of Neuquén is expected to receive US$ 8.5 billion from YPF for this purpose (YPF, n.d.).
110 Economic Commission for Latin America and the Caribbean (ECLAC) Chapter II
Another company with prominent operations in the region is Petronas of Malaysia, which in 2018 announced a total project of US$ 2.3 billion. Although its investment in Vaca Muerta represents just 0.6% of the total area of the geological formation, the Malaysian firm’s investments could amount to US$ 7 billion over a 20-year period (Ministry of Economy, 2018; YPF, n.d.).
Source: Economic Commission for Latin America and the Caribbean (ECLAC), on the basis of International Systems and Communications Limited (ISC)/World Petroleum Council, World Petroleum Council Guide: Unconventional Oil, London, 2013; D. Gordon, “Understanding unconventional oil”, The Carnegie Papers, Washington, D.C., Carnegie Endowment for International Peace (CEIP), 2012; ECLAC, Foreign Direct Investment in Latin America and the Caribbean, 2022 (LC/PUB.2022/12-P), Santiago, 2022; Energy Information Administration (EIA), “Oil and petroleum products explained: where our oil comes from”, April 2023 [online] https://www.eia.gov/energyexplained/oil-and-petroleum-products/where-our-oil-comes-from-in-depth.php; Petrobras, “Pré-Sal”, n.d. [online] https://petrobras.com.br/pt/nossas-atividades/areas-de-atuacao/exploracao-eproducao-de-petroleo-e-gas/pre-sal/‘; C. R. C. Viana, “A evolução do monopólio do petróleo e o novo marco regulatório do pré-sal”, Revista Brasileira de Direito do Petróleo, Gás e Energia, vol. 3, 2012; National Agency of Petroleum, Natural Gas and Biofuels (ANP), “Resultados”, n.d. [online] https://www.gov.br/anp/pt-br/rodadas-anp/rodadas-concluidas/resultados/ resultados [accessed on 26 March 2023]; ANP, “Os regimes de concessão e de partilha”, 2021 [online] https://www.gov. br/anp/pt-br/rodadas-anp/entenda-as-rodadas/os-regimes-de-concessao-e-de-partilha; M. Nogueira, R. Viga Gaier and G. Slattery, “Leilão do pré-sal decepciona; governo avalia mudança após atuação da Petrobras”, 7 November 2019 [online] https://www.reuters.com/article/energia-aram-idLTAKBN1XH1SB; El Observador, “Guyana: la producción petrolera offshore podría superar la de Estados Unidos, México y Noruega”, 4 August 2022 [online] https://www.elobservador.com.uy/nota/ guyana-la-produccion-petrolera-offshore-podria-superar-la-de-estados-unidos-mexico-y-noruega–202284211119; Financial Times, fDi Markets [online database] https://www.fdimarkets.com/; Forbes, “Guyana: global oil’s new king of the heap”, 6 March 2020 [online] https://www.forbes.com/sites/woodmackenzie/2020/03/06/guyana-global-oils-new-kingof-the-heap/; YPF, “Vaca Muerta”, n.d. [online] https://www.ypf.com/desafiovacamuerta/Paginas/index1.html; Instituto Argentino del Petróleo y del Gas (IAPG), “Vaca Muerta”, n.d. [online] http://www.shaleenargentina.com.ar/vaca-muerta [accessed on 26 March 2023]; E. López Anadón, El abecé de los hidrocarburos en reservorios no convencionales, IAPG, Buenos Aires, 2015; Ministry of Economy, “YPF y Petronas invertirán USD 2300 millones en Vaca Muerta para el desarrollo de petróleo no convencional”, 4 December 2018 [online] https://www.argentina.gob.ar/noticias/ypf-y-petronas-invertiranusd-2300-millones-en-vaca-muerta-para-el-desarrollo-de-petroleo.
As is happening in the rest of the world, the internationalization of the region’s oil, coal and natural gas sector entailed more new investment project announcements than mergers and acquisitions (see figure II.16). The amounts of project announcements and mergers and acquisitions cannot be directly compared, however, because the former are merely investment intentions whereas the latter are accomplished transactions. Nonetheless, during the period under review, the region announced investments in greenfield projects averaging approximately US$ 9.15 billion per year, compared to an average of US$ 5.723 billion per year in the case of M&A. However, the inherent volatility of the hydrocarbons sector makes it difficult to identify a clear pattern or trend, since large announcements or transactions generate significant year-on-year variations.
Comparing the amounts of project announcements and cross-border mergers and acquisitions in Latin America and the Caribbean in 2015–2022 reveals that transnational firms wishing to invest in the countries of the region tend to use different instruments, depending on the stage of the value chain in which the venture is located, and according to their pre-existing presence in the destination country. Moreover, the investments tend to complement each other, whether they are related to different modalities or to different stages of the value chain (see figure II.17).
111 Foreign Direct Investment in Latin America and the Caribbean • 2023 Chapter II
Source: Economic Commission for Latin America and the Caribbean (ECLAC), on the basis of data from Bloomberg and Financial Times, fDi Markets.
Note: Prospecting, exploration, production and decommissioning activities (upstream); crude oil and natural gas transportation and storage activities (midstream); and crude oil and natural gas refining or processing activities, distribution, sale and final use (downstream).
Unlike the rest of the world, investment announcements in Latin America and the Caribbean are evenly distributed between the upstream and downstream phases. In terms of mergers and acquisitions, interest in Latin American and Caribbean assets is greatest in the upstream segment (49%), followed by downstream (30%) and then midstream (21%). In the upstream segment the profile of assets transacted differs from that of announced projects. Transactions in the upstream segment display the lowest average value between 2015 and 2022 (US$ 302 million per asset transacted). Conversely,
112 Economic Commission for Latin America and the Caribbean (ECLAC) Chapter II
Figure II.16
0 5 10 15 20 25 2015 2016 2017 2018 2019 2020 2021 2022 Mergers and acquisitions Project announcements
Latin America and the Caribbean: cross-border mergers and acquisitions and project announcements in the oil, coal and natural gas sector, 2015–2022 (Billions of dollars)
Source: Economic Commission for Latin America and the Caribbean (ECLAC), on the basis of data from Bloomberg and Financial Times, fDi Markets.
Figure II.17
(Billions of
0 5 10 15 20 25 30 35 40 Mergers and acquisitions Project announcements Mergers and acquisitions Project announcements Mergers and acquisitions Project announcements Downstream Midstream Upstream
Latin America and the Caribbean: project announcements and mergers and acquisitions in the oil, coal and natural gas sector, 2015–2022
dollars)
they represent the highest value associated with each investment project announcement in the upstream segment over the same period (US$ 670 million). This is explained by the large projects described below.
During the period analysed, the upstream stage accounted for 49% of the amount of project announcements and M&A transactions. However, only 28% of the announcements, in terms of number, corresponded to this stage (compared to 78% in the case of M&A). This is because oil and natural gas exploration, extraction and production are the most capital-intensive activities in this industry, not only involving financial risk, but also requiring major contributions in terms of technologies, capital goods and infrastructure.
In the region, the entry of foreign firms in the upstream stage of the hydrocarbon industry in a country often begins with mergers and acquisitions, first and foremost through the purchase of exploration rights, through the various contractual regimes in force for hydrocarbon exploration in the country in question (bids, licenses, concessions, participations, among others), and the subsequent production of oil and/or natural gas in a previously prospected area. Examples of this are the purchase of oil exploration and production rights in the Santos basin and in the Bacalhau and Roncador fields, both located in Brazil, by consortiums led by the Norwegian firm Equinor ASA (see table II.6). Table
Latin America and the Caribbean: 10 largest cross-border mergers and acquisitions in the non-renewable energies sector, 2015–2022 (Percentages and billions of dollars)
Source: Economic Commission for Latin America and the Caribbean (ECLAC), on the basis of data from Bloomberg.
113 Foreign Direct Investment in Latin America and the Caribbean • 2023 Chapter II
II.6
Year Firm Country of origin Assets acquired Percentages Country of assets Value chain stage Amount (Billions of dollars) 2019 Engie, Caisse de Dépôt et Placement du Québec (CDPQ) France, Canada Transportadora Associada de Gás S.A. (Petrobras SA) 90 Brazil Crude oil and natural gas transportation and storage activities (midstream). 8.600 2017 Brookfield, others Singapore, others Nova Transportadora do Sudeste S/A (Petrobras S.A.) 90 Brazil Crude oil and natural gas refining or processing activities, distribution, sale and final use (downstream). 5.200 2016 Equinor ASA Norway Licence in the Santos basin (Petrobras S.A.) 66 Brazil Prospecting, exploration, production and decommissioning activities (upstream). 2.500 2016 Anadarko Petroleum Corporation United States Freeport–assets in the Gulf of Mexico 100 Mexico Prospecting, exploration, production and decommissioning activities (upstream). 2.000 2018 Equinor Norway Roncador offshore oilfield (Petrobras S.A.) 25 Brazil Prospecting, exploration, production and decommissioning activities (upstream). 2.000 2021 Mubadala Investment Company United Arab Emirates Landulpho Alves Refinery (Petrobras S.A.) 100 Brazil Crude oil and natural gas refining or processing activities, distribution, sale and final use (downstream). 1.800 2021 Sempra Energy United States Infraestructura Energetica Nova 26.23 Mexico Crude oil and natural gas refining or processing activities, distribution, sale and final use (downstream). 1. 768 2018 TotalEnergies France Lapa and Iara oil fields and Termobahia co-generation plant (Petrobras S.A.) 22.5, 35 and 50 Brazil Crude oil and natural gas refining or processing activities, distribution, sale and final use (downstream). 1.675 2019 Parkland Canada SOL Investments Ltd. 75 Barbados Crude oil and natural gas refining or processing activities, distribution, sale and final use (downstream). 1.612 2019 Petroliam Nasional Berhad Malaysia Tartaruga Verde oil field and Module III of the Espadarte field (Petrobras S.A.) 50 Brazil Prospecting, exploration, production and decommissioning activities (upstream). 1.294
After acquiring exploration and production rights, the firms usually expand their on-site developments depending on the viability of local exploration and their business strategy. This takes into account contractual agreements with countries in the region and the positioning of the product in the international market, since there is more incentive to increase production when prices are high. This can be seen by examining the Norwegian firm Equinor’s own track record in the region as, in 2022, it announced plans to expand its production capacity in the assets it had acquired in the Santos basin in 2016. A second drilling platform is expected to be built, along with another floating platform and gas pipelines for an estimated value of US$ 979 million (Offshore Technology, 2022). Transnational firms can also initiate operations in the upstream stage through other instruments, including production sharing agreements (PSAs).11 These agreements guarantee the firm carrying out the activities a percentage of the oil produced by way of remuneration. Another possibility is investment agreements, which usually cover hydrocarbon exploration and production rights in a defined area and for a specified period of time (Tienhaara, 2011). Whatever the instrument, it is expected that the participating transnational firms will invest more resources and develop other activities in the host country during the lifetime of the agreement. In the case of PSAs, an example is the agreement signed in 2016 between the United States firms ExxonMobil, leader of the consortium, and Hess Corporation, with China National Offshore Oil Corporation (CNOO) for exploration and production in the Stabroek block in Guyana. Following the development of several exploration activities in the last six years, in 2022 the consortium announced that it would invest an additional US$ 10 billion in just one of the 10 projects that the company expects to implement in the country (Valley Kumar, 2022) (see table II.7).
Source: Economic Commission for Latin America and the Caribbean (ECLAC), on the basis of data from
11
114 Economic Commission for Latin America and the Caribbean (ECLAC) Chapter II
Table II.7
Year Firm Country of origin Country of assets Value chain stage Amount (Billions of dollars) 2022 Exxon Mobil United States Guyana Prospecting, exploration, production and decommissioning activities (upstream) 10.000 2022 Woodside Energy (formerly Woodside Petroleum) Australia Mexico Prospecting, exploration, production and decommissioning activities (upstream) 4.500 2015 TransGas Development Systems United States Brazil Crude oil and natural gas refining or processing activities, distribution, sale and final use (downstream) 2.800 2018 Petronas Malaysia Argentina Prospecting, exploration, production and decommissioning activities (upstream) 2.300 2018 Sempra Energy (formerly Sempra Energy Resources) United States Mexico Crude oil and natural gas refining or processing activities, distribution, sale and final use (downstream) 2.000 2018 Golar LNG Bermuda Brazil Crude oil and natural gas refining or processing activities, distribution, sale and final use (downstream) 1.740 2015 Abengoa Spain Mexico Crude oil and natural gas refining or processing activities, distribution, sale and final use (downstream) 1.550 2016 Korea Gas Corporation (KOGAS) Republic of Korea Mexico Crude oil and natural gas refining or processing activities, distribution, sale and final use (downstream) 1.500 2020 BP (British Petroleum) United Kingdom Argentina Crude oil and natural gas refining or processing
and final use (downstream) 1.500 2022 BP (formerly British Petroleum) United Kingdom Mexico Crude oil and natural gas refining or processing activities, distribution, sale and final use (downstream) 1.400
Latin America and the Caribbean: 10 largest cross-border project announcements in the non-renewable energies sector (2015–2022)
activities, distribution, sale
Financial Times, fDi Markets.
In PSAs, the State, or the national oil company representing it, retains ownership of the oil produced in a given area, but contracts a private company to extract it, in exchange for a pre-agreed percentage of the oil produced.
The “investment agreement” modality was used in the region by Petronas of Malaysia, which set up business in 2015 in Argentina as Petronas E&P to explore shale assets in the Vaca Muerta region, under an agreement with the state-owned YPF. The investment agreement and complementary agreements of 2015 defined various phases of the venture, culminating, among other developments, in 2018 with the announcement of a US$ 2.3 billion investment project in extractive activities and, in 2022 with the announcement of a strategic partnership to develop an integrated (upstream, midstream, downstream) LNG project (YPF, 2015; Ministry of Economy, 2018; Offshore Energy, 2022).
Project announcements in the upstream stage thus often reflect the expansion plans of firms that, through some contractual instrument and/or asset purchases via mergers and acquisitions, had already started operations in the target country, which is why these announcements are so frequent. In addition to the increase in investments in the oil exploration, extraction and production ventures themselves, and in ancillary activities, experience in the region shows that this expansion can occur vertically. In this case they can involve investments in other stages of the value chain, especially in refineries and channels for distribution to end consumers, both of which are in the downstream stage of the value chain.
As the main functions in the midstream stage involve storage and transportation of the upstream inputs to the downstream stage, the classification of an asset or project as midstream may not be very clear, as the process is fluid and there are often overlaps, especially where operations are conducted in an integrated manner by the same firm. This is reflected in the fact that there are no announcements of projects classified in the midstream phase only; and it can also be seen when considering large-scale mergers and acquisitions, with assets that often share midstream and downstream functions. This is exemplified by the two largest M&A transactions in the region between 2015 and 2022. The larger of these operations is classified as midstream: the sale of 90% of the shares of Transportadora Associada de Gás S.A. (TAG) to a consortium formed by the French group Engie and the Canadian fund Caisse de Dépôt et Placement du Québec (CDPQ), for US$ 8.6 billion in 2019, followed the launch of the New Gas Market in the same year (Ministry of Mines and Energy, 2022; Petrobras, 2019).12 In 2017, Petrobras had already sold 90% of Nova Transportadora do Sudeste’s assets to a consortium led by Brookfield for US$ 5.2 billion, which turned out to be the first of many assets in the natural gas segment to be traded (see box II.3). Because it involves assets that also link to the final consumer, the transaction in question is classified as downstream, and is related to the electricity and gas distribution utilities industry.
Overall, mergers and acquisitions involving midstream assets represent just 21% of the total allocated to the oil, coal and gas sector in the region between 2015 and 2022. However, they represent just 6% of the number of transactions13 and therefore have the highest average transaction value, approximately US$ 1.591 billion (upstream: US$ 302 million per transaction; downstream: US$ 924 million). This reveals the interest of large investors and/or groups of investors in acquiring large-scale mature assets, involving large natural gas storage and distribution infrastructures in the region’s main consuming markets, Brazil and Mexico, such as those described above (see box II.3).
115 Foreign Direct Investment in Latin America and the Caribbean • 2023 Chapter II
12 This new institutional framework was intended to foster greater investment in infrastructure in the intermediate and downstream stages of the natural gas chain, and also to make the sector more competitive (Ministry of Mines and Energy, 2022).
13 This chapter only analyses transactions and mergers included in the Bloomberg database for which the transaction value is reported.
Box II.3
Changes in the strategy of a large state-owned firm: the case of Petrobras Regulation, sector policies and institutions shape the orientation and performance of the energy sector. Depending on the approach and configuration adopted, they can drive and promote public and private investments that are more or less aligned with the objectives considered as priorities by governments, whether local productive development, technological capacity building, productive diversification, energy self-sufficiency and diversification, or attraction of foreign investment and competitiveness, among other aims. Thus, the evolution of the regulatory framework and sectoral policies are fundamental elements for positioning the firms’ investment and disinvestment policies as an expression of their strategies. The transformations that have taken place in the Brazilian context in recent decades thus elucidate the strategic change that forms the backdrop for the recent wave of asset sales by Petrobras and the tensions surrounding it.
In the 1990s, a policy of market opening and deregulation was launched in Brazil, accompanied by regulatory and management changes in the oil and gas sector that affected Petrobras’ trajectory and performance. In 1997, the government adopted Law 9.478, which admitted domestic and foreign investment in oil exploration, production, refining and transportation. Following the opening up of the sector, Petrobras started importing more capital goods and acquiring complete packages of projects and operations from international firms, thus expanding its relationships with foreign suppliers of capital goods (Costa Pinto, 2020).
The discovery of the pre-salt layer in 2006 heralds a new stage in the oil and gas sector, with regulatory and sectoral policy changes and redefinition of the state-owned firm’s strategy. Law 12.351 of 2010 amends Law 9.478 of 1997 to provide for the exploration and production of oil, natural gas and other fluid hydrocarbons in both pre-salt and strategic areas, in addition to creating the Social Fund. The government’s main objective was to increase society’s share in the earnings of the pre-salt layer. To that end it is supporting the national productive sector through the development of local suppliers and an increase in the national content requirement; and by dedicating part of the surplus generated by pre-salt activities to financing social spending (for which the Social Fund was created). In addition, the sharing system was established in the exploration and development of the pre-salt layer, with Petrobras acting as the sole operator.
Within this framework, Petrobras defined its 2007–2011 business plan, in which it proposed to increase production and expand light oil and natural gas reserves, augment refining capacity, increase biomass, petrochemical and fertilizer capacity and boost production. The business model was oriented towards vertical integration and gave continuity to a cycle of major investments for the development of the oil and gas chain, while promoting diversification. In order to explore and develop the pre-salt fields and expand its operations, Petrobras had to expand its investments significantly, especially in the exploration, production and refining stages. Between 2004 and 2013, the state-owned firm increased its investments by an estimated annual average of more than 11%, well above Brazil’s rate of gross fixed capital formation, which averaged 7% for the same period (Costa Pinto, 2020).
In 2014, the pace of oil and gas activities slowed around the world. In Brazil, however, the interaction of a set of factors contributed to turning the slowdown into a deep crisis: the sharp drop in international oil prices was compounded by financial difficulties in Petrobras (exacerbated by the sharp devaluation of the real and the long maturity periods of the investments), and the reputation crisis caused by the association of the state-owned firm with the corruption scandals that gained notoriety with the Lava Jato operation. Nonetheless, in this context of crisis, in 2015 the company adopted a divestment strategy to meet its financial challenges.
Following the dismissal of President Dilma Roussef’s government, in 2016 the sector regulatory framework was again amended, with the aim of stimulating the attraction of foreign investment and accelerating the development and production of pre-salt oil. The new government adopted Law 13.365 of 2016, which established that Petrobras would no longer act as the sole operator of the pre-salt layer. It also reduced local content requirements, increased incentives and subsidies to foreign investment and established a fast-track schedule of pre- and post-salt oil auctions.
In this new context, another change was made to Petrobras’ strategic orientation. The vision focused on vertical integration gave way to greater specialization, placing emphasis on exploration and production and on deepwater and ultra-deepwater assets, with substantial reserves and high productivity. This new approach
116 Economic Commission for Latin America and the Caribbean (ECLAC) Chapter II
speeds up the implementation of an ambitious divestment plan targeting mature assets, with which it expects to increase its cash flow, reduce the net debt ratio and release funds for investments in more strategic areas (BNamericas, 2019). In late 2022, before the change of government, Petrobras approved its strategic plan for 2023–2027 in which it aims to restore pre-crisis investment levels (a total of US$ 78 billion over the next five years) and includes asset divestments. With the change of government and the appointment of a new general manager and board of directors of the state-owned firm in 2023, it is possible that Petrobras’ strategy could be reviewed, so its future remains an open question (Reuters 2023).
Source: Economic Commission for Latin America and the Caribbean (ECLAC), on the basis of E. Costa Pinto, “Nacionalismo energético, Petrobras e desenvolvimento brasileiro: a retomada interditada”, OIKOS, vol. 19, No. 1, 2020; Bnamericas, “Bajo la lupa: los planes de desinversión de Petrobras”, 2019 [online] https://www.bnamericas.com/es/reportajes/bajo-la-lupa-los-planesde-desinversion-de-petrobras; and Reuters, “Brasileña Petrobras dice revisión de desinversiones e inversiones se basará en plan estratégico”, 29 March 2023 [online] https://es.investing.com/news/stock-market-news/brasilena-petrobrasdice-revision-de-desinversiones-e-inversiones-se-basara-en-plan-estrategico-2378538.
In the downstream stage, not only is the profile of assets traded in M&A very different from that of projects, but the amounts of the investments also differ. Project announcements at this stage of the value chain have the lowest value per transaction, but are the largest in number; 79% of announcements occur in this stage, with an average value of US$ 258 million per project. The values associated with M&A transactions at the same stage of the value chain are more than three times higher on average (US$ 924 million per transaction).
In addition to the acquisition of Nova Transportadora Do Sudeste S/A mentioned above, there were two other key operations in the downstream stage, both of which involved the purchase of assets in the stage of retail distribution of hydrocarbons to the final consumer. In 2019 the Canadian firm Parkland Corporation acquired 75% of the operations of SOL, a Barbados-based fuel distributor serving Caribbean countries and territories, for US$ 1.612 billion (Parkland 2018). In a similar case, the Chilean firm Copec purchased rights from ExxonMobil to produce and distribute Mobil lubricants in the markets of Colombia, Ecuador and Peru, and it renewed its contract in Chile. The transaction was finalized in 2018 for US$ 747 million (San Juan, 2016).
Project announcements in the downstream stage in the region have a very different profile, dominated by projects of large European firms in the energy sector, related to the construction and operation of electricity generating plants from fossil fuel sources, especially natural gas. The largest announcement of the period corresponds to the construction of a coal gasification and fertilizer production complex in southern Brazil by TransGas Development Systems of the United States. The project was announced in 2015 and amounts to some US$ 2.8 billion. Another key announcement in the period under review is the contract awarded by Mexico’s Federal Electricity Commission (CFE) to the Spanish firm Abengoa to build a combined cycle power plant, which was announced in 2015 for US$ 1.55 billion (Reuters, 2015).
Three projects related to the construction and operation of thermoelectric power plants linked to natural gas obtained from Brazilian pre-salt exploration, were announced in 2019. The two largest are linked to Gás Natural Açu (GNA), a joint venture between Germany’s Siemens, Britain’s BP and Brazil’s Prumo Logística. This will be the largest natural gas-fired thermoelectric complex in Latin America, located in the logistics complex of the Port of Açu, in the state of Rio de Janeiro. Totalling US$ 2.2 billion, the announced ventures involve LNG regasification and electric power generation and transmission (Ennes, 2019; Ministry of Energy and Mines, 2019).14
117 Foreign Direct Investment in Latin America and the Caribbean • 2023 Chapter II
14 The project has been financed by the National Bank for Economic and Social Development (BNDES) and the International Finance Corporation (IFC) (Ennes, 2019).
In the same year, the joint venture between the Anglo-Dutch firm Shell, Japan’s Mitsubishi Hitachi Power Systems (MHPS) and a Brazilian investment fund, Pátria Investimentos, announced that it intends to invest 700 million reais in the construction and operation of the Marlim Azul natural-gas fired thermoelectric power plant, also in the state of Rio de Janeiro. The project was the first to win auctions for natural gas obtained from pre-salt exploration, which will be supplied to the plant by Shell itself, thus guaranteeing the gas production demand of the firm’s upstream business (Shell Brasil, 2019).
Considering the period 2005–2022, including years prior to those analysed above, 56% of project announcements have been in the upstream phase (see figure II.18). However, the largest project announcement between 2005 and 2010 was in the downstream stage in the Bolivarian Republic of Venezuela in 2005, when Chevron, in consortium with the Spanish firm Repsol, announced investments worth some US$ 5 billion to expand its extra-heavy crude oil production and refining capacity in the country (CincoDías, 2005). The second largest project in this downstream stage was also revealed during this period: in 2006, Repsol announced that it would participate in building and operating a natural gas liquefaction plant in Peru —a project valued at US$ 3.1 billion (EuropaPress, 2006). The participating firms were already operating in the upstream stage in the destination countries, thus expanding their integrated activities in the value chain.
Naturally, the distribution of investments in the region depends on the availability of hydrocarbon reserves; but it also depends on other factors, such as the size of the consuming market and the existence of the infrastructure needed to make its production and sale viable. Furthermore, experience in Latin America and the Caribbean shows that the plurality of contractual arrangements related to the exploration and production of these resources are also relevant when analysing the distribution of investments. The main destinations for both M&A and project announcements are those with the largest reserves and consumer markets.
Mexico is the destination for 35% of all project announcements, by amount, between 2005 and 2022, followed by Brazil (21%) and Guyana (14%) (see figure II.19). Only eight of the 19 countries in the region that were destinations for project announcements in the oil, coal and natural gas sector between 2015 and 2022 saw announcements in both stages of the value chain evaluated. This not only reflects opportunities related to their reserves, but also their consumer market.
118 Economic Commission for Latin America and the Caribbean (ECLAC) Chapter II
Figure II.18
(Billions of dollars) 0 2 4 6 8 10 12 14 16 18 2005 2006 2007 2008 2009 2010 2011 2012 2013 2014 2015 2016 2017 2018 2019 2020 2021 2022 Upstream Downstream
Latin America and the Caribbean: project announcements in the oil, coal and natural gas sector by stage of value chain and amount, 2005–2022
Source: Economic Commission for Latin America and the Caribbean (ECLAC), based on data from the Financial Times, fDi Markets.
(Billions of dollars)
Cuba
Costa Rica
Dominican Rep.
Paraguay
Panama
Guatemala
Ecuador
El Salvador
Uruguay
Nicaragua
Peru
Chile
Bolivia (Plur. State of)
Colombia
Venezuela (Bol. Rep. of)
Argentina
Guyana
Mexico Brazil
Upstream Downstream
Source: Economic Commission for Latin America and the Caribbean (ECLAC), on the basis of data from Financial Times, fDi Markets. Note: Prospecting, exploration, production and decommissioning activities (upstream); crude oil and natural gas refining or processing activities, distribution, sale and final use (downstream).
In contrast, the M&A market is much more concentrated than that of project announcements, not only in terms of the set of participating countries (just 13 compared to 19 countries with project announcements), but also because Brazil is the destination for more than half of the transactions (62%), followed by Mexico (18%). Moreover, only Argentina, Brazil and Mexico reported operations in all three stages of the value chain (see figure II.20).
Peru
Guyana
Uruguay
Paraguay
Trinidad and Tobago
Venezuela (Bol. Rep. of)
Ecuador
Colombia
Barbados
Argentina
Chile
Mexico
Brazil
(Billions of dollars) 0
Upstream Midstream Downstream
Source: Economic Commission for Latin America and the Caribbean (ECLAC), on the basis of data from Bloomberg. Note: Prospecting, exploration, production and decommissioning activities (upstream); crude oil and natural gas transportation and storage activities (midstream); and crude oil and natural gas refining or processing, distribution, sale and end-use activities (downstream).
119 Foreign Direct Investment in Latin America and the Caribbean • 2023 Chapter II
Figure II.19
Latin America and the Caribbean: project announcements in the oil, coal and natural gas sector by stage of value chain and country, 2015–2022
0 5 10 15 20 25 30
Figure II.20
Latin America and the Caribbean: mergers and acquisitions in the oil, coal and natural gas sector by stage of value chain and country, 2015–2022
5 10 15 20 25 30
In terms of the origin of the resources invested or announced in the region, large international oil companies predominate, especially those from the United States and France. However, once again the large sums invested in certain projects, in an industry of high capital intensity, make it difficult to identify trends.
This can be seen clearly in the project announcements. Between 2015 and 2022, 35% of project announcements in Latin America and the Caribbean were made by United Sates firms (figure II.21). In this regard, the figures are biased by ExxonMobil’s US$ 10 billion project in Guyana in 2022, making the firm the largest single investor in the entire region between 2015 and 2022. Bermuda is also the fourth largest source of funds in the region. The country’s tax framework encourages firms from other origins to register their headquarters in the country. Project announcements originating in the region’s countries represent just 1% of the total, originating in Chile, Mexico and the Plurinational State of Bolivia.
Latin America and the Caribbean: project announcements in the oil, coal and natural gas sector by stage of value chain and country of origin, 2015–2022
(Billions of dollars)
Source: Economic Commission for Latin America and the Caribbean (ECLAC), on the basis of data from Financial Times, fDi Markets. Note: Prospecting, exploration, production and decommissioning activities (upstream); crude oil and natural gas refining or processing activities, distribution, sale and final use (downstream).
In the case of mergers and acquisitions, French firms are the main buyers of Latin American assets (24% of total value), followed by firms from the United States (15%). However, consortiums and investment funds are the main individual investors, operating mainly in the downstream and midstream stages of the industry’s value chain. This explains the presence of firms from Singapore and the United Arab Emirates among the top 10 investors in the sector (see figure II.22).
In the past, large Latin American national oil companies harnessed the wave of privatizations in the region in the 1990s to acquire assets in neighbouring countries, in order to increase access to hydrocarbon reserves, guarantee demand for their own production and vertically integrate their businesses (ECLAC, 2006). However, given the need for large amounts of capital and the unfavourable domestic situation, as well as the change in strategy of some of the main firms in the region (see box II.3), this scenario has changed. Only 4% of all project announcements and 7% of M&A in the oil, coal and natural gas sector between 2015 and 2022 originated from trans-Latin firms, predominantly in the upstream stage of the value chain.
120 Economic Commission for Latin America and the Caribbean (ECLAC) Chapter II
Figure II.21
0 5 10 15 20 25 30 United States Spain France Bermuda Italy Australia United Kingdom Germany Malaysia Argentina Other countries Upstream Downstream
Source: Economic Commission for Latin America and the Caribbean (ECLAC), on the basis of data from Bloomberg. Note: Prospecting, exploration, production and decommissioning activities (upstream); crude oil and natural gas transportation and storage activities (midstream); and crude oil and natural gas refining or processing, distribution, sale and end-use activities (downstream).
In value terms, 77% of announced projects correspond to the plans of the Argentine firm Hokchi to extract oil and natural gas in shallow waters off Mexico, which is the largest recipient of project announcements in the region (76% of total value) (MexicoNow, 2018). In terms of M&A, the Brazilian firm Raizen accounts for 32% of the total value invested in the region. In 2018, it bought Shell’s midstream and downstream assets in Argentina for US$ 916 million. The Brazilian enterprise, which is a joint venture between Shell itself and Cosan, also of Brazil, then went on to gain control of the Buenos Aires refinery, 645 service stations and other assets, representing another example of vertical integration in the region (Hidalgo, 2018; Shell Argentina, 2018).
In conclusion, investments in the upstream stage of the oil, coal and natural gas value chain are usually the starting point from which transnational firms execute their strategy in Latin America and the Caribbean. This defines the growth of their investments in the expansion of existing projects, other similar ventures, or other stages of the value chain that promote the processing and distribution of the extracted hydrocarbons.
In terms of potential FDI attraction strategies, the downstream stage seems to be the most interesting. Investments in refining could add value to the crude oil and natural gas produced and make it possible to transport the hydrocarbons to ever more distant markets, which is important in the current situation of high energy demand and pressure on international prices. Investments in transportation and distribution are also needed, to enable energy obtained from hydrocarbon exploration to reach the region’s consumer markets in its various forms. Thus, projects such as the Açu port complex in the Brazilian state of Rio de Janeiro could facilitate the flow of production from recent discoveries in the region to domestic and foreign markets, in addition to creating jobs in other related industries, as will be explained in the following sections.
121 Foreign Direct Investment in Latin America and the Caribbean • 2023 Chapter II
0 2 4 6 8 10 12 France United States Norway Singapore Canada United Arab Emirates Russian Fed. United Kingdom Australia Malaysia Brazil Chile Bulgaria Mexico Other countries Upstream Midstream Downstream
Figure II.22 Latin America and the Caribbean: mergers and acquisitions by stage of value chain and country origin, 2015–2022 (Billions of dollars)
D. Challenges and opportunities for Latin America and the Caribbean
The transition to a low-carbon economy involves inherent contradictions. While there are incentives to invest in low-carbon energy sources and warnings against reliance on finite and non-renewable sources, which have a considerable negative environmental impact, the region’s countries also have the opportunity to generate income and attract investment based on these resources. The countries of Latin America and the Caribbean vary greatly in terms of their potential for entering the hydrocarbon chain and attracting investment in the sector. Nonetheless, this section aims to describe challenges, opportunities and instruments for income generation and productive development that might be common to the region and serve as inputs enabling governments and decision makers to define their role in managing the energy transition.
1. An unavoidable risk factor: stranded assets in the context of the energy transition
The analysis of FDI flows, project announcements and mergers and acquisitions in the oil, coal and natural gas sector in Latin America and the Caribbean demonstrates the interest that transnational corporations have in the region in the short term, especially in light of the new discoveries of hydrocarbon reserves and an international context of high energy prices and robust demand. However, climate change cannot be combated without an energy transition; and the demand for energy from non-renewable sources is expected to decline dramatically in the medium and long terms. This is highly problematic in an industry where investments are capital intensive and have a payback period that lasts several decades. The risk of obsolescence would imply huge financial losses and socioenvironmental impacts, particularly since these projects are capital-intensive and therefore have high financial costs. This situation could deter potential investors who want to commit to a long-term strategy which, if complemented by suitable policies, would potentially benefit the development of the countries in the region. The materialization of this risk is the “stranded-assets” problem.
Stranded assets can be defined as assets that have suffered from unanticipated or premature write-downs, devaluations, or conversion to liabilities (Caldecott and others 2016) as a result of some exogenous factor. In the context of the energy transition, fossil fuel reserves, and other capital investments for the exploration, production and refining of these energy sources can be rendered inoperable, because of the need to fulfil climate commitments. As a result, they become liabilities before the end of the payback period, or the corresponding installations have to be decommissioned prematurely, turning them into stranded assets (Nunes and Costa, 2021).
Stranded assets are problematic because they are often illiquid investments and highly vulnerable to abrupt devaluations (Caldecott and others, 2016). Moreover, plans to reduce emissions to net-zero by 2050 mandate the inclusion of this type of risk in project feasibility calculations, to ensure that countries or firms recognize that they may not recover the fixed capital invested (IEA, 2022d). Depending on the country context, this may cause hesitation in short-term investments and even instability in the financial markets (Nunes and Costa, 2021).
Despite the dominance of renewables in electricity production in Latin America and the Caribbean, the amount of capital to be withdrawn prematurely from the energy sector over the next 30 years is estimated at between US$ 37 billion and US$ 90 billion, depending on the decarbonization pathway (Binsted and others, 2020). Under GHG emissions reduction scenarios that are consistent with limiting the global temperature rise to 2°C or 1.5°C by 2050, utilities in the region would have to prematurely shut down between 10% and 16%, respectively, of current fossil fuel-based electricity
122 Economic Commission for Latin America and the Caribbean (ECLAC) Chapter II
generation capacity, or else reduce their production capacity (González-Mahecha and others, 2019). These high costs would fall on a relatively small group of agents, at a time when there is great need for new facilities and investments to expand production capacities (Caldecott and others, 2016; Binsted and others, 2020).
Stranded assets also have other consequences. Abandoned coal mines and oil wells not only pose physical risks to the surrounding communities by polluting water and air, but in the case of oil, they pose an additional risk through continuing methane emissions; and they also reduce the value of surrounding land (WRI, 2021). These are just some of the externalities caused by the oil and natural gas industry, on which the governments of the region have a duty not only to act, but also to inform their populations, as guaranteed by the Regional Agreement on Access to Information, Public Participation and Justice in Environmental Matters in Latin America and the Caribbean (Escazú Agreement) (ECLAC, 2023b).
The risk of stranded assets and the associated costs should therefore be taken into account in the decisions of large firms and investors in the hydrocarbon industry; but, above all, they should be incorporated into decision making by the region’s governments. The latter must actively manage both the opportunities associated with hydrocarbon exploration and the risks imposed by the energy transition, including stranded assets. This will require implementation of an appropriate carbon price, the provision of tax incentives and the development of regulations on the energy efficiency of thermoelectric power plants, whether already installed or to be installed in the future. In addition, good corporate governance practices, such as the disclosure of non-financial information, should be made mandatory (Rozenberg, Vogt-Schilb and Hallegatte, 2017). While the design of appropriate policies will depend on each country and particular circumstance, it is an issue that needs to be taken into account in the agendas of the region’s countries. Moreover, multilateral exchange mechanisms could be promoted, which could strengthen the countries’ position vis-à-vis the sector’s transnational firms.
2. Opportunities in an energy transition future: carbon dioxide capture and storage technologies
Key elements in the analysis of future investments in the non-renewable energies value chain, especially in the context of the energy transition, include carbon dioxide capture and storage and carbon capture, utilization and storage technologies.
As defined by the Intergovernmental Panel on Climate Change (IPCC, 2005), carbon dioxide capture and storage is a process that separates CO2 from industrial emission sources, and stores and isolates it from the atmosphere over the long term. Carbon dioxide capture has been used for decades —in the production of ammonia from natural gas, and in the processing of natural gas itself as a by-product of oil exploration, among other uses; but its use as a viable way to mitigate GHG emissions, as well as its technological maturity and application on a commercial scale, remain a challenge (IEA 2021b; IPCC 2005). In contrast, carbon dioxide capture, utilization and storage technologies have been used to enable the captured carbon to be used in industrial processes, instead of just storing it. In addition to its use in other industries (for example, in the production of plastics, concrete and biofuels, among others), this modality has been used particularly in the oil and natural gas industry, especially with the development of enhanced oil recovery (EOR) projects.
Firms operating in the upstream hydrocarbon stage play an important role in this regard, since the large-scale use of carbon dioxide capture and storage technologies could be the only way to make their business model viable in the long term and also fulfil the climate commitments assumed.15
123 Foreign Direct Investment in Latin America and the Caribbean • 2023 Chapter II
15 About 55% of the cumulative reductions in GHG emission obtained from technologies such as carbon dioxide capture, utilization and storage in the net zero scenario are based on technologies that are currently still being tested (IEA 2021b).
Moreover, these firms have vast technological and complex project management experience, as well as the resources needed to lead the development of the projects (BNamericas 2021). Nonetheless, the adoption of these technologies by large firms in the sector does not mean neglecting their core business; on the contrary, it would be a way to preserve it in the future (Lefebvre, 2023).
For Latin America and the Caribbean, carbon dioxide capture and storage technologies need to be considered in the context of the recent discoveries of oil and natural gas reserves. These have the potential for large volume extraction and production and, consequently, the inflow of investments and use of the revenues thus generated to reactivate the economy. However, despite their potential, Latin America and the Caribbean is one of the regions with the fewest installations for this purpose (Nunes and Costa, 2021).
According to Steyn and others (2022), in September 2022 there were 30 carbon dioxide capture and storage projects operating worldwide and 134 in the pipeline, mostly in the United States (43% of the total). This leadership will tend to increase in the coming years, owing to recent United States government tax incentives for the development of this type of technology. It is also worth noting that 58% of all carbon dioxide capture and storage projects involve geological storage (Steyn and others, 2022) (see figure II.23).
Source: Economic Commission for Latin America and the Caribbean (ECLAC), on the basis of M. Steyn and others (coords.), Global Status of CCS 2022, Global CCS Institute, 2022 [online] https://www.globalccsinstitute.com/resources/global-statusof-ccs–2022.
Although only six project announcements were directly related to these technologies in 2021 and 2022, the amount allocated to carbon dioxide capture and storage projects grew by 375% between the two years, totalling US$ 3.454 billion in 2022. The United States accounted for 96% of the total, and Belgium 4%.
In the region, the only projected identified is the use of EOR by Brazil’s Petrobras in 21 platforms producing oil extracted from the pre-salt layer of the Santos Basin, which is considered the largest carbon dioxide capture, utilization and storage project in the world (Agência Brasil, 2023; Steyn
124 Economic Commission for Latin America and the Caribbean (ECLAC) Chapter II
Figure II.23
13 5 3 2 1 1 1 1 1 1 1 0 2 4 6 8 10 12 14 United States Canada China Norway Australia Qatar Saudi Arabia Brazil United Arab Emirates Hungary Iceland
Selected countries: operational carbon dioxide capture and storage projects, 2022 (Number of projects)
and others, 2022; Petrobras, 2021).16 Since it was inaugurated in 2008, the Petrobras project has reinjected 40 million tons of CO2; and the firm’s goal is to reinject 40 million tons per year as from 2025 (Agência Brasil, 2023).
There are also projects in the planning and development phase in the region. Petrobras has recently disclosed plans to implement another carbon dioxide capture and storage technology, known as high-pressure membrane separation (HISEP), in its Libra projects by 2024, which will involve re-injection of CO2 in subsea reservoirs (BNamericas, 2021).
A crucial issue for the development of projects related to this technology is the identification of geological zones with CO2 storage capacity. It is also important that industrial-scale CO2 emission sources exist relatively close to these areas, thus facilitating transportation and improving the feasibility of the projects. In Latin America and the Caribbean, several areas have been identified as suitable for large-scale use of this technology. In Trinidad and Tobago, for example, which is a country with growing hydrocarbon production, the main source of CO2 emissions is in the Point Lisas region, which is relatively close to potential geological storage sites (Nunes and Costa, 2021).
Despite the potential for carbon dioxide capture and storage in the region, the technologies in question are still in the testing phase and have high implementation and operating costs. There are also regulatory and other uncertainties related to international carbon markets, which renders the return on investment even more unpredictable. Thus, in countries where the use of these technologies is more advanced, government support for the corresponding initiatives has proven fundamental; but this is still very incipient in the region. It would be essential to provide incentives to firms that invest in these technologies, especially in areas of new hydrocarbon discoveries, where transnational investor firms are more likely to adopt new technologies and modern extraction methods. However, the opportunity costs of these incentives must be weighed against other considerations and investment priorities of the region’s limited resources in the face of the challenges posed by the energy transition.
The United States, Canada and many European countries have implemented tax incentives, regulations and other support measures to stimulate the development and implementation of carbon dioxide capture and storage technologies. Delay in adopting similar solutions in Latin America and the Caribbean would make the region less competitive in the race to develop “low-carbon oil”, in contrast to regions where these technologies are already mature and producing at scale.
In the context of the energy transition and new trends for firms to relocate according to the availability of green energy sources, countries and regions that can also offer environmental advantages in terms of oil supply could regain importance. Harmonized efforts are needed to seize this opportunity, first and foremost by forging appropriate national consensuses to promote green and inclusive growth (Arbache, 2022; Hausmann, 2021).
3. Generating value with hydrocarbons: opportunities to promote productive development
As mentioned in the previous sections, FDI inflows in the non-renewable energies sector are especially important for developing countries, since projects in the upstream stage of the oil, coal and natural gas value chain require large investments in resources and technology, which are seldom abundant in these countries. Moreover, owing to the high volatility of the prices of these commodities on international markets, the risk is high and the financing of these projects is often prohibitive for most
125 Foreign Direct Investment in Latin America and the Caribbean • 2023 Chapter II
16 Enhanced oil recovery involves adding CO2 to operating oil wells to increase reservoir pressure, thereby facilitating extraction and improving its mobility (McGlade, 2019).
developing countries without the presence of international capital. Moreover, the hydrocarbons sector has been historically important for Latin American and Caribbean countries, especially in terms of tax revenues and balance of payments (Titelman and others, 2023). However, there is considerable debate as to whether the abundance of natural resources, such as hydrocarbons and energy minerals, is a “curse” or a “blessing” for developing countries. Several studies on the relationship between the presence of these resources in a country, and its economic development, find that the volatility of world prices for these raw materials also generates high volatility in per capita GDP growth in countries that rely on exporting them; and this undermines their long-term growth (Van der Ploeg and Poelhekke, 2009).
For example, when studying natural resource discoveries and their consequences, Corden and Neary (1982) note that large inflows of resources in the extractive sectors in natural-resource abundant countries can generate real exchange rate appreciation. This causes manufacturing, and the tradable sectors in general, to contract, while also fuelling inflation in the non-tradable sectors —a phenomenon known as “Dutch disease” (Benjamin, Devarajan, and Weiner, 2008; Corden and Neary, 1982). Other studies, in contrast, show that the presence of abundant natural resources can be positive for a country, since the revenue obtained from their exploitation could make it possible to finance activities that are necessary for the country’s economic development. Based on data for Latin America and the Caribbean, Sánchez, di Domenico, and Tovar de la Fe (2019) found that an increase in the natural-resource share of total exports could be associated with a reduction in inequality in the countries in question. Other studies show how industrial growth, employment and income generation can benefit from commodity sector linkages (Morris, Kaplinsky, and Kaplan, 2012).
A common feature in several of these studies is the importance of the role of governments and institutions in promoting economic growth from natural resource-related sectors, especially by stimulating industrial growth in associated sectors. Sanchez, di Dominico and Tovar de la Fe (2019) note that the crux of the debate is not the natural resource endowment and its impact on a country’s economic development, but the way in which the resources are explored and exploited; in other words the institutional framework and governance. These authors also stress that institutional quality is crucial for exploiting the resource rent obtained from mineral exploitation. In addition to institutional quality, some authors emphasize the soundness of the country’s financial system in exploiting the potential of the natural resource sector (Poelhekke and van der Ploeg, 2013; van der Ploeg and Poelhekke 2009). For example, a study by Satti and others (2014) on the hydrocarbons sector in the Bolivarian Republic of Venezuela, argues that the mere abundance of oil does not contribute to the country’s economic growth, but only when it is associated with financial development and openness to international trade. This underscores the importance of public policies to encourage sustainable exploitation of the country’s abundant natural resources, in conjunction with economic development policies (Satti and others, 2014). These policies should include regulatory and appropriate resource management measures, among others (Adedeji and others, 2016).
Governments can also design an industrial development strategy that uses the revenues obtained from the exploitation of natural resources to stimulate industrial activities at different levels of sophistication and at different points in the value chain, targeting the short, medium and long terms (Morris, Kaplinsky, and Kaplan, 2012). These authors identify a de-verticalization trend in the mineral resources exploration sector, which opens up opportunities for local firms to supply ancillary and intermediate goods and services, such as capital goods, chemical inputs, and knowledge-based services. Industries related to hydrocarbon exploration have location-specific attributes, which means that they must operate locally. This opens up possibilities for harnessing and making use of local knowledge, including local capacity to provide basic services, such as food, transportation and housing, and is a platform for generating technological spillover effects.
126 Economic Commission for Latin America and the Caribbean (ECLAC) Chapter II
One way to encourage the creation of linkages with the local economy would be through local-content policies. Whatever the legal framework for granting oil, coal or natural gas exploration rights to foreign firms, the inclusion of clauses requiring a local counterpart can contribute to industrial development in the country, whether or not it is related to the value chain of the resource being exploited. Such requirements include technology transfer to local firms, the hiring and training of nationals from the destination country of the investment, or the purchase of local goods and services, among other obligations (Tordo and others, 2013). A study for Nigeria suggests that the national content requirement system enhances local value creation through the development of backward linkages and the participation of local firms in the value chain. The commitments required by this system include the development of Nigerian expertise relating to the planned operations, as well as local training and employment obligations included in oil contracts, for example).17 This has had a positive effect on local value creation through the development of backward linkages and participation by local firms in the value chain. Thus, the policy has been found to have a positive effect on job creation (Adedeji and others, 2016; Tordo and others, 2013).
Nonetheless, despite the relative abundance of formats and designs of these instruments, and their application, their success depends on the context of the country in which they are adopted, and also on the other productive development policies implemented by the government. Brazil, for example, reduced the domestic content requirement from 40% to 20% in different licensing rounds for oil and gas exploration in the country, owing to concerns about the impact on investment costs and exploration and field development schedules (Tordo and others, 2013).
Other authors also highlight the need to add value to the country’s mineral resources, instead of just exporting them without any processing. According to Nagaeva (2021), this would avoid having to import technology and more sophisticated goods and services, with local firms being relegated to supplying low value-added products and services, which would reduce the potential for technology transfer. It would therefore be worthwhile fostering collaboration between international capital and local firms, especially small and medium-sized enterprises (SMEs). An example would be to promote investments not only in the oil extraction and production phases, but also in refining and processing activities, which would increase jobs, boost wages and stimulate other related industries (Nagaeva, 2021).
This hypothesis is supported by empirical evidence: although investments are larger per project in the ‘downstream segments of the petroleum value chain, when analysing data on job creation by the oil and gas production and transportation cluster in the United States in 2020, the largest number of jobs were created in activities supporting oil and gas operations. These accounted for 43% of the total, with oil and gas exploration being only the second sector (18%) (U.S. Cluster Mapping, 2020). Cluster initiatives thus represent an important tool that governments can use to diversify and enhance the sophistication of their productive apparatus in different activities, such as in value chains unrelated to non-renewable energies, thereby promoting economic diversification and reducing reliance on extractive activities. Such initiatives can be financed through resources obtained from hydrocarbon exploration and production activities. In Argentina, for example, firms have been reorganized to take advantage of the opportunities arising from hydrocarbon exploration in Vaca Muerta. Small and medium-sized enterprises (SMEs) producing auto parts in the province of Córdoba have adapted and diversified to serve the sector; and the Mar del Plata energy cluster has mobilized resources to connect to Vaca Muerta through pipelines (attracting investments worth US$ 40 billion from the Malaysian oil company Petronas), with a view to increasing its liquefied gas export capacity (Lanzafame, 2022, MásEnergía, 2022).
127 Foreign Direct Investment in Latin America and the Caribbean • 2023 Chapter II
17 The Nigerian Oil and Gas Industry Content Development Act, approved in 2010, sought to enhance the capacities of local firms and create more business opportunities for them. The law set targets to boost the development of local content, starting at 45% in 2007, rising to 70% in 2010 and eventually exceeding 80% by 2020. This policy was intended to foster the growth and development of the domestic oil and gas industry in Nigeria (Adedeji and others 2016).
Another way to address the challenges and opportunities arising from the bonanza of mineral resources such as oil, coal and natural gas would be to develop a taxation framework that includes solutions such as the creation of sovereign wealth funds. The advantage of this instrument would be to use revenues from resource exploitation activities to promote not just distributive, but also intergenerational justice (Machado e Silva and Medeiros Costa, 2019). Sovereign wealth funds could thus be used to transform non-renewable natural capital into other forms of durable capital, in order to promote sustainable development (Hazin and Sotelsek Salem, 2019). In addition to establishing long-term savings and promoting economic and social development, sovereign wealth funds would also help stabilize revenues in the short term. However, the effectiveness and transparency of these funds depend on how they are structured, and on their objectives and corporate governance. The industry benchmark in this regard would be the world’s largest sovereign wealth fund, the government’s Pension Fund-Global (GPFG), created by Norway in 1990,18 This fund receives all net revenues from oil exploration in Norway, plus the return on the investment of these resources, minus the total amount transferred to the country’s fiscal budget (Machado e Silva and Medeiros Costa, 2019).
Norway and its sovereign wealth fund are examples of the revenues obtained from hydrocarbon exploration being used to diversify the economy, by nurturing the development of sectors unrelated to non-renewable natural resources. Before GPFG was created, Norway set up a fund that invested exclusively in its domestic market, providing large sums for the development of other industries and job creation (de Rosa and Bartsch, 2016). This has contributed to the fact that the country currently ranks thirty-eighth (out of 131 countries) in the economic complexity ranking of the Observatory of Economic Complexity (OEC), despite the fact that its exports are still dominated by hydrocarbons (OEC, 2022a). Another example is Malaysia which, thanks to an industrial policy based on developing products with higher technological content and the promotion of skill upgrading policies, succeeded in concentrating 35.6% of its exports in the electrical equipment sector (Gelb, 2010; OEC, 2022a). Despite the multiplicity of existing instruments and their applicability to different realities, governments need to adopt strategies to ensure that non-renewable energy exploration and production activities are converted into lasting benefits for society at large. This is especially crucial in the context of the energy transition, where the objective is to make these sources obsolete and no longer exploit them. Governments should therefore play an active role in maximizing the benefits that can be extracted from the hydrocarbon industry in the short term, while the resources in question remain necessary for energy security during the transition to a predominantly clean and renewable energy matrix.19
E. Conclusions
The global energy panorama is in one of its most challenging phases. Following a period of economic slowdown and the consequent sharp decline in energy demand and prices during the COVID-19 pandemic, global energy demand has increased substantially in recent years. However, the conflict in Ukraine, compounded by climatic and geopolitical factors, has fuelled uncertainty in global energy supply, which is increasingly considered a strategic resource. Moreover, concerted actions recently
18 In 1990, the Norwegian Parliament adopted the law that created the “Government Petroleum Fund” (NBIM, n.d.). In 2005, the name was changed to “Government Pension Fund Global” (Machado e Silva and Medeiros Costa 2019).
19 In this context, it is important to note the existence, in Latin America and the Caribbean, of the Regional Technical Forum of Energy Planners (FOREPLEN). This forum serves as a permanent cooperation mechanism, seeking to bring together teams and entities involved in energy planning in Latin America. Its purpose is to generate, jointly and with a long-term vision, the knowledge needed to plan sustainable, safe and affordable energy systems, in order to promote complementarity in the energy transition in the region. The main objective of the forum is thus to create a platform for technical exchange to strengthen cooperation between countries on regional energy planning issues (ECLAC n.d.).
128 Economic Commission for Latin America and the Caribbean (ECLAC) Chapter II
taken by the world’s major oil and natural gas producers have driven up the prices of these energy inputs. Given the high degree of global dependence on non-renewable energy sources, investment in hydrocarbons remains very attractive in the short term.
For Latin America and the Caribbean, this increased demand for energy is likely to be positive news for hydrocarbon-exporting countries, especially in the context of the recent discoveries of new reserves and the interest they have aroused among international investors. Although M&A flows in the sector have been trending down since 2019, project announcements increased by 707% in the last year alone. This increase has been driven mainly by projects related to oil and natural gas prospecting, exploration and production. It is notable that investments in the upstream stage of the hydrocarbon value chain are often the starting point from which transnational firms roll out their strategies in Latin America and the Caribbean. These investments define their interest in the expansion of existing projects, other similar ventures or other stages of the value chain that promote the processing and distribution of the extracted hydrocarbons.
The rents associated with the exploitation of these resources represent a promise and also a hope for several governments in the region, especially after years of economic growth at rates below those needed to achieve the Sustainable Development Goals, compounded by scant fiscal space and a significant external constraint. However, they also provide opportunities for creating jobs and adding value, whether in the hydrocarbon industry itself (refineries, petrochemicals, etc.), or in the industries supplying the inputs and services needed to develop large projects in the countries of the region, or even in economic activities that are unrelated to the exploitation of non-renewable resources. However, this growing demand for hydrocarbons, and promises of future investments in the exploration, extraction and production of oil and natural gas do not seem to be compatible with the urgent need to mitigate the effects of climate change. The energy transition requires the exploitation of new hydrocarbon reserves to be halted and the use of fossil fuels to be phased out in the coming years, while increasing investments in clean and renewable energies. This situation makes hydrocarbon investments riskier, more costly and less viable. For Latin America and the Caribbean, this could lead not only to the underutilization of existing resources, which are a major source of income and employment in the region, but also to a large amount of capital being lost prematurely by becoming stranded assets.
Increased investment notwithstanding, clean and renewable energy sources have yet to attain the scale necessary for a successful and secure energy transition. Moreover, despite having made commitments to the energy transition, large international and national companies in the oil, coal and natural gas sector have acted timidly in changing their business model. In fact, they have increased their investments in the carbon-intensive sector, especially after reporting record earnings in 2022. This scenario gives the region’s governments an even more important role. Firstly, they are responsible for defining the regime under which non-renewable resources will be exploited, especially those related to new discoveries; along with their depletion policy and how the revenues from the activity will be used to the benefit of society. They must also play an active role in defining how these resources will be maximized, either by promoting economic activities in other stages of the hydrocarbon value chain, or beyond, by fostering the productive development of other sectors. In addition, they have a role in evaluating the feasibility of providing incentives for the large-scale adoption of technologies such as carbon capture and storage and carbon capture, utilization and storage, which are essential for the future of the hydrocarbons industry.
Secondly, governments must be the lead actors in coordinating strategies to achieve a successful energy transition in the region. They are responsible for making sure that non-renewable energy activities are reduced radically, as required by the climate commitments, while managing to mitigate their negative effects and their economic and social costs, especially in terms of investments, employment and income. One of their central functions is to develop long-term policies that promote investments
129 Foreign Direct Investment in Latin America and the Caribbean • 2023 Chapter II
in renewable energy sources, so that the transition is rapid and secure, and does not leave the region lagging behind in a context in which energy from clean sources is a factor of competition. However, another of their functions is to ensure that this transition enables their productive apparatus to become more sophisticated and diversified in sectors unrelated to extractive activities, while at the same time not jeopardizing the energy security of their populations. International cooperation also has a key role, as a source of both guidelines and know-how, and resources and technologies that make a just energy transition possible.
This chapter has explained the importance of non-renewable energy sources in the context of the energy transition, providing an overview of investments in the sector, with a focus on Latin America and the Caribbean. It also identified the challenges and opportunities facing the region in this context, highlighting the role of governments in managing the exploitation of non-renewable energy sources during the energy transition. To complete the regional overview of the energy transition, the challenges and opportunities of renewable energy sources will be discussed in chapter III.
Bibliography
Adedeji, A. N. and others (2016), “The role of local content policy in local value creation in Nigeria’s oil industry: a structural equation modeling (SEM) approach”, Resources Policy, vol. 49, September.
Agência Brasil (2023), “Petrobras: récord de reinyección de gas en yacimientos subterráneos”, 27 February [online] https://agenciabrasil.ebc.com.br/es/economia/noticia/2023-02/petrobras-record-de-reinyeccionde-gas-en-yacimientos-subterraneos.
Al-Moneef, M. (1998), “Vertical integration strategies of the national oil companies”, The Developing Economies, vol. XXXVI, No. 2, June.
Álvarez, E. and others (2018), “The oil and gas value chain: a focus on oil refining”, Cuadernos Orkestra, No. 2018/46, Basque Institute of Competitiveness [online] https://emcombustion.es/wp-content/uploads/2018/12/ orkestra_the-oil-gas-value-chain-refining-emcombustion1.pdf.
Arbache, J. (2022), “Powershoring II”, Development Bank of Latin America (CAF), 7 December [online] https:// www.caf.com/es/conocimiento/visiones/2022/12/powershoring-ii/.
Arroyo, A. (2019), “Estado de situación y perspectivas de los hidrocarburos en la región”, La bonanza de los recursos naturales para el desarrollo: dilemas de gobernanza, ECLAC Books, No. 157 (LC/PUB.2019/13-P), R. Sánchez (ed.), Santiago, Economic Commission for Latin America and the Caribbean (ECLAC).
Austrade (Australian Trade and Investment Commission) (2023), “INPEX energises Australia’s resources sector with US$34 billion LNG investment” [online] https://www.austrade.gov.au/international/invest/importanceof-foreign-direct-investment/japanese-investment-in-australia/real-stories/inpex.
Benjamin, N., S. Devarajan and R. Weiner (1986), “Oil revenues and the ‘Dutch disease’ in a developing country: Cameroon”, OPEC Review, vol. 10, No. 2, June.
Bertrand, S. (2021), “Fact Sheet: Climate, environmental, and health impacts of fossil fuels (2021)”, Environmental and Energy Study Institute (EESI), 17 December [online] https://www.eesi.org/papers/view/fact-sheetclimate-environmental-and-health-impacts-of-fossil-fuels-2021.
Binsted, M. and others (2020), “Stranded asset implications of the Paris Agreement in Latin America and the Caribbean”, Environmental Research Letters, vol. 15, No. 4, April.
BloombergNEF (2022), “New Energy Outlook 2022. Executive summary” [online] https://bnef.turtl.co/story/ neo-2022/page/3?teaser=yes.
BNamericas (2021), “Carbon capture, storage and LatAm’s race to net zero”, 9 November [online] https://www. bnamericas.com/en/interviews/carbon-capture-storage-and-latams-race-to-net-zero.
Bousso, R. and S. Valle (2023), “Big Oil’s good times set to roll on after record 2022 profits”, Reuters, 17 January [online] https://www.reuters.com/business/energy/big-oils-good-times-set-roll-after-record-2022profits-2023-01-17/.
Bulgheroni, M. (2017), “Latin America oil and gas: the search for efficiency and improved competitiveness”, World Economic Forum (WEF), 5 April [online] https://www.weforum.org/agenda/2017/04/latin-americaoil-gas-the-search-for-efficiency-and-improved-competitiveness/.
Caldecott, B. and others (2016), Stranded Assets: A Climate Risk Challenge. Summary, Inter-American Development Bank (IDB), Washington, D.C.
130 Economic Commission for Latin America and the Caribbean (ECLAC) Chapter II
Campodónico, H. (2004), “Reformas e inversión en la industria de hidrocarburos de América Latina”, Natural Resources and Infrastructure series, No. 18 (LC/L.2200-P), Santiago, Economic Commission for Latin America and the Caribbean (ECLAC).
Carpenter, J. W. (2023), “The biggest oil producers in Latin America”, Investopedia, 20 January [online] https:// www.investopedia.com/articles/investing/101315/biggest-oil-producers-latin-america.asp.
Casey, K., K. Shotts and S. Melvin (2017), “Repsol and YPF (A): a perfect marriage?”, Case Studies, No. P90 (A), Stanford Graduate School of Business [online] https://www.gsb.stanford.edu/faculty-research/case-studies/ repsol-ypf-perfect-marriage.
CincoDías (2005), “Alianza con Chevron para invertir 6.000 millones de dólares en Venezuela”, El País, 1 April [online] https://cincodias.elpais.com/cincodias/2005/04/01/empresas/1112362783_850215.html.
Copec (2007), “Copec y sus filiales” [online] https://qa.copec.cl/wp7/wps/wcm/connect/Copec+Publico+Web+ Content/Copec+Publico/Nuestra+Empresa/Copec+y+sus+Filiales/.
Corden, W. M. and J. P. Neary (1982), “Booming sector and de-industrialisation in a small open economy”, The Economic Journal, vol. 92, No. 368, December.
De Rosa, D. and U. Bartsch (2016), “Economic diversification - the trillion dollar question: when and how?” 10 May [online] https://blogs.worldbank.org/europeandcentralasia/economic-diversification-trilliondollar-question-when-and-how.
Deloitte (2023), 2023 Oil and Gas M&A Outlook: Pivoting for Change, Deloitte Research Center for Energy & Industrials [online] https://www2.deloitte.com/us/en/pages/energy-and-resources/articles/oil-and-gasmergers-and-acquisitions.html.
DW (Deutsche Welle) (2022), “Descubren yacimientos de gas en la costa caribeña de Colombia”, 6 de octubre [online] https://www.dw.com/es/descubren-yacimientos-de-gas-en-la-costa-caribe%C3%B1a-decolombia/a-63364041.
ECLAC (Economic Commission for Latin America and the Caribbean) (2023a), Halfway to 2030 in Latin America and the Caribbean: progress and recommendations for acceleration (LC/FDS.6/3), Santiago. (2023b), Regional Agreement on Access to Information, Public Participation and Justice in Environmental Matters in Latin America and the Caribbean: implementation guide (LC/TS.2021/221/Rev.2), Santiago. (2022), Foreign Direct Investment in Latin America and the Caribbean, 2022 (LC/PUB.2022/12-P), Santiago. (2021), CEPALSTAT [online database] https://statistics.cepal.org/portal/cepalstat/index.html?lang=es. (2006), Foreign Investment in Latin America and the Caribbean, 2005 (LC/G.2309-P), Santiago. (n.d.), “Foro Regional de Planificadores Energéticos (FOREPLEN)”, 30 November [online] https://www. cepal.org/es/foreplen.
Ecopetrol (2021), “Acerca de Ecopetrol”, 11 February [online] https://www.ecopetrol.com.co/wps/portal/Home/ es/NuestraEmpresa/QuienesSomos/acerca-de-ecopetrol. (2014), “Nuestra historia”, 8 September [online] https://www.ecopetrol.com.co/wps/portal/Home/es/ NuestraEmpresa/QuienesSomos/NuestraHistoria.
EIA (Energy Information Administration) (2022a), “What is energy? Sources of energy”, 28 June [online] https:// www.eia.gov/energyexplained/what-is-energy/sources-of-energy.php. (2022b), “What countries are the top producers and consumers of oil?”, 8 December [online] https://www. eia.gov/tools/faqs/faq.php?id=709&t=6.
Eissa, M. A. and M. M. Elgammal (2020), “Foreign direct investment determinants in oil exporting countries: revisiting the role of natural resources”, Journal of Emerging Market Finance, vol. 19, No. 1, April.
Electricidad (2010), “IOC = ¿NOC?”, 9 April [online] https://www.revistaei.cl/reportajes/ioc-noc/. Ennes, J. (2019), “LNG-to-power in Brazil and GNA I”, IJGlobal, 15 May [online] https://www.ijglobal.com/ articles/139927/lng-to-power-in-brazil-and-gna-i.
EPE (Empresa de Pesquisa Energética) (n.d.), “Fontes de energia” [online] https://www.epe.gov.br/pt/ abcdenergia/fontes-de-energia.
EP Petroecuador (2013), “El petróleo en el Ecuador: la nueva era petrolera” [online] https://www.eppetroecuador. ec/wp-content/uploads/downloads/2015/03/El-Petróleo-en-el-Ecuador-La-Nueva-Era.pdf.
Espinasa, R., R. Medina and G. Tarre (2016), La ley y los hidrocarburos: comparación de marcos legales de América Latina y el Caribe, C. Sucre (coord.), Inter-American Development Bank (IDB).
Europa Press (2006), “Economía/Empresas.- Repsol YPF participará en la construcción de una planta de gas natural en Perú”, 13 January [online] https://www.europapress.es/economia/noticia-economia-empresasrepsol-ypf-participara-construccion-planta-gas-natural-peru-20060113141751.html.
Evans, B., S. Nyquist and K. Yanosek (2016), “Mergers in the oil patch: lessons from past downturns”, McKinsey Insights, 13 July [online] https://www.mckinsey.com/capabilities/strategy-and-corporate-finance/ourinsights/mergers-in-the-oil-patch-lessons-from-past-downturns.
131 Foreign Direct Investment in Latin America and the Caribbean • 2023 Chapter II
Fortune (2022), “Global 500” [online] https://fortune.com/ranking/global500/.
Gelb, A. (2010), “Economic diversification in resource rich countries”, International Monetary Fund (IMF) [online]
https://www.imf.org/external/np/seminars/eng/2010/afrfin/pdf/gelb2.pdf.
González-Mahecha, E. and others (2019), “Committed emissions and the risk of stranded assets from power plants in Latin America and the Caribbean”, Discussion Paper, No. IDB-DP-00708, Washington, D.C., Inter-American Development Bank (IDB).
Guttman, D. (2020), “NOCs vs IOCs”, Guttman Energy, 6 April [online] https://www.guttmanenergy.com/fuelmatters-blog/nocs-vs-iocs/.
Hausmann, R. (2021), “Green growth at the end of the flat world”, Project Syndicate, 9 December [online]
https://www.project-syndicate.org/commentary/green-growth-and-end-of-flat-energy-world-by-ricardohausmann-2021-12.
Hazin, M. S. and D. Sotelsek Salem (2019), “Implementación, adaptación y funcionamiento de los fondos soberanos de inversión”, La bonanza de los recursos naturales para el desarrollo: dilemas de gobernanza, ECLAC Books, No. 157 (LC/PUB.2019/13-P), R. Sánchez (ed.), Santiago, Economic Commission for Latin America and the Caribbean (ECLAC).
Hidalgo, E. (2018), “Raízen completa compra de operaciones de Shell en Argentina”, LexLatin, 9 October [online]
https://lexlatin.com/noticias/raizen-completa-compra-de-operaciones-de-shell-en-argentina.
ICOS (Integrated Carbon Observation System) (n.d.), “About greenhouse gases” [online] https://www.icos-cp. eu/science-and-impact/climate-change/ghgs [accessed on 13 April 2023].
IEA (International Energy Agency) (2022a), “World energy balances highlights” [online] https://www.iea.org/ data-and-statistics/data-product/world-energy-balances-highlights.
(2022b), World Energy Investment 2022, Paris.
(2022c), Methane Emissions from Oil and Gas Operations, Paris.
(2022d), World Energy Outlook 2022, Paris.
(2021a), “Final consumption”, Key World Energy Statistics 2021, Paris.
(2021b), Net Zero by 2050: A Roadmap for the Global Energy Sector, Paris.
(2018), The Future of Petrochemicals: Towards more Sustainable Plastics and Fertilisers, Paris.
IPCC (Intergovernmental Panel on Climate Change) (2023), AR6 Synthesis Report: Climate Change 2023 [online] https://www.ipcc.ch/report/ar6/syr/.
(2022a), “Summary for policymakers”, Climate Change 2022: Mitigation of Climate Change. Working Group III Contribution to the Sixth Assessment Report of the Intergovernmental Panel on Climate Change, P. R. Shukla and others (eds.), Cambridge University Press.
(2022b), “Global Warming of 1.5°C”, An IPCC Special Report on Impacts of Global Warming of 1.5°C above Pre-Industrial Levels in Context of Strengthening Response to Climate Change, Sustainable Development, and Efforts to Eradicate Poverty, Cambridge University Press.
(2005), IPCC Special Report on Carbon Dioxide Capture and Storage, B. Metz and others (eds.), Cambridge University Press.
IRBC (International Responsible Business Conduct) (2019), Analysis of the Oil & Gas Value Chain [online] https:// www.imvoconvenanten.nl/-/media/imvo/files/banking/news/dba-analysis-oil-gas.pdf?la=en&hash= 1203950AEEC3C80C4BB490C066EF7B7F.
Jaramillo, E. (2021), “Mexico’s efforts to undo the 2013 energy reform: substantives and procedural protections for ‘covered investments’ under the USMCA”, Kluwer Arbitration Blog, 22 May [online] https://arbitrationblog. kluwerarbitration.com/2021/05/22/mexicos-efforts-to-undo-the-2013-energy-reform-substantives-andprocedural-protections-for-covered-investments-under-the-usmca/.
Jiménez, D. and M. Sáez (2022), “Agregación de valor en la producción de compuestos de litio en la región del triángulo del litio”, Project Documents (LC/TS.2022/87), Santiago, Economic Commission for Latin America and the Caribbean (ECLAC).
Lanzafame, S. (2022), “Los clústers de oil & gas crecen de la mano de Vaca Muerta”, El Cronista, 3 October [online] https://www.cronista.com/pyme/negocios-pyme/los-clusters-de-oil-gas-crecen-de-la-mano-de-vaca-muerta/.
Ledesma, D. (2009), The Changing Relationship between NOCs and IOCs in the LNG Chain, Oxford Institute for Energy Studies [online] https://www.oxfordenergy.org/publications/the-changing-relationship-betweennocs-and-iocs-in-the-lng-chain/.
Lefebvre, B. (2023), “Oil industry sees a vibe shift on climate tech”, POLITICO, 8 March [online] https://www. politico.com/news/2023/03/08/oil-industry-shift-climate-tech-00085853.
Londoño, J. G. (2008), “Acciones de Ecopetrol estarán en Bolsa de Nueva York desde el 18 de septiembre”, El Tiempo, 12 September [online] https://www.portafolio.co/economia/finanzas/acciones-ecopetrolestaran-bolsa-nueva-york-18-septiembre-481892.
132 Economic Commission for Latin America and the Caribbean (ECLAC) Chapter II
Machado e Silva, I. M. and H. K. de M. Costa (2019), “Brazilian social funds: the lessons learned from the Norway fund experience”, Energy Policy, vol. 129, June.
Martínez Ortiz, A. and M. E. Delgado (2021), Los retos del grupo Ecopetrol y del país frente a la transición energética, Bogotá, Foundation for Higher Education and Development (Fedesarrollo), 3 November [online] http:// www.repository.fedesarrollo.org.co/handle/11445/4256.
MásEnergía (2022), “Planta de GNL: la inversión de YPF y Petronas ascenderá a US$ 40.000 millones”, Lmnenergia. com, 1 September [online] https://mase.lmneuquen.com/gnl/planta-gnl-la-inversion-ypf-y-petronasascendera-us-40000-millones-n943369.
McGlade, C. (2019), “Can CO2-EOR really provide carbon-negative oil?”, International Energy Agency (IEA), 11 April [online] https://www.iea.org/commentaries/can-co2-eor-really-provide-carbon-negative-oil.
McLean, S., D. Charles and A. Rajkumar (2021), “Navigating transfer pricing risk in the oil and gas sector: essential elements of a policy framework for Trinidad and Tobago and Guyana”, Studies and Perspectives series-ECLAC Subregional Headquarters for the Caribbean, No. 101 (LC/TS.2021/10/Rev.1-LC/CAR/TS.2021/3/Rev.1), Santiago, Economic Commission for Latin America and the Caribbean (ECLAC).
MexicoNow (2018), “Oil and gas company Hokchi Energy unveils US$ 2.5 billion investment plan”, 5 October [online] https://mexico-now.com/oil-and-gas-company-hokchi-energy-unveils-us-2-5-billion-investment-plan/.
Ministry of Economy (2018), “YPF y Petronas invertirán USD 2300 millones en Vaca Muerta para el desarrollo de petróleo no convencional” 4 December [online] https://www.argentina.gob.ar/noticias/ypf-y-petronasinvertiran-usd-2300-millones-en-vaca-muerta-para-el-desarrollo-de-petroleo.
Ministry of Mines and Energy (2022), “Novo Mercado de Gás” [online] https://www.gov.br/mme/pt-br/assuntos/ secretarias/petroleo-gas-natural-e-biocombustiveis/novo-mercado-de-gas/. (2019), “Ministro faz visita técnica ao Complexo do Porto do Açu”, 2 August [online] https://www.gov.br/ mme/pt-br/assuntos/noticias/ministro-faz-visita-tecnica-ao-complexo-do-porto-do-acu.
Ministry of Public Works (n.d.), “YPF” [online] https://www.argentina.gob.ar/obras-publicas/comision-ddhh/ historia-organismos-nacionales/ypf.
Morris, M., R. Kaplinsky and D. Kaplan (2012), “‘One thing leads to another’—Commodities, linkages and industrial development”, Resources Policy, vol. 37, No. 4, December.
Nagaeva, O. S. (2021), “The development model of oil and gas producing region: enclave or cluster”, European Proceedings of Social and Behavioural Sciences (EpSBS) [online] https://www.europeanproceedings.com/ advanced-search/results?bookSeriesId=3&title=The+development+model+of+oil+and+gas+producing +region%3A+enclave+or+cluster.
NBIM (Norges Bank Investment Management) (n.d.), “The history” [online] https://www.nbim.no/en/the-fund/ the-history/.
Nunes, R. de C. and H. K. de M. Costa (2021), “Chapter 5 - Carbon capture and storage technologies and efforts on climate change in Latin American and Caribbean countries”, Carbon Capture and Storage in International Energy Policy and Law, H. K. de M. Costa and C. Arlota (eds.), Elsevier.
Nurshayeva, R. (2016), “Kazakhs, Chevron-led group approve $37 billion Tengiz field expansion”, Reuters, 5 July [online] https://www.reuters.com/article/us-chevron-kazakhstan-idUSKCN0ZL0X4.
OEC (Observatory of Economic Complexity) (2022a), “Norway” [online] https://oec.world/en/profile/country/nor. (2022b), “Malaysia” [online] https://oec.world/en/profile/country/mys?depthSelector1=HS2Depth.
Offshore Energy (2022), “Petronas and YPF to collaborate on LNG project in Argentina”, 2 September [online] https://www.offshore-energy.biz/petronas-and-ypf-to-collaborate-on-lng-project-in-argentina/.
Offshore Technology (2022), “Equinor and Exxon agree to boost production of Brazilian offshore field”, 18 May [online] https://www.offshore-technology.com/news/equinor-exxon-brazil-field/.
OLADE (Latin American Energy Organization) (2022), Panorama Energético de América Latina y el Caribe 2021, Quito. (2015), Riesgos de la explotación de los hidrocarburos no convencionales en América Latina y el Caribe, Quito. Parkland (2018), “Parkland Fuel Corporation to acquire 75% of SOL, the largest independent fuel marketer in the Caribbean”, 10 October https://www.parkland.ca/application/files/5415/4238/8955/Parkland_Sol_ Transaction_Investor_Presentation.pdf.
Perúpetro (n.d.), “¿Quiénes somos?” [online] https://www.perupetro.com.pe/wps/portal/corporativo/PerupetroSite/. Petrobras (2021), “Concluímos venda da Refinaria Landulpho Alves (RLAM) para o Mubadala Capital”, 30 November [online] https://petrobras.com.br/fatos-e-dados/concluimos-venda-da-refinaria-landulpho-alves-rlampara-o-mubadala-capital.htm.
(2019), “Concluímos a venda da TAG”, 13 June [online] https://petrobras.com.br/fatos-e-dados/concluimosa-venda-da-tag.htm.
(n.d.), “Mudanças climáticas e transição para baixo carbono”, [online] https://petrobras.com.br/pt/sociedadee-meio-ambiente/meio-ambiente/mudancas-do-clima/.
133 Foreign Direct Investment in Latin America and the Caribbean • 2023 Chapter II
PETROPERÚ (2023), “Acerca de Petroperú. Historia” [online] https://www.petroperu.com.pe/acerca-depetroperu/historia/.
Poelhekke, S. and F. van der Ploeg (2013), “Do natural resources attract nonresource FDI?”, The Review of Economics and Statistics, vol. 95, No. 3, July.
Reuters (2015), “Grupo español Abengoa se adjudica contrato de 1.550 mln dlr para planta en México”, Reuters, 12 January [online] https://www.reuters.com/article/latinoamerica-energia-abengoa-mexicoidLTAKBN0KL0UJ20150112.
Rozenberg, J., A. Vogt-Schilb and S. Hallegatte (2017), “Instrument choice and stranded assets in the transition to clean capital”, IDB Working Paper series, No. IDB-WP-782, Washington, D.C., Inter-American Development Bank (IDB).
San Juan, P. (2016), “Copec firma acuerdo por US$747 millones para comprar activos de ExxonMobil en Perú, Ecuador y Colombia”, La Tercera, 16 November [online] https://www.latercera.com/noticia/copec-firmaacuerdo-us712-millones-exxonmobil-comprar-plantas-combustibles/.
Sánchez, R. A. (1998), “El desarrollo de la industria petrolera en América Latina”, Revista Mexicana de Sociología, vol. 60, No. 3, July–September.
Sánchez, R. J., S. Sánchez di Doménico and B. Tovar de la Fe (2019), “La bendición o la maldición de los recursos naturales: un breve análisis empírico”, La bonanza de los recursos naturales para el desarrollo: dilemas de gobernanza, ECLAC Books, No. 157 (LC/PUB.2019/13-P), R. Sánchez (ed.), Santiago, Economic Commission for Latin America and the Caribbean (ECLAC).
Satti, S. L. and others (2014), “Empirical evidence on the resource curse hypothesis in oil abundant economy”, Economic Modelling, vol. 42, October.
Saudi Aramco (2022), “Aramco announces third quarter 2022 results” [online] https://www.aramco.com/-/ media/publications/corporate-reports/saudi-aramco-q3-2022-interim-report-english.pdf. (2021), “Aramco announces $15.5 billion landmark gas pipeline deal with global consortium led by BlackRock Real Assets and Hassana Investment Company”, 6 December [online] https://www.aramco.com/en/newsmedia/news/2021/aramco-announces-landmark-gas-pipeline-deal.
SBTi (Science Based Targets initiative) (2020), “Annex A - Non-energy uses of petroleum and gas products”, Guidance on Setting Science-based Targets for Oil, Gas and Integrated Energy companies, 10 August [online]
https://sciencebasedtargets.org/resources/legacy/2020/08/OG-Annex-A-Non-energy-uses-of-petroleumand-gas-products-2.pdf.
Serrani, E. (2013), “América latina y su política petrolera frente a las últimas tendencias internacionales: perspectivas regionales a partir del análisis de Brasil y Argentina”, Foro Internacional, vol. LIII, No. 1, January–March.
Shell Argentina (2018), “Shell vende a la empresa Raízen su negocio de downstream en Argentina”, 24 April [online] https://www.shell.com.ar/prensa/2018-media-releases/shell-to-sell-its-downstream-businessin-argentina.html.
Shell Brasil (2019), “Pátria Investimentos, Shell and Mitsubishi Hitachi Power Systems (MHPS) announce thermoelectric partnership”, 25 February [online] https://www.shell.com.br/imprensa/comunicados-para-aimprensa-2019/patria-investiments-shell-and-mitsubishi-hitachi-power-systems-announce-thermoelectricpartnership.html.
Shell Canada (2018), “Shell gives green light to invest in LNG Canada”, 2 October [online] https://www.shell. ca/en_ca/media/news-and-media-releases/news-releases-2018/shell-gives-green-light-to-invest-in-lngcanada.html.
Smil, V. (1994), Energy and Civilization: A History, The MIT Press.
Solís, A. (2022), “Exclusive: BP pulls out of oil, gas exploration in Mexico”, Bloomberg Línea, 15 August [online]
https://www.bloomberglinea.com/english/exclusive-bp-pulls-out-of-oil-gas-exploration-in-mexico/.
Steyn, M. and others (coords.) (2022), Global Status of CCS 2022, Global CCS Institute [online] https://www. globalccsinstitute.com/resources/global-status-of-ccs-2022/.
Stillman, A. (2022), “BP is exiting its Mexican oil assets in shift toward renewables”, BNN Bloomberg, 15 August [online] https://www.bnnbloomberg.ca/bp-is-exiting-its-mexican-oil-assets-in-shift-toward-renewables-1.1806102.
Suppes, G. J. and T. S. Storvick (2016), Sustainable Power Technologies and Infrastructure: Energy Sustainability and Prosperity in a Time of Climate Change, Elsevier.
The Guardian (2022), “Saudi Aramco overtakes Apple as world’s most valuable company”, 12 May [online]
https://www.theguardian.com/business/2022/may/12/saudi-aramco-overtakes-apple-worlds-mostvaluable-company.
The New York Times (2022), “Saudi Aramco reports $42 billion in profit as cash rolls in for oil giants”, 1 November [online] https://www.nytimes.com/2022/11/01/business/saudi-aramco-oil-profit.html.
134 Economic Commission for Latin America and the Caribbean (ECLAC) Chapter II
Tienhaara, K. (2011), “Foreign investment contracts in the oil & gas sector: a survey of environmentally relevant clauses”, Investment Treaty News, 7 October [online] https://www.iisd.org/itn/en/2011/10/07/foreigninvestment-contracts-in-the-oil-gas-sector-a-survey-of-environmentally-relevant-clauses/.
Titelman, D. and others (2022), Fiscal Impact Estimates of a Net-Zero Emissions Transition for Major Hydrocarbon Producers in Latin America and the Caribbean, Task Force on Climate, Development and the International Monetary Fund [online] https://www.bu.edu/gdp/files/2022/04/TF-WP-004-EN-FIN.pdf.
Tordo, S., B. S. Tracy and N. Arfaa (2011), “National oil companies and value creation”, Working Paper, No. 218, Washington, D.C., World Bank.
Tordo, S. and others (2013), Local Content Policies in the Oil and Gas Sector, Washington, D.C., World Bank. United Nations (2023), “Secretary-General’s remarks at the World Economic Forum”, 18 January [online] https:// www.un.org/sg/en/content/sg/statement/2023-01-18/secretary-generals-remarks-the-world-economic-forum. (2022), 2021 International Trade Statistics Yearbook, vol II, New York, https://comtradeplus.un.org/ Publication/ITSY.
(2021), Theme Report on Energy Transition: Towards the Achievement of SDG 7 and Net-Zero Emissions [online] https://www.un.org/en/hlde-2021/page/theme-reports.
U.S. Cluster Mapping Project (2020), “Oil and gas production and transportation” [online] https://clustermapping. us/cluster/oil_and_gas_production_and_transportation.
Valle, S. and A. Kumar (2022), “Exxon to invest $10 billion in massive Guyana offshore oil project”, Reuters, 4 April [online] https://www.reuters.com/business/energy/exxon-invest-10-billion-massive-guyana-offshore-oilproject-2022-04-04/.
Van der Ploeg, F. and S. Poelhekke (2009), “Volatility and the natural resource curse”, Oxford Economic Papers, vol. 61, No. 4, October.
WRI (World Resources Institute) (2021), “How the US can address legacy fossil fuel sites for a clean energy future”, 27 September [online] https://www.wri.org/insights/addressing-us-legacy-fossil-fuel-infrastructure.
Yazdanian, N. (2014), “Investigation of the determinants of foreign direct investment in oil-producing countries”, International Journal of Economy, Management and Social Sciences, vol. 3, No. 12, December.
YPF (2015), “YPF S.A. y PETRONAS E&P ARGENTINA S.A. comunican el inicio de vigencia del acuerdo para el desarrollo de hidrocarburos no convencionales en el área La Amarga Chica en la provincia del Neuquén”, 11 May [online] https://edicion.ypf.com/inversoresaccionistas/Lists/HechosRelevantes/11-05-2015-BCBAHR.%20Petronas-Inicio-de-Vigencia-Mayo-2015.pdf.
Yue, X.-L. and Q.-X. Gao (2018), “Contributions of natural systems and human activity to greenhouse gas emissions”, Advances in Climate Change Research, vol. 9, No. 4, December.
Zenteno Barrios, F. J. (1997), “La regulación de los hidrocarburos en México”, Regulación del sector energético, Mexico City, National Autonomous University of Mexico (UNAM)/Ministry of Energy.
135 Foreign Direct Investment in Latin America and the Caribbean • 2023 Chapter II
CHAPTER
Foreign direct investment in renewable energies: strategies to advance the energy transition in Latin America and the Caribbean
Introduction
A. The importance of renewable energy investment for the energy transition and attainment of the Sustainable Development Goals
B. Global trends in renewable energy foreign direct investment
C. Opportunities for the development of renewable energies in Latin America and the Caribbean
D. Renewable energy foreign direct investment in the region: dominated by two technologies in three countries
E. Policy approaches for promoting renewable energy and attracting foreign direct investment
F. Conclusions
Bibliography
137 Foreign Direct Investment in Latin America and the Caribbean • 2023 Chapter III
III
138 Economic Commission for Latin America and the Caribbean (ECLAC) Chapter III
Introduction
Renewable energies have been one of the main drivers of international investment. In 2005, foreign investment announcements in this area accounted for only 6% of total energy-related foreign investment announcements worldwide by value; in 2022, they accounted for 80%.
Several factors have driven the growth in renewable energy investment, from climate change and the need to comply with international climate agreements to rising energy demand and falling prices for renewable generation technologies.
Since the COVID-19 pandemic and the conflict in Ukraine, the energy transition has become a strategic priority for the world’s largest economies and has been increasingly linked to production development and energy security policies.1 The European Union and the United States have adopted and committed substantial resources to plans to accelerate the energy transition and strengthen production capabilities in related sectors, while China’s latest five-year plan includes a target for decarbonizing the country.
International climate commitments, the growing need for energy security and the role of energy in enabling sustainable growth all mean that the global use of renewable energies can be expected to increase. While investment in the sector has consistently risen, the International Renewable Energy Agency (IRENA) estimates that some US$ 131 trillion needs to be invested by 2050 if the goal of limiting the average rise in global temperature to 1.5 °C is to be met (IRENA, 2021). For this investment to occur, ambitious national and regional strategies will have to be implemented so that resources for the energy transition are mobilized.
The countries of Latin America and the Caribbean are very well positioned to take advantage of this transition, since they have well-developed energy markets and great potential in terms of their endowment of renewable energy resources. The region’s countries have progressively greened their electricity generation mix in recent decades, so that it is now among the world’s cleanest. However, renewable generation has been dominated by the large installed hydroelectric capacity in those countries. The effects of climate change and alterations in rainfall intensity are increasing the vulnerability of water sources, requiring renewable energy generation sources to be diversified beyond hydropower (IEA, 2021a). Expansion of the capacity of other technologies, in particular solar and wind power, represents a major opportunity to accelerate the region’s energy transition and diversify its energy mix.
The region’s markets have attracted the interest of international investors and become globally strategic. Between 2005 and 2022, they were the destination for more than 500 renewable energy foreign direct investment (FDI) project announcements worth a total of almost US$ 170 billion. The most attractive markets were Brazil, Chile and Mexico, which accounted for more than 80% of all announcements in the region. Solar and wind energy were the main technologies, representing almost 70% of all investment projects.
While most countries have set medium-term goals and the region has made substantial progress in developing the sector, energy demand is projected to increase significantly in the coming years, requiring the mobilization of public and private resources. In the current context, characterized by inadequate growth and limited fiscal policy space, there is a need to implement medium- and long-term strategies to facilitate the energy transition and enable its capacity-building potential to be harnessed. ECLAC (2023) has identified the energy transition as a priority area of action for the region’s recovery strategies. A clean energy supply will be essential for it to move towards more sustainable models of development. Clean energy can become a competitive factor as the region seeks to develop new production sectors and attract investment in other sectors apart from renewable
139 Foreign Direct Investment in Latin America and the Caribbean • 2023 Chapter III
1
In the literature, production development policies are also referred to as industrial policies.
energies. It is therefore necessary to set energy transition strategies within the framework of energy and production development policies by designing toolkits calibrated to the needs and capabilities of the countries that serve to strengthen the renewable energy sector and develop capabilities right along the chain and in related sectors. In this context, FDI can play a key role in technology transfer and capacity-building.
This chapter presents a brief analysis of the renewable energy sector and its FDI trends globally and in Latin America and the Caribbean. It also provides a detailed analysis of the dynamics of investment in solar and wind technologies, given that, unlike hydropower or biofuel, these sources were the main drivers of FDI in the region and the world during the period under review. At the end of the chapter, some of the main policy mechanisms that can be used to attract FDI and their potential impact on strategies to promote this type of investment in the countries of Latin America and the Caribbean are analysed.
A. The importance of renewable energy investment for the energy transition and attainment of the Sustainable Development Goals
The energy sector is currently the largest contributor to global greenhouse gas emissions. Oil, gas and other fossil fuels generate more than 75% of these and almost 90% of carbon dioxide emissions (UNEP, 2020a). To avoid climate change worsening and to meet the Paris Agreement goals, a 50% reduction in the overall emissions of the energy sector is required by 2030, on the way to net zero by 2050 (UNEP, 2020a). Achieving these targets requires an urgent energy transition to renewable energy sources and the implementation of strategies to decarbonize the energy sector. The objectives for the energy sector by 2030 have been established in the targets of SDG 7, which concerns access to affordable, secure, sustainable and modern energy for all. These targets are as follows:
7.1 Ensure access to affordable, reliable, sustainable and modern energy for all.
7.2 Increase substantially the share of renewable energy in the global energy mix.
7.3 Double the global rate of improvement in energy efficiency.
Achieving SDG 7 is critical to delivering the 2030 Agenda for Sustainable Development and the other SDGs. Sustainable and inclusive economic growth will depend heavily on the transition to renewable energies, which are essential for enhancing energy productivity and security in developing countries and transitioning the global economy towards less polluting sectors. Moreover, the energy transition will not only bring climate benefits. In its report on the pathway to net zero, the International Energy Agency (IEA) estimates that renewable energies will be essential to achieve climate goals, generate quality jobs and sustain economic growth (IEA, 2021b). Similarly, IRENA (2021) estimates that attaining 8,000 GW of installed renewable energy capacity could contribute significantly to achieving the 2030 Agenda goals. In particular, the transition would boost global GDP by an average of 1.3 percentage points per year by 2030. In addition, at least 25 new jobs are created for every million dollars of investment in renewable energies (IRENA, 2020).
The electricity sector will be the main driver of the energy transition. In 2021, the sector was responsible for 36% of total energy-related emissions, and IEA estimates that global electricity output will need to increase by 3.2% per year to 60,000 TWh by 2050 for climate targets to be met. Some 75% of the increase in global electricity demand will be in developing countries, whose electricity
140 Economic Commission for Latin America and the Caribbean (ECLAC) Chapter III
needs will grow 50% by 2030; from the sectoral point of view, the main drivers of this demand will be industry, transport systems and green hydrogen generation. The roll-out of renewables in all regions of the world will be essential to decarbonize the electricity sector and contribute to climate goals; in particular, almost 90% of electricity will have to be generated from renewable sources by 2050, with wind and solar power accounting for 70% of all the electricity produced in the world (IEA, 2021b).
In this scenario, investments to decarbonize the electricity and energy sector will be crucial to the transition. Over the last 20 years, policy initiatives to drive forward the energy transition have played an important role in redirecting investment towards renewable technologies. New capacity employing renewable technology has outstripped new non-renewable capacity since 2012: in 2022, the former accounted for 83% of all new installed capacity (IRENA, 2023). Globally, however, the energy mix is still dominated by non-renewables, which account for 60% of installed generating capacity (see figure III.1). Also, while installed renewable energy capacity is now 40% of total installed capacity globally, there are large disparities between regions. Asia accounts for 48% of total installed renewable energy capacity, followed by Europe with 21% and North America with 15%. The Latin American and Caribbean countries are home to just over 8% of this capacity and Africa and the Middle East to 2% (IRENA, 2023).
At the end of 2022, global installed renewable energy capacity was 3,372 GW. Hydropower was the largest contributor, with 37% of the total, followed by solar and wind energy, with 31% and 27%, respectively. Other renewables together accounted for 5% of total installed capacity (see figure III.2).
Solar and wind technologies have been the fastest-growing, contributing 12% of all electricity generated in 2022. The spread of these technologies has been due to technological advances and the fact that electricity costs less when generated from them. The current cost per kilowatt hour of electricity obtained from wind and photovoltaic solar sources is lower than that of electricity from coal-fired and, to a lesser extent, gas-fired plants (Lazard, 2021).
141 Foreign Direct Investment in Latin America and the Caribbean • 2023 Chapter III
Figure III.1 Installed renewable energy capacity worldwide, in absolute terms and as a proportion of electricity capacity, 2000–2022 (Gigawatts and percentages) 0 5 10 15 20 25 30 35 40 45 0 500 1 000 1 500 2 000 2 500 3 000 3 500 4 000 2000 2001 2002 2003 2004 2005 2006 2007 2008 2009 2010 2011 2012 2013 2014 2015 2016 2017 2018 2019 2020 2021 2022 In absolute terms As percentage of electricity capacity (right scale)
Source: Economic Commission for Latin America and the Caribbean (ECLAC), on the basis of International Renewable Energy Agency (IRENA), Renewable Capacity Statistics 2023, Abu Dhabi, 2023.
The COVID-19 crisis and the conflict in Ukraine have resulted in a period of turbulence in energy markets and put energy agendas at the core of developed countries’ recovery strategies (see box III.1). The European Union has launched a package of policies to increase the energy security of European countries by promoting the roll-out of renewable energies. In particular, the REPowerEU plan aims to hasten the green transition by accelerating the energy transition and capacity-building in related sectors. The European Commission has designed a 210 billion euro investment package for the development of renewable energies, among them solar and wind energy; it has also designed strategies to strengthen renewable technology manufacturing capabilities and plans to invest 27 billion euros in the development of green hydrogen infrastructure. The strategy of the United States for responding to the crisis caused by rising inflation, meanwhile, has focused on facilitating the energy transition and the development of related technologies. To this end, a set of measures, including a package of tax incentives, has been adopted with the aim of boosting the development of the renewable energy industry. For its part, in June 2022, China unveiled its fourteenth five-year plan for renewable energy development, aimed at mobilizing the public and private sectors to double renewables-based energy generation by 2025 and fostering the development of related sectors and technologies.
Box III.1
European Union and United States: investments and production development strategies to accelerate the energy transition
In August 2022, the United States passed the Inflation Reduction Act with the aim of accelerating the energy transition and achieving a 40% reduction in greenhouse gas emissions by 2030. The Act is the most ambitious energy law in the country’s history and provides for federal investments worth nearly US$ 400 billion over the next 10 years. The planned investments range from incentives for the development of renewable technologies to tax breaks for energy efficiency in buildings and the purchase of electric vehicles.
Energy sector measures account for some 63% of the total funding envisaged by the Act, followed by measures to promote the development of manufacturing industry in the country, accounting for 12%. Renewables, and in particular wind and solar energy, are the drivers of the strategy. The Act includes
142 Economic Commission for Latin America and the Caribbean (ECLAC) Chapter III
Hydropower
Onshore wind (25) Offshore wind (2) Solar photovoltaic (31) Concentrated solar (0) Solid biofuels (3) Biogas (1) Renewable urban waste (1) Geothermal (0) Liquid biofuels (0) Marine energy (0) Other (1)
Figure III.2 Installed renewable energy capacity worldwide, by technology, 2022 (Percentages of the total)
(37)
Source: Economic Commission for Latin America and the Caribbean (ECLAC), on the basis of International Renewable Energy Agency (IRENA), Renewable Capacity Statistics 2023, Abu Dhabi, 2023.
a package of more than US$ 60 billion for the onshoring of manufacturing activities in the renewable energy and transport value chains in the United States. In particular, the following extra funding is provided for:
• US$ 30 billion in tax credits for solar panel, wind turbine and battery production and critical mineral processing
• US$ 10 billion for the construction of manufacturing plants
• US$ 500 million in the Defense Production Act for critical minerals processing and heat pumps
• US$ 2 billion in subsidies to refurbish automotive manufacturing plants for electric vehicle production, ensuring continuity for workers
• US$ 2 billion for the country’s research and development laboratories to accelerate research into energy technologies
The Inflation Reduction Act also provides for investments to decarbonize the economy and incentives to reduce emissions in all sectors. The package consists of: tax credits for renewable electricity generation and storage; US$ 30 billion in subsidies for energy sector companies; tax credits and subsidies for clean fuels; subsidies and tax credits to reduce emissions from industry, including US$ 6 billion to reduce emissions in energy-intensive industries and US$ 9 billion for public procurement of clean technologies; and US$ 27 billion to accelerate the take-up of clean technologies in disadvantaged communities. In parallel, the Act includes measures to reduce the cost of energy for consumers and stimulate demand for clean technologies. These measures include 10 years of tax credits to boost the energy efficiency of buildings and encourage the installation of photovoltaic panels on roofs and the purchase of electric vehicles. Lastly, the Inflation Reduction Act includes measures for the energy transition in agriculture and US$ 60 billion for environmental justice. The European Union, for its part, responded to the COVID-19 crisis by presenting a plan to become the first decarbonized continent. This plan, the European Green Deal, aims to achieve zero net greenhouse gas emissions by 2050 and decouple economic growth from pollution and natural resource use. The Green Deal includes a set of European laws and initiatives to accelerate the energy transition and promote the development of clean technologies. It will be funded from the European Union budget and one third of the resources earmarked for NextGenerationEU, the recovery instrument designed to address the emergency phase of the COVID-19 crisis. The European Commission aims to mobilize a trillion euros in sustainable investments over the next 10 years in order to achieve a 55% reduction (from 1990 levels) in greenhouse gas emissions, increase the share of renewables by 32% and improve energy efficiency by 32.5%, all by 2030. The European Green Deal aims to strengthen the position of the European Union in the value chains of sectors connected with the energy transition and seeks to develop manufacturing industry, accelerate innovation with a view to green hydrogen production, promote the electrification of transport and improve the energy efficiency of buildings, among other initiatives.
On 18 May 2022, in response to the crisis caused by the conflict in Ukraine, the European Commission presented a plan to accelerate the energy transition of European countries and reduce dependence on energy imports from the Russian Federation. The objective of this plan, labelled REPowerEU, is to diversify the European Union’s energy mix and achieve 40% renewables penetration by 2030. The plan envisages additional investment of 210 billion euros by 2027 and 225 billion euros in lending. Among other measures, the strategy provides for an increase in installed solar panel capacity from 189 GW to 320 GW by 2025 and to 600 GW by 2030, an initiative to incentivize the installation of photovoltaic panels on the roofs of buildings, an initiative to produce 10 million tons of green hydrogen by 2030 and a plan for the development of the biomethane industry. To accelerate the transition, the European Union increased its research and development spending by 5%, earmarking an extra 200 million euros of funding for research and development in green hydrogen-related areas.
Source: Economic Commission for Latin America and the Caribbean (ECLAC), on the basis of Government of the United States, Building a Clean Energy Economy: A Guidebook to the Inflation Reduction Act’s Investments in Clean Energy and Climate Action, Washington, D.C., 2023 [online] https://www.whitehouse.gov/wp-content/uploads/2022/12/Inflation-ReductionAct-Guidebook.pdf; European Commission, “Communication from the Commission to the European Parliament, the European Council, the Council, the European Economic and Social Committee and the Committee of the Regions: the European Green Deal”, 2019 [online] https://eur-lex.europa.eu/legal-content/EN/ALL/?uri=COM%3A2019%3A640 %3AFIN; European Commission, “Communication from the Commission to the European Parliament, the European Council, the Council, the European Economic and Social Committee and the Committee of the Regions: REPowerEU Plan”, 2022 [online] https://eur-lex.europa.eu/legal-content/EN/TXT/?uri=COM%3A2022%3A230%3AFIN&qid=1653033742483.
143 Foreign Direct Investment in Latin America and the Caribbean • 2023 Chapter III
For developing countries, the transformation of the energy sector presents major challenges. In developed countries, with their mature production structures, the energy transition involves changing the energy mix that underpins growth in the economy and harnessing new technologies to generate new sources of growth. The challenge for developing countries is twofold, since they have to make production structures more sophisticated while promoting the adoption of low-carbon energy. However, the energy transition can represent an opportunity for these countries’ development strategies, since clean and cheaper energy sources can enhance energy security, increase the energy productivity of existing sectors, facilitate the development of energy-intensive activities and generate quality jobs (Batini and others, 2021).
While the transition will occur at different speeds in different regions, it is imperative to ensure that technological capabilities in renewable energy-related sectors are not concentrated in a few countries. It is therefore essential to implement strategies and policies that promote the deployment of renewable energy in developing countries and ensure that these can appropriate the socioeconomic benefits associated with the transition. Energy policies for renewable energy deployment must operate in tandem with production development policies, which are essential to foster capacity-building right along the renewable energy value chain and a shift in production structures towards sectors that sustain green energy industries. Countries with fewer capabilities will need more technological and financial support. Accordingly, directing investment efforts towards developing countries will be crucial for a just energy transition that leaves no one behind (United Nations, 2021).
1. The organization of renewable energy value chains: a sector in which technology production is highly concentrated
The renewable energy sector can be defined as the set of activities, processes, operations and organizations involved in the generation and distribution of energy from renewable sources. Like most sectors, the renewable energy sector is organized around global value chains with different stages, from the development of energy generation technologies to the distribution of energy in the market. Because different technological processes are used to transform the various natural sources into energy, the sector’s organization is specific to each of the generating technologies. However, it is possible to stylize some of the main stages in renewable energy value chains (see diagram III.1). The chain can be simplified into two stages. The first, upstream stage consists of all the processes involved in producing the technologies used to transform natural resources into energy, including obtaining raw materials for the development of the technologies for producing and distributing energy. The second, downstream stage consists in the activities of project planning and design, financing, deployment of technology, operation and maintenance and, lastly, production and distribution of energy in the grid. Alongside the value chain, there is a set of complementary activities that include research and development (R&D) and the regulation of energy markets.
Broadly speaking, the time it takes to implement a renewable energy project depends on the technology, the scale of the project and the country concerned. The whole chain can be divided into three phases: predevelopment, which comprises project assessment, feasibility studies and cost estimation; development, which consists in project construction, installation of the technology and commissioning; and operation and maintenance.2 Depending on the technology, the scale of the project and the regulatory environment, a project can take between 2 and 12 years to become operational (Ebenhoch and others, 2015; Lee and Jin, 2015).
The
144 Economic Commission for Latin America and the Caribbean (ECLAC) Chapter III
2
wind energy value chain, for example, involves turbine manufacturing companies and suppliers of ancillary components such as nacelles, blades, generators, converters, gearboxes, bearing systems and control equipment. The chain also involves suppliers of engineering and construction services, raw materials (iron, aluminium, copper, steel and fibreglass) and machinery and a variety of services at the project design and planning stage, such as site selection, site studies to assess wind characteristics and strength, power grid studies and assembly, operation and maintenance services. Lastly, power distribution companies are also part of the chain.
Source: Economic Commission for Latin America and the Caribbean (ECLAC), on the basis of J. Huenteler, C. Niebuhr and T. S. Schmidt, “The effect of local and global learning on the cost of renewable energy in developing countries”, Journal of Cleaner Production, vol. 128, August 2016; and T. Matsuo and T. S. Schmidt, “Managing tradeoffs in green industrial policies: the role of renewable energy policy design”, World Development, vol. 122, October 2019.
Renewable sources are generally less geographically concentrated than fossil fuels, which has resulted in highly globalized value chains involving transnational companies that operate worldwide. Companies participate in the various segments of the chain and specialize in one or more renewable technologies. Over the last 20 years, market expansion has led to a pattern of competition based on cost and technological excellence. As these dynamics have intensified, companies’ levels of consolidation and vertical integration have increased (Lacal-Arántegui, 2019; Meckling and Hughes, 2017). This has led to varying levels of concentration in critical stages of chains and, particularly, in the development of individual renewable technologies, giving rise to a growing market for service and component suppliers.
For example, in recent years, the development of wind and photovoltaic solar power generation technologies has become concentrated among a few companies capable of providing efficient technologies at competitive costs. In the case of wind energy, 15 manufacturers have the capacity to meet about 40% of the global demand for turbines and 45% of the demand for blades (GWEC, 2022). The increasing pressures of competition in the market and the requirements of scale and technological development led to the number of turbine producers declining by more than 50% between 2013 and 2021. In 2021, 30 producers installed more than 29,000 wind turbines worldwide. Asia and the Pacific and Europe dominate the market, with shares of 60% and 30%, respectively. Figure III.3 shows the main wind turbine producers and their market share in 2021.
In the case of photovoltaic panels, more than 24,000 modules were produced in 2021, with global production heavily concentrated in China, which is responsible for 75%, followed by Viet Nam (6.8%) and, with smaller shares, Malaysia, the Republic of Korea, the United States and India (see figure III.4). China dominates almost all segments of the photovoltaic panel and module value chain. In all countries except China, demand for photovoltaic solar power exceeds production capacity. While the countries of North America and Europe have substantial module manufacturing capabilities, 90% of the solar cells used are manufactured in Asia, particularly South-East Asia (IEA, 2022b). China’s solar module and component production remains the most competitive in the world, with manufacturing costs 10% lower than in India, 20% lower than in the United States and 35% lower than in Europe (IEA, 2022b).
145 Foreign Direct Investment in Latin America and the Caribbean • 2023 Chapter III
Diagram III.1
Raw materials Machinery Major components (such as turbines or panels) Project development Engineering services, procurement and construction management Technology Services Financing Logistics Distribution Technology centres Training centres Certification Regulation Complementary activities Secondary components (such as structures or towers) Maintenance and operation Research, development and innovation Downstream Upstream
Renewable energies: stylized value chain of the sector
(Percentages)
Dongfang Electric Corporation (3)
CSSC Haizhuang Windpower (3)
Southeastern Wind Coalition (6)
Nordex/ACCIONA (6)
Windey (7)
Mingyang (7)
GE Renewable Energy (9)
Source: Economic Commission for Latin America and the Caribbean (ECLAC), on the basis of Global Wind Energy Council (GWEC), Global Wind Report 2022, Brussels, 2022.
Note: The colours indicate the country of origin of the company: red for China, blue for Europe, green for the United States and yellow for the rest of the world.
(Percentages) China (75)
Source: Economic Commission for Latin America and the Caribbean (ECLAC), on the basis of Photovoltaic Power Systems Programme (PVPS), Trends in Photovoltaic Applications 2022, Paris, 2022.
Meeting climate and energy targets in the coming years will require a more than fourfold increase in renewable technology development and production capacity (IEA, 2023a). One of the main barriers for developing countries remains the technology intensity of projects. The initial capital cost is a major part of the life cycle costs of renewable energy projects and, in general, renewables are much more sensitive to increases in initial financing costs (Schmidt, 2014). In Germany, for example, the capital cost involved in photovoltaic power generation has been accounting for between 12% and
146 Economic Commission for Latin America and the Caribbean (ECLAC) Chapter III
Figure III.3
Leading producers of wind turbines worldwide, 2021
Vestas (18) Goldwind (12)
Siemens Gamesa (10)
Envision (9)
CRRC
SANY (3) Enercon (3) United Power (2) Other
(3)
(1)
Vietnam
(3) India (2) Thailand (1) Taiwan (China) (1) Europe (1) Japan (1) Singapore (0) Canada (0) Other (2) Other (4)
Figure III.4 Leading solar panel-producing countries, 2021
(7) Malaysia (4) Rep. of Korea (3) United States
37% of the levelized cost of electricity (Egli, Steffen and Schmidt, 2018). In developing countries such as Brazil and India, the capital cost can represent as much as 50% of the total cost of photovoltaic solar generation (Schmidt, 2014). In recent decades, public policies have been essential to mitigate project development costs and increase the viability of renewable energy technologies. Governments have funded renewable energy support schemes through national strategies, subsidies, grants, feed-in tariffs and regulated payment systems or power purchase agreements (PPAs). These last, in particular, have been the main method of compensating for the risks involved in developing renewable technology projects.
Developing the capabilities to diversify production chains and reduce the capital costs of renewables will be essential to meet future technology demand and make the energy transition possible. Some markets with substantial domestic demand, such as India, the United States, Europe and Brazil, are forming a critical mass at the technology development stage. Production costs, human capital availability and logistics infrastructure remain critical for achieving economies of scale to compete in the global market. India, for example, has managed to position itself as an important player in secondary component production and technology assembly. Brazil, similarly, has become the world’s fifth-largest manufacturing hub in the wind sector after China, Europe, India and the United States. In most countries where renewable energy technology production and export capacity have been developed, value has been generated locally by developing a highly skilled workforce, not only in technology design and engineering but in all activities along the value chain, from R&D to installation and operation and maintenance services.
While global renewable technology chains have consolidated in terms of cost efficiency, they remain exposed to major challenges. Growing demand for renewable technologies, competition for critical minerals and the new policy packages implemented in developed countries to strengthen local capabilities have the potential to reshape the geography of renewable technologies over the coming years. Long-term policy frameworks to mobilize local capacity-building investments will become increasingly necessary as a way of mitigating supply chain risks and making the green transition possible.
2. The mobilization of different funding sources in developing countries for the energy transition
The policy strategies implemented in response to the various recent crises have been aimed primarily at accelerating the green transition and have underpinned investment. In 2022, investment for the green transition totalled US$ 1.1 trillion, an increase of 31% over 2021. China was the main driver of the increase, with investments of US$ 546 billion, followed by the European Union with US$ 180 billion and the United States with US$ 141 billion. In total, the three powers were responsible for almost 80% of global investment. Renewables accounted for 45% of this investment (US$ 495 billion), followed by electric transport with 42% (BloombergNEF, 2023).
Between 2013 and 2022, renewable energy investment grew by an average of 8.5% annually, led by solar and wind power, which accounted for 97% of the total in the latter year (see figure III.5).
Over 40% of renewable energy investment went to South-East Asia and the Pacific, followed by Europe and North America (19% and 17%, respectively), while Latin America and the Caribbean and sub-Saharan Africa received 6% and 2% of all investment, respectively (IRENA/CPI, 2023). At the country level, China led global investment growth, accounting for around 20%. Investment in the country has been driven by ambitious national energy transition strategies (see box III.2).
147 Foreign Direct Investment in Latin America and the Caribbean • 2023 Chapter III
Figure III.5
Source: Economic Commission for Latin America and the Caribbean (ECLAC), on the basis of International Renewable Energy Agency (IRENA)/Climate Policy Initiative (CPI), Global Landscape of Renewable Energy Finance, 2023, Abu Dhabi, 2023.
Box III.2
China: production development policies for renewables
China has the largest installed renewable energy capacity of any country in the world, accounting for 34% of the total. This capacity has grown enormously in the last 20 years, from just over 75 GW as of 2002 to almost 1,200 GW in 2022. The growth of the renewable energy sector in China has been the result of long-term strategies that have combined energy policies and objectives with production development policies, positioning the country as a world leader in the sector.
China: installed renewable energy capacity, in absolute terms and as a proportion of the world total, 2000–2022
Installed capacity
Proportion of world total (right scale)
Source: Economic Commission for Latin America and the Caribbean (ECLAC), on the basis of International Renewable Energy Agency (IRENA), “Statistics Data”, 2022 [online] https://www.irena.org/Data.
148 Economic Commission for Latin America and the Caribbean (ECLAC) Chapter III
of dollars) 0 50 100 150 200 250 300 350 400 450 500 2013 2014 2015 2016 2017 2018 2019 2020 2021 2022 Biofuels Biomass Geothermal Hydropower Marine Offshore wind Onshore wind Solar photovoltaic Solar thermal Other
Annual investment in renewable energies worldwide, by technology, 2013–2022 (Billions
(Gigawatts and percentages) 0 5 10 15 20 25 30 35 40 0 200 400 600 800 1 000 1 200 1 400
2000 2001 2002 2003 2004 2005 2006 2007 2008 2009 2010 2011 2012 2013 2014 2015 2016 2017 2018 2019 2020 2021 2022
In the 1990s, China implemented its first wind energy development policies. These policies did not have much impact on the sector because of the energy price and the lack of subsidy and incentive mechanisms. It was only in the early 2000s, within the framework of the tenth five-year plan, that China began to implement a series of energy and production development policies that allowed it to position itself as the leading player in the renewable energy sector. In 2005, in particular, it enacted the Renewable Energy Law, which laid the foundations for the development of the market and required companies operating on the grid to purchase and distribute all the renewable energy available (National People’s Congress of China, 2005). In 2003, the government started to tender out the generation of renewable energy, and particularly wind energy, using auctions and feed-in tariffs. These two measures were crucial to the sector’s development.
In addition, the government implemented a system of financial subsidies to promote domestic investment in renewable energy. Large-scale projects had to be approved by the central government while those smaller than 50 MW were approved at the provincial level, and the grid had to pay preferential prices for renewable energy. While the initial focus of energy policies was the wind industry, the government updated its energy policies in the late 2000s as part of the eleventh five-year plan in order to promote the development of photovoltaic solar energy. From 2010, auctions and feed-in tariffs included national mechanisms for photovoltaic solar energy projects, and the government designed subsidy schemes to encourage the installation of solar panels on building roofs and promote research, development and demonstration programmes in the area of photovoltaic panel production.
In parallel with its energy policies, the Chinese government pursued a number of production development policies to foster the development of renewable technologies (Zhang and others, 2013). The main measures included:
• Financial support for research and development: funds for the development of strategic technologies, national networks of research laboratories, research and development funding for State-owned enterprises in the sector.
• Incentives and subsidies for renewable technology-related equipment manufacturing: tax incentives for the import of components essential to local technology development, financing from national development banks for wind and solar technology-related manufacturing, and export credits.
• Local content requirement: in 2003, a minimum of 50% local content began to be required in tenders for renewable energy development, rising to 70% from 2004. This requirement was discontinued in 2009 as contrary to World Trade Organization (WTO) provisions.
The combination of energy policies and production development policies strengthened the local market and its capacity to supply domestic demand. In the case of solar panels, the combination of competitive pricing and efforts to develop industrial capabilities resulted in oversupply at the national level, which was crucial in lowering the price of the technology globally (IEA, 2021).
Competitive production costs and public sector investment attracted international investors from Europe and the United States to set up production plants in China. Domestic enterprises have acquired sophisticated technological capabilities and have all the characteristics needed to compete in the global market. The tenth five-year plan (2001–2005) included incentives for Chinese companies to invest in global markets. With a few exceptions, however, global integration in the renewable energy sector has been through trade and value chains. Chinese companies now dominate the solar energy value chain and are among the most competitive players in the wind energy chain. China’s outward investments have been mainly concentrated in other Asian countries and have usually aimed at building up manufacturing capacity in nearby countries, such as Viet Nam and Malaysia (Tan and others, 2013).
The fourteenth five-year plan (2021–2025) identifies renewable energy and electricity transport as new strategic sectors and sets goals for strengthening the energy market, developing renewable technologies, improving electricity infrastructure and diversifying the energy mix (IEA, 2021).
Source: Economic Commission for Latin America and the Caribbean (ECLAC), on the basis of International Energy Agency (IEA), An energy sector roadmap to carbon neutrality in China, Paris, 2021; International Renewable Energy Agency (IRENA), “Statistics Data”, 2022 [online] https://www.irena.org/Data; National People’s Congress of China, “Renewable Energy Law of the People’s Republic of China”, 2005 [online] http://www.npc.gov.cn/zgrdw/englishnpc/Law/2007-12/13/
content_1384096.htm; X. Tan and others, “China’s overseas investments in the wind and solar industries: trends and drivers”, Working Paper, World Resources Institute, 2013; S. Zhang and others, “Interactions between renewable energy policy and renewable energy industrial policy: a critical analysis of China’s policy approach to renewable energies”, Energy Policy, vol. 62, November 2013.
149 Foreign Direct Investment in Latin America and the Caribbean • 2023 Chapter III
The importance of the private sector in renewable energy investment should also be stressed. Between 2013 and 2020, it mobilized an average of 74% of all renewable energy investment (IRENA/CPI, 2023), while the share of public investment has varied depending on the competitiveness of the technology. Also, policy mechanisms and instruments designed to promote the take-up of a given technology remain crucial in mobilizing private investment. In 2020, for example, thanks to the incentive schemes in place, 83% of investment in photovoltaic solar technologies came from the private sector. Commercial financial institutions and corporations have been the main private investors, accounting for almost 85% of total private investment in renewable energies (IRENA/CPI, 2023).
In regions with well-developed energy markets, such as North America, Europe and East Asia and the Pacific, around 80% of investment has been mobilized by the domestic private sector. In developing regions, international investment has played a more substantial role, contributing 30% of the total in Latin America and the Caribbean, 40% in the Middle East and North Africa and 50% in sub-Saharan Africa in the period 2013–2020 (figure III.6).
: Economic Commission for Latin America and the Caribbean (ECLAC), on the basis of International Renewable Energy Agency (IRENA)/Climate Policy Initiative (CPI), Global Landscape of Renewable Energy Finance, 2023, Abu Dhabi, 2023.
Public investment has been channelled mainly through State-owned financial institutions, public enterprises and local development banks, which together accounted for 70% of public sector investment between 2013 and 2020. In the latter year, in particular, public financing was one of the main catalysts for investment in China, and the China Development Bank was responsible for 90% of total public investment by national development banks worldwide. Similarly, China accounted for more than 80% of the investment efforts of State-owned financial institutions globally (IRENA/CPI, 2023). While renewable energy investment and installed capacity have soared globally over the past 20 years, IEA has noted that achieving net zero by 2050 will require a tripling of annual renewable energy investment by 2030, from the average of US$ 390 billion per year invested in the period 2016–2022 to US$ 1.3 trillion per year in 2023–2030 (AIE, 2022d).
Financing the transition will therefore require increased public investment, the mobilization of both domestic and international private capital and the design of new financing mechanisms for developing countries. Multilateral development banks, multilateral climate funds and bilateral investments by development banks accounted for 22% of total investment between 2013 and 2020. However, international financial commitments to supporting renewable energy production, R&D in developing
150 Economic Commission for Latin America and the Caribbean (ECLAC) Chapter III
Figure III.6
0 20 40 60 80 100 East
Europe
North America Sub-Saharan
Domestic and international investment in renewable energies in the different regions of the world as shares of the total, 2013–2020 (Percentages)
Asia and the Pacific
Latin America and the Caribbean Middle East and North Africa
Africa
Domestic International
Source
countries have trended downward in recent years: in the case of Latin America and the Caribbean, the value of these commitments fell from an annual average of US$ 4 billion between 2010 and 2018 to US$ 1.5 billion in 2019 (IEA and others, 2022).
The energy transition in developing countries entails huge challenges. In a global landscape affected by multiple crises, their economic situation has deteriorated and fiscal space for resource mobilization is limited. The policies implemented in response to these challenges will play a crucial role in making the energy transition possible, most particularly because developed countries have brought in strategies that foreground the strategic use of public investment to guide the transition, leverage domestic and international private investment and build up capabilities.
B. Global trends in renewable energy foreign direct investment
The renewable energy sector has become increasingly important in the global investment landscape over recent years, with the value of renewable technology FDI project announcements outstripping that of non-renewable projects since 2019 (see figure III.7). In 2005, non-renewables mobilized 15 times as much investment as renewables. In 2022, by contrast, the latter attracted more than four times as much investment as the former, accounting for more than 80% of the total value of announcements in the energy sector. As the analysis in this study shows, the growth of FDI in renewables is a prime example of how sectoral production development policies and public incentives and regulations can stimulate investment in new economic sectors.
Source: Economic Commission for Latin America and the Caribbean (ECLAC), on the basis of data from Financial Times, fDi Markets.
The cascade of recent crises, including the energy crisis caused by the conflict in Ukraine, has had a twofold impact on renewable energy investment. First, Europe’s need to diversify energy suppliers and decrease its energy dependence on imports has sent positive signals to the non-renewable energy market, particularly the gas sector. In 2022, non-renewable energy investment announcements returned to the levels prevailing before the COVID-19 pandemic in all quarters, peaking in the second (see figure III.8). Second, inflation and value chain disruptions have increased the capital
151 Foreign Direct Investment in Latin America and the Caribbean • 2023 Chapter III
Figure III.7
(Billions of dollars) 0 50 100 150 200 250 300 350 400 2005 2006 2007 2008 2009 2010 2011 2012 2013 2014 2015 2016 2017 2018 2019 2020 2021 2022 Non-renewable Renewable
Renewable and non-renewable energy investment project announcements worldwide, 2005–2022
cost of investments. However, new renewable energy projects are still less costly than traditional ones (BloombergNEF, 2022). At the same time, a number of plans to advance the energy transition have been implemented, sending positive signals to the renewables market and increasing investor interest in the development of new projects. They include the plans presented by the European Union, namely the European Green Deal, the “Fit for 55” package of measures and the REPowerEU plan for saving energy, producing clean energy and diversifying energy supplies.3 There is also the Inflation Reduction Act passed in the United States in 2022, which provides financing and incentives for clean energy investment.4 The net impact seems to be positive: during the four quarters of 2022, the value of renewables announcements was more than three times as great as that of conventional energy announcements, peaking in the third quarter, when there were 119 announcements worth US$ 108 billion.
Source: Economic Commission for Latin America and the Caribbean (ECLAC), on the basis of data from Financial Times, fDi Markets.
3 For further information on these plans, see [online] https://commission.europa.eu/strategy-and-policy/priorities-2019-2024/europeangreen-deal_en, https://www.consilium.europa.eu/en/policies/green-deal/fit-for-55-the-eu-plan-for-a-green-transition/ and https:// commission.europa.eu/strategy-and-policy/priorities-2019-2024/european-green-deal/repowereu-affordable-secure-and-sustainableenergy-europe_en.
4 See [online] https://www.epa.gov/green-power-markets/summary-inflation-reduction-act-provisions-related-renewable-energy#: ~:text=Most%20provisions%20of%20the%20Inflation,%2C%20local%2C%20and%20tribal%20organizations.
152 Economic Commission for Latin America and the Caribbean (ECLAC) Chapter III
Figure III.8
A. Non-renewables B. Renewables 0 5 10 15 20 25 30 35 40 45 0 5 10 15 20 25 30 Quarter 1 Quarter 2 Quarter 3 Quarter 4 Quarter 1 Quarter 2 Quarter 3 Quarter 4 Quarter 1 Quarter 2 Quarter 3 Quarter 4 2020 2021 2022 0 20 40 60 80 100 120 140 160 180 200 0 20 40 60 80 100 120 Quarter 1 Quarter 2 Quarter 3 Quarter 4 Quarter 1 Quarter 2 Quarter 3 Quarter 4 Quarter 1 Quarter 2 Quarter 3 Quarter 4 2020 2021 2022 Number
Value
Foreign direct investment announcements in the energy sector worldwide, 2020–2022 (Billions
of dollars and numbers)
(right scale)
Over the last decade, the interest of international companies in renewables was mainly driven by the increasing competitiveness of the sector. The cost of generating renewable energy, and in particular photovoltaic solar and wind power, has decreased worldwide because of technological advances. Between 2010 and 2020, global average levelized costs fell by 85% for photovoltaic solar energy projects, 56% for onshore wind projects and 48% for offshore wind projects (IEA, 2022d).
The incentive and subsidy schemes established in developed countries have been crucial in bringing down the cost of renewable technologies and consolidating the position of those countries’ energy companies on the international investment scene. Developed countries, and in particular those of the European Union, have managed to combine policies to develop their domestic markets with the search for new international markets, with the result that these countries are the leading international renewable energy investors. Between 2005 and 2010, investment was concentrated in Europe. European Union companies were responsible for 59% of the world’s non-conventional energy investment project announcements and over 50% of the investments were in Europe: 35% in European Union countries and 17% in other European countries (see figure III.9). This changed in subsequent years.
The global financial crisis of 2008 represented a turning point for renewable energy FDI. Companies developing renewable technologies sought alternatives in emerging markets. Developing countries with strong energy potential and policies to promote renewable energy became strategic investment destinations. Thus, between 2011 and 2016, Latin America and the Caribbean and Africa were the destinations for 15% and 12%, respectively, of total announced renewable energy FDI. During the same period, Asia and the Pacific attracted more than 22% of announced FDI. A special case is China, which, as explained in box III.2, while remaining a marginal player on the renewable energy FDI scene, has used domestic policies to pursue the development of renewable technologies and now has the world’s largest installed capacity and a position of leadership in the sector’s manufacturing chain.
As technologies and markets consolidated, the cost of financing the debt associated with renewable technology projects declined relative to fossil energy projects, increasing the competitiveness of the sector (Kempa, Moslener and Schenker, 2021). IEA estimates that the average return on investment is
153 Foreign Direct Investment in Latin America and the Caribbean • 2023 Chapter III
Figure III.9
Announcements of foreign direct investment projects in renewable and non-conventional energies worldwide, by destination region, 2005–2022
Africa Other Asia and the Pacific Oceania North America European Union Other Europe Middle East Latin America and the Caribbean China, Hong Kong (China) and Macao (China) 0 20 40 60 80 100 2005–2010 2011–2016 2017–2022
(Percentages of total value)
Source: Economic Commission for Latin America and the Caribbean (ECLAC), on the basis of data from Financial Times, fDi Markets.
seven times as high for the renewable energy portfolio as for the fossil fuel portfolio (AIE/CCFI, 2021). The centrality of the energy transition for meeting global emissions reduction targets and the greater profitability of renewable energy projects have resulted in an increased geographical diversification of FDI. As figure III.9 shows, 20% of the renewable energy FDI announced between 2017 and 2022 was for African countries, 11% for those of Asia and the Pacific, 9% for those of Latin America and the Caribbean and 4% for those of the Middle East (figure III.9). It should be noted that while more than 80% of energy FDI projects in Europe and Oceania were in the renewable energy sector during the period under review, investor interest in developing countries was still mixed. In Africa, for instance, renewables attracted only 56% of FDI projects. While European countries have lost share as a destination for renewable energy FDI, they still have a leading position in the investment landscape and a strong concentration of capital and technology. Between 2005 and 2022, FDI announced by European companies accounted for 61% of the total in the sector. Companies from Europe, in particular Italy, Spain and France, have been the leading investors in all regions of the world except Asia and the Pacific, where intraregional investments dominate (see diagram III.2).
Diagram III.2
Renewable energy foreign direct investment announcements worldwide, by origin and destination regions, 2005–2022
(Percentages of total value)
Africa
North America
Africa (15)
Latin America and the Caribbean (9)
Asia and the Pacific
Europe
Middle East
North America
Latin America and the Caribbean (11)
Asia and the Pacific (21)
Europe (40)
Middle East (4)
Solar and wind technologies have cemented their dominance, accounting for the bulk of FDI project announcements. Between 2005 and 2022, wind energy attracted FDI projects worth US$ 570 billion, solar energy projects worth US$ 444 billion and biomass and biofuels projects worth US$ 170 billion. The three technologies accounted for 70% of all announced FDI in the sector (see figure III.10). Developed countries’ policy agendas for advancing the energy transition have had a significant impact on emerging green technologies, especially storage technologies and green hydrogen. Since 2016, these technologies have mobilized US$ 210 billion in announcements, or 14% of the total, and in 2022 they accounted for about 40% of announced global FDI.
154 Economic Commission for Latin America and the Caribbean (ECLAC) Chapter III
Source: Economic Commission for Latin America and the Caribbean (ECLAC), on the basis of data from Financial Times, fDi Markets.
1. Wind energy: the sector attracting the world’s largest foreign direct investment announcements
The first international renewables investments were in large-scale wind power generation projects in developed countries, particularly the United Kingdom and the United States, where ambitious strategies to diversify energy sources, including incentives for the development of offshore wind projects, began to be pursued from 2008 onward (see box III.3). The early projects in the United Kingdom and the United States consolidated the leadership of European companies in the renewables landscape and set off a boom in investment announcements in the sector, which totalled US$ 49 billion in 2009 (see figure III.11).
Box III.3
Incentives for the development of emerging technologies: wind power in the United Kingdom and the United States
The wind sector in the United Kingdom began to develop in the late 1990s with the creation of the British Wind Energy Association, which sought to develop technology for the offshore industry. The first research and development funds for wind turbines were set up during this period; in the late 1990s, furthermore, the Department of Energy announced a target for 10% of electricity to be generated from renewables and inaugurated eight offshore wind demonstration projects. The first of these projects came onstream in 2001 (Bilgili, Yasar and Simsek, 2011), and in the same year the Crown Estate announced the first tender of sites for offshore wind energy production. In parallel, the government announced subsidies for project development (Kern and others, 2014).
However, the real boost to the wind sector came after 2007, when the Government of the United Kingdom signed up to the European goal of deriving 15% of energy from renewable sources by 2020 (Toke, 2011).
The Department of Energy and Climate Change (DECC) announced that stimulating large-scale industrial development of wind technology was essential to reduce project development costs and meet climate goals. In 2008, the Crown Estate tendered out 25 GW of offshore wind energy development. In 2009, to allow the
155 Foreign Direct Investment in Latin America and the Caribbean • 2023 Chapter III
dollars
Value Number (right scale) 0 500 1 000 1 500 2 000 2 500 0 100 200 300 400 500 600
Figure III.10 Renewable energy project announcements worldwide, by technology, 2005–2022 (Billions of
and numbers)
Marine Geothermal Green hydrogen and other emerging technologies
Hydropower Other Biomass Wind Solar
Source: Economic Commission for Latin America and the Caribbean (ECLAC), on the basis of data from Financial Times, fDi Markets.
market to keep growing, the government introduced a mandatory quota system for energy produced with emerging technologies and introduced incentives and feed-in tariffs for the renewable energy sector. Energy policies and incentives for wind energy production attracted international capital from Europe and the United States. In this context, offshore energy production rose to 2.7 GW, so that in 2012 the United Kingdom became the world leader by installed capacity (Kern and others, 2014).
In the United States, the development of the wind sector was also the result of a combination of public policy and market factors. The federal government began to fund research and development programmes for wind turbines in the 1970s. In 1992, the Energy Policy Act was passed, introducing a number of incentives for the development of the sector, most particularly the federal Production Tax Credit (PTC), a subsidy for wind power generation paid for the first 10 years of a project’s operation (Wiser, Bolinger and Barbose, 2007). In the same year, a technology-neutral incentive for the development of renewable energies was created. Thanks to the PTC, which reduced project costs and guaranteed a minimum 10-year payback, the sector developed rapidly until the United States had the world’s third-largest installed wind power capacity (Bird and others, 2005).
Source: Economic Commission for Latin America and the Caribbean (ECLAC), on the basis of M. Bilgili, A. Yasar and E. Simsek, “Offshore wind power development in Europe and its comparison with onshore counterpart”, Renewable and Sustainable Energy Reviews, vol. 15, No. 2, February 2011; F. Kern and others, “From laggard to leader: explaining offshore wind developments in the UK”, Energy Policy, vol. 69, June 2014; D. Toke, “The UK offshore wind power programme: a sea-change in UK energy policy?”, Energy Policy, vol. 39, No. 2, February 2011; R. Wiser, M. Bolinger and G. Barbose, “Using the federal production tax credit to build a durable market for wind power in the United States”, The Electricity Journal, vol. 20, No. 9, November 2007; L. Bird and others, “Policies and market factors driving wind power development in the United States”, Energy Policy, vol. 33, No. 11, 2005.
Source: Economic Commission for Latin America and the Caribbean (ECLAC), on the basis of data from Financial Times, fDi Markets.
Before the COVID-19 pandemic, investment in the wind sector had picked up again, with projects worth more than US$ 245 billion announced between 2019 and 2022. In particular, 2022 was a record year for the sector, with 131 announcements worth a total of more than US$ 110 billion. The rising cost of capital because of inflationary pressures may explain some of the increase in the value of investments over the last three years. However, the growth of wind energy FDI has been mainly due to the increasing role of offshore wind projects and renewed international commitments relating to the energy transition.
156 Economic Commission for Latin America and the Caribbean (ECLAC) Chapter III
(Billions of dollars and numbers) 0 50 100 150 200 250 0 20 40 60 80 100 120 2005 2006 2007 2008 2009 2010 2011 2012 2013 2014 2015 2016 2017 2018 2019 2020 2021 2022 Value Number (right scale)
Figure III.11 Wind energy project announcements worldwide, 2005–2022
In 2021, 113 GW of new wind capacity was installed, compared with only 59 GW in 2019, and wind energy generation increased by 17%, the highest growth rate of any renewable energy technology. China was the main contributor to the sector’s growth, followed by the United States and Brazil (IEA, 2022c). Many countries have put in place policy initiatives to assist the development of wind energy, including specific tools to facilitate the installation of new capacity, such as auctions, feed-in tariffs, incentives and subsidies, and renewable energy portfolio standards.
Geographically, investment has been mainly concentrated in Europe, where FDI projects worth a total of US$ 342 billion were announced between 2005 and 2022. The United Kingdom, the United States and Italy were the top three destinations, attracting 48% of total investment between 2005 and 2022. Since the global financial crisis of 2008, some developing countries such as Viet Nam, Egypt, Brazil, Chile and Mexico have become destinations of interest for international investment.
Investments in wind energy have been dominated by a few companies, most of them European. Of the top 10 investors, seven are from Europe, one from the United States and one from Japan. Together, these companies accounted for 40% of total investment. The European companies Energias de Portugal (EDP), Iberdrola and Enel are the largest investors with almost 300 announced projects worth more than US$ 97 billion, representing 17% of total investment announcements (see table III.1).
Top 10 investors in wind energy worldwide, 2005–2022
Source: Economic Commission for Latin America and the Caribbean (ECLAC), on the basis of data from Financial Times, fDi Markets.
The biggest announcements in recent years have been for offshore wind energy projects. In 2022, Viet Nam was the location for the world’s largest project.5 In 2020, the government of the United Kingdom announced its Ten Point Plan for a Green Industrial Revolution, whose first goal was to have 40 GW of offshore wind capacity in place by 2030, generating opportunities for investment to install more than 25 GW. Between 2020 and 2022, the United Kingdom received investment of almost US$ 100 billion, equivalent to 49% of total investment in the period.6 Another country that has launched major policy initiatives to promote the wind energy sector is France, which in 2022 announced investments of more than 1 billion euros in renewable energy as part of the France 2030 national investment plan,
5 AES of the United States announced a 4 GW offshore wind project in Bình Thuận province worth US$ 13 billion. The project should double the installed wind capacity of Viet Nam, which has set itself the target of having 11.7 GW of installed capacity in place by 2030 and 66 GW by 2045. Development of the country’s wind sector has been promoted since 2011, when the 2011–2020 national strategy for the development of wind energy was published, establishing feed-in tariffs for wind power, subsidies and reductions in land use fees and profit taxes for wind power projects. For more information, see the Prime Minister’s Decision No. 37/2011/QD-TTg of 2011 on the mechanisms supporting the development of wind power projects in Viet Nam.
6 In 2020, Equinor and Vårgrønn of Norway and SSE Renewables of the United Kingdom announced a US$ 10 billion project to build the Dogger Bank Wind Farm, which will generate 3.6 GW and supply around 5% of the United Kingdom’s energy needs. In 2021, Germany’s Energie Baden-Württemberg, in a cooperation agreement with BP, announced a US$ 9 billion project to generate 2.9 GW of offshore wind power. Lastly, in August 2022, Japan’s Marubeni, in cooperation with the United Kingdom’s SSE Renewables and Denmark’s Copenhagen Infrastructure Partners, announced a US$ 12 billion project to generate 3.6 GW.
157 Foreign Direct Investment in Latin America and the Caribbean • 2023 Chapter III
Table III.1
Company Announcements (Number) Capital invested (Millions of dollars) Average investment (Millions of dollars) Country Energias de Portugal (EDP) 63 38 925 618 Portugal Iberdrola 108 33 907 314 Spain Enel 127 24 299 191 Italy RWE 62 23 517 379 Germany Ørsted (Dong Energy) 53 20 472 386 Denmark Électricité de France (EDF) 63 18 432 293 France Equinor (formerly Statoil) 18 17 681 982 Norway Marubeni 2 16 020 8 010 Japan AES 12 15 305 1 275 United States BlueFloat Energy 7 14 633 2 091 Spain
with the goal of doubling installed capacity to 100 GW. Offshore wind generation will represent 40% of total installed capacity.7 Similarly, in 2021 the United States announced a strategy to encourage the development of offshore wind energy with a view to bringing capacity up to 30 GW by 2030.8 While offshore projects have represented an attractive opportunity for large investors, energy companies have continued to invest in onshore wind energy projects. In 2020, for example, Enel of Italy announced a US$ 810 million project to generate 1.01 GW of wind power in Brazil. Spain’s ACCIONA, meanwhile, has announced a US$ 1 billion project to generate 1.03 GW in Australia. Investments in wind energy, both offshore and onshore, are expected to continue growing in the coming years. IRENA (2022a) estimates that meeting the 2030 goals of the Paris Agreement will necessitate 3,380 GW of wind power, requiring installed onshore wind capacity to increase fourfold and offshore wind capacity elevenfold relative to 2020. Thus, in the coming years, FDI will play a key role in the deployment of wind energy, particularly in developing countries. Public sector support continues to be the main driver of wind energy investment in most of the world. Countries that have succeeded in attracting FDI projects have policy initiatives for wind energy, concrete targets for increasing installed capacity, favourable regulatory frameworks for investment in the sector, technology-specific incentives and subsidies, and instruments to support the use of local content in project development.
2. Solar energy: public policies and falling costs have driven the sector’s internationalization
Solar technology has had the most dynamic investment performance of any renewable energy: whereas there were just two projects worth US$ 300 million in 2005, FDI announcements peaked in 2019 at more than 290 projects worth a total of US$ 63 billion (see figure III.12). However, the impact of the COVID-19 pandemic and the conflict in Ukraine on supply chains slowed investment in the sector, and between 2020 and 2022, projects worth an average of US$ 40.5 billion per year were announced.
Source: Economic Commission for Latin America and the Caribbean (ECLAC), on the basis of data from Financial Times, fDi Markets.
7 For further information, see [online] https://www.vie-publique.fr/discours/283773-emmanuel-macron-10022022-politique-de-lenergie.
8 For further information, see [online] https://www.whitehouse.gov/briefing-room/statements-releases/2022/09/15/fact-sheet-bidenharris-administration-announces-new-actions-to-expand-u-s-offshore-wind-energy/.
158 Economic Commission for Latin America and the Caribbean (ECLAC) Chapter III
Figure III.12
(Billions of dollars and numbers) 0 50 100 150 200 250 300 350 0 10 20 30 40 50 60 70 2005 2006 2007 2008 2009 2010 2011 2012 2013 2014 2015 2016 2017 2018 2019 2020 2021 2022 Value Number
Solar energy project announcements worldwide, 2005–2022
(right scale)
Since the late 1990s, many countries have stepped up their efforts to accelerate the transition to alternative energy sources.9 A key element in the internationalization of the solar energy sector was the introduction of feed-in tariffs in the early 2000s. With these tariffs, governments guaranteed that clean energy would be purchased at above-market prices. Feed-in tariffs spread rapidly across Europe, leading to the development of the solar energy sector (Georgallis, Dowell and Durand, 2019).
Energy companies took advantage of the benefits of feed-in tariffs to enter new countries, driving the sector’s first wave of internationalization. Between 2005 and 2013, 53% of solar FDI projects were in European countries (figure III.13). The internationalization of the sector and a growing international commitment to the energy transition drove down the price of solar technology. Between 2010 and 2021, the global weighted average cost of photovoltaic solar projects decreased by 88%, making solar the most efficient technology for power generation (IRENA, 2022c).
During the 2010s, falling generation prices and the popularity of policies to support the solar sector in developing countries led to solar FDI becoming truly global in reach. Between 2014 and 2022, FDI in the sector totalled US$ 340 billion and its geographical distribution changed significantly: only 23% of projects were in Europe, while 20% were in Asia and the Pacific, 16% in Latin America and the Caribbean, 13% in Africa, 12% in Oceania, 10% in North America and 6% in the Middle East. The main destinations were Australia (US$ 40 billion), the United States and the United Kingdom. Chile ranked fourth by the total value of project announcements and was one of the countries displaying the highest growth in announced investments, which rose from US$ 5 billion between 2005 and 2013 to US$ 18 billion between 2014 and 2022.
9 Japan was one of the first countries to implement a strategy for the development of the solar sector with its 1974 “Sunshine” project, a long-term national strategy to develop renewable technologies and invest in R&D with a view to guiding the efforts of industry and academia towards the development of more efficient technologies (Shimamoto, 2020). Similarly, in 1991, Germany implemented its 100,000 Roofs initiative, offering loans at below-market interest rates for the installation or expansion of photovoltaic systems and the development of demand for solar technologies (Chowdhury and others, 2014). Both initiatives aimed to develop the market and position the country as a leader in the solar energy sector.
159 Foreign Direct Investment in Latin America and the Caribbean • 2023 Chapter III
Figure III.13
(Millions of dollars) 2005–2013 2014–2022 Total 103 149 341 252 Africa 7 818 42 887 North America 16 144 35 327 Latin America and the Caribbean 9 869 56 458 China, Hong (China) and Macao (China) 1 447 3 711 Other Europe 15 539 36 413 Oceania 1 109 41 016 Middle East 3 453 20 262 8 941 65 363 European Union 38 829 39 816 Other Asia and the Pacific
Solar power project announcements worldwide, by destination region, 2005–2013 and 2014–2022
Source: Economic Commission for Latin America and the Caribbean (ECLAC), on the basis of data from Financial Times, fDi Markets.
Between 2014 and 2022, the European Union cemented its position as the main investor, originating 43% of the total value of project announcements. Europe and Asia and the Pacific continued to be markets where intraregional investment was very important: 63% of all projects announced in Europe and 50% of those announced in Asia and the Pacific were intraregional. Spain, France and Canada were the main investors, accounting for 28% of the total value of project announcements. Special mention should be made of China, the sixth-ranking country by the value of its project announcements during the period: the total value of its announcements rose from US$ 6 billion between 2005 and 2013 to more than US$ 23 billion between 2014 and 2022. Chinese outward investment began increasing in 2010 and peaked at US$ 7 billion in 2014.
Between 2005 and 2022, the top 10 companies by the value of their FDI announcements originated 22% of investments and 16% of projects. Canadian Solar Inc. of Canada was the largest investor, announcing projects worth US$ 16.6 billion, followed by Singapore-based Sun Cable, which invested US$ 15 billion in a single 10 GW project in Australia (see table III.2).10 Italy’s Enel ranked third by the amount invested and first by the number of projects. In the period under review, the firm announced more than 100 projects worth a total of US$ 14 billion, with 40% of the total announced amount being for Latin America and the Caribbean and 38% for the European Union.
Top 10 solar energy investors worldwide, 2005–2022
The COVID-19 pandemic and its impacts on value chains were a turning point for the sector. The increase in the cost of capital cut short the downward trend in costs seen over the previous decade and led to a rise in contract prices. In the last two years, prices awarded for solar power generation at auctions have been higher in most countries around the world, leading to delays in the signing of new contracts.
While rising prices have had an impact in all regions and present a challenge for project developers that have won auctions at competitive prices and face higher costs when it comes to implementation, the cost of solar generation remains competitive with that of other energy sources. IRENA (2019) estimates that photovoltaic solar investment needs to increase by 68% relative to 2019 to meet the 1.5 °C scenario, which would indicate a potentially greater role for FDI in meeting the demand for investment in the sector. 10 For further information on Sun Cable, see [online] https://suncable.energy/.
160 Economic Commission for Latin America and the Caribbean (ECLAC) Chapter III
Table III.2
Company Announcements (Number) Capital invested (Millions of dollars) Average investment (Millions of dollars) Country Canadian Solar Inc. 65 16 638 256 Canada Sun Cable 1 15 556 15 556 Singapore Enel 107 14 456 135 Italy SkyPower 24 8 990 375 Canada Électricité de France (EDF) 40 8 749 219 France Abengoa 14 8 418 601 Spain Opdenergy 35 7 785 222 Spain TotalEnergies 34 6 888 203 France SunEdison Inc. 35 6 069 173 United States Impala SAS 23 5 610 244 France
Source: Economic Commission for Latin America and the Caribbean (ECLAC), on the basis of data from Financial Times, fDi Markets.
3. Green hydrogen and other clean technologies: the boom in 2022
In the last three years, the development of projects in the category known as green hydrogen and other clean technologies has attracted the interest of international investors, who allocated a total of US$ 201 billion to these technologies between 2020 and 2022 (see figure III.14). Of the total announced amount, 55% was for Africa, 16% for Europe and 15% for Oceania. The Middle East and Latin America and the Caribbean were the destinations for 5% and 4% of the total, respectively. While Asia and the Pacific was the region with the smallest volume of announced projects (a total of US$ 6.6 billion), hydrogen and other clean technology projects worth a total of US$ 63 billion were announced, more than for any other region; only the European Union was close, with projects worth US$ 61 billion. At the country level, Egypt, Australia and Spain received projects worth US$ 94 billion, US$ 32 billion and US$ 22 billion, respectively, representing 72% of total announced investments.
In contrast to the situation with solar and wind energy, the companies that have invested most in hydrogen and other clean technologies have committed to a few high-value projects, most of which were announced in 2022. For example, POSCO of the Republic of Korea announced a US$ 28 billion project to produce hydrogen from wind and solar power in Australia, positioning itself as the leading investor in the sector (Argus, 2022). For its part, Globeleq of the United Kingdom announced an US$ 11 billion project in the Suez Canal special economic zone in Egypt to produce 3.6 GW of electrolysers and 9 GW of solar and wind power.
Of particular note is the involvement of the oil majors, such as Shell, Eni, TotalEnergies and BP, which are repositioning their business models by investing in green hydrogen and other clean technologies, transforming existing assets and launching new industrial development projects.
161 Foreign Direct Investment in Latin America and the Caribbean • 2023 Chapter III
Figure III.14
(Billions of dollars and numbers) 0 10 20 30 40 50 60 70 80 90 100 0 20 40 60 80 100 120 140 160 2016 2017 2018 2019 2020 2021 2022 Value Number (right scale)
Announcements of foreign direct investment in green hydrogen and other clean technologies worldwide, 2016–2022
Source: Economic Commission for Latin America and the Caribbean (ECLAC), on the basis of data from Financial Times, fDi Markets.
In 2022, for example, Shell announced the construction of a hydrogen plant in the port of Rotterdam (Netherlands) that is expected to produce 200 MW of electrolysers and 60,000 kg of hydrogen per day from 2025 (Shell, 2022).
While FDI announcements in the sector reveal a growing interest from companies in clean technologies and particularly in green hydrogen, most of the announced projects are at very early stages —which is to say the demonstration stages— with little electrolyser capacity (MarketsandMarkets, 2023). More than 90% of demand is still being met mainly by traditional energies, particularly natural gas and coal (IEA, 2022a). While falling prices in the renewables sector and technological improvements in electrolyser production have increased the commercial viability of projects, green hydrogen remains very expensive to produce compared to fossil sources (BloombergNEF, 2020).
Global hydrogen demand was in excess of 94 Mt in 2021, however, and is expected to reach 180 Mt by 2030 to meet the requirements of the 1.5 °C scenario (IEA, 2022a). As happened in Japan in 2017, strategies to promote green hydrogen production have been launched in more than 28 countries (IEA, 2022a). In particular, spending on green hydrogen technology R&D in European countries has doubled since 2021, with these technologies receiving 5% of all resources allocated to renewable technologies. Most national plans and strategies have set targets for green hydrogen production as part of their energy transition road maps. It should be noted that demand for this product is still incipient and largely confined to the transport and mobility sector. Orienting green hydrogen production development strategies towards strengthened generation and production capabilities and the development of new technologies will be crucial to sustain demand and accelerate the use of green hydrogen in industrial sectors.
4. Other energy sources
Between 2005 and 2022, other renewable energy sources such as biomass and hydroelectric, geothermal and marine energies accounted for less than 20% of investment in the renewable energy sector, with announcements totalling US$ 315 billion. Investments in biomass projects were the most dynamic component (11% of total investment), followed by hydropower (4%), geothermal energy (2%) and marine projects (1%).
In the period mentioned, there were 935 biomass project announcements, worth a total of US$ 169 billion. Announcements peaked between 2007 and 2008, when announced investments averaged US$ 18 billion per year. Amounts began to progressively decline thereafter, so that in 2017 the total was US$ 2 billion. There was a slight increase over 2021 and 2022, however, with biomass project announcements averaging US$ 9 billion between 2019 and 2022. In 2022, biomass attracted 3% of all renewable energy investment. The main destination regions were Europe and Asia and the Pacific, which received 39% and 23% of all investment between 2005 and 2022, respectively, followed by Latin America and the Caribbean, which received 12%. At the country level, the United Kingdom, the United States and Brazil were the top destinations, receiving 16%, 8% and 7% of investment, respectively. European companies dominated investment, accounting for 50% of all announcements, followed by United States companies with 22%.
In the case of hydropower, 217 projects totalling US$ 62 billion were announced between 2005 and 2022. Overall, international investment has not been a driver of development in this sector, which accounted for an average of 4% of all renewable energy FDI announcements during the reporting period. The countries of Asia and the Pacific received 36% of investments, followed by those of Europe (27%) and Latin America and the Caribbean (25%). At the country level, Chile was the leader, receiving 13 projects totalling almost US$ 5 billion, followed by the Lao People’s Democratic Republic, Pakistan and Brazil. In total, these four countries accounted for 30% of all hydropower investments. Europe was responsible for 50% of investments, followed by countries of Asia and the Pacific (37%).
162 Economic Commission for Latin America and the Caribbean (ECLAC) Chapter III
However, owing to the environmental and social issues associated with the development of large-scale hydropower projects and the effects that climate change and shifting rainfall patterns can have on power generation, investment has declined over the past 20 years, from an annual average of almost US$ 6 billion between 2007 and 2011 to less than US$ 1 billion per year between 2019 and 2022. Since 2020, in particular, hydropower projects have accounted for less than 0.3% of all renewable energy investment.
Between 2005 and 2022, geothermal and marine energy attracted 96 and 61 projects, respectively, totalling US$ 36 billion. Geothermal investments were more evenly distributed across regions: Europe accounted for 32%, Asia and the Pacific for 23%, Africa for 21%, the Middle East for 13%, Latin America and the Caribbean for 8% and North America for 3%. Geothermal investment averaged less than US$ 2 billion per year during the period, peaking at US$ 6 billion in 2006. In 2022, geothermal energy investment accounted for 0.05% of all renewable energy investment. International investment in marine energy was mainly concentrated in Europe, the destination for more than 60%, followed by Asia and the Pacific, which received 25%. Overall, investment remained below US$ 1 billion per year, peaking in 2022 at US$ 2.33 billion. In particular, France’s Sabella has announced two turbine installation projects in the United Kingdom totalling US$ 1.6 billion.
5. Mergers and acquisitions: a strategic tool for market access
Although FDI projects are the best proxy indicator for analysing international investment in the renewable energy sector, the analysis of mergers and acquisitions reveals important milestones in the evolution of the sector and allows the internationalization strategies of companies to be characterized.
The mergers and acquisitions market in the energy sector has some specific characteristics. First, this is a highly regulated sector driven by national interests and participated in by State-owned companies in many countries. Moreover, it is characterized by high upfront capital costs, economies of scale and the need for vertical technological integration (Galperina and Klen, 2017). Thus, merger and acquisition dynamics are driven by developments both in the sector globally and in specific regional and technology markets.
The number of deals in the global renewable energy sector held steady between 2015 and 2019, with an average of 700 mergers and acquisitions per year.11 Although there are still fewer mergers and acquisitions in renewables than in the conventional energy sector, international environmental commitments and the energy crisis driven by the conflict in Ukraine have increased corporate interest in the sector (Busscher and others, 2022). The last two years have seen an increase of more than 50% in the number of transactions compared to pre-pandemic levels.
Most transactions were between companies in the same country, and only 40% involved the purchase of assets in a foreign country. However, 71% of transnational transactions qualified as FDI, suggesting that the strategic objective of seeking assets abroad has been to take control of them and access new markets (see figure III.15).12
11
12 According to the International Monetary Fund (IMF) Balance of Payments and International Investment Position Manual: Sixth Edition (BPM6), a transaction is deemed to be FDI when 10% or more of equity is purchased.
163 Foreign Direct Investment in Latin America and the Caribbean • 2023 Chapter III
Merger and acquisition data were obtained from Bloomberg and contained information on all transactions by listed companies in the renewable energy sector with information available for the period 2015–2022. During that period, 6,197 transactions involving the purchase of assets in the renewable energy sector were identified. Information on the value of the transactions was available for only 594 of these observations.
Figure III.15
Cross-border mergers and acquisitions in the renewable energy sector have held steady over the last eight years and still represent less than 1% of all cross-border deals. The dynamics of the market are mainly regional and dominated by developed countries. To the fore are cross-border investments by European companies, which have been more dynamic than domestic transactions, outnumbering them since 2017 and accounting for 58% of all transactions concluded in 2022. The main reasons for this are related to the characteristics of the European market. Since the adoption of the European Union’s Renewable Energy Directive in 2009, Europe has been one of the world’s leading regions for the development of renewable energy technologies. This has both created the conditions for the consolidation of the renewables market among European countries and enabled companies to position themselves as major players in the global renewables market. Transnational transactions have been carried out by European utilities mainly with the aim of developing the regional market. Between 2015 and 2022, Europe was the origin and destination of 53% of FDI deals in the sector, followed by North America and Asia and the Pacific (see diagram III.3). At the country level, the United States, the United Kingdom, Spain and Germany were the main destinations for cross-border mergers and acquisitions, accounting for almost 38% of the total number of transactions. Similarly, investors from the United States, the United Kingdom, Canada and Germany were responsible for 41% of deals. In recent years, the energy transition and growing interest in the renewable energy sector have led to an increase in the acquisition of strategic assets in the sector; non-energy players have become interested in buying green assets as part of their strategy. Most of the deals registered have been driven by investment companies in the financial sector and by traditional energy companies. The growing need to strengthen environmental, social and governance assets to raise finance has driven corporate strategies aimed at adding green assets to reduce carbon emissions in line with the goal of net zero. Companies in the traditional energy sector, for example, are acquiring solar and wind generation assets to offset emissions from their well drilling and completion operations. Similarly, many companies are acquiring renewable energy and green technology assets to restructure the composition of their portfolios and reposition themselves in energy sector value chains.13
13
164 Economic Commission for Latin America and the Caribbean (ECLAC) Chapter III
Domestic
0 100 200 300 400 500 600 2015 2016 2017 2018 2019 2020 2021 2022
Characteristics of mergers and acquisitions in the renewable energy sector worldwide, 2015–2022 (Numbers of transactions)
Cross-border Foreign direct investment
Source: Economic Commission for Latin America and the Caribbean (ECLAC), on the basis of data from Bloomberg.
The Anglo-Dutch firm Shell, for example, has initiated activities in the renewable energy sector by acquiring green assets in renewable energy companies and by signing long-term bilateral agreements for the purchase of renewable assets. In 2022, Shell acquired Spain’s Green Tie Capital, a company specializing in investments, divestments and the management and development of sustainable assets, with the aim of undertaking more than 2 GW of photovoltaic projects. Similarly, Italy’s Eni has launched a strategy to acquire renewable energy assets in order to meet the goal of net zero. Of particular note is Eni’s positioning in the United Kingdom wind industry, which it consolidated with two deals to purchase assets in the world’s largest offshore wind farm project, Dogger Bank.
(Percentages)
C. Opportunities for the development of renewable energies in Latin America and the Caribbean
Latin America and the Caribbean has one of the cleanest electricity generation mixes of any world region. On average, the region produces 8.1% of global greenhouse gas emissions, a figure that is proportional to its population (World Bank, 2022). At the subregional level, the Caribbean contributes 0.4% of all global emissions, Central America 1.7% and South America 6.1%. The region’s emissions have increased in all sectors since the 1990s, driven by economic growth. Emissions from the energy sector, which accounts for more than 43% of the regional total, have increased the most, from 1,052 MtCO2e in 1990 to 1,789 MtCO2e in 2019 (ClimateWatch, 2023).
The region’s primary energy supply is still dominated by fossil fuels (66%). Over recent decades, however, its countries have implemented ambitious policies to diversify the energy mix and made considerable progress in developing the renewable energy sector. On average, the supply of energy generated from renewable sources constitutes almost 33% of the region’s total, compared to an average of 13% globally (ECLAC, 2023).
While the share of installed renewable capacity in the region is still higher than the global average, this is mainly due to installed hydropower capacity, which accounted for more than 41% of total installed capacity in 2021. Wind accounted for 8%, solar for 6.2%, biomass for 4.8% and geothermal for 0.4% (see figure III.16). Moreover, installed capacity has been relatively slow-growing: between 2020 and 2021, it increased by only 7% to 292 GW, with 54.2% of the new capacity coming from solar energy, 31.5% from wind energy, 10.5% from biomass and the remaining 3.3% from hydropower (OLADE, 2022). For the region’s growth rate to approach the global rate projected for the next five years, more than 150 GW of renewable generating capacity would need to be added between 2023 and 2027, and installed wind and solar capacity would need to more than double. This would
165 Foreign Direct Investment in Latin America and the Caribbean • 2023 Chapter III
Diagram III.3
Mergers and acquisitions in the renewable energy sector, by regions of origin and destination, 2015–2022
Africa and the Middle East (2)
Asia and the Pacific (20)
Europe (53)
North America (23)
Africa and the Middle East (3)
Europe (53)
Latin America and the Caribbean (7)
North America
Latin America and the Caribbean (2) (20)
Asia and the Pacific (17)
Source: Economic Commission for Latin America and the Caribbean (ECLAC), on the basis of data from Bloomberg.
mean building new renewable capacity, mainly wind and solar, which account for only 18% of the region’s installed renewable energy capacity, compared to 50% globally. Solar and wind penetration in the region is still largely confined to a few countries: 71% of total regional installed capacity is in Argentina, Brazil, Colombia and Mexico. The countries of the region have been accelerating the installation of solar and wind power generating facilities, with capacity increasing by 36% and 18%, respectively, between 2019 and 2020. Following behind these are bioenergy with an increase of 2% and hydropower with an increase of 1% (OLADE, 2022).
Latin
Box III.4
Renewable electricity generation: the case of Uruguay
Uruguay has successfully diversified its renewable generating sources on the path to the energy transition. In particular, more than 85% of the electricity the country generates now comes from renewable sources. Of these, wind and solar account for more than 40%, and there are hourly spikes in which they account for close to 90% of the total.
Uruguay:
166 Economic Commission for Latin America and the Caribbean (ECLAC) Chapter III
Figure III.16
Geothermal (0) Nuclear (1) Non-renewable
Hydroelectric (41) Renewable thermal (5) Other renewable (0) Solar (6) Wind (8)
America and the Caribbean: distribution of installed electricity generation capacity, by technology, 2021 (Percentages)
thermal (38)
Source: Latin American Energy Organization (OLADE), Panorama energético de América Latina y el Caribe 2022, Quito, 2022.
(31.0) Solar (5.4) Wind (30.8) Biomass (8.5)
distribution of installed electricity generation capacity, by technology, 2021 (Percentages) Non-renewable thermal (24.0)
Hydroelectric
Source: Latin American Energy Organization (OLADE), Panorama energético de América Latina y el Caribe 2022, Quito, 2022.
Greenhouse gas emissions from Uruguay’s electricity sector are one thirtieth the global average. Furthermore, the incorporation of solar and wind energy has produced more than just environmental benefits. In particular, the cost of supplying the country’s demand has fallen by more than 40% and nearly 50,000 jobs have been created.
The first long-term national energy policy was approved by the Council of Ministers in 2008 and endorsed by a cross-party commission in 2010. The policy, which was formulated by consensus between all public actors in the sector, provides strategic guidelines, goals and lines of action for achieving the 2030 goals. It also establishes a diagnostic and evaluation mechanism to analyse the energy situation in the country and the world. The objective of the policy is to diversify the country’s energy mix and increase the percentage of electricity generated from renewable sources. The main actor involved in implementing the policy has been the State-owned enterprise Administración Nacional de Usinas y Transmisiones Eléctricas (UTE), which began to contract power from renewable sources by means of renewable energy procurement contracts with the private sector in accordance with Decree No. 77/006. Today, Uruguay invests about 3% of GDP in energy infrastructure and exports energy to Argentina and Brazil.
Source: Economic Commission for Latin America and the Caribbean (ECLAC), on the basis of Latin American Energy Organization (OLADE), Panorama energético de América Latina y el Caribe 2022, Quito, 2022, and Ministry of Industry, Energy and Mining, “Política energética”, 2008 [online] https://www.eficienciaenergetica.gub.uy/politica-energetica.
The electricity subsector can be the driver of the region’s energy transition: in 2021, 59% of electricity on average was generated from renewable sources, although there were large subregional differences. Diversifying electricity generation sources would have a multiplier effect in the region’s green energy transition and make it possible to electrify the transport sector, which is responsible for 13.4% of South America’s emissions, 11.1% of the Caribbean’s and 21.4% of Central America’s (OECD and others, 2022).
Latin America and the Caribbean is in a particularly strong position to carry through the energy transition, as it has exceptional renewable resources (see map III.1). Throughout the region, extraordinary resources are available for hydropower and bioenergy production. In Chile, Argentina, Brazil and Mexico, for example, there is great potential for producing solar and wind energy. Chile, in particular, has the world’s largest wind generation potential and one of the highest levels of horizontal irradiation. The mountains of Central America have characteristics that are essential for the production of geothermal energy (UNEP, 2020b). In addition, the region has large reserves of some minerals that are essential for the energy transition, enabling it to position itself strategically in the value chain. In 2017, 61% of world lithium reserves, 39% of copper reserves and 32% of nickel and silver reserves were in Latin America and the Caribbean.
Investing in the energy transition in the countries of Latin America and the Caribbean can represent an opportunity to move towards more sustainable development models. Renewables can cut the cost of supplying energy, increase energy efficiency and reduce countries’ vulnerability to fluctuations in the prices of imported fossil fuels. Countries currently dependent on fossil fuels need to put in place investment strategies to make the transition to renewable energy sources. Similarly, countries that rely heavily on hydropower generation must reduce their dependence on water sources and diversify the mix out to other renewable energy sources to minimize the impact that droughts can have on power generation (IEA, 2021a; OLADE, 2017; World Bank, 2017; Ubierna, Alberti and Alarcón, 2020).
Changes in rainfall intensity reduce the potential for hydropower to supply the region’s energy demand. Dependence on hydropower sources could increase energy vulnerability and economic costs. In addition, more than 50% of the region’s installed hydropower capacity is more than 30 years old and highly exposed to the consequences of climate change (IEA, 2021a). It is therefore essential to mobilize investments with a view to modernizing hydropower infrastructure, planning for climate change impacts on the various energy sources and diversifying energy mixes by expanding solar and wind generation capacity.
167 Foreign Direct Investment in Latin America and the Caribbean • 2023 Chapter III
Map III.1
The availability of clean, cheap energy could represent an opportunity to diversify the region’s production mix. In particular, the region’s great potential for clean power generation could be harnessed to develop capacity in energy-intensive activities, such as green hydrogen. If there were a growing supply of clean energy accompanied by energy planning and capacity-building strategies, the region could become an attractive location for international investment and, in particular, for the relocation of energy-intensive industries (Hausmann, 2021).
In an energy transition scenario, electricity demand in the region is projected to increase by between 210% and 560% by 2050 (IDB/DDPLAC, 2019). Coping with such a large increase will require growth in renewable energy generation capacity and the implementation of energy planning strategies to mobilize the necessary resources.
Progress with the energy transition will require investment of 1.3% of the region’s annual GDP over the next 10 years to introduce renewable energies, universalize energy access and enhance regional electricity integration (ECLAC, 2020). A regionwide electricity market is essential for increasing the region’s energy security and leveraging scale to coordinate investments in distribution and storage technologies.
The countries of the region are making progress in implementing policies and incentive programmes to accelerate the green transition. Member States of the Caribbean Community (CARICOM), for example, have developed a plan to achieve 47% renewables penetration in electricity generation by 2027. Similarly, the member countries of the Renewables in Latin America and the Caribbean (RELAC) initiative have voluntarily agreed to pursue a strategy to promote renewables in the region with the
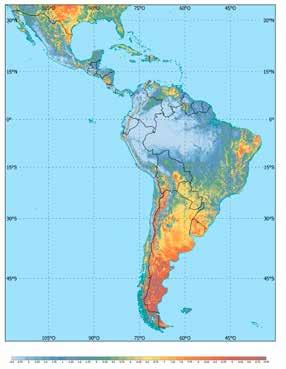
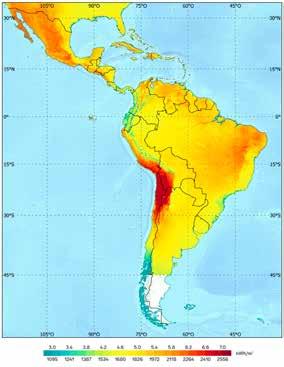
168 Economic Commission for Latin America and the Caribbean (ECLAC) Chapter III
Latin America and the Caribbean: current photovoltaic and wind power potential, 2023
Source: Economic Commission for Latin America and the Caribbean (ECLAC), on the basis of World Bank/Solargis, “Global Solar Atlas”, 2023 [online] https://globalsolaratlas.info/map, and J. Badger and others, “Global Wind Atlas”, 2023 [online] https://globalwindatlas.info.
<2.5 2.75 3.5 3.75 3 4.5 4.75 4 5.5 5.75 5 6.5 6.75 6 7.5 7.75 7 8.5 8.75 8 3.25 4.25 5.25 6.25 7.25 8.25 9.25 9.5 9.75 >9.75 9
objective of bringing their share of the energy mix up to 70% by 2030. The strategy aims to accelerate the move towards carbon neutrality in electricity systems, increase the resilience and competitiveness of the sector, create green jobs and improve air quality (RELAC, 2023). Lastly, the Central American countries have been working to create a market for electricity produced from renewable sources called the Clean Energy Corridor of Central America (CECCA).
While the countries are making progress in meeting nationally determined commitments, they face the challenge of mobilizing resources for the energy transition. The United Nations Environment Programme (UNEP, 2020b) estimates that to meet mitigation needs and achieve the 1.5 °C target, an eightfold increase in investment for the green transition is required in the region. Financing this transition requires coordinated strategies to direct public and private investment efforts towards it. In this context, it is important for FDI to contribute to the goals of the energy transition. It is also important to create policy frameworks and instruments for attracting high-quality investments in order to develop capabilities in sectors related to the energy transition.
D. Renewable energy foreign direct investment in the region: dominated by two technologies in three countries
The renewable energy sector has been among those attracting the most investment in the region, ranking third by the amounts announced. In the period 2005–2022, there were more than 800 FDI project announcements involving this sector in the region, worth a total of almost US$ 170 billion (see figure III.17). Between 2010 and 2021, announced investments in clean energy surpassed investment in fossil energy, and it has become one of the sectors attracting most FDI announcements in the region.
169 Foreign Direct Investment in Latin America and the Caribbean • 2023 Chapter III
Figure III.17
(Billions of dollars and numbers) A. Whole region 0 20 40 60 80 100 120 140 0 5 10 15 20 25 2005 2006 2007 2008 2009 2010 2011 2012 2013 2014 2015 2016 2017 2018 2019 2020 2021 2022 Value Number (right scale)
Latin America and the Caribbean (24 countries): renewable energy investment project announcements, 2005–2022
B. By country
While Brazil, Chile, Mexico, Peru and Colombia have been the main destination countries, attracting between them more than 80% of all FDI announced in the region, FDI has undergone a reconfiguration in most countries and been directed towards renewable energy.14
Since 2009, in the wake of the global financial crisis and the decline in the profitability of new renewable energy projects in European markets, Latin America and the Caribbean has become a key destination for European Union investments in this type of energy, particularly those from France, Spain and Italy. Companies from European Union countries were responsible for 63% of all renewable energy FDI projects announced in the region between 2005 and 2022. European capital inflows contributed to the dynamism of renewable energy markets and supported the energy transition in the Latin American and Caribbean countries. The main investors were Enel of Italy, which announced 99 projects worth US$ 16.8 billion, Iberdrola of Spain and Engie of France (see table III.3). The three companies were responsible for about 18% of all FDI projects announced for the region.
In line with the global trend, solar and wind technologies attracted the largest number of FDI projects and accounted for more than 70% of all investment in renewable energies (see figure III.18).
14 Information on energy-related FDI announcements is available for 24 countries of the region, in 15 of which over 50% of this investment has been in renewable energy.
170 Economic Commission for Latin America and the Caribbean (ECLAC) Chapter III Value Number (right scale) 0 50 100 150 200 250 0 5 10 15 20 25 30 35 40 45 50 Brazil Chile Mexico Panama Peru Dominican Rep. Argentina Colombia Uruguay Honduras Nicaragua Guatemala Cuba Paraguay Ecuador Costa Rica El Salvador Jamaica Barbados Suriname Trinidad and Tobago Guyana Belize Saint Lucia
Source: conomic Commission for Latin America and the Caribbean (ECLAC), on the basis of data from Financial Times, fDi Markets.
Table III.3
Total value of announced investments (Millions of dollars) Project announcements (Number) Average project value (Millions of dollars) Country of origin Enel 16 789 99 170 Italy Iberdrola 7 243 23 315 Spain Engie 6 794 37 184 France
Latin America and the Caribbean: top three renewable energy investors, 2005–2022
Source: Economic Commission for Latin America and the Caribbean (ECLAC), on the basis of data from Financial Times, fDi Markets.
Source: Economic Commission for Latin America and the Caribbean (ECLAC), on the basis of data from Financial Times fDi Markets. a The countries covered are: Argentina, Barbados, Belize, Brazil, Chile, Colombia, Costa Rica, Cuba, the Dominican Republic, Ecuador, El Salvador, Guatemala, Guyana, Honduras, Jamaica, Mexico, Nicaragua, Panama, Paraguay, Peru, Saint Lucia, Suriname, Trinidad and Tobago and Uruguay.
Renewable energy investment announcements peaked in 2019 at more than 120 projects totalling US$ 20.5 billion. Since the COVID-19 pandemic, there has been a marked slowdown caused by two main factors: the rising cost of capital to implement solar and wind projects, and the reshaping of the energy agenda in Europe and the United States. In 2022, renewable energy project announcements rebounded, growing by 30% over 2021, with 37 projects worth a total of US$ 10.4 billion announced. Importantly, more than 50% of investment was in emerging technologies that year; in particular, 27% was for the development of advanced biofuels and 25% for the implementation of hydrogen projects and green technologies.15 The vigour of the Latin American market has been reflected in the dynamics of cross-border mergers and acquisitions. Although those involving renewables still lag behind those involving fossil energy, since 2010 there has been a rise in interest from transnational companies in renewable assets in the countries of the region. Of the transactions completed, 50% have involved an acquirer from Europe, 33% one from North America and 13% one from Asia and the Pacific, while just 4% have been intraregional (see figure III.19).
15 SGP BioEnergy of the United States has announced the construction of the world’s largest advanced biofuels plant in Panama. The project, which will be carried out in cooperation with the Government of Panama and Panama Oil Terminals, is to include a biofuel refinery, a distribution facility and a plant for the production of green hydrogen from residual carbon and by-products of the refining process. Of particular interest too is the announcement of renewable energy and sustainable mobility projects by InterEnergy Holdings and the Punta Cana-Macao Energy Consortium in the Dominican Republic. InterEnergy is one of the main developers of renewable energies in the region, and at the twenty-seventh session of the Conference of the Parties to the United Nations Framework Convention on Climate Change (COP 27) it announced the signing of an agreement with Bank of America to finance renewable energy projects. The agreement provides for the creation of a warehouse financing facility involving multiple assets in various jurisdictions to support the financing of the InterEnergy project portfolio. A portion of the financing will be used to implement projects in Caribbean small island developing States (SIDS).
171 Foreign Direct Investment in Latin America and the Caribbean • 2023 Chapter III
Figure III.18
(Percentages) 0 1 2 3 9 12 31 40 0 5 10 15 20 25 30 35 40 45
Offshore
Latin America and the Caribbean (24 countries):a value of renewable energy investment project announcements as a proportion of the total, by technology, 2005–2022
Geothermal
Other Hydroelectric Biomass Wind Solar Green hydrogen and other emerging technologies
It has been established that there were 191 cross-border mergers and acquisitions involving the purchase of renewable energy assets in the region between 2005 and 2022. Brazil was the main destination, with 89 deals concluded, followed by Chile with 42 and Mexico with 26. Two phases can be distinguished in the period, the first from 2005 to 2014, when the region was the destination for an average of 8 transactions per year, and the second from 2015 to 2022, when the average was 15 transactions per year. While information on transaction amounts is unavailable in more than 60% of cases, an analysis of the average size of transactions whose value is known reveals that deals involving renewable energy assets since 2014 have been larger than those that took place in the first half of the 2000s. Importantly, 24% have involved the acquisition not of power generation companies but of assets used specifically for power generation, such as solar farms, hydroelectric power plants and wind farms.
The interest of international investors in the different renewable technologies has varied with the evolution of these technologies in international markets and the level of maturity of energy markets in the Latin American and Caribbean countries.
Solar and wind assets have dominated mergers and acquisitions, accounting on average for more than 50% of all deals, followed by assets used to generate hydropower (13%) and projects involving mixed portfolios (11%). Between 2006 and 2009, assets related to bioenergy and biofuels accounted for almost 40% of mergers and acquisitions, while between 2010 and 2013 wind energy deals accounted for 30%. Since 2014, solar assets in Chile, Brazil and Mexico have been at the forefront of merger and acquisition activity, accounting for almost 40% of all transactions (see figure III.20). It has been possible to identify seven cross-border asset acquisition deals in the renewable energy sector in 2022, with four involving solar, two hydropower and one wind power generation assets.
172 Economic Commission for Latin America and the Caribbean (ECLAC) Chapter III
Figure III.19
(Numbers) 0 5 10 15 20 25 30 2006 2007 2008 2009 2010 2011 2012 2013 2014 2015 2016 2017 2018 2019 2020 2021 2022 North America Latin America and the Caribbean Europe Asia and the Pacific Africa and the Middle East Source: Economic Commission for Latin America and the Caribbean (ECLAC), on the basis of data from Bloomberg.
Latin America and the Caribbean: cross-border renewable energy mergers and acquisitions, by region of origin, 2006–2022
The dynamics of renewable energy FDI in the region have been driven by falling technology prices, the great renewable resource potential of the region’s countries and policy initiatives implemented to create a stable and competitive investment environment. Most countries now offer tax incentives for investment, some of a general character and others specifically aimed at promoting renewable energies. These incentives consist mainly of accelerated depreciation schemes, special deductions and tax credits applied to income tax when project investments are made, as well as exemptions or reduced rates applied mainly to value added tax (VAT) and import tariffs on the purchase of machinery, equipment and other inputs needed to implement investment projects. At the same time, mechanisms such as auctions, differential tariffs and net metering have been used in most of the countries to attract international investment and, in particular, to encourage the implementation of new projects.
While the sector has grown steadily and the region now has one of the cleanest energy mixes in the world, major financing needs will have to be met if the energy transition in the Latin American and Caribbean countries is to advance. Given that there is little fiscal space in the region’s countries to increase investment in renewable energy on the scale needed to achieve the energy transition, it is essential for governments to have the right policies and instruments in place to attract private investment from the region and the world. According to IRENA (2021), investment in the sector will need to double by 2030 and then grow yet further to three times current levels if the goals set are to be achieved. FDI can play a key role in catalysing investments in frontier technologies that contribute to the energy transition in the countries of Latin America and the Caribbean.
1. Solar energy
Between 2005 and 2022, solar energy was the main driver of renewable energy investment in Latin America and the Caribbean, with 408 FDI project announcements totalling US$ 66.3 billion. The region was the third largest destination after Europe and Asia and the Pacific in the period, receiving
173 Foreign Direct Investment in Latin America and the Caribbean • 2023 Chapter III
Figure III.20
Transmission Services Mixed portfolio Other Geothermal Clean technologies Wind Solar Biofuels, biomass and bioenergy Hydropower 0 10 20 30 40 50 60 70 80 90 Argentina Bolivia (Plur. State of) Brazil Chile Colombia Costa Rica Ecuador Dominican Rep. Honduras Mexico Nicaragua Panama Peru
Latin America and the Caribbean (14 countries): cross-border renewable energy mergers and acquisitions, by technology, 2005–2021
(Numbers)
Uruguay
Source: Economic Commission for Latin America and the Caribbean (ECLAC), on the basis of data from Bloomberg.
15% of all investment in the sector. Solar power FDI announcements grew steadily from 2008 up to and including 2019, when 76 projects totalling US$ 11.8 billion were announced (see figure III.21). From 2020 onward, there was a steady decline in the number and total value of FDI announcements, with an average of US$ 5 billion between that year and 2022, leaving them at 2013 levels. The decline in solar energy FDI announcements was mainly driven by global market dynamics. Between 2020 and 2022, Latin America and the Caribbean was the destination for 12% of all investment in the sector.
Chile was the leading destination country in the region between 2005 and 2022, with 124 project announcements worth a total of more than US$ 23 billion. It was followed by Mexico and Brazil, which received US$ 16 billion and US$ 15 billion, respectively. The three countries accounted for 82% of all announcements in the region during the period. Panama ranked fourth by the amount of investment, attracting 14 projects worth almost US$ 2 billion.
174 Economic Commission for Latin America and the Caribbean (ECLAC) Chapter III
Figure III.21
of dollars and
0 10 20 30 40 50 60 70 80 0 2 4 6 8 10 12 14 2008 2010 2011 2012 2013 2014 2015 2016 2017 2018 2019 2020 2021 2022 Value (left scale) Number (right scale)
Latin America and the Caribbean (19 countries): solar energy investment project announcements, 2008–2022
(Billions
numbers)
Value Number (right scale)
By country 0 20 40 60 80 100 120 140 0 5 10 15 20 25 Chile Mexico Brazil Panama Peru Dominican Rep. Honduras Colombia Uruguay Argentina El Salvador Ecuador Jamaica Suriname Cuba Nicaragua Trinidad and Tobago Belize Costa Rica
A. Whole region
B.
Source: Economic Commission for Latin America and the Caribbean (ECLAC), on the basis of data from Financial Times, fDi Markets.
The European Union originated 64% of announcements, followed by North America (19%) and the rest of Europe (7%). At the country level, Spain was the leading investor, announcing 121 projects worth a total of US$ 21 billion (see table III.4). Of companies, Italy’s Enel was the largest investor, announcing 43 projects worth almost US$ 6 billion, followed by Spain’s Abengoa with 5 projects worth US$ 4.3 billion and Canadian Solar Inc. with 18 projects worth US$ 3 billion.
Table III.4
Latin America and the Caribbean: leading countries for solar energy investment, 2005–2022
Source: Economic Commission for Latin America and the Caribbean (ECLAC), on the basis of data from Financial Times, fDi Markets.
The largest project was announced in 2015 by Spain’s Abengoa: it was worth US$ 2.2 billion and entailed the construction of a 315 MW concentrated solar power plant. Chile was one of the top 10 investor countries between 2005 and 2022, announcing 10 projects worth US$ 1.3 billion in the region. All the Chilean projects were announced by Atlas Renewable Energy between 2017 and 2020, and the main destinations were Brazil, Mexico and Uruguay. Like project announcements, mergers and acquisitions in the solar sector were mainly concentrated in Brazil, Chile and Mexico. Of the 60 deals between 2005 and 2022, 22 involved the purchase of assets in Brazil, 21 in Chile and 9 in Mexico. In the five largest deals, four companies from Europe and one from the United States bought solar generation assets worth a total of US$ 1.3 billion (see table III.5). Only four deals were registered in 2022. Canada’s Innergex purchased the 50.6 MW San Andrés solar farm in the Atacama region of Chile for US$ 25.7 million. The company plans to build a battery energy storage system at the farm. In Mexico, MPC Energy Solutions of the Netherlands bought the Los Santos Solar I project, which has a capacity of 15.8 MWp and is located in the state of Chihuahua. Lastly, there were two deals in the Dominican Republic: the purchase of a 32 MWdc solar generation project by Canada’s Polaris Infrastructure, and the purchase of the 33.4 MWp Monte Plata solar farm by the MPC Caribbean Clean Energy Fund.
Enabling policies have played a decisive role in the evolution of solar energy FDI. Policy instruments including auctions, incentives and solar energy portfolio requirements have contributed to a significant reduction in the cost of implementing solar projects and an increase in the profitability of investments. Similarly, the creation of sound regulatory frameworks has facilitated the entry of international investors into the region’s markets. Since the mid-2000s, policies and measures to promote non-conventional energy generation have been implemented in many countries of Latin America and the Caribbean. In the case of photovoltaic solar energy, Chile’s experience has been of particular interest (see box III.5).
175 Foreign Direct Investment in Latin America and the Caribbean • 2023 Chapter III
Country of origin Value (Millions of dollars) Projects (Number) Spain 21 015 121 United States 8 272 45 Italy 6 815 50 France 5 310 41 Canada 4 443 26 United Kingdom 3 048 16 Germany 2 319 12 Czech Republic 1 714 11 China 1 534 10 Chile 1 286 10 Total 66 329 408
Table III.5
Latin America and the Caribbean: largest solar energy mergers and acquisitions, 2005–2022
Source: Economic Commission for Latin America and the Caribbean (ECLAC), on the basis of data from Bloomberg.
Box III.5
Solar photovoltaic energy in Chile
The development of the solar energy sector in Chile is relatively recent. In 2005, there was no capacity to generate this type of energy in the country. By 2014, photovoltaic energy accounted for 1% of all generation, and by 2022, for 16%. Within the general framework of a national inward investment and capacity-building strategy (Guimón and others, 2018), initiatives aimed at accelerating the growth of the renewable energy sector, and solar energy in particular, began to be implemented in the first half of the 2000s.
Foreign investment has played a key role in the strategies pursued and contributed significantly to the development of the sector. Since 2004, Law No. 19940, known as the Short Law I, has allowed new entrants into the energy market and provided non-discriminatory access to large-scale renewable energies and small generating facilities. In 2008, Law No. 20257 was passed, requiring energy companies to offer end customers certain minimum quotas of non-conventional energy. This was updated in 2013 by Law No. 20698 setting targets for renewable energy generation by 2025. At the same time, an auction mechanism and a series of tax incentives were designed for the implementation of solar energy projects, such as exemption from value added tax (VAT) on imports of capital goods and concessions of State-owned land for project implementation. In 2014, net billing was introduced to promote the creation of decentralized solutions. This mechanism, which was updated in 2018, gives regulated customers the option of feeding the energy they generate into the system and deducting it from their consumption. In 2015, the Energy 2050 long-term strategy was presented, introducing explicit targets and policies for the development of the solar sector and facilitating medium-term domestic and international investment. In particular, it created mechanisms to make solar project tendering more flexible, improved energy supply mechanisms, provided the option for generators to choose eight-hour time slots for generating electricity from renewable energy sources, guaranteed public procurement tender prices for a period of 15 or 20 years, and improved transmission and concession laws (Nasirov and others, 2019). In parallel, Chile has launched initiatives to develop production capacities throughout the solar sector chain, promoting synergies with demand from the mining sector and the service sector (Zurita and others, 2018; Saporito and others, 2021).
In a global context characterized by falling prices for photovoltaic technologies, Chile has been one of the main destinations for FDI announcements in the solar sector since 2012. Between 2010 and 2022, 124 FDI projects totalling more than US$ 23 billion were announced for the country. Investments were concentrated in a few regions, with 60% of projects being for Antofagasta and Atacama, the two regions with the highest solar irradiation. While investments over the decade came from 17 countries and 49 companies, Spain was the largest investor and Abengoa the leading company, announcing investments worth US$ 4.4 billion.
176 Economic Commission for Latin America and the Caribbean (ECLAC) Chapter III
Asset acquired Buyer Year Amount paid (Millions of dollars) Investing country Country of the asset Solar photovoltaic assets (578 MW) Actis 2017 525 United Kingdom Brazil Photovoltaic plant in Aguascalientes (Mexico) Cubico Sustainable Investments Ltd. 2016 275 United Kingdom Mexico Actis El Pelicano Solar Company photovoltaic plant SunPower Corporation 2016 212 United States Chile Kroma Energía Apodi photovoltaic portfolio Scatec Solar ASA 2016 211 Norway Brazil Portfolio of 100 MW of solar projects Reden Solar SAS 2019 96.4 France Chile
Source: Economic Commission for Latin America and the Caribbean (ECLAC), on the basis of data from Financial Times, fDi Markets.
In 2022, Chile’s National Energy Commission (CNE) announced that a tender for 777 GWh/a of new supply from 2027 had been awarded. Part of the tender was awarded to the Chinese company Canadian Solar, which has announced that in 2023 it will start work on the Zaldívar project, located in the Antofagasta region, which is expected to involve the installation of 253 MWp of solar power generation and 1,000 MWh of battery energy storage.
Chile’s public policies have become a benchmark for the development of the solar power generating sector globally. Growth and foreign investment in the sector are expected to accelerate again after 2022. As part of its recovery strategies, the government has announced new energy transition goals and pursued programmes aimed at increasing distributed generation capacity. With a well-developed regulatory framework in place and new photovoltaic capacity being added every year, Chile is on track to meet its 2025 targets.
Source: Economic Commission for Latin America and the Caribbean (ECLAC), on the basis of J. Guimón and others, “Policies to attract R&D-related FDI in small emerging countries: aligning incentives with local linkages and absorptive capacities in Chile”, Journal of International Management, vol. 24, No. 2, June 2018; S. Nasirov and others, “Policy makers’ perspectives on the expansion of renewable energy sources in Chile’s electricity auctions”, Energies, vol. 12, No. 21, October 2019; A. Zurita and others, “State of the art and future prospects for solar PV development in Chile”, Renewable and Sustainable Energy Reviews, vol. 92, September 2018; N. Saporito and others, Upgrading Institutional Capacities in Innovation Policy in Chile: Choices, Design, and Assessments, Washington, D.C., Inter-American Development Bank (IDB), 2021; and A. Podestá and others, “Políticas de atracción de inversiones para el financiamiento de la energía limpia en América Latina”, Project Documents (LC/TS.2022/116), Santiago, ECLAC, 2022.
177 Foreign Direct Investment in Latin America and the Caribbean • 2023 Chapter III
of dollars and numbers) Value Number (right scale) 0 5 10 15 20 25 0 0.5 1.0 1.5 2.0 2.5 3.0 3.5 4.0 4.5 5.0 2010 2011 2012 2013 2014 2015 2016 2017 2018 2019 2020 2021 2022
Chile: solar energy foreign direct investment project announcements, 2010–2022 (Billions
Source: Economic Commission for Latin America and the Caribbean (ECLAC), on the basis of data from Financial Times, fDi Markets.
Year Company Country of origin Destination region for the investment Capital (Millions of dollars) 2015 Abengoa Solar Chile Spain Atacama 2 200 2013 Abengoa Solar Chile Spain Antofagasta 1 061.48 2014 Abengoa Spain Antofagasta 750
Chile: largest solar energy investment project announcements, 2010–2022
2. Wind energy
Between 2005 and 2022, the wind power generation sector was one of the most dynamic in terms of attracting investment, with 233 projects worth a total of US$ 51.3 billion announced in Latin America and the Caribbean. After 2009, when investments worth US$ 7 billion were announced, FDI announcements in this sector held steady at an average of about US$ 3.5 billion per year. The number of announcements had been rising before the crisis caused by the pandemic, peaking in 2019 at 31 projects worth a total of US$ 5.3 billion. In 2021, however, the impact of the pandemic and the crisis in energy markets led to a 57% drop in project announcements, and 2022 saw the fewest in a decade: five projects worth US$ 1.6 billion (see figure III.22).
178 Economic Commission for Latin America and the Caribbean (ECLAC) Chapter III
Figure III.22
Value (left scale) Number (right scale) 0 5 10 15 20 25 30 35 0 1 2 3 4 5 6 7 8 2006 2007 2008 2009 2010 2011 2012 2013 2014 2015 2016 2017 2018 2019 2020 2021 2022 A. Whole region Value Number (right scale) B. By country 0 10 20 30 40 50 60 70 0 2 4 6 8 10 12 14 16 Chile Brazil Mexico Argentina Panama Uruguay Dominican Rep. Peru Colombia Costa Rica Honduras Nicaragua Ecuador Guatemala
Latin America and the Caribbean (14 countries): wind energy project announcements, 2006–2022 (Billions of dollars and numbers)
Source: Economic Commission for Latin America and the Caribbean (ECLAC), on the basis of data from Financial Times, fDi Markets.
Investments were concentrated in Chile, Brazil and Mexico, which together received 80% of the total. As for the other countries in the region, Colombia showed particular dynamism between 2019 and 2021, attracting projects worth US$ 600 million. Some 80% of the investments made in the sector came from the European Union, followed by North America (8%), other European countries (6%) and Asia and the Pacific (4%). Only 2% of all the projects announced originated from the countries of the region.
Investor countries were led by Spain, which announced 59 projects worth a total of US$ 17 billion, followed by Italy (US$ 7.6 billion) and France (US$ 6.4 billion) (see table III.6). Brazil was the leading investor from the region, announcing three investments in Chile and one in Uruguay worth a total of US$ 770 million, followed by Argentina, which in 2013 announced two projects in Uruguay to build and expand a wind farm, and Colombia, which in 2014 announced a US$ 200 million project to build a wind farm in Chile.
Table III.6
Countries originating the largest investments in wind energy, 2005–2022
Source: Economic Commission for Latin America and the Caribbean (ECLAC), on the basis of data from Financial Times, fDi Markets.
In 2009, Guascor Group from the Basque Country announced the building in Argentina of what would become the world’s largest wind farm, with a capacity of between 600 MW and 900 MW, for a total investment of US$ 2.4 billion.
In contrast to the dynamism of FDI project announcements, mergers and acquisitions in the sector were rare. Between 2007 and 2022, there were 48 recorded deals involving the purchase of wind generation assets in the countries of the region. The destination country for the largest number of deals was Brazil, with 21 cross-border mergers and acquisitions, followed by Mexico with 11 and Uruguay with 6. Companies from the United States, the United Kingdom and Spain were the main investors, accounting for 73% of all deals. The United States and the United Kingdom carried out the largest transactions in the region (see table III.7). The largest recorded between 2007 and 2022 was the purchase of the Casa dos Ventos wind farm complex in Brazil by Cubico Sustainable Investments Ltd.
At the intraregional level, there were no reported mergers and acquisitions between companies in the region, and the only two transactions recorded were carried out by multinational companies with assets in the region: in one, Enel bought assets with a capacity of 90 MW in the Cristalândia wind project in Brazil, and in the other, InterEnergy Holdings, which operates in the Dominican Republic, purchased a 15 MW portfolio in Chile.
179 Foreign Direct Investment in Latin America and the Caribbean • 2023 Chapter III
Investing country Capital invested (Millions of dollars) Projects (Number) United Kingdom 1 045 6 Australia 1 264 3 Portugal 1 424 11 Norway 1 625 8 United States 3 679 16 Ireland 3 745 11 Germany 4 657 26 France 6 425 34 Italy 7 663 39 Spain 16 798 59
Table III.7
Main wind energy mergers and acquisitions, 2005–2022
Source: Economic Commission for Latin America and the Caribbean (ECLAC), on the basis of data from Bloomberg.
As with solar energy, public policy initiatives aimed at fostering renewable energy generation have been crucial in promoting wind sector investment in Latin America and the Caribbean. While generic instruments such as auctions, tax incentives, feed-in tariffs and mandatory quotas have been implemented in all countries, few have developed strategic plans specifically aimed at encouraging the wind power generation sector. Auctions have been the most widely used policy tool at the regional level and have allowed the sector to grow rapidly. Uruguay is a case in point, holding five auctions to award wind generation capacity, with the result that the sector developed quickly and the country came to have one of the highest percentages of wind power in its energy mix (Ruiz Campillo, 2017). In Brazil and Panama, too, tenders have been held specifically for wind power generation (see box III.6 for information on Brazil).
Box III.6 Wind energy in Brazil
The wind generation sector in Brazil began to develop in the early 2000s as a result of a series of energy crises. The country’s energy mix was dominated by hydropower, and after a number of years in which generating capacity was below par, a strategy was put in place to diversify energy generation sources. The 2002 provisions to diversify the electricity mix were the first milestone in the opening up of Brazil’s wind sector to the global market. In the first Alternative Sources of Energy Incentive Programme (PROINFA), 300 MW were tendered under a preferential tariff system, and this capacity was distributed equally between wind, biomass and small-scale hydropower (Herrera, Cosenz and Dyner, 2019).
In 2008, the country implemented a system of auctions with strict eligibility criteria that enabled the industry to develop. The first auction exclusively for wind energy took place in 2009, tendering 1.8 GW of projects to be implemented by 2012. In 2010, the Ministry of Mines and Energy tendered other technology-neutral concessions. All auctions prohibited the import of wind turbines with a rated capacity of less than 1.5 MW and included a local content requirement (Herrera, Cosenz and Dyner, 2019). At the same time, initiatives aimed at creating efficient local production chains were designed and credits from the National Bank for Economic and Social Development (BNDES) were offered to those carrying out development activities in the sector. Brazil is now home to wind turbine producers, companies specializing in the manufacture of turbine blades and towers, companies working with other components, and transport, planning and service companies. Local capacity-building has been essential to create jobs and reduce the cost of implementing wind projects in the country.
The first foreign direct investment (FDI) projects in Brazil were announced in 2010. Spain’s Iberdrola and Elecnor announced two projects worth US$ 178 million and US$ 142 million, respectively. Wind power FDI announcements grew moderately from 2010 until before the pandemic, and 29 projects worth a total of US$ 5.7 billion were announced between 2019 and 2020.
180 Economic Commission for Latin America and the Caribbean (ECLAC) Chapter III
Asset acquired Buyer Year Amount paid (Millions of dollars) Investing country Country of the asset Wind assets with a capacity of 392 MW Cubico Sustainable Investments Ltd. 2016 494 United Kingdom Brazil Fourteen wind projects in Brazil TerraForm Global, Inc. 2015 485 United States Brazil Operative onshore wind project in Brazil with a capacity of 137 MW Actis 2020 325 United Kingdom Brazil Desarrollos Eólicos Mexicanos de Oaxaca 1 SA de CV First Reserve Corporation 2013 244 United States Mexico
Brazil: wind energy foreign direct investment project announcements, 2010–2022
A total of 67 FDI projects worth US$ 13.7 billion were announced in the wind generation sector between 2010 and 2022. The main investors were companies from Italy and France, which announced investments totalling US$ 7 billion. Italy’s Enel, in particular, announced 14 projects worth US$ 3 billion. The main investments took place between 2018 and 2020 (see table).
Brazil: largest wind energy investment project announcements, 2010–2022
Source: Economic Commission for Latin America and the Caribbean (ECLAC), on the basis of data from Financial Times, fDi Markets.
Geographically, wind energy investments are extremely concentrated. Three states, Rio Grande do Norte, Bahia and Piauí, have attracted 75% of the sector’s projects.
Brazil ranks eighth in the world for installed capacity, with 14.5 GW (IRENA, 2023). Furthermore, in 2021 it ranked third for the installation of new wind power capacity, behind China and the United States (GWEC, 2022). In 2022, regulations for the development of offshore wind energy projects started to be designed. It is estimated that, considering potential technical capacity, Brazil could become one of the main destinations for offshore energy projects. Large companies in the sector have shown increasing interest. According to the Brazilian Institute for the Environment and Renewable Natural Resources (IBAMA, 2023), environmental licence applications totalling more than 176 GW had been filed in Brazil by the end of 2022, with an average capacity of 2.7 GW per project.
Source: Economic Commission for Latin America and the Caribbean (ECLAC), on the basis of M. M. Herrera, F. Cosenz and I. Dyner, “How to support energy policy coordination? Findings from the Brazilian wind industry”, The Electricity Journal, vol. 32, No. 8, October 2019; International Renewable Energy Agency (IRENA), Renewable Capacity Statistics 2023, Abu Dhabi, 2023; Global Wind Energy Council (GWEC), Global Wind Report 2022, Brussels, 2022; and Brazilian Institute for the Environment and Renewable Natural Resources (IBAMA), “Complexos eólicos offshore: projetos com processos de licenciamento ambiental abertos no Ibama”, 2023 [online] https://www.gov.br/ibama/pt-br/assuntos/laf/consultas/ mapas-de-projetos-em-licenciamento-complexos-eolicos-offshore.
181 Foreign Direct Investment in Latin America and the Caribbean • 2023 Chapter III
(Billions of dollars and numbers) 0 2 4 6 8 10 12 14 16 18 0 0.5 1.0 1.5 2.0 2.5 3.0 3.5 4.0 2010 2011 2012 2013 2014 2015 2016 2017 2018 2019 2020 2021 2022 Value Number (right scale)
Source: Economic Commission for Latin America and the Caribbean (ECLAC), on the basis of data from Financial Times, fDi Markets.
Year Company Country State Value (Millions of dollars) 2018 Iberdrola Spain Rio Grande do Norte 833 2020 Enel Brasil Participações Italy Piauí 811 2020 Statkraft Norway Bahia 442
The wind generation sector is playing a key role in the energy transition in Latin America and the Caribbean. In 2022, Latin America accounted for 5.7% of all new wind capacity installed globally. While most of the investment attracted up to that year went into onshore wind technologies, there is great potential for offshore projects in the region. According to a study published by the World Bank’s Energy Sector Management Assistance Programme (ESMAP, 2019), the Latin American countries with the greatest technical potential for offshore wind power development are Argentina and Brazil, whose generation capacity is estimated at 1.9 TW and 1.3 TW, respectively. International investors have expressed interest in developing offshore wind energy projects in the region. According to the Brazilian Institute for the Environment and Renewable Natural Resources (IBAMA, 2023), planned offshore wind generation projects in Brazil amount to 180 GW, which is four times the current installed wind capacity in the country. The largest project will be the Ventos do Sul wind farm, which will have an installed capacity of 6.5 GW. The first auctions for the development of offshore projects are planned for 2023. The new offshore wind technology cycle is expected to re-energize offshore wind investments in the coming years.
3. Other energy sources: hydropower and biomass
While solar and wind have dominated renewable energy FDI in the region, other renewable sources have played an important role in the energy transition in many countries of Latin America and the Caribbean.
Hydropower, in particular, remains the leading source of renewable energy, accounting for more than 41% of installed capacity. However, FDI announcements have been relatively modest. Between 2005 and 2022, 55 projects worth US$ 15.5 billion were announced, the bulk of them between 2008 and 2011, when 35 such projects were announced, accounting for 65% of the total by value (see figure III.23).
Chile, Brazil and Peru were the top three destinations for hydropower FDI between 2005 and 2022, attracting 70% of the projects announced in the region. European Union countries, in particular Spain, Italy and France, were responsible for 57% of the announcements, followed by the United States (13%)
182 Economic Commission for Latin America and the Caribbean (ECLAC) Chapter III
Figure III.23
(Billions of dollars and numbers) 0 2 4 6 8 10 12 14 0 0.5 1.0 1.5 2.0 2.5 3.0 3.5 2005 2006 2007 2008 2009 2010 2011 2012 2013 2014 2015 2016 2017 2018 2019 2020 2021 Value Number (right scale)
Latin America and the Caribbean: hydropower investment project announcements, 2005–2022
Source: Economic Commission for Latin America and the Caribbean (ECLAC), on the basis of data from Financial Times, fDi Markets.
and countries in Latin America and the Caribbean (10%) and Asia and the Pacific (10%). Brazil was the main regional investor, announcing 10 projects worth US$ 1.5 billion in the period, or 9% of the investment in the region. AES of the United States announced the largest project, which was located in Chile and worth US$ 1.2 billion.
Environmental challenges associated with the development of large-scale hydropower projects and the impact of climate change on hydropower generating potential have reduced investor interest in the sector. Since 2020, there has been only one announcement in the region, by the Spanish group Ecoener in Colombia in 2021.
Bioenergy and biomass development has also played a key role in the energy strategies of some of the region’s countries, particularly Brazil, Argentina and Colombia, although its share of FDI announcements is low.
Between 2005 and 2022, 108 biomass and bioenergy FDI projects totalling almost US$ 20 billion were announced, representing 12% of all renewable energy investment (see figure III.24). Investment in the sector surged between 2007 and 2011, peaking at a total of US$ 3.3 billion in the latter year. From 2012 to 2021, announcements never exceeded US$ 1 billion per year, but in 2022, SGP BioEnergy of the United States announced the construction of a biofuel refinery in Panama to produce green hydrogen, which reversed the trend in the sector. The project, worth US$ 2.5 billion, will be implemented from 2025 and is estimated to have the potential to produce up to 405,000 tons of green hydrogen per year. The Panamanian announcement represented 90% of all investment in the sector in 2022. That year also saw the announcement of a US$ 290 million project in Brazil and two projects worth US$ 70 million and US$ 10 million, respectively, in Argentina.
Source: Economic Commission for Latin America and the Caribbean (ECLAC), on the basis of data from Financial Times, fDi Markets.
Between 2005 and 2022, Brazil was the leading destination for biomass and bioenergy FDI, attracting 47 projects that represented almost 60% of all announcements. Brazil was followed by Argentina with 15 projects and Peru with 9. North America was the leading investor, with 44 projects totalling US$ 9.4 billion, followed by the European Union, with 43 projects worth US$ 6 billion.
183 Foreign Direct Investment in Latin America and the Caribbean • 2023 Chapter III
Figure III.24
(Billions of dollars and numbers) 0 2 4 6 8 10 12 14 16 18 20 0 0.5 1.0 1.5 2.0 2.5 3.0 3.5 2005 2006 2007 2008 2009 2010 2011 2012 2013 2014 2015 2016 2017 2018 2019 2020 2021 2022 Value Number (right scale)
Latin America and the Caribbean: biomass and bioenergy investment project announcements, 2005–2022
Other energy sources, in particular offshore and geothermal energy, have together accounted for less than 3% of all announcements in the region. As has been the case globally, green hydrogen and environmental technologies such as battery and storage systems have attracted investor interest in the region in recent years. Between 2018 and 2022, there were 10 project announcements worth a total of US$ 3 billion. In 2022 alone, six projects with an estimated value of US$ 2.6 billion were announced. European countries have been the main investors (80% of the total), followed by the United States. While new technologies have attracted substantial announcements, projects are still in the demonstration phase.
E. Policy approaches for promoting renewable energy and attracting foreign direct investment
The urgency of the energy transition and the growing need for investment in the sector call for initiatives to mobilize resources, both domestic and international. In today’s regional economic context, characterized by limited fiscal space and low domestic investment, mobilizing international resources to accelerate the energy transition is particularly important. Understanding the factors that influence FDI flows and the policy tools for channelling them into renewable energy is of fundamental importance for policy design.
Investing in renewable technology projects involves high upfront capital costs and a number of risks related to technologies (such as their life cycle, efficiency, price, level of obsolescence and degree of maturity in markets), value chains (their degree of concentration and resilience to external shocks) and conditions in the countries where projects are implemented (for example, energy demand, the stability of the regulatory framework and electricity infrastructure). While renewable energy FDI benefits from the same variables as FDI in other sectors (market incentives, stable regulatory frameworks and low political risk), it has some specific dynamics that relate to the characteristics of the sector. When decisions about investing in renewable energy are made, the expected return of the project and the associated risks are the two main variables that determine how attractive it is (Wüstenhagen and Menichetti, 2012). In particular, the nature of the technologies, which serve to diversify a firm’s energy portfolio, and the increasing expansion of demand in international markets mean that market risk is typically lower for investment in renewable technologies than in other sectors. However, the high cost of the technologies and the degree of regulation in the sector mean that risks are greater at the project level (Rothballer and Kaserer, 2012). Most policy instruments designed to attract investment in the renewable energy sector aim to reduce the latter type of risk, ensure a return on investment in the medium term and lessen the risks associated with uncertainty in the market concerned (Lipp, 2007; Polzin and others, 2015 and 2019).
However, the design of the policies implemented to promote the renewable energy sector and the toolkit used to achieve the objectives set are more relevant to policy outcomes and effectiveness (Haelg, Waelchli and Schmidt, 2018; Schmidt and Sewerin, 2019). In particular, it has been shown that a crucial element when it comes to building local capacity and promoting the sector’s development is to have consistent policy strategies at the macro level (goals to be achieved), the meso level (choice of instrument) and the micro level (calibration of the instrument to match the country’s characteristics and objectives) (Haelg, Waelchli and Schmidt, 2018).
In this context, and in a highly globalized market whose dynamics tend to attract investments in mature technologies, it is crucial for developing countries to have policy strategies with specific goals and instruments calibrated to their needs. In these countries, which struggle to compete with international leaders, the design and calibration of instruments plays a key role in channelling the effects of policies and can influence the orientation of investments to facilitate the development of local capabilities or specific technologies (Matsuo and Schmidt, 2019).
184 Economic Commission for Latin America and the Caribbean (ECLAC) Chapter III
A variety of policy approaches are available to foster the development of renewable energy markets, related production capabilities and value chains. These instruments have proven effective in different contexts. However, it is important to realize that effectiveness will depend on the policy framework in which they are embedded and how they are calibrated to suit the characteristics of the different markets. Not all these policy mechanisms have the same goal: some aim to promote the renewable energy market, others provide general support for domestic and international companies to develop technology or ancillary components locally, and others again are designed to encourage complementary activities along the chain. Supporting a just energy transition will mean combining the different instruments and calibrating them to suit the characteristics and needs of the different countries.
Table III.8 summarizes some of the instruments most commonly used to promote the renewable energy sector and attract FDI, after which the main characteristics of each instrument are described.
Table III.8
Policy approaches most commonly used around the world to attract international investment and develop the renewable energy sector
Policy approach Effect
Long-term strategies and goals
Feed-in tariffs
Auctions
Financial and fiscal incentives
Portfolio standards and quotas
Direct public sector investment
Local content requirements
Research and development and demonstration projects
Reduce country uncertainty and orient investment.
Reduce uncertainty, guarantee a return and orient investment.
Reduce market risk, guarantee a return and orient investment.
Reduce costs, discourage investment in non-renewable energies and promote specific technologies.
Orient investment.
Reduce uncertainty, strengthen the sector and orient research and development efforts.
Develop local capabilities and cut costs.
Reduce technological risk.
Source: Economic Commission for Latin America and the Caribbean (ECLAC).
1. Long-term strategies and goals
In most countries, policies to promote the renewable energy sector have been framed within strategies to reduce long-term emissions. Since the late 1990s, with the signing of the Kyoto Protocol to the United Nations Framework Convention on Climate Change, energy transition strategies with long-term objectives have been developed in an increasing number of countries. When the Paris Agreement was signed in 2015, emission and renewable energy goals became more ambitious: since then, 194 parties have submitted their nationally determined contributions, 183 have included renewables among their goals and 143 have a quantified target (IRENA, 2022b). Long-term strategies have been the reference framework within which the most appropriate toolkits for achieving energy transition goals have been identified. National strategies (or regional ones, as in the European Union) have been implemented to accelerate the energy transition. Framing policy instruments within long-term strategies with concrete goals helps to reduce market uncertainty and encourages the mobilization of investments (Knutsson and Ibarlucea Flores, 2022; Costa and others, 2022). While many countries in the region have long-term energy transition strategies, very few have planning and policy instruments that provide a framework for identifying and selecting public investment projects (Eguino, Bonilla-Roth and Lopes 2020).
Long-term strategies and goals have the following characteristics:
• They are effective in promoting renewable energies.
• They can help reduce uncertainty.
• They must set clear and achievable goals.
• They need supplementary policies.
185 Foreign Direct Investment in Latin America and the Caribbean • 2023 Chapter III
2. Feed-in tariffs
Feed-in tariffs, which are fixed prices designed to encourage the development of the renewable energy market, have been one of the most widely used measures in the sector and have been adopted in more than 80 countries around the world. Such tariffs incentivize investments in renewable technologies because they yield an above-market price, increase market stability and ensure the profitability of projects. The design of the tariffs depends on the characteristics of the country in which they are applied and the objectives being pursued. In most cases they are long-term and designed to ensure a significant profit margin. They may also be designed to orient investment towards the adoption or development of specific technologies. Feed-in tariffs have been found to be effective mainly in promoting the renewable energy sector (Criscuolo and Menon, 2015) and orienting investments towards specific technologies (Friebe, Von Flotow and Täube, 2014). The effectiveness of such tariffs depends, among other factors, on the length of time for which the price is guaranteed (Dijkgraaf, Van Dorp and Maasland, 2018), correct calibration of the price (Viscidi and Yépez, 2019) and complementary measures to facilitate grid connection (Jacobs and others, 2013). Systems of guaranteed fixed tariffs over long periods with ancillary measures to facilitate grid connection have been found to reduce project risk and increase investment. Since the 2000s, feed-in tariffs have been used in some countries of the region to incentivize the deployment of renewable energy. Brazil was the first country to introduce them, between 2002 and 2010, under the Alternative Sources of Energy Incentive Programme (PROINFA) (Dutra and Szklo, 2008; Kissel and Krauter, 2006; IEA, 2023b). In Argentina, feed-in tariffs were introduced in 2006 and applied to renewable energy under the National Incentive Regime for the Use of Renewable Sources of Energy for Electricity Production (IEA, 2023b). In the Dominican Republic, Costa Rica, Ecuador, Honduras, Nicaragua, Panama, Peru and Uruguay, among other countries, feed-in tariff systems have been used to promote the spread of renewables (Jacobs and others, 2013; Washburn and Pablo-Romero, 2019). While these instruments have sometimes been important for the growth of the renewable energy market, they have often been discontinued and replaced by auction mechanisms. In the Latin American and Caribbean countries, tariffs need to be carefully calibrated, especially in relation to social tariff policies, to minimize possible distortions to energy production and generation (Podestá and others, 2022).
Feed-in tariffs have the following characteristics:
• They are effective at developing the market.
• They can serve to orient investment towards specific technologies.
• The time horizon of the measure influences its effectiveness.
• Proper calibration of the price is essential to ensure the measure is effective and minimize possible distortions to energy production and generation.
• Complementary measures facilitating or guaranteeing access to the grid increase the effectiveness of tariffs.
3. Auctions
Governments may hold competitive auctions to tender out projects or project sites. At auctions, the State usually offers long-term power purchase agreements. If the objective is to promote the renewable energy market in general, auctions may be technology-neutral; if the objective is to attract projects with a particular technology, then they may specify that technology. Like feed-in tariffs, public auction mechanisms have been designed in many countries around the world, and their effectiveness has varied depending on the design and calibration of the instrument. In particular, the
186 Economic Commission for Latin America and the Caribbean (ECLAC) Chapter III
length of contracts, the auction process, the price and the pricing structure (for example, the price ceiling and price floor) have a major impact on effectiveness. Long-term contracts tend to enhance market stability and attract more investment (Del Rio and Linares, 2014), particularly when applied to specific technologies. Neutral auctions tend to attract more investment in mature technologies and are not effective for emerging technologies (Mora and others, 2017). The calibration of pricing and of price caps can increase the volume of investment (Mora and others, 2017). Auctions have been one of the most widely used tools in Latin America and the Caribbean, where more than 16 countries have conducted them to implement renewable energies or incentivize projects using specific technologies (Viscidi and Yépez, 2019; Correia, Tolmasquim and Hallack, 2020). Some of the world’s first successful renewable energy tenders were in Brazil in 2005 and Uruguay in 2006, when auctions were held for hydropower, wind energy and biomass projects. The first solar energy tenders in the region were held in Argentina and Peru in 2009. Since then, auctions have become the main tool for facilitating renewable energy investment in the region and have contributed to the region becoming a market of global interest.
Auctions have the following characteristics:
• When they are technology-neutral, they are effective at stimulating the market.
• When they are not neutral, they are effective at orienting investment towards emerging technologies.
• When stable prices are set and longer periods offered, they lead to an increase in the volume of investment.
4. Financial and fiscal incentives
There are various types of financial and fiscal incentives designed to promote the development of the renewable energy sector. Instruments have different goals and vary with the level of maturity of the market. In some countries, for example, subsidy, incentive or tax reduction schemes have been designed to reduce the total cost of investments, to promote the development of manufacturing activities or to discourage non-renewable energy projects. While one or more financial and fiscal incentive schemes have been designed in most countries, these mechanisms have been found to be effective if implemented as supplements to other instruments (particularly differentiated tariffs and auctions) (Li, Chang and Chang 2017). However, financial and fiscal incentives can be useful for attracting venture capital and disincentivizing fossil fuel investments (Pfeiffer and Mulder, 2013). Financial and fiscal incentive schemes have been designed in almost all Latin American and Caribbean countries to promote the deployment of renewable energies (IEA, 2023b). Among the most commonly used measures are exemptions from or reductions in tariffs or value added taxes on imports of technology, machinery and materials for renewable energy projects. In addition, there are special regimes in many countries that reduce income tax on activities linked to renewable energy generation, and there are also mechanisms for accelerated depreciation of investments in machinery and equipment used to generate renewable energy. Some countries of the region, such as Argentina, Chile, Colombia and Mexico, have carbon taxes or green taxes designed to incentivize renewable energy sources. In addition, Mexico and Colombia were two of the first countries in the region to implement emissions trading systems.
Financial and fiscal incentives have the following characteristics:
• They are applied to reduce project financing costs.
• They are effective if they supplement other mechanisms.
• They can be helpful in attracting venture capital.
• They can be helpful in disincentivizing fossil fuel investments.
187 Foreign Direct Investment in Latin America and the Caribbean • 2023 Chapter III
5. Portfolio standards and quotas
To steer the market towards renewable technologies, governments can require companies in the energy and electricity sector to have a minimum percentage of renewable energy in their portfolios. The design of portfolio standards and quotas varies according to the objective of decision-makers and can include mandatory generating quotas, mandatory technologies or sales requirements. The simplest design is a requirement for a set percentage of electricity in each supplier’s portfolio to be generated from renewables. In some cases, mechanisms for incremental portfolio standards have been designed, setting obligations that change over the years. They have generally been an effective tool in developed energy markets (Baldwin and others, 2017). The first countries to implement portfolio standards were the United States, the United Kingdom and Japan. In the case of the United Kingdom, the data suggest that, as with the other instruments, a prespecified duration has a positive impact on investment (Lauber, 2004). In the United States, the effectiveness of portfolio standards has been variable and has depended on the energy policies of the different states (Shrimali and Kniefel, 2011). In addition, the allocation of quotas by technology can orient investments and, if well calibrated, incentivize the development of emerging technologies and increase environmental sustainability (Mamkhezri, Malczynski and Chermak, 2021). In recent years, as renewables markets and technologies have matured, there has been a progressive increase in the use of portfolio standards and mandatory renewable energy quotas (Bangjun and others, 2022). In Latin America and the Caribbean, this tool has been used in some specific cases to incentivize renewable energy generation. In Argentina, for example, Law 27191 introduced progressive quotas for renewable energy consumption. In Colombia, all energy distributors serving the regulated user market have been required since 2022 to obtain 10% of their energy from non-conventional sources. In 2023, the measure was extended to all companies trading in the wholesale energy market (IEA, 2023b).
Portfolio standards and quotas have the following characteristics:
• Their purpose is to increase the percentage of renewable energy.
• They can be applied to generation and sales.
• They can be nominal or incremental.
• They require a medium- to long-term time horizon.
• If properly calibrated they can foster the development of emerging technologies.
• They are most effective in developed energy markets.
6. Direct public sector investment
To boost the development of the energy sector, governments can implement public investment strategies for renewable energy. On average, direct public sector investments in renewables have accounted for about 6% of all investment (IRENA/CPI, 2023). China has led the international statistics for this type of investment, but developed countries have recently announced substantial public investment packages. Both the European Union and the United States have activated investment packages aimed at fostering technological development in the energy sector. The typology of public sector investments depends on the structure of the State and the financial markets. Among the conventional channels for public investment have been national development banks and State-owned enterprises (Geddes, Schmidt and Steffen, 2018; Waidelich and Steffen, 2023; Steffen and Schmidt, 2019). Direct public sector investment depends on countries’ capacity and has been crucial in catalysing private investment, facilitating market growth and promoting technological development (IRENA/CPI, 2023).
188 Economic Commission for Latin America and the Caribbean (ECLAC) Chapter III
Direct public sector investment has the following characteristics:
• It is intended to promote the development of the sector or of specific technologies.
• It is important in weak or underdeveloped markets.
• It has been channelled mainly through development banks and State-owned enterprises.
• It is carried out mainly in China and developed countries.
7. Local content requirements
Minimum local content requirements are intended to promote the development of a country’s production system at the various stages of the renewable energy chain. The most general version of this mechanism requires a minimum percentage of local content to be included in all or some renewable energy projects. The design varies according to decision-makers’ objectives and depends mainly on the stage of the chain at which capacity-building is sought, the capabilities already in place in the country, the maturity of the market, the structure of domestic and international value chains and the complexity of the product. In general, results are achieved in the medium and long term, and effectiveness depends on how this mechanism combines with other instruments (Baker and Sovacool, 2017). In many countries, it has been used to promote the development of wind and photovoltaic technologies and related components. Some emblematic cases have been Spain, Canada, China, Mexico, Brazil, India and South Africa (Huenteler, Niebuhr and Schmidt, 2016). The evidence is that, if well calibrated to local capacity and the global structure of the sector, local content requirements can foster local capabilities and reduce the cost of developing projects, thereby increasing countries’ ability to attract investment (Lewis and Wiser, 2007; Binz and others, 2017; Liu and Kokko, 2010). The effectiveness of policy design has varied depending on the type of technology and level of product sophistication. Generally, setting achievable requirements that match the capabilities of the sector has been crucial for initiatives to work (Baker and Sovacool, 2017; Rennkamp and Boyd, 2015). In the case of wind turbines, for example, the most successful cases have been those where stable levels of demand have been guaranteed (Bergek and Jacobsson, 2003); in the case of solar module cells, by contrast, global market growth has been more important than domestic demand (Grau, Huo and Neuhoff, 2012). In all cases, the determining factor has been the calibration of instruments to local capacity. When it comes to investment, local content requirements may have different impacts depending on the technology, the global market and domestic capabilities (Hansen and others, 2020). It should be mentioned that, under World Trade Organization (WTO) rules, local content requirements could be considered a violation of article III.4 of the General Agreement on Tariffs and Trade (GATT), article 2 of the Agreement on Trade-Related Investment Measures and article 3 of the Agreement on Subsidies and Countervailing Measures. The position taken by WTO on local content requirements was in evidence in its response to measures in the solar energy sectors of Canada and India. In both cases, WTO bodies found local content requirements to be in violation of the agreements (WTO, 2014 and 2018). In the last decade, however, such measures have been applied in developed and developing countries’ renewable energy promotion programmes.
Local content requirements have the following characteristics:
• They foster local capabilities at specific stages of the chain and of the different technologies.
• Their effectiveness depends on the instrument being calibrated to the country’s capabilities.
• Results are medium- and long-term.
• Domestic demand and international market dynamics are critical to the effectiveness of the measure.
189 Foreign Direct Investment in Latin America and the Caribbean • 2023 Chapter III
8. Research and development and demonstration projects
Research and development (R&D) support programmes and demonstration projects have been crucial in fostering renewable energy manufacturing and technological capabilities (Plank and Doblinger, 2018). The effectiveness of these instruments depends on the structure and functioning of the national innovation system. Public R&D programmes and demonstration projects have been most successful in countries where there is a high degree of coordination between the private sector, the public sector and universities (Kamp, 2002). Demonstration projects can be crucial in reducing investor risk when technology is developed locally, because they provide information and data on the effectiveness of the technology. Similarly, public R&D spending can have a positive impact on decisions about investment in renewable technologies, since it reduces the uncertainty and technical risk associated with these (Azhgaliyeva, Beirne and Mishra, 2023).
R&D and demonstration projects have the following characteristics:
• Their purpose is to develop renewable technologies and reduce the risk associated with them.
• Their effectiveness depends on the characteristics of the national innovation system.
• If they are part of a set of policy instruments, they have a positive impact in mobilizing investment.
9. Guidelines for policy design
Although there is no single recipe and it is not possible to establish a priori the ideal set of instruments for fostering the development of the renewable energy sector in different countries, it is possible to identify some guidelines that may be useful when designing policies in the countries of the region:
• Ensuring that instruments are predictable and stable is crucial for reducing political risk. It is therefore necessary to implement long-term strategies with clear objectives and a level of flexibility that allows decision-makers to recalibrate the set of instruments or specific instruments to the dynamics of the sector and the country’s needs.
• Each instrument should be calibrated according to the country’s specific objectives and needs.
• Market stability is a necessary condition for the development of the sector. Instruments such as feed-in tariffs, auctions, domestic investment and fiscal incentives have proven effective in fostering this stability.
• Technologically neutral instruments allow the most competitive technologies to be attracted. However, if they are not well calibrated with other instruments, technological lock-in or dependence could ensue.
• To attract emerging technologies, it is necessary to tailor the different instruments to the specific characteristics of each.
• In the case of mature technologies, it could be useful to design technology-specific instruments to promote local incremental innovation and learning by doing.
• Instruments intended to foster local manufacturing capabilities need to be calibrated to the capacity of the local context at the different stages of the chains that are to be established in the country, to avoid objectives becoming mismatched and costs rising.
• In countries where production capabilities are limited and the sector is at an intermediate level of development, instruments can be put in place to develop operations in the country incrementally, from the production of secondary components to that of components for the development of technologies, taking into account the possible future dynamics of international manufacturing costs.
190 Economic Commission for Latin America and the Caribbean (ECLAC) Chapter III
• Designing instruments to encourage local service provision right along the value chain can nurture capabilities in engineering, construction, project development, operation and maintenance services. These services can lower the cost of projects domestically and can be exported to other countries.
For instruments to be most effective, they need to form part of production development policies and agendas that address other bottlenecks which may be limiting inward investment and, more generally, the development of the renewable energy sector. These agendas could include complementary activities such as training human talent with the profiles and skills needed in the sector, making the necessary policy and regulatory adjustments, building specific complementary infrastructure, incubating and accelerating start-ups in the sector, and other activities. A useful tool for working on these more comprehensive agendas can be cluster initiatives, which create the conditions for coordination between public, private, academic and other civil society actors to create strategic agendas for these sectors, as happened with the Bogotá Electrical Energy Cluster initiative (Llinás Vargas, 2021).
Although Latin America and the Caribbean has been a strategic destination for renewable energy investments, if it is to secure the resources it needs to carry forward the energy transition, it will have to implement medium- and long-term strategies that mobilize domestic and international investment in renewable energy development. While wind and solar energy have attracted the most investment and have the potential to drive the energy transition in the region, it is essential to have policies and toolkits that orient investment towards emerging technologies and facilitate diversification of the energy mix.
F. Conclusions
There is great potential in Latin America and the Caribbean to increase the development of renewable energies and related production activities and services. In recent years, the countries of the region have accelerated their energy transition efforts and designed ambitious strategies aimed at moving towards more sustainable development models. The region’s installed renewable energy capacity is greater than the world average, and the electricity generation mix is one of the world’s cleanest (ECLAC, 2023).
Most of the countries have set medium- and long-term goals for renewable energy penetration and implemented policy mechanisms designed to increase investment in the sector. The most commonly used instruments have included auctions, feed-in tariffs, fiscal incentives, minimum portfolio standards and energy certification. By developing the renewable energy market and regulation, the region has positioned itself in the world and become the third-largest regional recipient of renewable energy FDI. The main destination countries have been Chile, Brazil and Mexico, with solar and wind technology leading investment. FDI in the region has been driven mainly by the growing size of the market and the high return on investment, which has been confined almost exclusively to power generation via project development and to territories where generating potential is highest.
International experience shows that the energy sector can create production linkages in sectors related to the transition. For one thing, activities associated with the renewable energy value chain, from critical minerals and technology development to the provision of engineering, construction and maintenance services, represent an opportunity to strengthen production capabilities and develop new service sectors. For another, clean energy can increase the region’s energy efficiency and encourage more energy-intensive production activities, as in the case of green hydrogen. A growing supply of renewable energy will not only be essential to meet the region’s rising demand, but could also become a strategic asset to attract investment in other sectors, not just renewable energy.
191 Foreign Direct Investment in Latin America and the Caribbean • 2023 Chapter III
Here it should be borne in mind that the developed countries have embarked on ambitious strategies aimed at fostering the green transition, and that large investments are being channelled into the energy transition and capacity-building in energy-related industries. Driving the energy transition and the development of related industries in the region will require subnational, national and regional strategies that go beyond energy policy and encompass production development policies designed to strengthen capacities right along the chain.
ECLAC (2023) has identified the energy transition as one of the strategic areas of action to spur the region’s recovery and has proposed eight transformative policies that can accelerate it:
(i) Foment public and private investment to increase the share of renewable energies and expand the infrastructure for energy services and universal access to these.
(ii) Universalize electrification and facilitate the deployment of distributed generation technologies, particularly in rural, remote or isolated communities not served by interconnected systems.
(iii) Use a variety of instruments such as regulations, incentives, subsidies and public procurement to boost renewable energy demand.
(iv) Develop renewable energy value chains by harnessing the region’s critical raw materials to produce technologies, components, storage systems and other energy sources such as green hydrogen.
(v) Pursue production development policies with a view to introducing renewable technologies via investments in R&D and support for the manufacture of technologies, parts and components and for engineering, maintenance and operation services. Cluster initiatives could be a valuable tool to nurture production capabilities at specific stages of the chain.
(vi) Increase financing and design forms of blended finance that make investments less risky and channel them towards renewable technologies.
(vii) Encourage participatory governance and cooperation between the public and private sectors, and increase decentralization and informed participation. Cluster initiatives could also be a useful tool here.
(viii) Plan for the long term, foster regional energy integration and leverage the scale of the regional market to strengthen value chains.
FDI can play a vital role in accelerating the energy transition, facilitating technology transfer and enabling emerging technologies. However, investment policies need to be designed in the broader context of energy transition policies, taking into account the drivers of investment, market forces and international technology development to calibrate the toolbox and steer investments towards priority technologies, sectors or stages of the chain. These agendas need to be supported by institutional mechanisms that facilitate coordination between different parts of the public sector, between the public and private sectors, and between the different levels. Cluster initiatives are one of the mechanisms that could be used to promote this coordination.
In this context, it is essential to calibrate policy tools to the goals of national strategies, the characteristics of the energy market and existing capabilities in each country. The challenge for the countries of Latin America and the Caribbean is to implement investment strategies that enable them to attract frontier technologies, build capabilities and take advantage of production development opportunities. Strengthening local capabilities in developing countries is critical to meeting climate commitments. While there is no one right instrument or combination of instruments for promoting renewable energy investments, promising methods include the use of incentives and subsidies for the development of emerging technologies, local workforce or content requirements, the establishment of special economic zones for the development of sophisticated technologies, and investment facilitation and promotion mechanisms (see diagram III.4).
192 Economic Commission for Latin America and the Caribbean (ECLAC) Chapter III
Diagram III.4
Strategies to promote the energy transition and related capacity-building
• Sectoral and technological incentives
• Subsidies for technology development
• Subsidies for component development
• Technology parks and centres
• Production clusters
Promotion of foreign direct investment
• Incentives (auctions, feed-in tariffs, premiums, fiscal incentives)
Energy policy
National goals
Role of renewables
Technologies
Grid management
Distribution
Transmission
Production development policy
• Supplier development
• Development of modern and energy sector-related services
• Value chains
• Export incentives
• Research, development and demonstration
• Skills development
• Promotion of foreign direct investment
Source: Economic Commission for Latin America and the Caribbean (ECLAC).
• Local workforce
• Local service providers
• Portfolio standards
• Special economic zones for manufacturing
• Investment facilitation mechanisms and investment promotion agencies
Lastly, it should be noted that a successful energy transition could become a comparative advantage in efforts to attract investment in other sectors, such as energy-intensive industries, and to attract activities that complement renewable energies, such as those related to green hydrogen and the development of carbon-neutral technologies. In a very dynamic international market, the countries of the region have a great opportunity to make progress with this important challenge.
Bibliography
Argus (2022), “Korea’s Posco plans $28bn Australia green H2 investment”, 2 December [online] https://www. argusmedia.com/en/news/2396832-koreas-posco-plans-28bn-australia-green-h2-investment.
Azhgaliyeva, D., J. Beirne and R. Mishra (2023), “What matters for private investment in renewable energy?”, Climate Policy, vol. 23, No. 1.
Badger, J. and others (2023), “Global Wind Atlas” [online] https://globalwindatlas.info.
Baker, L. and B. K. Sovacool (2017), “The political economy of technological capabilities and global production networks in South Africa’s wind and solar photovoltaic (PV) industries”, Political Geography, vol. 60, September.
Baldwin, E. and others (2017), “Global renewable electricity policy: a comparative policy analysis of countries by income status”, Journal of Comparative Policy Analysis: Research and Practice, vol. 19, No. 3, May.
Bangjun, W. and others (2022), “Decision making on investments in photovoltaic power generation projects based on renewable portfolio standard: perspective of real option”, Renewable Energy, vol. 189, April.
Batini, N. and others (2021), “Building back better: how big are green spending multipliers?”, IMF Working Papers, No. WP/21/87, Washington, D.C., International Monetary Fund (IMF).
Bergek, A. and S. Jacobsson (2003), “The emergence of a growth industry: a comparative analysis of the German, Dutch and Swedish wind turbine industries”, Change, Transformation and Development, J. S. Metcalfe and U. Cantner (eds.), Springer.
Binz, C. and others (2017), “Toward technology-sensitive catching-up policies: insights from renewable energy in China”, World Development, vol. 96, August.
BloombergNEF (2023), Energy Transition Investment Trends 2023: Tracking Global Investment in the Low-Carbon Energy Transition, January [online] https://assets.bbhub.io/professional/sites/24/energy-transitioninvestment-trends-2023.pdf.
(2022), “Cost of new renewables temporarily rises as inflation starts to bite”, 30 June [online] https://about. bnef.com/blog/cost-of-new-renewables-temporarily-rises-as-inflation-starts-to-bite/.
193 Foreign Direct Investment in Latin America and the Caribbean • 2023 Chapter III
(2020), Hydrogen Economy Outlook: Key Messages [online] https://about.bnef.com/blog/hydrogen-economyoffers-promising-path-to-decarbonization/.
Busscher, F. and others (2022), “Ready, set, grow: winning the M&A race for renewables developers”, McKinsey, 9 December [online] https://www.mckinsey.com/industries/electric-power-and-natural-gas/our-insights/ ready-set-grow-winning-the-m-and-a-race-for-renewables-developers.
Chowdhury, S. and others (2014), “Importance of policy for energy system transformation: diffusion of PV technology in Japan and Germany”, Energy Policy, vol. 68, May.
Climate Watch (2023), “Historical (GHG) emissions” [online] https://www.climatewatchdata.org/ghg-emissions.
Correia, T. de B., M. Tolmasquim and M. Hallack (2020), Guide for Designing Contracts for Renewable Energy Procured by Auctions, Washington, D.C., Inter-American Development Bank (IDB).
Costa, E. and others (2022), “Influence of public policies on the diffusion of wind and solar PV sources in Brazil and the possible effects of COVID-19”, Renewable and Sustainable Energy Reviews, vol. 162, July.
Criscuolo, C. and C. Menon (2015), “Environmental policies and risk finance in the green sector: cross-country evidence”, Energy Policy, vol. 83, August.
Del Río, P. and P. Linares (2014), “Back to the future? Rethinking auctions for renewable electricity support”, Renewable and Sustainable Energy Reviews, vol. 35, July.
Dijkgraaf, E., T. P. van Dorp and E. Maasland (2018), “On the effectiveness of feed-in tariffs in the development of solar photovoltaics”, The Energy Journal, vol. 39, No. 1, January.
Dutra, R. M. and A. S. Szklo (2008), “Incentive policies for promoting wind power production in Brazil: scenarios for the Alternative Energy Sources Incentive Program (PROINFA) under the new Brazilian electric power sector regulation”, Renewable Energy, vol. 33, No. 1, January.
Ebenhoch, R. and others (2015), “Comparative levelized cost of energy analysis”, Energy Procedia, vol. 80, January.
ECLAC (Economic Commission for Latin America and the Caribbean) (2023), Halfway to 2030 in Latin America and the Caribbean: progress and recommendations for acceleration (LC/FDS.6/3), Santiago. (2020), Building a New Future: Transformative Recovery with Equality and Sustainability (LC/SES.38/3-P/Rev.1), Santiago.
Egli, F., B. Steffen and T. S. Schmidt (2018), “A dynamic analysis of financing conditions for renewable energy technologies”, Nature Energy, vol. 3, No. 12, November.
Eguino, H., M. Bonilla-Roth and A. Lopes (2020), “The strategic role of Ministries of Finance to boost sustainable infrastructure investments”, Inter-American Development Bank (IDB), 8 July [online] https://blogs.iadb.org/ gestion-fiscal/en/public-investment-in-sustainable-infrastructure/.
ESMAP (Energy Sector Management Assistance Program) (2019), Going Global: Expanding Offshore Wind to Emerging Markets, Washington, D.C., World Bank.
Friebe, C. A., P. von Flotow and F. A. Täube (2014), “Exploring technology diffusion in emerging markets – the role of public policy for wind energy”, Energy Policy, vol. 70, July.
Galperina, L. and Y. Klen (2017), “Global trends of international mergers and acquisitions in the energy sector”, International Economic Policy, vol. 26, No. 1.
Geddes, A., T. S. Schmidt and B. Steffen (2018), “The multiple roles of state investment banks in low-carbon energy finance: an analysis of Australia, the UK and Germany”, Energy Policy, vol. 115, April.
Georgallis, P., G. Dowell and R. Durand (2019), “Shine on me: industry coherence and policy support for emerging industries”, Administrative Science Quarterly, vol. 64, No. 3, September.
Grau, T., M. Huo and K. Neuhoff (2012), “Survey of photovoltaic industry and policy in Germany and China”, Energy Policy, vol. 51, December.
GWEC (Global Wind Energy Council) (2022), Global Wind Report 2022, Brussels.
Haelg, L., M. Waelchli and T. Schmidt (2018), “Supporting energy technology deployment while avoiding unintended technological lock-in: a policy design perspective”, Environmental Research Letters, vol. 13, No. 10, October.
Hansen, U. E. and others (2020), “The effects of local content requirements in auction schemes for renewable energy in developing countries: a literature review”, Renewable and Sustainable Energy Reviews, vol. 127, July.
Hausmann, R. (2021), “Green growth at the end of the flat world”, Project Syndicate, 9 December [online] https://www.project-syndicate.org/commentary/green-growth-and-end-of-flat-energy-world-by-ricardohausmann-2021-12.
Huenteler, J., C. Niebuhr and T. S. Schmidt (2016), “The effect of local and global learning on the cost of renewable energy in developing countries”, Journal of Cleaner Production, vol. 128, August.
IBAMA (Brazilian Institute for the Environment and Renewable Natural Resources) (2022), “Mapas de projetos em licenciamento - Complexos Eólicos Offshore” [online] https://www.gov.br/ibama/pt-br/assuntos/laf/ consultas/mapas-de-projetos-em-licenciamento-complexos-eolicos-offshore.
194 Economic Commission for Latin America and the Caribbean (ECLAC) Chapter III
IDB/DDPLAC (Inter-American Development Bank/Deep Decarbonization Pathways for Latin America and the Caribbean) (2019), Getting to Net-Zero Emissions: Lessons from Latin America and the Caribbean, Washington, D.C., Inter-American Development Bank (IDB).
IEA (International Energy Agency) (2023a), Energy Technology Perspectives 2023, Paris.
(2023b), “Data and statistics”, Policies Database [online] https://www.iea.org/data-and-statistics.
(2022a), Hydrogen, Paris.
(2022b), Special Report on Solar PV Global Supply Chains, Paris.
(2022c), Wind Electricity, Paris.
(2022d), World Energy Outlook 2022, Paris.
(2021a), Climate Impacts on Latin American Hydropower, Paris.
(2021b), Net Zero by 2050: A Roadmap for the Global Energy Sector, Paris.
IEA/CCFI (International Energy Agency/Centre for Climate Finance & Investment) (2021), Clean Energy Investing: Global Comparison of Investment Returns, Paris.
IEA and others (International Energy Agency and others) (2022), Tracking SDG 7: The Energy Progress Report, 2022, Washington, D.C., World Bank.
IRENA (International Renewable Energy Agency) (2023), Renewable Capacity Statistics 2023, Abu Dhabi.
(2022a), World Energy Transitions Outlook 2022: 1.5°C Pathway, Abu Dhabi.
(2022b), NDCs and Renewable Energy Targets in 2021: Are we on the right path to a climate-safe future?, Abu Dhabi.
(2022c), Renewable Power Generation Costs in 2021, Abu Dhabi.
(2021), World Energy Transitions Outlook: 1.5°C Pathway, Abu Dhabi.
(2020), The Post-COVID Recovery: An Agenda for Resilience, Development and Equality, Abu Dhabi.
(2019), Future of Solar Photovoltaic: Deployment, investment, technology, grid integration and socio-economic aspects (A Global Energy Transformation: paper), Abu Dhabi.
IRENA/CPI (International Renewable Energy Agency/Climate Policy Initiative) (2023), Global Landscape of Renewable Energy Finance, 2023, Abu Dhabi.
Jacobs, D. and others (2013), “Analysis of renewable energy incentives in the Latin America and Caribbean region: the feed-in tariff case”, Energy Policy, vol. 60, September.
Kamp, L. M. (2002), “Learning in wind turbine development: a comparison between the Netherlands and Denmark”, doctorate thesis, Utrecht University.
Kempa, K., U. Moslener and O. Schenker (2021), “The cost of debt of renewable and non-renewable energy firms”, Nature Energy, vol. 6, No. 2.
Kissel, J. M. and S. C. W. Krauter (2006), “Adaptations of renewable energy policies to unstable macroeconomic situations – Case study: wind power in Brazil”, Energy Policy, vol. 34, No. 18, December.
Knutsson, P. and P. Ibarlucea Flores (2022), “Trends, investor types and drivers of renewable energy FDI”, OECD Working Papers on International Investment, No. 2022/02, Paris, OECD Publishing.
Lacal-Arántegui, R. (2019), “Globalization in the wind energy industry: contribution and economic impact of European companies”, Renewable Energy, vol. 134, April.
Lauber, V. (2004), “REFIT and RPS: options for a harmonised Community framework”, Energy Policy, vol. 32, No. 12, August.
Lazard (2021), Levelized Cost of Energy Analysis: Version 15.0 [online] https://www.lazard.com/research-insights/ levelized-cost-of-energy-levelized-cost-of-storage-and-levelized-cost-of-hydrogen-2021/.
Lee, C. W. and Z. Jin (2015), “Risk management methods applied to renewable and sustainable energy: a review”, Journal of Electrical and Electronic Engineering, vol. 3, No. 1-1, January.
Lewis, J. I. and R. H. Wiser (2007), “Fostering a renewable energy technology industry: an international comparison of wind industry policy support mechanisms”, Energy Policy, vol. 35, No. 3, March.
Li, S.-J., T.-H. Chang and S.-L. Chang (2017), “The policy effectiveness of economic instruments for the photovoltaic and wind power development in the European Union”, Renewable Energy, vol. 101, February.
Lipp, J. (2007), “Lessons for effective renewable electricity policy from Denmark, Germany and the United Kingdom”, Energy Policy, vol. 35, No. 11, November.
Liu, Y. and A. Kokko (2010), “Wind power in China: policy and development challenges”, Energy Policy, vol. 38, No. 10, October.
Llinás Vargas, M. A. (2021), Iniciativas cluster: una forma concreta y efectiva de “mover la aguja”, de la productividad, Bogotá, Puntoaparte Editores.
Mamkhezri, J., L. A. Malczynski and J. M. Chermak (2021), “Assessing the economic and environmental impacts of alternative renewable portfolio standards: winners and losers”, Energies, vol. 14, No. 11, June.
195 Foreign Direct Investment in Latin America and the Caribbean • 2023 Chapter III
MarketsandMarkets (2023), “Green Hydrogen Market Size”, 26 April [online] https://www.marketsandmarkets. com/Market-Reports/green-hydrogen-market-92444177.html.
Matsuo, T. and T. S. Schmidt (2019), “Managing tradeoffs in green industrial policies: the role of renewable energy policy design”, World Development, vol. 122, October.
Meckling, J. and L. Hughes (2017), “Globalizing solar: global supply chains and trade preferences”, International Studies Quarterly, vol. 61, No. 2, June.
Mora, D. and others (2017), “Experiences with auctions for renewable energy support”, 2017 14th International Conference on the European Energy Market (EEM), Institute of Electrical and Electronics Engineers, Inc. (IEEE). OECD and others (Organisation for Economic Co-operation and Development and others) (2022), Latin American Economic Outlook 2022: Towards a Green and Just Transition, Paris, OECD Publishing.
OLADE (Latin American Energy Organization) (2022), Panorama energético de América Latina y el Caribe 2022, Quito. (2017), Recomendaciones de política para el sector energético de América Latina y el Caribe en apoyo a la implementación de las NDC, Quito.
Pfeiffer, B. and P. Mulder (2013), “Explaining the diffusion of renewable energy technology in developing countries”, Energy Economics, vol. 40, November.
Plank, J. and C. Doblinger (2018), “The firm-level innovation impact of public R&D funding: evidence from the German renewable energy sector”, Energy Policy, vol. 113, February.
Podestá, A. and others (2022), “Políticas de atracción de inversiones para el financiamiento de la energía limpia en América Latina”, Project Documents (LC/TS.2022/116), Santiago, Economic Commission for Latin America and the Caribbean (ECLAC).
Polzin, F. and others (2019), “How do policies mobilize private finance for renewable energy? A systematic review with an investor perspective”, Applied Energy, vol. 236, February. (2015), “Public policy influence on renewable energy investments – A panel data study across OECD countries”, Energy Policy, vol. 80, May.
PVPS (Photovoltaic Power Systems Programme) (2022), Trends in Photovoltaic Applications 2022, Paris. RELAC (REnewables in LAtin America and the Caribbean) (2023), “What is RELAC?”“ [online] https://hubenergia. org/en/relac.
Rennkamp, B. and A. Boyd (2015), “Technological capability and transfer for achieving South Africa’s development goals”, Climate Policy, vol. 15, No. 1, January.
Rothballer, C. and C. Kaserer (2012), “The risk profile of infrastructure investments: challenging conventional wisdom”, The Journal of Structured Finance, vol. 18, No. 2, June.
Ruiz Campillo, X. (2017), Latinoamérica y España: caminos opuestos en el fomento de las energías renovables, Universidad Internacional de Valencia.
Schmidt, T. S. (2014), “Low-carbon investment risks and de-risking”, Nature Climate Change, vol. 4, No. 4, March.
Schmidt, T. S. and S. Sewerin (2019), “Measuring the temporal dynamics of policy mixes – An empirical analysis of renewable energy policy mixes’ balance and design features in nine countries”, Research Policy, vol. 48, No. 10, December.
Shell (2022), “Shell to start building Europe’s largest renewable hydrogen plant”, 6 July [online] https://www. shell.com/media/news-and-media-releases/2022/shell-to-start-building-europes-largest-renewablehydrogen-plant.html.
Shimamoto, M. (2020), National Project Management: The Sunshine Project and the Rise of the Japanese Solar Industry, Advances in Japanese Business and Economics, No. 25, Springer.
Shrimali, G. and J. Kniefel (2011), “Are government policies effective in promoting deployment of renewable electricity resources?”, Energy Policy, vol. 39, No. 9, September.
Steffen, B. and T. S. Schmidt (2019), “A quantitative analysis of 10 multilateral development banks’ investment in conventional and renewable power-generation technologies from 2006 to 2015”, Nature Energy, vol. 4, No. 1, January.
Ubierna, M., J. Alberti and A. D. Alarcón (2020), “Modernización de centrales hidroeléctricas en América Latina y el Caribe: identificación y priorización de necesidades de inversión”, Nota Técnica, No. IDB-TN-02051, Washington, D.C., Inter-American Development Bank (IDB).
UNEP (United Nations Environment Programme) (2020a), Emissions Gap Report 2020, Nairobi. (2020b), Zero Carbon: The Opportunity, Cost and Benefits of the Coupled Decarbonization of the Power and Transport Sectors in Latin America and the Caribbean, Panama City.
United Nations (2021), Theme Report on Energy Transition: Towards the Achievement of SDG 7 and Net-zero Emissions, New York.
Viscidi, L. and A. Yépez (2019), Clean energy auctions in Latin America, Washington, D.C., Inter-American Development Bank (IDB).
196 Economic Commission for Latin America and the Caribbean (ECLAC) Chapter III
Waidelich, P. and B. Steffen (2023), “The role of state investment banks for renewable energy technologies in OECD countries”, Working Paper Series, No. 2023-07, Center for Energy and Environmental Policy Research (CEEPR).
Washburn, C. and M. Pablo-Romero (2019), “Measures to promote renewable energies for electricity generation in Latin American countries”, Energy Policy, vol. 128, May.
World Bank (2022), “Climate Change Knowledge Portal” [online] https://climateknowledgeportal.worldbank.org/. (2017), Energy Markets in Latin America: Emerging Disruptions and the Next Frontier, Washington, D.C.
World Bank/Solargis (2023), “Global Solar Atlas” [online] https://globalsolaratlas.info/map.
WTO (World Trade Organization) (2018), “DS456: India – Certain measures relating to solar cells and solar modules” [online] https://www.wto.org/english/tratop_e/dispu_e/cases_e/ds456_e.htm. (2014), “DS412: Canada–Certain Measures Affecting the Renewable Energy Generation Sector” [online] https://www.wto.org/english/tratop_e/dispu_e/cases_e/ds412_e.htm.
Wüstenhagen, R. and E. Menichetti (2012), “Strategic choices for renewable energy investment: conceptual framework and opportunities for further research”, Energy Policy, vol. 40, January.
197 Foreign Direct Investment in Latin America and the Caribbean • 2023 Chapter III
Publicaciones recientes de la CEPAL
www.cepal.org/publicaciones
Informes Anuales/Annual Reports
También disponibles para años anteriores/Issues for previous years also available
Estudio Económico de América Latina y el Caribe 2022
EconomicSurveyofLatinAmerica and the Caribbean 2022
La Inversión Extranjera Directa en América Latina y el Caribe 2022
Foreign Direct Investment in Latin America and the Caribbean 2022
Balance Preliminar de las Economías de América Latina y el Caribe 2022
PreliminaryOverviewoftheEconomiesofLatinAmerica and the Caribbean 2022
Anuario Estadístico de América Latina y el Caribe 2021
Statistical Yearbook for Latin America and the Caribbean 2021

Panorama Social de América Latina y el Caribe 2022
Social Panorama of Latin America and the Caribbean 2022
Perspectivas del Comercio Internacional de América Latina y el Caribe 2022

International Trade Outlook for Latin America and the Caribbean 2022
ECLAC
publications
recent
El Pensamiento de la CEPAL/ECLAC Thinking
Hacia la transformación del modelo de desarrollo en América Latina y el Caribe: producción, inclusión y sostenibilidad
TowardstransformationofthedevelopmentmodelinLatinAmerica andtheCaribbean:Production,inclusionandsustainability
Construir un nuevo futuro: una recuperación transformadora con igualdad y sostenibilidad
BuildingaNewFuture:TransformativeRecoverywithEqualityandSustainability
La ineficiencia de la desigualdad
TheInefficiencyofInequality
Libros y Documentos Institucionales/Institutional Books and Documents
La sociedad del cuidado: horizonte para una recuperación sostenible con igualdad de género
Thecaresociety:Ahorizonforsustainablerecoverywithgenderequality
Una década de acción para un cambio de época. Quinto informe sobre el progreso y los desafíos regionales de la Agenda 2030 para el Desarrollo Sostenible en América Latina y el Caribe
Adecadeofactionforachangeofera.Fifthreportonregionalprogressandchallenges inrelationtothe2030AgendaforSustainableDevelopmentinLatinAmerica and the Caribbean
Innovación para el desarrollo: la clave para una recuperación transformadora en América Latina y el Caribe
Innovationfordevelopment:ThekeytoatransformativerecoveryinLatinAmerica and the Caribbean
Libros de la CEPAL/ECLAC Books
La tragedia ambiental de América Latina y el Caribe
La emergencia del cambio climático en América Latina y el Caribe: ¿seguimos esperando la catástrofe o pasamos a la acción?
TheclimateemergencyinLatinAmericaandtheCaribbean: Thepathahead–resignationoraction?
Los sistemas de pensiones en la encrucijada: desafíos para la sostenibilidad en América Latina
Páginas Selectas de la CEPAL/ECLAC Select Pages
Reflexiones sobre la gestión del agua en América Latina y el Caribe. Textos seleccionados 2002-2020
Las dimensiones del envejecimiento y los derechos de las personas mayores en América Latina y el Caribe. Textos seleccionados 2009-2020
Protección social universal en América Latina y el Caribe. Textos seleccionados 2006-2019
Revista CEPAL/CEPAL Review
Series de la CEPAL/ECLAC Series

Notas de Población
Observatorio Demográfico Demographic Observatory
Documentos de Proyectos Project Documents
Informes Especiales COVID-19
Special Reports COVID-19
Coediciones/Co-editions
Copublicaciones/Co-publications
www.cepal.org/es/suscripciones www.cepal.org/en/subscriptions Publicaciones de la CEPAL Informes Anuales OBSERVATORIO DEMOGRÁFICO Libros de la CEPAL Revista CEPAL Libros institucionales Páginas Selectas Libros de la CEPAL Manuales de la CEPAL Notas de Población Cuadernos Estadísticos Subscribe to receive up-to-the-minute information on ECLAC publications Suscríbase y reciba información oportuna sobre las publicaciones de la CEPAL www.cepal.org/publicaciones Las publicaciones de la CEPAL también se pueden adquirir a través de: ECLAC publications also available at: shop.un.org Tel. (1-888)254-4286 Fax (1-800)338-4550 Contacto/ Contact: publications@un.org Pedidos/Orders: order@un.org United Nations Publications PO Box 960 Herndon, VA 20172 USA ww w.facebook.com/publicacionesdelacepal ww w.instagram.com/publicacionesdelacepal
www.eclac.org
Against the backdrop of the reconfiguration of globalization and mixed trends in global foreign direct investment (FDI) inflows, with declines for the world’s major recipients, FDI inflows in Latin America and the Caribbean grew for the second year in a row in 2022, by 55.2% to US$ 224.579 billion, the highest level on record.
The first chapter of this report provides an overview of global and regional FDI trends and makes recommendations to ensure that these investments advance productive development processes in the countries of the region. The second chapter analyses investments in the energy sector, which have profoundly shaped recent global and regional FDI trends, along with the role of this type of investment in non-renewable energies and the challenges posed for the energy transition. The third chapter examines FDI in renewable energies and suggests strategies to drive the energy transition in the region.
Glyphs from the Mayan numbering system found in pre-Hispanic codices. Bas-relief on the spiral tower of the ECLAC headquarters building in Santiago.
9 789211 221220 ISBN 978-92-1-122122-0
