
JIAHUA WU

BUILDING PERFORMANCE MODELING ITERATIVE AND COMPUTATIONAL ASSESSMENT OF TCS HALL
Jiahua Wu, Yihan Ma, Chuyi Wang Link to Full Report Spring 2023
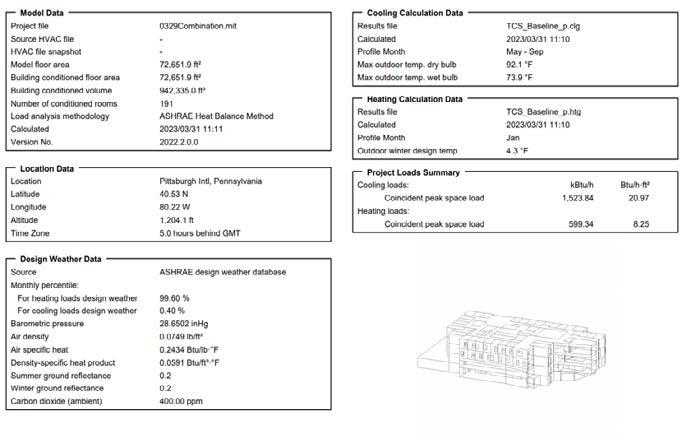
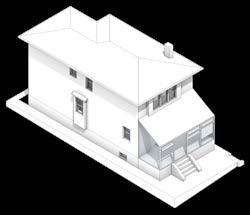
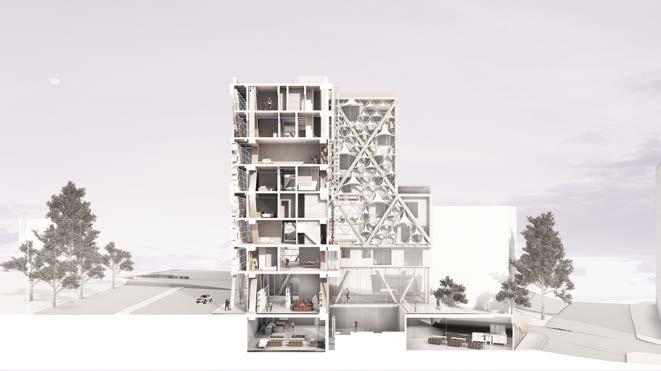
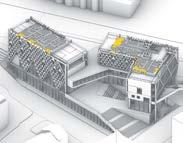
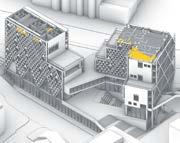
TCS Hall was originally built in 1916 and renovated in 2008. It is located in Pittsburgh, Pennsylvania, ASHRAE climate zone of 5A. The building has a total of 5 floors and a basement (parking lot), with a gross area of 72,652 ft2. It achieved LEED Gold certification for its energy-efficient design, which includes a green roof, energy-efficient HVAC systems, and water-saving fixtures.
The project did a interative assessment for the building based on the ASHRAE 90.1 standard. Due to the lack of building information, the fifth floor and basement are not modeled in this project. By proposing higher performance building envelope, lighting system and HVAC system, the energy consumption of TCS Hall reduced by 11.2%.
Building Information
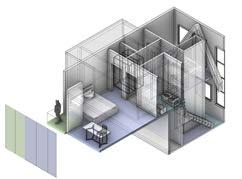
TCS Hall at Carnegie Mellon University was originally built in 1916 and was used as an office building until it underwent a complete renovation in 2018. It is now home to the School of Computer Science, the Human-Computer Interaction Institute, and the Language Technologies Institute. The primary building programs are centered around a central atrium that is flooded with natural light. The north side of the building houses classrooms and lecture halls, while the east side is dedicated to faculty offices and research labs. The south side of the building contains collaborative spaces, including a large conference room and an open work area. One of the standout features of TCS Hall is the design of the central atrium. A glass roof and skylight flood the space with natural light, and a large circular staircase connects the two floors. The staircase
is designed to encourage collaboration and interaction, with seating areas on each level and an open view of the entire space.
TCS Hall is designed with sustainability in mind, achieving LEED Gold certification for its energy-efficient design, which includes a green roof, energy-efficient HVAC systems, and water-saving fixtures.
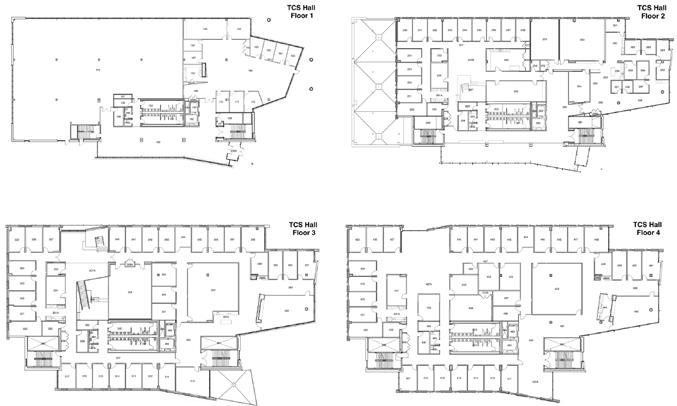
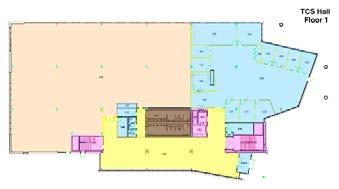
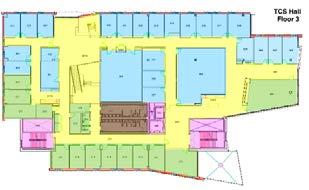
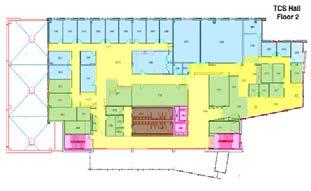
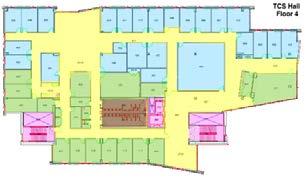
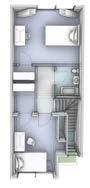
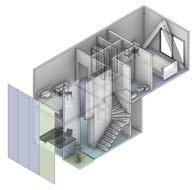
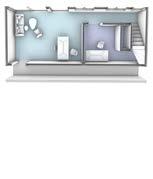
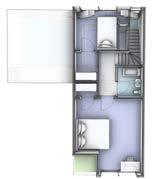
The building’s total area is 72651.90 ft2 and its volume is 942335.13 ft3. Below is the plan drawings of the TCS hall. since we do not have access to the fifth floor’s and the parking lot’s floor plan, we only modeled level 1-4 of the building.


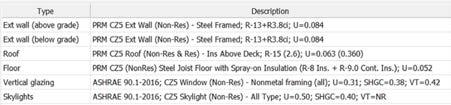
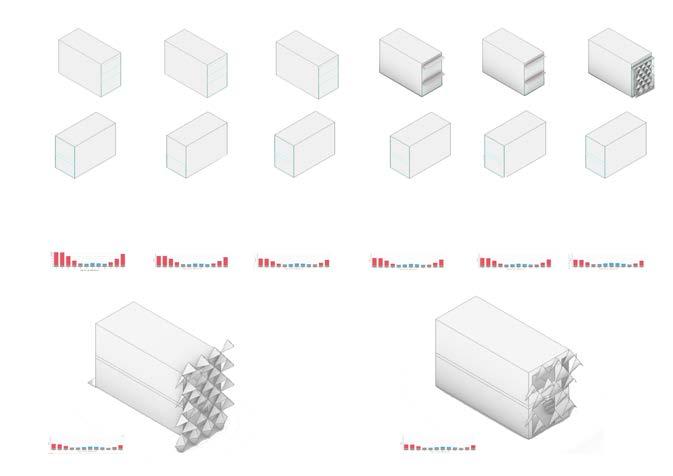
Since the detailed technical drawings of TCS hall is unavailable, the regulations outlined in the ASHRAE 90.1 2016 User Manual for the 5A climate zone are used to establish
the baseline construction materials. The chart below is the specific materials used for the baseline model.

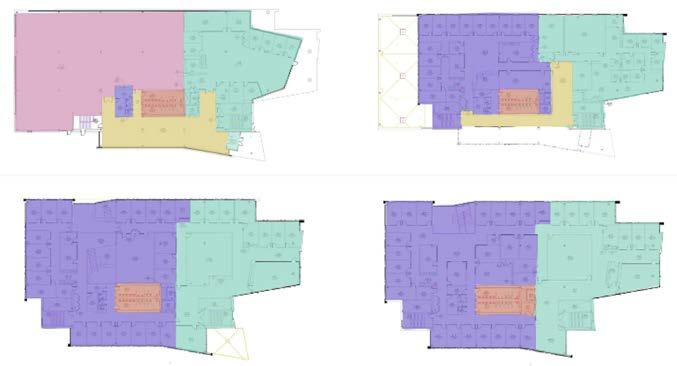
Dividing a building into HVAC thermal zones is a crucial step in designing an effective and efficient heating, ventilation, and air conditioning (HVAC) system. In the case of TCS Hall, thermal zone division is based on several considerations to ensure optimal performance.
Firs, thermal comfort requirements is the primary factor of heating and cooling load.
Second, the occupancy and usage patterns of the spaces or rooms. Those with similar usage patterns are divided into the same thermal zone. Offices that have different enclosure features are sepearted into two differenct thermal zones, i.e., enclosed and open space, Other functional areas such as restrooms, stairwells are divided into other zones respectively.
The main use space require a higher level of thermal comfort for occupants, and the HVAC system should be able to adjust according to occupancy demand, while the functional areas
To build the thermal templates, ASHRAE 90.1-2016-based IES-VE templates is used as a starting point for the baseline
have lower requirements and do not need to be personalized to meet occupancy demands.
Third, building's orientation also matters. TCS hall is oriented east-west. West is the most difficult orientation to block sunlight while the building has large areas of glazing on the west facade. Therefore, the energy loads in the eastern space and the western space can be very different.
Fourth, the building envelope is also taken into consideration. Areas with different envelope characteristics were separated into different thermal zones.
Finally, HVAC system is evaluated to determine the best way to divide the building into thermal zones, taking into account the location of air supply and return ducts and the system's capacity.
Below is the detailed thermal zoning labeled in colors.
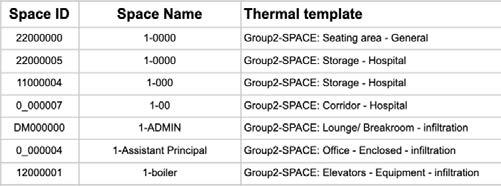
A list of our assigned thermal zoning and thermal templates of the spaces in the baseline model is shown below.
Baseline Energy Performance
Design Alterations
The goal of this part of study is to investigate how alterations to different aspects of the building could affect the energy simulation outcomes. To test a range of design alternatives and create an improved building in terms of energy usage, we performed three parametric simulations for each category using a step-by-step approach. The aim was to identify the best design alternative that would optimize the building’s energy efficiency.
The effect of building loads can be influenced by several
parameters, including the building’s orientation, envelope design, glazing systems, shading devices, occupancy patterns, and building systems such as HVAC and lighting. For example, a building with a high window-to-wall ratio (WWR) may have higher cooling loads due to increased solar gain through the windows, while a building with a low WWR may have higher lighting loads due to less natural daylighting. Building loads can also be affected by the climate and location of the building, as well as the type and efficiency of the building systems used.
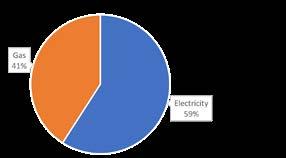
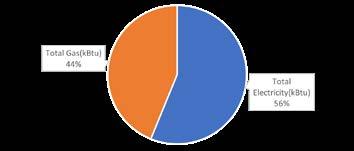
In the baseline model, the building's annual energy consumption was 5246349.80 kBtu/yr, with an energy use intensity (EUI) of 72.21 kBtu/ft²/year. The energy use was divided into gas energy, which amounted to 2032200.50 kBtu, and electricity, which amounted to 3214149.30 kBtu. The higher consumption of gas energy can be attributed to Pittsburgh's climate, which is primarily heating-dominated. The building relied heavily on natural gas as a fuel source for heating, resulting in a greater demand for gas energy compared to electricity.
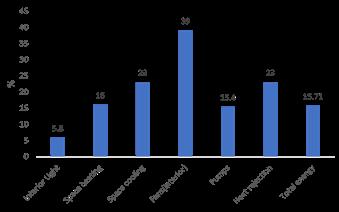
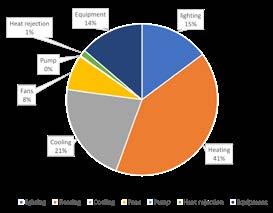
The following is the load results and energy usage percentage breakdown:

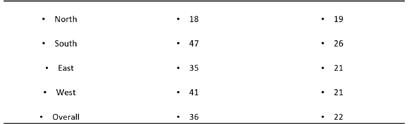
The WWR, or window-to-wall ratio, has a significant impact on building loads and energy use. In the case of TCS Hall, the WWR is relatively high, and combined with the climate conditions of the building location, we determined that the WWR should be appropriately reduced. Our recommendation is to keep more windows on the southern side, where they can receive direct sunlight in the winter and reduce heating loads. WWR on other orientations should be reduced accordingly. After reducing the WWR to an overall ratio of 22% (North 19%, South 26%, East 21%, West 21%), we were able to achieve a 6.91% reduction in overall energy use.
To improve the performance of the ground slab, we made several modifications, including changing the insulation materials and increasing the slab's thickness. We consulted various reference materials and based on our analysis, we determined that the recommended construction has a lower U-value compared to the baseline construction. Table 3.2 U-Value
However, during the simulation, we discovered that the performance of the slab was not optimal, and it actually increased energy consumption by 12.78%. This is similar to the results we obtained in Lab1, which was conducted in Miami. The issue may be related to the balance of heat transfer between the ground and indoor space during both winter and summer months. It's possible that there is an optimal range of U-value for the slab that is specific to certain regions, but unfortunately, we were unable to identify it. As a result, for the subsequent simulations, we opted to use the ASHRAE ground floor parameters, as follows:
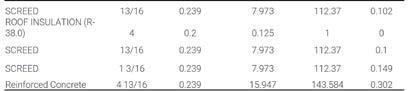
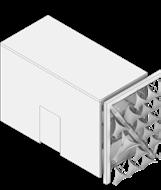
The performance of exterior walls affects the insulation effect of buildings. From the exploration of Lab1, we learned that the U value of walls is determined by their material and thickness. After consulting some reference materials and construction atlases, we found that modifying the insulation layer is the main strategy to improve the energy performance of exterior walls in the location of this building because it is the biggest factor determining the R-value of the exterior wall. After changing it, the total energy use reduced 3.18%.
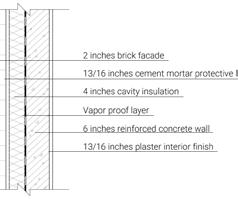
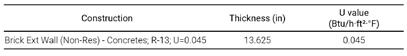
In the material selection, we compared the R values of different insulation materials and, combined with data and common constructions, we chose Cavity Insulation. By filling the cavity between the inner and outer walls with insulation material, heat
transfer through the wall can be significantly reduced, which helps to keep the building warmer in winter and cooler in summer. The detailed information of wall construction is shown in the table below:
The U-value of a roof can be improved by using insulation materials with a low thermal conductivity. Increasing the thickness of the insulation layer can also reduce the U-value. After changing it, the total energy use reduced 1.13%.
Glazing is an important element that affects the building loads, particularly the heat gain and loss through the building envelope. Windows or glazing assemblies have different U-values and solar heat gain coefficients (SHGC) which influence the amount of heat that passes through them. A higher U-value means more heat transfer, and a higher SHGC means more solar heat gain. Using new glazing helps us to reduce 4.64% the total energy.
By choosing the appropriate glazing assembly, it is possible to reduce the building's heating and cooling loads. Double or triple-glazed windows with inert gas-filled cavities can significantly reduce heat transfer through the window. These strategies can lead to a reduction in the building's energy consumption and lower HVAC system loads.
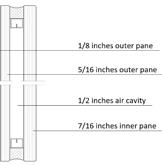
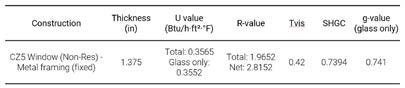
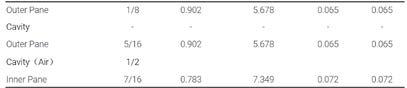
In Assignment 2, we gained a deeper understanding of the construction of glazing. Single-pane glass has poor thermal performance, which can result in high building loads. Therefore, we considered using triple-pane insulating glass, which has an air gap between the outer and middle glass layers to improve its thermal properties. Below are the parameters of the construction we selected. When choosing the glass, we also
considered parameters such as Tvis and SHGC. In the region where the building is located, we wanted it to receive more solar heat gain during winter and more daylight to ensure a comfortable indoor lighting environment and reduce lighting energy consumption. Therefore, we aimed for a higher SHGC and Tvis.
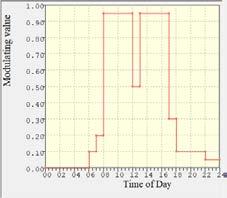
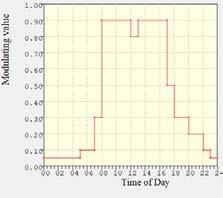
The original schedule for the occupancy is stayed unchanged. This decision was made based on the fact that the building was a combination of a laboratory and an office building, and the
actual operating hours of the building closely aligned with the existing schedule we set.
Besides, the interior equipment of the baseline model isn't changed either. When creating the baseline model, we had to consider various factors, and one of the most important was the internal heat gains from people, lighting, and computers or
equipment. We included internal heat gains from people and lighting in all spaces, but only considered internal heat gains from computers in work areas and electrical/mechanical rooms.
For the interior lighting control, with the default setting, the energy consumption of the proposed model is 63.2% greater than the baseline model. By only applying the scheduled shutoff strategy and automatic partial off, the proposed model is still 14.6% greater than the baseline model.
From the a field study conducted by Anca D, Galasiu in 2007 about lighting control methods. By integrating occupancy sensors, light sensors for daylight harvesting, and individual dimming controls for each workstation, the overall lighting energy reduced 42 to 47 percent compared to a conventional
lighting system. Deep-plan office buildings with central cubicle workstations and suspended direct-indirect luminaires can benefit from the use of occupancy sensors, light sensors, and individual dimming controls. Perimeter workstations may benefit more from light sensors due to the availability of natural daylight. The use of these controls may result in energy savings, peak power reductions, and higher occupant satisfaction.
After applying this strategy, automatic partial off and scheduled shutoff, interior lighting energy use improved by 16.3%, which can save 1.7% energy usage comparing to the baseline model.
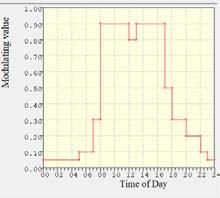
We maintained the original schedule for the operation and did not make any changes to the daily schedule. This decision was made based on the fact that the building was a combination of a laboratory and an office building, and the actual operating hours of the building closely aligned with the existing schedule we set.
climate zone with very cold winters, reducing heating loads can significantly improve the building's energy performance. Lighting is also an important target in our simulation. Initially, the proposed model consumed 60% more energy for lighting than the baseline, indicating a significant potential for improvement.
By changing the lighting control mode, we were able to reduce energy consumption by 5.31% compared to the baseline.
Additionally, we should consider reducing loads in other areas, such as space cooling and HVAC equipment. Energy consumption is directly related to carbon dioxide emissions, with gas consumption causing the most significant emissions. Therefore, we need to consider reducing the use of gas for heating. These areas can be further improved in subsequent simulations.
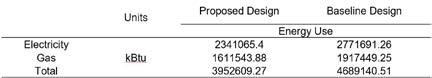
The table summarizes the energy consumption results of both the baseline model simulation and the best proposed model, the electricity usage decreased 15.54%, the gas usage decreased 15.95%.
The Site EUI is successfully reduced by 20% and the CE by 25%, which is a good reference for improving the building's performance. If we want to further reduce the CE, we can consider reducing the heating loads, which means reducing
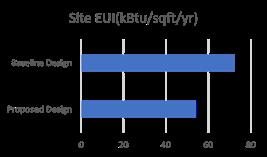
The proposed design shows a lower cumulative energy consumption level compared to the baseline design, indicating that it is more energy-efficient. Disaggregated EUIs by end-uses for both designs reveal that the proposed design is more energy-efficient than the baseline design for heating, cooling, and lighting, while it uses slightly more energy for
the use of fossil fuels. And if we want to reduce the total energy consumption, we can also consider the electricity consumption caused by cooling and lighting.
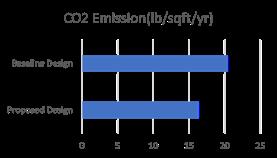
fans, pumps, heat rejection, and equipment. The proposed design uses less natural gas and electricity compared to the baseline design, with a difference of 9.3% and 7.3%, respectively. Moreover, the proposed design emits less CO2 compared to the baseline design, with a difference of about 7.7%.
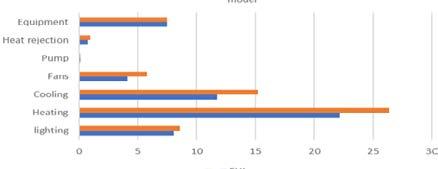
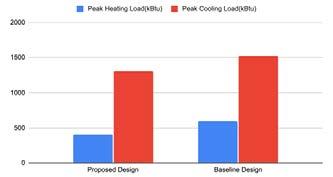
Looking at the peak loads, the proposed design has a lower heating load but a slightly higher cooling load compared to the baseline design. This suggests that the proposed design may have better insulation and heating systems, but may require more cooling energy due to factors such as increased occupancy or more extensive glazing. In conclusion, the proposed design is more energy-efficient and environmentally friendly than the baseline design, although there may be trade-offs in terms of cooling energy and equipment usage.
As a baseline for building performance modeling of TCS Hall, we set . This data will be used to simulate the energy consumption and thermal comfort of the building under different scenarios.
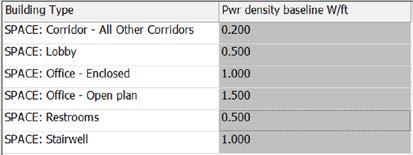
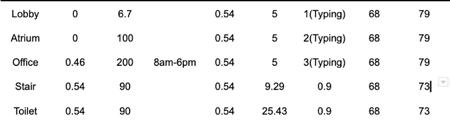
Internal load density shows the amount of heat generated within each space of the building, expressed in watts per square foot. The highest load density is found in the offices, with a value of 0.46 W/ft2, while the lobby and atrium have no equipment load. The toilet area has the same load density as
the stair area, with both having a value of 0.54 W/ft2.
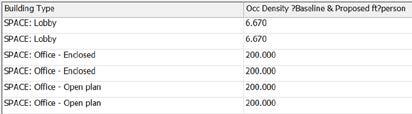
Occupancy shows the number of people expected to be present in each space, expressed in square feet per person. The highest occupancy density is in the atrium, with a value of 100 ft2/person, while the lowest is in the lobby, with a value of 6.7 ft2/person.
For the thermal properties, we still used the data provided from the ASHRAE 90.1 2016 User Manual.
Thermal Zone division are changed into the following divisions, since the last simulation result shows that if the thermal zones are divided in the west-east orientation, there
would be a huge energy load difference between
and west.
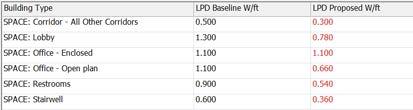
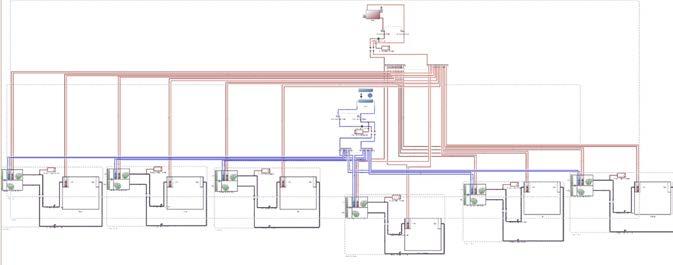
In this section, an alternative building envelope is introduced to both CAV and VAV systems. The goal of this modification is to improve the building’s overall energy performance. The baseline model is built according to the CZ5 Non-residential construction template of ASHRAE 90.1 2016, and the proposed model is built based on the best-case scenario in assignment 2. A detailed construction assemblies comparison is shown below.
As we can see, four kinds of assemblies are modified, external wall, flat roof, ground floor, and glazing. In order to
increase R-value and decrease the U-value, the thickness of construction layers was added and materials are changed into stronger ones, especially the insulation layers. As a result, the total U-value of each proposed assembly is much lower than the baseline.
As for glazing, although the generic clear glass has a higher SHGC, its U-value is too high. Compared with this, the proposed double-glazing glass with a 13mm air layer in the middle decrease the U-value greatly without changing the SHGC too much.
Construction layers

Total thickness(in) U‐value(Btu/h*ft2*°F)
0.75in Stucco
0.625in Gypsum board
2.242in Glass fiber board insulation
1.7550 Glass fiber board insulation
0.625in Gypsum board

2.000in Brickwork outer
0.8130in Cemnet and render
4.000in Cavity insulation
6.000in Concrete reinforced external wall
0.8130in Gypsum board
Construction layers

7.602in Glass fiber board insulation

0.8130in Cemnet and render 7.602in EPS
0.8130in Cemnet and render 0.8130in Cemnet and render
4.8130in Concrete reinforced
0.3940in Metal deck
Total thickness(in)
U‐value(Btu/h*ft2*°F)
Construction layers

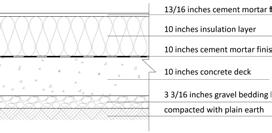
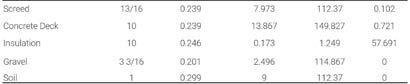
6.000in Concrete at R‐0.0625/in
12.000in Soil at R‐0.104/in

0.8130in Cement and render 10.000in Concrete reinforced 10.000in EPS
3.190in Loose fill/powders‐gravel
1.000in Aerated concrete slab
Total thickness(in)
U‐value(Btu/h*ft2*°F)
Pane layers
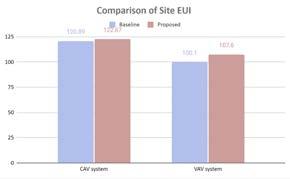
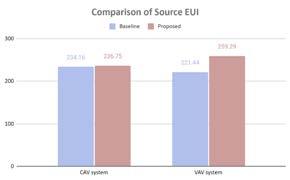
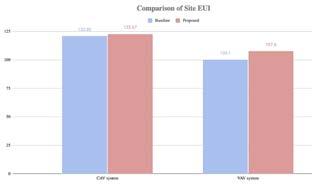
The figure below shows the comparison of site and source EUI between baseline and proposed model. For the CAV system, the annual site EUI of the baseline model is 120.89 kBtu/ft2, while the propsed model's site EUI is 122.67kBtu/ft2. As for the VAV system, the annual site EUI of the baseline and proposed model are 100.12kBtu/ft2 and 107.58kBtu/ft2 respectively. From the perspective of energy consumption, it is clear that the VAV system is significantly better than the CAV system. However, although in theroy, the energy performance of the proposed envelope should be much better than the baseline, the result is the opposite. The reason will be analyzed in the conclusion section.
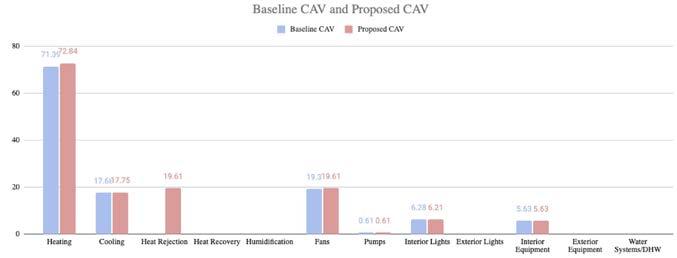
The breakdown of the annual energy use intensity (EUI) of the baseline and proposed CAV systems shows that there is not a significant difference in their energy consumption for heating and cooling. However, there is a slight increase in the proposed CAV system's heating energy use compared to the baseline. Additionally, the energy consumption of fans in the proposed CAV system is slightly higher than in the
baseline system. Other categories, such as interior lights and equipment, have similar energy consumption in both systems. These results suggest that the proposed CAV system does not provide significant energy savings compared to the baseline system. Further analysis may be necessary to identify potential improvements in the HVAC system design to achieve more significant energy savings.
The two graphs below are the monthly energy usage breakdown generated by the design builder, which reflects the energy usage deviation across the year. We can also
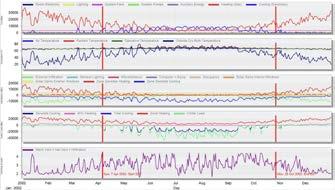
indicate that there is not much difference between the monthly usage of baseline CAV and proposed CAV system.
The proposed VAV system shows an improvement in overall energy efficiency compared to the baseline VAV system. The reduction in heating energy usage is particularly notable, decreasing by 6.82 kBTU/ft2. However, the proposed VAV system has a slightly higher cooling energy usage, which could be due to the trade off between glazing SHGC and U value. The proposed VAV system also increase energy consumption from pumps by 8.28 kBTU/ft2 and energy consumption from fans by 3.1 kBTU/ft2. These improvements in heating performance may be attributed to the change in construction materials and the use of more efficient AHU settings in the proposed VAV system.
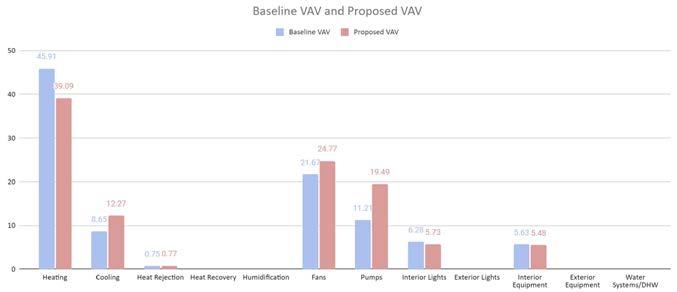
In all, as we aimed to demonstrate an improvement n energy efficiency for the proposed VAV system, we failed to achieve our initial goal for some reason. But still, our experiment showcases the importance of careful design and material selection in creating more sustainable and energy-efficient buildings.
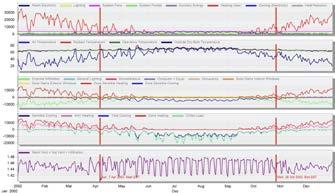
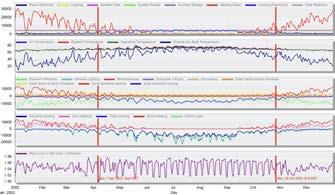
The two graphs above are the monthly energy usage breakdown generated by the design builder, which reflects the energy usage deviation across the year. Similar to the circumstance for CAV, there is not much difference between the monthly usage of baseline VAV and proposed VAV system.
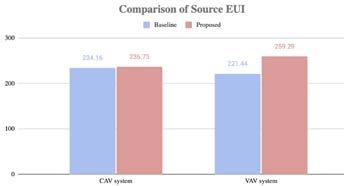
From the site EUI data, we can see that the CAV system has a higher energy consumption than the VAV system for both the baseline and proposed models. Despite both systems experiencing an increase in the site EUI, the VAV system is still more energy-efficient than the CAV system. This can be attributed to the VAV system's capability to control the airflow to specific zones and adjust to the varying cooling or heating load in different areas of the building. In contrast, the CAV system supplies a constant airflow to the entire building, regardless of individual zone requirements.
However, when looking at the source EUI, we can see that the baseline CAV system has a lower energy consumption
compared to the baseline VAV system. This indicates that the CAV system is more efficient in terms of energy conversion.
On the other hand, the proposed VAV system has a significantly higher source EUI than the baseline VAV system, indicating a decrease in energy efficiency. This could be due to the changes made in the proposed model, such as the increased glazing area and changes in HVAC settings. It is possible that the increased glazing area could lead to more heat gains and losses, requiring more energy to maintain indoor comfort conditions. Additionally, changes in the HVAC settings may have also impacted energy consumption.
The graph above shows the breakdown of energy usage intensity (EUI) for the baseline GTHP and the proposed GTHP system. The proposed GTHP system has higher EUI values than the baseline system for heating, cooling, and pumps. This is likely due to the proposed GTHP system's larger capacity
and improved performance compared to the baseline system, which resulted in higher energy consumption. The proposed GTHP system has the same energy consumption as the baseline system for fans, interior lights, and interior equipment.
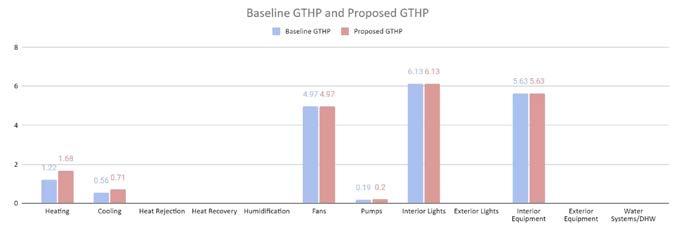
The two graphs below are the monthly energy usage breakdown generated by the design builder that reflects the energy usage deviation across the year. As seen in the graph, the energy usage in each month remains almost same for baseline and proposed GTHP.
Properties of the Solar Photovoltaic System Designed for the Proposed Net-Zero Energy Building
Solar Power System Design Properties
Total PV peak power (at STC1): 12,950 Wp (12.95 kWp)
Total PV area: 78.71 m2 (847.24 ft2)
Total number PV modules: 70
PV-module Type and Specifications:
Manufacturer and Module Type: Solar World -SunModule SW 165/175/185 MONO
Solar Cell: Mono-crystalline silicon (Msi)
Number of Cells: 72 (125mm x 125mm)
Total Active Module Area: 1.125m2
Maximum Power: 185Wp
Module Efficiency: 16.32%
Open Circuit Voltage (VOC): 44.5V
Maximum Power Point Voltage (VMP): 36V
Short Circuit Current (ISC): 5.5A
Maximum Power Point Current (IMP): 5.1A
Temperature Coefficient of Short Circuit Current (A/K): 0.0033
Temperature Coefficient of Open Circuit Voltage (V/K): -0.1558
PV-performance model type in energy simulations:
Simple Performance PV Model (fixed cell efficiency and rated electric power output)
Power Conditioning Type:
DC-to-AC Inverters without a storage media, direct connection to utility grid with bidirectional electricity meter
Inverter Type: Simple Inverter Model (with 0.96 fixed efficiency)
Azimuth Angle: 180o (South)
Tilt Angle: Varies (28o rooftop PV array, 0o shading type PV array.)
Total annual photovoltaic power generation: 8,780.41 kWh (8.78 MWh)
Total annual solar power conversion loss: 702.43 kWh (0.70 MWh)
Total annual solar power generation on Site Energy Basis: 8,077.98 kWh (8.78 MWh)
Total annual solar power generation if supplied by the utilities on Source Energy Basis: 25,582.96 kWh (25.58MWh)
Total annual source energy saving by using on-site solar power generation: 16,802.55 kWh (16.80 MWh)
Total annual solar power generation intensity: 1.30 kWh/m2 (Building Area: 6361.00m2)
Percentage of electric loads satisfied: 0.70%
Building Integration Types:
Roof-top solar PV arrays, Shading-device (overhang integrated) type solar PV arrays.
Solar PV Array 1 Properties Roof-top solar PV arrays: 44.98m2, 40 PV Modules, 7400Wp, 180o azimuth angle, 28o tilt angle, 1.2m spacing between each PV row, 1.2m setbacks from the edges of the roof perimeter.
Solar PV Array 2 Properties Shading type solar PV arrays: 33.73m2, 30 PV Modules, 5550Wp, 180o azimuth angle, 0o tilt angle (horizontal).
Total Estimated Cost (all system components): N/A
CLIMATE AND ENERGY
RESIDENTIAL PASSIVE ANALYSIS AND RETROFITS
Individual Project Link to Full Report Fall 2022
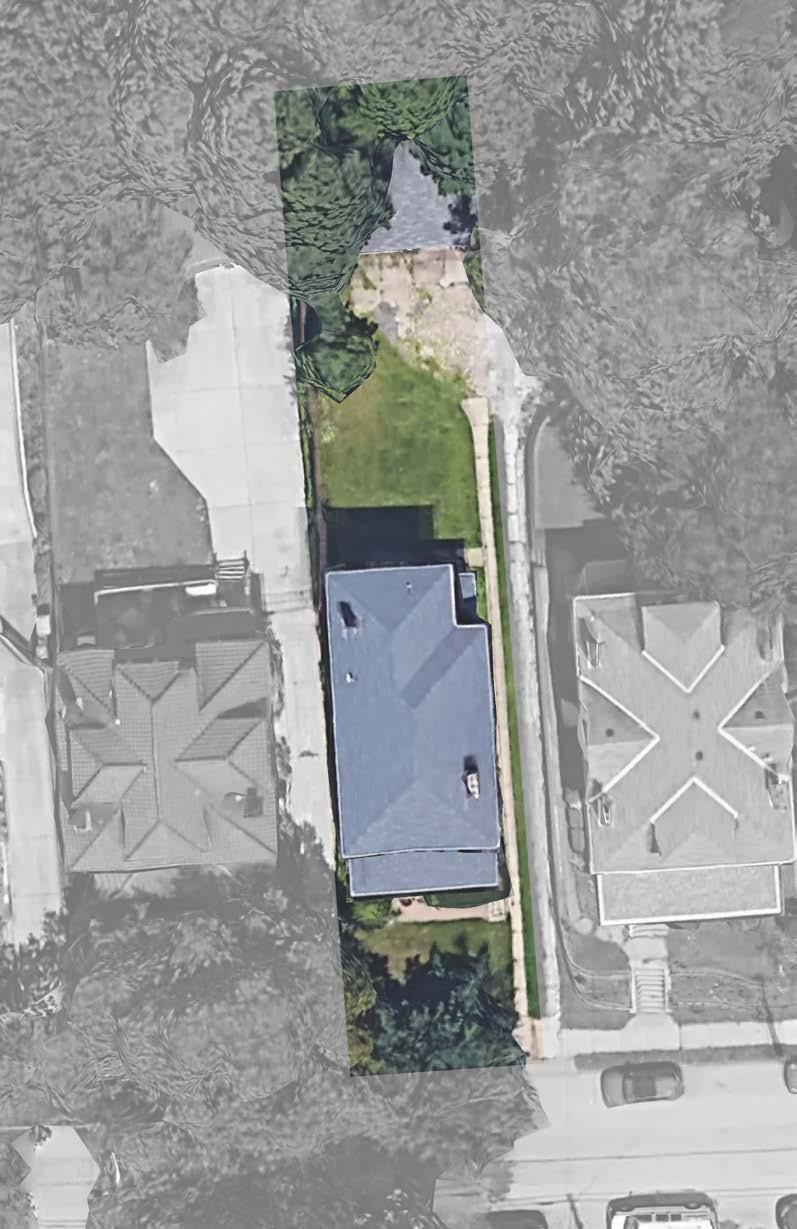
The project presents a comprehensive strategy to improve the energy efficiency of a singlefamily house located at 5875 Bartlett Street, Pittsburgh, PA. Through detailed site and climate analysis, the study identifies the significant impact of Pittsburgh’s cold winters and hot, humid summers on building performance. Key passive design strategies include maximizing passive solar gain, enhancing insulation, and optimizing natural ventilation.
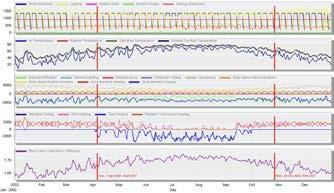
By calculating the building's heat loss using UA coefficients for walls, windows, doors, roofs, and floors, it is proved that the house has a terrible performance with a significant heat loss through the walls and windows. Total energy calculations show yearly consumption at 184 mmBTU and site EUI at 96.5 kBtu/sqft/yr.
The study includes a detailed home energy modeling and calibration using RemRate software. By putting forwards 10 retrofits including solaring the house the building’s energy efficiency are highly enhanced, the total energy load reduced 58% and the toal energy costs reduced 60.5%. The house finally meet the HERS minimum criteria.
PSYCHROMETRIC CHART
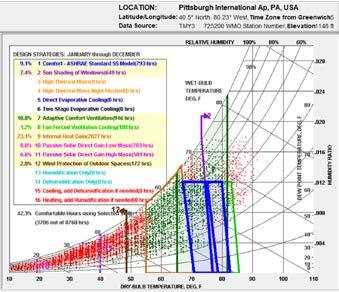
According to the psychrometric chart, we can know that the most important factor in Pittsbuigh to keep a internal comfort level is internal heat gain. Secondly, passive solar direct gain is the second impact factor. In addition, ventilation also affect thermal comfort.
Cold winter is a liability for comfortable level. During the typical month of December, the temperature will drop below 32 degrees F. Therefore, it is necessary to enhance air tightness and improve the insulation of the wall
Passive solar direct gian can provide a comfort for 14% of a year. It is important to take advantage of summer sun and ensure the building gets much solar radiation from the facade towards south, southwest and southeast.
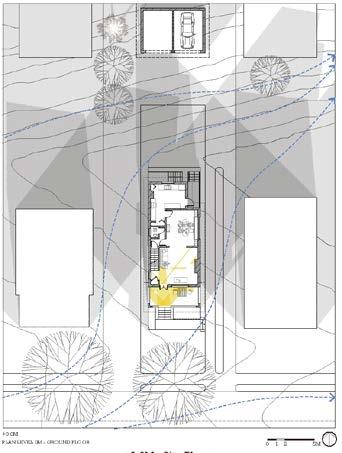
Site Analysis
Winter Shadow & Wind
In the winter, the shadow becomes much more drastic due to the low altitude. The whole back yard is blocked by the houses. However, direct sunlight is available at the front lawn and porch because of the decidious trees become barren in the winter. As for the interior daylight, all the rooms is deprived of direct sunlight due to the roof above the front door blocks the sun. The house suffers from cold wind in winter due
Summer Shadow & Wind
to the barren trees in winter.
In the summer, the front lawn and porch can be blocked by the America sycamore and maple tree in front of the house which is beneficial to the indoor temperature in hot days. Parts of the house are able to receive some indirect light. In terms of wind, the tall trees resist from the wind comes from southwestern, which has a negative impact on interior temperature and
Ground Floor Comparison
There are several changes in the revised ground floor as follows.
First, the most prominant change is the arrangement of living room and dining room. Due to the southeatern direction is the best orientation with a great amount of sunlight during the whole year, this corner should be opened to allow more light enters in. As a result, the dinning room can receives direct sunlight in winter.
Second, the front door space is covered by a seasonal roof instead of a fixed slope roof. The utilize of seasonal vegetation makes the porch a warm area in winter and a cool area in summer. Meanwhile, the flourish vegetation in summer block direct sunlight while the barren vegetation in winter allows more light enters into the room.
Second Floor Comparison
There are several changes in the revised second floor as follows.
First, makes more bedrooms faces south and southeast.. Provide a independent terrace for bedroom2 and optimize its lighting conditions.
Plans and Sections
The areas highlighted in red are conditioned space. It is clear that this two storages house have all the living spaces including first and second floor heated. The basement is unconditioned and fully sunk in the ground.
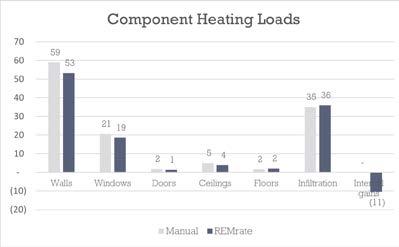
The total components loads is controlled within 15%. However the main diifference lies in doors and floors. This maybe because the manual calculation of the floors over the unheated basement is roughly
The setpoint temperature in RemRate model should be
Heat Loss through Building Envelope
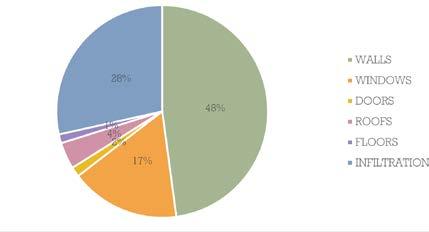
The annual total heat loss is 123.27 mmBTU, which is calculated manually with UA factors. From the tables above, it is obvious that the infultration through window seams are the largest contributor while the brick wall is the second, and then the single-pan glazings. The house is equipped with a relatively
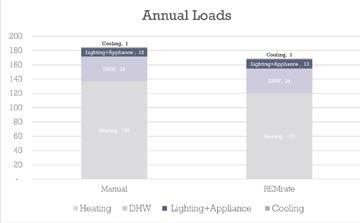
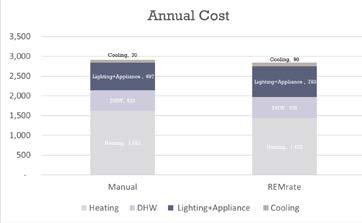
The difference of the annual cost is only 1%, and the differernce of each kind of end-use is consistent with the energy consumption. The slight difference maybe because the manual calculation varies for
month which is based on the
bills. The
This home DOES NOT MEET the overall thermal performance requirements and verifications of the International Energy Conservation Code based on a climate zone of 5A. (Section 402, International Energy Conservation Code, 2018 edition). In fact, this home is under the requirements by 200.3%
1. ZONING THE HOUSE
INSTALL SMART THERMOSTATES WITH DAMPERS FOR DIFFERENT
Since users are not always stay in the same room all the day, it is not a good deal to maintain the temperature at 65 o F for every room. A more econimc measurement is to install smart thermostates for different zones and control it with a damper. For example, bedrooms (678sqft, 50% of total area)are always closed during the day, so the temperature could maintain at 55oF in the day and 65oF in the night. For the rest of the house (678sqft, 50% of total area), the temperature during the day could set at 65oF, while turned down to 55oF duiring the night.
Calculation of average setpoint temperature: ground level: (65oF+55oF)/2 = 60oF first level: (55oF+65oF)/2 = 60oF the whole house: (60oF+60oF)/2 = 60oF
• Compliant mechanical ventilation is required in the home. This home has insufficient mechanical ventilation specified. Failed mandatory requirements
• The Tested home infiltration level is above the 3.0 ACH50 limit set by IECC 2018 and as a result fails the UA Compliance Path.

This home DOES NOT MEET the energy efficient requirements for designation as an EPA ENERGY STAR Version 3.1 Single-Family New Home (Rev 11).
• The Design Home HERS Index is larger than the ENERGY STAR HERS Target Index.
• The envelope does not meet the insulation requirements of the 2009 IECC as specified by ENERGY STAR v3/3.1. The UA Calculation is the same as the 2009 IECC UA Compliance. The Design Home UA value of 696.0 must be less than or equal to the 2009 IECC Reference Home UA value of 242.8. Check the 2009 IECC UA Report to find the components not meeting code.
• Windows do not meet the 2009 IECC requirements.
• Mechanical ventilation has not been measured in the design home which is required for ENERGY STAR v3/3.1/3.2.
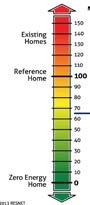
This home FAILS the minimum criteria. The home HERS index now is 202. Since the standard of new home in US is 100, this home is 102% less efficient than the standard. It is neccesary to take retrofit measures to improve its energy performance.
2. REDUCE INFILTRATION
CAULK THE WINDOW FRAMES AND WEATHERSTRIP THE
Infiltration accounts for the largest amount of heat loss. By caulking the the window frames and add weatherstrips to the door bottom could reduce infiltration by 20%, which could significantly increase heating and cooling efficiency.
The total length of the window frame is 234.25ft. Since each caulk tube is 50ft, it consumes 5 tubes.


3. LIGHTING UPGRADE
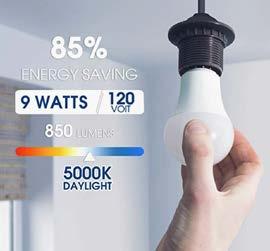
REPLACE ALL THE BULBS WITH LED ONES
For the same brighness, the LED bulb only use 12 wattages energy while the traditional bulb consumes 60 wattages. Besides, the lifetime of the LED bulb is more than 60 times longer than the incandescent bulbs.
There are 20 lamps in this house, 10 of them are incandescent lamps, and 8 are fluorescent lamps. Replace all of them with 9W LED bulbs is a easy way to reduce energy consumption and electricity cost.
4. INSTALL WINDOW SHADE
INSTALL HONEYCOMB CELLULAR WINDOW SHADE
Night insulation plays an important role in saving energy consumption. An additional layer of honeycomb shade will increase the R-value of window to 7.73 during the night and the heat loss will significantly reduce and provide a warmer interior environment.
Calculation of new base R-value: single glaze window: (1+7.73)/2=4.365 double glaze window: (1.61+7.73)/2=4.67
There are 13 windows, each size is 29'' width*51height. It consumes 13 celluar shades in total.

5. WALL UPGRADED
INSTALL THERMAL INSULATION LAYER TO EXTERIOR WALL
Wall loses second large amount of heat, thus it is necessary to improve the R-value of exterior wall. Compare with internal thermal insulation, the effect of external insulation is much more better. However, the house facade will be changed due to the wall upgrade, clients may need to redesign it. Clients could also choose to install internal insulation which is much easier to install and saves money by avoiding facade decoration. The point is, it must be added with a vapor barrier to protect it from interior humidity.
The total area of exterior wall is 1771sqft. Since each bag covers 125.94sqft, it consumes 14 bags of fiberglass batt. The basic cost to Install Wall Insulation is $1.49 - $2.56 per square foot.
SAVINGS

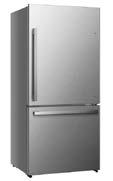
6. KITCHEN MACHINE UPGRADE REPLACE REFRIGERATOR AND DRYER WITH ENERGY STAR
A new refrigerator only consumes 435kwh per year, while the current refrigerator consumes 900kwh annually. Therefore, to buy a more efficient one will save a lot of electricity fees.

7. INSTALL PHOTOVALTIC PANELS
INSTALL SOLAR PANELS ON THE PORCH ROOF
It is suggested to install photovaltic panels on the porch roof whici oriented south direction. It will convert solar energy into electricity and thus save clients electricity fees.
The whole area of the porch roof is 201.1 sqft which could convey 35 panels. This solar panel is 70 watt, since the average price of labor per watt across the country is about 50 cents, the total labor cost is 70w* $0.5*35= $1225.

8. PASSIVE SOLAR HEATING
ENCLOSE THE PORCH WITH LOW-E GLASS (SUNSPACE
It is highly recommended to enclose the porch to create a glasshouse. The reasons and advantages are as follows:
In winter, the glasshouse absorbs solar heat and the heated air flows into the house to provide a warm environment. In summer, open the glass doors and windows at night to promote air ventilation.
The energy consumption calculations are as follows: new UA= UA Total - UA of south wall = 944.52-113.88 =830.64 BTU/HRF
According to the chart, the specification choice is SS-B2b for the goal of 18% energy saving(SSF), LCR=70 Ag(Area of glass) = 24UA/LCR = 830.64/70 = 284.79sqft
Since the original heat cost is $ 1469, the galsshouse will save $264.42


This home DOES NOT MEET the overall thermal performance requirements and verifications of the International Energy Conservation Code based on a climate zone of 5A. (Section 402, International Energy Conservation Code, 2018 edition.)
Due to the installation of insulation
to the
and honeycomb
shades to the windows, their UA improved greatly. However, the tested home lack of sufficient mechanical ventilation specified and its infiltration level is above the 3.0 ACH50 limit set by IECC 2018 and as a result FAILS the UA Compliance Path.
ENERGY STAR V3.1
This home DOES NOT MEET the energy efficient requirements for designation as an EPA ENERGY STAR Version 3.1 SingleFamily New Home (Rev 11).
NORMALIZED, MODIFIED ENG-USE LOADS (MMBTU/YR)
• The Design Home HERS Index is larger than the ENERGY STAR HERS Target Index.
• Windows do not meet the 2009 IECC requirements. Check the windows and make sure they have the correct values.
• Mechanical ventilation has not been measured in the design home which is required for ENERGY STAR v3/3.1/3.2.
HERS INDEX: 99
This home MEET the minimum criteria. The home HERS index now is 99, compared with the former index 202, its energy rating impoves significantly. Since the standard of new home in US is 100, this home is 1% more efficient than the criteria. If taking the glasshouse into account, which saves 18% energy cost, the HERS index goes lower.
HOW GREEN IS CLEAN WATER?
LCA OF PGH2O WATER TREATMENT AND DISTRIBUTION
Harsh Vaibhav, Jiahua Wu, Nicholas Cooper, Rahul Raj Link to Full Report Spring 2024
The project provides a comprehensive life cycle assessment (LCA) of the Pittsburgh Water and Sewer Authority's (PGH2O) water treatment and distribution processes based on ISO standards. This assessment aims to evaluate the environmental impacts, particularly focusing on energy consumption, greenhouse gas emissions, and waste generation throughout the stages of water extraction, treatment, and distribution. The functional unit considered is 1 million gallons of treated water per day (MGD), with a cradle-to-grave system boundary covering water extraction from the Allegheny River to the distribution of treated water to end-users.
Two models are built to do this study. OpenLCA model is the primary tool to build the LCA model while the process-based matrix model serves as a screening tool to validate the result. Key findings indicate that the total greenhouse gas emissions associated with treating and distributing 1 MGD of water are approximately 353 kilograms of carbon dioxide equivalent (CO2e). The major contributors to these emissions are the electricity consumption for operating pumps and other equipment, and the transportation of chemicals used in the treatment process. Sensitivity analyses reveal that transitioning to renewable energy sources for electricity and optimizing chemical transportation logistics could significantly reduce the environmental impact.
• Intended Application: This project aims to conduct a comprehensive life cycle assessment (LCA) focusing on the environmental impact of water consumption in Pittsburgh, with specific emphasis on the water provided by the Pittsburgh Water and Sewer Authority (PWSA), a.k.a. PGH2O.
• Reason: Understand the energy consumption and environmental impact associated treatment and distribution of water.
• Audience: PGH2O, Policy Makers, and Individuals who Consume Pittsburgh Water.
• Comparative assertion: Not a comparative study intended for public use
• 1 million gallons of treated water per day
System Boundary
The system boundary is cradle-to-gate which includes water extraction from Allegheny River, water treatment at the PGH2O water treatment plant, and clean water distribution to end users. While the sourcing and disposal of chemicals are accounted for in the LCA, the installation of water treatment equippments, the manufacturing of chemicals and the associated emissions with this production are excluded from the study.
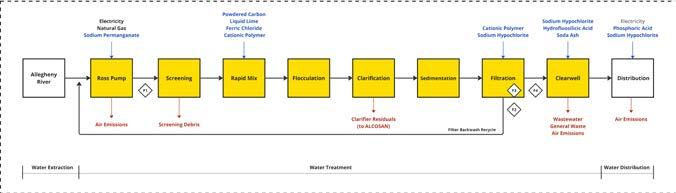
Inventory Inputs and Outputs
• Inputs: Raw river water, electricity, chemical feed, and other energy inputs (fuel and natural gas consumption) for water treatment
• Outputs: Treated Water, municipal solid waste, biosolids and biogas, CO2e
Data and Methods
• PGH2O: Direct data on day-to-day operations in winter months.
• Transportation
• Chemical inputs and locations
• Emissions and waste flows
• Electricity and natural gas usage
• USLCI:
• Transportation
• Electricity
• Elementary flows
• TRACI: Impact assessment
Assumptions
• Wastewater sent to ALCOSAN is not metered so it will be excluded. However, the quantity of wastewater sent to ALCOSAN is insignificant compared to treated water so it is assumed that it has an insignificant impact on the electricity required.
• Assuming that there is a ‘unit’ loss of water in between the screening and filtration units instead of losses after every stage, since most stages have a minimal loss.
• Electricity readings are provided every 15 minutes,
necessitating aggregation to daily or monthly summaries, introducing uncertainty.
• Chemical consumption, electricity, and natural gas consumption for Q4 are averaged, which is going to take away the operational peaks and troughs of the process.
• Simple allocation was conducted where one chemical was used in 3 processes. Since the volume of the water remains constant across processes, the allocation was done by splitting it into equal amounts across the processes.
Calculations
• Inputs and outputs of each unit process. As mentioned before, the primary datacollected from the PGH2O water treatment plant are the three-month metering data of electricity and natural gas in Q4, the total amount of river water, chemicals, emissions, and wastes. The input electricity consumption data of the “Ross Pump” and “Distribution” process is an average daily electricity consumption value which is obtained by dividing the cumulative electricity consumption in Q4, as shown in the Ross meter and Aspinwall meter respectively by the number of days (92 in total). The same for the input data of natural gas (Equation 1).
• B matrix of CO2 and air emissions of unit processes. Air emissions from the grid electricity are calculated according to the eGrid data. To be more specific, the total amount of each air emission equals the total electricity consumed times emission rate given by the table below.
For example, the CO2 emission from the Ross Pump process equals total kilowatt hours of electricity (18517.46 kWh) divided by 1000 and times 657.39 lb/MWh (Equation 2).
Besides, according to EIA data, the CO2 emission of natural gas combustion is 117 lb/MMBtu, which means the total emission from the natural gas is calculated based on the following equation (Equation 3).
(Equation 3)
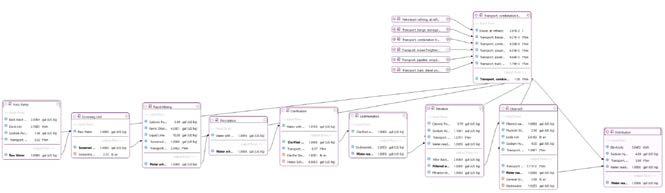
Matrix Model
A process-based matrix model was created to attempt a validation of the openLCA results. The A matrix is calculated based on the ten-unit processes from water extraction to distribution. The B matrix, which is the CO2 emission of each unit process, is the sum of it from transportation, electricity consumption, and natural gas combustion if applicable since CO2 emissions are only present during these three processes. The number of CO2 emissions of transportation used in this matrix mode is obtained from OpenLCA, while the emissions of electricity and natural
According to the following equation, the final CO2 emission is 353.84 kg, which is almost the same as the result from the OpenLCA model.
= B * X
Impact Results
Global Warming Potential is the primary impact category selected for our analysis.
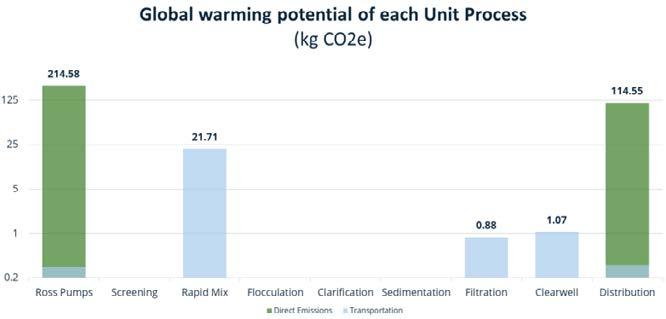
The GWP of the water treatment facility of PGH2O, as reported by openLCA, is ~353 kg of CO2 eq
The individual contributions to Global Warming Potential (GWP) from each unit process are delineated by segregating direct emissions and those arising from transportation.
(Equation 4)
Additionally, the total GWP for each unit is stated alongside the cumulative GWP, factoring in the preceding units.
Ross pump and distribution process are the two biggest contributors largely due to the use of grid electricity to power the pump. GHG emissions from other processes are all below 25kg which come from the transportation of chemicals and solid wastes.
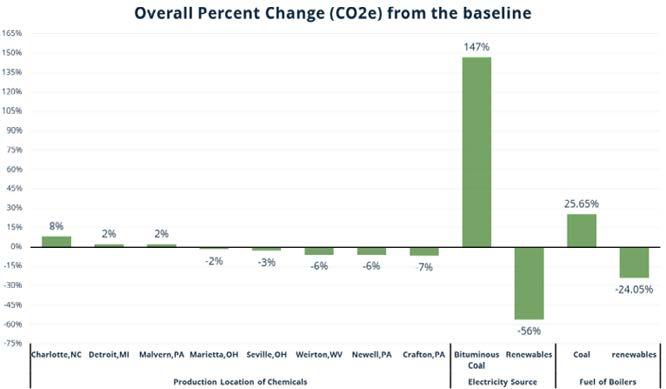
Three factors are selected to do our sensitivity analysis, transportation, electricity sources, and fuel types of the boilers.
An analysis was done on the amount of tonne*km needed to transport every chemical to the water treatment plant. This analysis was done assuming that each city possessed the needed manufacturing plants to create and ship the quantity
of chemicals needed. The overall change in CO2e ranged from an 8% increase in the highest case, and a 7%decrease in the lowest.
Another sensitivity analysis was done to understand how electricity sources impacted the percent change in emissions. The two scenarios chosen were generation from entirely renewable sources, and electricity being generated
from bituminous coal. Renewable energy saw a 56% decrease in emissions, and bituminous coal netted a 147% increase in total emissions.
The third sensitivity analysis was done by changing the fuel type of the boiler used in the “Ross Pump” process. The purpose is to understand the total CO2e emissions change from boilers powered by different fuels. The two scenarios were also heat from coal and electricity from renewable sources. The coal-burning furnace saw an increase of 25.65%,
while the electric boiler powered by renewable energy saw a 24.05% decrease
All sensitivity analyses were plotted together to show the relative impact that each variable had when compared to the base case. Overall the electricity source had the highest discernible impact when it comes to change in CO2e emissions from the baseline, with a 147% increase when using solely bituminous coal, or a 56% decrease when switching to renewable electricity.
Recommendations
• To PGH2O:
• On-Site Electricity Generation using
• RenewablesChemical Sourcing and Transportation improvemen
• To Policy Makers:
• Encourage adoption of green tech by implementing subsidies for the water industry
• To Individuals:
• Know the embodied emissions of water consumption
• Water Heating
Limitations
• Material and Equipment: Emissions only associated with manufacture and transport
• Electricity Metering: Understanding stage wise impact of electricity us
• Result Expansion: Analysis was done for Q4 months (Oct, Nov, Dec)
Future Work
• Cost-Benefit Analysis for on-site electricity generation
• Path and cost optimization for chemical transportation
• Comparative study against another city

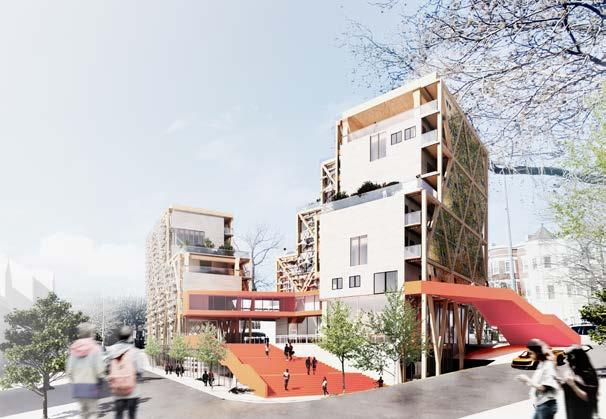
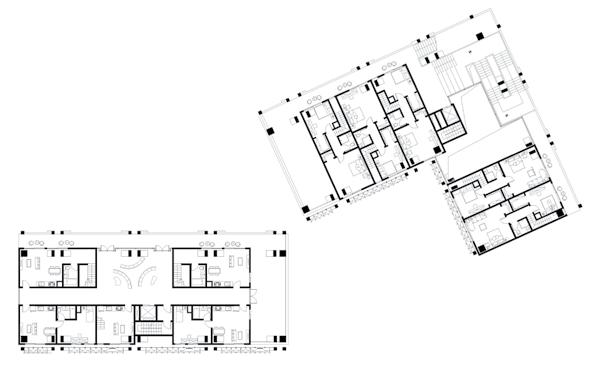
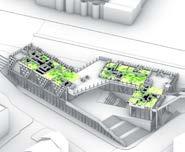
URBAN LIVING AFFORDABLE HOUSING DESIGN IN WASHINGTON DC
Academic Work
Praxis II at Carnegie Mellon University Spring 2023
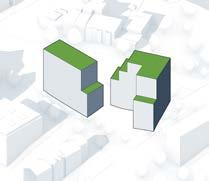
The project aims to create a collective housing with five different scaled uint types. The positioning of the site in the central Washington area became the catalyst of this design, which one which renounces the traditional isolated housing, and instead actively engages with city life and foster social interaction between people with different background in a variety of scale.
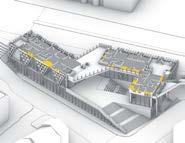
Two towers form a path that connects the streets on the north and south sides of the site and a central plaza that invites citizens to circulate up. Various public programs that are missing from the surroundings are embedded into the project to active city life, such as vertical garden, cooking education, grocery store, etc.
As for the building space arragement, public spaces are integrated into each floor and connected vertically on the northeast corner of the buiding. Void spaces are reserved to provide further development possibilities of residents.
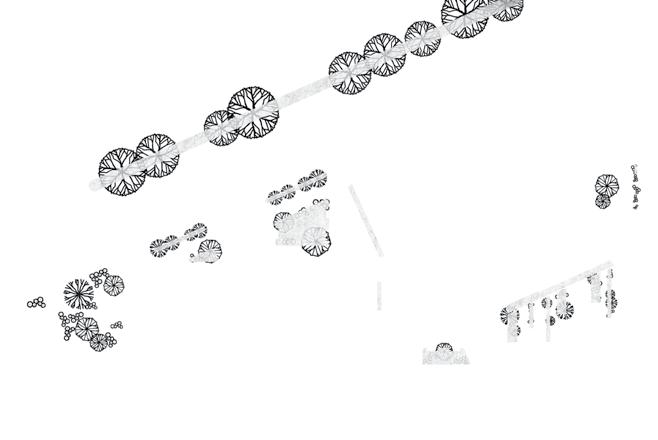
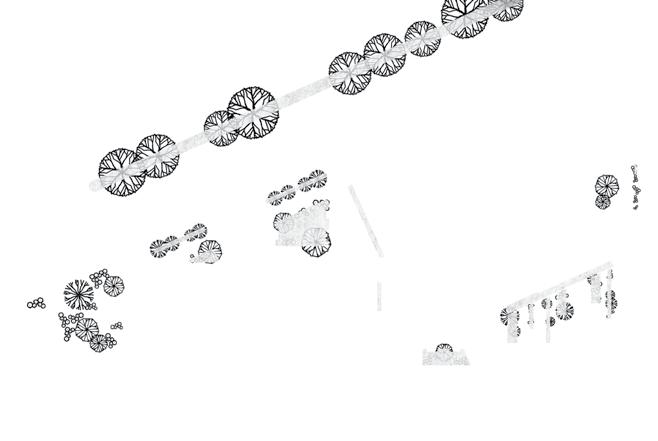
Infrastructure Analysis
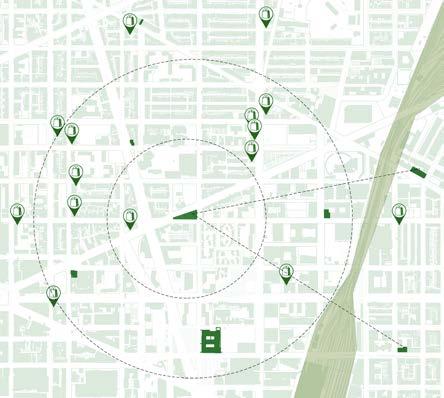
The surrounding buildings are monofunctional and the service infrastructures and public spaces are far beyond the walking distance.

Data Source: Climate. gov, Open Data DC
UHI & GI Map
The Heat Island effect
is relativly
Urban Farming
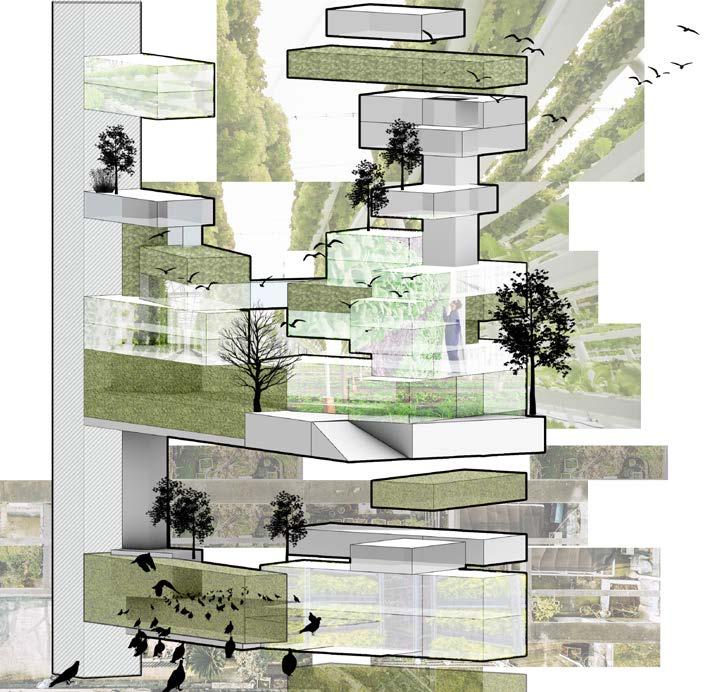
To create a self-supporting community and encourage a collective lifestyle, the building is conceived as an urban farming system. The roof terrace and couryard provide enough space for farm land, which not only satisfy the needs of residents' dailylife but also increase green space and therefore reduce the heat island effect in Washington D.C.
of the central D.C. area seriouse due to the large area of concrete surface and the lack of tree canopy and other green infrastructures.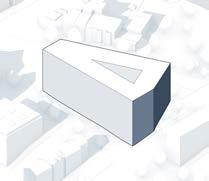
Singe volume is used to occupy the whole site, a central couryard is preserved to ensure the enough daylight.
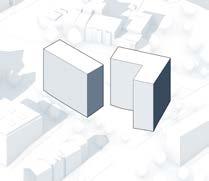
Open the building by dividing it into two towers and promote social engagement.
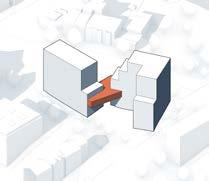
Triangular squares and a passageway are formed by the two towers to provide a public city space.
Public spaces are located on the corner in response to the crossroad.
To reduce the pressrue on the streets, the massing setbacks while creating more roof terraces that could be used for roof gardening.

Different unit types aggragated together while keeping some blank spaces to adapt to family development in the future. A bridge on the second floor connects the two towers while shape the passageway spacially. Horizontal shading panels overhang above the window to reduce solar heat gain in the summer while ensure adequate winter illumination.
Shape the topography and create a private courtyard for the residents. Roof terraces and the north facade are designed as green surfaces to promote a sustainable lifestyle.
and Massing
Each unit has public space on the first floor, bedrooms and bathroom on the second. Terrace is provided to promote interaction between units.
The two tower are connected on the second floor with an iconic orange bridge to maintain consistency and permeability of sights and circulation.
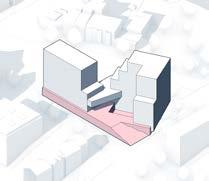
+0.0m - Ground Floor Plan
The towers, on north and south sides of the site, enclose a plaza formed by two triangles connected at the center of the site which serves as the living room of the city. In addition to the public programs on the ground floor, the plaza invites the public to pass through and participate in the public activities held there.
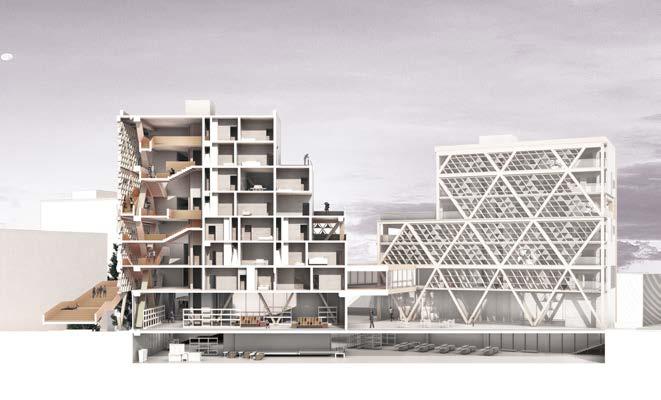
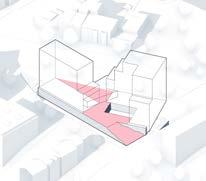
Longitudinal Section
The vertically penetrating public spaces are located in the most open corners with great views of the city.
Transverse Section
The different levels of courtyards form a transition from public streets to fully private gardens.

Aeroponic System & Sustainable Living
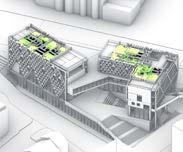
Aeroponic gardening are applied on the north facade to create a green elevation and purifiing the outdoor air polluted by vehicle. When all the triangular cells are filled by plants, the facade could also serves as a noise barrier.
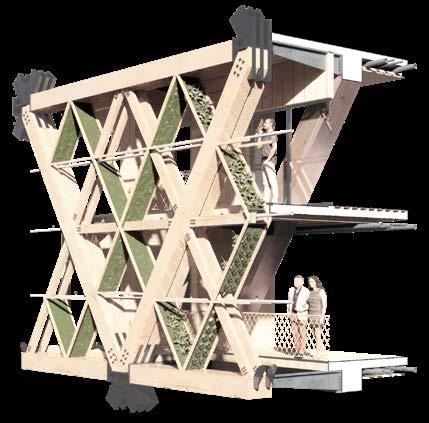
Aeroponic Facade System
Clean water with nutritions are pumped from the ground and distributed to each floor for daily water use and aeroponic cells. The water flows in the pipe is spreaded to irrigate all the plants and vegies planted by residents.
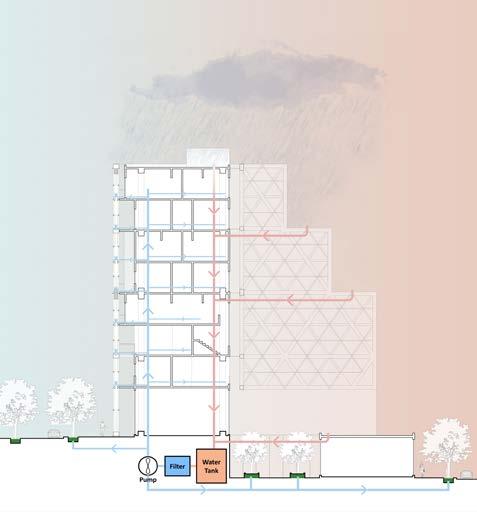
Rainwater Harvesting Diagram
The rainwater collected from the rooftop are used for irrigation of the aeroponic system, flushing and gardening after filtered on site.
Precipitation & Amount of Water Collected
Considering about the rooftop collection efficiency, the total amount of the rainwater collection from rainwater harvesting is calculated according to the precipitation of rainwater in Washington DC, which is 80,004 per year.
Two months of storage: 3,840 gal = 513.37 cubic feet Sizing round cistern: 3.14 x radius of cistern squared x max height of stored r = 4.8', d = 10'
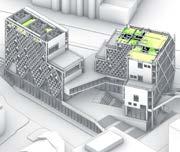
The stepped roof shapes the urban image and reduces the mutual obstruction of views between the two towers. The application of shading system on the south side block the excessive sunlight and therefore improve the building's energy performance.
Daylight Analysis
Three representative floors are selected to do the spatial daylight analysis and annual sun exposure analysis. The depth of each floor are controled to guarentee the central area could have enough daylight while the sun exposure of the peripheral area is kept at a lower value.
The chunk model above shows the shading system on the south and the aeroponic facade on the north, as well as how they help shaping a comfortable and sustainable life for the residents.
By
Energy Simulation
from 67 to 34.

SOLAR POTENTIAL BASED ON GIS ANALYSIS
ROOFTOP SOLAR TECHNIC POTENTIAL IN ALLEGHENY COUNTY
Individual Work Link to ESRI Story Map Fall 2023
The project explores the potential for residential rooftop solar installations in Allegheny County. The analysis focuses on identifying areas with high solar potential based on factors such as household income, home ownership, roof area, and house value. Using ArcGIS Pro, the study maps these factors and employs multivariate cluster analysis to classify neighborhoods into five clusters ranging from highest to lowest solar potential. The results show that suburban areas have the highest potential, while central Pittsburgh has the lowest due to older, rented homes with low building performance. The study also identifies neighborhoods with high energy burdens and older housing stock, highlighting the need for clean energy interventions. Additionally, areas with low-income and low-education populations are identified as requiring government support to adopt solar technology.
The report suggests prioritizing solar energy promotion in affluent suburban areas and addressing barriers in central, lower-income regions to achieve broader adoption of rooftop solar energy. While some future works are needed to complement the research result, including collecting more detailed data on energy burdens and developing a comprehensive plan that considers current policies and phased development strategies to promote rooftop solar energy effectively.
Background Overview
• Although global commitments and actions to reduce carbon emission are growing, but they still fall well short of what is needed to limit the rise in global temperature to 1.5 oC.
• In order to achieve the net-zero goal in 2050, the massive deployment of all available clean energy technologies is required between now and 2030.
• Net zero means huge declines in the use of coal, oil and gas.
• The global energy sector in 2050 is based largely on renewables, with solar the single largest source of supply.
• One of the resistance to access solar energy will be income and poverty.
Analysis Goals
• Identify high potential neighborhoods within Allegheny County to promote and apply solar energy.
• Identify the neighborhoods within Allegheny County that are in urgent needs to shift to clean energy from fossil fuel.
• Identity the neighborhoods within Allegheny County that need government support to apply PV panels.
Approach and Methodology
Problem Statement
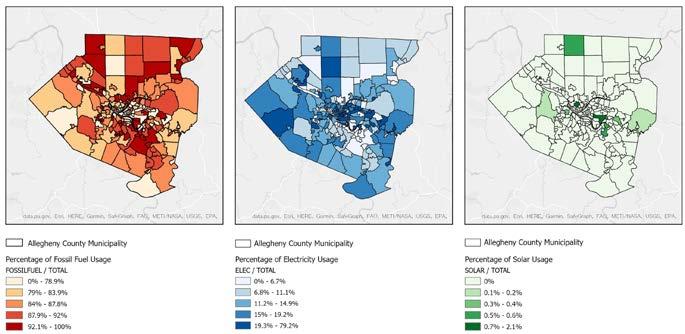
According to the definition given by the Department of Energy (DOE), fossil fuel which includes oil, coal and natural gas are non-renewable resources that formed when prehistoric plants and animals died and were gradually buried by layers of rock. Therefore, the cumulative number of gas, oil, and coal is calculated to get the percentage of fossil fuel usage. Same as the electricity usage and solar usage map.
Potential Hierarchy
The neighborhoods with intense fossil fuel usage are located in the adjacent boroughs of Pittsburgh and several northern neighborhoods showing 92.1% to 100%, while Pittsburgh downtown has the lowest usage at 0% to 78.9%. The usage of electricity as the fuel type is just the opposite, the central part uses electricity greatly at up to 79.2%, while the suburban area only has a 6.7% usage rate or less. On the contrary, only several neighborhoods have access to solar energy with a percentage of 2.1 at most.
Main Factors of Potential Hierarchy
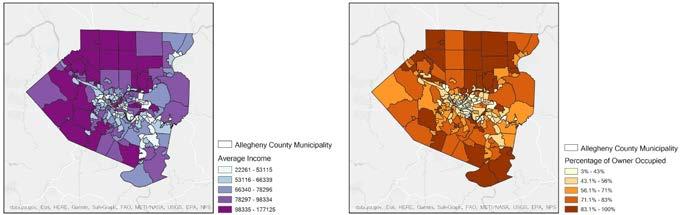
According to the Rooftop Solar Technical Potential for Low-toModerate Income (LMI) Households done by National Rewable Energy Lab, the solar potential is influenced by income, and tenure of occupants. The map on the left shows the average
According to the research done by the National Renewable Energy Lab(NREL), Allegheny County has a high absolute residential solar potential. To promote the accessibility of rooftop solar energy in Allegheny County. Therefore, a geographic pattern analysis of regional rooftop solar technic potentials was done in this research.
income of families in each neighborhood while the map on the right demonstrates the percentage of owner-occupied houses. It is obvious that the peripheral areas with higher income and owner-occupied rate has a higher potential.
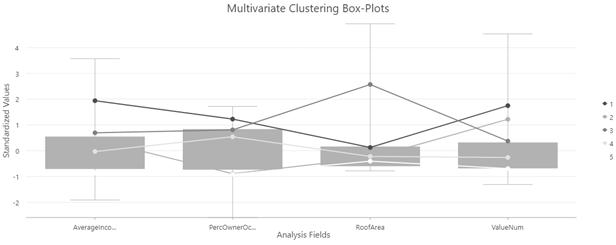
Multivariate cluster analysis was used to identify areas with higher potential as a result of synthesized consideration of 4 variables above. Five clusters were chosen for this study. Descriptive statistics and box-plots below illustrate the potential hierarchy, from highest potential, high potential, medium potential, low potential to lowest potential. The bestfit areas was deemed to be cluster 1 which is the richest region with the highest house value and most of the houses are occupied by the owner. Cluster 5 is the lowest potential region where people who possess old and cheap houses may
not afford the investment in renewable energy, let alone these houses are there to rent to university students or employees working in downtown Pittsburgh.
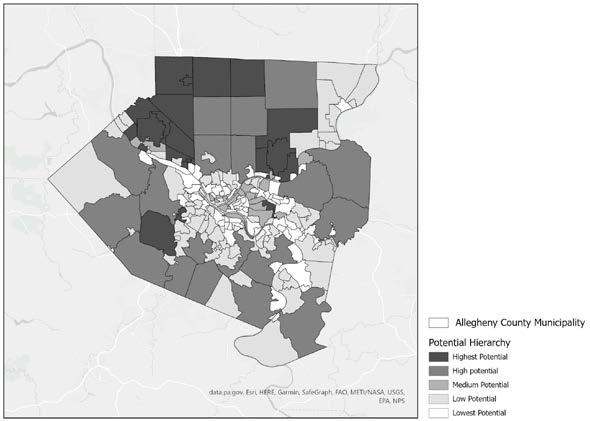
The most potential part is the northern neighborhoods, while other peripheral areas have relatively high potential. However, the central parts, the city of Pittsburgh and surrounding neighborhoods are given the lowest potential. Therefore, the darkest neighborhoods shown on the map could be set as the first target areas of rooftop solar energy promotion by the government since that would be an easier and better start.
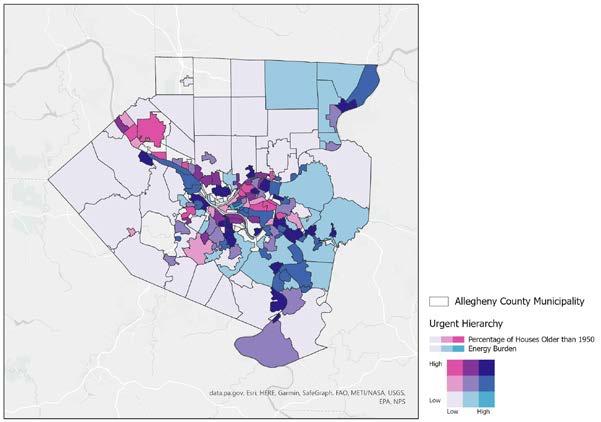
The bivariant choropleth map takes both factors (year of built and energy burden) into consideration and represents those areas with more urgent needs. That is to say, the adjacent neighborhoods of the city of Pittsburgh are areas that need rooftop PV panel installation most, followed by some neighborhoods along the rivers. Fortunately, those areas have already been prioritized to get federal funding. However, the disadvantage of this study is the lack of regional data on energy burden, such as the northmost two neighborhoods, which makes the final results for a few neighborhoods not that
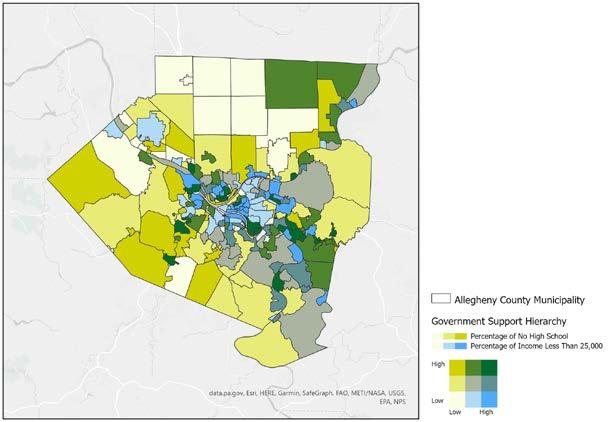
One of the resistance of solar energy promotion is the income. Poor people would be reluctant to install rooftop solar technology due to the relatively high initial cost. Another factor would be education level, those people receive less education may lack of understanding of new technologies and are not entirely clear of why we need to shift from fossil fuel to solar energy. That is to say the government should focus on the neighborhoods with a high percentage of poor people and make them aware that although the initial cost might be high, but the payback is only a few years, and then families would save a lot on energy costs. In a word, the government should pay more attention to the areas highlighted in green on the
Conclusion
• This geographic analysis tells the neighborhoods with higher Rooftop Solar Technical Potential and how should government react to household fuel usage to achieve net-zero goal in 2050.
• 41 Allegheny County neighborhoods were identified where have high potential of rooftop solar energy technology installation. They are all located in the periphery of the county.
• The central areas are in more urgent need for clean energy and neighborhoods in the periphery of city Pittsburgh are in more demand for government support.
• Fuel shift in periphery could be an easier and good start, while government and related authorities could
take effort to help families living in the center access to rooftop solar energy
Future Work
Consider about the defects of this study, more detailed data should be collected to assess the energy burden areas and deeper relationship between all the factors mentioned is to be discovered. At the same time, the government should weigh the emergent areas and potential areas to decide the final target area to develop rooftop solar energy. Current policies should also be considered to make a well-developed master plan and phased development plan.