
11 minute read
Photo: Adobe Stock


Supply and demand drivers
Southeast Asia accounts for 80% of natural fatty acids and fatty alcohol production and the region is also a major consumer of oleochemicals Jackie Wong
Southeast Asia produces around 80% of the world’s natural fatty acids and fatty alcohols and these products usually track the prices of palm oil closely. Both markets face chronic overcapacity with new complexes expected to come on stream this year.
In terms of demand, China is the biggest consumer of fatty acids, taking some 30% of global output, while the Asia Pacific region consumes about 35% of world fatty alcohols production. Growth for both sectors is mostly driven by developing economies, chiefly in Southeast Asia and countries such as Indonesia and Thailand.
Glycerine demand to make hand sanitisers led to price rises in March-May last year
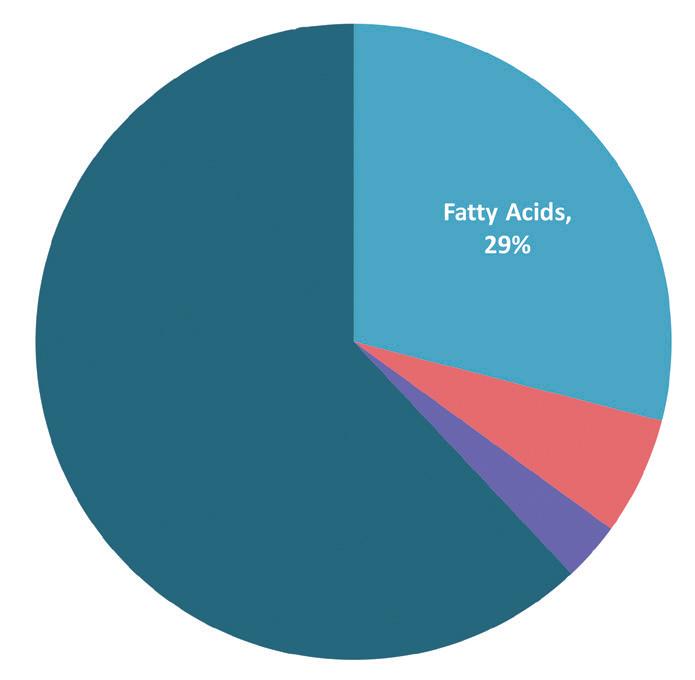
Looking at the demand segments for fatty acids and fatty alcohols, detergents, cleaners and soaps comprise the largest share. These account for about 48% of fatty acids demand and 55% of fatty alcohols demand (see Figure 1, below).
Fatty acids
In 2020, the fatty acids market came under pressure due to sluggish demand. In particular, demand for stearic acids was signficantly hit by the COVID-19 pandemic due to weak downstream sectors such as industrial lubricants and tyres.
In addition, the margins for short chain fatty acids which usually provide high value for producers have been corroded in recent years. This has put a lot of pressure on suppliers to secure better margins for their main products, such as C12 lauric acids.
In 2020, producers tried to offset the lack of demand and margin for stearic acids by increasing prices for palmitic acids. Slow demand was set to continue to put pressure on prices, with a second pandemic wave affecting end product sales and putting further pressure on fatty acid prices. Some new capacities expected to come on stream this year will also put supply pressure on the market.
However, firming palm oil prices and some recovery in sectors such as the automotive industry should help boost demand for fatty acids.
Fatty alcohols
Fatty alcohols fared better in 2020 because the majority of these go into the making of household and personal care products. In late March to early May 2020, the market saw a surge in demand for fatty alcohols as a result of the COVID pandemic leading to increased demand for sanitisation and hygiene products.
Demand for fatty alcohols was relatively stable for most of 2020, with some slowdown in the third quarter as end product sales were as good as early projections suggested.
Demand for C18 single cut alcohols also slowed later in 2020 due to a seasonal lull. C10 alcohols also gained some support in terms of pricing from stronger demand and tighter supply.
Going forward, fatty alcohol prices are expected to remain supported by tight feedstock supply and firm palm oil prices.

Source: ICIS
Palm oil prices
Palm oil is a major feedstock for fatty acids and fatty alcohols and 2020 was an atypical year for the crop.
Prices were firm, even in the peak harvest season of July to October, which should have seen production increase and pressure on prices. Instead, palm oil prices went on a general upward trend
CUT C8 caprylic acid C10 capric acid C12 lauric acid
C14 myristic acid C16 palmitic acid
C18 oleic acid C18 triple pressed stearic acid (TPSA)
C18 rubber grade stearic acid (RGSA) APPLICATIONS Lubricants, cosmetics, perfumes pesticides, disinfectants, fungicides Surfactants, cosmetics, personal care products, pharmaceuticals Surfactants, cosmetics, personal care Soaps, detergents, cosmetics, food animal feed Food, soaps, pharmaceuticals, emulsifiers Food, lubricants, metal working fluids personal care products, plastics, pharmaceuticals, rubber, surfactants Rubber, candles, cosmetics, soaps CUT C8-C10 alcohols
C12-14 alcohols
C16 alcohol
C18 alcohol
Figure 2: Applications of fatty acid and fatty alcohol cuts
APPLICATIONS Perfumes, lubricants, plasticisers, surfactants
Surfactants, food, cosmetics
Emulsifiers, cosmetics, thickening agents
Emulsifiers, cosmetics, thickening agents antioxidants
Source: ICIS
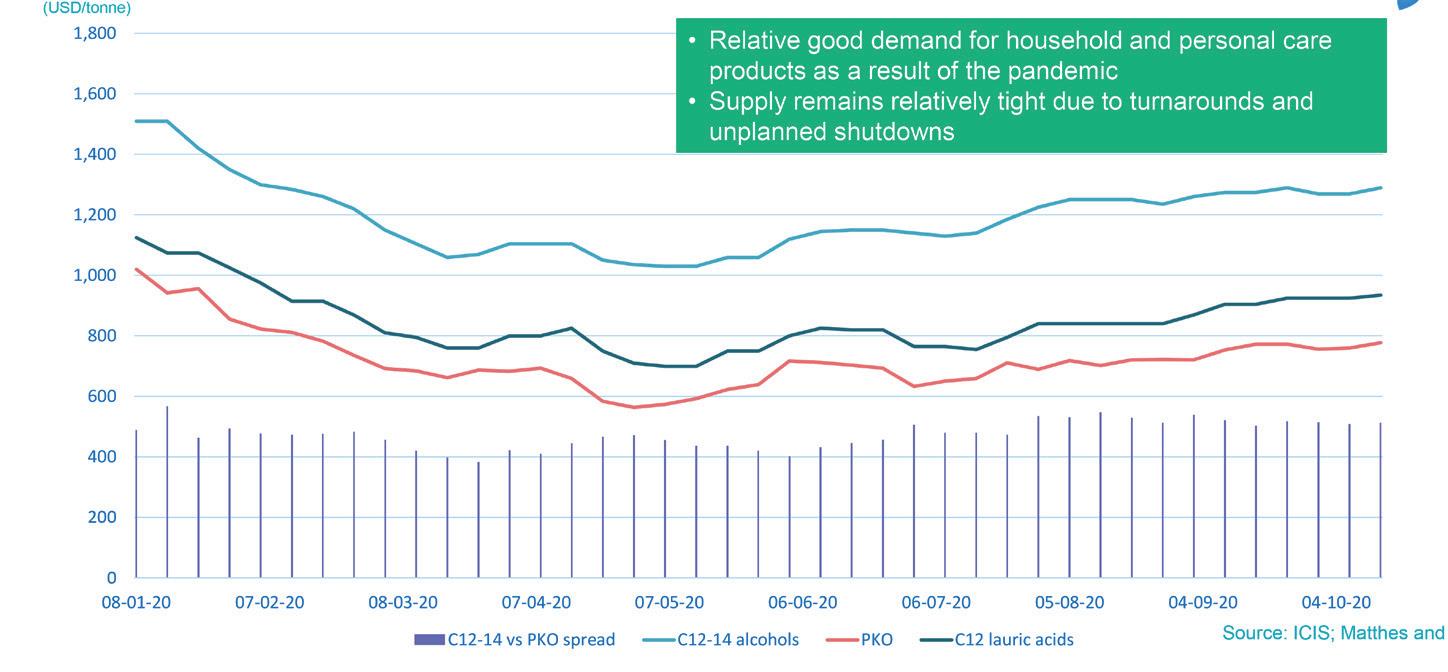
Figure 3: Spread between C12-14 alcohols and PKO prices (US$/tonne)
Source: ICIS, Matthes and Porton
Personal care, food and pharmaceuticals account for 47% of applications
Others 8%
Other Americas, 5%

Epichlorohydrin is the second largest segment 14% Pharmaceutical 9%

Propylene glycol 4%
Figure 4: Refined glycerine demand by application and region
China, 31% is the biggest consumer
Asia accounts for 47% of global demand
Source: ICIS - market sources
Biodiesel, 62%
Majority of glycerine supply comes from biodiesel sector
Fatty alcohols 6%
Soap 3%
u
Source: ICIS - market sources as production was affected by labour shortages due to COVID movement restrictions and adverse weather conditions resulting from the La Niña weather pattern.
Last year, the price spread between C12-C14 fatty alcohols and palm kernel oil (PKO) was healthy due to strong demand for personal care and household care products (see Figure 3, above). Supply remained relatively tight due to some planned and unplanned turarounds.
For C12 lauric acids, the spread stopped and skewed. A typical healthy range is US$150-200/tonne but across the year, the spread dipped below this healthy level at certain points.
Glycerine
Glycerine is a by-product of biodiesel and oleochemical production, which means that its supply and price are driven by the run rates of plants in these two sectors. Glycerine output is typically about 10% of the nameplate capacity of both processes.
Around 3.3M tonnes of glycerine is consumed annually and the biggest consumer is the Asia region, which accounts for around 47% of global demand (see Figure 4, below left). China alone accounts for 30% of world demand, which is expected to grow at a stable rate of 6%/year, although this figure may be lower in 2020 due to COVID slowdowns.
The majority of refined glycerine demand is from the food and pharmaceutical sectors, which accounted for 47% of demand. The next biggest sector is the epichlorohydrin (ECH) sector, at 14%.
The majority of global glycerine supply (62%) comes from the biodiesel sector (see Figure 5, below), followed by oleochemicals. In the oleochemical route, most glycerine is outputted as refined glycerine while, for the biodiesel sector, a fair amount is sold as crude glycerine.
From late March to May 2020, glycerine prices rose significantly due to buyers from the personal care sector wanting to secure feedstock to produce hand sanitiser.
In addition, the implementation of movement control measures in South Asia, Europe and Latin America meant biodiesel production and consumption was lower. From June onwards, however, glycerine prices started to soften due to the recovery of biodiesel production and technical grade glycerine users finding it harder to absorb increasing costs.
For example, a bottle of hand sanitiser usually contains 2-3% glycerine, while an ECH producer needs to use 1.2 tonnes of glycerine to produce one tonne of ECH. This means increased glycerine prices are much costlier for technical grade users.
ECH is traditionally produced from petrochemical feedstocks (propylene) but glycerine is slowly replacing propylene. The main application for ECH is epoxy resin, which is used in a wide variety of applications including paints, electronics, construction, composites and adhesives.
Good margins for ECH producers in China should see glycerine demand from the country remain strong.
In the long term, glycerine prices will face pressure from increased biodiesel production, due to aggressive blending mandates in countries such as Indonesia, Malaysia, Brazil and Thailand.
Glycerine output as a result of biodiesel production in Indonesia, Brazil and
Malaysia in 2019 was around 1.3M tonnes (see Figure 6, right). In 2020, their projected glycerine output was 1.75M tonnes, before COVID-19 struck.
In the future, if Indonesia moves to a B50 biodiesel blending mandate, its glycerine output would rise from 640,000 tonnes currently, to 1.7M tonnes. For Brazil, a move from B11 to B15 would increase glycerine production from 580,000 tonnes to 850,000 tonnes. While in Malaysia, a move from B10 to B30 would increase glycerine production from 76,000 tonnes to 125,000 tonnes.
In total, if all blending mandates were implemented, the output from these three countries alone would double glycerine output from 1.3M tonnes to 2.67M tonnes.
In the future, the glycerine market will face pressure from significant increases Figure 6: Effects of biodiesel mandates on glycerine output

in supply from these aggressive mandate plans. However, as a result of the COVID pandemic, it is uncertain when these plans will resume and how long it will take to reach their targets. ● Jackie Wong is senior editor at Independent Commodity Intelligence Services (ICIS). This article is based on a presentation he gave to the ICIS European & Asian Surfactants Virtual Conference on 10-11 November 2020
The pricing stories behind feedstocks
The pricing of products in the oleochemicals sector is complex and, at any time, there are factors that will push them up and pull them down, Martin Herrington, president, North America, IP Specialities, told the ICIS European & Asian Surfactants Virtual Conference last year.
“The price that is agreed is largely the result of stories that are told to each other,” he said.
Major feedstocks for oleochemical products are palm oil, lauric oils (palm kernel oil and coconut oil) and tallow.
Palm oil
The production life of an oil palm tree is over 20 years and palm oil production results in four main products – empty fruit bunches, sludge, palm oil and palm kernel oil (PKO). Several effects come into play when it comes to palm oil prices, according to Herrington. These include the yield of trees, which is weather dependent, such as in El Niño or La Niña years.
Then there is the effect of stock holding. “If producers don’t like the current price, they will store the oil and wait until prices are higher. However, if they have full tanks, then they must sell.”
The price of fuel is also a major factor. “Palm oil is a major feedstock for biodiesel and can be burned as heating oil. The price of fuel is a floor for palm oil prices, under which they will not fall.”
Lauric oils (C12-C14 chain length)
PKO is a by-product of the oil palm milling process.
“Producers plant for palm oil, not PKO,” Herrington said. “Therefore, prices for PKO are more volatile than for palm oil because if demand for PKO goes up, prices go up until somebody formulates out of it.”
Coconut oil is technically similar to PKO and its pricing should be similar. However, the price of coconut oil partly depends on its ‘story’. Herrington said that in 2017, when coconut oil was touted as a cure for various diseases and ailments, the price differential between coconut oil and PKO reached US$400-1,000. When there were negative health stories in 2018, coconut oil prices went down.
Tallow
Tallow is a by-product of beef processing. “It should be cheap unless it has more value than its primary product,” Herrington said. “However, low carbon fuel standards in California and the EU give more value to a by-product than the primary product because it has less CO2 emissions than the primary product.”
Looking back at 2020, tallow prices were high at the start of the year because biodiesel production was strong.
Then COVID-19 lockdowns hit, transportation was shut down, biodiesel production fell with less demand, and tallow prices slipped from US$0.36/pound to US$0.29/pound.
Some meat packing plants – which provided ideal conditions for spreading coronavirus – shut down, leading to a fall in tallow production. With a shortage of tallow, prices went up.
“However, animals were still being slaughtered and carcasses were still sitting around. So in June, prices of high grade tallow went up while low grade tallow fell through the floor to US$0.29/pound.”
Co-products and by-products
In the oleochemicals market, it is important to make the distinction between “products of assembly” and “products of ‘disassembly’”, Herrington said.
In products of assembly, the material cost is the sum of their ingredients. In products of ‘disassembly’, such as with oleochemicals, producers had to extract the parts they want and sell the other parts.
“For example, if you want steak, you need to kill the cow and sell the other cuts of meat, tallow and leather.
“If you want a tonne of C12-C14 fatty alcohol, you need 1.7 tonnes of PKO and 700kg of other material has to be sold. Your cost is 1.7 tonnes of PKO minus the by-product credits.”
Glycerine is widely used in multiple applications but it is only a by-product. “No one sets out to make glycerine and price signals have no effect.”
So when COVID hit last year and biodiesel production fell, so did the production of crude glycerine.
“At the same time, personal care and pharmaceutical demand was strong as glycerine is an ingredient in hand sanitiser. In a few weeks in March/April, the price of glycerine doubled. Then everyone had filled their tanks and prices came down in May/June. In some parts of the world, prices doubled and halved in the space of 10 weeks.”


