Progress Report IV: Testing and monitoring of an energy-efficient indirect evaporative
B1 Research Project
TITLE
HERE
Testing and monitoring of an energy efficient indirect evaporative CO2 refrigeration system at a Coles supermarket in Adelaide
Progress Report IV
RACE for Business
Research Theme B1: Transforming energy productivity through value chains
Progress report IV
Testing and monitoring of an energy efficient indirect evaporative CO2 refrigeration system at a Coles supermarket
October 2023
Citations
Lau, T., Bruno, F., Evans, M., Gilbert, R., J., Leak, J., Leonardis, C., Liddle, R., Taghipour, A., Rainey, T., Xing, K. (2023). Testing and monitoring of an energy efficient indirect evaporative CO2 refrigeration system at a Coles supermarket: Progress Report IV Prepared for RACE for 2030 CRC.
Project team
UniSA
• Dr Timothy Lau (TL)
• A/Prof Ke Xing (KX)
• Dr Michael Evans (ME)
• Prof Frank Bruno (FB)
• Mr Raymond Liddle (RL)
QUT
• A/Prof Thomas Rainey (TR)
• Dr Alireza Taghipour (AT)
Seeley International
• Mr Rob Gilbert (RG)
• Mr Clint Leonardis (CL)
Australian Alliance for Energy Productivity (A2EP)
• Mr Jarrod Leak (JL)
Project partners
Acknowledgement of Country
The authors of this report would like to respectfully acknowledge the Traditional Owners of the ancestral lands throughout Australia and their connection to land, sea and community We recognise their continuing connection to the land, waters and culture and pay our respects to them, their cultures and to their Elders past, present, and emerging.
What is RACE for 2030?
RACE for 2030 CRC is a 10-year cooperative research centre with AUD350 million of resources to fund research towards a reliable, affordable, and clean energy future. https://racefor2030.com.au
Disclaimer
The authors have used all due care and skill to ensure the material is accurate as at the date of this report. The authors do not accept any responsibility for any loss that may arise by anyone relying upon its contents.
Executive Summary
This report outlines the key progress made in the project titled “Testing and monitoring of an energy efficient indirect evaporative CO2 refrigeration system at a Coles supermarket” for theme B1 of the RACE for 2030 CRC since the previous progress report 8 months ago Much of the progress made during this time has focussed on the construction of the DP-CO2 refrigeration system, the fit-out of the monitoring system, the installation of the DP-CO2 system at the Coles supermarket in Norwood, South Australia, and the commissioning of the system.
The construction of the DP-CO2 system began late 2022 with the delivery of 12 dew point coolers (produced by Seeley International) to the original equipment manufacturer’s (OEM) workshop at Cavan, South Australia As these dew point coolers were “off-the-shelf” products that were designed primarily for space cooling (i.e. air conditioning) applications, these units were modified by the OEM to suit the DP-CO2 system. At the same time, the sensors for the monitoring system were installed onto the DP-CO2 system. Construction was completed in December, 2022.
The DP-CO2 units were delivered to the Coles site on the 9th of January 2023. The on-site pipework and electrical connections were performed between January and March 2023 The electrical connection to the SAPN network was completed on the 17th of April Following this, an intensive commissioning program was carried out to test instrumentation, sensors, fan flow systems, water distribution systems, control systems and the performance of the dew point cooler prior to the CO2 system being energised The CO2 system was activated on the 3rd of May 2023, after which the integration of the CO2 refrigeration system, the dew point coolers, and Coles’ Building Management System (BMS) was conducted. During this time, testing of the data from the monitoring system was conducted.
The Coles store opened its doors to the public on the 21st of June, 2023. Data from the monitoring system, comprising of 113 sensors recording data at 10 second intervals, are currently being recorded and saved to a secure server.
Nomenclature
List of symbols
ε heat exchanger effectiveness
ρ fluid density, kg/m3
Cp specific heat capacity, kJ/(kgK)
Subscripts
ANCIL ancillary
COMP compressor
C condenser
pb dry bulb
dp dew point
EXH exhaust
EV evaporator in entering, in, inlet
LT low temperature
MT medium temperature out leaving, out, outlet
TOT total
List of abbreviations
CO2, R744 Carbon dioxide refrigerant
ATD approach temperature difference
COP coefficient of performance
DB dry bulb
DP dew point
DPC dew point cooler/cooling (see context)
DP-CO2 Dew point- CO2 system
FG flash gas
HVAC Heating, ventilation and air conditioning
HP high pressure
HTF heat transfer fluid
IHX internal heat exchanger
LT low temperature
MT medium temperature
PLC Program Logic controller
PID Proportional Integral Differential
SST saturation suction temperature
WB wet bulb
1 Introduction
Despite recent advances, the HVAC-R sector remains a highly energy-intensive sector. Heating, ventilation and air conditioning (HVAC) contributes significantly to business energy use and operating costs, typically consuming the largest proportion of energy in commercial buildings In a commercial building, HVAC electricity consumption can typically account for around 40 per cent of total building consumption and around 70 per cent of base building electricity consumption (Lecamwasam et al., 2012).
As of 2017, HVAC-R systems account for 61,000 GWh (23.6%) of Australia's annual electricity production, with cooling alone contributing to 58.7 Mt CO2-eq (11.5%) of Australia's total greenhouse gas emissions (Brodribb and McCann, 2018). HVAC-R systems are also a major contributor to peak energy demand, and therefore directly contribute to Australia’s already high network operating costs.
The RACE for 2030 B1 Opportunity Assessment (OA) (Denham et al., 2021) has identified Australian’s food cold chain, which is estimated to consume 19,600 GWh of electricity per annum, as a sector with significant potential for improved energy productivity. The OA estimated that a 30% reduction in energy consumption can be realised through the use of high-performance refrigeration systems and recommended a demonstration project as a high priority.
This project therefore aims to monitor and validate the performance of a new-generation indirect evaporative (or dew point) CO2 (DP-CO2) refrigeration system in a Coles supermarket. Coles operates more than 1,500 outlets across Australia and is Australia’s 12th largest electricity user (annual usage at 1.61 billion kWh of electricity) The DP-CO2 has already been shown to reduce peak demand by 24% and average annual energy consumption by 16%, relative to conventional CO2 systems, under lab-scale conditions relevant to Australia’s challenging climate (Belusko et al., 2019).
While the performance of the DP-CO2 has already been demonstrated at lab-scale, it has yet to be confirmed at larger, commercial scale conditions These conditions may differ from those at lab-scale, which may in turn impact the performance of the system For example, in real-world conditions the internal load profile (i.e., the amount of people within the store) and the operational strategies employed may be different to smaller scale systems As such, this project aims to monitor the performance of the novel DP-CO2 system on site under large scale, commercial, real-world conditions.
1.1 Project aims
The aim of this project is to model, monitor and validate the performance of a new-generation indirect evaporative (or dew point) CO2 (DP-CO2) refrigeration system at scale, providing direct evidence of the efficacy and viability of the technology under real-world conditions.
In particular, this project will:
1. continuously monitor the performance of the DP-CO2 system in a Coles supermarket across at least one full operational year;
2. Develop a model to reliably estimate the reduction in energy consumption, running costs and CO2 emissions that can be realised under a range of operating conditions and climates;
3. Provide recommendations to optimise the operation and control of DP-CO2 systems;
4. Demonstrate the viability and efficacy of the DP-CO2 system in Australian conditions and commercial supermarket loads.
1.2 Current status
This project was originally scheduled to be completed by December 2023. However, due to delay in the opening date of the Coles supermarket, which officially opened on the 21 June 2023 (see Figure 1), which in turn affected the date in which the monitoring could begin, the project has been delayed to a new estimated end date of September 2024. The project team have negotiated a project variation in collaboration with RACE to a new end date of 27 September 2024
Other than this delay, the project is currently on schedule. The DP-CO2 system, including the embedded monitoring system, has been fully designed, installed and commissioned at the Coles site in Norwood, South Australia. All sensors have been checked, and data from the monitoring system is currently being recorded. Additionally, the model of the DP-CO2 system is currently in the mature stages of development, with the model validation ready to begin once sufficient data from the monitoring system (particularly during summer months where the DP-CO2 system will be fully loaded) can begin.
The project team is also currently applying the model to a range of other sectors other than supermarkets. In particular, the model will be applied to site data been obtained from the meat processing sector, the healthcare sector and from breweries to determine the potential efficacy of the DP-CO2 within these sectors. This analysis has only recently begun and will be the subject of a future progress report.
Figure 1 Coles, Norwood and Vintage Cellars store fronts
1.3 Report layout
This report is the fourth in a series of documents which report the progress of the project thus far. This report will primarily focus on the construction, installation and commission of the DP-CO2 system to the Coles site. In particular, this report comprises of:
1. An overview of the construction of the DP-CO2 units and the monitoring system (Section 2)
2. The commissioning of the system (Section 3)
Note that a background of the DP-CO2 refrigeration system has previously been provided in Milestone Report II (Lau et al., 2022)
2 DP-CO2 Module construction
2.1 Introduction
A significant proportion of the work conducted in the past 8 months focussed on the construction and commissioning of the DP-CO2 refrigeration units and the monitoring system.
Three DP-CO2 units were constructed by the original equipment manufacturer (OEM) at their workshop in Cavan, SA. These units were comprised of 4 main components, namely;
• 12 x Seeley International dew point coolers
• Modine gas coolers / condensers
• Framing
• Plumbing/ water storage tank
Seeley International supplied stripped out versions of their dew point coolers to the OEM where they were modified to the OEM specifications to minimise space usage and pressure drop as required for this specific configuration In particular, Seeley’s dew point coolers, which were primarily designed for air-conditioning systems, were modified to allow the cool supply air from the dew point coolers to be re-directed to the gas coolers of the CO2 refrigeration system This work was completed in the second half of 2022.
Images of the assembled DP-CO2 units are shown in Figure 2 below.
2.2 Sub section assembly
The initial timeline for the installation of the DP-CO2 units was short. The sub assembly of the system was done in parallel to reduce the construction time as much as possible. The dew point coolers were placed on the sub
Figure 2 Three DP-CO2 modules ready for transportation to the Coles store
frames before the gas cooler coils and water sumps were fitted. Transition sheet metal was fabricated to allow the supply air from the dew point coolers to be redirected to the gas cooler coils.
An image of the DP-CO2 sub-assemblies during construction is shown in Figure 3 below.
2.3 Module assembly
An articulated crane was used to lift the top assemblies onto the bottom assemblies using dedicated lifting points (Figure 4). Once completed, final fit out of the units commenced and all plumbing, electrical and vanity cladding was installed (Figure 5 & Figure 6)
Figure 3 DP -CO 2 sub -assemblies during construction
Figure 4 Lifting of the top sub assembly onto the bottom sub assembly
Figure 5 Completed modules with vanity panels and transition cover r emoved
Figure 6 Completed modules with vanity panels installed
2.4 Assembly of monitoring system
The final assembly of the DP-CO2 monitoring system did not vary greatly from the system proposed in Progress Report II (Lau et al., 2022). While three identical DP-CO2 units were constructed for Coles (labelled units A, B and C, respectively), only one unit (Unit A) was fully fitted with sensors. This was done to be cost effective, given that all three units were identical and that redundancy in the sensors was not required in this instance.
Unit A was installed with a series of power, water usage, temperature and pressure sensors to allow researchers in-depth measurements of the performance of the system. Units B and C were installed with minimal instrumentation to allow the system to be adequately controlled and to ensure consistent operation between the three modules.
Further details of the full design of the DP-CO2 monitoring system are provided in Progress Report II (Lau et al., 2022), and is thus not repeated here for brevity. A piping and instrumentation diagram of the complete asbuilt DP-CO2 system including the monitoring points is shown in Appendix A A schedule of the as-built monitoring instruments and sensors is summarised in Appendix B
2.5 Sensor locations on the dew point coolers
Figure 7 illustrates the locations of the air temperature probes and differential pressure sensors on Unit A. While Unit B and C were fitted with temperature sensors to measure the supply air and gas cooler CO2 outlet temperatures, Unit A is used to investigate, in detail, the performance of the dew point coolers. Air temperatures are recorded for both the bottom and the top assemblies of Unit A. The flow diagram as displayed on the top unit of Figure 7 shows the location of the temperature sensors in relation to the main components in the module while the flow diagram on the bottom module shows the location of the pressure sensors. Table 1 & Table 2 summarise the process measurements that can be obtained using these sensors. Air velocity meters in the transition piece will be used in conjunction with these sensors to calculate the heat capacity of each process.
Figure 7 Location of temperature and pressure sensors on Unit A
Table 1 Measurement derived from the temperature sensors
Temperature sensors Process measured
1 → 2
2 → 3
3 → 4
2 → 5
1 → 3
Temperature difference across the “dry” side of the indirect evaporative pad
Temperature difference across the direct evaporative pad
Temperature difference across the gas cooler coil
Temperature difference across the “wet” side of the indirect evaporative pad to the exhaust
Total temperature difference between the ambient air and supply air
Table 2 Measurement derived from the differential pressure sensors
Pressure sensors Differential pressure measured
1 Filter pressure drop
1 → 2
2 → 3
3 → 4
4 → 5
Fan differential pressure
Pressure drop across the indirect evaporate pad
Pressure drop across the direct evaporate pad
Pressure drop across the gas cooler
It should also be noted that the measurements taken from Unit A also allows researchers to analyse the performance of Seeley’s dew point coolers independently from the CO2 refrigeration system, which in turn will provide further useful information to optimise the design and implementation of these systems.
Figure 8 to Figure 11 show the final installation positions of the sensors installed on Unit A. These sensors were installed by UniSA staff, and the wiring of the sensors was performed by a third party contractor (Electrical Solutions)
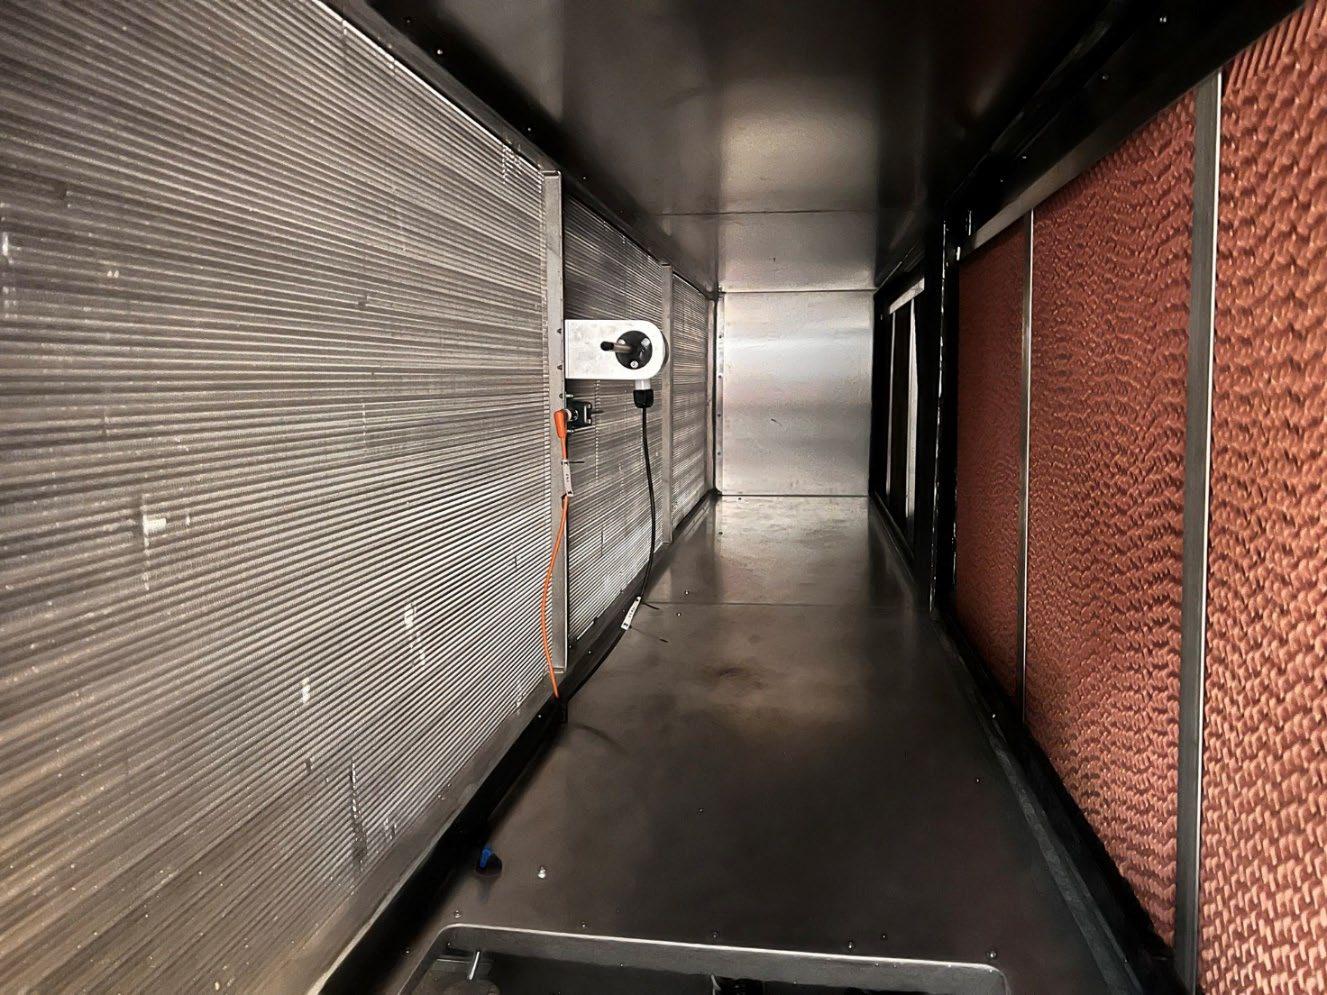
Figure 8 Supply air velocity, temperature and pressure sensors
Figure 9 Ambient air temperature and relative humidity sensor Pressure sensor
Humidity sensor
Ambient air temperature sensor
Access to water sump
Differential pressure sensors
Make up water flow sensor
Tank water level
Figure 10 Water sump valves, access point and differential pressure sensor location
Figure 11 Evaporate pad wetting pumps and tank level sensors/ switches
sensor
Tank level switches
Evaporative pad wetting pumps
Sump fill/ drain valves
2.6 Sensor locations on the CO2 Rack
For this installation, the CO2 refrigeration rack was supplied by third party supplier SCM. The rack, shown in its installed form in Figure 12, is controlled by a Danfoss pack controller. The Danfoss pack controllers are a great option for control for supermarkets as they are specifically designed for this type of refrigeration application. While it is beneficial to use these controllers as they are cheaper and designed to integrate the typical applications and systems present in a supermarket CO2 system, they are not designed for atypical configurations, such as the use of the DP-CO2 systems. In particular, the pack controller does not provide sufficient data for the compressors for detailed data analysis. To ensure there is enough detail in the monitoring of the complete system, researchers have added additional pressure (Figure 13) and temperature (Figure 14) sensors to critical parts of the refrigeration rack.
Figure 12 The CO2 Rack, together with electrical box, PLC and HMI attached. These are located in the main plant room
Figure 13 IFM pressure sensor mounted to SCM pressure manifold
Figure 14 High pressure expansion valve CO 2 temperature sensor and IFM converter module
The overall performance of the system and the effect of the dew point coolers on the system can be established from the monitoring data specified above. In addition to the pressure and temperature sensors installed on the rack, several 0-10V channels on the pack controller were dedicated to outputting data to the PLC for monitoring and control purposes. Furthermore, an additional Dent power meter was also installed to provide accurate power data for each of the 10 compressors in the system (Figure 15).
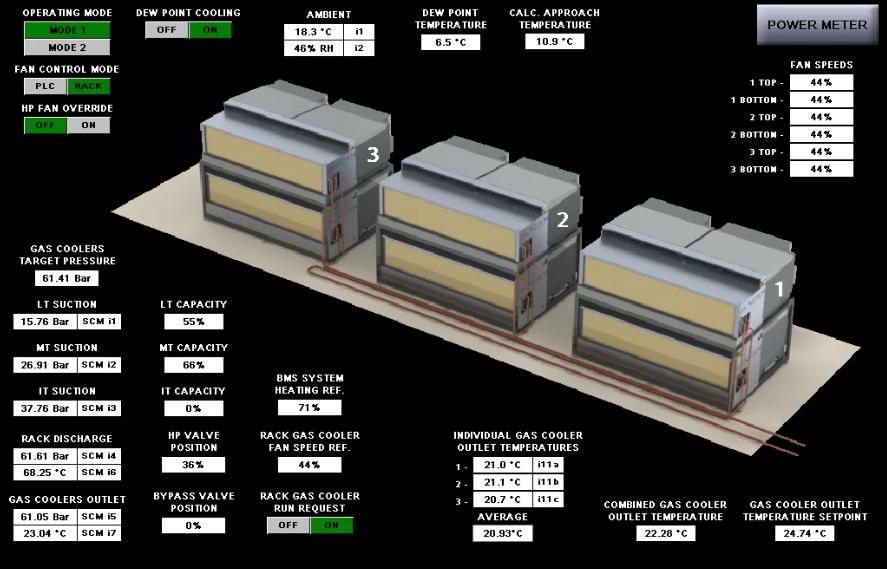
The results from the entire monitoring system, which includes all 113 sensors from the DP-CO2 system, including the compressor rack and power meters, are exported continuously to the graphical-based dashboard, as shown in Figure 16. This data is typically “live”, i.e., it is typically updated every 10 seconds. Furthermore, all data is recorded locally and then uploaded to a password-protected cloud server weekly, enabling researchers to access the data remotely.
2.7 Delivery to site
The three DP-CO2 modules were loaded onto a truck at the manufacturer's workshop of the 9th of January, 2023 (Figure 17) The loading was performed by an articulated crane The modules were moved outside before being lifted onto the bed of the truck.
Figure 15 Electrical board- Electrical breakers, PLC and DENT power meter
Figure 16 Snapshot of live feed from the Scada homepage
The platform for locating the DP-CO2 modules at Coles, Norwood is located on the first floor. A crane was needed to lift the DP-CO2 modules from the truck to the designated area on the first floor. Each module was raised separately using the dedicated hoisting points and placed into position. The lift was performed by GM Cranes under the direct supervision of Control Air (Figure 18).
Figure 18 DP -CO 2 m odules being lifted from the transport truck (left) Second DP -CO 2 module being lowered into place (right)
3 SiteCommissioning
As the DP-CO2 units that were installed at Coles, Norwood were the first of their generation, there were a number of additional commissioning steps required to ensure the correct operation of the refrigeration system and the monitoring sensors The final electrical installation on site, together with the programming of the Programmable Logic Controller (PLC), which was used to log the data, was conducted by electrical contractors Electric Solutions During this stage, UniSA and the OEM's staff checked the operation of the individual sensors to ensure correct scaling and operation.
3.1 Pre commissioning
UniSA researchers, together with the OEM's commissioning staff, verified the sensor installations and operation prior to the system being delivered to site. A pre commissioning checklist was then completed where the basic operational functions of the DP-CO2 modules were checked In particular, checks were carried out on the performance and operation of:
• Fan control and fan actuation
The fans which drive the flow through the dew point coolers, and eventually on to the gas coolers, can be controlled depending on the refrigeration load and the ambient conditions. Checks were performed to ensure that these fans were controlled appropriately by the PLC. The performance of the fans was analysed in relation to power consumption, air flow and pressure drop.
• Exhaust louver control and actuation
Air vent louvers are located on the exhaust port of the dew point coolers. These louvers close when the dew point cooling is not required and allow 100% of the air flow from the fans to pass through the gas coolers, i.e., bypassing the evaporative pads (thereby reducing pressure drop and improving efficiency). Checks were performed to ensure the end stop positions of the louvers and the automated open/ close movements aligned with the control settings.
• Water fill and drain valve operation
Water into and out of the water storage sump for the evaporative pads is automatically controlled by a fill valve and drain valve. The operation of these valves was checked.
• Water High/ low level switches levels and operation
High- and low-level float switches were installed in the water sumps to control the fill and drain valves. The position and the function of these valves was checked. The volume of water required to activate these switches was also recorded.
• Gas cooler high pressure switch
As a safety measure, there is a high-pressure switch within the CO2 plumbing to the gas coolers. This switch monitors the pressure in the gas coolers. If the pressure in the gas cooler increases above the maximum allowable limit the switch is activated. The switch sends an override signal to the fans to operate at a set flow rate (high flow rate). This should only occur if there is a control issue with the dew point coolers. The correct settings and the operation of this switch was checked.
• Operational control of the PLC functions
Checks were conducted to ensure that the intended actions programmed into the PLC were able to be performed as expected i.e., valves opened when an open signal is sent and fans ran at the correct speed for a given input signal.
• Pump operation
The pad wetting pumps deliver water from the water sump to the top of the pads. The operation and performance of the pads were checked. The volume flow rate of water to the pads was confirmed.
• Air flow distribution
The air flow distribution between the dry and wet sides of the indirect evaporative cooler is critical to the overall performance of the system. The differential pressure at each stage of the process was monitored and correct air flow distribution confirmed.
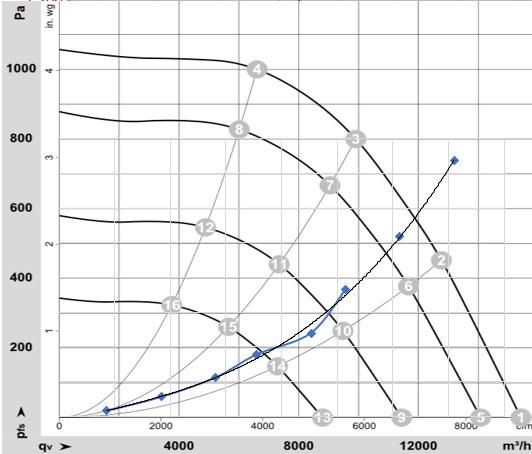
3.1.1 Fan speed/ airflow vs power consumption
Researchers have found that there is an inverse relationship between the fan power consumption and the compressor power consumption for these systems (Belusko et al., 2019). Typically, the faster the fans operate, the more cooling performed by the gas coolers and the lower the compressor discharge pressure and hence lower compressor power. That is, the higher the fan power the lower the compressor power. Therefore, for any given system there is an optimal operating range whereby the total energy (i.e. the sum of the compressor and fan powers) are minimised. This concept is illustrated in Figure 19, which shows that there is an optimal approach temperature (difference between gas cooler and ambient temperature) at which the sum of the compressor and fan power is minimised. To determine the optimal operating point, the air flow rate and power consumption of the fans was measured for varying fan speed in both dew point cooling mode and ventilation mode. The measure fan operating pressure and flow rate is shown in Figure 20. These measurements will be used in conjunction with the monitoring data to further optimise the control of the fans and compressors to minimise total power consumption.
3.1.2 Water fill rates, comparison between Unit A, B and C
Unit A has a separate water flow meter attached to the make-up water line. The volume of water required, the water level in the tank, and the time required to fill the tank was recorded. The time taken for all three sumps to fill to the high-level switch (Figure 21 and Figure 22) was also recorded ensuring consistency across the three units.
3.1.3 Water distribution to evaporative pad balance and pad wetting
The water distribution system for the DP-CO2 units is bespoke, designed specifically for this application. As a result, plumbing to the direct and indirect evaporative pads has been modified from the original Seeley international design. Multiple evaporative pads (see Figure 23) share a single feed from their respective pumps. To ensure an even distribution of water to each pad, valving has been installed. These valves were calibrated during the commissioning process. Valve were set to ensure equal flow rates to each pad. The transition piece covers were removed to ensure the correct flow rate of water to each pad. Checks for water carryover or insufficient/ uneven pad wetting were completed.
Figure 21 Sump water low / high level water switches
Figure 22 Dew point cooler drain ports into the water sump initial high level
3.1.4 Dew point cooler effectiveness
Significant changes to the design of the supply air portion of the dew point coolers were made during the adaptation of the gas cooler coils to the dew point coolers. It was necessary to confirm the performance of the dew point coolers as they could potentially change the balance of air diverted to the wet channel of the indirect evaporative pads and therefore efficiency. Since commissioning occurred during the during June in Adelaide (when the weather is typically relatively cold), there was not a chance to perform this test with high temperature ambient conditions. This cold weather testing proved that the supply air temperature was able to match the theoretical supply air temperature as used in the design on the model. The current results from the monitoring system show that the air supply temperatures closely match the ambient dry bulb temperature, consistent with expectation. When the dew point cooling mode is activated, all air supply temperatures approach the modelled temperatures, which is also consistent with expectation A further commissioning test has been recommended for October/ November when warmer weather can be expected.
3.2 Live commissioning
Integration of the DP-CO2 system with the refrigeration rack was conducted once the refrigeration pipework was charged with CO2 (i.e. the refrigerant) The Danfoss controller that was supplied with the refrigeration rack was not designed to accommodate the use of dew point cooled gas coolers. As a result, the PLC integrated into the DP-CO2 units needs to be able to operate in a manner that integrates with the operation of the refrigeration unit. While typical gas cooler/ condensers can operate in a simplified mode, the dew point coolers need to operate in a variety of modes depending on the ambient conditions and the operation (in
Figure 23 Direct evaporative pads during pad wetting / water distribution setting, inspection, and commissioning
particular, the demand) of the refrigeration system. As the refrigeration rack controller does not accommodate this, additional coding and calibrations of the DP-CO2 controller were conducted by UniSA and the manufacturer
The commissioning team also completed several activities to ensure the integration of the dew point cooling system and the CO2 system. Major tasks in this list included:
• Gas cooler outlet approach temperature set point optimisation
The gas cooler outlet approach temperature is the difference between the supply air temperature and the temperature of the CO2 leaving the gas coolers. Researchers conducted tests to measure the total system COP while modifying the approach temperature. Based on these tests, a control strategy has been developed for the DP-CO2 system which, theoretically, minimises the total power consumption of the compressors and fans However, more analysis will be conducted using the monitoring data (particularly using data from the warmer months) to further optimise the control system)
• Fan PID control
The PID control of the fan determines how quickly the fan control changes due to a change in the gas cooler outlet approach temperature. A study was performed to determine the transient effects of slow and fast control on both the overall efficiency and the stability of the system.
• Automated mode change procedures
The dew point cooler PLC evaluates the ambient condition to determine when to instigate the dew point cooling. When the dew point cooling commences, there is an automated process to fill the water sump, wet the evaporative pads, and open the exhaust port louvers. The process was performed to ensure a smooth transition and that the process happened in such a manner that the refrigeration system could accommodate the change in conditions supplied by the gas coolers.
• Automated safety procedure and setpoint
There are safety features that are inbuilt into the pack controller that cannot be easily communicated to the DP-CO2 PLC. For example, during an event where the receiver pressure is too high, the pack controller would usually increase the condenser fan speed signal. There is no digital signal to show this safety feature is influencing the operation and the PLC cannot readily detect that the fan speed signal has changed because of this safety feature. The PLC programmer included code in the PLC to mimic this operation based on an independent pressure sensor on the receiver. The commissioning team checked the operation of this feature.
3.2.1 Commissioning troubleshooting and resolutions
The integration of the DP-CO2 units was a more involved than anticipated. The DP-CO2 system requires a more complex control than other condenser/ gas cooler installations. Typically, a simple fan speed control is all that is required to control the gas cooler. However, DP-CO2 systems need to control fans, pumps, louvers, and valves based on ambient conditions and system operating parameters. The design philosophy of the pack controller used on the CO2 refrigeration system is based around a simplified and integrated structure. The pack controller gathers input data from its sensors, internally performs calculations and provides output signals for control. While the integrated approach of the pack controller is cost effective works well for standard systems, it does not have the flexibility to control non-standard equipment. An augmented control was required for the DP-CO2 units.
For this demonstration project, it was decided that the DP-CO2 system would have its own PLC control, sensors and logic operate largely independently to the pack controller. The pack controller also does not have a networking protocol to share operating parameters. A limited number of 0-10V signal channels were provided to aid the synchronisation of the PLC and pack controller controls. Figure 24 shows the inputs, outputs and shared data structure of the refrigeration pack controller and the DP-CO2 PLC. Note that there is limited communications between the two systems. Detailed algorithms for the operation of the dew point coolers were created and calibrated to ensure coherence between the two systems.
In a transcritical CO2 system, the compressors, expansion valves, high-pressure expansion valve, flash gas bypass, gas coolers, internal heat exchanger, gas cooler bypass valve and gas cooler fans need to work together to ensure coherent operation. If any of these components do not operate in conjunction with the others, the quality of and level of liquid in the receiver will be compromised. Intermittent and/or low performance can be expected. Figure 25 provides an example of the system operating in cyclic fashion. The fan speed and high pressure valve control were not synced and resulted in non-steady state operation.
Figure 24 Refrigeration Pack controller and DP -CO 2 PLC data tree and operational relationship
The detailed instrumentation installed by researchers for this project was vital in the understanding of the pack controller algorithms and control Researchers were able to characterise the control of each of the components and develop control within the DP-CO2 controller to ensure correct operation. It was also necessary to request several setpoints within the pack controller be set to the manufacturer's specifications and fixed. These setpoints were specific to the control of:
• PID control speeds for refrigerant control valves and compressor ramp rates
The initial operation of the system was very unsteady. This can partly be attributed to the fact that the store was empty during the early stages of commissioning. Without products on the shelves and in the fridges, there was little load and thermal mass. This resulted in the load on the refrigeration system continuing to vary. Once filled with product, the system did settle down, however, cyclic control could still be seen on many of the controls. In an effort to rectify this commissioning engineers decreased the rate at which the PID controls for fan, valves and compressor acted.
• Temperature sensor calibrations
The temperature sensors used on the refrigeration unit do not self-compensate for long distance wiring. It was found that these sensors required calibration. The calibration was performed against the DP-CO2 unit sensors which are of a high quality. The calibration against these sensors also ensured alignment between the two systems.
• HP valve OP limits & Gas cooler bypass OP limits
It was found that during cold conditions, liquid was being collected after the gas coolers. It is believed that this is as a result of the opening positions of the high-pressure expansion valve and the gas cooler bypass vale. In an effort to reduce this phenomenon, a minimum HP valve closed percentage and a maximum gas cooler bypass valve opening were utilised
Figure 25 Fan speed, compressors, and high pressure (HP) valve not in synchronisation resulting in cyclic operation
Physical changes that were required for the smooth operation of the gas coolers pivoted around the position of the supply air temperature and gas cooler CO2 outlet temperature probe positions.
• In typical installations, the supply air temperature is the ambient air condition and can therefore be measured in a shaded position in the airflow before the gas cooler. In the DP-CO2 system, the supply air temperature can vary significantly as it goes through the dew point cooler. The supply air temperature probe needs to be installed within the transition chamber between the dew point cooler and the gas cooler. During initial operation, it was discovered that the position of this probe is very sensitive Sensors were placed too close to the gas cooler will lead to high measurement when fan speed is low. High measurements from this sensor have an effect of increasing the gas cooler outlet setpoint which in turn lowers fan speed, further increasing the setpoint. This leads to an erratic system during low temperature operation. This was alleviated by varying the sensor placement and choosing the placement which provided most accurate and stable results.
• A study into the optimal positioning of the gas cooler outlet temperature probe was required. The optimal placement of this sensor was not trivial, as there is a significant distance between the three gas cooler outlets, and furthermore, there was also space constraints given that the gas coolers were installed on the same level as the CO2 rack. Initial test showed poor control of the gas cooler fans as a result of a number of factors, including:
o the time delay between temperature changes and fan speed changes,
o flow mixing between the three gas coolers,
o probe reading calibration,
o probe location,
o high pressure expansion valve control &
o system wide PID settings.
Researchers investigated the relationship between the individual gas cooler outlet temperatures, the combined gas cooler outlet temperature, the temperature, and pressure at the high-pressure expansion valve and PID settings. Final results saw the use of the maximum of the three gas cooler outlet temperatures being used to control the gas cooler fan speed and the combined gas cooler outlet temperature being used to control the high-pressure expansion valve operation. PID settings were changed to provide a slower, steadier control.
3.3 Store opening
The Coles Norwood store opening occurred on the 21st of June, 2023 Representatives from UniSA, Coles, subcontractor City Holdings, the manufacturer, the South Australian Government (Steven Marshall) and the Minister for Trade and Investment (Nick Champion) were all in attendance (Figure 26 to Figure 28) The store and the DP-CO2 system have been operational since then. In total, there are 113 parameters that are being recorded by the DP-CO2 PLC. This data will lead to a greater understanding of the operation of a modern day trans-critical CO2 refrigeration system installed in an Australian climate and the real-life performance of this system integrated with high efficiency DP-CO2 condensers.
Figure 26 DP -CO 2 modules and condenser deck from the ground level carpark
Figure 27 DP -CO 2 modules installed and commissioned on the morning of the store opening
Figure 28 Ribbon cutting at store opening
4 The 4 th Industry Reference Group m eeting
The 4th Industry Reference Group (IRG) meeting was held on the 23rd of August, 2023. In attendance were representatives from the Australian Institute of Refrigeration, Air-conditioning and Heating (AIRAH), Health Infrastructure NSW, the Refrigerated Warehouse & Transport Association of Australia (RWTA), the Australian Meat Processing Corporation (AMPC) and Dairy Australia, together with the theme manager for RACE for 2030 Business and the project team.
As shown in Table 3 the agenda of the meeting covered several topics, with the main presentation comprising of a discussion of the commissioning of the DP-CO2 system at the Coles site, together with a presentation of the current operation of the monitoring system, including the data collection interface. The discussion also had ample time for interaction with the IRG members, including a Q&A session.
Table 3 Agenda for the 4 th IRG m eeting held on the 23rd of August 2023
1. Welcome and Project Status
2. Project Team Presentations
a. Commissioning of the DP-CO2 System at the Coles site
b. Current Operation of the Monitoring System
c.Q&A
3. Next Steps – Engagement & Dissemination
a.Potential Coles Site Visit and Virtual Tour
b.Industry Webinar
4. Close
The presentation on the DP-CO2 system commissioning focussed on a number of aspects, including:
• An introduction to the Coles store in Norwood, SA
• The design specifications of the refrigeration system
• Construction and assembly of the DP-CO2 systems
• As-built design and assembly of the monitoring system
• Transportation of the assemble system to site
• Testing and commissioning of the entire DP-CO2 system, including the monitoring system
• The interface of the installed monitoring system
• The opening of the store
After the presentation, the session was open to questions from the audience. The questions and responses, together with action items arising from the discussion are summarised in Table 4
The meeting agenda also included a brief discussion on the next steps with regards to some of the potential knowledge sharing and industry engagement activities that are currently being planned or proposed as part of the project. Topics discussed included:
• An update on the current marketing and communications activities, including online news articles regarding the project through HVAC-R news (part of AIRAH) and Hughes Publishing
• The potential hybrid site visit and virtual 3D scan of the plantroom (subject to Coles’ approval)
• The proposed industry webinar for 2024
• Plans for publications, including scientific journal articles and trade magazines
A discussion ensued with regard to other ideas for industry engagement and knowledge dissemination.
Table 4 Summary of questions, answers and discussions from IRG #4 . Note that these questions and answers are not direct quotes, but are paraphrased from the transcripts
Questions
Are the outcomes looking like you predicted (from the model)?
Do you have a sense of what sort of cost savings associated with there's initial the energy saving predicted by the manufacturer?
Answers
Yes, the model was found to accurately predict the refrigeration system when it is operation under conventional (non-dew point) mode. However, the outcomes of the dew point cooler sub-model has not been tested against the data, because we do not yet have data for the warmer months (when the dew point cooler will begin to operate)
We have predicted annual energy savings of 16% and a predicted peak load savings of 24% which was obtained through lab testing. However, this lab testing was done under very specific conditions, and we do not know how this will scale depending on conditions and applications. It is part of this project to develop a general tool that can be applied to a range of conditions and climates.
We also do not have full data in which to provide more confident predictions on energy savings, because the Coles systems has not yet been operating during warmer months. We should have better predictions after summer.
Note that we also do not predict actual cost savings, as we cannot predict electricity prices. All we can do is provide an estimate of energy savings, which then has to be used to calculate cost savings given the price of electricity for your organisation.
Further Action / Response
UniSA will compare the performance of the dew point cooler model once data for warmer conditions becomes available.
The 16% energy savings quoted above, what system is that relative to?
Has there been a review of capital cost?
The 16% energy savings is relative to an adiabatic, parallel compression CO2 refrigeration system.
The project team has not analysed the capital cost of the current system for a number of reasons. Firstly, the project team is not privy to the full cost of manufacturing the DP-CO2 system, as this information is commercially sensitive for the manufacturer. More importantly, however, the system installed at Coles is the first of its kind and includes a range of sensors for
UniSA will analyse the performance data of the operating DP-CO2 system across a whole year (i.e. including summer months) and provide a better estimate of energy savings.
N/A
N/A
Have you been able to calculate the return on investment?
monitoring. Hence, the cost of installing this particular system at Coles is not representative of the true cost of the DPCO2 system once it rolls out on a larger scale.
As noted in the previous questions, we do not calculate actual dollar savings, nor do we estimate the actual capital cost for installing these systems, and hence we are not able to calculate a return on investment.
N/A
Does the project team have any sense whether this system can perform well on a larger scale, e.g. a warehouse?
What are differences in characteristics in this system compared to conventional systems that may limit its uptake?
Are you using the model to compare the performance of the DP-CO2 systems vs conventional systems, or do you have a conventional system operating in parallel which you can compare your results to?
Dairy Australia is keen to explore how the DP-CO2 system may help them reduce their energy consumption and suggests that we could introduce this technology to the Dairy Manufacturers Sustainability Council.
This is currently something the project team is looking at. We will be using our general (extended) model and apply this to a range of sectors, including larger scale systems, to determine suitability of the DP-CO2 system under these conditions.
If any IRG member has any input data we could use, e.g. loads, that may better represent your system, we will be happy to use them in our models.
One of the key differences is that the weight of the DP-CO2 system is typically higher than conventional adiabatic systems, and hence may be limited by structural considerations.
For most part, we will be using the model, but it should be noted that there are other Coles sites that utilise (or will utilise) conventional CO2 refrigeration systems. If we manage to obtain that data, we may be able to compare data for the DP-CO2 system vs conventional CO2 systems.
UniSA is keen to get in touch with Dairy Australia to explore further opportunities.
UniSA to contact IRG members to obtain refrigeration specifications (loads, sizes, etc.) and utilise this in the model. This will be presented in the next IRG meeting.
N/A
UniSA to try and obtain access to data from Coles on their other sites using conventional CO2 systems.
UniSA to contact Dairy Australia. Will there be an interactive tool (even if indicative), where users can self-assess whether this technology is suitable for their application?
Yes. We are currently designing a simplified version of our model (in Excel) to be used as an indicative tool to estimate energy consumption from the DP-CO2 refrigeration system.
Consider consulting with IRG members on the design and usage of the simplified tool.
Last year, we (AIRAH) built a mobile training unit for CO2 transcritical refrigeration, which was run all around the country, training 250 mechanics for Coles. As part of that training, we would be more than happy to include the [dew point] cooler technology in our training to aid knowledge sharing.
We would be happy to get in touch with you to discuss how this could possibly work.
UniSA to contact AIRAH.
References
Belusko, M., Liddle, R., Alemu, A., Halawa, E., Bruno, F., 2019. Performance Evaluation of a CO2 Refrigeration System Enhanced with a Dew Point Cooler. Energies 12, 1079. https://doi.org/10.3390/en12061079
Brodribb, P., McCann, M., 2018. Cold hard facts 3. Canberra.
Denham, T., Xing, K., Dodson, J., Pears, A., Agrawal, H., Azar, B., Hossain, J., Indraswari, K., Katic, M., Liu, M., Rajakaruna, S., Shawon, M., Shi, L., Susilawati, C., 2021. Transforming energy productivity through value chains. Final report of the opportunity assessment for research theme B1. RACE for 2030 CRC.
Lau, T., Alemu, A., Bruno, F., Evans, M., Gilbert, R., Hadian, D., Hudson, J., Leak, J., Leonardis, C., Liddle, R., Liu, A., Rainey, T., Semsarilar, H., Xing, K., 2022. Testing and monitoring of an energy efficient indirect evaporative CO2 refrigeration system at a Coles supermarket: Milestone Report II. B1 for RACE for 2030.
Lecamwasam, L., Wilson, J., Chokolich, D., 2012. Guide to Best Practice & Maintenance & Operation of HVAC Systems for Energy Efficiency. Commonwealth of Australia.
Appendix A: Piping and i nstrumentation d iagrams (P & ID) of the DP - CO 2 system
29 Piping and instrumentation (P & ID) diagram of the Coles DP-CO2 refrigeration system
Figure
Figure 30 Piping and instrumentation diagram of the condensers and dew point cooling units
Appendix B: DP - CO 2 Monitoring e quipment s chedule
Table 5 Schedule of monitoring equip ment for the proposed DP -CO 2 system EquipmentList