
B3 Research report
Techno-economic Feasibility Study of Mechanical Vapour Recompression (MVR) for improving Energy Efficiency in Meat Rendering
Final Report


s
RACE for Business
Research theme B 3 : Electrification & renewables
ISBN: 978-1-922746-50-4
Industry Report
March 2024
Citation s
Nihill, J., Date, A., Deegan, M., Lappas, P , Leak, J. and Pinches, D. (2024).
Techno-economic Feasibility Study of Mechanical Vapour Recompression (MVR) for improving Energy Efficiency in Meat Rendering
Prepared for RACE for 2030 CRC
Project Partners

Acknowledgements
Project team
RMIT University
• Dr J Nihill
• Dr A Date
• Dr P Lappas
AMPC
• M Deegan
Pinches Group
• D Pinches
A2EP
• J Leak


We would like to thank the Industry Reference Group participants from the following organisations: JBS Australia, Teys Australia, Mayekawa Australia, G & K O’Connor, Queensland University of Technology.
Although the IRG members and partners have provided valuable inputs and feedback throughout the project, the findings and recommendation included in this report do not necessarily reflect the views of each individual member.
Acknowledgement of Country
The authors of this report would like to respectfully acknowledge the Traditional Owners of the ancestral lands throughout Australia and their connection to land, sea and community. We recognise their continuing connection to the land, waters, and culture and pay our respects to them, their cultures and to their Elders past, present, and emerging.
What is RACE for 2030?
Reliable, Affordable Clean Energy for 2030 (RACE for 2030) is an innovative cooperative research centre for energy and carbon transition. We were funded with $68.5 million of Commonwealth funds and commitments of $280 million of cash and in-kind contributions from our partners. Our aim is to deliver $3.8 billion of cumulative energy productivity benefits and 20 megatons of cumulative carbon emission savings by 2030. racefor2030.com.au
Disclaimer
The authors have used all due care and skill to ensure the material is accurate as at the date of this report. The authors do not accept any responsibility for any loss that may arise by anyone relying upon its contents.
3 Contents 1 E XECUTIVE SUMMARY 4 2 P ROJECT BACKGROUND 6 3 L ITERATURE AND TECHNOLOGY REVIEW 8 3.1 The rendering process in Australia 9 3.2 Potential for heat pumps to reduce CO2e emissions from industrial heat 12 4 M ODEL ANALYSIS 15 4.1 Model validation 15 4.2 Energy flow through typical rendering processes 16 4.3 Integration of MVR/heat pumps into rendering processes 18 5 A NALYSIS OF COST AND EMISSIONS REDUCTIONS 22 5.1 Equipment requirements based on product feed rate 23 5.2 Cost and emissions analysis 25 6 O UTCOME OF IRG MEETINGS 33 6.1 Outcome of 1st IRG meeting 33 6.2 Outcome of 2nd IRG meeting 36 6.3 Outcome of 3rd IRG meeting 36 7 C ONCLUSIONS AND RECOMMENDATIONS 37 7.1 Additional notes 38 8 R EFERENCES 39
1 Executive Summary
This report is the culmination of a targeted technical and economic feasibility study aimed at reducing the risk of adoption of Mechanical Vapour Recompression (MVR) technology for heat supply in the meat rendering and processing industry. The study builds on a detailed analysis of the key heating processes in the target industry using a custom thermodynamic model to make recommendations regarding appropriate integration of MVR and/or heat pump systems that could meet the heating demands, as well as how these systems could be integrated with existing machinery. The proposed modifications to the existing processes have been analysed with respect to economic and environmental impacts. The outcome of which is expected to lay a strong foundation for future pilot demonstrations, and to accelerate the reduction in CO2e emissions from process heat within the target industry.
The first major distinction from a thermodynamic perspective between the rendering processes used in industry are whether they evaporate all the moisture from the feed and render the fat in a single stage (dry rendering) or render the fat without evaporation, then use mechanical fluid separation systems followed by evaporation of the remaining moisture in a separate drier (wet rendering). The second is whether the heat required by the process is delivered via direct gas firing, via steam from a boiler, or a combination of the two. The thermodynamic analysis presented in this report focuses on steam heated dry rendering processes and steam heated wet rendering with separate steam heated driers
The thermodynamic analysis showed that the existing heat recovery efforts used in industry, which typically focus on generating hot water for use elsewhere in the facility (e.g. for cleaning and sterilisation) by condensing the vapour in the exhaust from a dry rendering cooker (or the drier in a wet rendering process), do a good job of recovering and further utilising the heat required to separate moisture via evaporation. However, the temperature (and hence the usefulness) of this recovered energy is significantly lower than the energy input to the system which indicates a significant loss of potential In a similar way, the use of gas combustion for thermal energy anywhere in the process represents a significant amount of wasted potential due in part to the high combustion temperature relative to the required process temperature
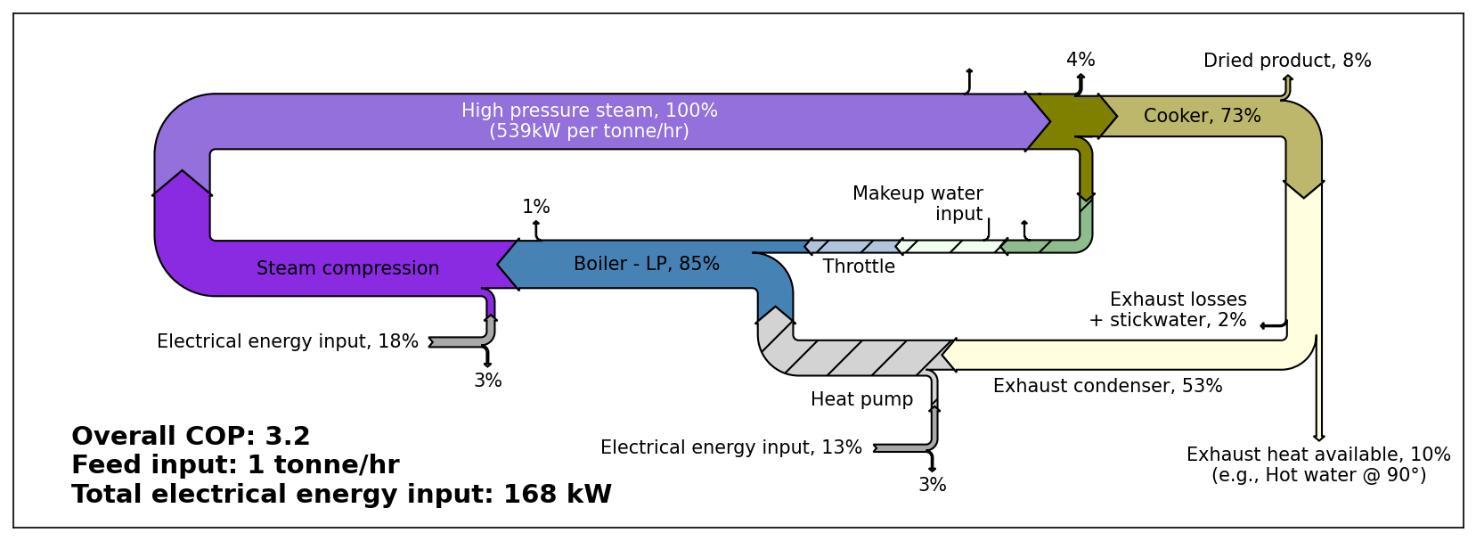
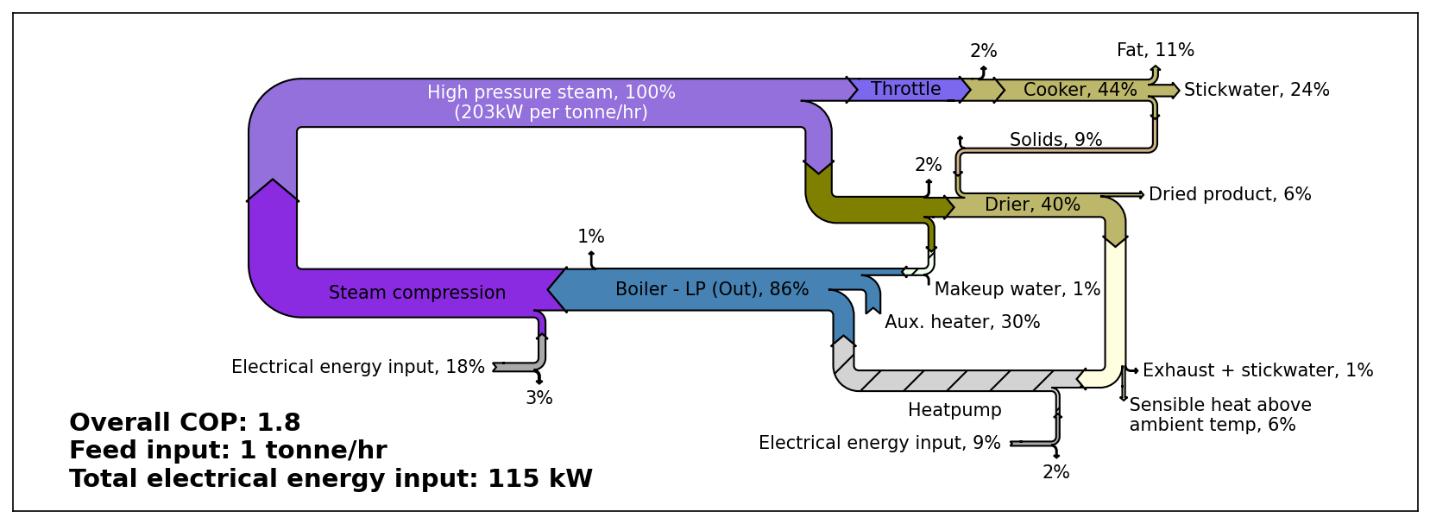
Because of the efficiency (from an energy perspective) of existing exhaust vapour condensing heat recovery solutions, there is little in the way of additional sources of waste heat that could be utilised in a heat pump and/or MVR heat recovery system. Therefore, it must be noted that any heat pump or MVR system will replace existing heat recovery solutions. Additionally, as the exhaust from a cooker or meal drier is the only substantial source of waste heat, a direct MVR system is not possible due to the inclusion of air, VOCs and other contaminants such as fats and oils With this in mind, the most promising means of integrating MVR and/or heat pumps was found to be indirect recovery of the heat contained in the vapour in the above-mentioned exhaust streams via a condenser similar to that used in existing hot water heat recovery systems. This heat can then be upgraded via a heat pump and used to evaporate the condensate recovered from the steam heating system (e.g., the steam jacket of a dry rendering cooker). Due to the temperature limitations of currently available heat pump technology, this evaporation must occur at a lower pressure than is required by a typical rendering process. The low-pressure vapour would then be compressed by a steam compressor train and delivered to the start of the process. This can be done in both wet and dry rendering processes, however, as there is typically a reduced amount of evaporation required in wet rendering (due to partial mechanical separation), there is typically insufficient energy available in the drier exhaust to fully supply the energy demand of the low-pressure boiler. Hence in wet rendering, an auxiliary electric heater would be necessary to supplement the heat from the heat pump. This reduces the overall COP for wet rendering systems, dropping it to 1.8 compared to 3.2 for dry rendering. It should be noted that an auxiliary heat supply is required in both
4
cases to provide heat during startup, however for wet rendering it would also be required to provide some heat during operation.
Because of this requirement for an auxiliary electric heater, it would be a significantly lower initial investment to simply replace gas boilers with direct electric boilers and depending on the trend in gas and electricity prices over the next few years (to 2030), this may also result in reduced operating costs . However, the heat pump + MVR integrations suggested in this report would reduce the total input energy demand of the process to 31% of the equivalent direct electric boiler in the case of dry rendering and 5 5% in the case of wet rendering. Therefore, the operating cost compared to a direct electric boiler would be substantially reduced. It is important to note that this reduction in energy consumption does not directly translate to a reduction in cost or emissions compared to a gas boiler, as without specific effort to ensure that a sufficient amount of the electricity required for the heat pump + MVR system is from renewable sources (around 50%), the additional steps associated with burning fossil fuels for electricity would result in a net increase in overall energy consumption and emissions. Any proportion of renewables above this threshold will result in a net reduction, and importantly, it is possible to completely eliminate the emissions associated with rendering by utilising 100% renewable energy.
The primary benefit of the suggested heat pump + MVR heat recovery system over existing hot water heat recovery is that it not only effectively uses what would otherwise be wasted heat in the exhaust from the process, but it also upgrades the quality of that heat and can completely eliminate gas combustion from the rendering process. It should be noted that while this would require an alternative heat source for the hot water requirements of the site, due to the temperature requirement of this water, it should be possible to provide this heat with, for example, a heat pump integrated with the refrigeration plant which would result in further reductions in energy consumption. This is beyond the scope of this study however and it is noted only to highlight that it would need to be considered when evaluating the benefit to specific sites.
5
2 Project background
Heating operations such as cooking, drying, sterilisation, and cleaning are used extensively in the meat rendering and processing industries. Further, in the case of integrated meat processing plants, all these processes may occur at the same location. At present, these operations are often carried out using heat from steam that is generated via traditional energy sources such as fossil fuels. High-pressure steam is used in rendering plant cookers, then, if additional heating processes are conducted at the same site, waste heat can be recovered to generate hot and warm water for these processes. Additional steam is then used to ensure the required distribution temperatures are met.
The current heat generation and distribution methods (including any existing cascade heat recovery) could still be further improved using MVR. For example, by recompressing the waste steam from the cookers and reusing it in the rendering process, the energy required for steam generation could be significantly reduced. The lower temperature heating demands (e.g., the hot water for cleaning) could then be met via separate electrification methods (e.g., heat pump using warm gas discharge from refrigeration plant as a source). This would enable high COP heat recovery technologies (MVR, heat pumps etc ) to be matched to the relevant process temperatures, reducing the overall energy consumed in heat generation.
The present literature does not provide any advice or direction on the practical aspects of integration of MVR in the meat rendering process. The literature provides some advice on the appropriate placement of MVR to maximise energy savings in the wastewater recycling, solvent recovery, milk processing and paper industry to reduce energy usage (Dahmardeh, Amiri, and Nowee 2019; Walmsley et al. 2016; Kim et al. 2022), but there is no advice on the practical aspects of integration. And this gap in the practical aspects of integration of MVR in the literature highlights the need for this research.
The RACE for 2030 Opportunity Assessment for Electrification and renewables to displace fossil fuel process heating (Evans et al. 2021) highlighted the use of MVR for heat recovery in the meat processing industry as one of the key opportunities for achieving decarbonisation of process heat in this sector. MVR can greatly reduce the total amount of energy required for a given heating demand and relies on commercially mature technology. It can therefore act as a low risk first step towards decarbonisation and will complement additional measures such as the use of solar thermal, or biogas from wastewater treatment, due to reducing the overall demand.
The Australian meat processing sector produced 3,464,022 tonnes of Hot Standard Carcase Weight (HSCW) for all red meat production as reported from July 2019 to June 2020 by the Australian Bureau of Statistics (ABS series 7218013, referenced in All Energy Pty. Ltd. 2021) At 3,316 MJ/t HSCW, this equates to total annual energy consumption by the Australian meat processing sector of 11.48 PJ per year. Around 37% of which (4.25 PJ per year) is used by rendering processes (All Energy Pty. Ltd. 2021). As most of this energy is supplied by natural gas steam generators. This equates to around 520,000 tonnes of CO2-e assuming 50 kg CO2-e emissions per GJ of energy from natural gas. Widespread adoption of MVR could reduce this energy consumption to between 1.42 PJ per year and 0.85 PJ per year (assuming an overall COP of 3-5)
The rendering process uses thermal energy in the form of steam between 115°C to 145°C and generates low temperature waste steam at around 100°C (Evans et al. 2021). This temperature range is well suited for MVR heat pumps. MVR systems for heat recovery have so far been trialled in evaporation and concentration processes in the beverage, sugar, and dairy industries and have been shown to reduce energy consumption by 70-80% (Dahmardeh, Amiri, and Nowee 2019; Walmsley et al. 2016; Kim et al. 2022; Ahirrao 2014; Han, Si, and
6
7
Chen 2021; Atkins and Walmsley 2013; Marechal, Sachan, and Salgueiro 2013; Urbaniec, Grabowski, and Wernik 2013).
3 Literature and technology review
At a glance:
• Rendering accounts for approximately 37% of the total energy use intensity for meat processing, equating to around 1,200 MJ/t HSCW.
• Accurate and up to date data on industry trends, such as the percentage of batch vs continuous and wet vs dry rendering operations, is lacking. However:
o Prior to 2000, the split between batch and continuous rendering was approximately 50/50 and dry rendering accounted for around 85-90% of rendering operations.
o In 2005, dry rendering had reduced to 80-85% of operations and current industry feedback suggests that this is now closer to 60%
• Current heat pump technology, including the use of MVR, is able to achieve COPs between 2 and 3 with a temperature lift up to 80°C, and condensing temperature as high as 280°C
o This level of performance is typically achieved with some combination of vapour compression (including MVR), supercritical CO2 or ammonia heat pumps, either alone or in a hybrid configuration.
o Heat pumps and MVR have shown notable promise in both the dairy processing and alumina refining industries
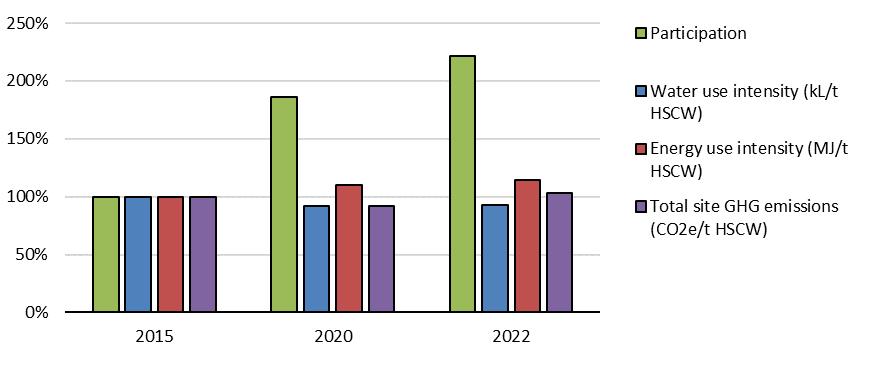
The rendering industry is closely tied to the meat processing industry as a whole. The environmental impact of the red meat processing industry for 2019-2020, in particular with respect to water, energy and GHG emissions, was summarised in a report published by AMPC and MLA (All Energy Pty. Ltd. 2021) and updated by AMPC and CSIRO in 2023 (Ridoutt and Sikes 2023). These reviews were based on a survey of the industry which is typically conducted every five years. For the 2020 report, responses were obtained from 26 of the 150 sites, with these respondents accounting for 41.3% of the total per annum production of 3.46 million tonnes of hot standard carcase weight (HSCW). In 2022, the number of participating sites increased to 31, representing approximately 60% of national production.
The scale of the plants surveyed ranged from 5,500-180,000 t HSCW p.a. operating in regions with water stress ranging from less than 0.1 to 0.8-0.9. Some of the key data from these reports are summarised in Figure 1 and Figure 2 Most relevant to this report, Figure 2 shows the energy use intensity (MJ/t HSCW) for rendering and non-rendering operations relative to the total. This is shown for the data from the 2020 EPR report as this ratio was not reported in the more recent 2022 EPR report.
8
Figure 1. Summary of key conclusions from 2022 EPR for red meat processing industry compared to 2015 levels (Ridoutt and Sikes 2023).

Rendering operations account for approximately 37% of total energy use intensity, however it was found that rendering had no impact on the specific energy based emissions production for 2019-2020. This was a departure from the 2015 survey in which rendering contributed an extra 36% to site emissions. Additionally, the reduction in GHG emissions accompanying the increase in energy use intensity noted in 2020 was attributed to the relatively high dependence on grid energy, and hence scope 2 emissions. This has meant that the increase in renewables supplying the national grid has reduced GHG emissions for the industry despite the overall energy consumption increasing. Overall, it was noted in 2020 that there had been a clear downward trend in emissions, but that this would still need to accelerate in order to achieve carbon neutrality by 2030. In 2022, the GHG emissions had increased again to close to 2015 levels, breaking this trend.
3.1 The rendering process in Australia
In Australian literature sources (Food Science Australia 1997d, 1997c, 2005), rendering processes are typically classified by whether they are wet or dry, and further by whether they are a batched or continuous process. The primary distinction between wet and dry rendering in Australia is whether the bulk of the moisture is removed from the solids (protein, bone etc.) before (dry rendering) or after (wet rendering) the separation of the fat/tallow (Food Science Australia 1997d). For wet rendering, this typically results in higher quality tallow (Food Science Australia 1997e) as the fat is exposed to lower temperatures (<100°C) and is only in contact with the pigments associated with the raw material for a short time. The other core product from rendering, meat meal, is typically produced using dry rendering processes (Food Science Australia 1997b). Figure 3 shows the key differences between wet and dry rendering in Australia (Swan,1992 as referenced in (Food Science Australia 1997c)), along with the possible opportunities for heat recovery integration identified for investigation in this project
9
Figure 2. Energy use intensity for rendering and non-rendering operations in the meat processing industry (All Energy Pty. Ltd. 2021).
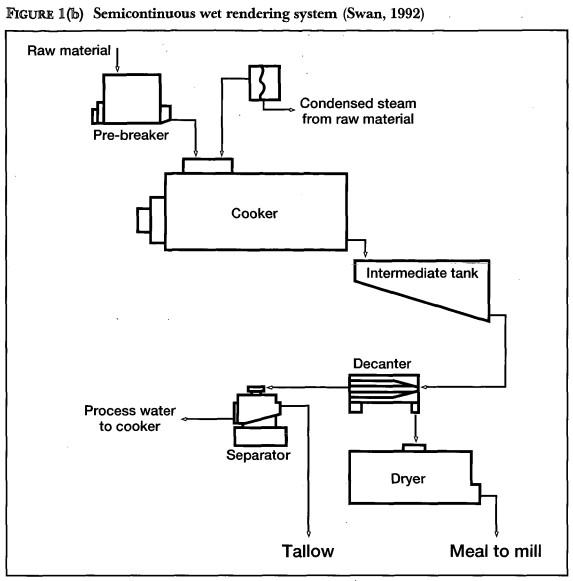

The key equipment/stages used in wet rendering are as follows (Food Science Australia 1997d): A continuous cooker which coagulates protein and releases fat and water from the feed material. Heat can be supplied either by direct steam injection or indirectly via a steam jacket and internal discs or internal coils (similar to a dry rendering cooker). The cooking temperature is kept below 100°C and the water and fats are separated in the next stage. The second stage consists of a centrifugal decanter or press which separates the fat and liquid phases from the solids. In the third stage, the solids (which still contain approx. 50% water after separation) are then dried using a variety of systems (indirect steam driers, direct fired rotary driers etc).
Dry rendering can be accomplished in either a batch or continuous process and consists of two primary stages (rather than the three used in wet rendering). The first stage is a cooker (batch or continuous) which heats the feed material to first coagulate protein and release fat and water as in wet rendering, then continues to dry the solids. The end point temperature, after the water has been evaporated, typically reaches 110°C – 145°C. In a batch process, the pressure in the cooker can be increased by closing the vent in order to hydrolyse/breakdown wool and hair (which cannot happen at atmospheric pressure). After leaving the cooker, the feed material passes over a screen or percolator to separate solids from liquid tallow. The solids are then typically pressed to further separate any remaining tallow (Food Science Australia 1997d)
In dry rendering, all of the moisture is evaporated during the cooking stage and is exhausted from the cooker along with any non-condensable gasses (NCGs) and volatile organic compounds (VOCs) released during cooking. Emission of these NCGs and VOCs needs to be controlled, and there are a variety of methods used to do this (Food Science Australia 1997a). The four most common methods for controlling emissions (outside of prevention where it is possible) are: Biofiltration, wet chemical scrubbing, thermal oxidation and activated carbon filtration. The original method used in treating the emissions from rendering cookers was thermal oxidation, in which NCGs and VOCs are first separated from the vapour in a condenser, then are incinerated (which can be done in the gas fired furnace/boiler heater) (Food Science Australia 1997a). This led to early developments in heat recovery from rendering cooker exhaust in which the condensing vapour is used to heat water for use in cleaning and sterilisation in other areas of the plant (Graham and Cain 1978). In wet rendering, there is significantly less vapour generated in the 1st stage cooker, with most of the moisture removal occurring in the solid drier at the end of the process. It is assumed here that similar emission control methods are applied to each of these sources in the wet rendering process, however the literature sour ces available do not confirm this one way or the other. Further, the literature sources covering heat recovery from emission control condensers are focused on dry rendering processes and make no mention as to whether the same
10
Figure 3. Difference between wet and dry rendering (Swan, 1992 as referenced in (Food Science Australia 1997c)).
Semi con�nuous wet rendering process (Swan, 1992) Dry rendering process (Swan, 1992) * *
* * Possible opportuni�es for MVR/Heat pump integra�on
techniques can be or are applied in wet rendering. Figure 4, shows schematics of two early variations of heat recovery solutions which utilise the heat from the condenser in the VOC control system (cooker exhaust) (Graham and Cain 1978).

While the waste heat from rendering can typically cover the heating demand for hot water used by meat processing plants, the use of ammonia heat pumps to recover heat from refrigeration to meet this demand has also been explored (Whelan 2010). The study was based on previous overseas research which showed that specific energy consumption for livestock processing plants without onsite rendering could be reduced by 3740% using ammonia heat pumps. It was concluded that fuel gas (butane) consumption used for hot water at the site studied could be reduced by 36% with a net reduction in GHG emissions of 693 tonnes p.a. These studies indicate that there are highly effective alternatives for providing the thermal energy typically obtained from rendering process waste heat, hence opportunities for reusing this heat elsewhere in the process can be considered without negatively impacting those processes that currently make use of it.
The stickwater produced during rendering operations is typically either treated onsite in effluent ponds or sent to municipal treatment plants, however alternative methods have also been explored including the use of multi-stage evaporative distillation or vapour compression vacuum distillation water treatment systems (Sentance 2011)
The relative proportion of wet vs dry rendering plants in use in Australia appears to be uncertain. Prior to 2000, approximately 50% of rendering operations used batch dry rendering, 40% used continuous dry rendering and 10% used wet rendering (Food Science Australia 1997d). As of 2005, around 80-85% of rendering operations used some kind of dry rendering with 15-20% using wet rendering (Food Science Australia 2005). If this trend continued through to 2020, then the relative proportions would be around 60% dry rendering and 40% wet rendering. These proportions would agree somewhat with the feedback obtained from the 1st IRG meeting for this project, which suggested that the current proportion either favoured wet rendering or was close to an even split. However, recent figures on this split were not available in the literature reviewed so far, and hence this cannot be confirmed here. It will be useful if an industry body such as AMPC or Australian Rendering Association conducts a survey to collect more up to date data.
The cost of rendering (excluding environmental and transport costs) in 2007 was calculated as $130 - $265 per tonne of finished product ((ProAnd Associates Australia Pty. Ltd. 2006), summarised in (Food Science Australia 2007)). Most of this variation was found to be due to high variability in energy costs, resulting from
11
Figure 4. Past heat recovery solutions utilising VOC control system (Graham and Cain 1978).
the different fuels used. These were, from cheapest to most expensive: sawdust/wood, coal, delivered/bottled gas. Further, energy costs were found to be the largest single cost associated with rendering products.
The impact of implementing measures to reduce natural gas consumption has been explored with respect to energy savings and GHG emissions reduction (Colley 2015). The major natural gas consumers identified were the boiler, blood drier and odour burner, hence the project considered five key areas for improvement, including: Rendering plant efficiency improvements, boiler efficiency improvements, biogas use in boilers, blood drier upgrades and biofilter installation. The original odour treatment unit was replaced with a biofilter which consumes no natural gas, hence this source of natural gas consumption and GHG emissions was completely eliminated. The savings from boiler and plant efficiency improvements were not as high as initially predicted, however this was in part due to the initial quote used for estimates not being used for the final implementation. The impact of biogas from onsite digestion was more promising than initially expected. Further improvements were also suggested, with reducing water entrainment in cooker being key as 90% of the energy consumed here is used for evaporation of water.
3.2 Potential for heat pumps to reduce CO2e emissions from industrial heat
When considering renewable alternatives to fossil fuels for process heat supply, there are two ‘big picture’ aspects that need to be considered. The CO2 emissions associated with the alternative energy supply are clearly one key aspect, while the cost of any alternative is another. Given that direct sources of carbon neutral heat such as solar thermal or biomass/biofuel are somewhat site dependent, electrification of heat supply represents a significant opportunity for widely applicable solutions that would in turn benefit from greater economies of scale and standardisation which would both contribute to reduced risk of adoption for industry. An important caveat to this is that electricity-based heat supply solutions are not inherently carbon neutral but rely on the electricity being sourced renewably. While this can be sourced onsite e.g., via PV collectors, it is also possible to use grid power and rely on purchase agreements for renewable power and/or the overall decarbonisation of electrical grids which, in Australia’s National Electricity Market (NEM), has increased from 480 MW to 19,000 MW of installed utility scale renewable electricity generation between 2010 and 2023 (Dawkins and Walker 2023). Further, including rooftop solar PV, 36% of Australia’s electricity generation came from renewable sources in 2022, and the target is to reach 82% by 2030 (Choy and Gibson 2023)
There are a number of technologies for converting electrical energy into process heat. Some, like microwave heating have certain benefits (e.g., zero contact) that make them particularly applicable for certain processes, however they can be broadly categorised into solutions with a coefficient of performance (COP) ≤ 1 and solutions with a COP > 1. The later are generally referred to as heat pumps, a term which encompasses a wide variety of technologies that are characterised by the utilisation of a small work input to move a greater amount of heat from a low temperature source to a higher temperature sink (i.e., the process in question). With a COP > 1, heat pumps have the potential to reduce the energy consumption of a heating process and offset the generally higher cost of electricity compared to fossil methane (natural gas).
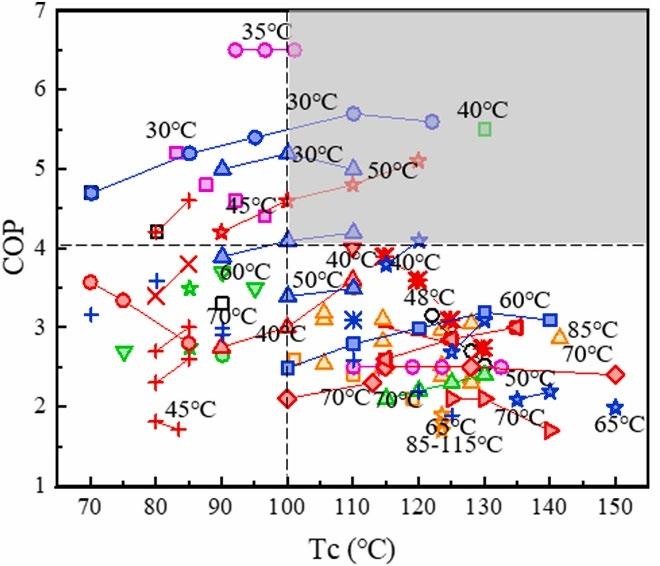
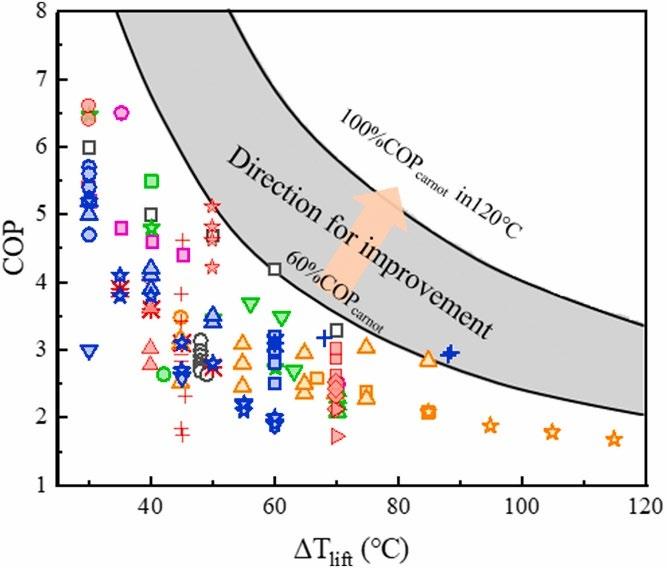
Jiang et. al. summarized the experimental development of high temperature heat pumps (HTHPs) over the years from 1985 to 2020 (Jiang et al. 2022) . Their summary of the relationship between COP, condensing temperature (Tc) and temperature lift is shown in Figure 5. This summary clearly shows that COPs between 2 and 3 with a temperature lift up to 80°C, and condensing temperature as high as 150°C are possible with current technology.
12
The developments in water vapour heat pumps from 2011 to 2017 summarised by Hu, Wu and Wang are provided in Table 1 (Hu, Wu, and Wang 2018; Šarevski and Šarevski 2012; Chamoun et al. 2014; Šarevski and Šarevski 2017). In short, COPs greater than 6 have been demonstrated for condensing temperatures around 50°C and combined compression ratios around 7 (for two stage compression and heat source temperatures around 5-10°C). For condensing temperatures between 118-130°C and heat source temperatures from 75-95°C, COPs between 3.5 and 5.5 have been achieved. Discussion with industry during this project has further indicated that condensing temperatures up to 280°C are feasible.
and
Chamoun M., Rulliere R., Haberschill P. and Berail J.F. in (Hu, Wu, and Wang 2018)
3.2.1 Industrial use of heat pumps for process heating
In 2018, Hu, Wu and Wang (Hu, Wu, and Wang 2018) explored the three main types of water vapour compressors (centrifugal, roots blower and screw compressor) and discussed their application in mechanical vapour recompression, heat pumps and refrigeration. The vast majority of MVR applications discussed were related to desalination, an application which has been utilised and studied since the early 1980s. More recent applications were shown to include concentration processes in the food industry (dairy, juice) and chemical industries (urea), as well as resource recovery applications such as alkali recovery in soda pulping. As part of this discussion, the characteristics of water vapour as a refrigerant were summarised. The key advantages highlighted were waters non-polluting characteristics, availability, low cost, and high latent heat of vaporisation. On the other hand, the low molecular weight, high specific volume, and high adiabatic index of water vapour
13
Figure 5. Summary of experimental performance of HTHPs (Jiang et al. 2022).
Evap. Temp. ℃ Cond. Temp. ℃ Compression ratio COP Year References min max min max A NEW HIGH TEMPERATURE HEAT PUMP 75 130 – 3.6 2011
Table 1. Summary of water vapor compression heat pump systems (Hu, Wu,
Wang 2018; Šarevski and Šarevski 2012; Chamoun et al. 2014; Šarevski and Šarevski 2017)
WATER TWO STAGE CENTRIFUGAL COMPRESSOR HEAT PUMP SYSTEMS 5–10 50–55 6.35 7.17 5.64 6.47 2012 (Šarevski and Šarevski 2012) A HIGH TEMPERATURE TWO SCREW WATER VAPOR COMPRESSION HEAT PUMP 86–94 118–121 – 4.5 5.5 2014 (Chamoun et al. 2014) HIGH TEMPERATURE HEAT PUMP WITH WATER-JET SCREW VAPOR COMPRESSOR1 75–90 100–130 1.45 7 5.99 31.48 2014 J.B.
X.J. in (Hu, Wu,
Wang 2018) SINGLE STAGE GEOTHERMAL TURBO COMPRESSION WATER HEAT PUMPS 5–10 45–55 – 5.2 7.2 2017 (Šarevski and Šarevski 2017) TWO STAGE GEOTHERMAL TURBO COMPRESSION WATER HEAT PUMPS 5–10 45–55 – 5.75 6.45 2017 (Šarevski and Šarevski 2017)
Shen, Z.L. He, Z.W. Xing and
and
(
) (b)
a
were noted as they present challenges for compression processes. Further, the release of NCGs at low pressures was highlighted as having kept many investigations limited to theoretical studies due to the difficulties in dealing with NCGs in experimental systems.
Hu, Wu and Wang summarised the characteristics of common water vapour compressors (Hu, Wu, and Wang 2018) The trade-off between volume flow rate and compression ratio for each of these compressor types is summarised well in Figure 6 which shows the relative strengths and weaknesses with respect to suction volume flow rate and compression ratio for the most common compressor types used for water vapour compression.

While not an exhaustive list, heat pumps and MVR have been investigated for use in drying applications (Xu et al. 2023), milk powder production (Bühler et al. 2019), and alumina refining (Chatfield and Alcoa 2022a) (Chatfield and Alcoa 2022b) (Alcoa and Pure Font Communications 2022)
These studies considered a number of scenarios that could form a useful basis for integrating heat pumps into other industrial processes. In particular, the concept of recovering heat from multiple points in the process and delivering it to a central low temperature evaporator (e.g., a flash tank or heat pump evaporator), then compressing this vapour to the higher temperature required is one that is worth considering. The studies from Alcoa show that MVR has potential to eliminate fossil fuel from even very large scale and complex processes. However, it is unclear whether the economics of such a system would scale down favourably to smaller, less homogeneous industries.
14
Figure 6. Comparison of compression ratio and suction volume flow rate for major water vapour compressor types (Hu, Wu, and Wang 2018).
4 Model analysis
At a glance:
• The model developed for this project is flexible enough to be adapted to and simulate a range of rendering process configurations and has been validated against data from industry.
• For dry rendering, there is sufficient heat available in the cooker exhaust (in the form of vapour) that can be recovered with an overall COP of 3.2 such that it would completely eliminate the need for any gas combustion.
• For wet rendering however, the improved energy efficiency inherent in the process means that there is insufficient recoverable heat in the process to completely remove the need for an auxiliary heat source during operation.
o If this auxiliary heat source is electric however, the overall COP will be 1.8
4.1 Model validation
The model was validated against data obtained from industry. The process used for validation was a steam heated wet rendering system combined with natural gas (fossil methane) fired driers. However, the specifics of the process and data used for validation are obscured here due to confidentiality concerns A simplified process flow diagram of the system is shown in Figure 7, and the comparison of the model output with the industrial data is provided in Table 2. The data in Table 2 has been normalised with respect to industry data provided.
Without a more in-depth data collection study, there were minimal data points in common between the industry data available and the model output that could be used for validation Further, the inputs to the model required to properly simulate the industrial process required some assumptions to fill gaps in the available data. A range of values were provided to the model in these cases leading to the range in error shown in Table 2. The error is small enough with the assumptions in case 1 to provide a reasonable level of confidence in the output of the model
15

4.2 Energy flow through typical rendering processes
Sections 4.2.1 and 4.2.2 show the energy flow through a ‘typical’ dry and wet rendering process respectively. Both processes are assumed to receive heat from steam raised in a gas fired boiler In the following section (section 5), the heat recovery solutions proposed here will be analysed with respect to CO2e emissions, cost and practicality. In the energy flow diagrams, the energy of the steam delivered to the cooker is taken as the reference point as this the amount required by the cooker (and thus is constant for a given production rate and feed composition). This means that the percentages are consistent across diagrams of the same system as well as the modified systems that incorporate heat pumps and MVR (the demand from the cooker is still the same in these systems)
4.2.1 Steam heated dry rendering
The steam heated dry rendering process shown in Figure 8 is a relatively energy efficient process due to the condensate return system and the exhaust condenser used to heat water for other purposes (e.g. cleaning and sterilisation) This is confirmed by the energy flow diagram in Figure 9 which shows that, due to the energy recovered from the condensate leaving the cooker, the losses from the natural gas combustion process are offset to the point where the natural gas consumption is only 7% greater than the actual energy demand of the cooker. Further, the energy in the condenser cooling water is also recovered, meaning that around 80% of the chemical energy input is either internally recovered or can be re-used in other applications. However, an
16
Figure 7. Simple process flow of system used for model validation.
Industry data Model output 1 Model output 2 Error Cooker (Wet): Steam consumption 1.00 1.03 1.17 3% - 17% Gas drier: Gas consumption 1.00 1.02 1.08 2% - 8%
Table 2. Comparison of model output with data from industry.
analysis of the exergy 1 flow through the system shows that, due to the temperature gradient from the start of the process (gas combustion) to the end (dried solids, tallow and recovered waste heat), the potential of the energy released during combustion is heavily underutilised, and in fact cannot be fully utilised as over 50% is lost in the combustion process itself (i.e. during the conversion from fuel to hot gasses)

4.2.2 Steam heated wet rendering process with separate drier
Based on the results for the dry rendering process above, it was noted that the energy losses from the connecting pipes were negligible compared to the rest of the system. Therefore, these were ignored when
1 The concept of exergy in thermodynamics considers both a system and its environment and represents the ‘utilisable energy’ or the ‘quality of energy’ in a system. In the case of thermal energy systems, it is closely tied to the temperature of the system and its surroundings. As an example, consider two thermal energy systems (e.g. hot water storage tanks) in a room which is at typical ambient temperature. If both systems have the same amount of thermal energy, but each is at a different temperature. The system with the higher temperature relative to the surrounding room would have a higher exergy as there is greater potential to convert this thermal energy to another useful form of energy such as mechanical work.
17
Figure 8. Process flow diagram: Typical steam heated dry rendering system.
Figure 9. Energy flow through a steam heated dry rendering process. Text labels indicate key locations/components. Min % loss labelled is 1%.
setting up the simulation for the wet rendering process in order to simplify both the calculations and the results.
It can be seen in Figure 11 that, with respect to the energy demand of the process, the wet rendering system simulated is less efficient than the dry rendering system above. This is in part due to the condensate from the drier not being recovered in this process. However, even if this were done, the chemical energy required would still be around 22% greater than the energy demand (compared to 7% for the dry rendering process). This is due to some of the steam being combined with the feed in the cooker and leaving the system as stickwater, and therefore not being available for return to the boiler regardless of whether condensate is recovered from the drier or not It should be noted though that the process itself is significantly more efficient overall compared to dry rendering, requiring only 47% of the total chemical energy that the same feed required in a dry rendering process.


4.3 Integration of MVR/heat pumps into rendering processes
Based on Figure 9 and Figure 11, it is clear that existing heat recovery solutions that return condensate to the boiler, and condense the vapour in the cooker/drier exhaust (where applicable) target the only viable sources
18
Figure 10. Process flow diagram: Typical steam heated wet rendering system with drier.
Figure 11. Energy flow through a steam heated wet rendering process. Text labels indicate key locations/components. Min % loss labelled is 1%.
of energy that would otherwise leave the system. Additionally, these energy recovery efforts do little to address the high potential that is lost during energy conversion and transfer from natural gas to the process fluid.
Therefore, effective integration of heat pumps and/or MVR to replace the natural gas combustion would need to make use of these same low-grade sources and would therefore replace any existing heat recovery solution. It should also be noted that increasing the temperature lift of a heat pump significantly impacts the COP. It will therefore be unlikely that recovering the sensible energy in the exhaust (i.e., cooling the condensed liquid down to near ambient temperature as is often done currently) with a heat pump will be practical. This does mean however that a small amount of energy may still be available for water heating, but the amount of water that could be heated would be greatly reduced.
4.3.1 Steam heated dry rendering with heat pump boiler and MVR
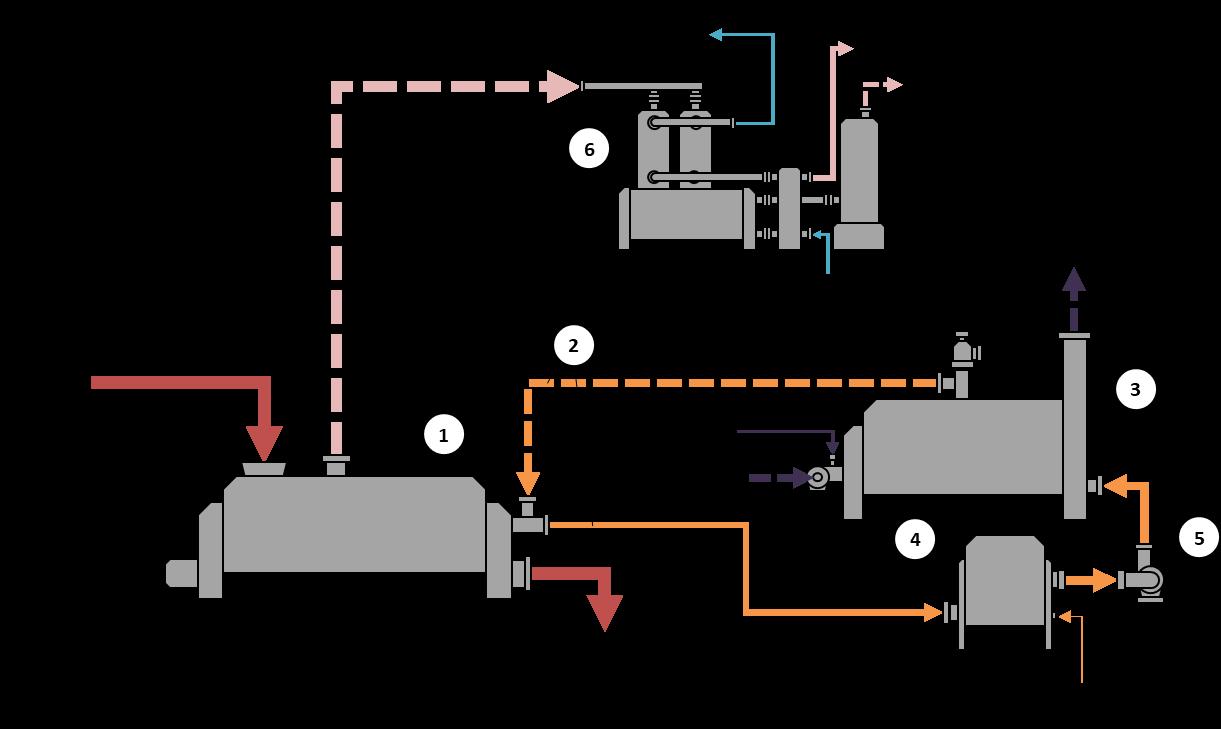
The process flow diagram from Figure 8 is modified in Figure 12 to show how heat pumps and MVR could best be integrated into a dry rendering process based on the energy flow shown in Figure 9 The exhaust condenser unit (6) would need to be modified to separate condensing and subcooling heat exchangers , and a heat transfer fluid loop added to transfer the energy recovered from condensing the exhaust vapour to the evaporator of a high temperature heat pump (7). The heat pump boosts the temperature of this heat (to 120°C in this example) and generates steam at a low pressure. Depending on the design of the heat pump, this could be in a separate low-pressure boiler as shown here, or it could be integrated into the design of the heat pump unit. The low-pressure steam is then compressed in a compressor train to the required pressure and temperature for the dry rendering cooker As the boiler is now at a lower pressure than the condensate leaving the cooker, the boiler feed pump is replaced with a throttling valve (4) which drops the pressure and flashes a portion of the condensate to steam

If an exhaust condenser is already in place for recovering heat for hot water and sterilisation, the modifications to install a heat pump as shown would be minimal. However, if an air-cooled condenser is used (e.g., purely for liquid separation from the exhaust), an entirely new condenser would be required. Additionally, the gas fired
19
Figure 12. Process flow diagram: Possible integration of heat pumps and MVR into a typical steam heated dry rendering system.
boiler would likely need to be replaced rather than modified. It should also be noted that an auxiliary heat source (e.g., and electric element heater) would be required somewhere in the heat recovery system to enable startup.
The updated energy flow diagram for the modified process in Figure 12 is shown in Figure 13 It can be seen that the use of heat pumps and steam compression reduces the total energy consumption to around 41% of the energy consumption of the dry rendering process in Figure 8. This energy consumption is also electrical rather than gas, and the effect this would have on cost and emissions will be discussed in section 5. It should be noted that the utilisation of the potential in the energy supplied (the exergetic efficiency) of this modified process is significantly better at 95% compared to 28%.
4.3.2 Steam heated wet rendering with separate drier integrated with heat pump boiler and MVR
A similar modification could be made to the wet rendering process shown in Figure 10 In this case however, there is less moisture evaporated in the drier and hence less energy available for recovery in the exhaust stream. Therefore, the auxiliary heater required for startup would also be needed at a reduced capacity during operation in order to make up the difference between the demand and what the heat pump can supply. An additional difference of note is that due to the extra makeup water required (as a result of the water that is separated after rendering), the temperature of the water leaving the boiler feed tank is reduced to the point where there is no flashing of the condensate between the boiler feed tank and the boiler. As can be seen in Figure 15, the effect of this auxiliary heat requirement is that the overall COP of this system is reduced in comparison to the dry rendering process in the previous section (the exergetic efficiency is also reduced at 52% compared to 95%). However, similarly to the gas fired boiler wet and dry processes, the total energy requirement is significantly lower for the wet rendering process (around 50% compared to dry rendering with heat pumps and MVR, and 44% compared to wet rendering with a gas fired boiler).
20
Figure 13. Energy flow through a dry rendering process with heat pump and MVR heat recovery. Text labels indicate key locations/components. Min % loss labelled is 1%.

21
Figure 14. Process flow diagram: Possible integration of heat pumps and MVR into a typical steam heated wet rendering system.
Figure 15. Energy flow through a wet rendering process with heat pump and MVR heat recovery. Text labels indicate key locations/components. Min % loss labelled is 1%.
5 Analysis of cost and emissions reductions
At a glance:
• If the current relationship between gas (fossil methane) and electricity remains the same through to 2035 (as in scenario 1), retrofit projects for dry rendering processes would likely be able to achieve payback periods around 7 years for an assumed CAPEX of around $0.5M per tonne per hour of rendering feed rate
• If the gap between gas and electricity prices reduces (scenarios 2 and 3), the payback period on this same investment is significantly reduced to around 3.5-4 years
• For wet rendering retrofit projects, it is likely that additional support would be needed to make such projects economically attractive.
o Under scenarios 2 and 3, payback periods of 2.5-3.5 years could be expected.
o However, under scenario 1 projections, payback periods would be in excess of 20 years i.e., there is significantly greater risk associated with wet rendering retrofit projects.
• Around 50% renewables are required in order to start seeing a notable reduction in emissions. However, for both wet and dry rendering processes, the heat supply is able to be completely electrified, meaning that through a combination of the government renewable targets, purchase agreements and/or onsite renewable power generation, there is a clear path to complete decarbonisation of the process heat.
The analysis in this section assumes a plant capacity factor of 80% where needed (i.e., 6,989 operating hrs per year). Further, results are calculated for rendering plant feed rates of 1, 10 and 20 tonnes per hour Based on these assumptions, and assuming that the rendering input is approximately 60% of the HSCW, the equivalent processing plant input in tonnes HSCW p.a. are shown in Table 3
Rendering feed rate 1 tonne/hr 10 tonne/hr 20 tonne/hr
Processing plant capacity 11,648 t HSCW p.a. 116,480 t HSCW p.a. 232,960 t HSCW p.a.
This relationship can be used to extrapolate the results presented here to any actual plant capacity by determining the equivalent rendering feed rate under the assumptions used in this analysis as follows :
As an example, a beef processing plant processing 912 head per day at approximately 320kg per head and operating for 250 days per year would have an annual capacity of 912 x 250 x 0.32 = 72,960 t HSCW p.a.
The equivalent rendering feed rate accounting for the assumptions used in this analysis would therefore be:
Equivalent rendering plant capacity = 72,960 t HSCW x 60% = 43,776 t p.a.
Equivalent rendering feed rate = 43,776 t p.a. / 6,989 hrs p.a. = 6.3 tonnes per hour.
It was found that the results in this section scale linearly with feed rate, therefore the equivalent rendering feed rate (as calculated above) can be used to scale the results given for 1 tonne per hour where needed.
22
Table 3. Processing plant capacity vs rendering process feed rate assuming 60% of HSCW as rendering input and 80% plant capacity.
5.1 Equipment requirements based on product feed rate
The primary pieces of equipment required to implement the modified processes shown in Figure 12 and Figure 14 are: An exhaust vapour condenser connected between the cooker or drier (for dry and wet rendering processes respectively) and any additional VOC treatment system, a heat pump boiler (with auxiliary electric heater for startup), and a steam compressor train (MVR system)
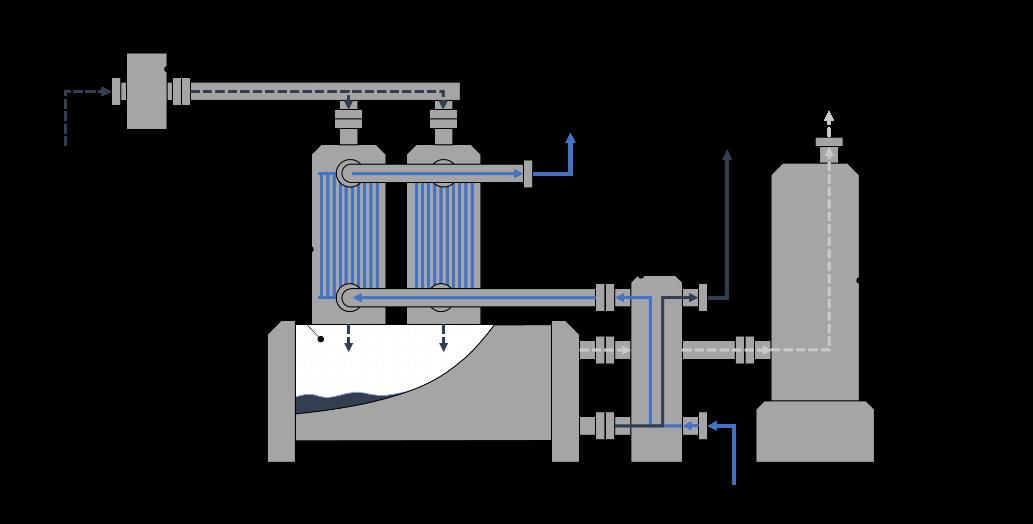
A schematic example of the required vapour condenser unit is shown in Figure 16 The unit should include a droplet separator (e.g., a stainless-steel mesh screen filter) to remove any entrained oil droplets in the exhaust, heat exchangers for latent and sensible heat extraction, and a liquid separator. The heat exchangers must be designed to transfer the heat to a medium that can interface with the evaporator of the heat pump. As such, existing exhaust vapour condensers designed to recover heat for hot water production should be able to be re-purposed.
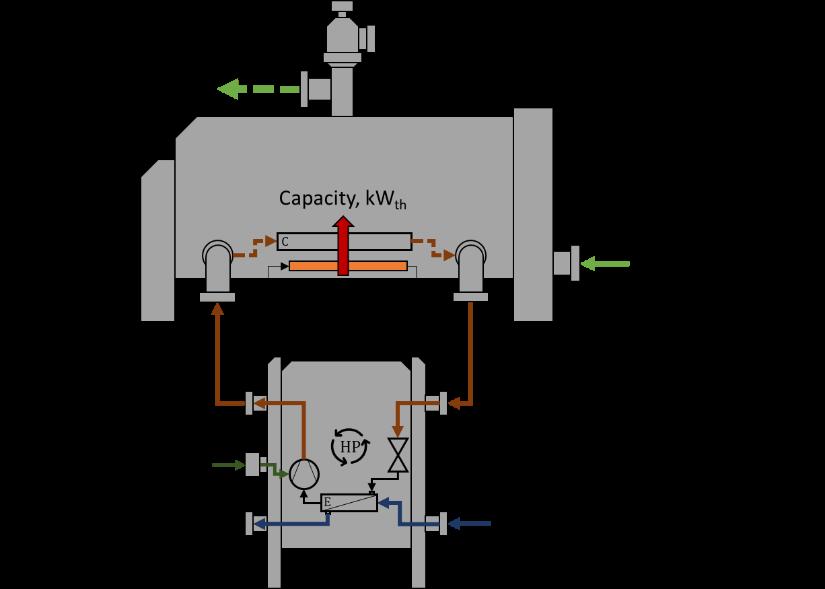
The required thermal capacity of the heat pump boiler based on rendering feed rate and rendering process type is summarised in Table 4 The condenser and evaporator temperatures required are based on the process boundary conditions assumed, and in the case of this analysis are 120°C and 80°C respectively. It was further assumed that the heat pump could achieve 60% of Carnot, which would result in a COPHP of 6 for the temperature difference needed. This is shown in the example heat pump boiler schematic in Figure 17 In this schematic, the boiler is shown as a separate component, however depending on the heat pump design, it may be incorporated into a single unit.
23
Figure 16 Schematic example of required vapour condenser unit.
Rendering process 1 tonne/hr 10 tonne/hr 20 tonne/hr Dry rendering 344 3,389 6,805 Wet rendering 87 871 1,742
Table 4. Heat pump boiler thermal capacity, kWth.
in
Table 5 Again, based on the information provided by Hu, Wu and Wang (2018), these flow rates should be achievable with modern steam compressors.

24
Figure 17. Example heat pump boiler schematic.
A schematic of the required MVR compressor train is shown in Figure 18 A target compression ratio per stage of 2 was specified in the model which, based on the data in Figure 6 (Hu, Wu, and Wang 2018), is achievable by either roots, screw or centrifugal compressors. This results in a three-stage compressor train being required in order to provide the necessary steam pressure. The required suction flow rates and average power per stage are summarised
Figure 18. Schematic of required MVR compressor train.
Rendering process Parameter
1 tonne/hr 10 tonne/hr 20 tonne/hr
Dry rendering Suction volume flow, m³/min [12, 6, 4] [120, 52, 35] [240, 107, 72]
Compressor power per stage 32 328 644
Wet rendering Suction volume flow, m³/min [5, 2, 1] [46, 21, 14] [91, 42, 28]
Compressor power per stage 13 126 252
It should be noted that the required equipment summarised here is not exhaustive and will depend on the specifics of the site being considered for modification. For example, in some cases the existing vapour condenser could be repurposed, reducing the equipment required. However, if the cooker, and drier where relevant, are not already designed to operate with steam, then these would need to be replaced to achieve the full benefits shown here. This could represent a significant additional cost depending on the current depreciation of the existing assets.
5.2 Cost and emissions analysis
In order to conduct an analysis of the cost and emissions reductions that could be expected from the modified processes described in section 4, projections for the price of electricity and gas, and assumptions regarding the percentage of renewables used to generate the electricity consumed are required. Three scenarios were developed in order to provide reasonable upper and lower bounds for these projections, as well as an intermediate scenario to indicate the scaling between these bounds. These scenarios are summarised below In each scenario, it assumed that the gas prices will rise at a rate consistent with historical trends, and the processes considered will operate for 6,989 hours p.a. (i.e., at a capacity factor of 80%)
Scenario 1: ‘Business as usual’
• Electricity is assumed to be obtained from 100% fossil sources.
• It is assumed that electricity prices will rise at a rate consistent with historical trends
Scenario 2: 50% renewable electricity
• Electricity is assumed to be obtained from 50% renewable sources.
• It is assumed that electricity prices will rise at a rate consistent with a 50/50 weighting of historical price trends and the projected trend of the LCOE from renewables
Scenario 2: 82% renewable electricity (based on government targets)
• Electricity is assumed to be obtained from 82% renewable sources.
• It is assumed that electricity prices will rise at a rate consistent with a 18/82 weighting of historical price trends and the projected trend of the LCOE from renewables
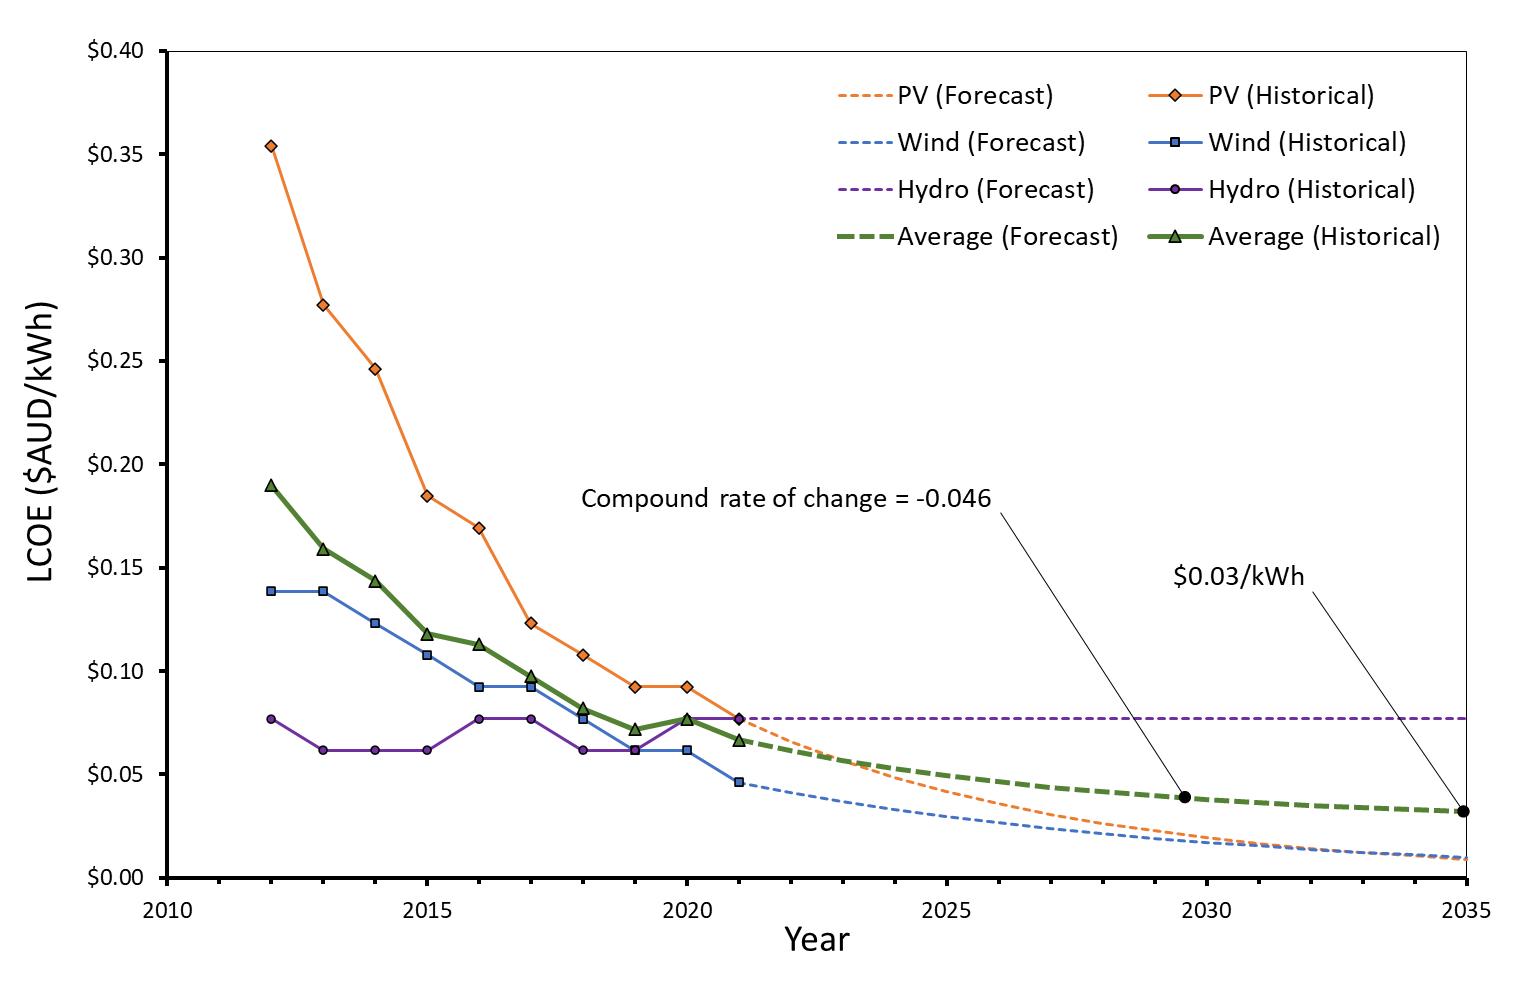
The levelized cost of energy (LCOE) from renewables (specifically PV, onshore wind and hydro) is shown in Figure 19 based on data from IRENA (2023). For each of the sources shown, the LCOE was projected through to 2035 based on their respective historical compound rates of change. The average of these sources was calculated in order to get a projected rate of change in LCOE to use for scenarios 2 and 3.
25
Table 5. MVR compressor specifications required.
The historical prices for gas and electricity and subsequent projections based on scenarios 1 to 3 are shown in Figure 20 The data for historical gas and electricity prices was obtained from the Australian Energy Regulator (AER 2023b, 2023a). The projections under scenarios 1 to 3 are based on this data and the data on the LCOE from renewable sources from IRENA (IRENA 2023) as described above.
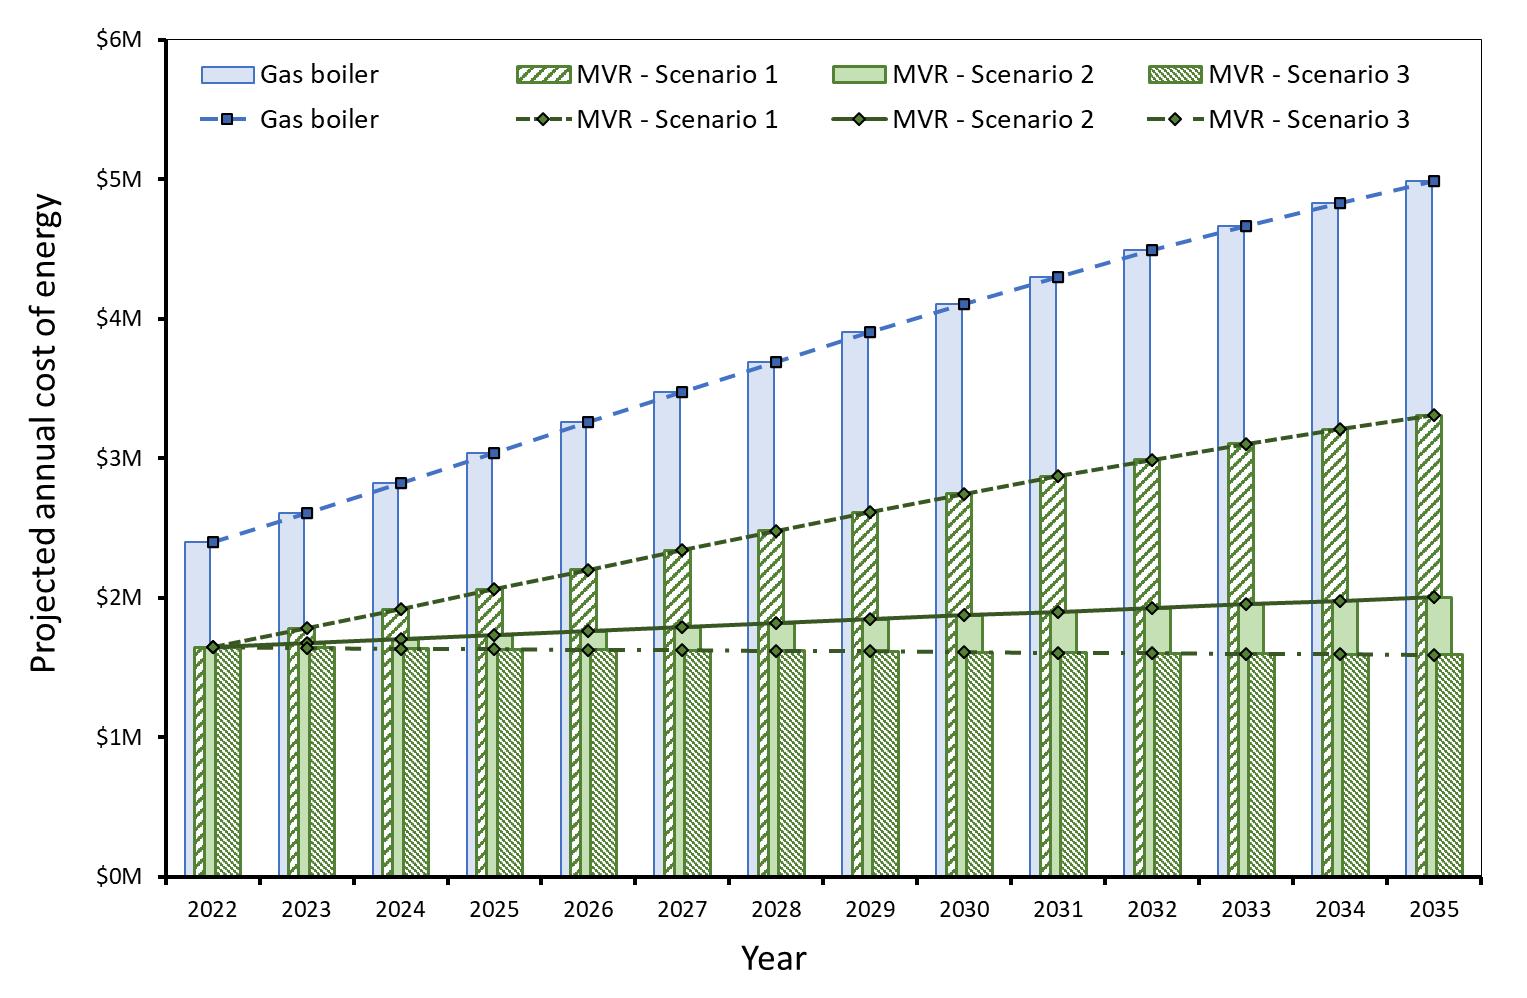
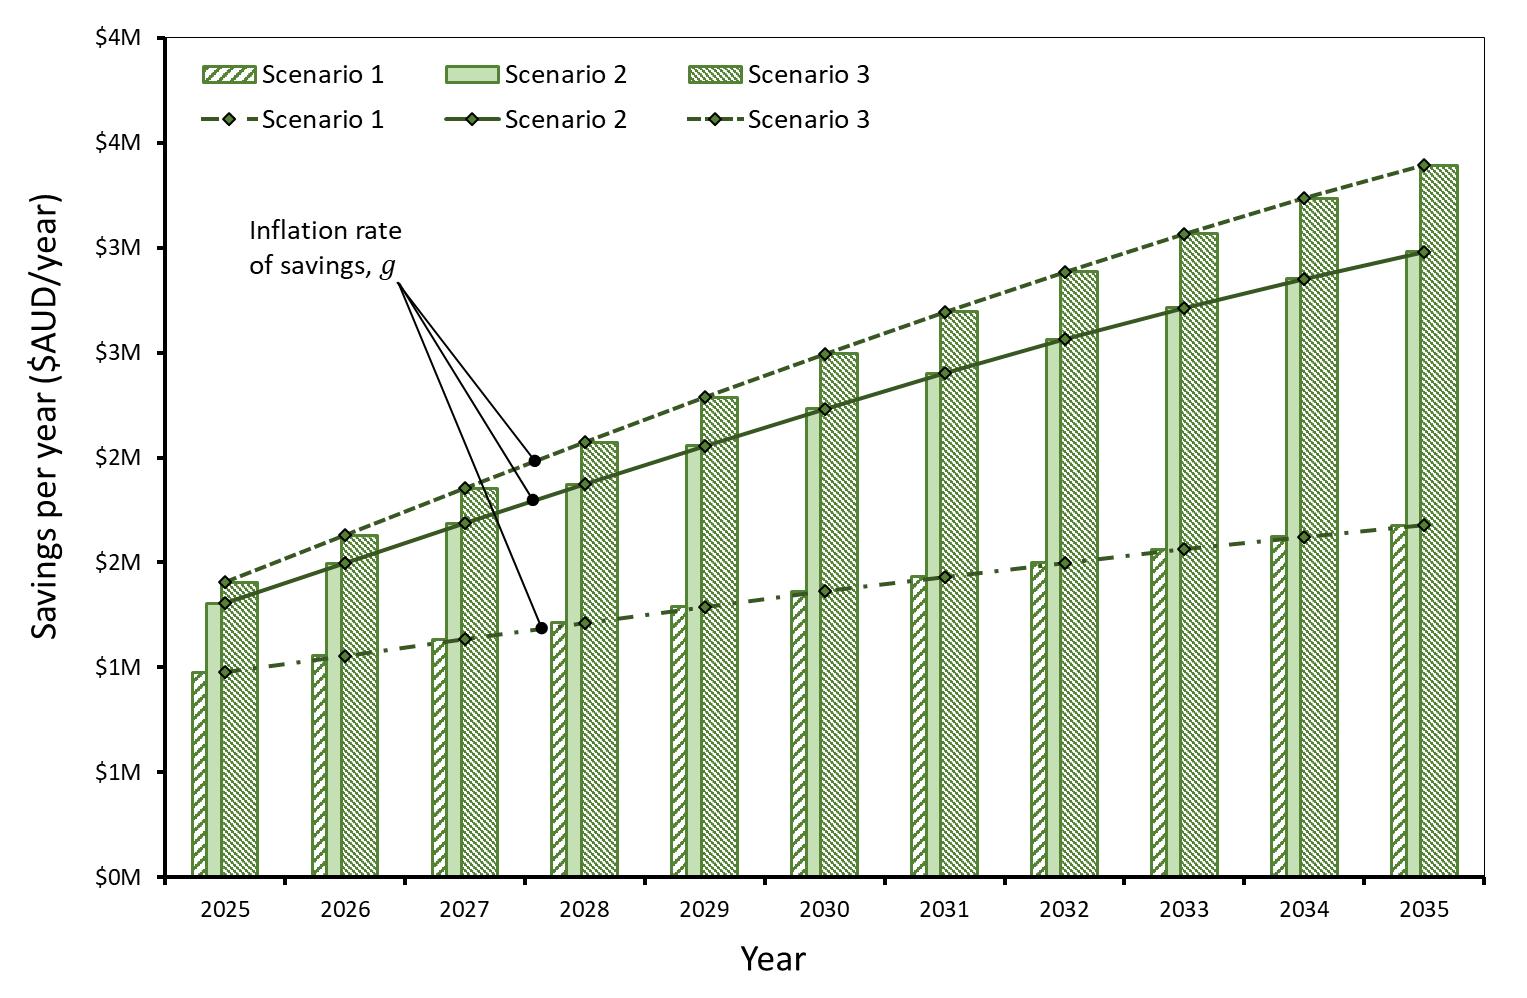
Based on these projections, and the energy consumptions calculated for the gas fired and MVR based rendering processes, the annual cost of energy was determined From these projected costs, the annual savings due to the difference in the cost of energy for an MVR based process compared to a gas boiler system were calculated These are shown for a 10 tonne per hour rendering process in Figures 21 and Figure 22 respectively.

26
Figure 19. Average LCOE from renewables (PV, wind and hydro) (IRENA 2023)
Figure 20. Historical and projected prices for gas and electricity under scenarios 1 to 3 based on data from AER and IRENA
Due to the variation in existing process equipment from one site to another, determining useful estimations of the CAPEX required to modify a process to use heat pumps and MVR to replace fossil methane boilers grew beyond the scope of this project. However, in order to provide a point of reference, a rough estimation of CAPEX is provided in Table 6 below based on the heating capacity required from the heat pump + MVR system
27
Figure 21. Projected annual cost of energy for a 10 tonne per hour rendering process comparing a gas boiler system with MVR under 3 scenarios.
Figure 22. Annual savings due to reduced cost of energy for 10 tonne per hour MVR heated dry rendering compared to a gas boiler system.
for 1, 10 and 20 tonne/hr processes. In literature, the cost of heat pump systems based on heating capacity has been estimated as approximately $500.00 AUD per kWth (Cox, Belding, and Lowder 2022), however feedback from the IRG suggested that this should be closer to $1,000.00 AUD per kWth of required heating capacity. In order to provide more conservative estimates, this higher figure was used. The CAPEX for auxiliary equipment (e.g., ducting, filters etc.) was assumed at 10% of the CAPEX of the heat pump + MVR system, and installation costs were assumed at 5%.
In order to account for departures from the assumptions in Table 6, payback periods were calculated for a range of capital expenditures based on the savings shown, for a 10 tonne per hour process, in Figure 22.
The payback periods were calculated using the following formula for savings starting in 2025:
CAPEX
Year 1 savings = 1 � (1 + g)n (1 + d)n � �1 + d 1 + g � 1
Where:
���� is the payback period,
���� is the inflation rate of the savings,
���� is the discount rate (assumed at 15%)
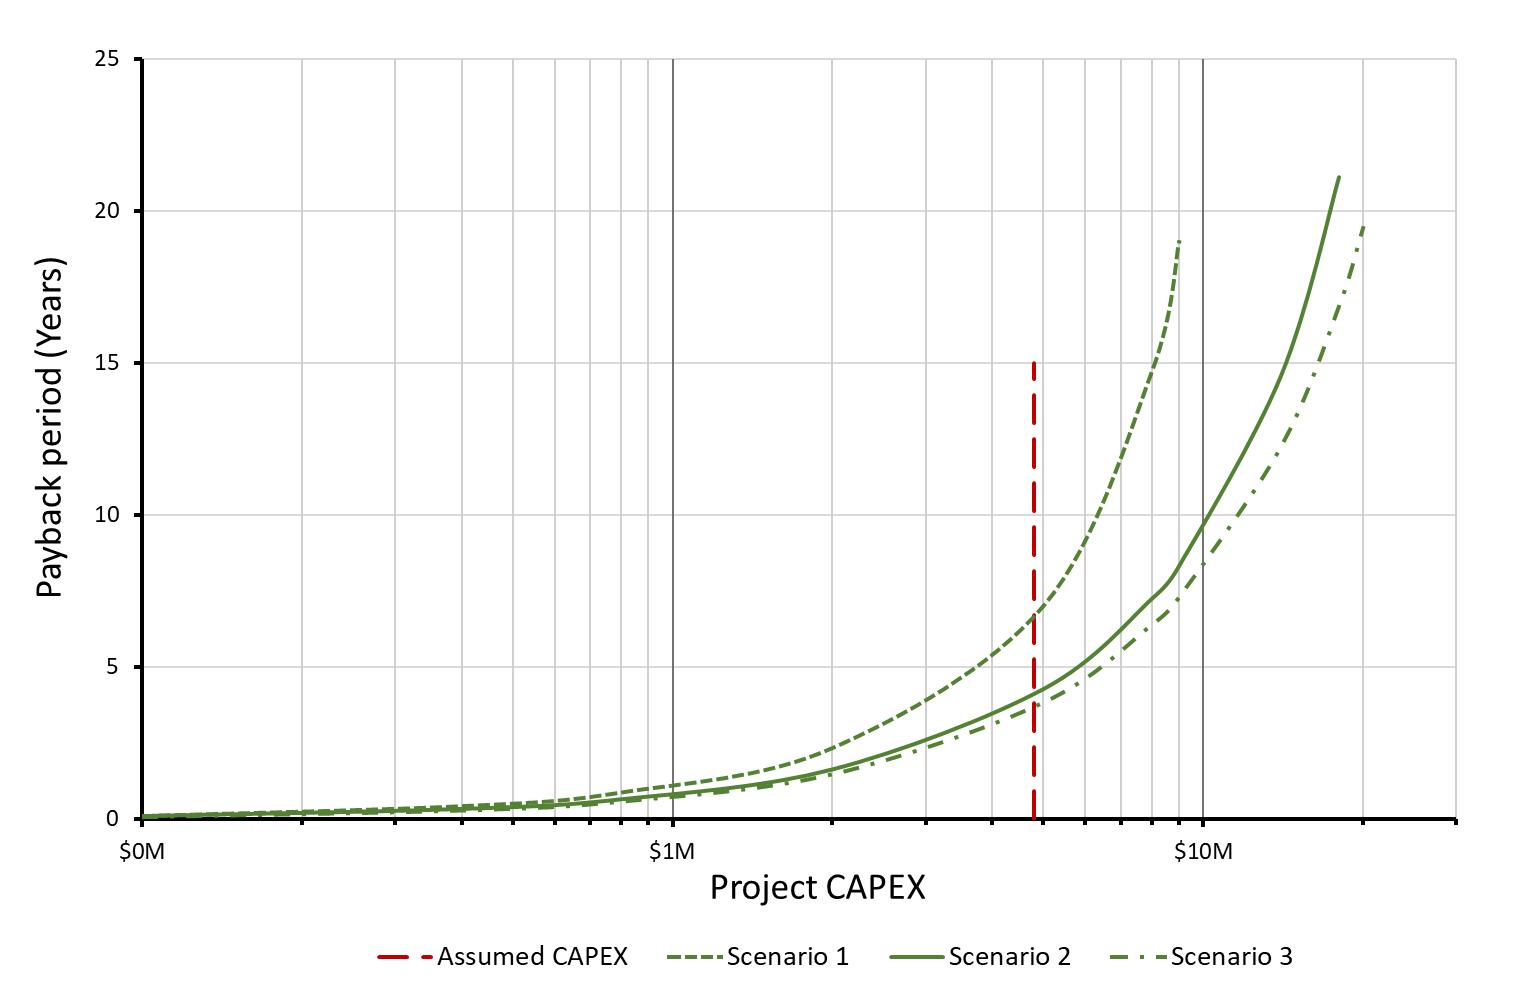
The calculated payback periods for 10 and 20 tonne per hour, wet and dry rendering processes are shown in Figures 23 to 26 Considering these figures, it can be seen that the reduced overall COP for an MVR based wet rendering process as presented in section 4.3 (COP of 1.8 compared to 3.2) results in a riskier proposition without additional income or support on top of the cost of energy savings. To retrofit a 10 tonne per hour dry rendering process, a project budget up to $10M AUD could be recovered in less than 10 years under scenarios 2 and 3, and up to $6M in the same time period for scenario 1. On the other hand, under scenario 1 projections,
28
1 tonne/hr* 10 tonne/hr 20 tonne/hr Dry rendering HP + MVR Capacity, kWth 425 4,198 8,422 CAPEX (HP + MVR), $AUD1 $0.4M $4.2M $8.4M CAPEX (Aux. equipment), $AUD2 $42K $420K $842K Installation cost3 $21K $210K $421K CAPEX Total, $AUD $0.5M $4.8M $9.7M Wet rendering HP + MVR Capacity, kWth 115 1,176 2,351 CAPEX, $AUD1 $0.1M $1.2M $2.4M CAPEX (Aux. equipment), $AUD2 $12K $118K
Installation cost3 $6K $59K
CAPEX Total, $AUD $0.1M $1.4M $2.7M
Estimated as $1000 AUD per kWth 2 Estimated as 10% of HP + MVR CAPEX
Estimated as 5% of HP + MVR CAPEX
Table 6. Ball Park estimation of CAPEX based on required heating capacity.
$235K
$118K
1
3
a 10 tonne per hour wet rendering process retrofit would only have a budget of up to $300K AUD for a payback period less than 10 years. Scenario 2 and 3 projections increase this to around $7M - $10M AUD for the same payback period, however the large spread represents a much greater risk on the investment. It should be noted that the CAPEX for a wet rendering retrofit should be lower due to reduced overall equipment capacities required (see Tables 4, 5 and 6), however this will not offset all of the increased risk
Based on the assumptions in Table 6, as well las the assumptions and resulting payback period curves shown in Figures 23 and 24, it could be estimated that a retrofit project for a 10-20 tonne per hr dry rendering process would have a payback period of 4-7 years depending on the future cost of electricity. For a retrofit project of a 10-20 tonne per hr wet rendering process, based on the assumptions in Table 6 and the curves in Figures 25 and 26, it could be estimated that the payback period would be between 2.5-3.5 years under scenario 2 and 3 projections for electricity prices. The scenario 1 projections however would result in a payback period well in excess of 20 years which is clearly not feasible. These estimates indicate that the reduced equipment requirements for a wet rendering process do have the potential to result in lower payback periods than a dry rendering process, however the charts also re-enforce the greater risk associated with the cost of electricity projections.
With 1 to 1 funding support for CAPEX, payback periods for both process types could be reduced to around 23 years (excepting the scenario 1 case for wet rendering), however it must be noted that the estimates of CAPEX used to arrive at these figures are very coarse, and site-specific analysis would need to be conducted to confirm their validity.
29
Figure 23. Payback period vs CAPEX for a 10 tonne per hour dry rendering process based on savings due to reduced cost of energy. Assumed CAPEX from Table 6.


30
Figure 24 Payback period vs CAPEX for a 20 tonne per hour dry rendering process based on savings due to reduced cost of energy.
Assumed CAPEX from Table 6.
Figure 25. Payback period vs CAPEX for a 10 tonne per hour wet rendering process based on savings due to reduced cost of energy.
Assumed CAPEX from Table 6

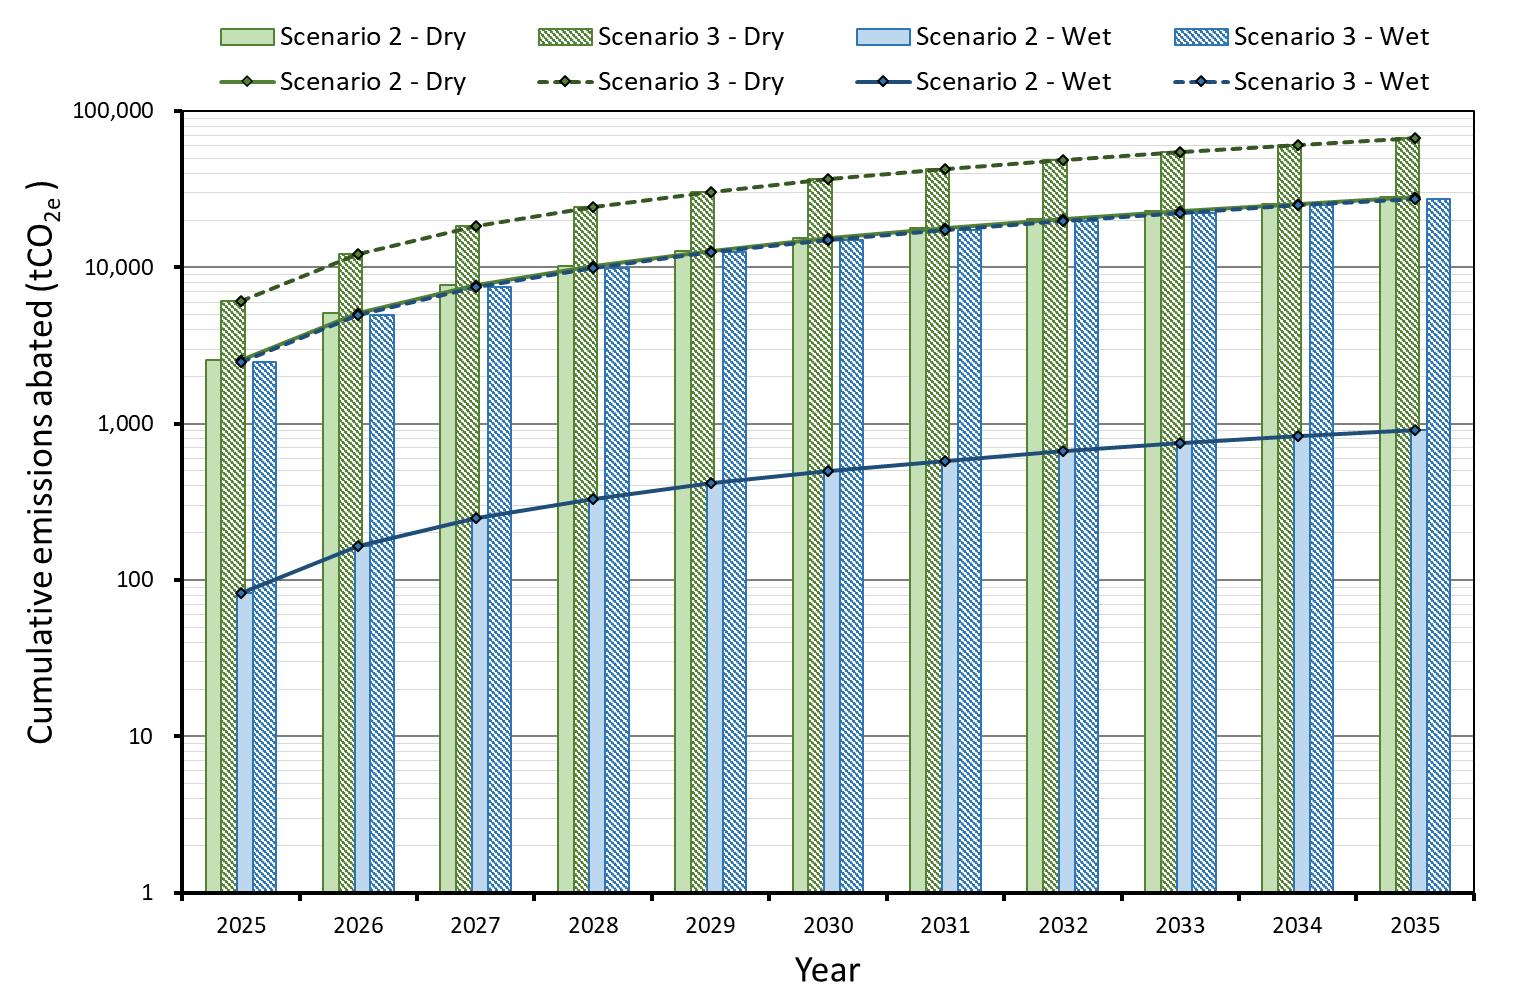
The cumulative emissions abated from switching to an electrically driven MVR based rendering process from a fossil methane boiler system are shown for a 10 tonne per hour process in Figure 27 The figure shows projections for both wet and dry processes under scenarios 2 and 3. Scenario 1, which assumes 0% renewable electricity, results in a net increase in emissions due to the higher emissions factor associated with fossil sourced electricity (compared to gas combustion) offsetting the reduced energy consumption for both wet and dry processes. The emissions factors used in this calculation are summarised in Table 7
It can be seen that, once again, the reduced overall COP achievable in a wet rendering process with MVR results in significantly reduced emissions reductions compared to an equivalent fossil methane boiler system. It is important to note however, that in both cases there is the potential to completely eliminate emissions through the use of 100% renewable power.
31
Figure 26 Payback period vs CAPEX for a 20 tonne per hour wet rendering process based on savings due to reduced cost of energy. Assumed CAPEX from Table 6.
32
Figure 27 Projected cumulative emissions abated for 10 tonne per hour wet and dry rendering processes under scenarios 2 and 3.
CO2-e emissions factors Fossil methane 56 gCO2-e/MJheating Electricity (fossil source) 260 gCO2-e/MJ Electricity (50% renewable) 130 gCO2-e/MJ Electricity (82% renewable) 47 gCO2-e/MJ
Table 7. Emissions factors used to calculate cost of energy.
6 Outcome of IRG meetings
This section summarises the outcomes of the three IRG meetings that were held throughout the course of the project.
6.1 Outcome of 1st IRG meeting
The main goal of the first industry reference group (IRG) meeting was to introduce the project to the IRG members and obtain feedback on the direction of the project. Further, if industry could see any immediate barriers to the project as planned, this meeting was intended to identi fy and address these. The outcome of the meeting is summarised in the following sections.
6.1.1 Feedback on project overview
The feedback on the project overview primarily consisted of clarifications to different aspects of the rendering process and existing heat recovery efforts as follows:
It was suggested in the meeting that the majority of the industry is made up of low-temperature wet rendering operations, however, this assertion could not be confirmed based on the experience of the IRG members.
The difference between wet/low-temperature and dry/high-temperature rendering processes was clarified; In high-temperature dry rendering, moisture is fully evaporated during the rendering process, resulting in a dry product leaving the cooker which is then pressed to separate the out tallow. In the low-temperature wet process, the bulk of the liquid in the feed is not evaporated and is instead separated in a centrifugal separator after the cooker. Further, while wet rendering might lend itself more to heat recovery due to the lower temperatures, there is no realistic way to convert from a high-temperature to a low-temperature process. Aside from the differences in equipment used for each process, this is also due to the difference in output quality which typically favours either tallow (low temperature/wet) or meat meal production (high temperature/dry). While there have been some studies on the quality differences between these two process types, the IRG was not aware of any studies on the differences in energy consumption.
The temperatures typical of high-temperature dry rendering were clarified; The melt tank peak temperature is typically around 92°C, while the inlet steam (to the steam jacket) is approximately 180°C at 1,000 kPa, which then falls to around 130°C-135°C at the outlet. The inlet steam pressure varies slightly based on the cooker type e.g., a disc cooker might use steam at 600 kPa, while a satellite cooker might use steam at 800-960 kPa.
It was also noted that there are some high-temperature and high-pressure rendering processes, where the elevated pressure is required to break down keratin in wool, hair etc.
Finally, it was noted that in addition to the relatively common use of waste heat from rendering to provide heat for cleaning water, another use of waste heat in low-temperature wet rendering is for water recovery from the stickwater that leaves the centrifugal separator. However, most plants still produce more waste heat than can be recovered by either of these approaches.
6.1.2 Interest in heat recovery projects
The IRG members recognise that heat in the rendering process is still underutilised, and that despite some level of heat recovery typically being employed, there is both scope and drive within the industry to do more. Heat pumps have been explored in the past as a possible solution, however at the time they were deemed an
33
uneconomical solution. Recent developments in high temperature heat pumps and rise in the energy cost might make this worth revisiting, and it was noted that the government support, improvements in efficiency and reduced payback periods would get such projects on track faster.
6.1.3 Prior MVR studies
As mentioned above, there have been some studies on the feasibility of heat pumps to supply process heat for rendering. Further, MVR has been used successfully in other industries such as paper, dairy and sugar production. It is a common solution for evaporation processes where there is a relatively clean source of fluid to evaporate and a relatively stable rate of vapour generation.
6.1.4 Barriers
As mentioned above, MVR is typically used where there is a relatively clean source and a stable rate of vapour generation. In rendering however, this is not the case; There is often a lot of surging in the vapour generation in rendering due to inconsistent feed mixture composition. This also results in oil and fine meat/protean particles being atomised and carried away with the vapour. One obvious solution to dealing with this contamination and inconsistency would be to use an indirect heat exchanger to evaporate a clean source for MVR. However, with sufficient incentive, it might be possible to develop alternative MVR equipment that can handle these input conditions.
If onsite solar were to be used to supply an electrified rendering process, energy storage would also be required as it would be nearly impossible to reliably schedule the use of rendering plants during periods of solar availability. This is primarily due to variations in upstream processes that are outside the control of rendering plant operators. It is possible that sites with biogas production and co-generation capabilities (which can typically provide up to 10% of the energy demand) could use this to fill any gaps in solar availability, however such capabilities are not ubiquitous and so would still represent significant additional cost for most sites.
As touched on in the previous sections, while there is drive within the industry to improve efficiency and reduce emissions, the cost of any proposed solution is still a significant barrier to implementation. If significant reductions in operating costs can be demonstrated alongside emissions reductions, the payback period might be attractive enough to overcome this barrier. However, in the absence of this, alternative solutions such as equipment subsidies might need to be considered.
6.1.5 Initial IRG extended survey
In addition to the 1 st IRG meeting results, AMPC sent out a short survey to representatives of the meat processing and related industries.
The following are the questions that were included:
1. How are you connected to the meat processing/rendering industry? (e.g., Rendering plant, Equipment manufacturer/supplier, Industry body, other)
2. Is your organisation open (in principle) to exploring energy efficiency and/or emissions reduction projects? (Y/N, more details optional)
3. Is the outcome of the specific project described here of potential interest to your organisation? (Y/N, more details optional)
4. Are you aware of any other projects that have explored the use of MVR and/or heat pumps for heat supply in meat rendering?
4.1. If yes, can you provide any details?
34
5. Are you aware of any barriers to this projects success or acceptance that should be considered?
5.1. If yes, can you provide any details?
6. (Optional) Do you have any further comments or feedback?
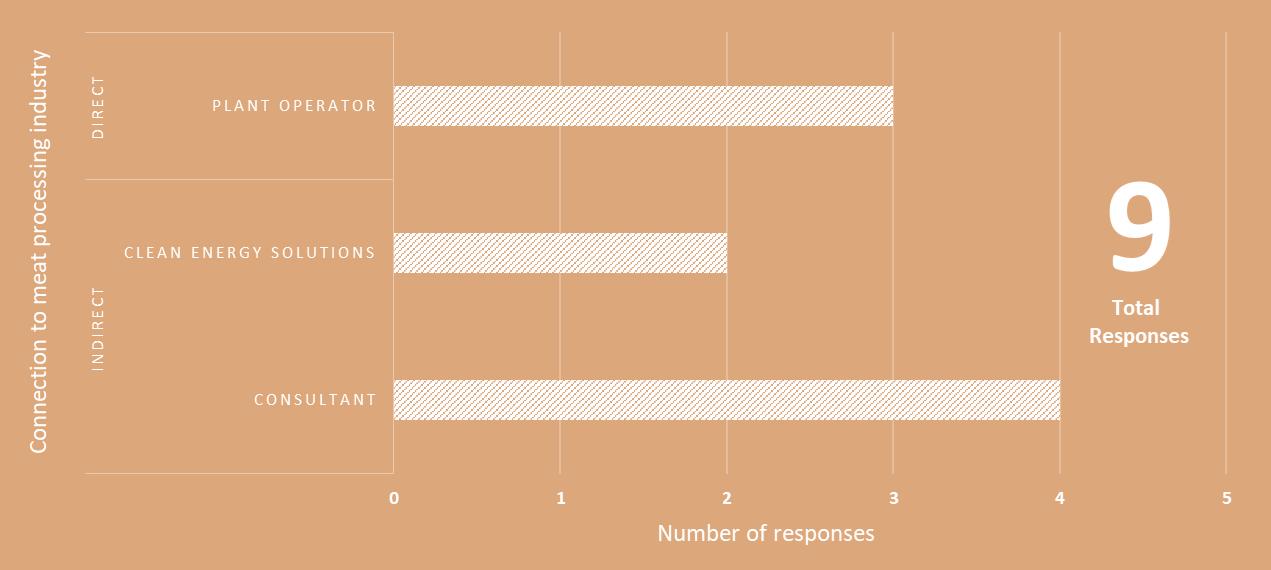
The key results of this survey are summarised below. Figure 28 shows the number and distribution of responses to the above industry survey questions. Out of the nine total responses, three were from rendering plant operators. The remaining responses were from sources indirectly connected to the rendering industry and included responses from energy/environmental consultants and clean energy solutions engineering firms.
Overwhelmingly, interest in both emissions reduction projects in general and the outcome of this project in particular was high. However, it is noted that this is a somewhat biased result, both because the survey questions were sent to organisations that were likely re-disposed to this attitude, and further because any that were not interested would have been less likely to respond at all. As a result, any future surveys will avoid this sort of question and instead focus on fewer, more targeted questions.
The vast majority (~78%) of responses were not aware of any prior projects investigating MVR specifically in rendering, however some installations of heat pumps, as well as MVR projects in other industries (milk powder and soft drink) were noted. The historically low evaporator temperatures of heat pumps were suggested as a possible factor contributing to this lack of prior exploration. One notable exception that was mentioned in one of the survey responses was an old project (1987) in the EU which sought to demonstrate the use of MVR with a continuous steam heated contact dryer for processing animal by products, i.e., rendering.
The following barriers were highlighted in the survey responses:
• Capital cost and payback periods.
• General inertia/resistance to change.
• Space and or structural requirements of any new technology/equipment.
• Capacity of electrical distribution networks to meet increased demand.
• Electricity price uncertainty.
• Lingering impacts of COVID19 on appetite for projects of strategic importance (rather than just maintaining operation).
• Competition with existing heat recovery solutions (e.g., water heating).
• High process temperatures.
• Impact of vapour contamination (with water, oil, solids) on MVR.
• Lack of metering/detailed data in existing processes.
35
Figure 28. IRG survey: Distribution of responses with respect to industry and connection to the meat processing industry.
The first three can be considered as standard barriers that will need to be addressed by any project that will require industry to change or adopt new solutions. Further, the barriers associated with electricity supply go hand in hand with any electrification project. The lack of specific process flow data is an issue that had already been encountered.
6.2 Outcome of 2nd IRG meeting
The primary purpose of the 2nd IRG meeting was to update the IRG on the ‘progress so far’ and to ensure that any assumptions that had been made were valid. As a result, the amount of feedback from this meeting was limited in comparison to the first one. In addition to sanity checking the model at the time of the meeting, the key outcome of this meeting was feedback on the most appropriate format of the eventual output of the model. It was suggested that a simple chart or info doc in a ‘ready reckoner’ style would be the most useful. This was in comparison to a more complex packaged model which would be less attractive, at least initially. Basing the ‘ready reckoner’ around a 10 tonne/hr rendering feed rate as a default would be acceptable, however there would also need to be a simple means of determining the expected economic and environmental outcomes and equipment requirements for different configurations, feed rates and product/feed types where relevant
6.3 Outcome of 3rd IRG meeting
Similar to the 2nd meeting, the outcome of the 3rd IRG meeting was primarily limited to feedback on the modelling results. An overview of the modelling results was presented including validation, energy and exergy flows for typical wet and dry rendering processes, and energy and exergy flows for modified wet and dry rendering processes with hybrid heat pump and MVR replacing natural gas (fossil methane) boilers. Preliminary progress on costing and emissions reductions were also covered. The most notable piece of feedback was concerning the preliminary costing analysis. It was suggested that there was insufficient or inconclusive information available to provide accurate project costing, and that this had the potential to be more detrimental than not including it at all. This led to the final approach taken in this report.
36
7 Conclusions and recommendations
Rendering accounts for approximately 37% of the total energy use intensity for meat processing, equating to 1,223 MJ/t HSCW in 2020 The majority of this energy is supplied by natural gas/fossil methane steam generators which results in around 520,000 tonnes of CO2-e emissions per year.
Prior to 2000, the split between batch and continuous rendering was approximately 50/50 and dry rendering accounted for around 85-90% of rendering operations. In 2005, dry rendering had reduced to 80-85% of operations and current industry feedback suggests that this is now closer to 60%.
Current heat pump technology, including the use of MVR, is able to achieve COPs between 2 and 3 with a temperature lift up to 80°C, and condensing temperature as high as 150°C. This level of performance is typically achieved with some combination of vapour compression (including MVR), supercritical CO2 or ammonia heat pumps, either alone or in a hybrid configuration. Heat pumps and MVR have shown notable promise in both the dairy processing and alumina refining industries.
The model developed for this project is flexible enough to be adapted to and simulate a range of rendering process configurations and has been validated against data from industry. The model has shown that, for dry rendering, there is sufficient heat available in the cooker exhaust (in the form of vapour) that can be recovered with an overall COP of 3.2 such that it would completely eliminate the need for any gas combustion. For wet rendering however, the improved energy efficiency inherent in the process r esults in there being insufficient recoverable heat in the process to completely remove the need for an auxiliary heat source during operation. If this auxiliary heat source is electric however, the overall COP will still be greater than 1 at 1.8
The economic analyse completed indicates that even if the current relationship between gas (fossil methane) and electricity remains the same through to 2035 (as in scenario 1), retrofit projects for dry rendering processes will likely be able to achieve a payback period of approximately 7 years for the assumed project CAPEX of $5M – $10M AUD (depending on process throughput i.e., approx. $0.5M per tonne per hour of rendering feed rate) If the gap between gas and electricity prices reduces, the payback period is significantly reduced to around 3.5-4 years for the same CAPEX assumptions For wet rendering retrofit projects however, the outcome is not as clear cut, and it is likely that additional support would be needed to make such projects economically attractive. Specifically, the scenario 2 and 3 projections for electricity and gas prices would result in payback periods of 2.5-3.5 years for assumed project CAPEX of around $1.5M - $3M, however the payback period under scenario 1 projections would be in excess of 20 years. In either case, a more detailed, site-specific cost analysis would need to be conducted to determine the likely actual CAPEX of an MVR retrofit.
The potential reduction in emissions from the proposed MVR/heat pump integration is fairly straight forward. Due to the higher emissions associated with electricity from fossil sources compared to heat directly from gas combustion, around 50% renewables are required in the mix of electricity sources in order to start seeing a notable reduction in emissions. However, in the proposed modifications for both wet and dry rendering processes, the heat supply is able to be completely electrified, meaning that through a combination of the government renewable targets, purchase agreements and/or onsite renewable power generation, there is a clear path to complete decarbonisation of the process heat.
It is recommended that a detailed site-specific energy analysis, system design, and implementation feasibility analysis be carried out prior to a pilot demonstration
37
7.1 Additional notes
There are two additional points that should be noted with respect to the assumptions and analysis in this report. These are as follows:
1. Given the need to include full capacity electric boilers/heating elements to enable start-up (in the best case) of the MVR + heat pump systems analysed in this report, it is worth considering whether these alone could be used to displace the need for fossil fuel combustion in the rendering industry. And with respect to emissions, as long as the electricity was sourced close to 100% renewably either onsite or via a sufficiently low carbon intensity grid, there is little difference between the two solutions
However, under the gas vs electricity price scenarios considered in this report, the increased cost of running a straight electric boiler (COP ~ 1) would far outweigh any reduction in capital cost associated with the simpler system.
For a simple electric boiler to be a cost-effective replacement for a gas boiler, either an alternative source of savings would need to be identified (only the difference in the cost of energy was considered in this report), or, a solution or arrangement found such that the electricity used to power the electric boiler could be sourced at a lower cost/MJ than is currently paid for gas.
2. Throughout this report, distinction has been made between wet and dry rendering processes , and this distinction includes the assumption that the stickwater that is mechanically separated from the tallow in a wet rendering process is considered a waste stream and is completely removed from the process. In reality, there are some wet rendering processes where this is not the case and the protein solids that are contained in the stickwater are recovered in an additional evaporative concentration process (typically using waste heat from the boiler flue gasses). The concentrated stickwater is then sent to the drier along with the solids.
This variation was not explicitly modelled as part of this project, however, as the heat from the flue gasses would no longer be available in an MVR based system, both the total evaporation requirement and the heat available for recovery would be similar to the dry rendering process modelled. Therefore, the economic and environmental impact of such a system being converted to utilise heat pumps and MVR to replace gas combustion could be assumed to be similar to what was found for the dry rendering process in this report.
38
8 References
AER. 2023a. 'Annual volume weighted average 30-minute prices - regions'.
https://www.aer.gov.au/industry/registers/charts/annual-volume-weighted-average-30-minute-prices-regions.
. 2023b. 'Gas market prices'. https://www.aer.gov.au/industry/registers/charts/gas-market-prices
Ahirrao, Shrikant. 2014. 'Chapter 13 - Zero Liquid Discharge Solutions.' in Vivek V. Ranade and Vinay M. Bhandari (eds.), Industrial Wastewater Treatment, Recycling and Reuse (Butterworth-Heinemann: Oxford).
Alcoa, and Pure Font Communications. 2022. "Mechanical Vapour Recompression for Low Carbon Alumina Refining: Mechanical Vapour Recompression (MVR) Technical and Commercial Feasibility Studies - A SUMMARY REPORT." In, edited by Alcoa of Australia Limited. Australian Renewable Energy Agency.
All Energy Pty. Ltd. 2021. "2020 Environmental Performance Review (EPR) for the Red Meat Processing (RMP) industry." In. North Sydney NSW: Australian Meat Processor Corporation and Meat & Livestock Australia Limited.
Atkins, Martin John, and Michael R. W. Walmsley. 2013. '28 - Applications of Process Integration Methodologies in Dairy and Cheese Production.' in Jiří J. Klemeš (ed.), Handbook of Process Integration (PI) (Woodhead Publishing).
Becker, B. R., and B. A. Fricke. 2003. 'FREEZING | Principles.' in Benjamin Caballero (ed.), Encyclopedia of Food Sciences and Nutrition (Second Edition) (Academic Press: Oxford).
Bühler, Fabian, Benjamin Zühlsdorf, Tuong-Van Nguyen, and Brian Elmegaard. 2019. 'A comparative assessment of electrification strategies for industrial sites: Case of milk powder production', Applied Energy, 250: 1383-401.
Chamoun, Marwan, Romuald Rulliere, Philippe Haberschill, and Jean-Louis Peureux. 2014. 'Experimental and numerical investigations of a new high temperature heat pump for industrial heat recovery using water as refrigerant', International Journal of Refrigeration, 44: 177-88.
Chatfield, Ray, and Alcoa. 2022a. "Mechanical Vapour Recompression for Low Carbon Alumina Refining: MVR Evaporation Feasibility Study." In, edited by Alcoa of Australia Limited.
. 2022b. "Mechanical Vapour Recompression for Low Carbon Alumina Refining: MVR Retrofit and Commercialisation Report." In, edited by Alcoa of Australia Limited.
Choy, Sandra, and Harriet Gibson. 2023. "Australia's action plan for power sector decarbonisation." In.
Colley, Tracey. 2015. "Gas consumption reduction in a rendering plant." In. North Sydney NSW: Meat & Livestock Australia Limited.
Cox, Jordan, Scott Belding, and Travis Lowder. 2022. 'Application of a novel heat pump model for estimating economic viability and barriers of heat pumps in dairy applications in the United States', Applied Energy, 310: 118499.
Dahmardeh, Hamed, Hossein Ali Akhlaghi Amiri, and Seyed Mostafa Nowee. 2019. 'Evaluation of mechanical vapor recompression crystallization process for treatment of high salinity wastewater', Chemical Engineering and Processing - Process Intensification.
Dawkins, Ruth, and Scott Walker. 2023. "Building the future grid: reshaping Australia's largest machine." In CSIRO News and articles
Despars, David. 2023. 'Declutter Your Natural Gas Model'. https://www.aft.com/support/product-tips/natural-gas-model
ESA-Pyronics. 2000. "An introduction to combustion." In ESA Pyronics International, edited by ESA-Pyronics.
Evans, Michael, Martin Belusko, Alireza Taghipour, Ming Liu, Patrick F. Keane, Jack Nihill, Ruhul Amin, Aaron Liu, Jihane Assaf, Tim Lau, Ke Xing, Thomas Rainey, Cameron Stanley, Abhijit Date, Bruce Bonney, Jarrod Leak, Jahangir Hossain, Wendy Miller, Gary Rosengarten, and Frank Bruno. 2021. Electrification & Renewables to Displace Fossil Fuel Process Heating (RACE for 2030 CRC: Australia).
Food Science. 2015. 'What is latent heat?'. https://www.foodscience-avenue.com/2015/03/latentheat.html#:~:text=The%20latent%20heat%20of%20fusion,80%20to%20200%20J%2Fg
Food Science Australia. 1997a. 'Environmental Control in the Rendering Industry.' in, Rendering Advisory Package (CSIRO: Australia).
. 1997b. 'Meat and Bone Meal.' in, Rendering Advisory Package (CSIRO: Australia).
. 1997c. 'Rendering.' in, Energy Management Advisory Package (CSIRO: Australia).
39
. 1997d. 'Rendering systems.' in, Rendering Advisory Package (CSIRO: Australia).
. 1997e. 'Tallow.' in, Rendering Advisory Package (CSIRO: Australia).
. 2005. 'Validation of rendering processes.' in, Meat technology - information sheet (CSIRO: Australia).
. 2007. 'Tracking Rendering Costs.' in, Meat technologyupdate (CSIRO: Australia).
Graham, A., and Cain, B. P. 1978. 'Waste heat recovery from pollution control devices used with dry rendering plants.' in, Meat research report (CSIRO: Australia).
Han, Dong, Zetian Si, and Junjie Chen. 2021. 'Analysis of an intermittent mechanical vapor recompression evaporation system', Applied Thermal Engineering, 193: 116996.
Hu, Bin, Di Wu, and R. Z. Wang. 2018. 'Water vapor compression and its various applications', Renewable and Sustainable Energy Reviews, 98: 92-107.
IRENA. 2023. Renewable power generation costs in 2022 (International Renewable Energy Agency: Abu Dhabi).
IT'IS Foundation. 2023. 'Database of Tissue Properties'. https://itis.swiss/virtual-population/tissue-properties/database/heatcapacity/
Jiang, Jiatong, Bin Hu, R. Z. Wang, Na Deng, Feng Cao, and Chi-Chuan Wang. 2022. 'A review and perspective on industry hightemperature heat pumps', Renewable and Sustainable Energy Reviews, 161: 112106.
Kim, Yurim, Jonghun Lim, Hyungtae Cho, and Junghwan Kim. 2022. 'Novel mechanical vapor recompression-assisted evaporation process for improving energy efficiency in pulp and paper industry', International Journal of Energy Research, 46: 340927.
Lemmon, E. W., Ian H. Bell, M. L. Huber, and M. O. McLinden. 2018. "NIST Standard Reference Database 23: Reference Fluid Thermodynamic and Transport Properties-REFPROP, Version 10.0, National Institute of Standards and Technology." In. Gaithersburg.
Marechal, François, Anurag Kumar Sachan, and Leandro Salgueiro. 2013. '27 - Application of Process Integration Methodologies in the Brewing Industry.' in Jiří J. Klemeš (ed.), Handbook of Process Integration (PI) (Woodhead Publishing).
ProAnd Associates Australia Pty. Ltd. 2006. "The costs of rendering." In. North Sydney NSW: Meat & Livestock Australia Limited.
Ridoutt, Brad, and Anita Sikes. 2023. "Environmental Performance Review 2022: Red Meat Processing Industry." In. North Sydney NSW: Australian Meat Processor Corporation Ltd (AMPC).
Saidur, R., J. U. Ahamed, and H. H. Masjuki. 2010. 'Energy, exergy and economic analysis of industrial boilers', Energy Policy, 38: 2188-97.
Šarevski, Milan N., and Vasko N. Šarevski. 2017. 'Thermal characteristics of high-temperature R718 heat pumps with turbo compressor thermal vapor recompression', Applied Thermal Engineering, 117: 355-65.
Šarevski, V. N., and M. N. Šarevski. 2012. 'Energy efficiency of the thermocompression refrigerating and heat pump systems', International Journal of Refrigeration, 35: 1067-79.
Seilert, Julia, Susanne Rudolph-Flöter, and Eckhard Flöter. 2021. 'On the Relation of Entropy and Enthalpy of Fusion in Triglycerides', European Journal of Lipid Science and Technology, 123: 2100098.
Sentance, Chris. 2011. "Optimising integrated water reuse and waste heat recovery in rendering plants and abattoirs." In. North Sydney NSW: Meat & Livestock Australia Limited.
Urbaniec, Krzysztof, Mirosław Grabowski, and Jacek Wernik. 2013. '29 - Applications of Process Integration Methodologies in Beet Sugar Plants.' in Jiří J. Klemeš (ed.), Handbook of Process Integration (PI) (Woodhead Publishing).
Walmsley, Timothy G., Martin J. Atkins, Michael R. W. Walmsley, and James R. Neale. 2016. 'Appropriate placement of vapour recompression in ultra-low energy industrial milk evaporation systems using Pinch Analysis', Energy, 116: 1269-81.
Whelan, Josh. 2010. "Feasibility and technical study of the use of ammonia heat pumps to reduce plant water heating energy consumption in Australian beef processing facilities." In. North Sydney NSW: Meat & Livestock Australia Limited.
Xu, Peng, Zhentao Zhang, Xueyuan Peng, Junling Yang, Huafu Zhang, Youdong Wang, Xiaoqiong Li, Tiejian Yuan, and Xiaohan Jia. 2023. 'Energy, exergy and economic analysis of a vacuum belt drying system integrated with mechanical vapor recompression (MVR) for aqueous extracts drying', International Journal of Refrigeration, 145: 96-104.
40
B4 Opportunity Assessment Project title 41 RMIT Classification: Trusted


