Pathways for Urban Renewable Energy Zones

Final report


Progress report
RACE for Network Program
N4 Pathways for Urban Renewable Energy Zones Barriers, opportunities and impacts of establishing a UREZ
Project Code: 21.N4.F.0152
Copyright © RACE for 2030 Cooperative Research Centre, 2022
ISBN: 978-1-922746-25-2
December 2022
Citation
Mortimer, G., Dwyer, S., Guerrero Orbe, J., Rajakaruna, S., Silva, A., Pashajavid, E., and Amarasinghe, D. (2022). Pathways for Urban Renewable Energy Zones Barriers, opportunities and impacts of establishing a UREZ. Fast Track project for RACE for 2030.
What is RACE for 2030?
Project team
Climate-KIC Australia

• Dr Genevieve Mortimer
Institute for Sustainable Futures, UTS

• Dr Scott Dwyer
• Dr Jaysson Guerrero Orbe
Curtin University


• Dr Sumedha Rajakaruna
• Dr Angie Silva
• Dr Ehsan Pashajavid
• Dr Dilan Amarasinghe
RACE for 2030 CRC is a 10-year co-operative research program with AUD350 million of resources to fund research towards a reliable, affordable, and clean energy future.
https://www.racefor2030.com.au
Project Partners
Acknowledgements
We would like to thank the Industry Reference Group Electric Power Research Institute (EPRI), Balance Services Group, Development WA, Energy Efficiency Council, Cities Power Partnership, Energy Policy WA, Partners in Performance, Coalition for Community Energy (C4CE) for their contributions.





Acknowledgement of Country



The authors of this report would like to respectfully acknowledge the Traditional Owners of the ancestral lands throughout Australia and their connection to land, sea and community. We recognise their continuing connection to the land, waters and culture and pay our respects to them, their cultures and to their Elders past, present, and emerging.
Disclaimer
The authors have used all due care and skill to ensure the material is accurate as at the date of this report. The authors do not accept any responsibility for any loss that may arise by anyone relying upon its contents.
Pathways for Urban Renewable Energy Zones
2
Executive Summary
Distributed Energy Resources (DERs) are a large and growing component of the Australian electricity network and a major factor in corporate and regional strategies for economic growth, environmental sustainability, and social wellbeing. Blessed with one of the best solar resources in the world and driven by government incentives, high electricity prices, and the declining cost of the technology, Australian householders have become world leaders in rooftop solar. Australian organisations are acting as trailblazers in converting their infrastructure to electricity-producing assets to reduce their emissions, minimise their energy bills and enhance their environmental credentials. Indeed, it is widely accepted that DERs will be a cornerstone of Australia’s energy system transition to net zero. However, a central challenge remains how we best integrate rapidly increasing levels of DER into reliable and cost-competitive energy systems.
This RACE for 2030 project brought together organisations from universities, state governments, technology providers, industry experts, electricity network businesses and energy retailers to explore whether a Urban Renewable Energy Zone (UREZ) is a useful mechanism to accelerate DER investments in our cities while maximising the use of existing grid infrastructure and driving other benefits. The report synthesises the results from consultation, desktop research and network modelling completed in a six-month RACE for 2030 Fast Track Project.
We define UREZ as “a zone within an urban area that supports high levels of small and medium-scale renewable energy penetration, facilitates the decarbonisation of cities, helps the wider energy system and drives local socio-economic benefits”. A UREZ does not define a particular distributed energy technology, suite of technologies, business model, type of grid connection or ownership model. As both technology and business model agnostic, a UREZ seeks to facilitate the local generation of renewable energy in a way that helps to balance demand, improve power quality and reliability, and create benefits for the whole community. A successful UREZ must be able to handle extremely high levels of DERs as, over time, this zone is intended to be self-sufficient in energy and in some cases able to export energy to other areas.
We consulted a wide range of stakeholders. The emerging consensus was that DER, enabled through a UREZ approach, would provide a pathway to cheaper, cleaner energy for communities while simultaneously providing broader benefits to the energy systems. We found three interrelated types of new value that a wellimplemented UREZ could deliver:
1) reduce the cost and increase in the value of local electrification
2) enhance grid performance and reduce cost of grid upgrades, and
3) increase participation, attract investment to a region and amplify entrepreneurship and innovation.
Hence, at its core the UREZ represents an energy transition path that can be a win-win for both the energy system and communities.
The challenge is that the management of DERs in our energy system sits uncomfortably on the horns of a dilemma–the current energy system cannot handle unchecked increases in DER. Rapid scaling up of DER is a disruptive force to our energy system. Our regional modelling shows that significant increases in rooftop solar would cause voltage deviations above the technical standard of the network in some urban areas. This dilemma is reaching a critical point as the promise of more self-reliant, abundant and cheaper energy seems within reach, but the pathway is blocked because of perceptions that a new energy management paradigm may challenge the reliability of the current system. Success in UREZ implementation will be achieved if the new distributed energy markets deliver more reliable and affordable energy for all.
Pathways for Urban Renewable Energy Zones 3
A UREZ will need new capability and capacity for connecting, coordinating, and aggregating the electricity grid. In this report, we put forward a system for optimally using the existing network assets by embedding layers of control and communication. This system allows major investment in upgrading network infrastructure to be deferred and hence could be relatively quick and cost-effective to implement. Importantly, the layered energy management system does not define a particular DER technology, business model, type of grid connection or ownership model—a UREZ is both technology and business model agnostic. Instead, it will enable the facilitation of local renewable energy generation in a way that helps to balance demand and improve both power quality and reliability.
By implementing a UREZ with the necessary metering and communication infrastructure, high growth of DERs in a UREZ can be accommodated with least cost and minimum network performance problems. This means that a UREZ will deliver improved power quality, increased choice to both large and small consumers and decentralised control of the grid power system. It will also provide fast and effective control of the power system during network emergencies and deliver other major benefits, including increased private finance, improved reliability, reduced emissions and reduced energy bills. In a nutshell, a UREZ will transform the conventional distribution system of an urban area into a technology-enabled building block of a smart grid.
Our aim over the next two years is to implement at least two UREZs, with 50 (or more) UREZs to be developed by 2031. We have defined three overarching criteria for selecting the initial sites for UREZs:
• Resource availability, which assesses the potential technical resources within the UREZ candidate area, including solar, storage, load and communication
• Network capability, which assesses the network capability to engage with UREZ technology options, and to evaluate the network technical capacity and constraints
• Community engagement, which assesses the existing community engagements and investments or commitments of local councils, communities and businesses to UREZ activities, technologies or synergy concepts
There are many regions across Australia that would meet these criteria. We suggest that initial demonstration projects take place in regions that score highly across all criteria, particularly the third criterion community. We think that successful UREZ implementation should be community-driven rather than research-driven. In the regions chosen for the initial demonstration projects we recommend three connected layers of action:
1) Prototyping: an action learning project that integrates generation, storage and grid integration, and grid services in practice. This project will require novel partnerships among community, energy management, and commercial actors
2) Policy: Influencing strategy policy, planning and regulation programs to establish broader designation and deployment processes for a UREZ over time
3) Informing, educating and advocating for the UREZ concept by providing relevant and useful information to different stakeholder groups
A UREZ could offer profound benefits to achieve net zero, improve the energy system more broadly and spawn broader innovations. The UREZ pathway will require new and possibly unusual partnerships, which we know will butt-up against energy management legacy perspectives. But the opportunity is vast and exciting and staying the course of this transformation will be highly rewarding.
Pathways for Urban Renewable Energy Zones 4
Pathways for Urban Renewable Energy Zones 5 Contents EXECUTIVE SUMMARY _____________________________________________________ 3 INTRODUCTION 6 Project approach ..................................................................................................................................................................................................... 6 Project engagement 6 Report structure 7 PART A—DEFINING A UREZ _________________________________________________ 8 1.1 UREZ definition 8 1.2 UREZ technologies 8 1.3 Global megatrends driving change ..................................................................................................................................................10 1.4 UREZ locations 11 1.5 UREZ designation process 13 1.6 Multi-criteria framework for site selection 15 1.7 Market assessment and replicability potential............................................................................................................................ 17 1.8 Recommendations for early action 34 PART B—PERSPECTIVES ON A UREZ 37 2.1 Perspectives of energy actors on a UREZ ..................................................................................................................................... 37 2.2 Perspectives of local actors on a UREZ 40 2.2.1 Perspectives of local actors: Midland, Western Australia 41 2.2.2 Perspectives of local actors: Warringah, New South Wales 48 2.3 Synthesis of perspectives on a UREZ ............................................................................................................................................. 50 2.3.1 UREZs as a pathway for scaling DER 50 2.3.2 Pathway for implementation 52 2.4 Recommendations for early action 52 PART C—NETWORK PROBLEMS AND SOLUTIONS FOR A UREZ 53 3.1 Network problems in conventional power systems 53 3.2 Network problems in a UREZ 55 3.3 Proposed solution to control power flow in a UREZ 57 3.3.1 Layer 1: Urban Renewable Energy Zone (UREZ) 58 3.3.2 Layer 2: Nano-Renewable Energy Zones (NREZ) 59 3.3.3 Layer 3: Building Energy Management Systems (BEMS) 61 3.3.4 Layer 4: Home Energy Management Systems (HEMS) 62 3.4 Increasing renewable energy generation 62 3.5 Transitioning pathway from existing to proposed UREZ network configuration ....................................................... 63 3.6 Case studies 64 3.6.1 Network and load modelling and power flow analysis Midland, WA 64 3.6.2 Network and load modelling and power flow analysis Warringah, NSW 74 3.7 Recommendations for early action 83
1
Introduction
This RACE for 2030 project brought together organisations from universities, state governments, technology providers, industry experts, electricity network businesses and energy retailers to explore whether an Urban Renewable Energy Zone (UREZ) is a useful mechanism to accelerate investment in Distributed Energy Resources (DER) while supporting the grid and driving other benefits in our cities.
DER are resources sited close to consumers to provide some or all of their electric and power needs1 . DER can also be used by the system to reduce demand or provide supply to satisfy the energy, capacity, or ancillary service needs of the distribution grid. Examples of DER include solar photovoltaic (PV), wind, combined heat and power (CHP), energy storage, demand response (DR), electric vehicles (EVs), microgrids, and energy efficiency (EE).
This report synthesises the results from consultation, desktop research and network modelling.
Project approach
This report provides key insights gained in this six-month RACE Fast Track project. The intention was to clarify what a UREZ is and whether it is needed and wanted. During this sprint process, the delivery team pulled together a range of information that tested and refined the concept of a UREZ. This moved the discussion from the general idea that a UREZ could be a useful path to enabling DER to a more concrete path of how it could be implemented (Figure 1).
1) What is a UREZ?
2) What are the opportunities and barriers of a UREZ?
3) Is there support, and by whom, to move to action?

Project engagement
Throughout this Fast Track project, we sought the perspectives of a wide range of people. The synthesis of these perspectives informed all aspects of this report. Four main groups of people were engaged in this project:
1) The delivery team
2) The project partners

3) The industry reference group
4) Case study participants
Pathways for Urban Renewable Energy Zones 6
sensemaking
and one-on-one meetings
from case studies
Research & team
sessions IRG
Insights
Figure 1. Fast Track project approach
NARUC, The National Association of Regulatory Utility Commissioners. (2016). DER Rate Design and Compensation Manual. Accessible at https://www.naruc.org/rate-design/
Report structure


This report has been structured into three parts Part A, Part B and Part C.


Part A defines what a UREZ is. It identifies the drivers behind a UREZ, its scope and how it can be designated, implemented, replicated and scaled to regions across Australia. The engagement and research synthesised throughout this Fast Track project has informed the definitions and market analysis completed in Part A.


Part B is a synthesis of the perspectives of stakeholders who were engaged through the Fast Track project. These perspectives were obtained through workshop processes and a series of meetings and interviews with stakeholders that have been assigned into two overarching groups energy actors and local actors. This section shares insights about the underlying drivers and barriers of implementing a UREZ. We combined the perspectives of energy actors and local actors to create a model that can scale DER whilst resolving the tension between their differing views. This model identifies points of priority areas for implementation and action for a UREZ.


Part C describes the design of a new control strategy or a UREZ and identifies the control layers that are required for its implementation. The design of the control model came from the engagement and technical modelling that was completed as part of this project. This section also includes the technology modelling of the network and the network constraints in the two case study regions: Midland on the west coast and Warringah on the east coast.
In each section we identify recommendations for action as early leverage points to kick-start a UREZ.


Pathways for Urban Renewable Energy Zones 7
Figure 2. Two clusters of case study participants - east and west coast
Case study participants – east and west coast
Case study participants
Case study participants
1.Demonstrating pathways for Urban Renewable Energy Zones Part A Defining a UREZ
This section describes the drivers behind a UREZ, its definitional framework, scope, and how it can be designated and implemented. These considerations form the foundations of a design plan, a critical component of how a UREZ can become an established mechanism that can be replicated and scaled. However, this plan should be considered as a guide only, to build on and develop further should the project expand in scope and stakeholder involvement and move to the implementation phase.
1.1 UREZ definition
Following the research and stakeholder engagement phases, the following definition and objective of a UREZ was confirmed.
Definition
UREZ (Urban Renewable Energy Zone): A zone within an urban area that supports high levels of small- scale and medium-scale renewable energy penetration, facilitates the decarbonisation of cities, helps the wider energy system and drives local socio-economic benefits.
Objectives
• Support the coordinated development of renewables, demand-side measures and distribution grid infrastructure in urban areas with high potential for local power generation and load management
• Provide an opportunity to reduce costs for all stakeholders through enhanced planning while creating local socio-economic benefit and encouraging early and effective community engagement.
1.2 UREZ technologies
A UREZ is an area within a city without a predetermined size or scale. It seeks to facilitate the local generation of renewable energy in a way that helps to balance demand and improve power quality and reliability. It does this in an equitable way while driving benefits to the whole community and city. A UREZ does not define a particular distributed energy technology, suite of technologies, business model, type of grid connection or ownership model.
UREZs are technology agnostic provided that the technologies involved either help harness a renewable energy source or enable other technologies to do so. Any site, precinct or suburb designated a UREZ would seek, facilitate, and encourage deployment of the optimum mix of these technologies.
Identifying the relevant technologies took place in two steps: Establishing distinct categories and listing the relevant technologies under each category.
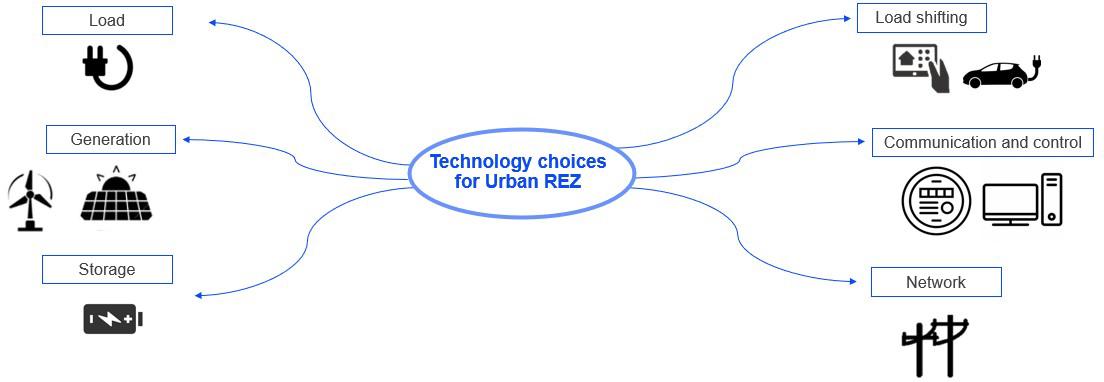
The relevant technologies were listed and divided into six key option category types shown in Figure 6. These are:
• Generation: Options that generate electricity for the customer near the point-of-demand, which may be variable or dispatchable
• Load: Options that enables the adjustment of a customer’s energy use to reduce consumption or better match the profile of local energy supply options
Pathways for Urban Renewable Energy Zones 8
• Load-shifting: Options that enable the adjustment of the timing of a customer’s energy consumption
• Storage: Means of storing energy to balance local energy supply and demand under various conditions
• Communication and control: Options to manage the logistics of local energy options to meet local network or other constraints
• Network: Options that correct issues at the community scale by adjusting the operation of the local distribution network.
Each technology category features a number of different technology options as listed in Table 1 below. A combination of these options would result in a portfolio of solutions that would enable a UREZ to:
1. Support the coordinated development of renewables, demand-side measures and distribution grid infrastructure in urban areas with high potential for local generation and load management; and
2. Provide an opportunity to reduce costs for all stakeholders through enhanced planning while creating local socio-economic benefit and encouraging early and effective community engagement.
Generation
• Solar PV
• Biogas CHP
• Biomass CHP
• Stand-by generation
• Fuel cell
Storage
• Flywheel
• Supercapacitor
• Battery
• Transport (V2X)
• Thermal
• Water
• Community batteries
Pathways for Urban Renewable Energy Zones 9
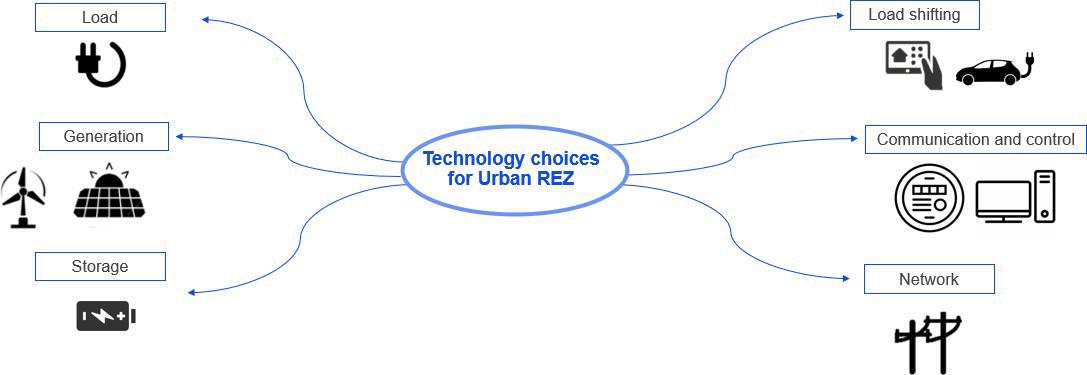
Figure 3. Technology category options for a UREZ
Table 1. Technology options for a UREZ Technology Category
Load & Load shifting
• Demand management
• Transport (V2X)
• Energy efficiency (lighting, HVAC, lighting, process)
• Fuel switching
• Mix of loads type (residential and commercial)
• Behavioural change
• Responsive loads
• Building envelope (insulation, double glazing)
• Heat pumps
Communication & Control
• Voltage management, monitoring, control (behind the meter—PV, battery, inverter, VPP)
• Home and building energy management system
• Smart meters
• Energy monitoring devices (sub-metering)
• Microgrid controller
• Algorithms, AI methods, forecasting methods and data-driven approaches
• Protocols to alleviate privacy concerns
• Price signals
• Cybersecurity
• Technology to allow two-sided energy markets
Network
• Capacitors, reactors and static VAr compensators (STATCOMs)
• On-load tap changers
• Network reconfiguration
• Reconductoring and upgrading distribution transformers
• Battery (front of meter)
• Existing network capacity
1.3 Global megatrends driving change
This project took place against the backdrop of major global socio-economic shifts that include climate change and the energy transition, and urbanisation. These megatrends transcend the regulatory control of governments or individual businesses. They are putting pressure on the energy system to change and they are intensifying.
Climate change and energy transition
Global economies are transitioning away from fossil fuels towards zero carbon alternatives driven by concerns of climate change, the falling cost of renewables, the emergence of disruptive technologies/business models and increased consumer empowerment

Pathways for Urban Renewable Energy Zones 10
Urbanisation
More people now live in urban than in rural areas. Urbanisation has the potential to be both a positive and negative transformational force, however, congestion, pollution, inequality, and social inclusion are among the challenges posed when urbanisation is poorly planned and managed.
1.4 UREZ locations
The Merriam-Webster definition of ‘urban’ is: “...of, relating to, characteristic of, or constituting a city”. However, what constitutes a city needs to be further defined.

The Australian Bureau of Statistics provides a number of ways to classify what constitutes an urban centre in order to collect and report on its regular National Census on Population and Housing. This framework is designed to ensure that the statistics published are geospatially integrated and can be easily compared.
These classifications are known as Significant Urban Areas (SUA), Section of State (SOS) classification, and Section of State Ranges (SOSR). They classify and group urban centres and localities based on population size.
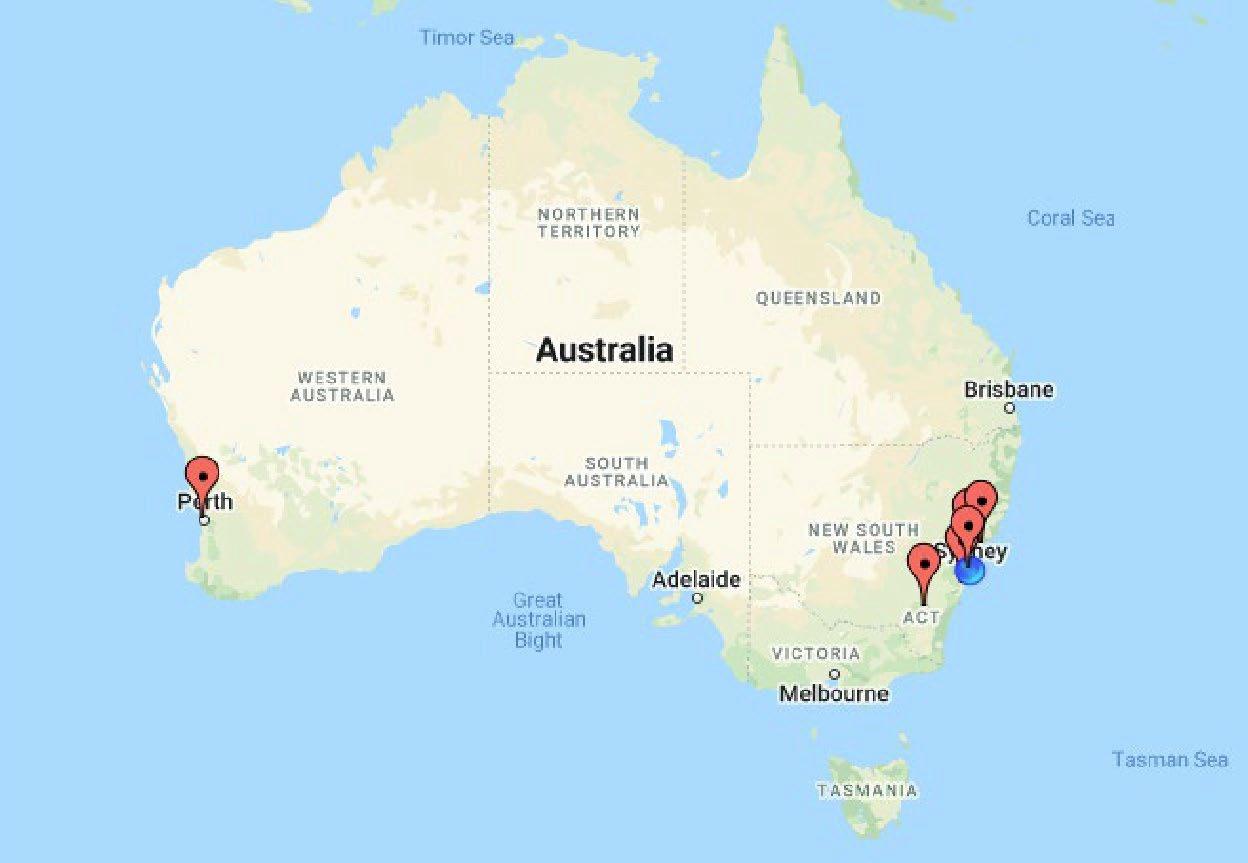
For the UREZ concept we consider only those cities classified as Major Urban in their Section of State classification (with a population of 100,000 people or more). Based on this, there are six Major Urban areas that are relevant for this study: NSW and ACT with five Major Urban centres (Sydney, Newcastle, Canberra, Central Coast and Wollongong) and WA with one Major Urban centre (Perth). More on the nationwide opportunity is contained in the latter section on market assessment and replicability potential.
While the UREZ concept could be applied and beneficial to less-populated urban centres and those in states other than NSW, the ACT and WA, this definition allows the UREZ concept to be more tightly focussed on a concentrated number of cities initially while still representing a combined population of 8.7 million urban dwellers (Table 2). Out of a national population of 25.7 million people, the ability to designate UREZ in just two states could potentially offer benefits to 34% of the Australian population (Figure 7).
Pathways for Urban Renewable Energy Zones 11
Pathways for Urban Renewable Energy Zones 12
Figure 4. Map of major urban areas in NSW, ACT and WA as defined by the Australian Bureau of Statistics (Source: Google Maps/Zee Maps)
Table 2. Summary table of urban areas in Australia as defined by the Australian Bureau of Statistics
SOSR Identifier SOSR Name SOS Name In scope for UREZ NSW and ACT Towns/cities (population) WA towns/cities (population) 01 1 million or more Major Urban Yes Sydney (5.0 million) Perth (2.1 million) 02 250,000 to 999,999 Major Urban Yes Newcastle (0.5 million) Canberra (0.5 million) Central Coast (0.3 million) Wollongong (0.3 million) none 03 100,000 to 249,999 Major Urban Yes none none 11 50,000 to 99,999 Other Urban No Out of scope Out of scope 12 20,000 to 49,999 Other Urban No
(Source: ABS 2019- 2020)
Defining boundaries
How the UREZ boundary is drawn will have an impact on the design, operation and interaction between resources. Drawing boundaries may consider –
• Geography: Map-based and physical boundaries
• Generation sources: Demand proximity to energy generation sources, including REZs
• Network infrastructure: The UREZ concept could be applied to specific parts of the network, for example, all customers connected to the same electricity substation.
• Interests or behaviours: A cluster of entities and agents who agree on particular interests can constitute a boundary. Also, diversity in demand and generation behaviours might represent a good coalition.
• Scale: Small-scale projects might meet different interests and requirements than medium-scale projects.
• Ownership: Ownership of energy resources might facilitate the decision-making process and operation of a UREZ.
1.5 UREZ designation process
A UREZ is designed to support the coordinated development of renewables by taking an enhanced planning approach. It does this while driving the benefits to the community and the city in which it is located. The section below details the considerations for the designation of a UREZ and a possible process to follow.
Funding and planning
To start with, internal funding and resourcing would be required for state and local governments to plan and implement the designation initiative. With UREZs potentially involving many technologies and addressing a wide range of cross-cutting issues, there is potential to lever existing funding programs, ranging from EV infrastructure funds to energy efficiency programs.
Planning should include market research, clearly articulate the benefits and the risks of a UREZ, describe how it would be evaluated, present the financial case, and detail what implementation would look like.
Pathways for Urban Renewable Energy Zones 13 13 10,000 to 19,999 Other Urban No 14 5,000 to 9,999 Other Urban No 15 1,000 to 4,999 Other Urban No 21 500 to 1,000 Bounded Locality No 22 200 to 499 Bounded Locality No 31 <200 Rural Balance No
From proof-of-concept to initiative
A proof-of-concept can support the case for a UREZ to be adopted by state government and supported by other stakeholders. It allows for the demonstration of its viability and provides a greater understanding of how and to whom benefits are allocated. The proof-of-concept would build on the case studies featured in this project and include an evaluation process to better communicate the proposition to state government.
Progressing to an initiative would require a positive outcome from the evaluation process and internal stakeholder commitment from within the state government (e.g., planning, transport), as well as critical external stakeholders.
UREZ designation
A clear ‘designation process’ that follows an established series of steps is needed if the UREZ concept is to be adopted more widely by states, territories, and local governments.
The designation process assumes that pilots have been conducted and that state/territory governments have adopted UREZs within their own policy and procedural frameworks.
A coordinated, strategic approach is needed to enable the development of renewables, demand-side measures, and distribution grid infrastructure in urban areas with high potential for local generation and load management.
Identification & Engagement Configuration & Design Approvals & Planning
• Zone identification (criteria)
• Stakeholder and community engagement
• Zone confirmation
• Characterisation of urban area
• Configuration and design options
• Community consultation
• Feedback iterations
• Regulatory approvals
• Planning approvals
• Funding approvals
• Network connection agreements
• Contractual templates
UREZ deployment
This involves the typical steps taken by vendors in deploying a commercial renewable energy solution but ensures early community engagement while streamlining the process thus reducing the time, complexity, and cost of the steps shown in Figure 8.
Pathways for Urban Renewable Energy Zones 14
Figure 5. UREZ Designation Process
Project Development & Contracting Equipment Specification & Procurement
Delivery, Installation & Commissioning Operation & Maintenance
1.6 Multi-criteria framework for site selection
A multi-criteria framework (MCF) is a tool that can be used to assess potential UREZ sites. It also helps to identify the needs around local renewable resources, network capability and community engagement before applying a more detailed analysis or filtering best-candidate site options This tool uses criteria linked to desirable UREZ characteristics and ranks and compares options.
Approach
The UREZ definition indicates that multiple models and technologies can be incorporated within the UREZ concept. Hence, the assessment of UREZ candidates requires a multi-criteria framework that evaluates key aspects such as resource availability, network capability and community engagement. Following the applied approach by AEMO in REZ 2, a scorecard methodology was developed to assess UREZ candidates and provide an overview of key characteristics.
Framework
The proposed UREZ multi-criteria framework assesses the following categories:
• Resource availability, which assesses the potential technical resources within the UREZ candidate areas. The list of resources assessed is based on the technology options developed in Section 1.3 UREZ technologies and includes solar, storage, load, and communication.
• Network capability, which assesses the network capability to engage with UREZ technology options, and to evaluate the network technical capacity and constraints
• Community engagement, which assesses the existing community engagements and investments or commitments of local councils, communities, and businesses in UREZ activities, technologies or synergistic concepts.
Assessing suitability UREZ scorecard
The purpose of the scorecard is to provide a quick and easy way to understand the suitability of an area to become a UREZ. A positive score would trigger a more detailed pre-feasibility or feasibility assessment.
The scorecard assesses a potential UREZ against three criteria based on three scores: (A) High, (B) Medium and (C) Low. Table 3 shows a template with a brief description of each criterion and each UREZ candidate can be assessed by indicating its score for each item.
The ranges for each score would need to be determined and benchmarked. Benchmarking could be based on quantitative score ranges (where available) or attribute descriptions in the case of qualitative scores. An accompanying rating card would describe what constitutes a certain score. For example, an ‘A’ rating for ‘EV
2 https://aemo.com.au/-/media/files/major-publications/isp/2020/appendix 5.pdf?
15
Figure 6. Steps undertaken by vendors within the scope of the UREZ designation phase
la=en Pathways for Urban Renewable Energy Zones
uptake’ might be awarded where there is a major bus depot and significant off-street parking, as well as office/fleet parking. A ‘C’ rating would be where there are no such depots, and all forms of parking are limited.
Resource
Solar Potential for PV systems, including medium and small scale
Weather conditions favour PV generation
Storage Potential for distributed batteries and community batteries
EV-uptake Potential for bus depot, taxi depot, car fleet and car park
Load Potential for mix of load-types (residential, commercial and industrial)
Local balancing Correlation between demand and generation; Higher correlation represents local balancing
Communication and control Potential to deploy ICT solutions to facilitate communication and control
Network
DNSP engagement Track record or proven interest of innovative initiatives featuring the technology options
System strength Ability of the power system to manage fluctuations in supply or demand while maintaining stable voltage levels and potential to effectively integrate more DERs.
Community
Community, council and local business engagement
Investment in UREZ technology options and activities
Track record or desire to engage in sustainability initiatives and UREZ technology options as a community, council or business
Track record or desire to invest in UREZ technology options and activities
Pathways for Urban Renewable Energy Zones 16
Score A B C Description High Medium Low
Table 3. UREZ scorecard template
Synergies with other programs
Track record or desire to deploy relevant demonstrations or pilots
Applying a scorecard
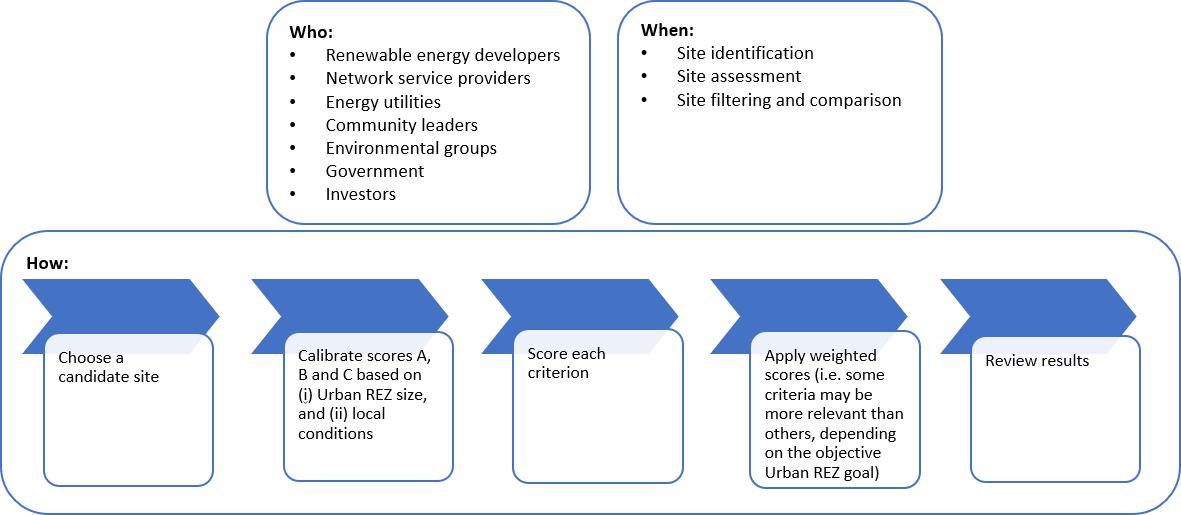
Figure 7 below summarises the process for applying a scorecard to assess UREZ candidates by listing examples of who may use the scorecard and when and how to use it.
It is worth noting that the diagram above shows examples of potential scorecard users and applications. However, using the scorecard is not limited to these examples; Other stakeholders can also use this tool in different stages of a UREZ project.
1.7 Market assessment and replicability potential
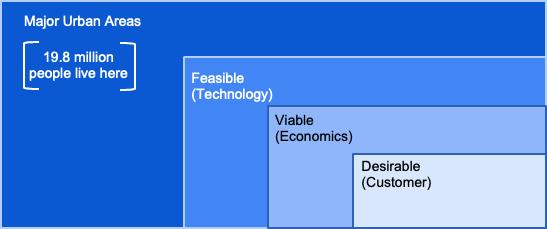
A standard approach to market-sizing typically follows a four-step process that seeks to understand:
1. What is the total addressable market?
2. What is feasible based on the technology available?
3. What is then viable based on the economics?
4. What is desirable based on customer preferences?
At each step the size of the actual market opportunity shrinks due to constraints posed by what is technically possible, what makes sense on an economic basis, and what customers choose to engage with and spend their money on for any given product or service.
Pathways for Urban Renewable Energy Zones 17
happing in the zone (e.g. REZ, VPP, P2P)
Figure 7. Example of who, when and how to use the developed UREZ scorecard tool
The conceptual figure below (Figure 8) shows how the actual market opportunity shrinks from the addressable market at each step.
Addressable market
A UREZ is an area within a city without a predetermined size or scale, making it challenging to understand the full extent of the opportunity offered by creating such a zone. As discussed earlier, we decided that our focus was only on those cities classified as ‘Major Urban’ (i.e. having a population of 100,000 people or more) in the Australian Bureau of Statistics’ Section of State classification. For this project, which focussed on New South Wales and Western Australia, six major urban areas were identified as follows: (i) Sydney, (ii) NewcastleMaitland, (iii) Central Coast, (iv) Wollongong, (v) Canberra-Queanbeyan and (vi) Perth.
If we consider the major urban areas that meet the UREZ criteria at a national scale, we get an indication of the market opportunity and replicability potential. The table below shows that Australia’s urban areas of 100,000 or more are home to 19.8 million people, roughly equivalent to 77% of the Australian population.
A number of regional centres have experienced population growth due to migration from major cities over the last two years. Coupled with the general trend for urbanisation and the reopening of international borders post pandemic, there is a high likelihood that the overall opportunity for UREZs will increase.
Pathways for Urban Renewable Energy Zones 18
Figure 8. Approach to market assessment
# Major Urban Area State/territory Estimated Resident Population June 2020 Range 1 Melbourne Victoria 4,969,305 1 million or more 2 Sydney New South Wales 4,966,806 1 million or more 3 Brisbane Queensland 2,475,680 1 million or more 4 Perth Western Australia 2,083,645 1 million or more
Table 4. Significant urban areas relevant for urban renewable energy zones (UREZ) ranked by population. Source: Australian Bureau of Statistics. (2020). Population estimates by selected Non-ABS Structures, 2010-2020. abs.gov.au. Australian Bureau of Statistics.
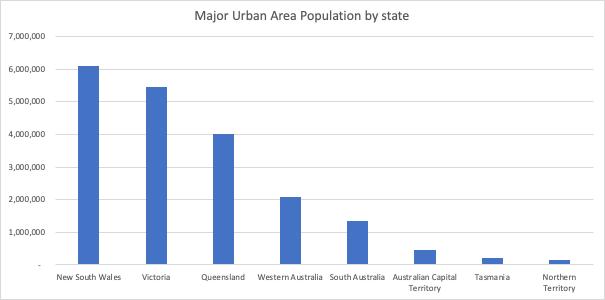
On a state/territory basis, New South Wales and Victoria have the greatest market opportunity for UREZs, followed by Queensland. These states feature multiple urban centres that could provide possible opportunities for renewable energy zoning.
For Western Australia and South Australia the opportunity is also sizeable but concentrated in the state capitals. This also applies to the Australian Capital Territory, Tasmania and the Northern Territory, which have smaller state capital populations and therefore represent smaller addressable markets.
Pathways for Urban Renewable Energy Zones 19 5 Adelaide South Australia 1,357,504 1 million or more 6 Gold Coast–Tweed Heads Queensland New South Wales 709,495 250,000–999,999 7 Newcastle–Maitland New South Wales 498,095 250,000–999,999 8 Canberra–Queanbeyan Australian Capital Territory New South Wales 464,995 250,000–999,999 9 Sunshine Coast Queensland 348,343 250,000–999,999 10 Central Coast New South Wales 337,284 250,000–999,999 11 Wollongong New South Wales 309,345 250,000–999,999 12 Geelong Victoria 282,412 250,000–999,999 13 Hobart Tasmania 219,071 250,000–999,999 14 Townsville Queensland 183,322 100,000–249,999 15 Cairns Queensland 155,340 100,000–249,999 16 Toowoomba Queensland 139,526 100,000–249,999 17 Darwin Northern Territory 133,268 100,000–249,999 18 Ballarat Victoria 109,533 100,000–249,999 19 Bendigo Victoria 102,499 100,000–249,999
Pathways for Urban Renewable Energy Zones 20
Figure 9. Major Urban area population by state/territory
Population Centres Estimated Resident Population June 2020 Australian Capital Territory 464,995 Canberra–Queanbeyan 464,995 New South Wales 6,111,530 Central Coast 337,284 Newcastle–Maitland 498,095 Sydney 4,966,806 Wollongong 309,345 Northern Territory 133,268 Darwin 133,268 Queensland 4,011,706 Brisbane 2,475,680 Cairns 155,340 Gold Coast–Tweed Heads 709,495 Sunshine Coast 348,343
Table 5. Major urban areas by State/Territory
Feasible market (Technology)
The next step in market-sizing is to look at what is feasible based on the applicable technology. As shown in the section discussing technology options, UREZs are largely technology agnostic and open to the deployment of a wide variety of renewable energy and enabling technologies and business models. This makes understanding the feasibility extremely challenging.
Our case-study approach seeks to understand what is technically feasible for a specific site. This bottom-up approach could shed some light on the potential in NSW, the ACT and WA by estimating how many ‘Warringahs’ or ‘Midlands’ might exist within each major urban area.
Another approach could be to take a spatial approach to examine the potential for solar PV in cities. While UREZs are about more than just solar, they are designed to support high levels of small-scale and mediumscale renewable energy. Estimating the maximum potential for rooftop PV in a major urban area therefore provides an upper boundary for the maximum solar potential that could be achieved through a UREZ.
A UREZ could theoretically achieve even greater penetration of renewables by facilitating energy efficiency upgrades and supporting other renewable, non-solar resources harnessed by heat pumps and bioenergy. Combining solar with energy storage (either stationary or mobile) could also significantly increase locally generated electricity consumption and reduce the amount exported to the grid. In some cases, excess energy could also help to power unmetered supply (e.g. street lighting).
UNSW and APVI have undertaken several past studies on the solar potential of cities. Although these were
Pathways for Urban Renewable Energy Zones 21 Toowoomba 139,526 Townsville 183,322 South Australia 1,357,504 Adelaide 1,357,504 Tasmania 219,071 Hobart 219,071 Victoria 5,463,749 Ballarat 109,533 Bendigo 102,499 Geelong 282,412 Melbourne 4,969,305 Western Australia 2,083,645 Perth 2,083,645 Grand Total 19,845,468
limited to a small number of state/territory capitals, they are relevant for UREZs. In their Sydney Solar Potential Study3, Cooper et al found that 25% of rooftops were available across the city and could potentially generate 393 MW from installed solar PV For the Canberra CBD4 , 34% of rooftops were available, with the potential to yield 46 MW. In Perth5, 31% of rooftops could be fitted with solar PV to generate up to 102 MW. A similar approach using spatial analysis to identify potential UREZs focused on major urban areas. Greater clarity on the extent of the feasible market can be conveyed when a desire for solar is expressed by a DNSP, business or community group.
Viable market (Economic)
The ‘viable market’ opportunity considers what is economically feasible. Understanding the CAPEX, OPEX, NPV or other metrics associated with a UREZ relies upon a level of understanding about a site's characteristics and current energy use, and what is being proposed in terms of renewable and enabling technologies These will form the basis for a business model and a business plan.
If the process of selecting a UREZ has been done well, the odds of it being viable will increase. However, we also need to understand how many technically feasible UREZs would be economically viable and theoretically quantifying this is challenging.
Desirable market (Customer)
The ‘desirable market’ opportunity refers to the proportion of a given population which, when provided with a product or service that is technically feasible and economically viable, chooses to become a customer. Within the context of the UREZ, not all homes and businesses within the zone would be guaranteed to opt in.
The conversion rate of solar PV sales in urban areas could offer a basic proxy for this step. However, if the UREZ process were initiated as part of a grassroots response by the community or local businesses and the community engaged to a sufficiently high standard then the chances of increasing the percentage of customers who find the offer appealing would be higher.
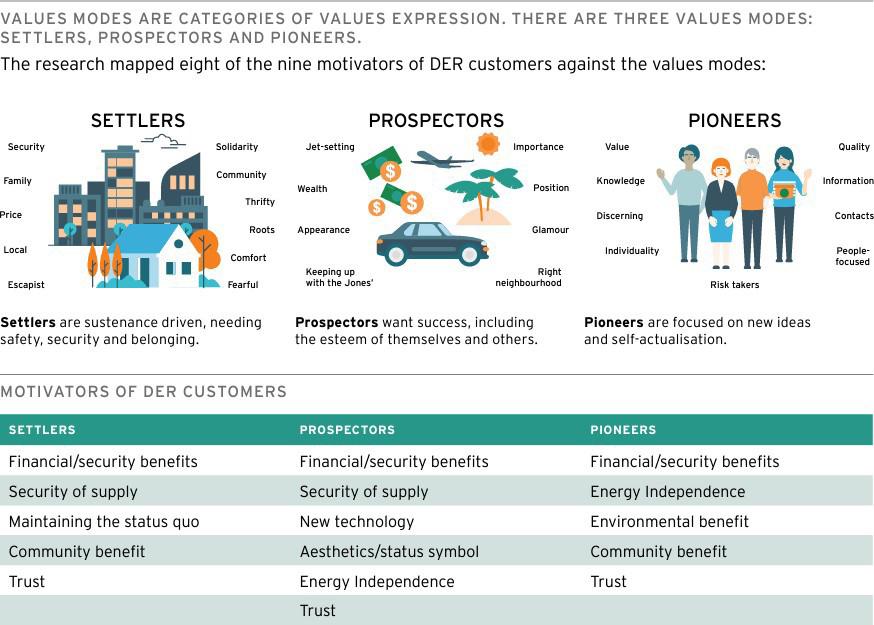
Undertaking social research into what might motivate people to participate in a UREZ with high levels of DER will help to estimate the percentage of customers likely to find the concept desirable. This should build upon the state-of-the-art in terms of DER customer motivations and values as shown in the figure below (Figure 10) from an ARENA-funded study into DER customers.
3 Copper, J., Roberts, M., and Bruce, A. (2017). Spatial analysis of solar potential in Sydney. Prepared for the Australian PV Institute. November 2017. Accessible at: http://apvi.org.au/wp-content/uploads/2017/05/CMC_SydneySolarPotential_Final_reduced.pdf
4 Copper, J., Roberts, M., and Bruce, A. (2017). Spatial analysis of solar potential in Canberra. Prepared for the Australian PV Institute by UNSW. Accessible at: http://apvi.org.au/wp-content/uploads/2018/02/CMC_CanberraSolarPotential_hires.pdf
5 Copper, J., Roberts, M., Barton, T., Hu, R., and Bruce, A. (2019). Spatial analysis of solar potential in Perth. Prepared for the Australian PV Institute by UNSW. Accessible at: http://unsworks.unsw.edu.au/fapi/datastream/unsworks:71863/bin9714ed6f-9fe8-4e37-aba410d45b3ea743?view=true&xy=01
Pathways for Urban Renewable Energy Zones 22
Data challenges and accessibility
Estimating the market potential for UREZs is extremely challenging but has revealed some useful insights into access and availability of distribution network data, including customer data. Challenges relating to the accessibility and granularity of city-level energy data on demand and supply are well documented (irena.org/media/Files/IRENA/Agency/Publication/2020/Oct/IRENA_Renewables_in_cities_2020.pdf). For major urban areas in Australia, only Ausgrid makes available data on energy consumption and generation in the Sydney LGAs it supplies; Endeavour covers the remaining parts but does not offer the same data publicly.
Data on the potential for renewable energy resource and technology installation at the LGA or disaggregated city-level are also not universally available or systematically collected. The same applies to energy statistics and building renovation potential in cities.
Market studies on the potential for the different technology categories and types (whether VPPs, microgrids, electric vehicles and charging infrastructure, stationary storage or heat pumps) are published and available. However, these technologies could be deployed in a UREZ in any combination. Estimating the most likely configuration was impossible within the scope of this study, as was estimating the resultant impact on electricity consumption and generation of UREZs for the cities in question. Resolving these issues would help facilitate a better understanding of the UREZ opportunity.
Pathways for Urban Renewable Energy Zones 23
Figure 10. Value modes and motivators of customers of ARENA-funded DER projects (2014-2020)4
Definitional framework approach
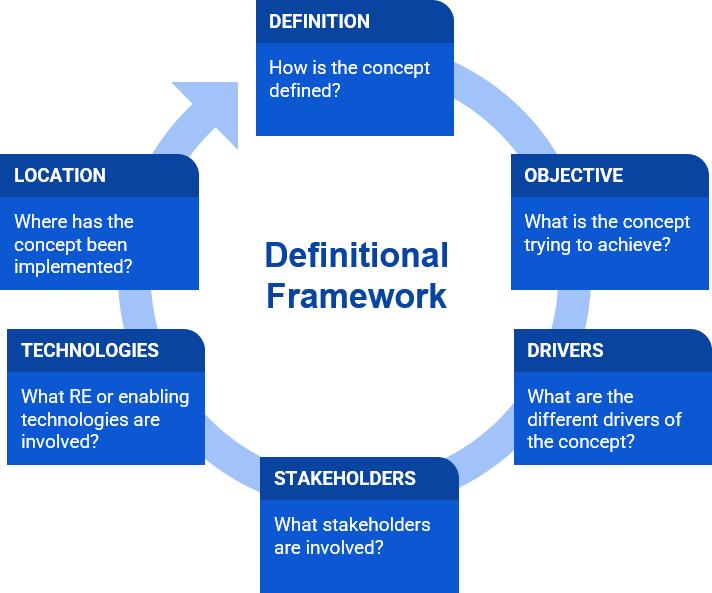
The first step of the project was to develop a definitional framework. This was critical to shaping the rest of the work program, from understanding the opportunity and guiding the literature review to selecting the case studies and undertaking the techno–economic modelling.
A key aspect of this step was analysing other, similar concepts that were considered to have relevance for a UREZ. A long list of concepts was drafted based on the project team’s knowledge and supplemented with desktop research, review of public documents, consultations, planning guidelines, academic and grey literature and media reports. The definitional framework featured four steps, each seeking an answer to a specific question (Figure 11).
The resulting definitional framework that would describe the key features of a UREZ and other shortlisted concepts for comparison is shown below:

Pathways for Urban Renewable Energy Zones 24
Figure 11. Steps of the definitional framework
Relevant concepts for UREZ definition
A final shortlist of eight relevant concepts was generated for further research. These were:
1. Renewable Energy Zone (US, Australia)
2. Net Zero Precinct (Australia)
3. Renewable Energy Industrial Precinct (Australia)
4. Special Activation Precincts (Regional NSW, Australia)
5. Low Carbon Communities (Australia, UK)
6. Zero Emission Neighbourhoods (Norway)
7. Hydrogen Hub (US, Europe, Australia)
8. Local Energy Systems (UK)
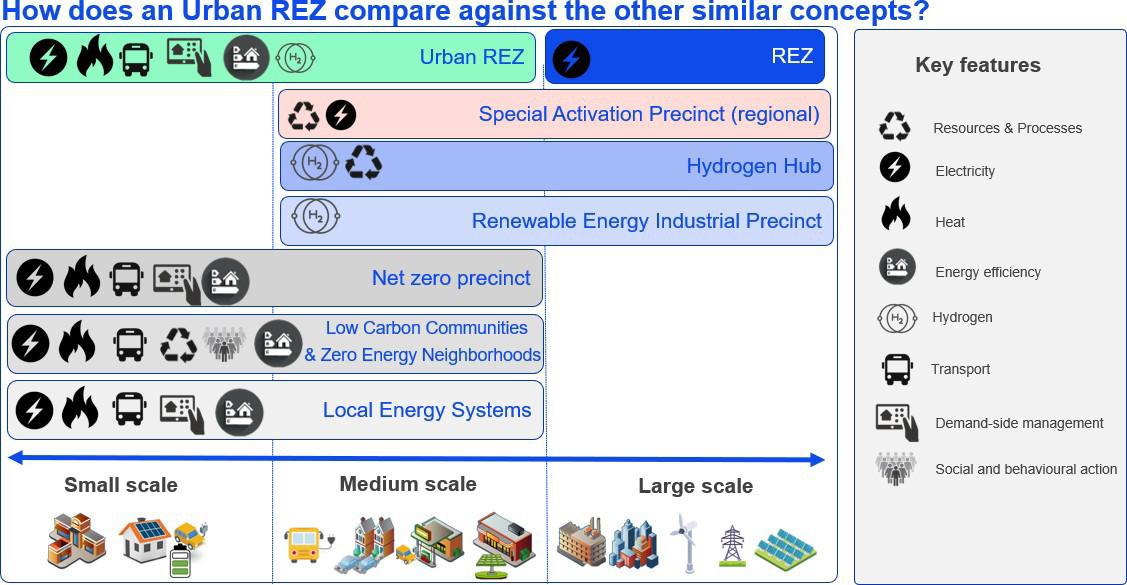
Each shortlisted concept was then profiled using the six features of the definitional framework. This provided a succinct, graphical document that made it easy to communicate and compare each concept. An example is shown in Figure 13 below.
Pathways for Urban Renewable Energy Zones 25
Figure 12. Definitional framework
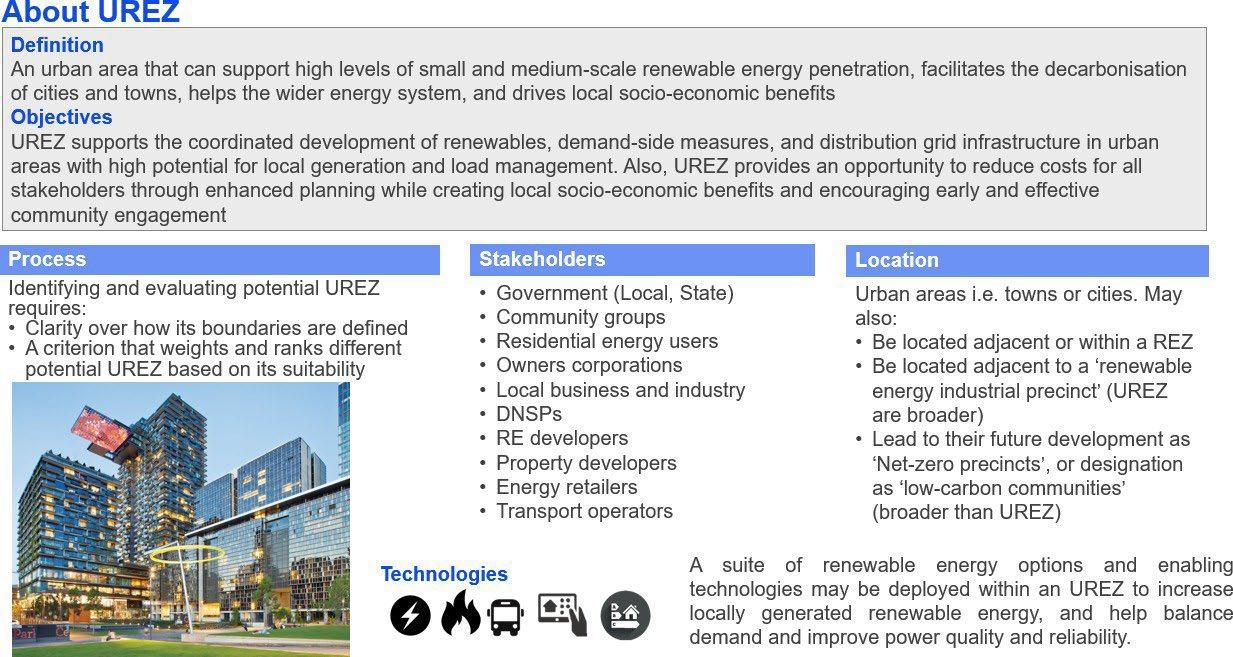
How does a UREZ compare to similar concepts? The UREZ concept was assessed against the other short-listed concepts based on key features and scale. This revealed that the UREZ occupied a niche among small-scale and medium-scale concepts and was not competing against other similar concepts such as large REZs, industrial precincts and hydrogen hubs. While concepts like Net Zero Precincts and Low Carbon Communities mainly aim to achieve significant reductions of CO2 emissions and industrial hubs/precincts are focused on accelerating manufacturing activities, a UREZ is not explicitly subject to one technology or business model. Instead, a UREZ seeks to support demand-side measures and network infrastructure in urban areas with high potential for local coordination between energy demand and generation to create local socioeconomic benefit and encourage community engagement.
Pathways for Urban Renewable Energy Zones 26
Figure 13. Key features of a UREZ
Figure 14. Comparison of UREZ against other similar concepts based on scale and key features
Relevant examples
The following section presents more of the detailed research on the different Australian and international examples that were investigated within the definitional framework.
Renewable Energy Zone (REZ)
Definition & objectives
A Renewable Energy Zone has been defined as the modern day, renewables-based equivalent of a power station. It combines generation, transmission and storage to make sure the energy system is secure, affordable, clean and reliable. Renewable energy zones form part of a coordinated approach to the development of new grid infrastructure in energy-rich areas to connect multiple generators (such as solar and wind farms) in the same location. REZs seek to capitalise on economies of scale, unlocking new energy generation at lower cost. REZs are currently being developed at multiple locations in NEM states around Australia.
Background & drivers
• The initial REZ concept was developed in Texas (US) and has since been replicated in other countries around the world. Its aim is to address the mismatch in planning timescales to enable transmission planning and renewable energy project development.
• As part of AEMO’s most recent Integrated System Plan (2020), 35 potential REZs were identified: Six in Victoria, nine in NSW, three in Tasmania, nine in South Australia and eight in Queensland.
• Cited benefits of a REZ include improved overall energy system efficiency, reduced renewable energy curtailment risk, boosted renewable energy deployment, assistance with meeting carbon targets, and supporting the local economy.
• Criticisms have been that REZs lack benefit for local communities, don’t create local or sustainable jobs, have a negative environmental impact, and result in overinvestment in the transmission network.
Selection criteria
Selection of REZ candidates was based on their suitability against ten criteria that assessed them for their suitability. These were:
It was also seen as desirable that REZ should promote local (community and industrial) development opportunities.
Pathways for Urban Renewable Energy Zones 27
1. Wind resources 2. Solar resources 3. Demand matching 4. Electrical network 5. Property size 6. Land cover 7. Roads 8. Terrain complexity 9. Population density 10. Protected areas
Process
The REZ process was defined as having five key steps, from the identification phase through to construction and commissioning (Figure 15). These broad categories of steps are also likely to be relevant within the UREZ context.

Stakeholders
The main REZ stakeholder groups are listed below. The same stakeholder groups are also relevant for UREZs, although for a UREZ Transmission Network Service Providers would be replaced by Distribution Network Service Providers.
1. Energy market operator (AEMO)
2. Renewable energy developers
3. Transmission Network Service Providers
4. Landowners, residents and broader communities
5. Energy utilities
6. Environmental groups
7. Government (state, local, ARENA)
Renewable Energy Industrial Precinct (REIP)
Definition
Renewable Energy Industrial Precincts (REIPs) support a cluster of manufacturers powered by 100% renewable energy. These precincts are either located within REZs or connected to renewable energy generation through high voltage transmission lines. REIPs also have access to clean heat and renewable hydrogen.
Objectives
• Repowering Australian manufacturing
• Attracting businesses and investors, supporting local industries, securing existing jobs and creating new ones
• Accelerating the growth of manufacturing in Australia
• Capturing the benefits of cheaper renewable energy to capitalise on the opportunity to produce lowcarbon products
Pathways for Urban Renewable Energy Zones 28
Figure 15. Five defining key steps in a REZ
Stakeholders
• Manufacturers: Aluminium smelting, steel and other metals processing, hydrogen and chemical production, recycling and data centres
• Companies making clean tech (batteries, EV chargers etc.)
Drivers
• Stimulate economic recovery
• Revive economy, modernise industry, reskill workforce
• Create new opportunities
• Affordable and reliable energy
Technologies
• Connected to REZ or other renewable energy sources (powered by 100% renewable energy)
• Heat and renewable hydrogen production and infrastructure
Location
• Regional Australia
• Five potential locations; in existing industrial areas with supporting infrastructure (transport connections, brownfield land and skilled workforce)
Special Activation Precincts (SAP)
Definition
A Special Activation Precinct is a dedicated area in a reginal location identified by the NSW Government to become a thriving business hub. SAPs are a new way of planning and delivering industrial and commercial infrastructure projects in dedicated areas in regional NSW by bringing together planning and investment support services. They are part of the NSW Government’s 20-year Economic Vision for Regional NSW.
Objectives
• Create certainty and confidence for establishing businesses and opportunities to grow
• Enable more local jobs and drive economic outcomes
• Streamline planning and approval processes
• Plan, coordinate and deliver successful precincts
• Provide certainty and confidence to businesses and investors
• Ensure strategic land-use and infrastructure planning for the precinct
• Coordinate the precinct’s development in line with the social, economic and environmental requirements for each region
• Criteria:
o Align with the NSW Economic Vision
o Area has growth opportunities for new and existing industries
o There is projected population and jobs growth
o Area aligns with key infrastructure projects that are either planned or underway.
Pathways for Urban Renewable Energy Zones 29
Stakeholders
• Department of Regional New South Wales
• Department of Planning Industry and Environment
• Regional Growth NSW Development Corporation
Drivers
• The NSW Government's 20-Year Economic Vision for Regional NSW that expects growth opportunities for new and existing industries.The need for a simplify planning pathway to deliver industrial and commercial infrastructure projects.
Technologies
• Advanced manufacturing
• Renewable energy (solar and wind)
• Agribusinesses
• Recycling and waste management
Location
• Six projects in regional NSW, Australia
Low Carbon Communities (LCC)
Definition
Low carbon communities are characterised by compact special arrangements, green transportation systems, energy efficiency architecture and consumption, recycling of waste material and public participation.
Objectives
• Achieve significant reductions of CO2 emissions within local communities by involving household residents and businesses
• Balance energy within the community considering vehicles, thermal, and electrical energy.
Stakeholders
• Local councils
• Residential, commercial and industry users
• Mobility systems
• Utilities
• Operators
Drivers
• Urgent need to delivery carbon reduction
• Strengthening local economics
• Create new social and collective actions to create progress and value
Pathways for Urban Renewable Energy Zones 30
Technologies
• Most efficient lighting, heating, transport, white goods etc.
• Solar generation
• Biofuels
• Storage
• Multi-energy systems (electricity & heat)
Location
• US, UK, Canada, Australia, Japan, China
Zero Emission Neighbourhood (ZEN)
Definition
A ZEN is a group of inter-connected buildings with distributed energy resources such as solar energy systems, electric vehicles, charging stations and heating systems located within a confined geographical area and with a well-defined physical boundary to the electric and thermal grids.
Objective
• Reduce direct and indirect greenhouse gas emissions towards zero over the analysis period in line with a chosen ambition level with respect to which life-cycle modules, building and infrastructure elements
Stakeholders
• Local councils
• Residential, commercial and industry-users
• Mobility systems
• Utilities
• Operators
Drivers
• Unlocking the value of local DER via managing energy flows (within and between buildings) and exchanges with the surrounding energy system in a smart and flexible way
• Become highly energy efficient and powered by a high share of new renewable energy in the neighbourhood energy supply system
Technologies
• Generation and storage of electricity and heat
• Grids and technologies for water, sewage, waste, mobility and ICT
Location
• Nine pilot projects in Norway
Pathways for Urban Renewable Energy Zones 31
Local Energy System (LES)
Definition
Local energy systems link the supply and demand of energy services within a defined area across electricity, heat and transport. They incorporate innovative energy distribution, management and metering, novel business models and clean transport systems.
Objectives
• Match energy supply and demand within a defined area to benefit a range of stakeholders
• Create secure and sustainable low carbon economies designed in line with local needs and aspirations
Stakeholders
• Local councils
• Residential, commercial and industry users
• Mobility systems
• Utilities
• Operators
Drivers
• Reduce carbon emissions
• Enable greater energy resilience and flexibility
• Allow decentralisation and digitalisation of energy systems
• Increase energy equity and affordability
• Engage community actors and creating local jobs
Technologies
• Multi-vectors systems (electricity, thermal energy, transport, ICT) LEM can include carbon intensive technology (e.g. diesel generators, gas-fired boilers).
• Solar, wind, micro-hydro, flexible loads (EV, heat pumps, storage, demand-side management)
Location
• Four large LES in the UK and ten new LESs under design
Net Zero Precincts (NZP)
Definition
Net Zero Precincts bring together a new approach to transition management by using design anthropology to engage with the precinct community and consider their lived experiences. They are applied at a precinct scale, such as shopping centre, suburb or community level.
Objective
• To help cities and urban regions reach net zero emissions by taking the precinct as an optimal scale for urban transition
Pathways for Urban Renewable Energy Zones 32
Stakeholders
• Industry
• Government
• Research organizations
Drivers
• Leading the way to a 100% renewable energy future
• NZP are cheaper, more liveable and create larger economic growth than normal precincts
• Cost-efficient solutions
Technologies
• Microgrids
• Energy efficiency coordination
• Transport, waste and water management, construction processes, energy production and management
• New business models (e.g. P2P trading)
Locations
• Monash Tech Precinct, UTS and Central Park, Barangaroo
• Fremantle in WA
• Germany and Sweden
Hydrogen Hub
Definition
Hydrogen hubs are regional ecosystems that link hydrogen production, transportation, and various end uses such as mobility or industrial feedstock.
Objective
Hydrogen hubs help to minimise the cost of infrastructure, and support economies of scale in producing and delivering hydrogen to customers. Hydrogen hubs also facilitate opportunities for sectors to innovate and collaborate, while developing the workforce and skills needed to support a future hydrogen industry.
Stakeholders:
• Industry
• Transport sector.
• Hydrogen consumers.
• Government.
Drivers
• Decarbonisation of hard-to-abate sectors such as fuel or feedstock
• Industrial development
• Job creation
Pathways for Urban Renewable Energy Zones 33
• Stimulate regions through new hydrogen markets
• Strategic investment in new business models
Technologies
• ‘Giga’ electrolysers
• Abundant renewable energy (solar and wind) sources
Location
• About 40 around the world
1.8 Recommendations for early action
Action for a UREZ should start at leverage points. These are areas of effort that will have a disproportionate positive effect towards kick-starting a UREZ. We target these recommendations at three strategic connected layers of action:
1) Policy, planning and regulatory support to establish designation and deployment processes over time
2) Information, education and advocacy on the UREZ concept through providing relevant and useful information targeted at different stakeholder groups
3) Longer-term RACE Research Program that supports implementation
Recommendation 1: Government (state and local), energy market operator and energy market regulator should provide policy, planning and regulatory support to build UREZs into their long-term planning.
A UREZ prototype would provide the proof-of-concept that is required by state governments to support the case for and adoption of these zones and ensure the support of other stakeholders. Demonstrating the viability of UREZs would provide a greater understanding of how the benefits are allocated, to whom and where there are barriers. This would build on the case studies featured in this project and include an evaluation process to better support the proposition to state government.
State government acceptance of the UREZ concept would be predicated on several prerequisites. These include specific market research, a clear articulation of benefits and risks, how outcomes should be evaluated against objectives, the financial case and what implementation would look like from a state government perspective. These governance structures will allow for replicability and scale. Both the prototype and RACE for 2030 research project will yield a series of recommendations to include UREZs in the AEMO ISP Report.
Importance of state and local government for a bottom-up approach to UREZ adoption
State governments are critical for the success of UREZs due to their role in implementing and shaping relevant policy, planning and programs. Local governments also have a vital role due to their responsibilities related to local environmental amenity and road infrastructure and ensuring that local communities thrive. The technology and business model-agnostic nature of UREZs means that a thorough understanding of the wide range of issues related to the regulatory challenges of developing a UREZ is needed, but supplying this was outside the scope of this Fast Track project.
Pathways for Urban Renewable Energy Zones 34
A future pilot project which seeks to be a proof-of-concept—developed in close consultation with the state government and other experts on these policy and regulatory issues (industry, academia, regulators, and industry bodies) can help address this Other RACE for 2030 projects examining these issues can also provide an important source of information.
While we recommend that the first UREZ pilot projects should seek to pursue a model that is not overly burdened with regulatory and legal barriers, any barriers encountered should be documented and future UREZ projects should seek to push these boundaries by tackling these incrementally and systematically.
Continued engagement with both state and local government stakeholders working within the same forum will help inform the policy, planning and regulation reforms that are need to support the deployment of UREZs.
Importance of market bodies for a top-down approach to UREZ adoption
AEMO is the Australian market operator for electricity and gas systems and markets Every two years, it publishes a whole-of-energy-system plan called the Integrated System Plan (ISP). The aim of the ISP is to produce an integrated roadmap to ensure the effective development of the National Electricity Market (NEM) over the next two decades and beyond. In its first ISP published in 2018, AEMO referenced large scale REZs and included an initial assessment of their potential. This was supported with updates to subsequent ISPs that provided more detail on potential zones, an ARENA-funded report on the regulatory (and technical and commercial) challenges, and government funding to establish the priority REZs (the Victorian Government announced $540m to establish six zones).
While multiple benefits of REZs are cited, criticisms have included that they lack benefits for local communities, do not create local or sustainable jobs, have a negative environmental impact, and result in overinvestment in the transmission network.
UREZs can help address these issues for urban areas while supporting the integration of DER, which is a key priority of AEMO and a focus of its DER-related projects. AEMO should be engaged to understand its attitudes to the UREZ concept, whether it can support its DER integration objectives, and its possible inclusion of the concept in an upcoming ISP.
Recommendation 2: Interested parties can use emerging outcomes of this report to inform, educate and advocate for the UREZ concept to different stakeholder groups, such as residential energy users, community groups, owners corporations, RE developers, etc.6
The UREZ concept is new and while it has been understood intuitively by those interviewed as part of this project, communication about its aims and benefits is needed to further the likelihood of its adoption.
The promotion of the UREZ concept could take place through publishing in academic literature, publication and dissemination of this final report, and presentations at leading Australian energy conferences and to key stakeholder groups. It could also be promoted in the media (such as in The Conversation) and via regular communication to inform the general public about the UREZ concept and its development..
A communication strategy as part of continuing research on UREZ will help guide the type and frequency of interaction with the different types of stakeholders while ensuring clarity and consistency of messaging.
35
6 See Figure 16 for a detailed list of UREZ stakeholders Pathways for Urban Renewable Energy Zones
Recommendation 3: Recommendation 3: Curtin, UTS or Climate-KIC to initiate a RACE for 2030 Standard Track Project—a larger, longer-term research project
This Fast Track project for RACE for 2030 has outlined the role UREZs can play in increasing the levels of distributed energy resources being deployed in our cities while driving benefits to the communities that reside there and supporting the wider energy system.
To further investigate the UREZ proposition beyond the scope of the Fast Track project, a longer-term Standard Track project is recommended that will dive more deeply into the identified issues while seeking to provide a proof-of-concept that can be led by state governments.To achieve this, the Standard Track project would seek to undertake the following research activities:
• Investigate ways to streamline the viability assessment of UREZs to accelerate the process and encourage uptake. This may involve –
o Defining the ‘journey’ of how UREZs are designated from the perspective of different consumer and stakeholder groups
o Developing a spatial analysis approach that can quantify current and future generation options (e.g. installed solar PV, suitable rooftops), load centres (e.g. industry, bus depots), and network infrastructure and capacity (e.g. feeders, community batteries).
o Mapping the decision-making process for UREZs and the interaction with different stakeholders
o Developing templates, toolkits and guides in partnership with DNSPs, local government, and state planning and transport agencies that will reduce the administrative burden for connecting UREZ technologies in the designated zones on customers, vendors and the stakeholders themselves.
• Demonstrate the viability of UREZs through proof-of-concept state government-supported pilots by
o Building on the case studies featured in this project to test the UREZ model
o Providing a greater understanding of the benefits and costs
o Documenting the technical, commercial and regulatory issues encountered
• Undertake additional activities to support state government to understand the UREZ proposition, including
o Supporting focussed market research, cost benefit analysis, organisational requirements and business case development
o Detailing the path to implementation from a state government perspective
o Identifying funding sources.
• Undertake social research studies into customer motivations for UREZ participation, such as
o Surveying both pilot participants as well as city dwellers generally
o Exploring aspects of consumer attitudes and motivations to participate in different models of UREZs through stated preference techniques and other market research approaches.
Pathways for Urban Renewable Energy Zones 36
2. Demonstrating pathways for Urban Renewable Energy Zones
Part B Perspectives on a UREZ
This section provides a synthesis of perspectives gathered from the project’s stakeholder engagement. A diverse array of stakeholders was consulted. They included utilities, private sector players, researchers, regulators, customer advocates, community representatives and local asset owners. We have separated the findings into three sections.
Section 2.1 Perspectives of energy actors
Energy actors are directly engaged in the energy system transformation and particularly in scaling up DER. This includes people from industry, government and research. The perspectives of energy actors were captured in two facilitated industry reference group workshops and regular conversations throughout the project. We followed an active engagement approach, iteratively identifying and synthesising drivers and barriers throughout the six-month project.
Section 2.2 Perspectives of local actors
‘Local actor’ is used as a general term that encompasses local asset owners, local government, or local community groups. These groups are not connected into the broader energy transitions and DER discussions to the same extent that energy actors are. Perspectives were captured from local asset owners in Midlands, WA, and local community actors in Warringah, NSW. The perspectives from local asset owners in Midlands were captured through an extensive interview approach. Perspectives from local asset owners and local community groups in Warringah were captured through a series of meetings and invitations to share perspectives at the industry reference group workshop.
Section 2.3 Synthesis of perspectives
This section compares and contrasts the perspectives across all stakeholders engaged as part of this project. Sometimes these revealed seemingly paradoxical views among different stakeholders about the benefits and challenges of DER and we have put forward a model which allows us to better understand why this was the case. We use this model to identify priority areas for implementation and action for a UREZ.
2.1 Perspectives of energy actors on a UREZ
There was a pervasive message from this group that DER, enabled through a UREZ approach, would provide a pathway to cheaper, cleaner energy. A UREZ was positioned as a pathway to respond to the lack of strategic coordination of DER resources. Through a UREZ the benefits of the energy transition could be shared by communities and this strategic coordination could provide valuable grid services.
We found three interrelated types of new ‘values’ that identified that a well-implemented UREZ could deliver:
1) Reduce the cost and increase in the value of local electrification (Table 6)
2) Enhance grid performance and reduce the cost of grid upgrades (Table 7)
3) Increase participation, attract investment to a region and amplify entrepreneurship and innovation (Table 8).
These values are expanded on in the tables below. They describe what we heard on how UREZ would generate new value for Australia’s energy transition.
Pathways for Urban Renewable Energy Zones 37
The new value a UREZ could add to Australia’s energy systems transition
Provide incentives for local asset owners to maximise rooftop solar
What we heard drivers identified in our engagement
• Enable more efficient use of excess solar capacity
• We need ways of incentivising investment in rooftop generation on a much bigger scale. Next step is to reward for exports and compensate DNPS for their facilities without burdening other people excessively or unfairly.
• Currently people won't install more than a fraction of the solar capacity they could because they can't get any money to export the generated power
• Combat low energy productivity of business and industry
Harness the benefits and reduce the risks from a quickly scaling EV market
The new value a UREZ could add to Australia’s energy systems transition
A UREZ can establish an effective value exchange for grid services
• Electrification of different sectors and households will increase how do we harness EV capacity in the urban zone?
Reduce the capital and operational cost to the network
Improve resilience of the energy systems
Reduce
• There is a tacit assumption that distributed energy can improve energy systems’ flexibility
• Investment to catalyse action should be targeted at areas that enhance the connectivity of the grid
• Over time, value is less about energy and more about grid service/facilitating flexibility; Need to consider efficiency trade off compared with large scale generation
• Perhaps the value in UREZs is all the grid services, the ability to provide coordinated demand response, flexibility, reduce inertia, and provide other network-related services that will be needed in the future. The economic value of UREZs is to look for these opportunities. Maybe the main value of UREZs is not economic and more like a facilitating framework or mechanism to facilitate customers’ move from being consumers to prosumers in a coordinated fashion that helps the grid.
• Utilise the existing network to its highest potential and, where possible, implement solutions that avoid costly upgrades and reduce the need for major investment in transmission.
• Improve resilience to environmental shocks through a UREZ model for energy.
• Resolve complex regulatory frameworks and approaches to control the ‘system’
• Policy cost barriers for off-site large scale RE projects for organisations
Pathways for Urban Renewable Energy Zones 38
Table 6. Reduce the cost and increase the value of local electrification
Table 7. Enhance grid performance and reduce the cost of grid upgrades
What we heard drivers identified in our engagement
the policy burden and cost of inefficiently ‘controlling’ complex energy systems
The new value a UREZ could add to Australia’s energy systems transitions
Increase social participation in the energy transition - build trust in, and access to, the energy transition.
What we heard drivers identified in our engagement
• A UREZ could enable greater connection of businesses to their communities.
• There is a growing public desire to participate in emissions reductions, decarbonisation and net zero energy transition.
• Participation and energy ownership are increasing.
• Commercial frameworks for collaborative development of underpinning infrastructure need to be increased.
• The social inequality of the current energy system is making DER non-bankable.
• This is about changing the social contract of energy.
Create opportunities for Australian entrepreneurs to invest in the new technologies
• There are new technologies and services, including Australian inventions, that are ready to be deployed to support better-value DER.
• New ICT development will be increasingly available to improve efficiency and operation.
• We need an energy system that creates more options rather than reducing options.
Increase transparency to engage the community and harness local entrepreneurs in unexpected ways
• Do not underestimate the non-financial drivers, especially when you have really active communities who want to engage with this. Examples include: Providing a local area with more visibility about how much generation in their area is renewable; Using behavioural demandresponse to move at times when there are more renewables; environmental reasons.
• Improve the visibility of the network, including operating envelopes
• There is a split incentive problem (commercial and residential) in that those responsible for paying the bills are not the same as those responsible for making the capital investment decisions.
Enable a variety of technologies to be incorporated in a way which enhances grid performance
• Technology is evolving so fast the UREZ needs to evolve with technology rather than be prescriptive about it
• Build trust in the aggregation and facilitation at the local level so that diverse, good solutions self-organise
Attract new investment and businesses to a region
• Implement a timely climate change response to attract and enable clean manufacturing and low carbon business operations.
• Businesses are seeking cost effective ways for companies to meet their net zero targets.
Pathways for Urban Renewable Energy Zones 39
Table 8. Increase participation, attract investment to a region and amplify entrepreneurship and innovation
The hypothesis is that if a UREZ were established in a way that allowed for these values to be harnessed, the result would be reliable, affordable, clean energy which benefits entire communities. Hence, at its core the UREZ represents an energy transition path that can be a win-win for both the energy system and communities. It does this by ensuring that the flexibility of energy systems is enabled through the coordination of DER. Hence a core long-term benefit of the UREZ is the energy system benefits it can provide in the form of energy system services.
2.2 Perspectives of local actors on a UREZ
This section outlines the perspectives of local actors in urban areas. The perspectives are those of local asset owners (i.e. managers of buildings with rooftop space), local government, and local community climate advocacy groups. In WA the local actors engaged were primarily local asset owners in the Midland region, and in Warringah, NSW, the local actors engaged included local community groups and asset owners.
Generally, the perception of UREZ was positive. We saw clear examples of local actors that are already investors and increasingly demonstrated that they want to invest in DER, particularly in Warringah. However, some asset owners across both regions expressed concern that giving households and businesses unfettered opportunities to embrace DER threatens the stability and performance of the energy network. There was a dominate perspective that energy reliability would not be maintained and affordability would be reduced as more DER—particularly generation comes online. This tension is reaching a critical point as the promise of more self-reliant, abundant and cheaper energy for communities clashes with a seemingly contradicting narrative that DER will be unreliable and more expensive.
The perspectives from both regions have been separated into the following two sections:
• 2.2.1 Perspectives from local actors: Midland, North-Western Perth suburb, Western Australia
• 2.2.2 Perspectives from local actors: Warringah, Northern Sydney suburb, New South Wales
Pathways for Urban Renewable Energy Zones 40
2.2.1 Perspectives of local actors: Midland, Western Australia North-Western Perth suburb, Western Australia
Semi-structured interviews were conducted with several Midland stakeholders to better understand the different perspectives on renewable energy and the potential for Midland to become a renewable energy zone.
The first step was to identify the key stakeholders relevant to the Midland Redevelopment Case Study. We then identified potential interviewees from the list of relevant stakeholders and invited them to be interviewed. Potential interviewees were determined using purposive and convenience sampling, which are non-probability sampling techniques that assess the required information and the participant’s alignment to be able to provide this information.
The two main considerations were the interviewee’s
• Relevance to renewable energy at the Midland Redevelopment site

• Availability and willingness to be interviewed in the given timeframe
A total of nine suitable interview participants were identified (Table 9).
Stakeholder Type
Local Council: City of Swan
Role
Sustainability Manager
Building a Developer: Blue Rock Projects Owner
Large Energy User: Saint John of God
Transport Authority: Metro Net
Engineering Manager
Sustainability Strategy
Renewable Energy Provider: Element 47 Owner
Large State Asset Owner: WA Police Assets
Associate Director
Community Representative: Transition Town Midland Community Leader
Resident: Local Councillor Councillor
1.2.1.1 Key Findings: Perspectives on UREZ from the Midland WA Local Actors
The key findings indicated that a UREZ was perceived as a positive opportunity for a township such as Midland. The local actors generally supported the concept and were pleased to know Midland may be considered for a UREZ site. As this case study was selected via a top-down approach originally put forward by Development WA and then measured against the selection criteria by our project team, there is a need to further establish community agreement and engagement. There were some concerns and questions regarding a UREZs implementation and commercial arrangements.
Pathways for Urban Renewable Energy Zones 41
Table 9. Midland interview participants
Key Findings
Load and generation management was seen as a critical function to successfully implement a UREZ.
Different types of load profiles within an urban landscape were seen as an opportunity or a risk to local actors.
Pre-empting EVs in the UREZ was seen as a potential to add more flexible load and demand management.
Energy storage was also seen as a tool to add load and demand flexibility.
What we heard
Mixed-use urban density in managing loads and generation
Residential loads are quite homogenous and predictable because most households have similar appliances and times of energy usage. Most households find that their solar generation can often completely supply their load, which is leading to self-organised, higher renewable energy penetration across residential communities.
Commercial and industrial areas are different. These areas often have large roof space and thus commercial opportunity but require an aggregator or a microgrid manager who can facilitate the process of the commercial business becoming a larger generator but also guarantee that they are able to on-sell that power and get a return on investment. Loads in these areas are also bigger and less predictable. This means that power demands might not be as assured. For example, a business that leases in a renewable energy zone may require more power over time and needs a guarantee that it will have increasing access to renewable energy.
Use EVs as a flexible load and demand option
EV circulation within a UREZ was also mentioned as an inevitable feature of future urbanised landscapes. The installation of charging stations and the ability to use EVs as extra storage devices provides another layer of flexible load and demand options. However, with little to no EV incentives, subsidies or targets in WA, some interviewees felt that EV integration would be slow.
Use energy storage to add load and demand flexibility
The role of storage within a UREZ was a common point of discussion across most interviews. Large-scale community battery storage was mentioned as the best opportunity to add load and demand flexibility within a UREZ. A community battery was perceived as a ‘local power bank’ that can manage peak demand costs, reduce grid exports and instability, and increase energy reliability and access. If a UREZ were to operate as a VPP with the grid then a large-scale community battery could enable the on-sell of energy during peak demand, ensuring a higher price per kWh.
Pathways for Urban Renewable Energy Zones 42 Table 10. Key interview findings load and
considerations
generation
Key Findings
UREZ implementation is perceived as most favourable when aligned with planned upgrades in the zone. This can include required upgrades to grid transmission lines or substations as well as upgrades to physical assets in the area or new infrastructural developments.
Perspectives also considered the contractual and commercial benefits of implementing a UREZ to new land developments.
What we heard
Consider timing UREZ with required grid and substation upgrades
The timing of installing renewable energy upgrades towards a UREZ should be considered in line with needed infrastructural upgrades in the area. This may include required upgrades to grid transmission lines or substations or significant upgrades to physical assets in the area.
Consider timing UREZ with significant infrastructural and asset upgrades within the zone
Local actors mentioned that refurbishment or expansion plans of existing assets would be an opportune time to engage with the UREZ process as planning budgets and contracts would be more easily negotiable during times where infrastructural upgrades are being considered rather than in retrospect.
The timing should also consider the ability to retrofit building assets with more efficient energy appliances, lighting, and heating and cooling as energy efficiency should be at the cornerstone of a UREZ plan.
Consider timing UREZ implementation with new land developments
The commercial model is easier when the infrastructure and contracts are established from the beginning. This enables businesses that move into the area to be inducted to what is already there rather than trying to change an existing area to come on board with a new energy model and business structure.
Pathways for Urban Renewable Energy Zones 43 Table
11. Key interview findings UREZ timing considerations
Key Findings
The UREZ business case needs to make sense to asset owners, and the cost of UREZ components and energy pricing play a big role in bringing them on board.
Network tariffs may disincentivise renewable energy investment for large energy users, who pay a lower tariff for both peak and off-peak demand.
A UREZ will need to establish and firm up energy pricing agreements and guarantees to avoid concerns of lock-ins or price increases.
What we heard
Cost of investment and energy pricing significantly influences
the perceived business case for a UREZ
Several local actors have already invested in solar or have a pipeline of renewable energy projects planned. The business case was mentioned as a key driver, especially for past investment. ‘Pay-back periods’ were significant considerations for owners who owned, or were building, long term assets. ‘Current energy costs’ were also influential in determining whether renewable energy had been invested in or not.
One large energy user stated that:
“We are on a high-demand tariff so our peak and off-peak costs are quite low. The cost–benefit analysis to putting solar on the roof suggests a 30-year pay back so solar doesn’t make sense.”
Cost of energy storage is a barrier to UREZ business case
Storage was identified as something that most local actors had given thought to, however it was considered ‘out of reach’ due to the required capital investment and uncertainty about the ongoing costs of operations and maintenance. Therefore, the cost of storage was noted as the biggest hindrance to installation by many of the key stakeholders, who felt that investing in privately owned storage capacity did not stack up financially. The cost- benefit analysis was therefore less clear than for solar, which made it difficult to get budget approvals for asset owners.
UREZ energy pricing guarantees and contestability options are needed for local asset owner assurances
The price of energy within a UREZ was also discussed. Examples such as Peel Business Park and the Witchcliffe Eco-Village were given as these projects established pricing guarantees and contestability options for their residents. Peel Business Park is an established microgrid, owned and operated by a microgrid operator independent from the grid. This independence enables the operator to provide a 30% price reduction per kWh compared to what Synergy can offer, giving those who lease commercial properties in Peel Business Park an energy price incentive and assurance. A UREZ will need to establish and firm- up energy pricing agreements and guarantees to avoid concerns of lock-ins or price increases.
Pathways for Urban Renewable Energy Zones 44 Table 12. Key interview findings UREZ
costs and
considerations
infrastructure
energy pricing
Key Findings
UREZs can be perceived as an opportunity to revitalise an area in terms of attracting investment and commercial and residential activity.
What we heard
The Midland local actors all agreed that there would likely be benefits to the Midland area if it became a UREZ. There was a perception that it would increase investment and attract more innovative businesses into the area.
The was also discussion about the marketing opportunity of connecting a zone’s/ town’s character and history to the implementation of a UREZ. For example, Midland was once a bluecollar industrial hub, which lends it to being transitioned to a modern technology and commercial hub.
The desire to decarbonise is at the forefront of many asset owners' minds. Carbon reduction opportunities across physical assets are increasing in importance.
Decarbonisation was identified as a growing motivator for increasing renewable energy usage and investment. This was particularly evident amongst the government organisations, who were more aware of the emerging carbon reporting and reduction requirements for their assets than other asset owners. Communityfacing representatives such as local council also suggested that renewable energy was a visible action to support environmental responsibility and organisational reputation.
Pathways for Urban Renewable Energy Zones 45 Table
13. Key interview findings UREZ community willingness and the drive to decarbonise
Key Findings
The perception is that high renewable energy penetration leads to more energy instability.
This concern is particularly pressing for those who manage and own critical infrastructure like hospitals and emergency response departments.
What we heard
There was an overall narrative that higher levels of renewable energy would lead to increased energy instability.
Increased solar leads to brown-outs
One of the large energy consumers in the Midland region discussed the experience of ‘brown-outs’ that had been occurring at his organisation. The perceived cause of the brown-outs was sudden cloud cover over the solar systems in the area and the resultant lag of energy generation.
Critical assets owners or managers are extremely risk averse to change
Several local asset owners or managers expressed the need for a UREZ to be extremely reliable and secure. This is due to the nature of their operations, which includes life support and emergency response. The perception of a UREZ was that it may increase energy supply instability and there was a sense of mistrust of a UREZ as an energy system.
A perception exists that grid network owners are highly risk averse and local actors wanting to trial energy innovations are disincentivised by the amount of red tape.
Many of the local actors perceived Western Power and the WA regulators to be extremely risk averse, prioritising energy security and stability over anything else. The perception was that it is becoming increasingly difficult to approve solar systems that are larger than 5 kW. The biggest requirement for new renewable energy projects trying to connect to the grid is therefore managing demand and load to ensure grid stability.
The current energy regulatory environment is seen to be very complex and a deterrent towards a UREZ.
Questions around ownership, management and governance remain unclear to local actors willing to participate in a UREZ.
Community ownership as a UREZ business model
Prosumer classification and rights need to be clarified.
New regulation is needed that enables the private microgrid operator to have
Who would own, control and operate the UREZ?
The most notable complexities and questions raised in relation to Midland becoming a UREZ were about the regulatory constraints on who could own, control and operate the system. It is intended that a UREZ interacts and is integrated with the existing grid, which adds complexity in terms of cross-grid trading, energy market participation, solar-sizing restrictions, and licencing and approvals.
What are the rights and role of the prosumer?
Regulators are struggling to classify the ‘prosumer’ who generates and consumes energy and could also sell back to the grid. No licenses or regulatory frameworks currently capture an individual becoming a retailer and generator in an energy market. There are complex issues to be dealt with, among them questions about who manages quality.
Pathways for Urban Renewable Energy Zones 46 Table 14.
UREZ
Key interview findings
barriers and challenges
reasonable access to the road reserve to maintain equipment.
Better bespoke or built for purpose integrator microgrid operator licencing is needed.
There are benefits of having third party operators at the zone level for a UREZ to be optimised.
Community ownership as a UREZ business model.
The perceived benefit of having a geographically-defined zone was that it adds a community-based element, whereby ownership and investment can be coordinated amongst those who will benefit from the system –
“It is empowering and focuses costs and investment to users.”
Who can access and maintain the UREZ infrastructure and what licences are required / available?
If a new party becomes a licensed operator, it is not covered by the Energy Operators Act (EOA) and therefore does not have permission to access verge infrastructure or the road reserve. The EOA enables only Synergy and Western Power to enter a customer’s property to read the meter or to install a transmission line. Prospective licensees also need to negotiate some very heavyhanded codes there are no bespoke licenses and smaller actors therefore need to address similar criteria as the networks that manage thousands of poles and wires and loads. Better bespoke or built-for-purpose integrator microgrid operator licencing is needed to overcome this.
Having third-party operators at the zone level benefits UREZ optimisation.
The role of a third-party operator at a precinct level was mentioned as an optimisation and commercial opportunity. The ability to redeploy excess energy to those who want it rather than the energy automatically going to the grid for little to no money would be an advantage.
Recommended Actions
Through synthesis of the Midland local actors’ perspectives, the following actions were recommended with consideration for a UREZ.
The key actions for UREZ considerations were:
• Ensure that UREZs maximise on supply and demand configurations as a zone
• Strategically leverage the growth of EVs and energy storage in the zone
• Time UREZ implementation to coincide with asset upgrades (grid, substation and built environment)
• Establish energy efficiency plans for building stock as a part of a UREZ
• Market UREZs as a town revitalisation and decarbonisation initiatives to encourage investment and social benefit to the area.
Pathways for Urban Renewable Energy Zones 47
The key actions to address concerns were:
• Provide strong evidence and narrative that DER and thus a UREZ will increase stability and reliability (especially for critical services, e.g. hospitals and police assets)
• Clarify options for ownership, investment and infrastructural costings
• Ensure pricing assurances and contestability options are offered under a UREZ to avoid feelings of lock-in
• Simplify regulatory complexities for third party operators and encourage energy service innovation through private enterprise.
2.2.2
Northern Sydney suburb, New South Wales
Perspectives of local actors in Warringah, NSW, were gained through speaking with representatives from local community group Solar Alliance Brookvale and through online research. The community group is seeking to establish a UREZ in Warringah by supporting local businesses to make investments in DER, particularly in rooftop solar. We invited representatives from Solar Alliance Brookvale to join the IRG discussion and share their ground-up perspectives. These inputs were used to synthesise a local perspective on UREZs from this region.
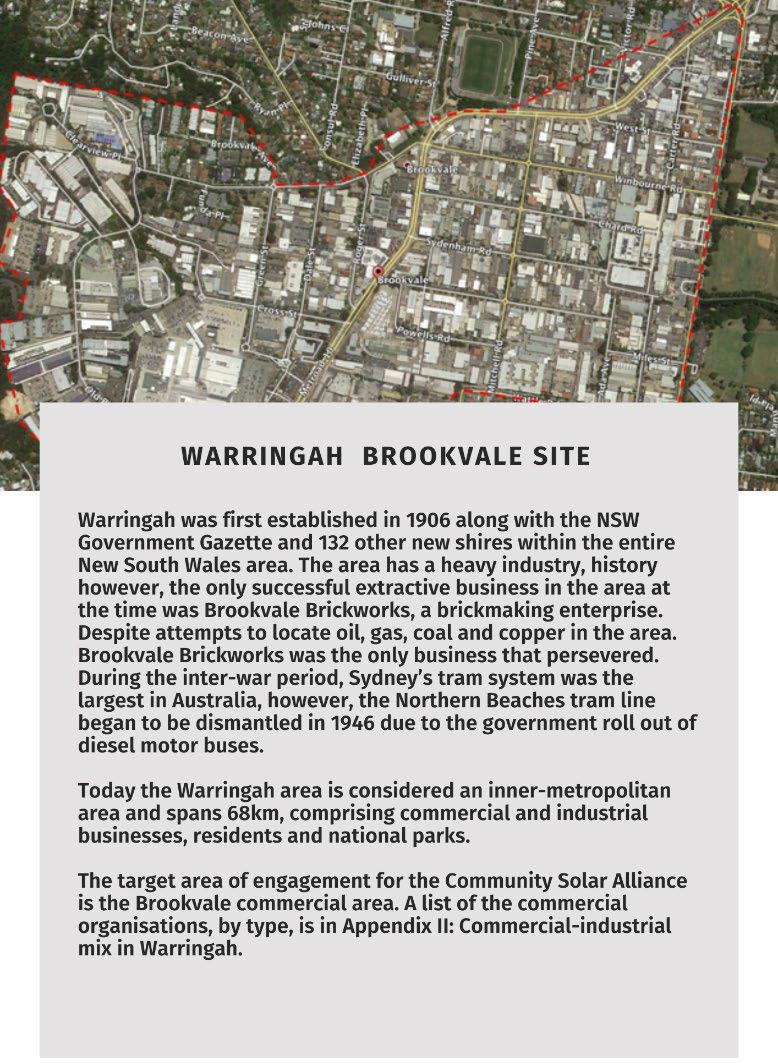
Pathways for Urban Renewable Energy Zones 48
Perspectives of local actors: Warringah,
2.2.2.1 Key Findings: Perspectives on UREZs from the local actors of Warringah, NSW
This region expressed a clear desire to invest in DER and become a UREZ. The community has established local relationships to drive this ambition not only at a community level but also at the government level. The strength of these relationships was evident by the large turn-out from local businesses at Solar Alliance Brookvale’s Powerhouse Brookvale Launch, which launched the Alliance’s plans to turn Brookvale in a UREZ. Speakers from each level of government expressed their support for the initiative. In addition, the Northern Beaches Council has been involved with increasing momentum for the uptake of solar as a form of renewable energy7 and has expressed interest in participating in a UREZ study. Table 15 provides evidence of the local desire to invest in DER and shift to net zero in their community.
What is being heard
The community is increasingly installing solar.
Why is it happening
The momentum for installing solar has increased over the past few years, with over 100 local residents expressing their intention to install solar panels to reduce emissions, save money and increase self-sufficiency following a council–led meeting in 2019. The Northern Beaches Council advocates for oversizing solar supply in residential homes to meet future electricity demand through energy distribution technology for smarter homes and V2H/V2G models for electric vehicle owners 7 . Currently, 28% of residences in the Northern Beaches have installed rooftop solar (equivalent to 14GW).
There is desire from government to electrify major transport.
The community wants to increase uptake of electric vehicles.
In late 2021 Transport for New South Wales awarded Keolis Downer a $900 million contract to operate and maintain electric bus services in the Northern Beaches over eight years. The contract will see the introduction of 125 electric buses from two newly-electrified bus depots in Brookvale and Mona Vale.
In addition to the roll-out of electric bus fleets, the Northern Beaches Council published the Electric Vehicle Charging Infrastructure Plan to support the delivery of EV-charging infrastructure on public land that is integrated with the existing local environment and transportation network 8. The Council strategy aims to reduce vehicle emissions by 30% by 2038, acknowledging that promoting electric vehicles is key to this aim.
There is strong community engagement and action.
The region further benefits from the momentum built by Solar Alliance Brookvale, a not-for-profit organisation that is convened by a group of volunteers with the vision to facilitate the development of the Brookvale precinct as Australia’s first UREZ. The organisation aims to link early adopters with skilled support to assist businesses with finance, research and applications for solar PVs6,8.
Early adopters have already started making commercial investments.
On a small scale, local businesses such as Colormaker have moved as early adopters of solar PVs and experienced the benefit of making deliveries in electric vehicles that are charged with their own solar energy and planned battery.1
The community and commercial industry in Warringah are demonstrating their readiness to act as early movers and invest in DER. The community sees the inherent value in catalysing early investment in order to both contribute to and benefit from the transition. However, emerging evidence (Table 16) suggests that consumers are increasingly frustrated with the external barriers prohibiting them from investing sooner.
Pathways for Urban Renewable Energy Zones 49
Table 15. Local desire to invest in DER in Warringah, NSW
What is being heard Why is this happening
There is a perception that capital is unavailable.
The energy export potential is currently undervalued.
Consumers don’t know how to determine which solar providers are trustworthy.
While the business case stacks up, there is a common misconception that solar is an expensive investment 9. Following the impact of COVID-19 on small, local businesses, the upfront capital required to invest in rooftop solar has not been a priority, especially as businesses typically only plan three years ahead.
Currently export patterns and prices are not well understood by prosumers, preventing individuals and organisations from considering oversizing supply. There is no current incentive to export and share.
There is a consumer perception that considerable research and thinking are needed before businesses and households will make the financial commitment to install rooftop solar. Finding trustworthy solar providers is seen as important to correctly understanding the value of electricity, calculating payback periods, and understanding current consumption and export patterns.
The Northern Beaches Council conducted approximately 70 one-on-one consultations with households to assist it in building capacity to make an informed decision on choosing a solar provider.
The community wants to install more solar in its region but is frustrated with financial barriers.
The community is looking for an acceptable return-on-investment for prosumers exporting solar whilst providing adequate income to the DNSP. The perception is that price incentives for producers and a fair, adjusted way of covering DNSP costs are needed.
Warringah would benefit from seeing a higher export price for the business model to make sense and prosumers to fill entire rooftop areas. It was noted that consumer knowledge and perception on the complexities of oversizing on the grid is still limited as network issues were not discussed during stakeholder engagements. A DER solution is needed that catalyses local action whilst shielding the consumer from the grid and network complexities.
2.3 Synthesis of perspectives on a UREZ
Combining the perspectives of both the energy actors and the local actors on the UREZ revealed a clear tension in the perception of DER. On one hand DER is positioned as an opportunity for abundant, cheaper, reliable energy. On the other hand, there was evidence of frustration at not being able to invest in DER sooner and assertions that DER would actually decrease energy system reliability. These views seem paradoxical—DER is both presented as huge opportunity for delivering net zero and cheaper and more reliable energy, while at the same time it is positioned as a more expensive, less reliable form of energy.
2.3.1 UREZs as a pathway for scaling DER
To resolve this paradox, we recognised twodistinctivepathwaysforscalingDERincommunities (Figure 16). In the top path, DER represents an opportunity to be enabled. In the bottom path, DER represents a challenge to be managed. Using this model, a UREZ represents the approach a region can take to enable DER growth to follow the top path. In other words, the UREZ path represents a re-ordering of the current energy system so that investment in DER is dramatically scaled up and taps into all the potential benefits of DER identified through this project engagement.
7 Australian Energy Foundation. (n.d.). Future-proof your solar for batteries and EV. Accessible at: https://www.aef.com.au/for-home/future-proof-solarbatteries-evs-the-northern-beaches/
8 Northern Beaches Council. (n.d.). Northern Beaches Council Electric Vehicle Charging Infrastructure Plan. Accessible at: https://files.northernbeaches.nsw.gov.au/sites/default/files/documents/policies-register/transport-and-active-travel-strategies-and-plans/transport-andactive-travel/electric-vehicle-charging-infrastructure-plan.PDF
9 Matich, Blake. (2020, July 30). The sun shines on Sydney’s Northern Beaches but can it shine for them? PV Magazine. Accessible at: https://www.pvmagazine-australia.com/2020/07/30/the-sun-shines-on-sydneys-northern-beaches-but-can-it-shine-for-them/
Pathways for Urban Renewable Energy Zones 50
Table 16. What is holding back DER investment in Warringah, NSW
This is a novel and we think valuable conceptualisation of the challenge of DER. The term ‘disruption’ has been deliberately chosen in this model. Harnessing DER through the UREZ pathway (the top pathway) demands a different, disruptive mindset on how the energy system is managed. Each phase along the top pathway offers the potential for creating cheaper, more reliable, fairer energy all the benefits that have been outlined in the sections above. However, in order to succeed, the projects, programs and leadership needed to track along the top path will have to engage with counterpoint pressures that maintain the trajectory of the bottom path. Unsurprisingly, these counterpoints reflect the hard-won, positive attributes of the current energy system market like efficiency, reliability, and control. Success in UREZ implementation will depend on establishing trust that new distributed energy markets will deliver the same reliability and affordability of energy.
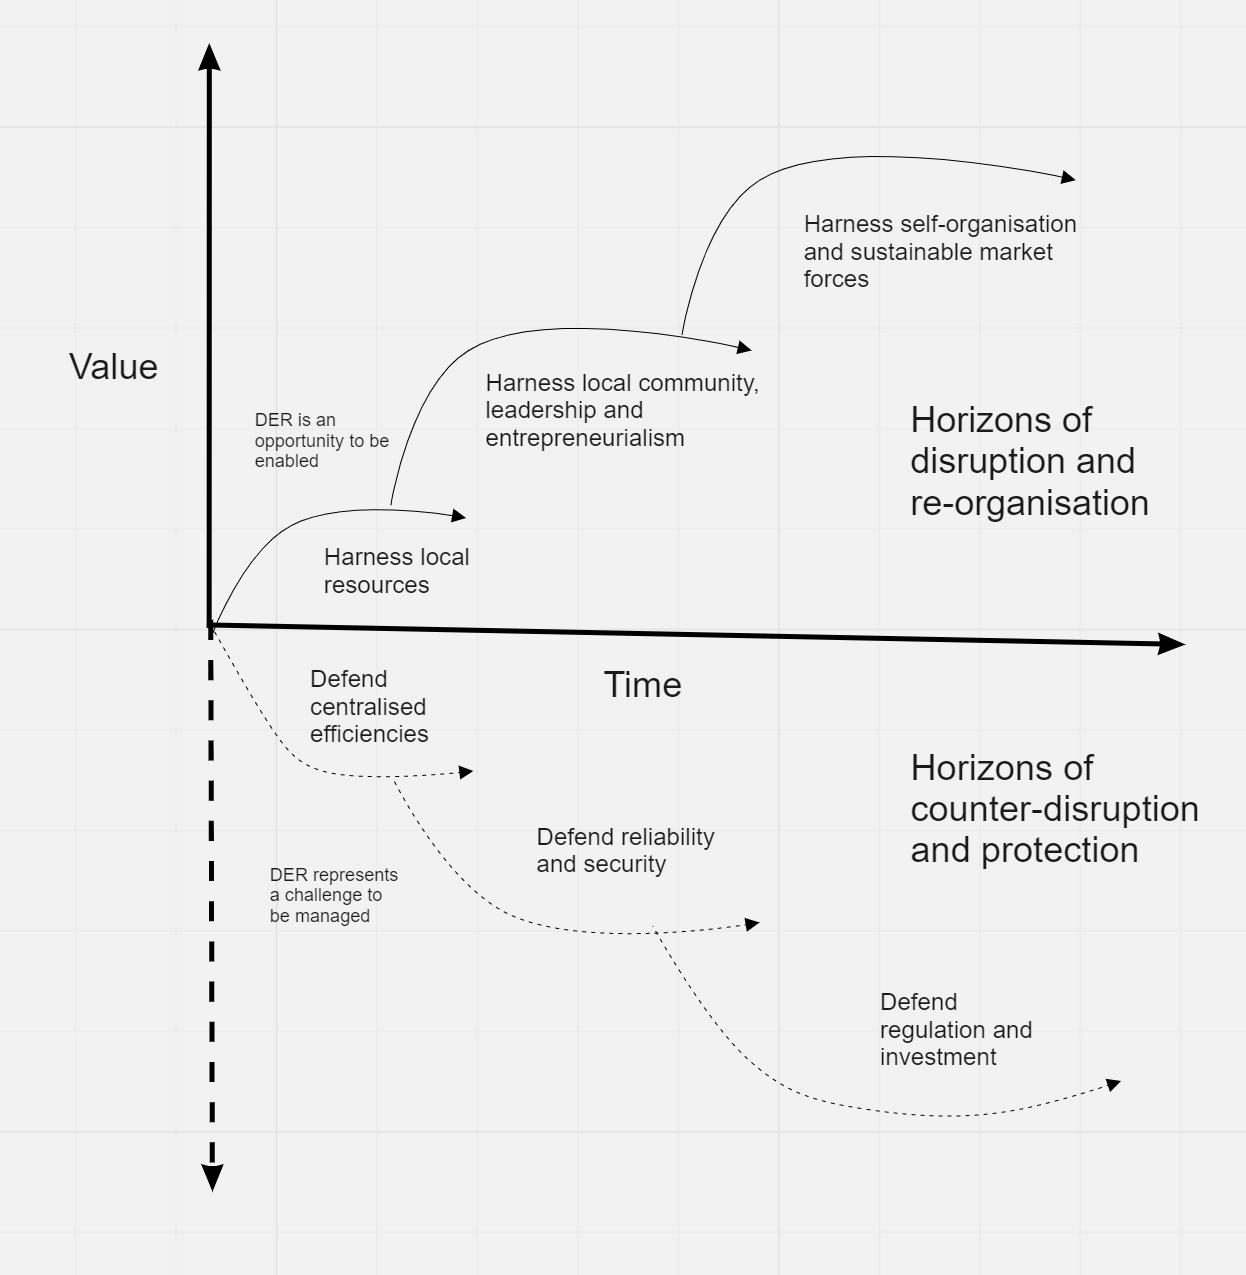
For each horizon in the UREZ pathway (the top path), new and possibly unusual partnerships will continually butt up against legacy perspectives for energy management. These counter arguments will undoubtedly be persuasive, grounded in the attributes of efficiency and reliability that are expected of an energy system. The model proposes that staying the course of this transformation will be highly rewarding as a new model for energy management enabled through the implementation of a UREZ offers profound benefits to achieve net zero, improve the energy system more broadly, and spawn broader innovations.
Another important insight from this framing is that it helps position electricity transition among other reforms that have shifted from centralised, monopolistic and regulated to distributed, competitive and dynamic. Services such as regulated banking and telecommunications began as government-owned regulated monopolies because of their high strategic value and high barriers to entry. As these barriers declined through
Pathways for Urban Renewable Energy Zones 51
Figure 16. Alternative paths for scaling DER
new technologies and/or government reforms these services have transitioned, often through disruptive phases.
2.4 Recommendations for early action
Figure 16 conceptualises the profound potential value of taking the UREZ pathway whilst acknowledging that there will be a dampening pressure along the way. It stimulates practical question about what UREZ implementation looks like, such as ‘what are the projects and programs for a UREZ that help us progress along the top path’.
At this point we do not have all the design answers, but the perspectives gained through this RACE for 2030 Fast Track project have already brought forward several target areas that UREZ projects and programs should address. Some key features to be addressed in the next phase of the design of UREZs have been identified throughout the engagement phase of this Fast Track project.
1. A UREZ coordinator to partner with the distribution network provider and unlock the win-win potential of a UREZ
This would incorporate process to streamline network connection services as part of the UREZ and involve co-design of mechanisms to pay for the flexibility and other energy systems services provided by coordinated DER.
An ongoing partnership would address the physical considerations of the grid and streamline processes for network connection services as part of the UREZ. Additionally, a business case will need to be unlocked by leveraging distribution network providers to change Transmission Use of System, Distribution Use of System and Frequency Control Ancillary Services payments to reward community action and recognise the value in avoidance of costly grid upgrades. These do not have to be solved immediately but this partnership requires longer-term engagement coordinated by RACE for 2030 or Climate-KIC to understand the commercial UREZ model and subsequent local needs at each zone.
2. Organisations that share alignment with UREZ need to invest as early movers in grid services, aggregation capability and connectivity in conjunction with rolling out more local generation and storage
Local organisations in these case study areas are ready to partner across these services. This includes incentivising storage which has control devices and proving that there is an underlying business case for aggregation services in the UREZ. These organisations must collaborate with the UREZ zone coordinator to effectively work across the energy service system to catalyse market transformations instead of siloing supply and demand side interventions.
3. UREZ coordinator to convene key local stakeholders to establish robust and flexible market arrangements that facilitates UREZ growth
This involves supporting or creating institutions like state government and community organisations that build trust, market lubrication and momentum where needed. It includes investing in standards and auditing bodies that will over time continue to enhance the trust in the organisations and institutions that deliver the UREZ. It also includes supporting the development of the skilled workforce needed to deliver the UREZ as it scales up, as well as investing in the capacity for local businesses to understand the opportunity associated with participating in the UREZ. This could be done by expanding the remit of Business Renewables Centre Australia to include local energy procurement.
Pathways for Urban Renewable Energy Zones 52
3.Demonstrating pathways for Urban Renewable Energy Zones Part C Network Problems and Solutions for a UREZ
The intention for a UREZ is to cost effectively facilitate meeting the net zero operational targets of large-scale and medium-scale commercial and industrial consumers in urban areas by increasing the distributed generation of clean renewable energy by prosumers within the same urban zone. A UREZ is expected to reach self-sufficiency in energy and potentially the ability to export energy to other nearby areas. Hence, a UREZ should be designed to handle extremely high renewable energy penetration levels beyond 100% of the local demand. EVs at homes, home-scale distributed batteries, community batteries, and EVs at central parking areas provide options for storing energy to manage the energy system when needed.
A UREZ demands changes to the energy management system to facilitate this DER. In this section we describe how this new high-DER penetration in distribution lines creates network problems and we put forward a design for a new control model for a UREZ. Implementing a UREZ requires a region to invest in the control layers described below.
The proposed approach makes it practically possible to use the existing network assets until it becomes essential to upgrade them. The control model will allow sharing of locally generated renewables with large commercial and industrial consumers to meet their net zero targets more quickly while minimising additional costs for network upgrades.
Furthermore, the power that is exported to or imported from the larger grid could be regulated by the control strategy proposed. The proposed control strategy could also be used in a way that facilitates controlling the power flow during an emergency (such as during daytime oversupply) or to help stabilise the system during periods of low system inertia. The remote control of a single UREZ would be more reliable and effective in mitigating undesired operating conditions than controlling numerous smart inverters of prosumers as is being planned or adopted at present. Thus, the UREZ control strategy could serve as a way to control the power flow in the entire grid power system.
3.1 Network problems in conventional power systems
Conventional electrical power systems (Figure 17) are built to deliver energy from large, centralised power- generating stations through transmission lines at high voltages and then through medium-voltage and low- voltage distribution lines to consumers. A transformer at a substation is required at each stage of voltage step up or step down. Both power lines and transformers have a maximum power rating within which they can safely operate. Violating this limit will cause an overloading fault and can damage the expensive equipment due to overheating. Furthermore, when power flows from one end of the line or cable to the other it causes the voltage to drop due to the impedance of the lines or the cable. In a low voltage distribution system, this is mainly due to the resistance of the line, which depends on the conductor material, the cross-sectional area and the length of the line. Thus, the conventional challenge is to avoid consumers receiving voltages below the acceptable levels, or in other words, to avoid ‘undervoltage’ at the end of the distribution line as illustrated in
Pathways for Urban Renewable Energy Zones 53
In a conventional power system it is also important to balance the load in the three-phase wires to avoid neutral line voltages and currents. This is usually performed at the time of connection of a load to the network and based on the installed load capacity However, during consumption, a degree of phase unbalance is
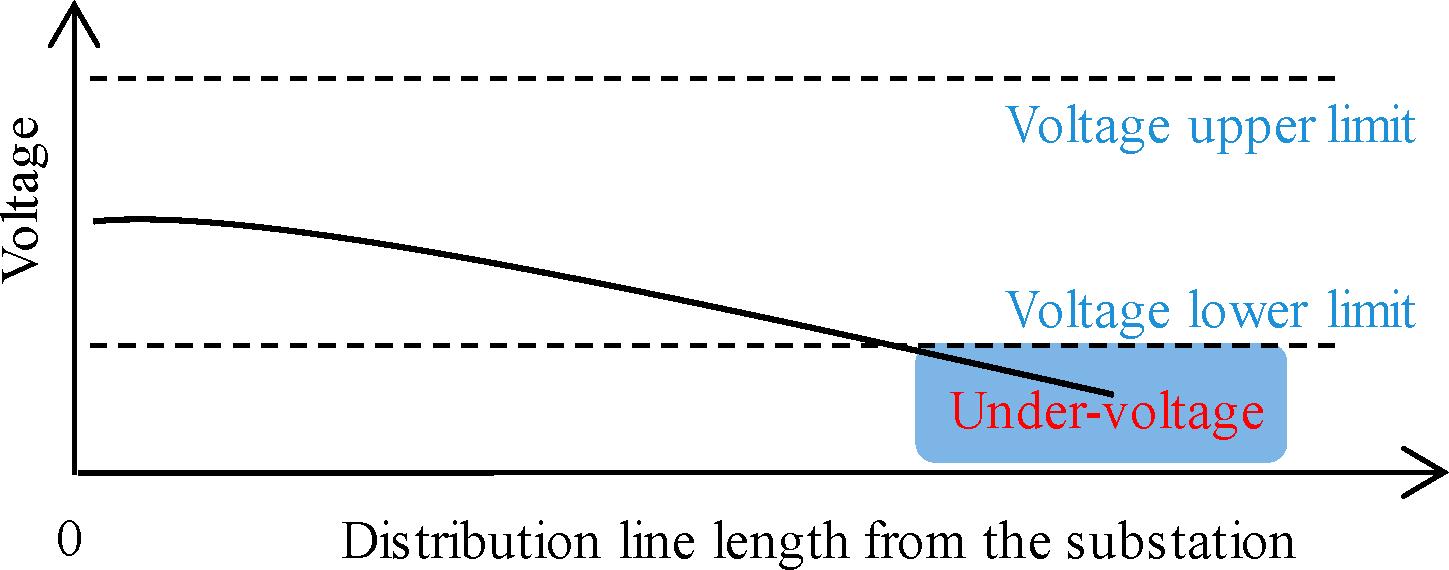
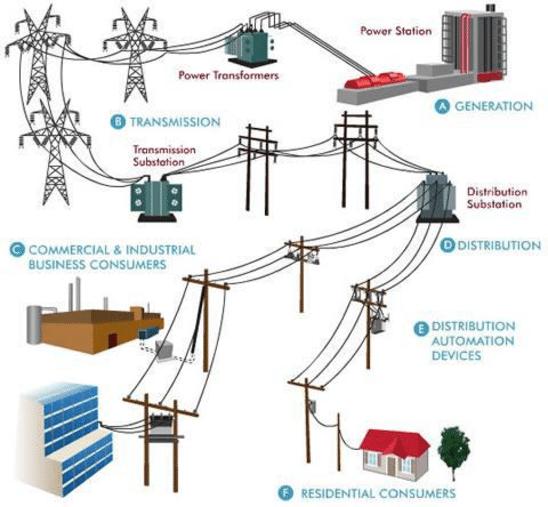
10 “Technical Rules”, Western Power, 1December 2016, Revision 3, Retrieved from https://www.erawa.com.au/cproot/14411/2/edm%2040518689%20%20technical%20rules%201st%20august%202016%20publish%20version%20-%20fri.pdf on 10/03/2022.
11 “Load Sharing of Transformers for Intelligent Electric Power Management”, A. U. Rehman, R. M Asif, S. R. Hassan and M T. Sadiq, Journal of Applied and Emerging Sciences Vol (09), Issue (02), Dec. 2019.
12 “Coordinated Voltage Regulation by On-Load Tap Changer Operation and Demand Response Based on Voltage Ranking Search Algorithm”, Qiangqiang Xie, Xiangrong Shentu, Xusheng Wu, Yi Ding, Yongzhu Hua and Jiadong Cui, Energies 2019, 12(10), 1902; https://doi.org/10.3390/en12101902
Pathways for Urban Renewable Energy Zones
54
Figure 18 Table 17 presents the acceptable voltage ranges for different states in Australia. For Western Australia, this range is +/-6% 10
Figure 17. Conventional power systems built for power flow from the central generators to consumers 11
Figure 18. Voltage drop along the power flow direction causes undervoltage in conventional energy systems 12
expected because the consumption varies dynamically. In general, the phase balancing is kept at an acceptable level without any significant intervention by the network.
NSW Ausgrid 230V + 10% / - 6% (Ausgrid 2016)
Endeavour 230V + 10% / - 6% ‘for most customers most of the time’ + 14% / - 6% ‘under certain network conditions’
(Endeavour Energy 2016) Essential 230v + 10% / - 2% for 95% of the time
Section 3.3 of Essential Energy Supply Standards
+ 10% / - 6% for 99% of the time
(Essential Energy 2014, Essential Energy 2016) Victoria United Energy 230V Steady state: + 10% / - 6%
Less than one minute: + 14% / - 10%
Phase to earth for less than 10 seconds: + 50% / - 100%
As per Energy Distribution Code section 4.2.2
(Essential Services Commission Victoria 2015)
SA SAON
+ 10% / - 6% (SA Power Networks 2016) TAS
+ 10% / - 6% (TasNetworks 2014)
ACT ActewAGL 230V + 10% / - 6% (ActewAGL Distribution 2016)
Furthermore, in a conventional power system most generators are based on rotating machines that have mechanical inertia to prevent sudden changes in electric power from causing similar changes in system frequency. Continuous fast fluctuations of power consumption or generation do not occur under normal power consumption patterns.
3.2 Network problems in a UREZ
As illustrated in Figure 19, a UREZ power system that depends highly on distributed renewables such as solar PV arrays on residential or commercial rooftops will reverse the power flow direction at times of high generation Power generation in a UREZ occurs at the end of the distribution lines If the local load is sufficiently large there is no export of power from the UREZ to other areas. However, if the generation exceeds local consumption, redundant power is exported to larger commercial and industrial loads away from the
13
Pathways for Urban Renewable Energy Zones
55
State DNSP Nominal Voltage Nominal Range Reference
Ergon
Table 17. Nominal LV network voltage ranges for different states of Australia 13
QLD Energex 240V */- 6% (Energex 2017)
240V */- 6% (Ergon 2017)
Powercor 230V CitiPower 230V Jemena 230V Ausnet Services (SP
230V
Ausnet)
230V
TasNetworks 230V
“Data driven exploration of voltage conditions in the Low Voltage network for sites with distributed solar PV”, N. Stringer, A. Bruce and I. MacGill, Asia-Pacific Solar Research Conference, 2017.
UREZ through MV/HV lines. Therefore, the highest voltage on a distribution line will be at the furthest end of the line from the substation With increasing length of the distribution line from the substation, overvoltage conditions can occur during high generation times as depicted in Figure 20. Such overvoltage incidents will trip the solar PV inverters, limiting their participation in the energy system.
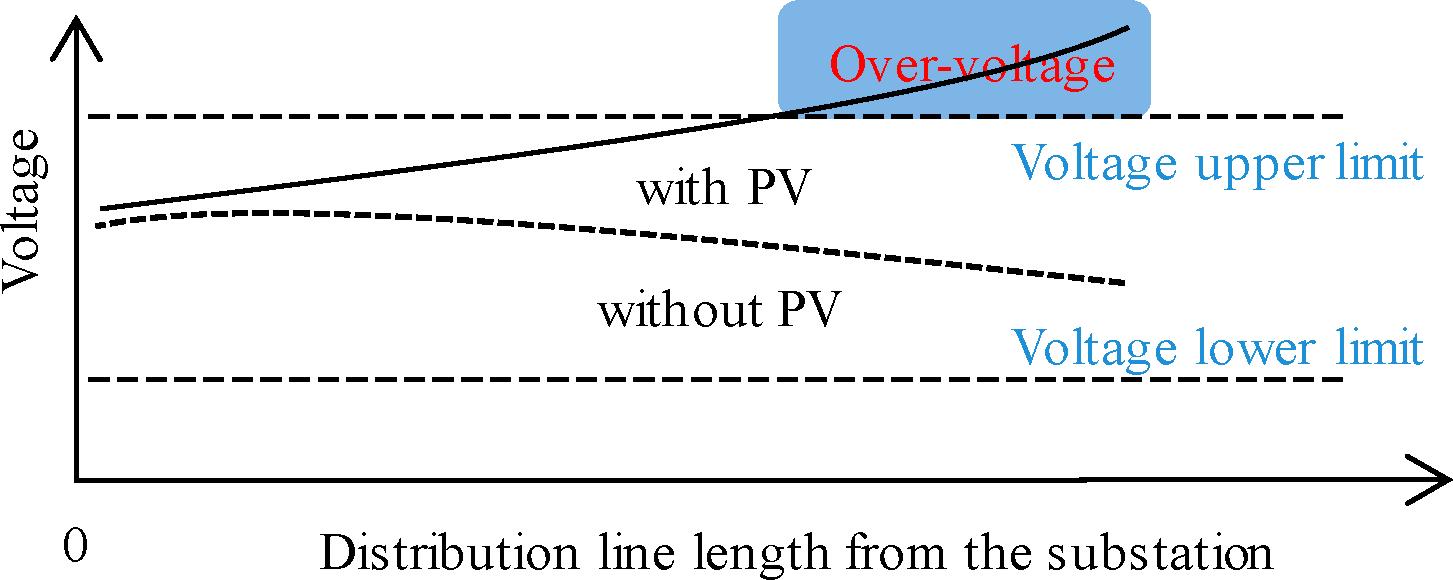
Since generation from solar PV arrays is only available during the daytime and the peak house demand occurs at night, the reverse voltage profile occurs during peak-load demands, typically at night At those times the highest voltage will be at the substation as is usually the case in conventional power systems. In a UREZ power system, dynamic voltage control is required when the generation or the demand increases to sufficiently high values.
With increasing renewable energy penetration overloading of the lines and transformers can also occur. This happens because the power generated needs to flow through the lines if there is no way to store it locally. High renewable energy generation also increases phase unbalance in distribution lines. This is mainly because generation occurs only after the network connection is made The system becomes significantly phaseunbalanced during high generation times14. This can cause increased neutral line currents and voltages, sometimes resulting in malfunctioning of the protection systems. However, Figure 21 shows that out of the possible limiting factors that can impact a network the solar PV hosting capacity of a system is limited by overvoltage during 48% of occurrences, overloading during 26% of occurrences, and phase unbalance during 19% occurrences. Harmonics and flicker cause limitation during 4% and 3% of occurrences, respectively.

Therefore, controlling the voltage and current of the distribution lines could increase the renewable energy hosting capacity during 74% of occurrences.
Pathways for Urban Renewable Energy Zones
56
Figure 19. A conceptual future power system where the power flow direction is reversed 9
Figure 20. Increased generation by prosumers can lead to overvoltage at the end of distributed lines 10
14 “Review on the PV Hosting Capacity in Distribution Networks”, Samar Fatima, Verner Püvi and Matti Lehtonen, Energies 2020, 13, 4756; doi:10.3390/en13184756.
From the point of the network, an uncontrolled flow of renewable energy to the grid at medium and high voltage levels causes tremendous problems In general, highly fluctuating powerline voltages and currents result in poor power quality for all customers powered by the network The increased inverter-based generation (such as with solar PV arrays) reduces the ratings of rotating machines in large central power stations. This results in reduced system inertia and thereby increases system instability 15. Furthermore, spinning reserves and their ramping capabilities need to be increased as renewable energy sources such as solar power availability can change rapidly.
Another major problem with increasing renewable energy in a power system is the underutilisation of the available capacity of transformers and lines. Where solar power is the main generation source in a UREZ, the lines and transformers receive the highest power at around noon but only for a very short period. This means that unless the power flow is regulated the network is underutilised for most of the day.
3.3 Proposed solution to control power flow in a UREZ
In proposing a UREZ as the vehicle for growth of renewable energy in urban areas, we need to find solutions to the network-related problems presented in the previous section. These solutions must not only provide a way to mitigate the aforementioned problems but must also—
• provide a least-cost strategy
• utilise existing systems to the maximum capacity
• minimise extra investments needed
• attempt to solve network problems within the UREZ as well as within the larger network
• create a platform to promote increased participation of residential prosumers
• support large and medium-scale commercial and industrial customers to meet net zero targets using locally generated renewable energy
• create an environment to promote industry and community-scale investments in the energy sector
• minimise changes in regulatory frameworks.
Journal of Power and Energy Systems, vol 5, no 3, pp 295-305, Sept 2019, doi: 10.17775/CSEEJPES.2019.00230.
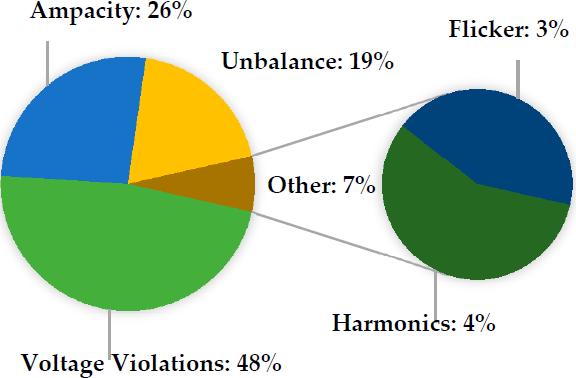
Pathways for Urban Renewable Energy Zones 57
Figure 21. Percentages of statistics of solar PV-hosting capacity limiting factors12
15 "Review of system strength and inertia requirements for the national electricity market of Australia," H. Gu, R. Yan and T. Saha, CSEE
Based on hierarchical control concepts applied in large and complex systems, a multi-layer approach to controlling power in UREZs is presented below to achieve the stated objectives. The model first needs to be designed and tested through computer simulations to verify its effectiveness before being field tested. The scope of this work is beyond the boundaries of this project.
3.3.1 Layer 1: Urban Renewable Energy Zone (UREZ)
The UREZ controller is the highest level of control and looks after the medium voltage network in communication with the external and internal stakeholders. This controller is essentially a software algorithm, taking decisions based on the information received from the zone and from the external systems. As the resulting actions are applied to control network assets, it is highly likely the UREZ controller is owned and operated by the Distributed Network Services Provider (DNSP) or one of their subsidiaries.
Within a UREZ a large number of distribution substations connect LV-feeders to prosumers. The area that is supplied by a distribution substation is referred to as a ‘Nano REZ’ or NREZ. Each NREZ has its own NREZ controller that controls the power flow on the LV side of the distribution system in communication with the UREZ controller and the other controllers within the NREZ In contrast to the UREZ controller, the ownership and operation of the NREZ controllers could be delegated to joint subsidiaries of DNSP with private companies, community organizations, etc.
This is mainly because the impact of the decisions taken by this software controller are limited to the local area and may involve action on assets owned by companies, community organizations and buildings The third level of control is the Building Energy Management System (BEMS) that determines the energy flow in and out of a building in communication with the NREZ controller and the controllers within the building. Finally, the Home Energy Management System (HEMS) controls the energy consumption pattern within a home in communication with the BEMS of the respective building. Both BEMS and HEMS are more likely to be hardware devices embedded with smart energy management software, metering, and communication.
A UREZ will have a central controller (Figure 22) that delivers the following objectives:
1. Regulate the import/export of power through Distribution Substations (DS) to/from the medium voltage (MV) network ex: 11 kV, 22 kV by setting maximum power thresholds of NREZ controllers to the transformer nameplate capacities.
2. Monitor and control the transactions and power flows with the larger network with the real-time updates of tariffs, weather, loading etc.
3. When renewable energy produced by residential prosumers is directed to large consumers within the zone, ensure that power flows in the MV network and through Distribution Transformers are within the safe limits by applying limitations to possible participation by each NREZ.
Pathways for Urban Renewable Energy Zones 58
The UREZ controller is technical in nature but does not necessarily need to operate network assets on the MV network. This role can be fulfilled either by the DNSP or by an aggregator. However, a cooperative entity with the participation of DNSP and the aggregators would be the best option.
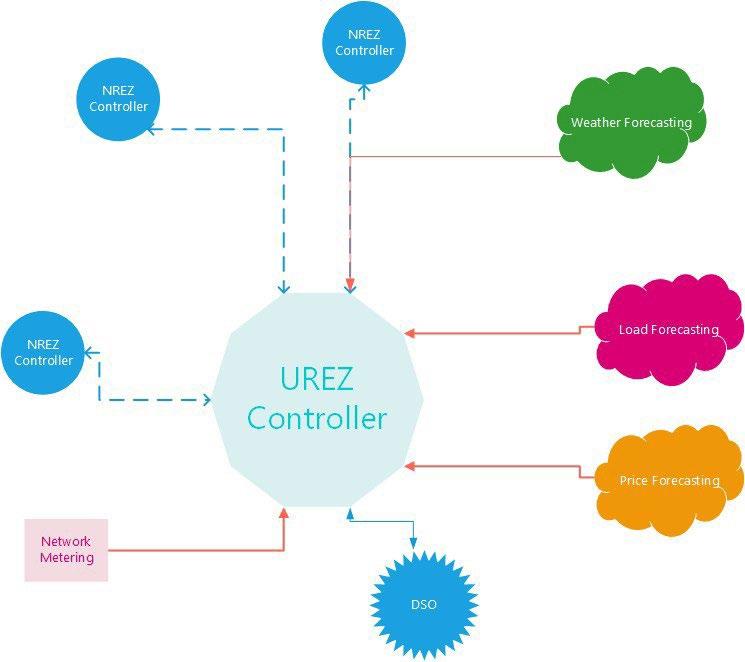
3.3.2 Layer 2: Nano-Renewable Energy Zones (NREZ)
The NREZ controller controls the power flow in the LV network of each distribution transformer. A lumped model of an NREZ showing some of the possible major components is illustrated in Figure 23 As indicated, the prosumers are categorised into three groups: residential (below 10 kW), medium-scale commercial (10 kW to 100 kW) and large-scale commercial (above 100 kW) Each category of prosumers has buildings with power consumption and or generation that are fitted with Building Energy Management Systems The residential consumer category represents hundreds or thousands of residential buildings of various types As the power level increases the number of prosumers in each category decreases.
In addition to these three types of prosumers an NREZ also has central parking areas with possible rooftop PV generation and EV batteries for charging and discharging Furthermore, the distributed batteries at buildings (most likely community storages) are also connected along the distribution lines to control the power flow within the NREZ. The distribution lines are fitted with company-owned metering devices to help manage the voltage profile and power flow. The voltage profile of the line is dynamically and automatically controlled using online tap changers (OLTC) at the distribution transformer as well as step voltage regulators (SVR)16 , DSTATCOM-type devices 17, 18, community-scale battery energy storages (BESS) 19 and the smart inverters 20 associated with prosumer solar PV arrays to avoid overvoltage or undervoltage problems.
16 “An Average Voltage Approach to Control Energy Storage Device and Tap Changing Transformers Under High Distributed Generation," N. Tshivhase, A. N. Hasan and T. Shongwe , IEEE Access, vol. 9, pp. 108731-108753, 2021, doi: 10.1109/ACCESS.2021.3101463.
17 “eleXsys: Our Technology”, Retrieved from https://elexsys.com/the-solution/our-technology/ on 08/03/2022.
18 "Optimal d-STATCOM Placement using OpenDSS/Matlab", U. Mumtahina, S. Alakahoon and P. Wolfs, 2021 IEEE PES Innovative Smart Grid Technologies - Asia (ISGT Asia), 2021, pp. 1-5, doi: 10.1109/ISGTAsia49270.2021.9715672.
19 "Distributed Control of Battery Energy Storage Systems for Voltage Regulation in Distribution Networks With High PV Penetration," M. Zeraati, M. E. Hamedani Golshan and J. M Guerrero, IEEE Transactions on Smart Grid, vol. 9, no. 4, pp. 3582-3593, July 2018, doi:.10.1109/TSG.2016.2636217.
20 "Smart Inverter Volt-Watt Control Design in High PV-Penetrated Distribution Systems", M. G. Kashani, M. Mobarrez and S. Bhattacharya, IEEE Transactions on Industry Applications, vol. 55, no. 2, pp. 1147-1156, March-April 2019, doi: 10.1109/TIA.2018.2878844.
Pathways for Urban Renewable Energy Zones 59
Figure 22. UREZ controller controls the power flow in the MV network
Increased phase balancing can be achieved using dynamic phase balancers. To facilitate such power quality enhancement measures, increased smart metering along the line becomes essential. Central parking areas could be converted to renewable energy generation assets with rooftop solar PV arrays while the EVs at such parking areas could be utilised for energy management in the NREZ.
Each NREZ Controller is expected to perform following duties:
• Receive instructions from the UREZ controller to regulate the power transfer through the distribution transformers; Power exported from or imported to the MV network should not be above the limits set by UREZ controller
• Supply the operating conditions of the LV power system to the UREZ controller so that the UREZ controller can function effectively
• Ensure the LV powerline voltage is kept within acceptable margins
• Meet the power demand using the generation within the zone to minimise powerline current fluctuations
• Receive the offer/bid prices of electricity from each BEMS in the zone to maximize the value of generation
• Receive weather, price, load and LV network metering data in decision making processes
• Use the central EV charging and central storage intelligently to reduce daytime oversupply and night time peak load
• Use the central storages and central EV charging and weather forecasting to act against generation fluctuations due to weather events
• Communicate with Building Energy Management Systems to provide price information and receive generation/consumption data
• Control power line voltage within acceptable margins to control the load
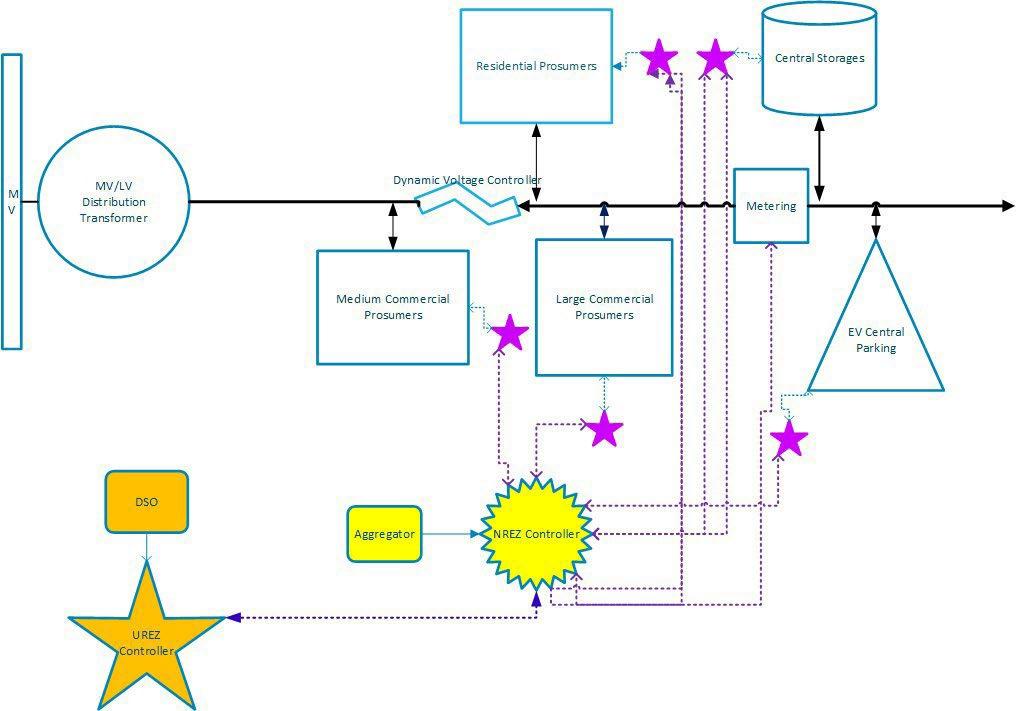
Pathways for Urban Renewable Energy Zones 60
Figure 23. NREZ controller controls the power flow on the LV-side of a distribution transformer
• Use cloud and load forecasting to operate energy storages to minimise power fluctuations.
To implement these tasks, the NREZ will control or operate in tandem with the following through a dedicated communication network:
1. UREZ controller
2. Building Energy Management Systems of residential, medium-scale commercial and large-scale commercial prosumers
3. Community energy storages
4. Large car parks with EV charging/discharging with or without rooftop PV generation
5. Power line metering at various points along the LV feeder.
The quality of the communication network will therefore be crucial to build an effective NREZ controller 21 The NREZ controller dealing with all low voltage devices could be managed by private companies acting as energy aggregators.
3.3.3 Layer 3: Building Energy Management Systems (BEMS)
Building Energy Management Systems (BEMS)22 will not only control the building-specific power devices but also communicate and control the Home Area Management Systems (HEMS) (Figure 24).
21 "Smart home energy management system including renewable energy based on ZigBee and PLC", J. Han, C. -s. Choi, W. -k. Park, I Lee and S. -h. Kim, IEEE Transactions on Consumer Electronics, vol. 60, no. 2, pp. 198-202, May 2014, doi: 10.1109/TCE.2014.6851994.
22 "Goal Programming Approach for Energy Management of Smart Building", Z. Foroozandeh, S. Ramos, J. Soares and Z. Vale, IEEE Access, doi: 10.1109/ACCESS.2022.3153341.
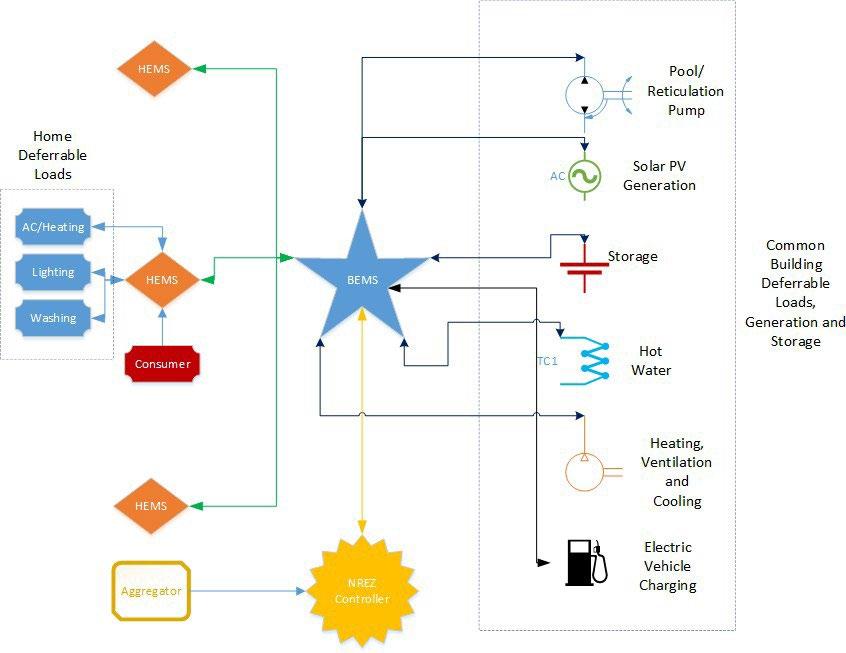
Pathways for Urban Renewable Energy Zones 61
Figure 24. The Building Energy Management System controls the power flow within a building
The functions of the BEMs are outlined below.
• BEMS will directly control the common deferrable building loads (e.g. water heater, pool pump, EV), RE generation (e.g. smart inverters of PV arrays), distributed storage (e.g. building-scale batteries) in communication with the NREZ controller.
• BEMS will be operated by the owner/s of the building through software settings; The destination of RE generated, charging and discharging periods and patterns of storage are also decided by the building owner/s.
3.3.4 Layer 4: Home Energy Management Systems (HEMS)
Figure 24 also shows the range of control possible through Home Energy Management Systems (HEMS)14,15 A building can contain multiple dwellings, workplaces and so on. Each of these places has some deferrable loads that can be used to reduce the energy bills (e.g. AC/heating, lighting, washing, drying)
HEMS will be used to achieve following objectives:
• Reduce energy bills by shifting the load to lower tariff periods such as midday
• Reduce the carbon footprint by consuming energy from green energy sources
• Increase energy efficiency.
By reducing the amount of energy consumed within a UREZ through efficiency improvements, the share of renewable energy generation can be increased and overall emissions reduced. The following are some example steps that can be taken:
• Support residents, businesses and landlords in the zone to implement energy efficiency improvements for their premises. This can be through coordinated information, bulk buys of materials and products, provision of combined finance and streamlined access to incentives.
• Provide an energy concierge role as well as a platform to provide information, advice and access to help support coordination of energy-efficiency improvements for the entire UREZ.
3.4 Increasing renewable energy generation
A UREZ depends on high local renewable energy generation to meet the energy demands of large and small customers within the zone. The following steps can be taken to accelerate the growth of renewable energy within a UREZ:
• Support all residents in the zone to install customer-owned or aggregator-owned PV arrays on rooftops. Leasing the rooftops to the aggregator for a specific period such as 10 to 15 years is a possible and already existing business model.
• Promote large landowners or government agencies of the zone to lease unshaded land for groundmounted PV arrays. Wherever space and safety conditions are met, tracked PV arrays can be installed to increase the energy yield.
Pathways for Urban Renewable Energy Zones 62
• Convert central car parks into PV power generation centres by building roofs and installing PV arrays on top of them. Part or all of the power generated is to be used to charge EVs during the daytime.
• Promote PV power generation using building-integrated solar PV modules in large and mediumscale commercial buildings.
• Install wind turbines in open areas not too close to residential dwellings
• Explore options for biomass or biogas if there is a locally available source of fuel (e.g. sawdust from timber processing and manufacturing or biogas from wastewater treatment).
This can all be supported through coordinated information dissemination, bulk buys of materials and products, provision of combined finance and streamlined access to incentives. An energy concierge role as well as a platform to provide information, advice and access would help to support the coordination of renewable energy deployment for the entire UREZ
3.5 Transitioning pathway from existing to proposed UREZ network configuration
By controlling the UREZ as proposed in the above control model with the necessary metering, communication and control infrastructure, the anticipated high growth of renewable energy in a UREZ can be accommodated at least cost and minimum network performance problems. However, not all the features in the proposed network configuration are needed at the outset when the existing renewable energy penetration levels are low. The anticipated pathway for transitioning from the existing to the future network is summarised below:
Stage 1: Adopt the multi-layer control model with increased metering, communication and control with no large energy storages such as community batteries when the renewable energy penetration level is low, there are no overvoltage problems, no significant levels of generation curtailments by the network company, and there is no requirement for energy arbitrage. At that time the generated amount of energy will be consumed mostly by large commercial and industrial customers.
Stage 2: When overvoltage or overloading issues start to appear due to increased RE generation or else the generation curtailment becomes significant, control the voltage deviations and perform energy arbitrage. This could involve using dynamic voltage controllers, dynamic phase balancers, communityscale batteries or fleets of EVs. The distribution feeder and transformer loading levels will be controlled using energy storage devices to avoid any overloading of the lines or transformer.
Stage 3: When transformer or feeder overloading happens even with dynamic voltage controllers, phase balancers, smart inverters and sufficient energy storage devices in place, the RE penetration has reached a level where an upgrade to the transformer or the feeder is required. However, this will be apparent well in advance and possible serious network outages can be avoided.
Pathways for Urban Renewable Energy Zones 63
3.6 Case studies
Purpose
The purpose of this modelling is to evaluate the impact of a significant integration of rooftop PV panels on the voltage magnitude of the HV-side of distribution transformers and power flow through network conductors and transformers. This modelling and analysis will reveal:
• To what extent the existing network can handle the proliferation of rooftop PV panels without requiring a considerable variation to the network configuration
• What the potential rooftop PV panel installation capacity is in the area
• How employing battery energy storage systems can facilitate higher PV integration levels without violating technical standards of the network
• What the suitability is of a given site for implementing a UREZ.
Methodology
The methodology used is a Newton-Raphson power flow code. This code is developed in MATLAB to analyse technical indices such as voltage deviation from nominal values and load flow through conductors. The power flow analysis is performed on the network under hourly loading scenarios for the 24 hours of a week day. This makes it possible to evaluate the technical impacts caused by various proliferation levels of rooftop PV panels with and without battery energy storage systems. The project’s IRG members provided the network configuration and closely estimated consumption data and related information. Due to the unavailability of specific data, variations in loading between week days and weekends and over the seasons of a year were not assessed.
3.6.1 Network and load modelling and power flow analysis Midland, WA
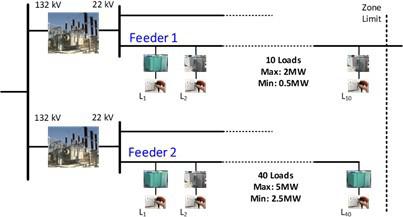
The network configuration
The area of this study is mainly fed via two 22 kV feeders (Figure 25). A primary substation from 132 kV to 22 kV is at the border of the zone. Two 132 kV/22 kV transformers are connected to four 22 kV feeders, two of which span the zone. Feeder 1 is partially inside the area supplying a maximum of 2 MW via ten customer transformers. Feeder 2 delivers power to consumers through 40 transformers with a maximum of about 5 MW loading.
64
Pathways for Urban Renewable Energy Zones
Figure 25. Single line diagram of the network understudy
Ratings of the transformers
As shown in Table 18 the 132 kV/22 kV transformers have a power rating of 30 MVA with a per-unit impedance of 0.2. These two transformers transfer power from the 132 kV sub-transmission level to the 22 kV distribution network. The load 22 kV/440 V transformers are of two different power ratings of 1000 kVA and 500 kVA with per-unit impedances of 0.06 and 0.04, respectively. It is assumed that these transformers are evenly distributed on the feeders.

Network impedance model


The impedance modelling of the transformers and powerlines are shown in Figure 26 This figure also shows the numbering of the buses starting at 1 for the 132 kV bus. The estimated loads will be evenly applied on the LV side of the transformers (e.g. Buses 13 to 22 on Feeder 1 and Buses 64 to 103 on Feeder 2).
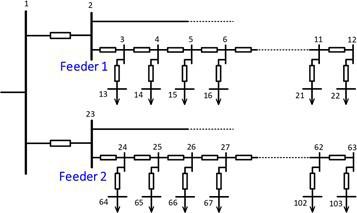
Load modelling
This study will consider a 24-hour loading period to examine the technical impacts of rooftop PV panel installation at various proliferation levels. Figure 27 shows the aggregated load profile of Feeder 1 with a peak value of 2 MW at 3 pm and a minimum of about 1 MW at 4 am Likewise Figure 28 illustrates the load profile of Feeder 2 for 24 hours. This profile has a peak value of 5 MW and a minimum of about 2.4 MW at 3 pm and 3 am, respectively.
Pathways for Urban Renewable Energy Zones 65
Size 1000 kVA Transformer 500 kVA Transformer 30 MVA Transformer HV-side/LV-side Voltages 22 kV/440 V 22 kV/440 V 132 kV/22 kV Vector group Dyn1 Dyn1 Impedance 6% 4% 20%
Table 18. Rating of the transformers
Figure 26. Bus numbering of the network
Estimation of DER potential
Estimation of rooftop area
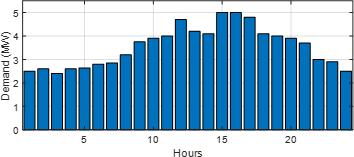
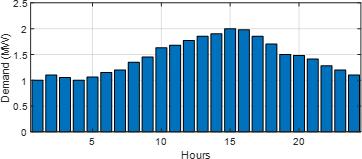
The estimated rooftop area available in the zone is about 199000 m2 This figure assumes a flat rooftop for all buildings. The existing installed PV panels are limited to less than 5% of the reported area on a few large-scale buildings. Generally, the power output of PV panels Pdc can be derived as
where S is irradiance [W/m2], A is area [m2], kA is area factor, ηpv is PV panel efficiency, and ηdrt is the derating factor.
Table 19 shows the parameter values used in this study to derive the maximum power output of the panels. Applying these figures yields a total power output of 31.8 MW. In the following sections the potential impacts of the partial realisation of this power will be investigated under different loading and storage scenarios.
Pathways for Urban Renewable Energy Zones 66
Figure 27. Load profile of Feeder 1
Figure 28 Load profile of Feeder 2
������������������������������������������������ =���������������������������������������������������������������� ������������������������������������������������ ����������������������������������������������������������������
Table 19. PV power generation
Parameter Value S 1000 W/m2 A 199000 m2 kA 100% ηpv 20% ηdrt 80%
Figure 29 demonstrates the generation profile considered for the rooftop PV panels. The generation starts at 8 am with a value of 20% and reaches peak value at 1 pm 23. This peak value will be the total Pdc calculated above multiplied by a coefficient corresponding to different penetration levels. Figure 30 also shows the aggregated load and PV panels connected to the low voltage side of the 22kV/440 V transformers when there is no energy storage system.
Voltage deviation without battery energy storage system (BESS)
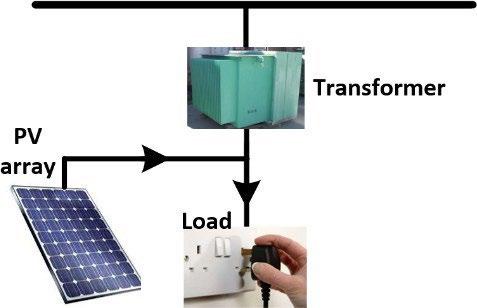
In this section, voltage deviation from the nominal value is investigated at the high voltage side of the distribution transformers for various penetration levels of rooftop PV panels. The voltage deviation is calculated as follows:
where Vn and V are the nominal value and the actual magnitude of voltage, respectively. As per the power quality standard of Western Power 24 , V% should be limited to ±6% for the low voltage side of the distribution transformers. Note that a positive value of V% indicates a voltage drop below the nominal value whereas a negative value of V% stands for a corresponding voltage rise above the nominal value. A load-flow analysis should be conducted in order to derive the power flow through the lines and voltage magnitude at the buses. The outcome will be plotted for the high-voltage side of the distribution transformers in both Feeder 1 and Feeder 2, with 10 and 40 buses, respectively (Figure 26).
No PV installation
Initially, it would be beneficial to evaluate the voltage deviation for the existing network. As explained earlier the current PV installation level is negligible. Figure 31 shows the V% of the HV-side of the distribution
23 https://research.csiro.au/solar/not-too-hot-not-too-cold-whats-just-right-for-solar-pv/
24 “Technical Rules”, Western Power, https://www.erawa.com.au/cproot/14411/2/edm%2040518689%20-%20technical%20rules%201st%20august%202016%20publish%20vers ion%20-%20fri.pdf
Pathways for Urban Renewable Energy Zones
67
1 0.8 0.6 0.4 0.2 0 5 10 15 20 Hours
Figure 29. Generation profile of roof top PV panels
Figure 30. Load and PV panels connected to the secondary side of transformers
����������������% = ������������������������ �������� ���������������� × 100 ��������������������������������
PV generation(pu)
transformers on both Feeders 1 and 2 for 24 hours. The highest V% takes place at around t = 3 pm on both feeders, consistent with the load profiles shown in Figure 27 and Figure 28 The deviation continues to rise to the end of the feeders due to their radial configuration The V% is below 6% for both feeders.
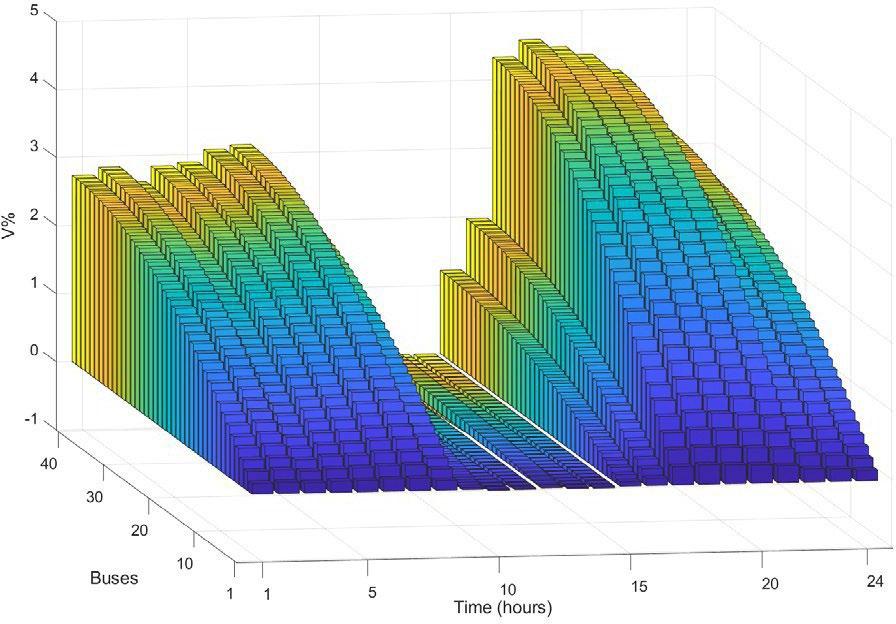
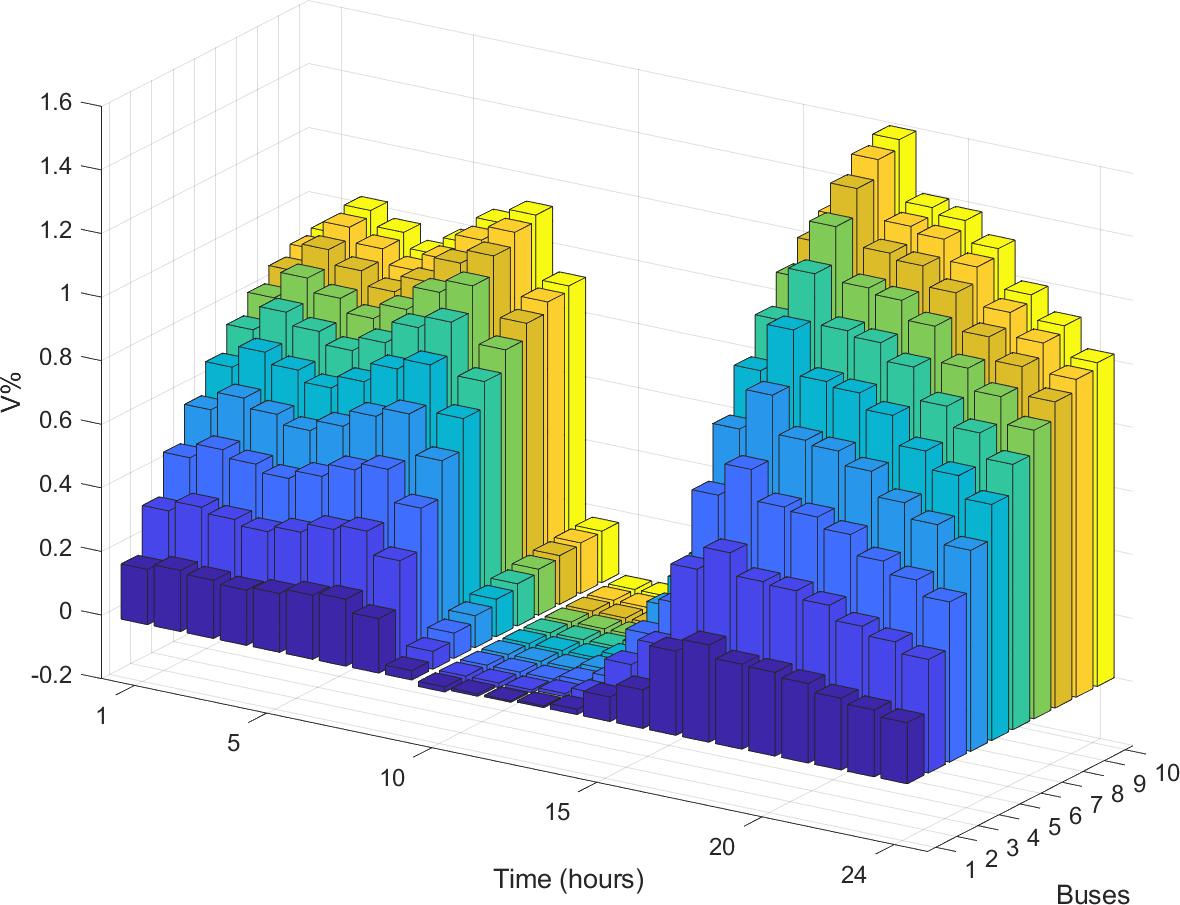
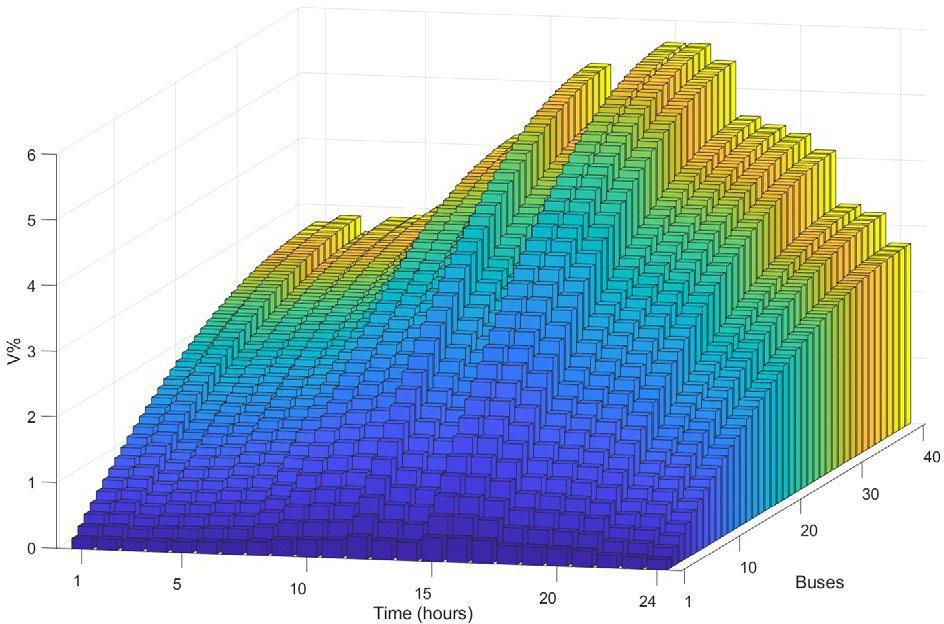
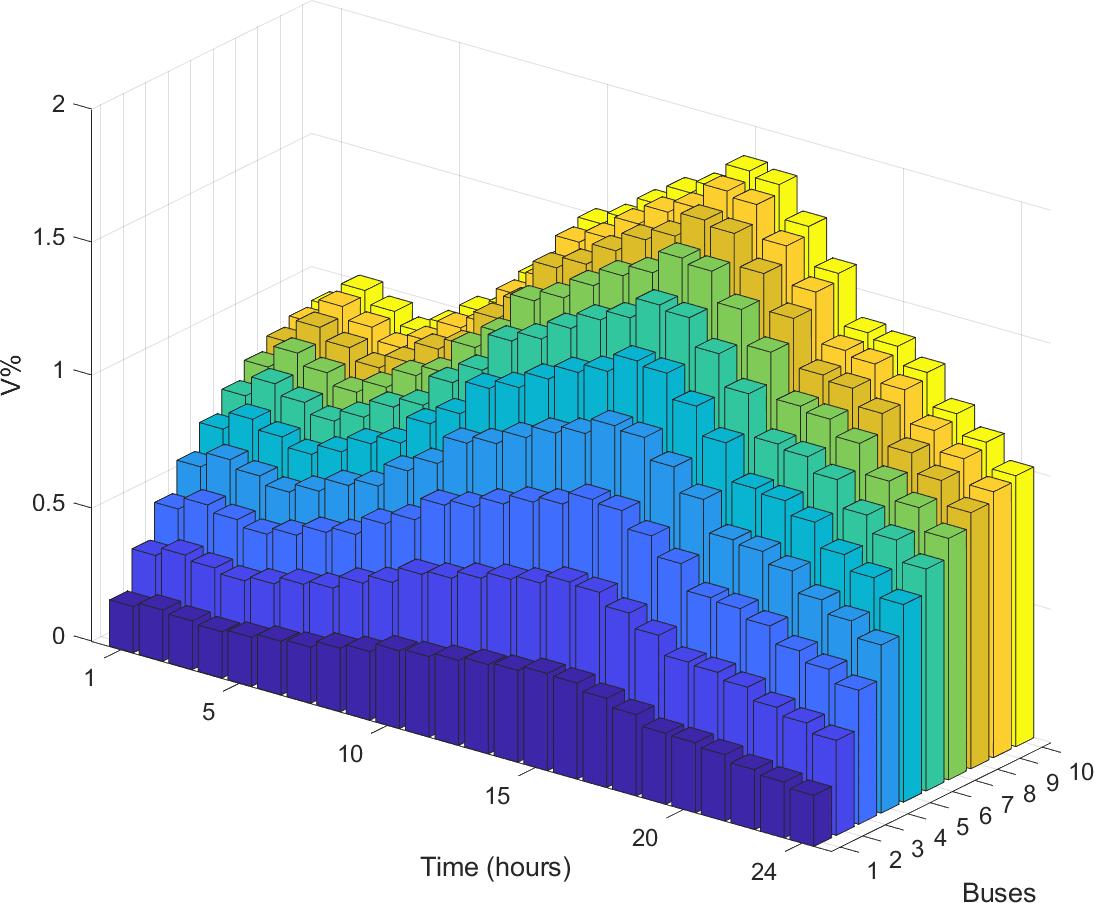
installation
Assuming a 20% realisation of Pdc mentioned above a significant improvement of V% can be seen in Figure32 taking V% sufficiently close to zero. This simply means that with only 20% installation of the PV panels the renewable generation can efficiently meet local demand with no need for an energy storage device.
PV installation
As seen in Figure 33, V% is negative for almost all the daytime as plenty of power is generated by the panels. This fully meets the local demand and injects surplus power to the network While V% for realisations below 50% was within acceptable limits, the voltage deviation at some Feeder 2 buses rises slightly above the standard tolerance. Using energy storage systems is one of the practical methods to address this concern and will be examined shortly.
Pathways for Urban Renewable Energy Zones 68
(a) (b)
Figure 31. V% at HV-side of the transformers with no PV installation on (a) Feeder 1 and (b) Feeder 2 20% PV
(a) (b)
Figure 32. V% at HV-side of the transformers with 20% PV installation on (a) Feeder 1 and (b) Feeder 2 50%
70% and 90% PV installation
The voltage deviation for installation levels of 70% and 90% is shown in Figure 35. These results clearly indicate the need for energy storage units Negative voltage deviations above 6% indicate a significant overvoltage at most buses Proper installation of BESS can avoid undesirable voltage rises and meet the demand in the evening with net zero power generation.
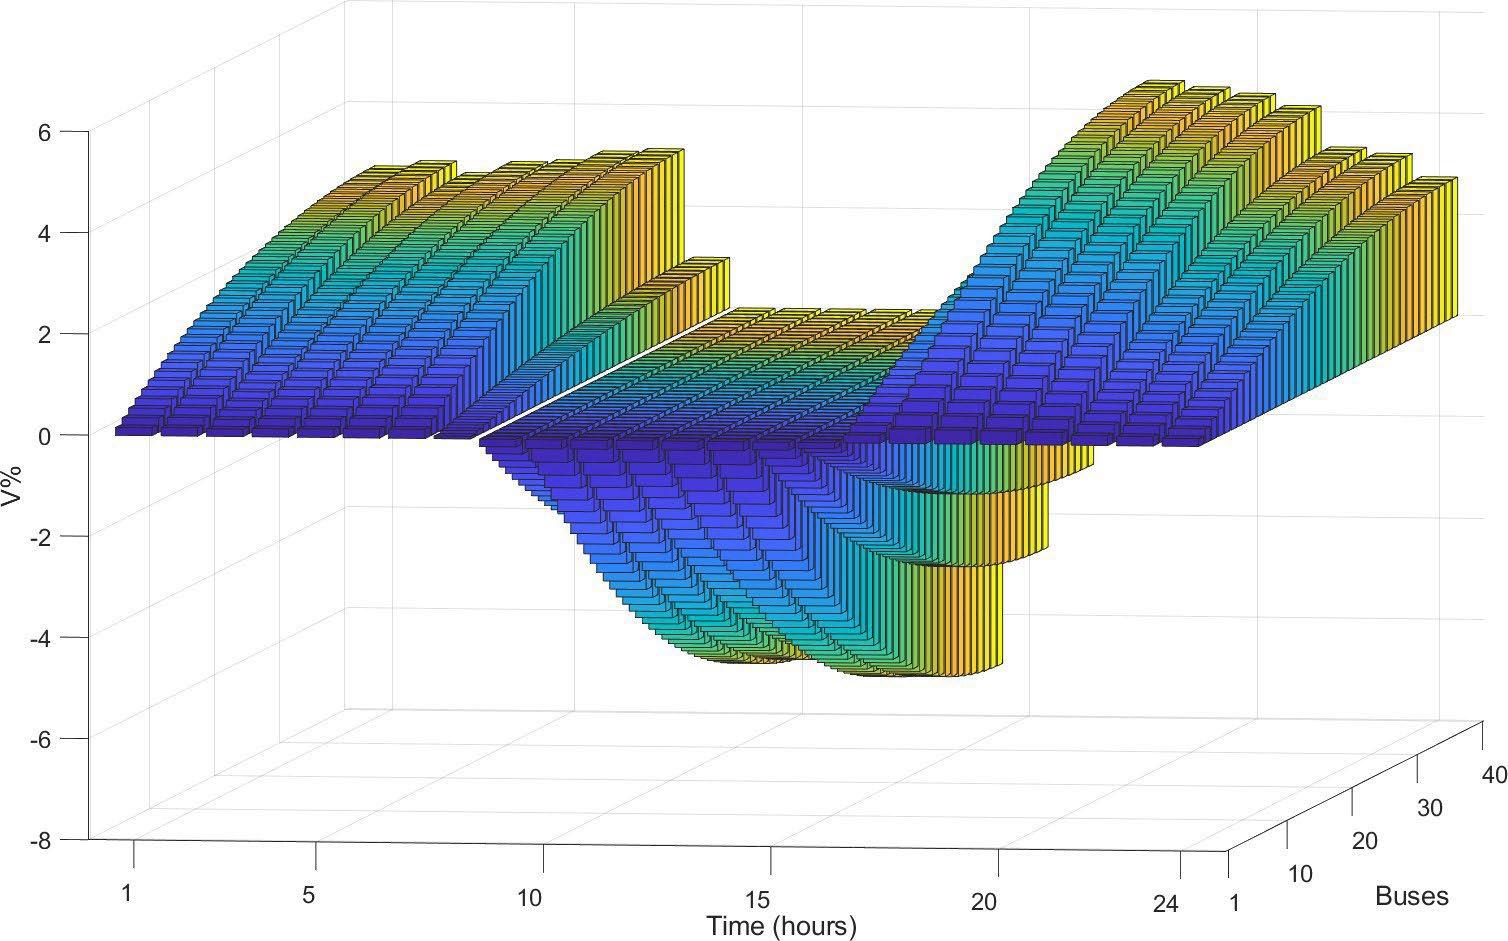


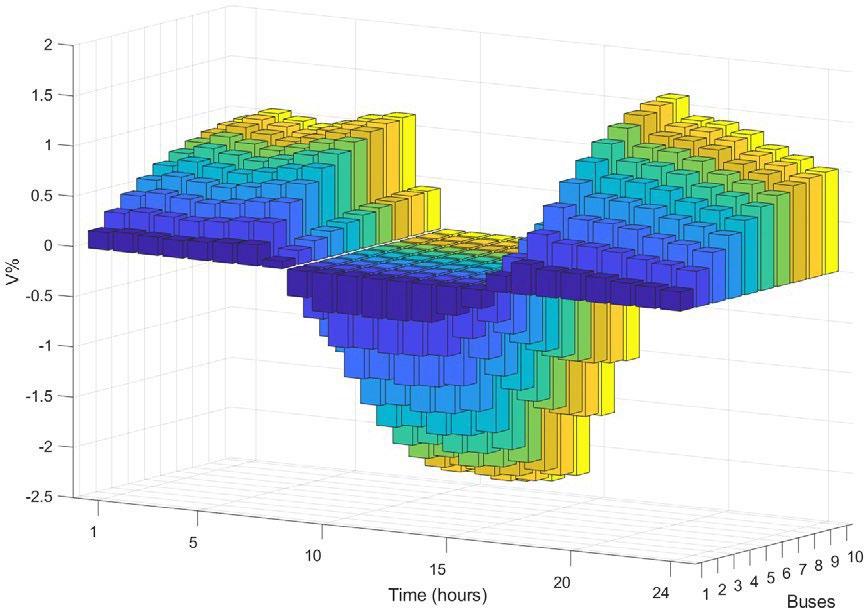
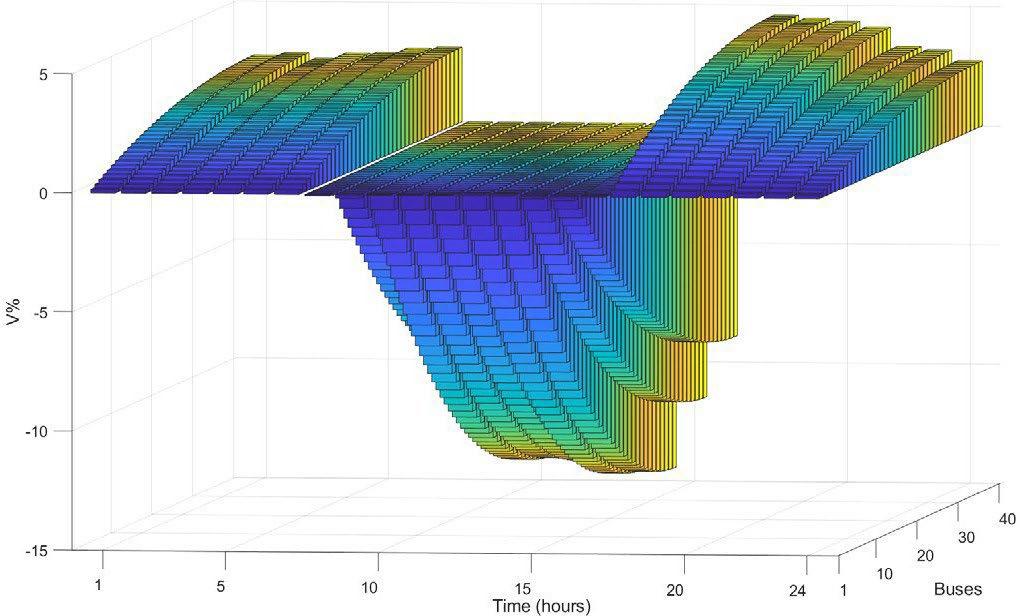
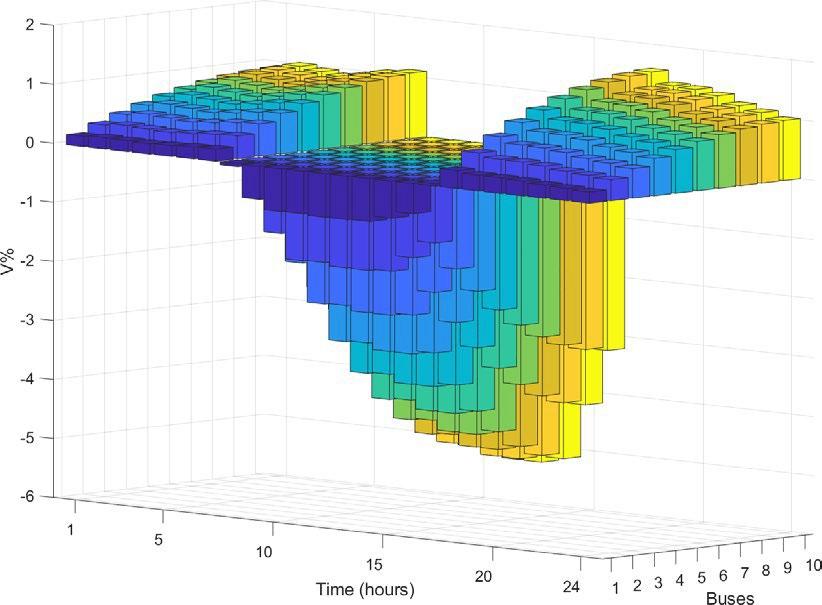
Pathways for Urban Renewable Energy Zones 69
(b)
(a)
Figure 33 V% at HV-side of the transformers with 50% PV installation on (a) Feeder 1 and (b) Feeder 2
(a) (b) (c) (d)
Figure 34. V% at HV-side of the transformers with 70% PV installation on (a) Feeder 1 and (b) Feeder 2 and 90% PV installation on (c) Feeder 1 and (bFeeder 2
Voltage deviation with BESS
Installing BESS can deal with most of the negative impacts of intermittent renewable energy resources on frequency and voltage fluctuations This section demonstrates how BESS can facilitate achieving net zero goals without violating voltage magnitude standards. The power generated by PV panels will be efficiently managed using a BESS connected to the LV-side of the distribution transformers (Figure 35). The BESS will be charged during the daytime to limit the PVcaused voltage rise at either side of the transformers to 6%.
The BESS will then discharge the stored energy to both the distribution transformers local load and grid in the evening when there is no PV generation. Likewise a proper discharging power rating is chosen to avoid any voltage rise above 6%. Table 20 shows the BESS charging and discharging to grid powers selected for both feeders to meet the voltage requirements. The powers are chosen to ensure full integration of the generated renewable energy without any power curtailment or voltage standard violations. Also, the power flow through the transformers and conductors would be well below the ratings. As already explained, there is no need for any BESS for the PV penetration levels below 50%.
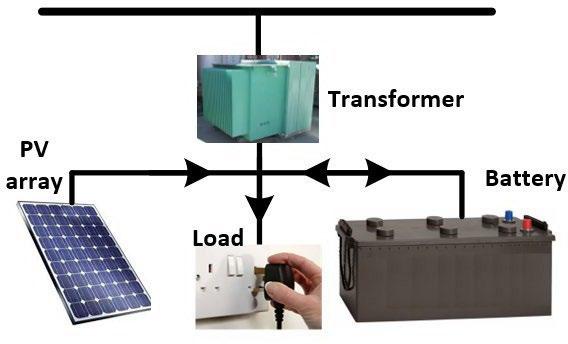
Above 50% PV panel installation on Feeder 1 with BESS
Figure 36 shows the voltage deviation of Feeder 1 buses for PV installation of 50%, 70%, 80% and 90% The 50% installation level does not require BESS as the power injected into the grid is below 350 kW. For the 70%, 80% and 90% penetration levels the feeder needs a total BESS capacity of 4.7 MWh, 9.95 MWh and 16.04 MWh, respectively (Table 20) Consequently V% is negative and limited to about 3% for most of the time including the evening hours. The main impact is limiting the load flow through Feeder 1 and respective transformers to less than their ratings.
Above 50% PV panel installation on Feeder 2 with BESS
Figure 37 illustrates that the voltage deviation values continue to flip from positive to negative as a result of increasing the PV installation level from 50% to 90%. This realises further net zero power generation goals. It is evident from this figure that the voltage magnitude violation due to the high penetration level of PV panels on Feeder 2 is efficiently handled using BESS as V% is limited to 6% during the daytime. The total BESS required to successfully run this scenario is shown in Table 20.
Pathways for Urban Renewable Energy Zones 70
Figure 35 PV/BESS/load connection to the LV-side of
Feeder 1 Feeder 2 Charging Power Discharging Power Charging Power Discharging Power 300 kW 350 kW 220 kW 150 kW
Table 20. BESS charging and discharging power
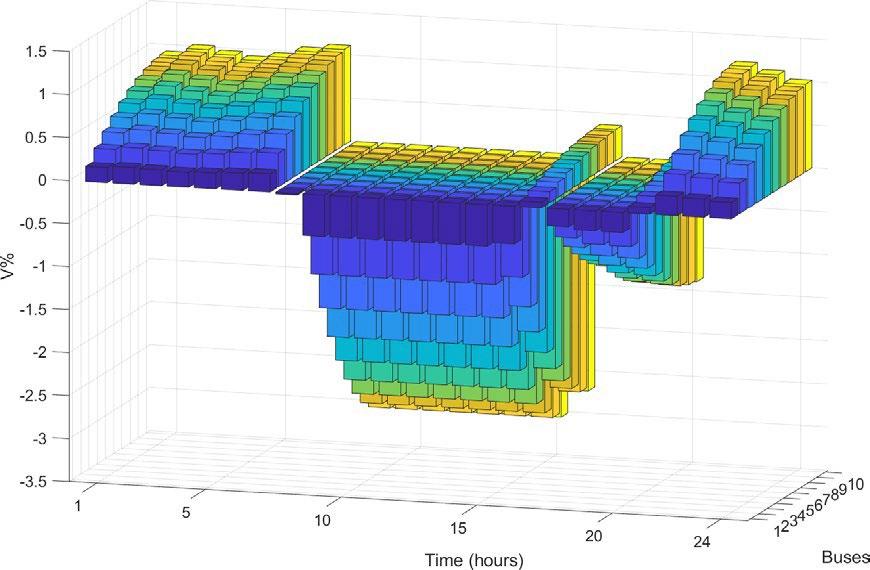
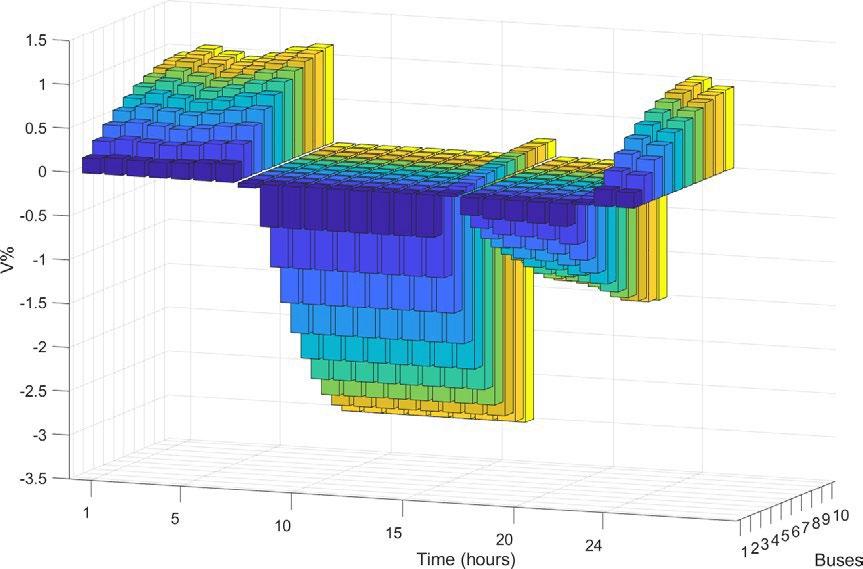


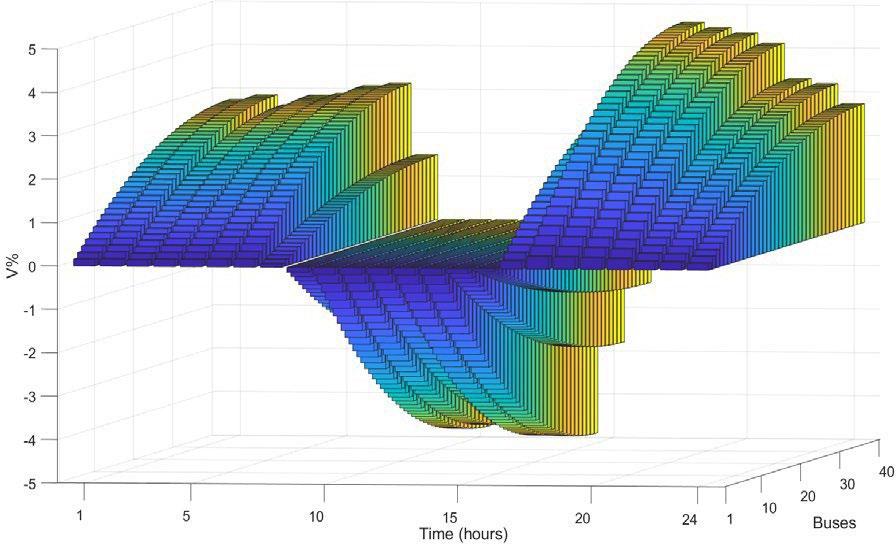
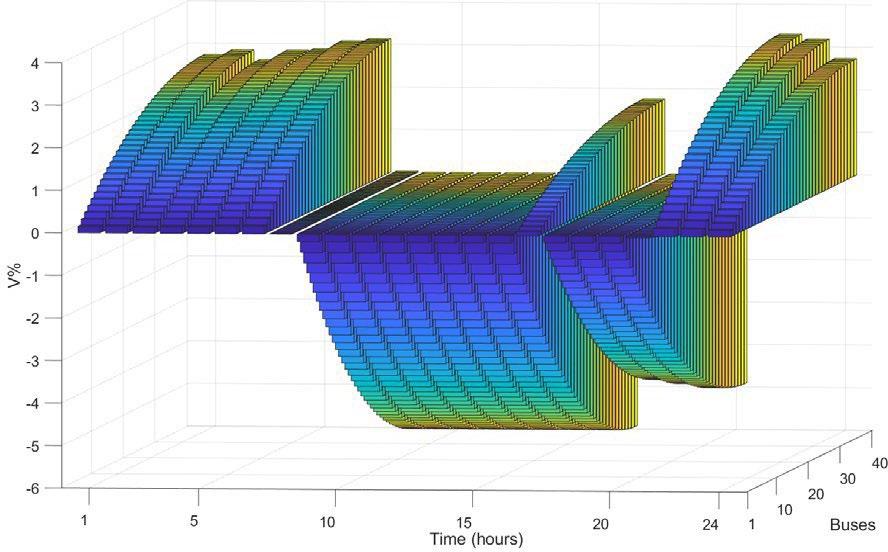
Pathways for Urban Renewable Energy Zones 71
(a) (b)
(c) (d)
Figure 36 V% at HV-side of Feeder 1 transformers with BESS and PV installation of (a) 50%, (b) 70%, (c) 80% and (d) 90%
(a) (b)
Power flow analysis
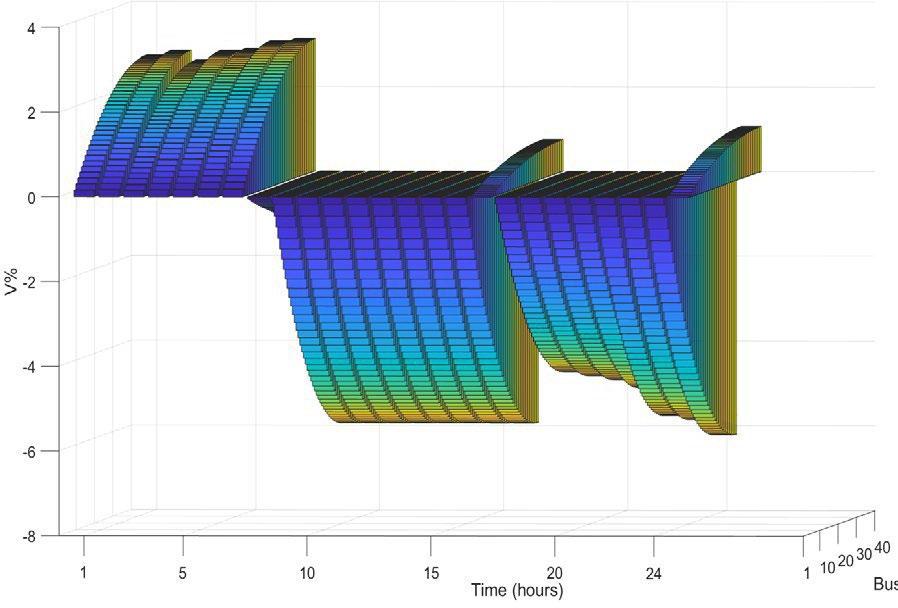
Power flow through the conductors
One of the most critical factors in operating a power network is that the power flow through conductors and transformers remains well below their power ratings.
Figure 38 shows the power flow through Branch 2-3 of Feeder 1—with and without BESS at 1 pm and 3 pm. Comparing the results at 1 pm the BESS is not required for the PV panel installations below 60% However, this figure shows how employing BESS can handle undesirable power flows from the very high penetration of PV panels and facilitate a successful realisation of net zero power generation.
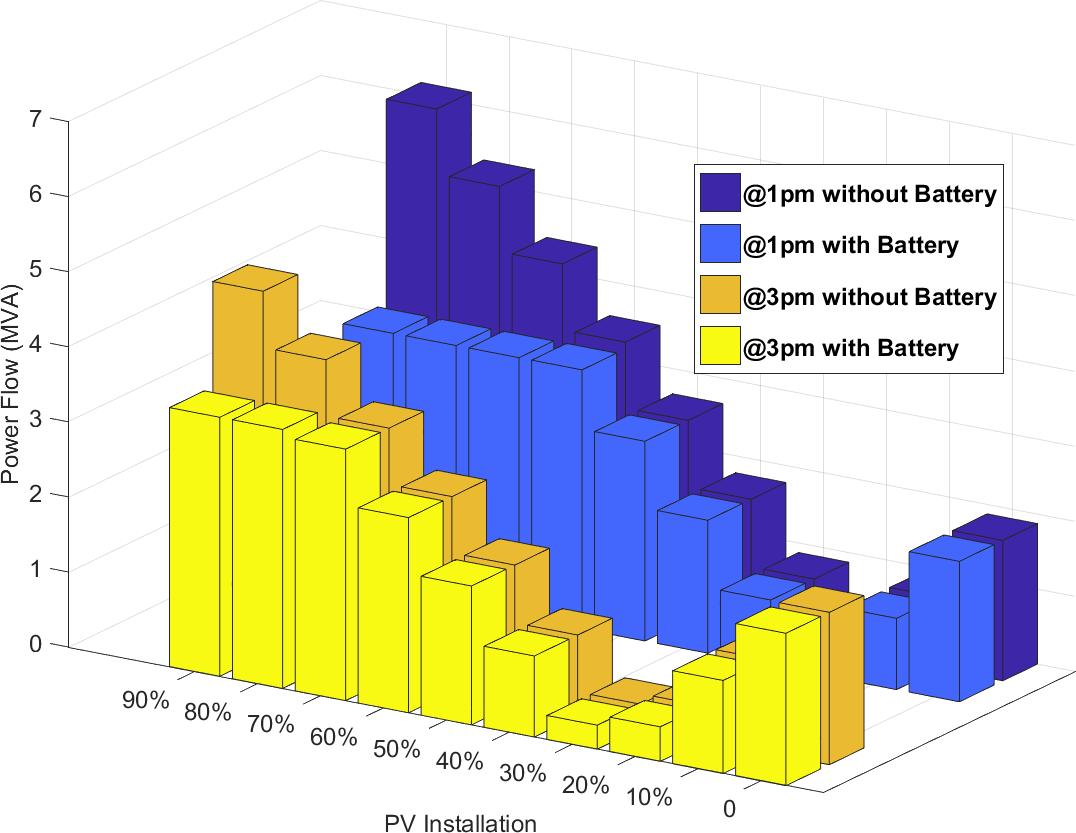
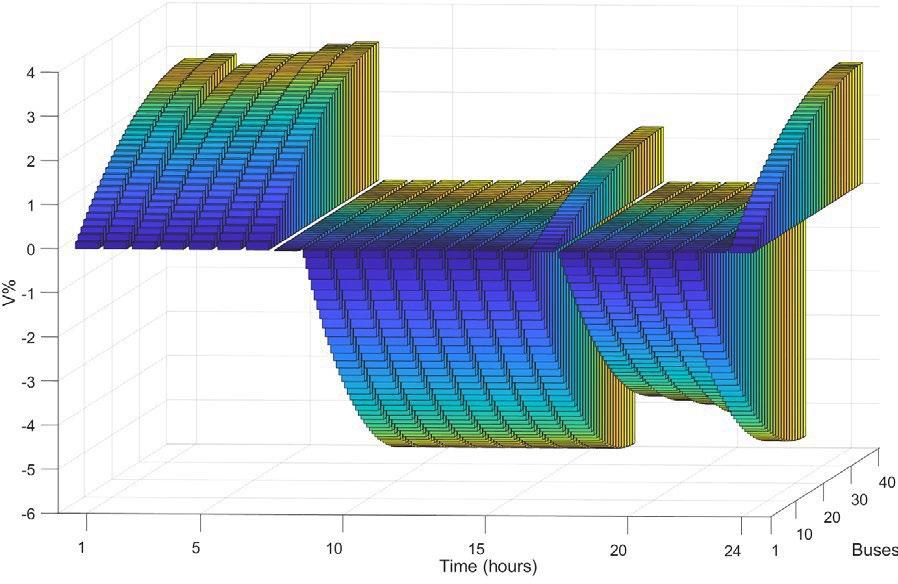
72 (c) (d)
Figure 37. V% at HV-side of Feeder 2 transformers with BESS and PV installation of (a) 50%, (b) 70%, (c) 80% and (d) 90%
PV installation Feeder 1 Feeder 2 50% 0 4.52 70% 80% 4.70 9.95 30.72 46.91 90% 16.04 63.11
Table 21. Total BESS capacity required for a daily generation [MWh]
Pathways for Urban Renewable Energy Zones
Figure 38. Power flow through Branch 2-3 of Feeder 1
Figure 39 illustrates the positive impact of BESS at limiting the power flow through Branch 23-24 of Feeder 2 at two different hours. The power flow at 1 pm, for example, can rise significantly for PV installations above 50%, overheating the conductors Comparing the power level with and without BESS for the high penetration level of PV panels demonstrates that utilising energy storage systems can efficiently keep the power flow below the respective limits.
Recommendations for future modelling
The accuracy of the developed model and analysis method can be improved by:
• getting access to more accurate information on network configuration such as the exact location of the transformers and length and impedance of conductors
• getting access to the individual load profile of distribution transformers
• evaluating the generation level and their possible technical impacts under various weather and seasonal conditions
• investigating the distribution and availability of different battery energy storage options and their technical and economic impacts
• designing more effective control and energy management procedures to integrate PV generation successfully at various levels
• implementing stochastic modelling scenarios to address uncertainties with different loads, generators, storages and network configuration
• enhancing resolution of the load and generation profiles to improve accuracy of load flow analysis
• developing efficient methods to verify validity of the presented model and the outcome of the numerical analysis.
Key insights from the modelling
There are three main insights from the modelling:
1. The study shows that no network upgrade is required to integrate rooftop PV panels with a total power limited to 50% of the estimated PV generation capacity (i.e. 50% of 31.8 MW).
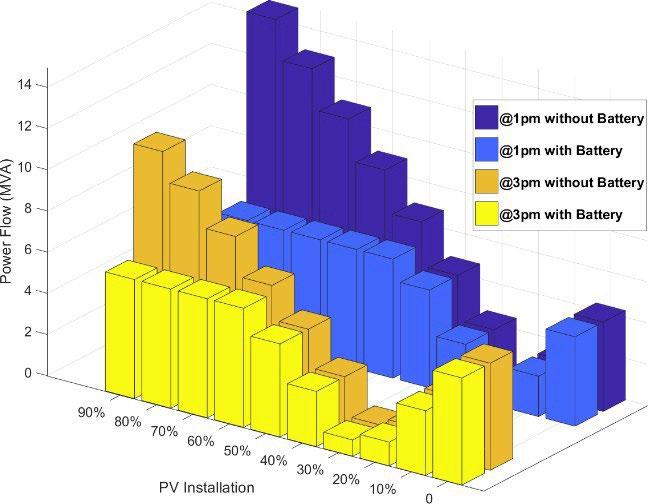
2. For PV proliferation levels above 50% the HV-side of distribution transformers would experience voltage deviations above 6%, violating technical standards of Western Power mainly at noon. Likewise, the power flow through the conductors and transformers can reach their respective ratings.
3. The integration of PV panels at higher percentages (above 50%) can be facilitated by properly installing battery energy storage systems. Alternatively, a curtailment procedure must be applied.
These insights tell us that in the near term the network can handle increased PV, however in the longer-term load-matching within the UREZ would be needed to avoid curtailment.
Pathways for Urban Renewable Energy Zones 73
Figure 39. Power flow through Branch 23-24 of Feeder 2
3.6.2 Network and load modelling and power flow analysis Warringah, NSW
The network configuration
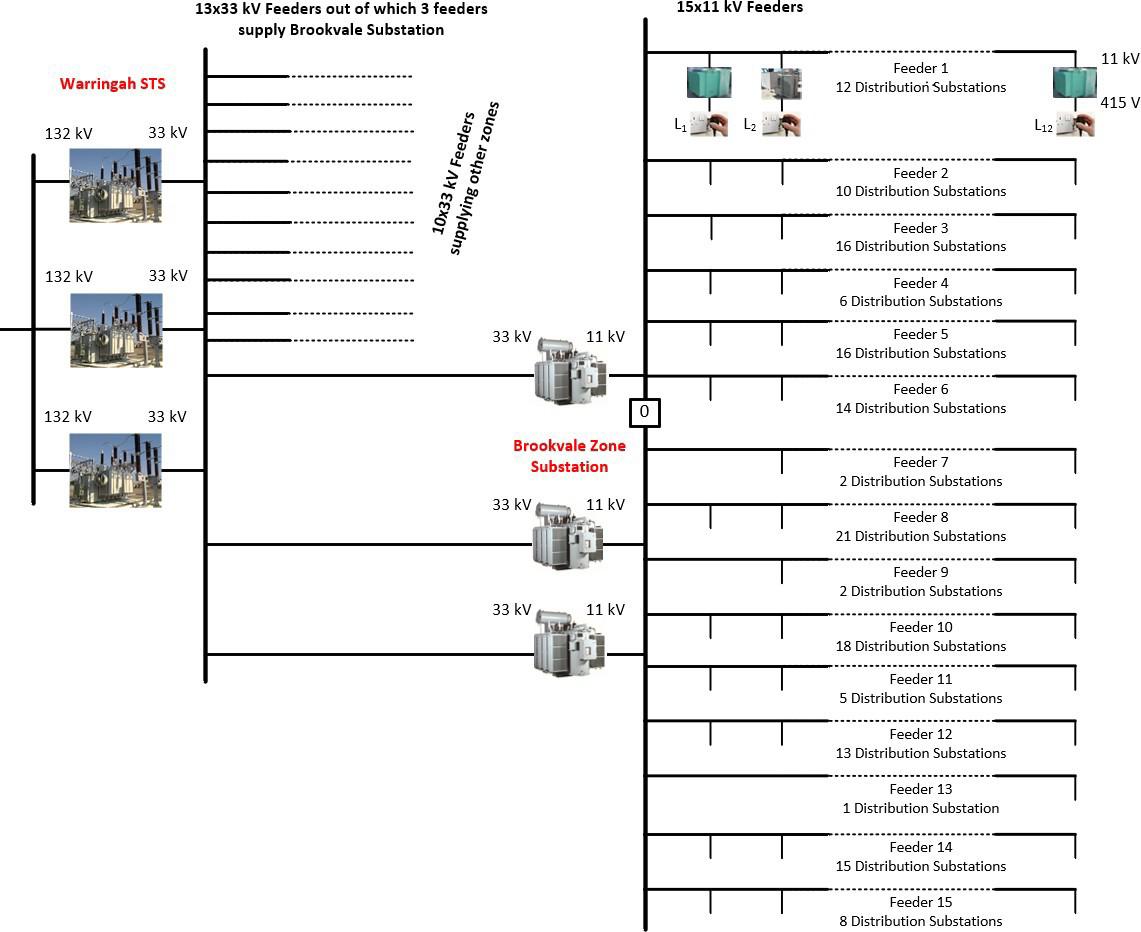
The Warringah STS consists of four 132 kV/33 kV transformers, one of which is on standby. Thirteen 33kV feeders are connected to the 33 kV bus of Warringah STS, including the three feeders supplying the Brookvale Zone Substation. Brookvale Zone Substation comprises three 33 kV/11 kV transformers (Figure 40). These transformers are directly connected to Warringah STS through three 33 kV feeders. Brookvale Zone Substation supplies 15 x 11 kV feeders. Six of these are supplied through Transformer 1 while the other nine feeders are supplied through Transformers 2 and 3. A total of 159 x 11 kV/415 V distribution transformers are supplied from the Substation. The distribution of these transformers is shown in Figure 40
Ratings of the transformers
As shown in Table 24 the 132 kV/33 kV transformers have a power rating of 120 MVA. The respective per-unit impedances are also shown. These three 33 kV/11 kV transformers have different power ratings and impedances. Two different types of 11 kV/415 V distribution transformers are considered for the distribution substations. It is assumed that these two types of transformers are evenly distributed on the feeders.
Pathways for Urban Renewable Energy Zones 74
Figure 40 Single line diagram of the Brookvale Zone Substation network
Network impedance model
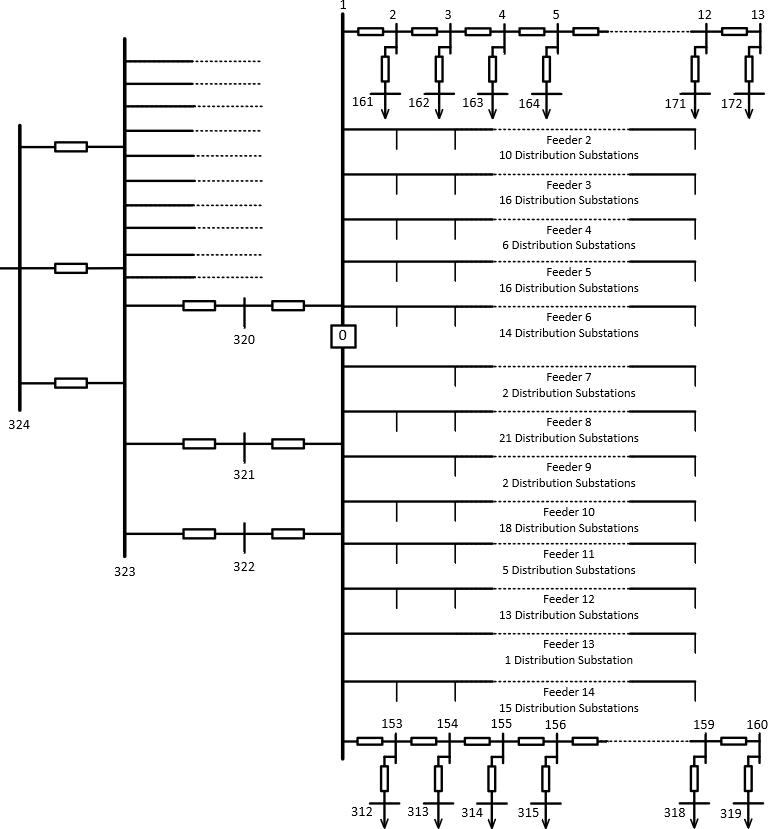


The impedance modelling of the transformers and powerlines is shown in Figure 41 This figure also shows the numbering of the buses, starting at 1 for the 11 kV bus of Brookvale Zone Substation. The numbering pattern is chosen on purpose to better classify different types of buses. The estimated loads will be evenly applied on the LV-side of the distribution transformers (i.e. buses 161 to 319). Bus numbers 320 to 324 are dedicated to the 33 kV and 132 kV buses. Note that buses 320 to 322 are imaginary as there is no 33 kV busbar at Brookvale.
Pathways for Urban Renewable Energy Zones 75
Size 1000 kVA Transformer 500 kVA Transformer 30 MVA Transformer Voltage 11 kV / 415 V 33 kV / 11 kV 132 kV / 33 kV Rating (MVA) 0.63, 0.8 25, 26, 33 120 Reactance (pu) 0.0475, 0.0487 0.6617, 0.6315, 0.606 0.1849, 0.1766, 0.18849
Table 22. Rating of the transformers
Figure 41. Bus numbering of the Brookvale network
Load modelling
Figure 42 shows the 24-hour aggregated load profile of the Brookvale Zone Substation. The load profile is assumed to include the generation from existing PV panels. This profile has a minimum of about 11 MW and a peak value of about 30 MW at 4 am and 2 pm, respectively. This profile reflects a highly commercial and industrial-type load with the highest demand during the daytime. It is assumed that the individual load profiles of the distribution transformers can be estimated by rescaling this profile based on the total number of the transformers.
Estimation of DER Potential Estimation of rooftop area
One of the IRG members conducted a study to estimate the total rooftop area available for installing PV panels. The study showed that about 520914 m2 can be made available for this purpose, potentially generating a total of about 38.7 MW power (Pdc = 38.7 MW). Examining the impact of different rooftop slopes on the power output of PV panels showed that the potential power output of PV panels is considered proportional to the effective rooftop area by a coefficient of 10%. This can be modelled by an area factor kA of about 50%. Table 23 shows the suggested values to derive the maximum power output of the panels.
The generation profile of rooftop PV panels is like the one considered for the Midland Case Study in Figure25.
Voltage deviation
One of the main objectives of this study was to investigate voltage deviation from the nominal value at the highvoltage side of the distribution transformers for different penetration levels of rooftop PV panels. As mentioned earlier, the power quality standard of Ausgrid indicates that voltage should be limited to +10% and -6% for the
Pathways for Urban Renewable Energy Zones 76
35 30 25 20 15 10 5 0 5 10 15 20 Hours
Figure 42. Load profile of Brookvale Zone Substation
Parameter Value S 1000 W/m2 A 520914 m2 kA 50% ηpv 20% ηdrt 80%
Table 23. PV power generation coefficients
Demand (MW)
low-voltage side of the distribution transformers25 . The voltage magnitude at the buses was derived by developing and running a load flow analysis on the system. The deviation at the high-voltage side of the distribution transformers of different feeders was plotted to demonstrate the network behaviour
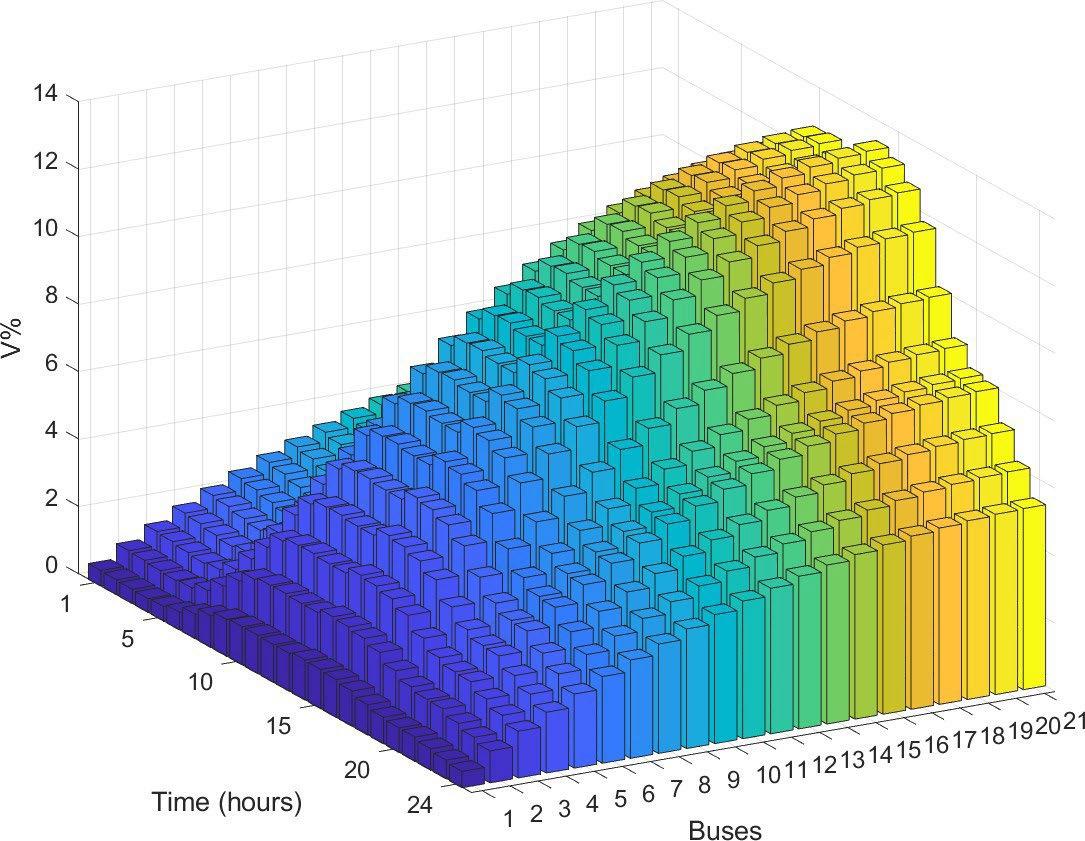
The existing network
This section evaluated the voltage deviation of the buses in the existing network. Figure 43 demonstrates the V% of the HV-side of the distribution transformers on four sample feeders for 24 hours. The bus numbers in Figure 43 and in all following figures have been reset to start with No. 1 at the Brookvale Substation and progressively increase at each distribution transformer along the feeder. This means that the highest bus number indicates the greatest distance away from the substation. The highest V% takes place at around t = 2 pm on all the feeders consistent with the load profiles shown in Figure 41 As expected, the radial configuration of the feeders has caused the deviation to continue to increase with the increasing bus numbers (i.e. the feeder length from Brookvale Substation to the distribution transformer). For some feeders the voltage drop is above 6% which occurs mainly around noon. The drop is even greater for highly-loaded feeders such as Feeder 8.
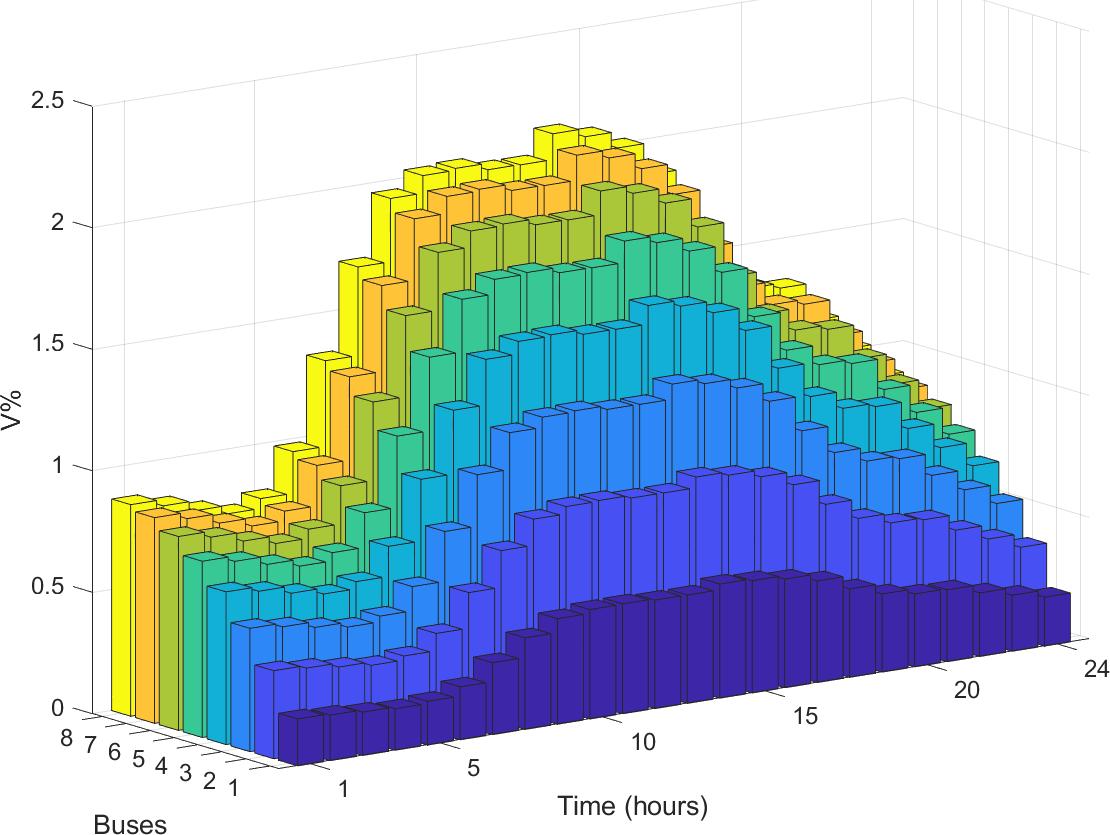
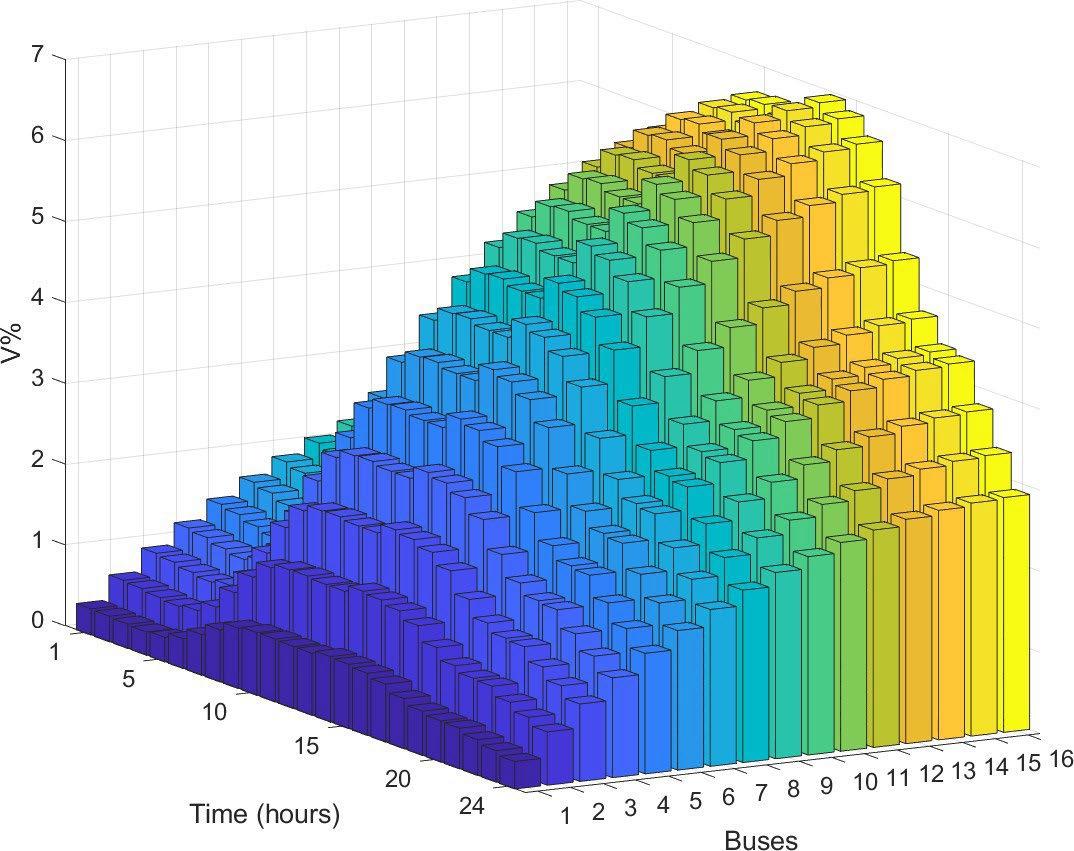
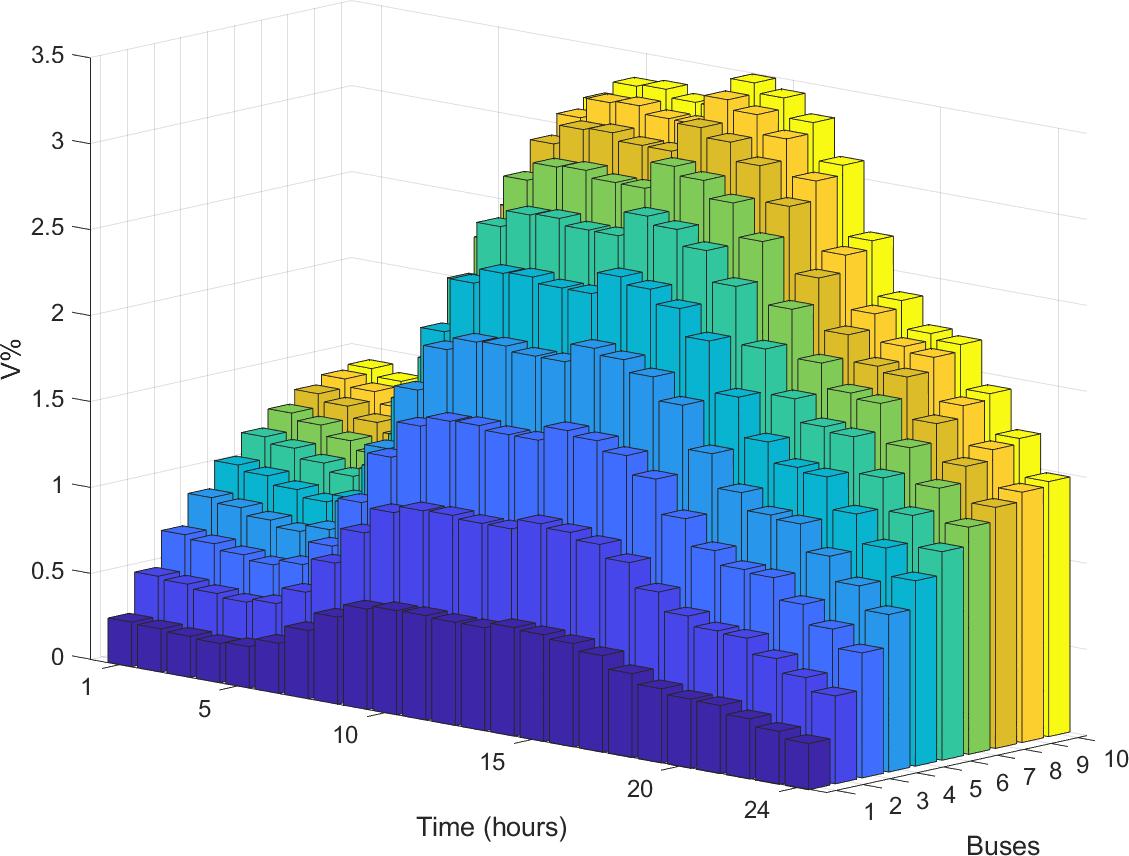
77
(a) (b) (c) (d)
Figure 43. V% at HV-side of the transformers with no PV installation on Feeders (a) 2, (b) 3, (c) 8, (d) 15
Pathways for Urban Renewable Energy Zones
25 Data driven exploration of voltage conditions in the Low Voltage network for sites with distributed solar PV”, N. Stringer, A. Bruce and I. MacGill, Asia-Pacific Solar Research Conference, 2017.
20% PV installation
Figure 44 shows the voltage deviation for the selected feeders after a 20% realisation of Pdc A minor improvement of V% occurs during the daytime, mainly around noon. For example, the maximum value of V% on Feeder 8 has decreased from about 13.2% without PV installation to about 11% at 20% PV installation. This demonstrates the significant potential of this network in the integration of PV panels.
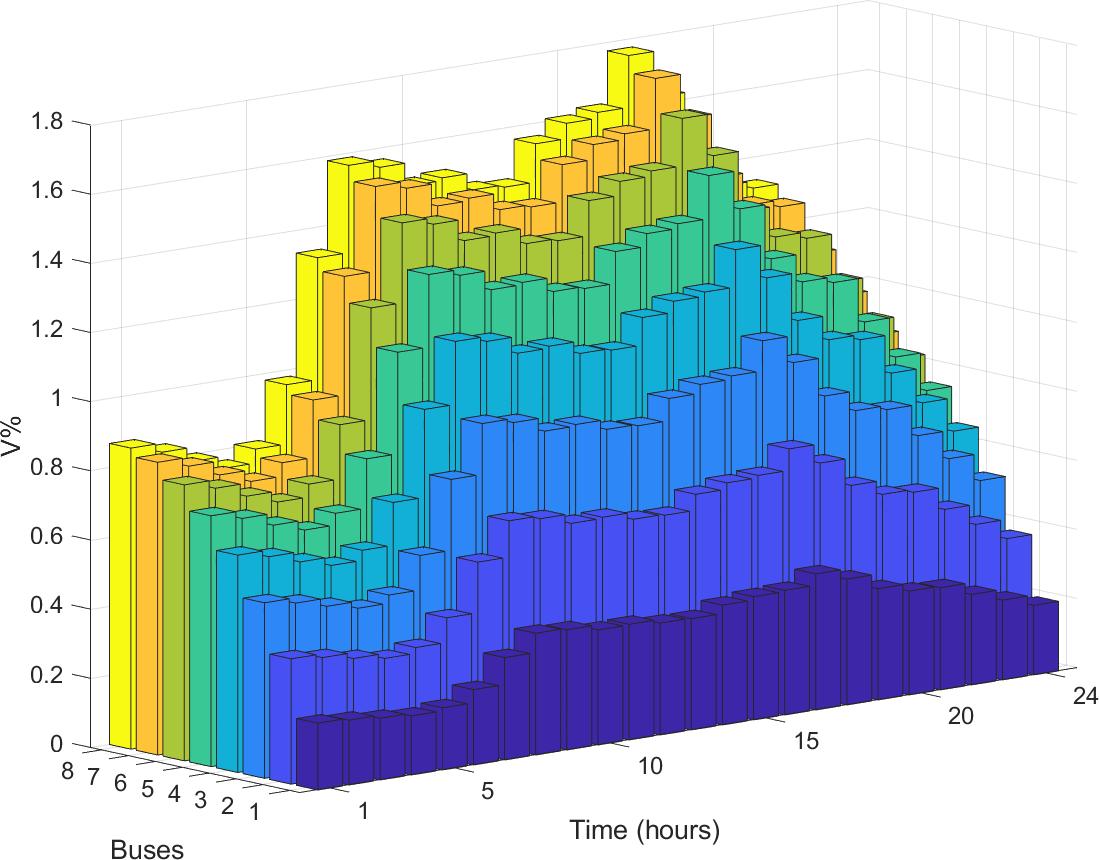
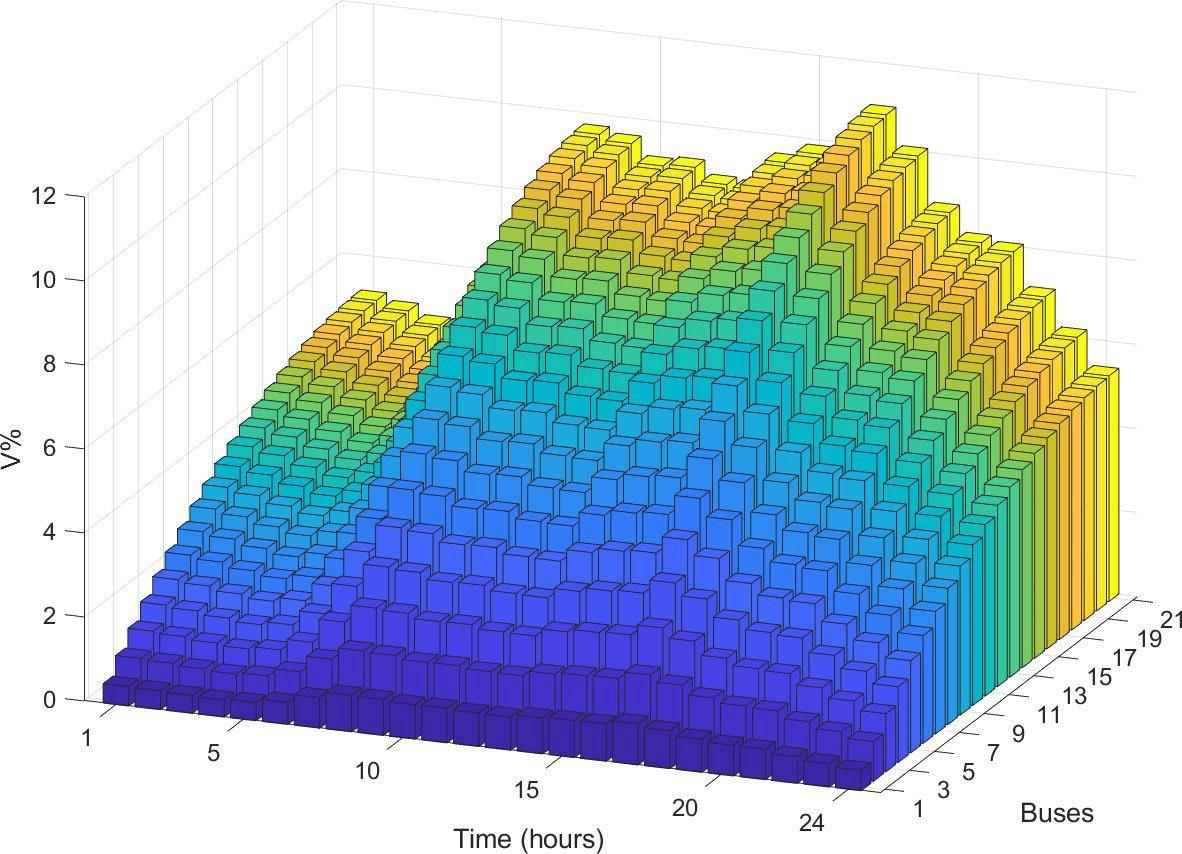
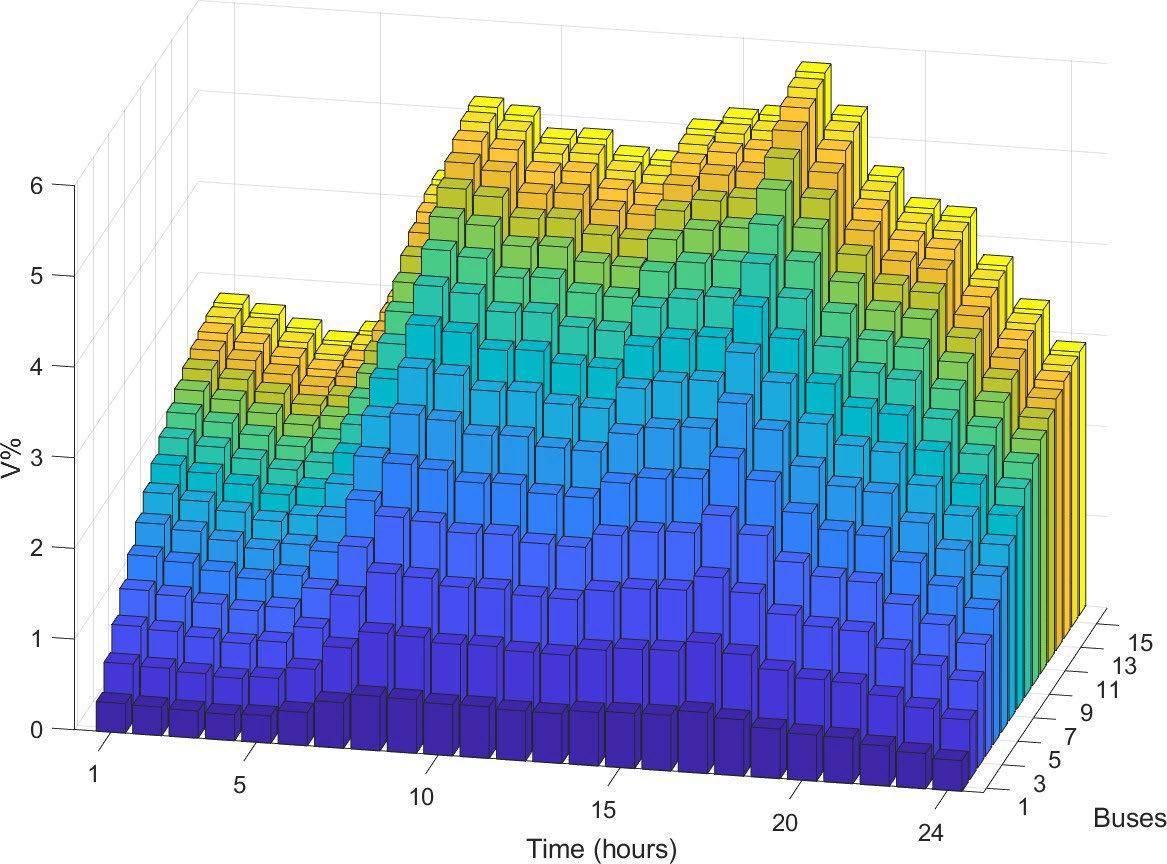
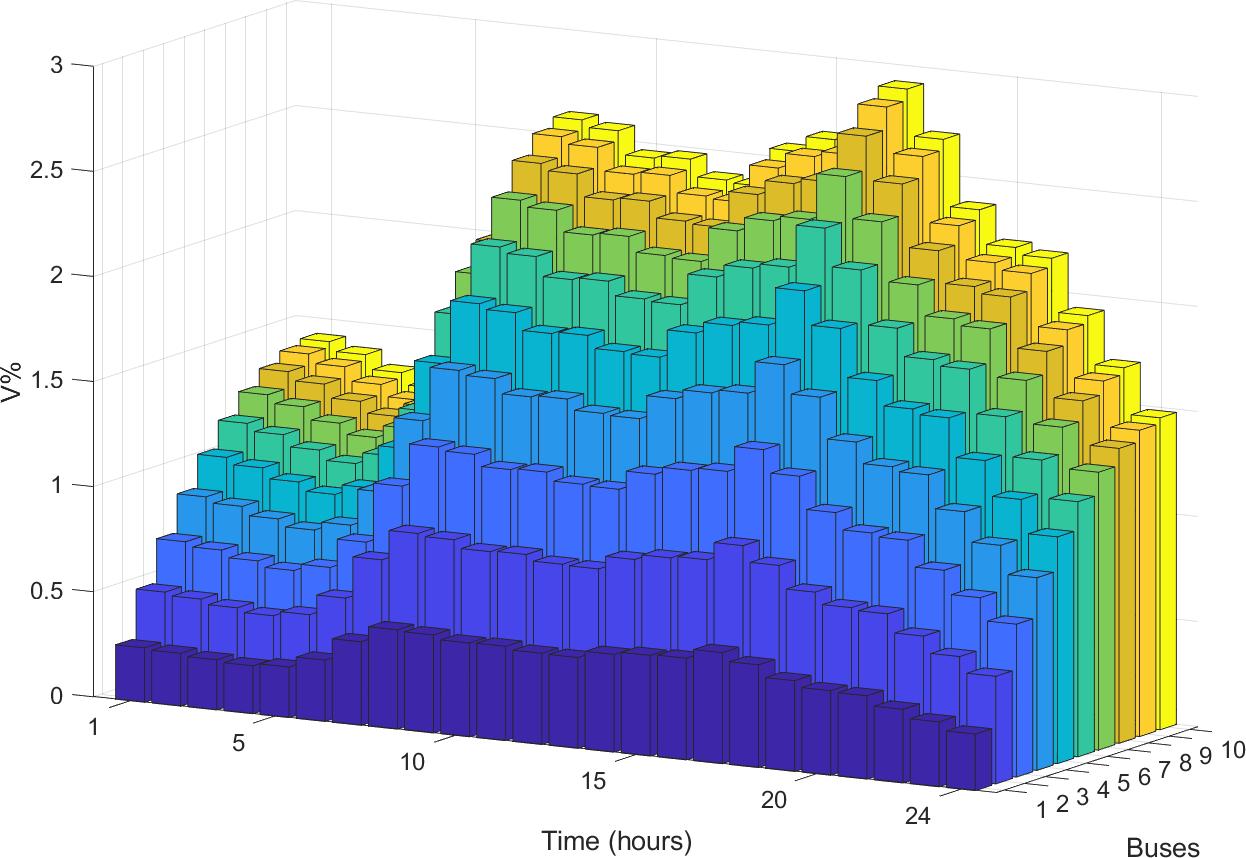
50% PV installation
As seen in Figure 45, V% on all feeders has experienced a significant decrease as a result of a 50% realisation of the potential Pdc, Such a realisation could maintain the voltage deviation below the standard limit during the daytime.
Pathways for Urban Renewable Energy Zones 78
(a)
(b)
(c)
(d)
Figure 44. V% at HV-side of the transformers with 20% PV installation on Feeders (a) 2, (b) 3, (c) 8 and (d) 15
Above 80% PV installation
The voltage deviation for PV installation levels of 80% and 100% are shown in Figure 46 and Figure 47, respectively. During most daytime hours, these significant installation levels mean that the deviation is negative or almost zero. The renewable-based generated power is partially injected to the grid or reduces the grid-side power demand to zero. In other words, net zero power generation occurs for PV installations above 80%.
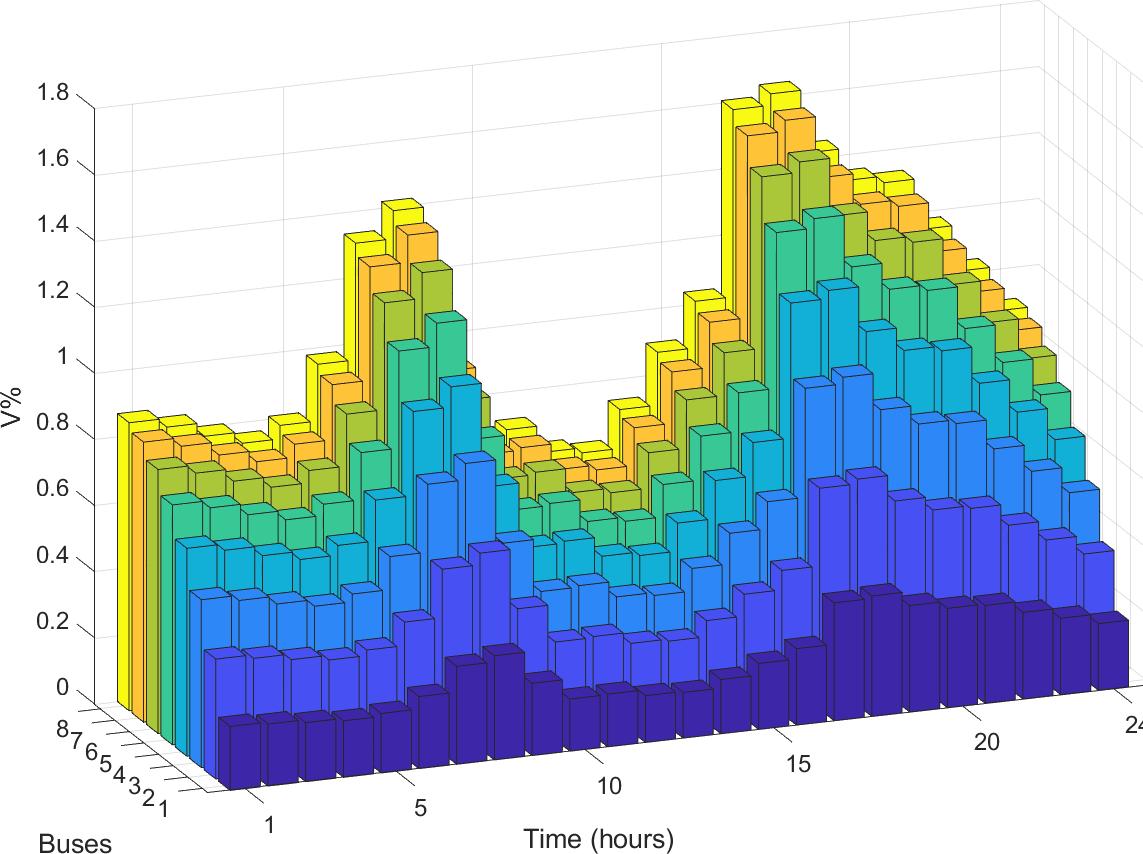
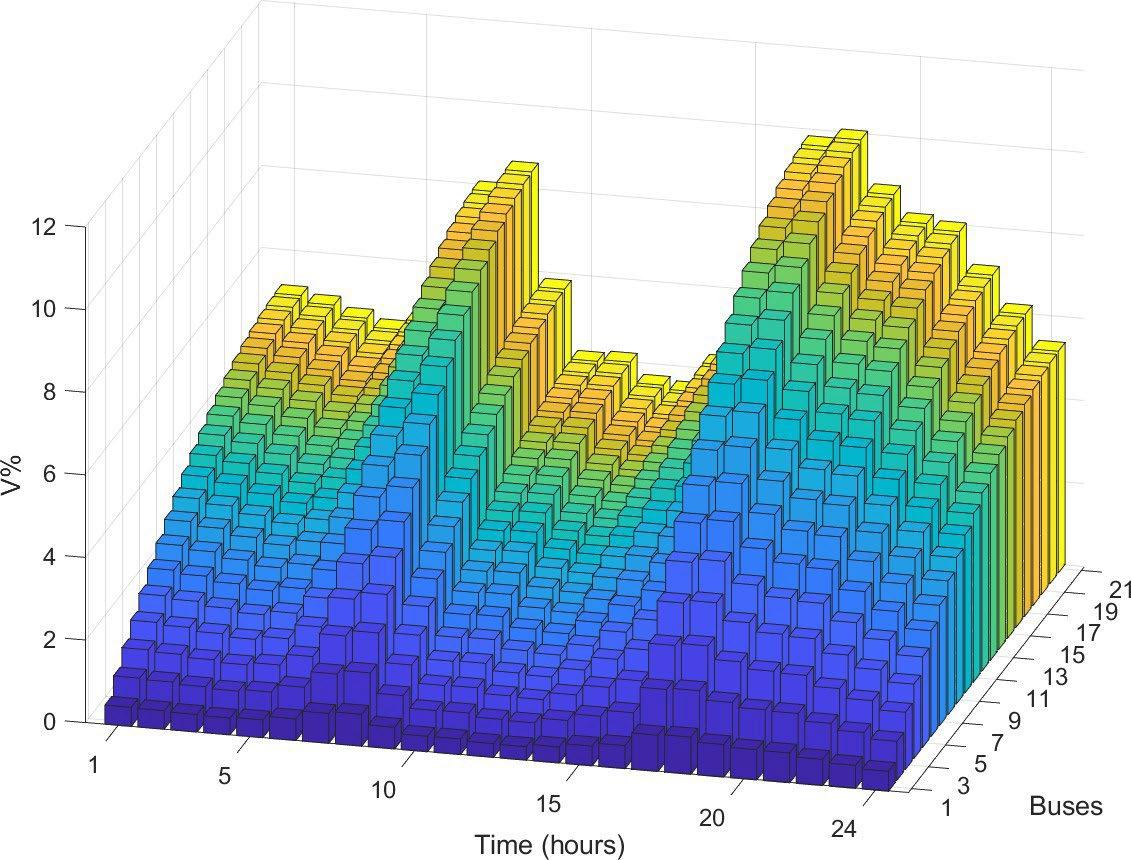
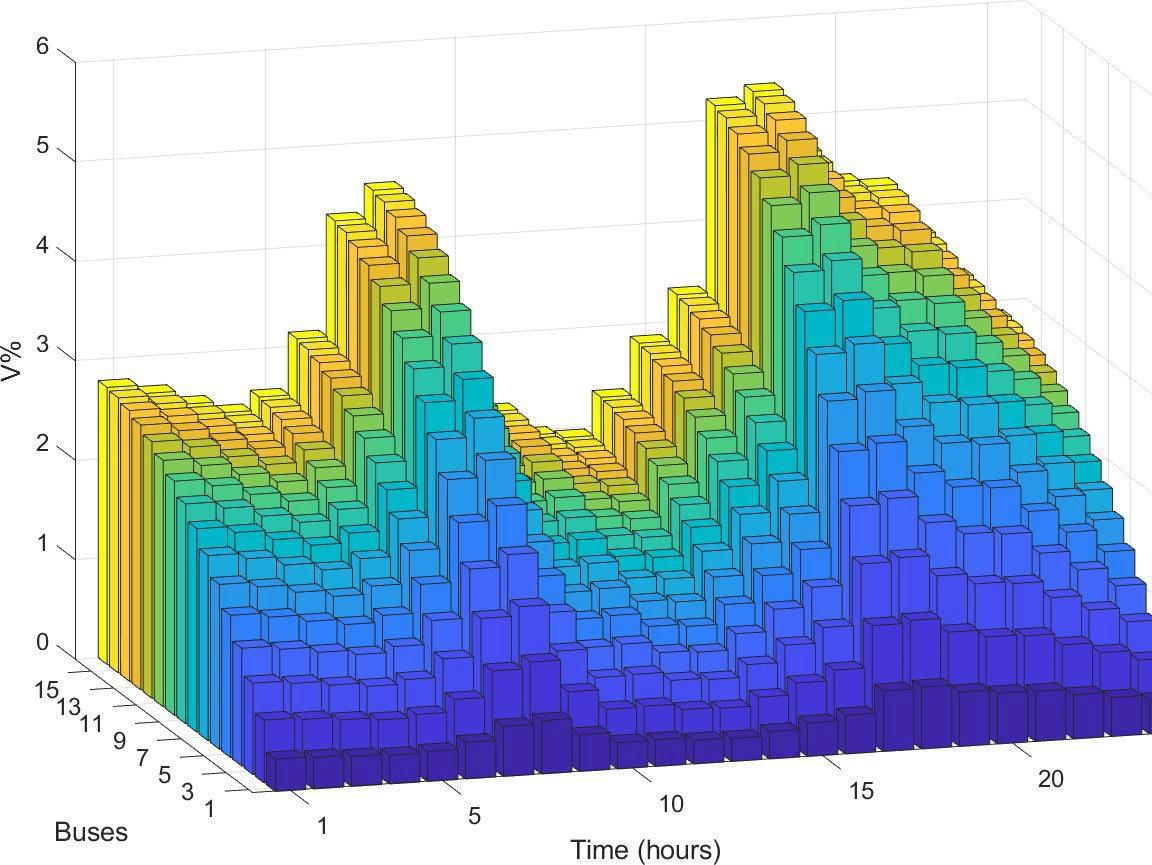
Even a 100% penetration of PV panels no violation of the voltage standard was detected since the magnitude of voltage deviations on the negative side had not crossed 10% and there was no undesirable voltage rise. This means that rooftop PV panels can be successfully installed at different penetration levels under this scenario without the need for energy storage systems.
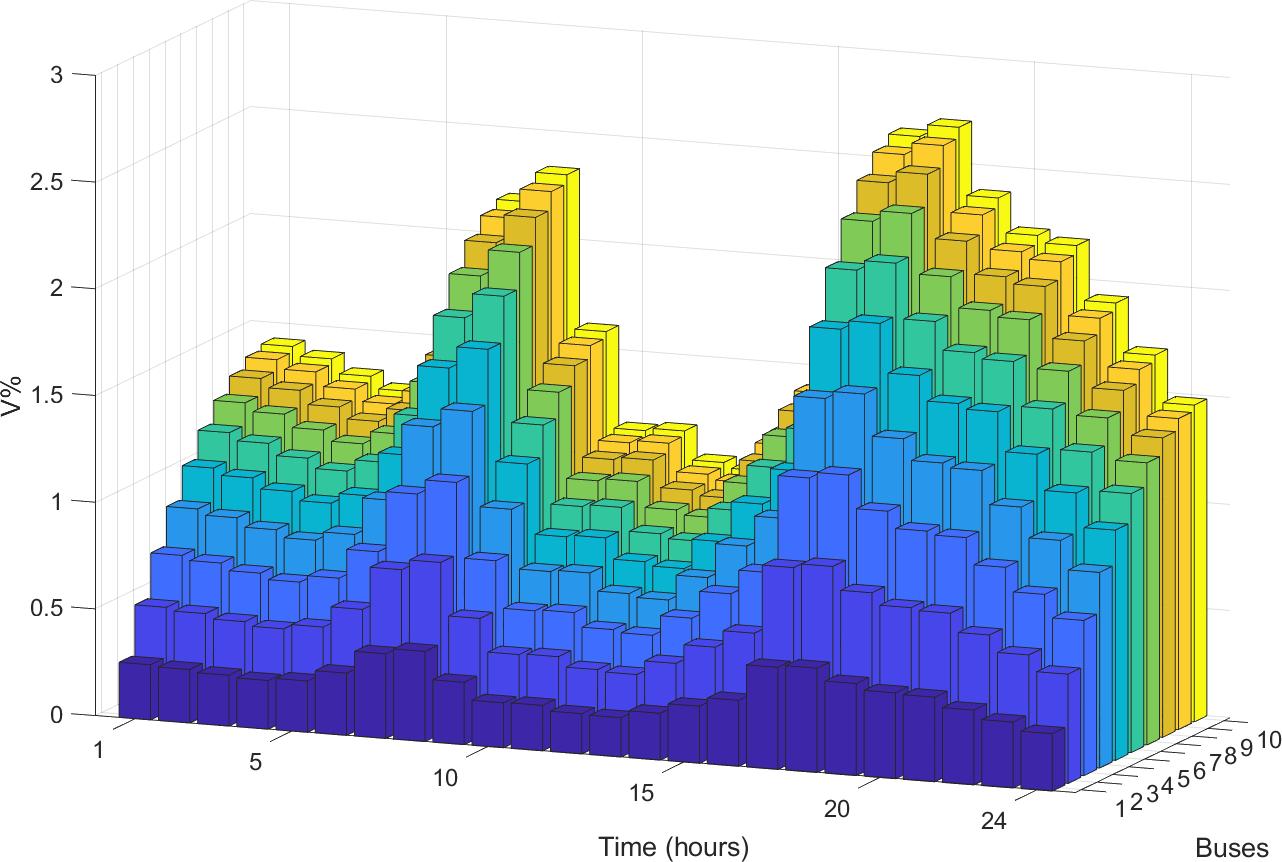
Pathways for Urban Renewable Energy Zones 79
(a)
(b)
(c)
Figure 45. V% at HV-side of the transformers with 50% PV installation on Feeders (a) 2, (b) 3, (c) 8 and (d15
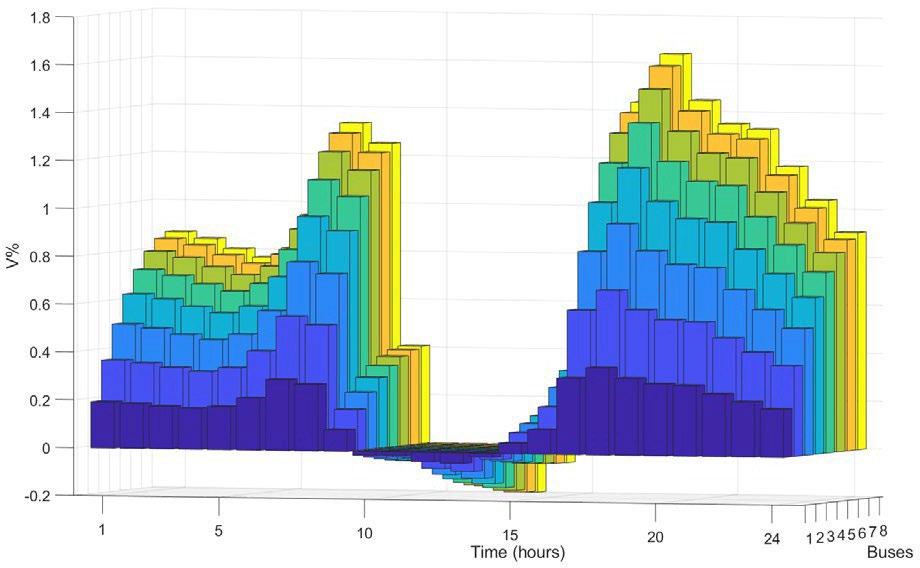
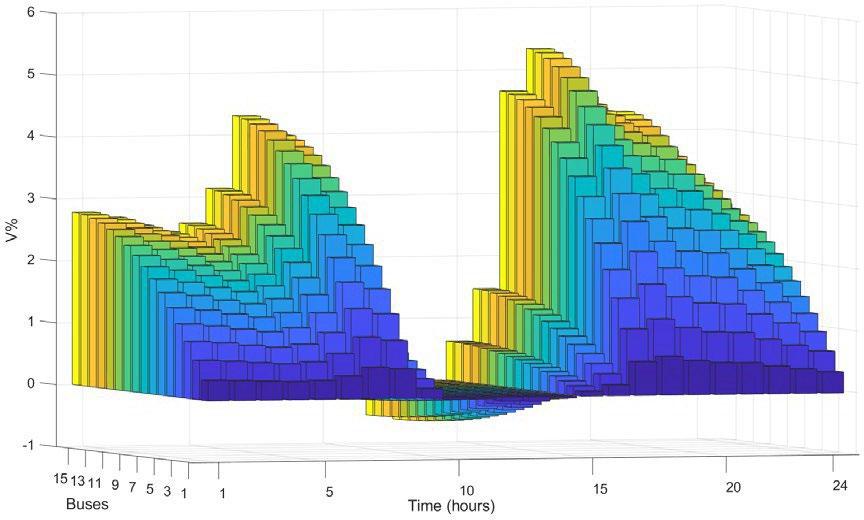
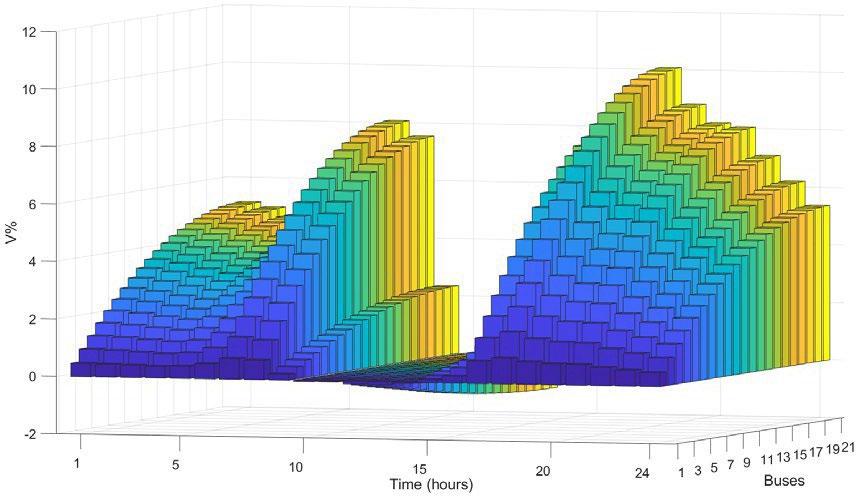
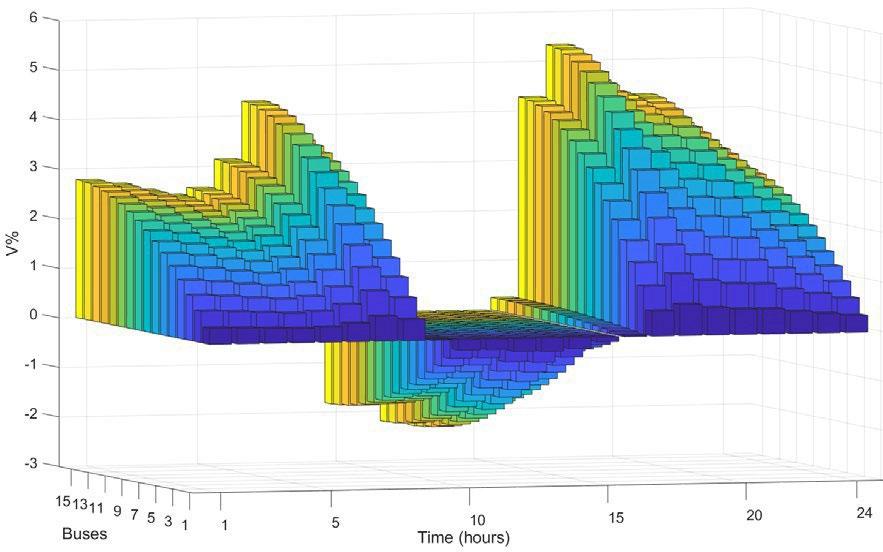
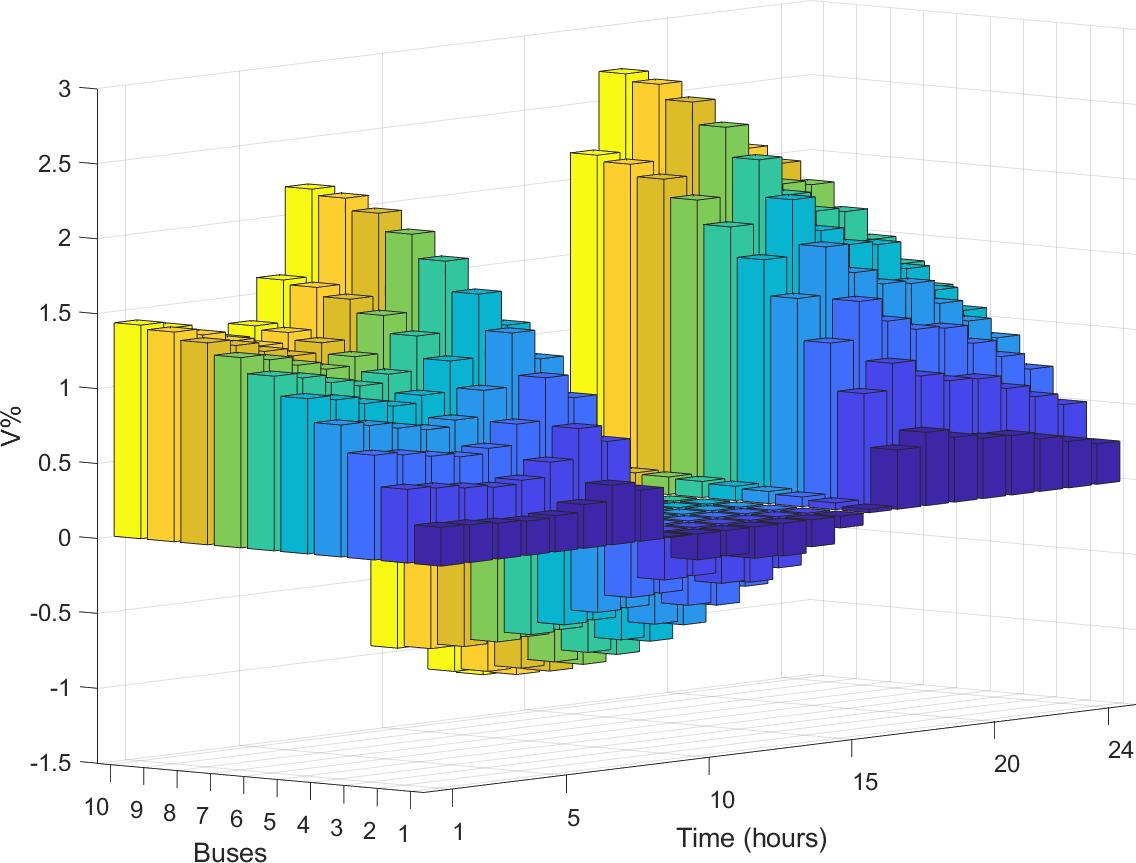
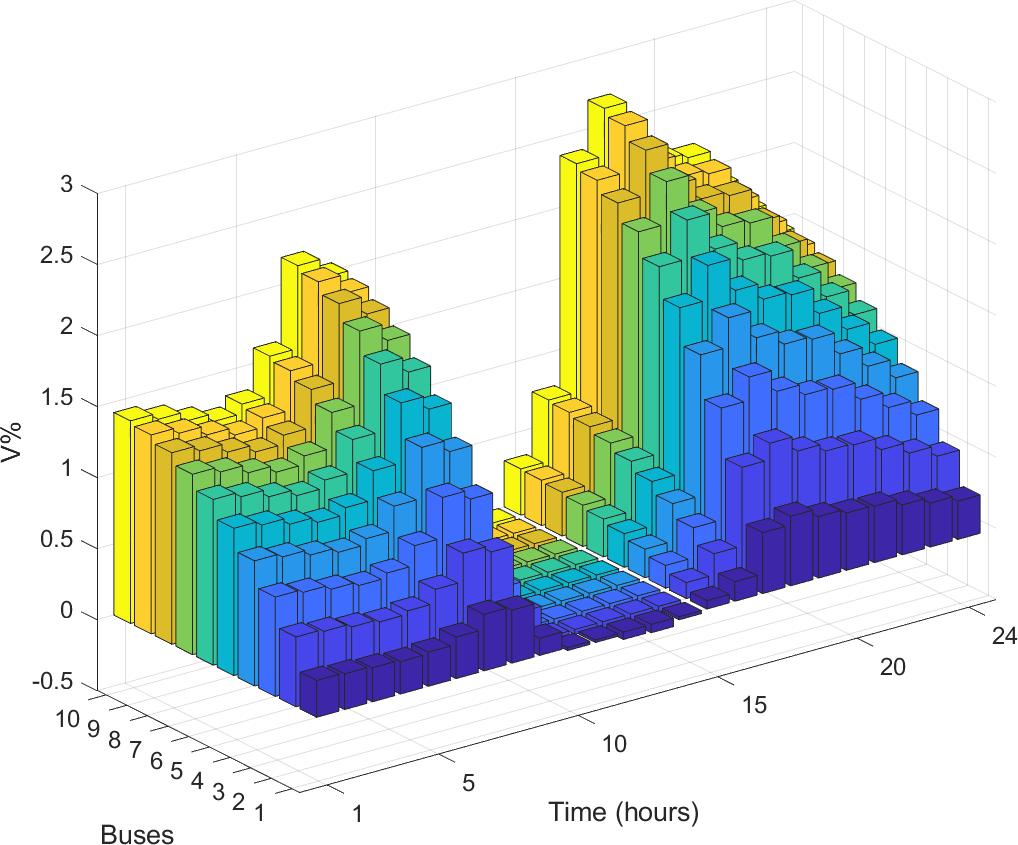
Pathways for Urban Renewable Energy Zones 80
(a)
(b)
(c)
(d)
Figure 46 V% at HV-side of the transformers with 80% PV installation on Feeders (a) 2, (b) 3, (c) 8 and (d) 15
(b)
(a)
Power flow analysis
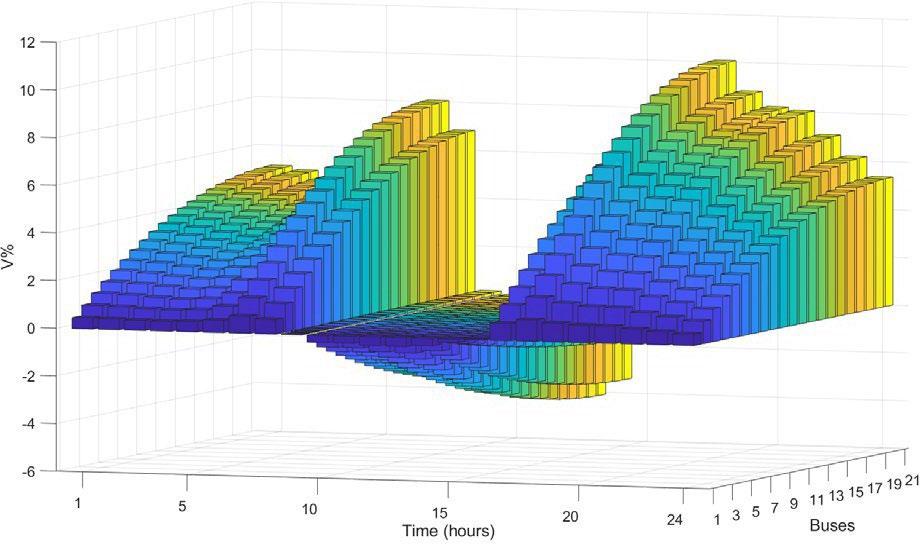
As explained earlier, the power flow through conductors and transformers should remain well below their respective ratings. Figure 48 shows the magnitude of the power flow from the Brookvale Zone Substation at 1 pm and 3 pm. Considering the results at 1 pm, installing the PV panels at different levels from 0 to 70% consistently reduces the total power flow, dropping it to zero at a 70% installation level. Above 70% penetration the power flow would reverse to inject the surplus power into the rest of the network. The figure shows that the magnitude of power flow for 100% installation level is about one third of the magnitude for the existing network without PV panels. Likewise, Figure 48 shows the total power flow at 3 pm for different PV installation levels. About zero power flow from the substation occurs at 90% PV penetration level. At the other levels the figure is lower in comparison to the existing network.
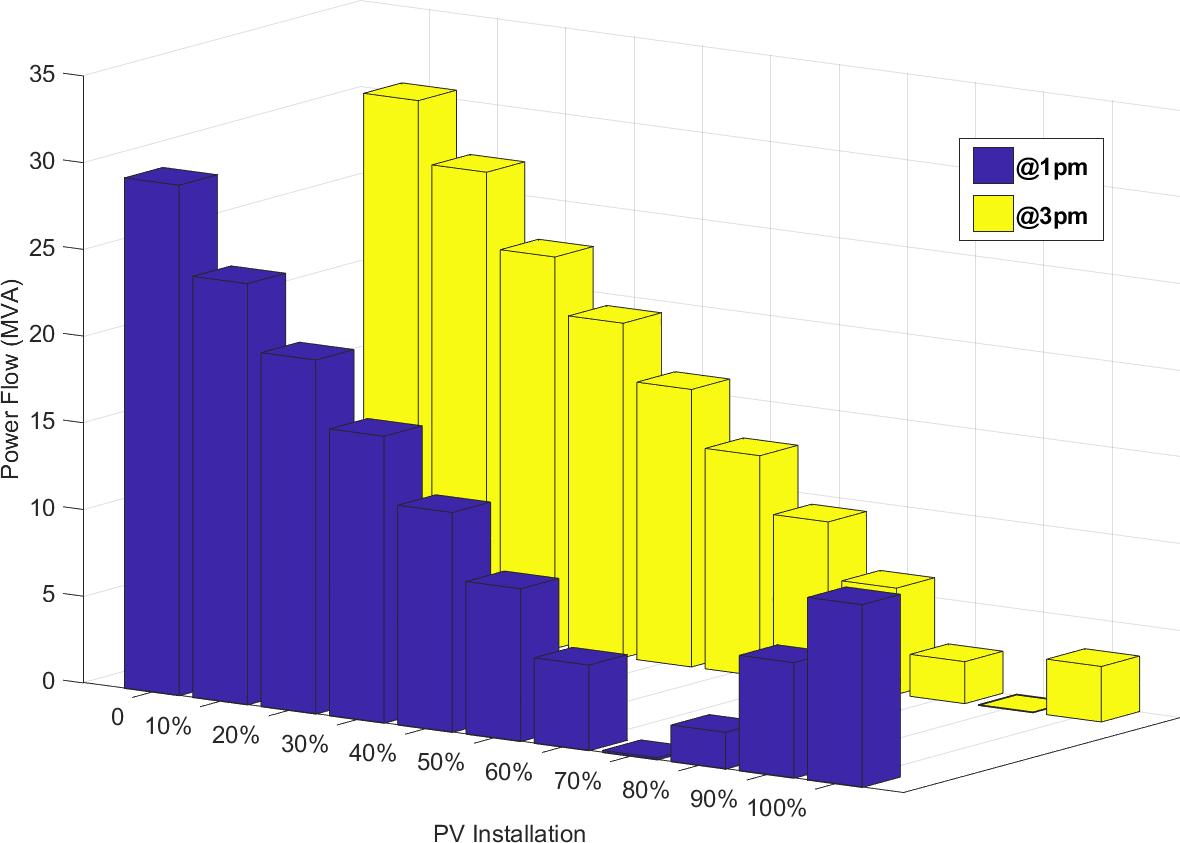
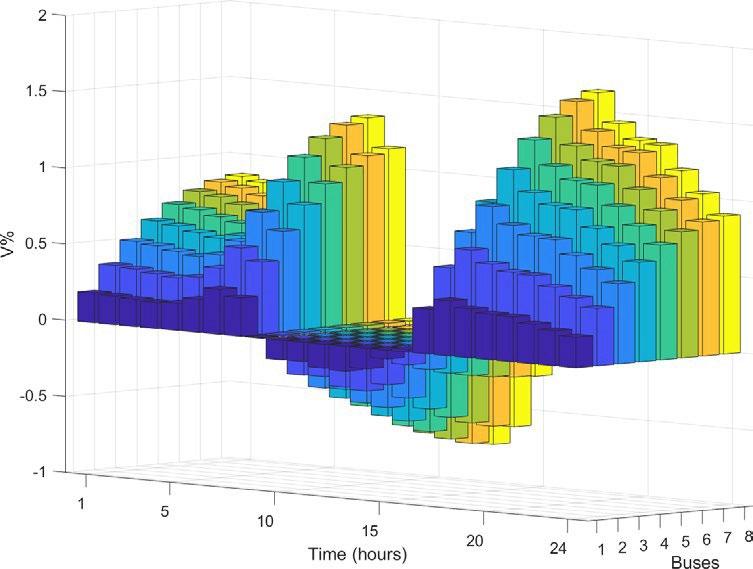
Scenario analysis: electrification of the bus depot
As the internal combustion engines of buses are high carbon emitters, transport electrification is often considered a potential strategy to reduce carbon emissions The bus depot in Brookvale plans to retrofit 40
Pathways for Urban Renewable Energy Zones 81
(d)
(c)
Figure 47 V% at HV-side of the transformers with 100% PV installation on Feeders (a) 2, (b) 3, (c) 8 and (d) 15
Figure 48. Total power flow from the Brookvale Zone Substation
electric buses with 368 kWh and 422 kWh batteries. The buses will be charged by five 120 kW charging points each capable of charging two buses simultaneously. The plan also includes the installation of another 80kW charging point. The depot plans to get the energy required to charge the buses from the rooftop PV panels in the area. Installation of a battery energy storage system of 2.5 MW/4.9 MWh is also being considered to store the surplus energy generated by the PV panels. Given the number of buses servicing the area and their regular daily trips chargers would need to be used simultaneously to charge the buses, demanding about 680 kW of power.
Assuming an equal distribution of 368 kWh and 422 kWh batteries across 40 buses the daily energy consumption of the buses would be up to 15.8 MWh. Therefore, the storage capacity of the batteries needs to be increased four-fold to reach the required capacity.
Assuming 4.5 peak-sun hours per day (the average for Sydney, NSW) the rated capacity of the solar PV array to supply the energy to charge the batteries fully would be 3.5 MW. As the UREZ at Brookvale can generate up to a maximum of 38.7 MW of PV power using rooftop PV array even with about 10% PV penetration the energy demand of the bus depot can be met. However, as the power capacity of the local distribution transformer is 0.8 MVA and the feeder power rating is about 2 MVA, the power network acts as a bottleneck, limiting the power that can be received from the prosumers of the UREZ.
Therefore, the existing network is highly unlikely to handle such an operation and would need to be expanded to supply electric buses as well as solar prosumers.
Recommendations for future modelling
The above simulation was conducted with the limited data available to the research team. While we were able to estimate the generation for the identified UREZ, the load of the same area was unavailable. Instead we assumed that the available total load of Brookvale Substation transformers is the load demand of the UREZ. This potentially larger than the actual load of the UREZ would have increased the percentage of PV penetration beyond which the overvoltage occurs and thereby the percentage penetration beyond which energy storages are needed to solve network problems.
The accuracy of the developed model and analysis method can be improved by:
• access to more accurate information on the load profile of the designated area of UREZ
• access to the exact location of the transformers and length and impedance of conductors
• access to the individual load profile of distribution transformers
• evaluating the generation levels and their possible technical impacts under various weather and seasonal conditions
• designing more effective control and energy management procedures
• enhancing resolution of the load and generation profiles to improve accuracy of load flow analysis
• developing efficient methods to verify the validity of the presented model and the outcome of the numerical analysis.
Key insights
• The existing network does not need to be upgraded to integrate rooftop PV panels even if covering up to 100% of the available rooftop area.
• There is no need to include BESS as the PV-based power generation does not violate voltage standards. The power generated is consumed by the locally distributed loads.
• The power flow through the conductors and transformers are within acceptable ranges.
Pathways for Urban Renewable Energy Zones 82
• The network has significant potential to integrate PV panels without necessitating any network augmentation. This is due mainly to a significant level of local load demand.
• When considering the enhanced load sourced locally from electrification of the bus depot, the power network acts as a bottleneck, limiting the power that can be received from the prosumers of UREZ. Therefore the network would need to be expanded accordingly as the existing network would be highly unlikely to handle this operation.
• It is possible that the actual load of UREZ is lower than that used in the simulation. If that were the case, network control devices such as battery energy storages would be needed at a lower DER penetration level than predicted here.
3.7 Recommendations for early action
The modelling in both case studies predicts that the existing networks will only be able to handle increased local power generation up to a certain point without encountering network problems. Further growth of generation would require storages at the level of the distribution line. Network augmentation is needed when the reverse power flow exceeds transformer or line capacities. Therefore, the items below are recommended for early action:
• Optimally locating a UREZ site: As evident from the case studies, high local load reduces network problems. As such, a high level of local load should be considered a critical factor in optimally locating a UREZ site. The advantage of placing UREZ prototypes in heavily loaded regions is that the existing networks can sustain a significant increase in generation without any network augmentation.
• Simulation studies and prototyping: Computer modelling and prototyping of a control system based on the proposed control strategy are two important steps that should precede implementation in the field. Powering a large commercial or industrial load such as the bus depot using local generation could face network congestion issues as the existing power network is not designed for such a purpose. The UREZ control strategy should be adopted even if there are no overvoltage issues in the network model to give prosumers the choice of consumption, informed participation in the energy market, improve power quality, maximise local self-sufficiency, provide network support during emergencies and so on. An accurate and intensive computer modelling and prototyping can facilitate a successful implementation of UREZ control systems.
Pathways for Urban Renewable Energy Zones 83


www.racefor2030.com.au © 2022 RACE FOR 2030


