Waterfront Report

PROPERTY LIFESTYLE
2024
THE MOST COVETED

This report provides a comprehensive analysis of 16 distinct waterfront communities across multiple counties in the region, offering valuable insights into market trends and performance throughout 2023. By leveraging our global real estate expertise and local knowledge, Realogics Sotheby’s International Realty ensures that you receive the best possible guidance and support in navigating the waterfront market.
Join us on this waterfront odyssey and let our expert brokers help you find your dream waterfront home or achieve the best value for your current property. Embrace the iconic Pacific Northwest vistas, boundless recreational opportunities, and the unique lifestyle that comes with living on the water's edge.

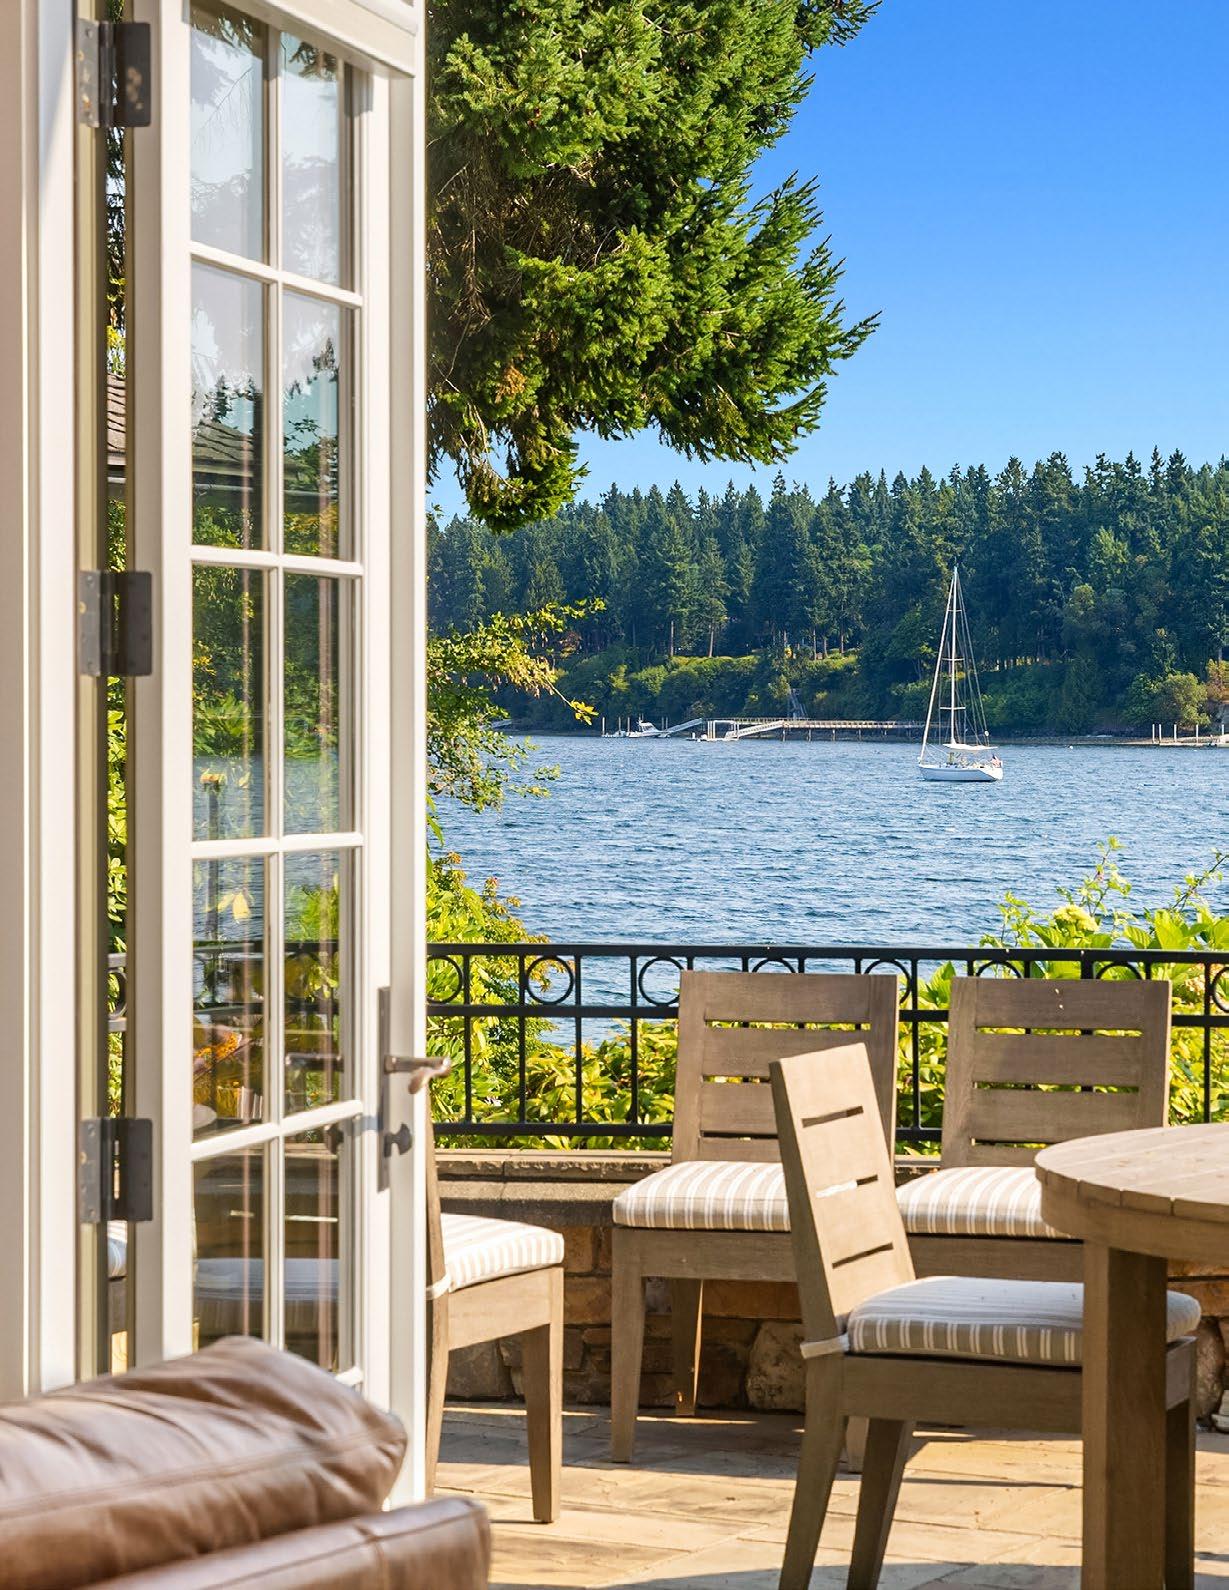
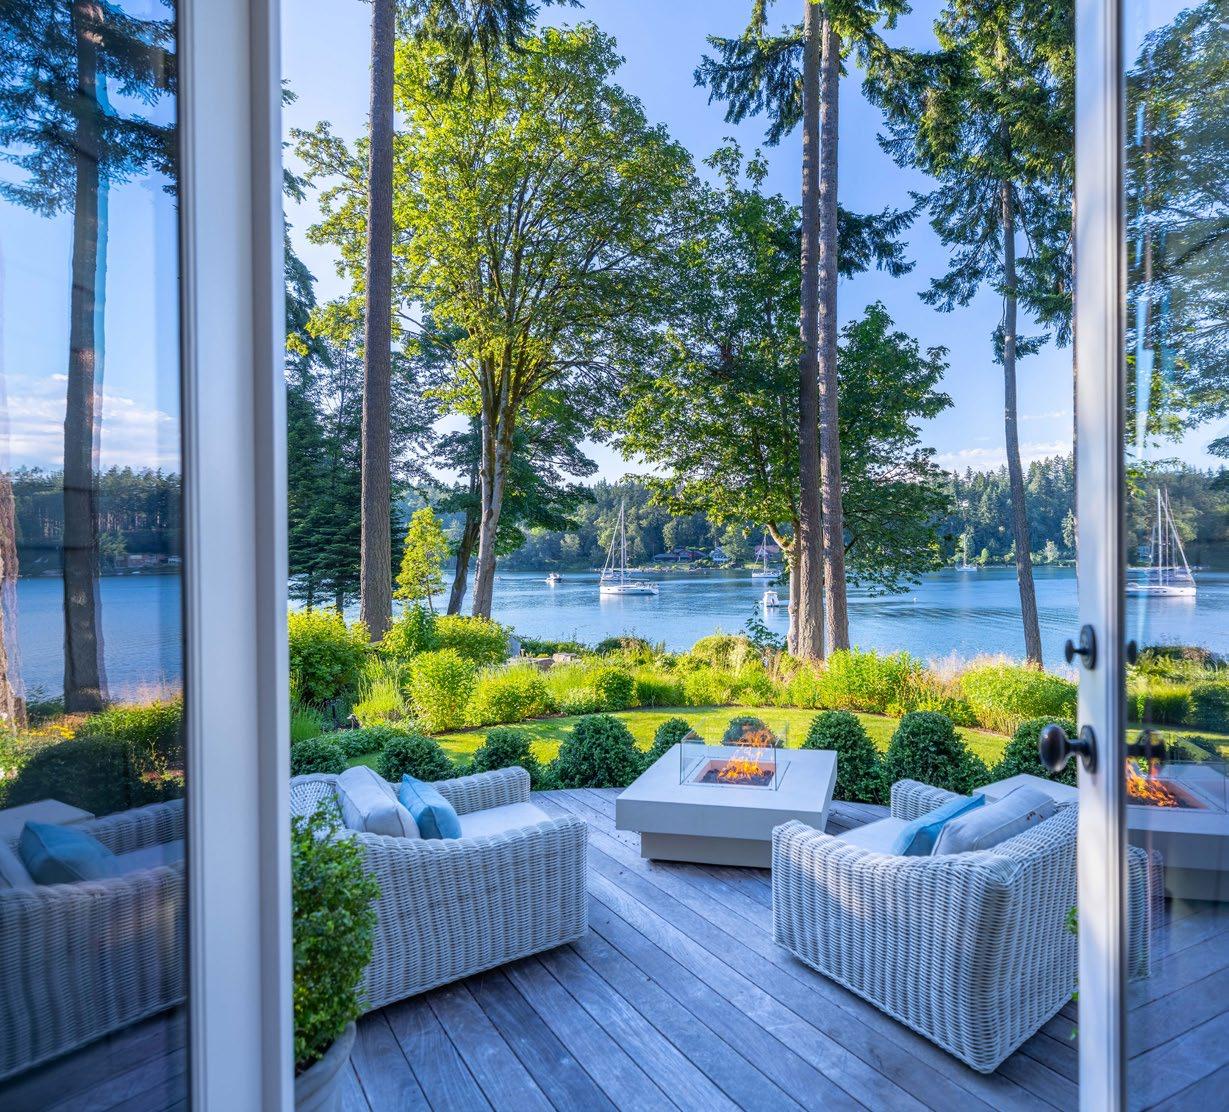
magine waking up each morning to the serene beauty of Washington's shoreline, where the gentle lapping of waves greets you and panoramic vistas of the Puget Sound or Lake Washington stretch out before you. Owning a waterfront home in Washington is a rare and coveted opportunity, offering a unique lifestyle defined by natural beauty, tranquility, and endless recreational possibilities.
At Realogics Sotheby’s International Realty, we understand the unparalleled allure of waterfront living. Our dedicated team of brokers are true experts in this specialized market, with a deep understanding of the unique nuances and complexities involved in waterfront transactions. Whether you're looking to sell your current waterfront property or find the perfect shoreline retreat, our advisors are equipped with decades of experience, data-backed insights, and an intimate knowledge of the local communities that grace our spectacular shorelines.

Whether your next move is around the corner or around the world, we’re here to help.
Washington's waterfront real estate is not just about owning a piece of land; it's about embracing a lifestyle shaped by our region's stunning waterways. From the bustling marine life of Puget Sound to the serene lakes perfect for kayaking and sailing, each waterfront property offers a gateway to a world of natural wonder and adventure. The Puget Sound is an estuary where freshwater and saltwater merge, creating one of the most productive environments for life to flourish. With over 2,500 miles of shoreline, stretching from the Strait of Juan de Fuca to Hood Canal, the region offers stunning views and an incredible diversity of recreational opportunities.
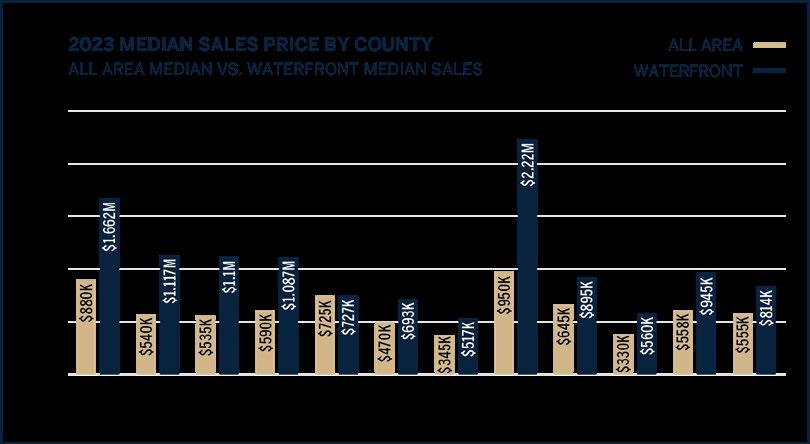
Waterfront properties are exceptionally rare, representing only 4% of all single-family homes sold in 2023 in Washington State. These properties command a significant premium, with median sold prices 43% higher than their non-waterfront counterparts. Interestingly, 57% of these waterfront sales were for under $1 million, while 15% exceeded $2 million, highlighting the diverse range of opportunities available in this exclusive market. Out of the 12 counties researched, King County accounted for the highest proportion of waterfront sales, at 17% of the total sales in Washington State.
Collectively, Realogics Sotheby's International Realty brokers transaction median sales price exceeded the Washington State median sales price for waterfront properties by an impressive 136% for 2023. Additionally, Realogics Sotheby’s International Realty represented buyers in the highest recorded sales for waterfront properties in 2023. This demonstrates our brokerage's exceptional value and premium service to the waterfront real estate market.
Our brokers are here to guide you through every step, ensuring a seamless and successful transaction that captures the essence of waterfront living.
 Andrea Savage Chief Marketing Officer
REFERENCES

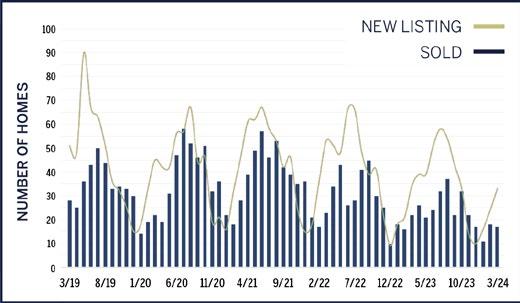
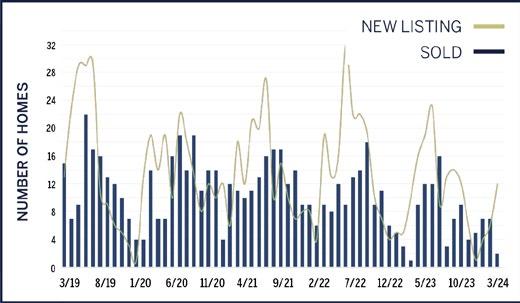
This section analyzes waterfront real estate trends across 12 Washington counties from 2019 to 2023, illustrating new listings and sales patterns. With only 4% of sales in Washington being waterfront properties, it is crucial to identify the best opportunities to buy or sell. Our review shows that new listings and sales typically peak in spring and summer, making these seasons ideal for sellers due to increased buyer activity and appealing weather. Conversely, sales dip during fall and winter, offering buyers better deals in the off-season with less competition. Over the past five years, median sales prices for waterfront properties have risen due to limited inventory and high demand. The Pacific Northwest's weather patterns significantly influence the market, with the rainy season slowing activity in colder months and sunny weather boosting spring and summer sales. The following graphs provide visual insights into these trends, helping you determine the best times to buy or sell a waterfront home in each of these 12 counties.
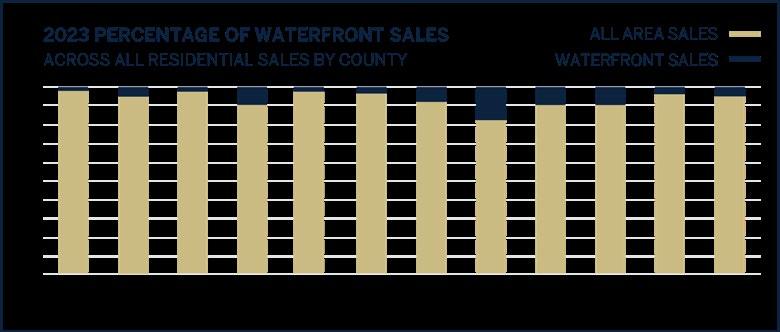
This graph illustrates the percentage of waterfront homes sold in the counties in 2023, providing a rare opportunity to own property along the shoreline.
NUMBER OF WATERFRONT SALES IN WASHINGTON 2,040
55,781
NUMBER OF RESIDENTIAL SALES IN WASHINGTON FOR 2023
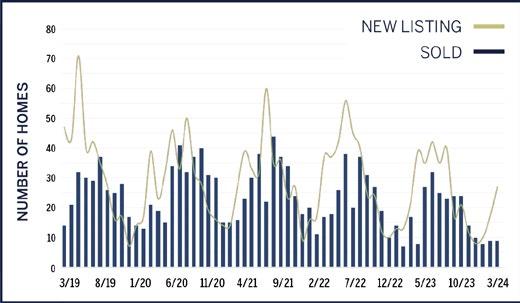
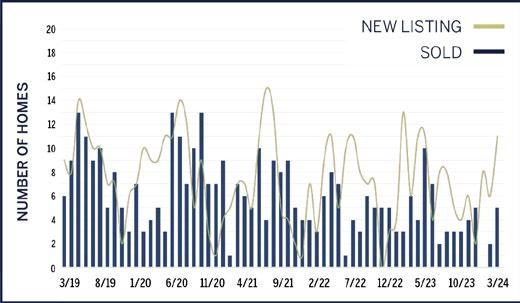
Charting new listing waterfront data in King County for the past five years reveals a decrease from a peak in 2019 but then consistent numbers from year to year. There is an annual dip during colder months, from the fall through the winter, indicating that the waterfront season truly picks up during spring and summer in this county.

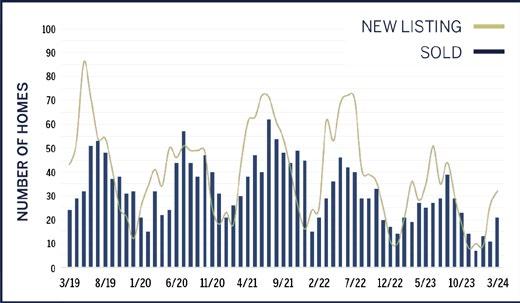
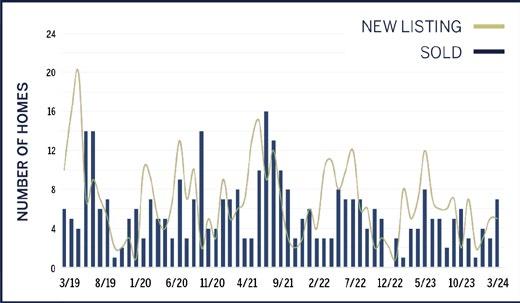
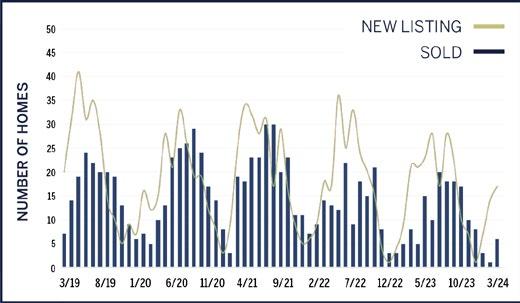
Pierce County’s waterfront market saw fewer new listings in 2023 than in previous years, mirroring the low inventory obstacles that the region’s real estate market—both waterfront and non-waterfront— faced last year. Closed sales also trended lower, despite a surprising spike in October 2023.
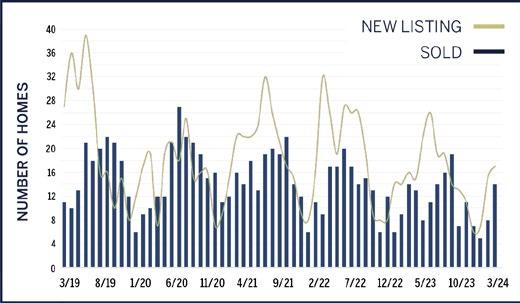
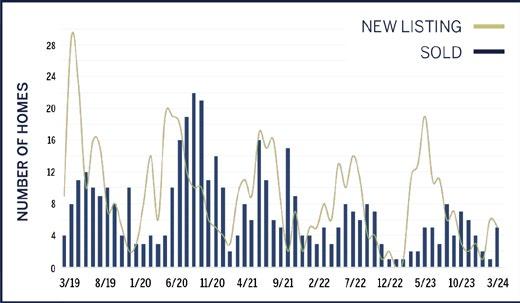
The ebb and flow of closed sales and new listings we witnessed in other counties analyzed in our reporting continued in Snohomish County. New listings peaked in June/July and closed sales peaked in August, with buyers closing out their searches as the summer similarly came to an end.
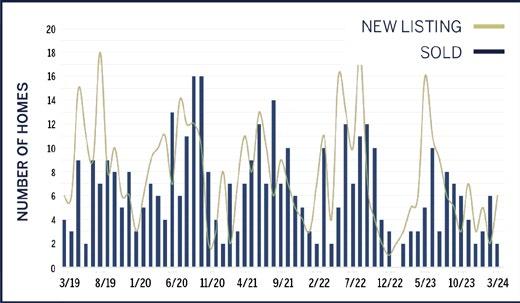
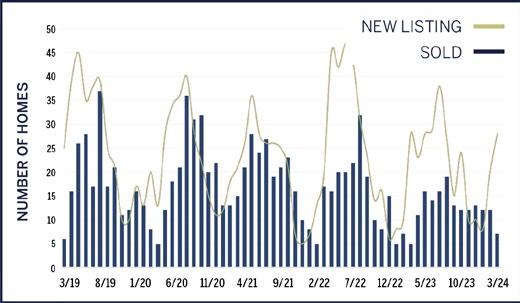
Kitsap County, with its major waterfront havens like Bainbridge Island and Bremerton, typically spikes in closed sales during the later summer months and early fall. In 2023, data indicates a steadier trend of closings, with fewer peaks and valleys from July through October, than seen in past years.
Clallam County’s market activity took a hit at the end of 2022 with zero closed sales and very few new listings. Inventory levels rebounded during the spring of 2023, but sales did not reach the levels seen in past years. New listings and sales both hit their 2023 peak in May, earlier than is typical with other waterfront counties in the area.
Grays Harbor data illustrates that sellers in this area waited for the warmer months to list their waterfront homes, with new listings reaching their highest level in June last year. Buyers took advantage of more inventory and closed sales gradually increased from June through September.
The waterfront market in Jefferson County proves to be harder to predict than other counties that follow clear seasonal trends. New listings peaked in spring in 2023, whereas there were multiple spikes in 2022 (once in spring and again in late summer), and several spikes in 2021. Closed sales also defy trendlines in this county.
In past years, Pacific County has not followed the same seasonal trends as other waterfront markets analyzed in our reporting. In 2023, we saw closings pick up in spring and peak in May and June. As the unexpected can be expected in this market, July had the lowest number of closings. New listings were similarly sporadic on the graph.
Island County’s waterfront data presents more predictably than other counties analyzed when it comes to new listings—for the past four years, new listings have hit their lowest point in December, and for the past three years, they have peaked in spring. In 2023, closed sales were consistent through summer and into early autumn.
The San Juan Island county waterfront market’s inventory levels rebounded in 2023. However, the variance between months with low sales activity (winter 2023) and months with higher sales activity (late spring and early summer 2023) was not as sizable as it has been in previous years given fewer sales overall throughout the year.
The Whatcom waterfront market held consistent levels when it came to closed sales, starting from the spring and lasting until the end of 2023. Buyers who began their search during spring were able to shop with more choice as inventory levels outpaced demand. However, supply dwindled as the year progressed.
Closed waterfront sales picked up in spring and throughout the summer in Skagit County. New listings peaked in summer, as is typical in this market, indicating sellers often list their waterfront homes later than the spring influx seen in other counties. New listings hit a major low in December when many people decided to pause their real estate plans.
With only 4% of sales in Washington being waterfront properties, it is crucial to identify the best opportunities to buy or sell.
21,600 Ft.
LAKE WASHINGTON'S SURFACE AREA
LAKE WASHINGTON'S DEEPEST DEPTH 214 Ft.
Located in the heart of Washington, Lake Washington covers 21,600 acres with a maximum depth of 214 feet. Bordered by Seattle, Bellevue, and Renton, it is a hub for outdoor activities such as boating, fishing, kayaking, and swimming. Fed by the Sammamish and Cedar rivers, Lake Washington spans 34 miles and is the largest lake in King County.
The lake supports diverse wildlife, including salmon and bald eagles. Iconic structures like the SR 520 and I-90 floating bridges connect communities, enhancing accessibility. More than a million people in the region use its amenities annually. This coveted waterfront area features diverse real estate, including craftsman homes, beach bungalows, and modern constructions, often with beach access and docks.
Seattle offers a variety of waterfront properties, from houseboats and custom floating homes to luxurious estates and shoreline condos. Elliott Bay, Lake Washington, and Lake Union provide ample opportunities for waterfront living, with private docks making boating excursions convenient. For those who crave in-city conveniences but yearn for a stunning setting, a waterfront property in bustling Emerald City is ideal.
Seattle's floating homes, a unique niche in the market, range from cozy and rustic to luxurious and sprawling. Residents enjoy peaceful sunrises and up-close wildlife sightings in the mornings, with colorful sunsets and sparkling city skylines reflecting off the water in the evenings. Whether on Lake Union, Lake Washington, or Elliott Bay, Seattle’s waterfront properties offer a perfect blend of natural beauty and urban excitement.
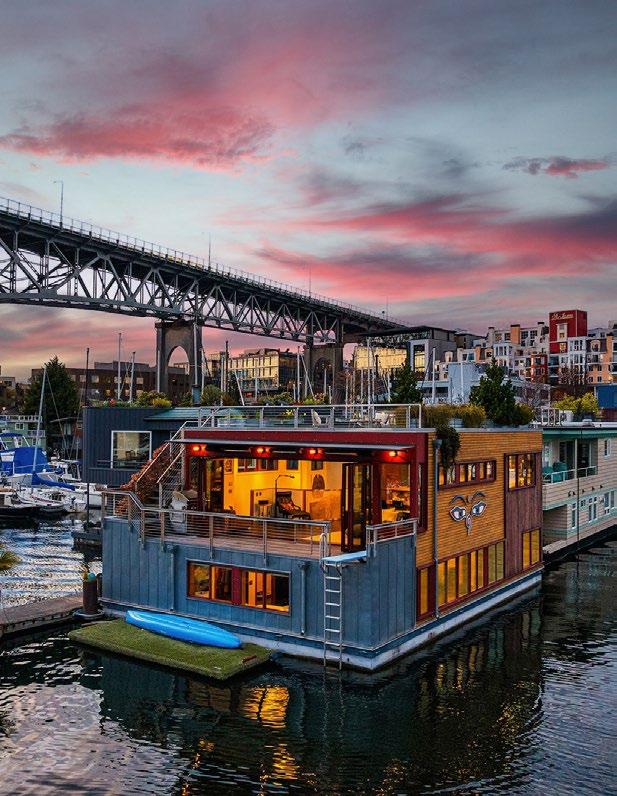
Lake Union spans 580 acres with a six-mile shoreline and is one of two freshwater lakes in the city. Connected to Puget Sound via the Lake Washington Ship Canal and Ballard Locks, it is famous for houseboats and floating homes, including the iconic “Sleepless in Seattle” houseboat. The surrounding South Lake Union neighborhood features vibrant communities, tech hubs, and parks. Residents enjoy boating, kayaking, paddleboarding, and unique experiences like hot tub boats, with seaplanes frequently taking off and landing.
Lake Sammamish is an eastside gem spanning 4,897 acres stretching from Redmond to Issaquah. The freshwater lake is popular for boating, fishing, and swimming. Lake Sammamish State Park offers beaches, picnic areas, and boat launches. The lake’s ecosystem includes the native kokanee salmon. Established in 1950, the park transformed from dairy farms to a public space used by over a million people annually, showcasing the community’s dedication to preserving natural beauty.
The San Juan Islands, an archipelago of 175 named islands, are renowned for their stunning natural beauty and vibrant wildlife. San Juan Island features the charming town of Friday Harbor and Lime Kiln Point State Park, one of the best spots for whale watching, where visitors can often see orcas from the shore. Orcas Island, the largest, offers excellent hiking trails and breathtaking panoramic views from Mt. Constitution, the highest point in the islands.
The nutrient-rich waters surrounding the islands support diverse ecosystems, including orcas, seals, and a variety of seabirds. The San Juan Island National Historical Park, established in 1966, spans 1,752 acres and commemorates the Pig War, a border dispute between the United States and Great Britain.
The islands provide a perfect getaway with opportunities for boating, kayaking, and exploring serene beaches and lush forests, making them a paradise for nature lovers and adventure seekers.
| 2024 Waterfront Report REFERENCES
of Washington: School of Aquatic and Fishery Sciences. Letting Nature Be Nature: Restoring Puget Sound’s Shoreline. Fish.uw.edu. Puget Sound Estuarium. Overview of Puget Sound. Pugetsoundestuarium.org.

MILES OF SHORELINE
1,330 RESIDENTS +4M
WATER VESSELS REGISTERED IN WA FOR 2023 225K
Stretching from Admiralty Inlet to Olympia, Puget Sound offers 1,330 miles of shoreline and a unique lifestyle blending natural beauty with urban convenience. Home to 4 million residents, it features diverse wildlife, including orcas, salmon, and seabirds. Residents enjoy a lifestyle enriched by outdoor activities, such as boating, fishing, and kayaking, supported by numerous public piers and access points.
In 2023, nearly 225,000 vessels were registered in Washington, highlighting the community's passion for maritime adventures. Conservation efforts ensure the region's beauty and resources are preserved, enhancing the quality of life. This area, beloved by residents and visitors, offers opportunities to explore sea creatures, try clam digging on public beaches, and witness majestic orcas from West Seattle and the Sound’s 35 islands, including Vashon, Whidbey, and Bainbridge.
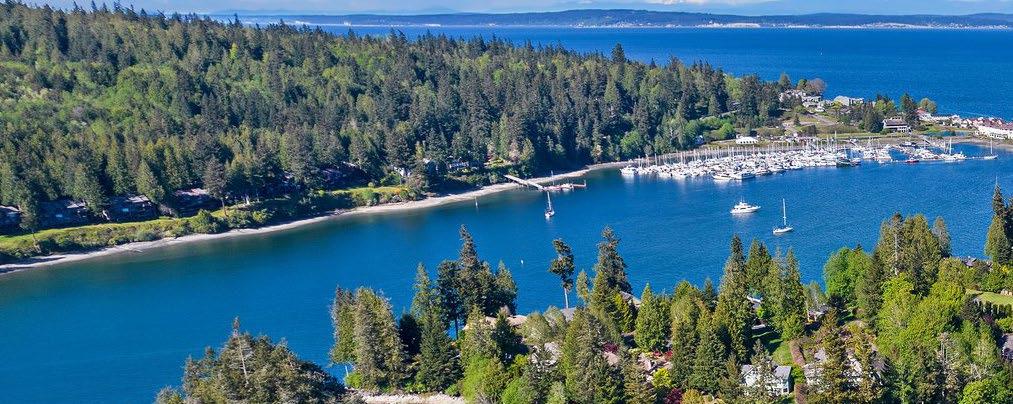
Some of the most sought-after waterfront properties in the region can be found on the shores of the iconic Bainbridge Island. Just a short ferry ride away from Seattle, a Bainbridge Island address opens the door to the best of both worlds—in-city opportunities and idyllic waterfront living. This market proved stable even during a challenging year in the real estate market. The median sales price dropped 8.12% year over year to $2,500,000, but the average price per square foot saw a slight growth of 4.51% from $903 in 2022 to $944 in 2023. Unlike some of the other markets analyzed, Bainbridge Island’s waterfront sales make up a sizable portion of its total sales, accounting for 18.52% of all sales. This not only gives us a substantial pool of data to use in our yearly comparison but it also speaks to the significance of a waterfront address in this community.
MEDIAN SALES PRICE
Single-Family
AVERAGE LINEAR WATERFRONT FOOTAGE
Single-Family
AVERAGE PRICE PER SQ. FT.
Single-Family Homes ↑(4.51%)
TOP THREE WATERFRONT SALES IN 2023
1 2 3
12269 NE Arrow Point Lp, Bainbridge Island*
MLS #2151047 | $8,300,000
8802 Spargur Lp NE, Bainbridge Island
MLS #2058572 | $7,988,000
11078 Country Club Rd NE, Bainbridge Island
MLS #2047167 | $6,150,000
CLOSED SALES IN 2023
Single-Family
In examining the year-over-year changes in the trendy waterfront communities of Ballard and Magnolia in Seattle, it is apparent that the slowdown that the region’s general residential market experienced was similarly experienced within the waterfront market. There was a notable decrease in the median sales price, which was down 28.57% from $3,500,000 in 2022 to $2,500,000 in 2023. However, the average price per square foot was down less than 2% from the previous year, indicating that sellers received similar values for their square footage despite a lower overall median sales price. With waterfront sales accounting for just half of a percent of the entire total sales of this area, the data pool is significantly smaller (just 11 homes) than other areas analyzed in our reporting. It should also be noted that floating homes were excluded from this analysis and reported on separately.
MEDIAN SALES PRICE
AVERAGE LINEAR WATERFRONT FOOTAGE
Single-Family
AVERAGE DAYS ON MARKET
Showing Waterfront Data Over The Last Three Years
AVERAGE
1 2 3
4594 W Cramer St, Seattle MLS #1945371 | $4,800,000
2355 Perkins Ln W, Seattle MLS #2030687 | $3,500,000
3636 W Commodore Wy, Seattle MLS #2140554 | $3,400,000 TOP THREE WATERFRONT SALES IN 2023
CLOSED SALES IN 2023
Single-Family
The Bellevue waterfront market is a prime example of how even a popular market can be affected by industry obstacles like low demand and high interest rates. With listings sitting on the market for an average of 90 days, it appears that potential Bellevue buyers either put their home-buying plans on hold during the chilly market conditions or took their time when searching for their property and making a purchase. There was a 13.44% year-over-year decrease in the median sales price which dropped from $5,060,000 in 2022 to $4,380,000 in 2023. With less waterfront real estate than some of the other markets reported on, Bellevue’s 17 waterfront sales accounted for just 1.83% of the total sales in 2023. Buyers received almost the same amount of average linear feet of waterfront as they did the previous year with 72 feet.
MEDIAN SALES PRICE Single-Family
AVERAGE LINEAR WATERFRONT FOOTAGE
Single-Family Homes
AVERAGE DAYS ON MARKET
Showing Waterfront Data Over The Last Three
TOP THREE WATERFRONT SALES IN 2023 1 2 3
9537 NE Lake Washington, Bellevue
MLS #2153335 | $14,700,000
1863 Killarney Wy, Bellevue
MLS #2063559 | $9,075,000
1201 96th Ave SE, Bellevue
MLS
CLOSED SALES IN 2023
Single-Family Homes
You can’t talk about life on one of Washington State’s most desirable islands without highlighting the appeal of owning a waterfront residence situated right on its scenic shores. The Camano Island waterfront market proved that even with 2022’s real estate challenges, like high interest rates and low levels of both activity and inventory, homebuyers were still eager to own in this beautiful Island County community. The median sales price stayed relatively the same year over year, with a mere 1.36% increase to $1,115,000. However, the average price per square foot decreased slightly by 5.8% from $609 in 2022 to $574 in 2023. Sellers did have to allow for more time for their property to reach the right buyer, with days on market averaging 50 days, which is longer than is typical as we look back on past yearly analysis of Camano Island.
MEDIAN SALES PRICE
Single-Family
↑(1.36%)
Single-Family
AVERAGE DAYS ON MARKET
Showing Waterfront Data
AVERAGE PRICE PER SQ. FT.
Single-Family
TOP THREE WATERFRONT SALES IN 2023
1 2 3
3228 S Camano Dr, Camano Island
MLS #2077128 | $1,720,000
1288 Juniper Beach Rd, Camano Island
MLS #2041067 | $1,710,000
975 Olympic St, Camano Island
MLS #2054238 | $1,700,000
CLOSED SALES IN 2023
Single-Family Homes
MEDINA | CLYDE HILL | YARROW POINT | HUNTS POINT
The Four Points community, which encompasses the elegant enclaves of Medina, Hunts Point, Yarrow Point, and Clyde Hill, presents some of the highest sales prices of our reporting, including the second highest top sale at $20,000,000. It boasts the highest median sales price at $11,880,000, up 3.38% from $11,491,250 in 2022. Residents in this area are not only looking for a waterfront lifestyle, but they’re also searching for a luxury home with high-end amenities as they enjoy the very best that the Pacific Northwest has to offer in both setting and architectural style. As is common with homes of higher price tags, they tended to sit on the market longer in this community, averaging 53 days on market. There was a significant increase in the average price per square foot, jumping 26.51% from $2,026 in 2022 to $2,564 in 2023.
MEDIAN SALES PRICE
Single-Family Homes ↑(3.38%)
AVERAGE LINEAR WATERFRONT
AVERAGE PRICE PER SQ. FT.
Single-Family Homes ↑(26.51%)
TOP THREE WATERFRONT SALES IN 2023 1 2 3
3667 Fairweather Ln, Medina
MLS #2029941 | $20,000,000
3267 Evergreen Point Rd, Medina MLS #2047966 | $16,518,888
4232 Hunts Point Rd, Hunts Point* MLS #2071073 | $14,500,000
CLOSED SALES IN 2023
Single-Family Homes
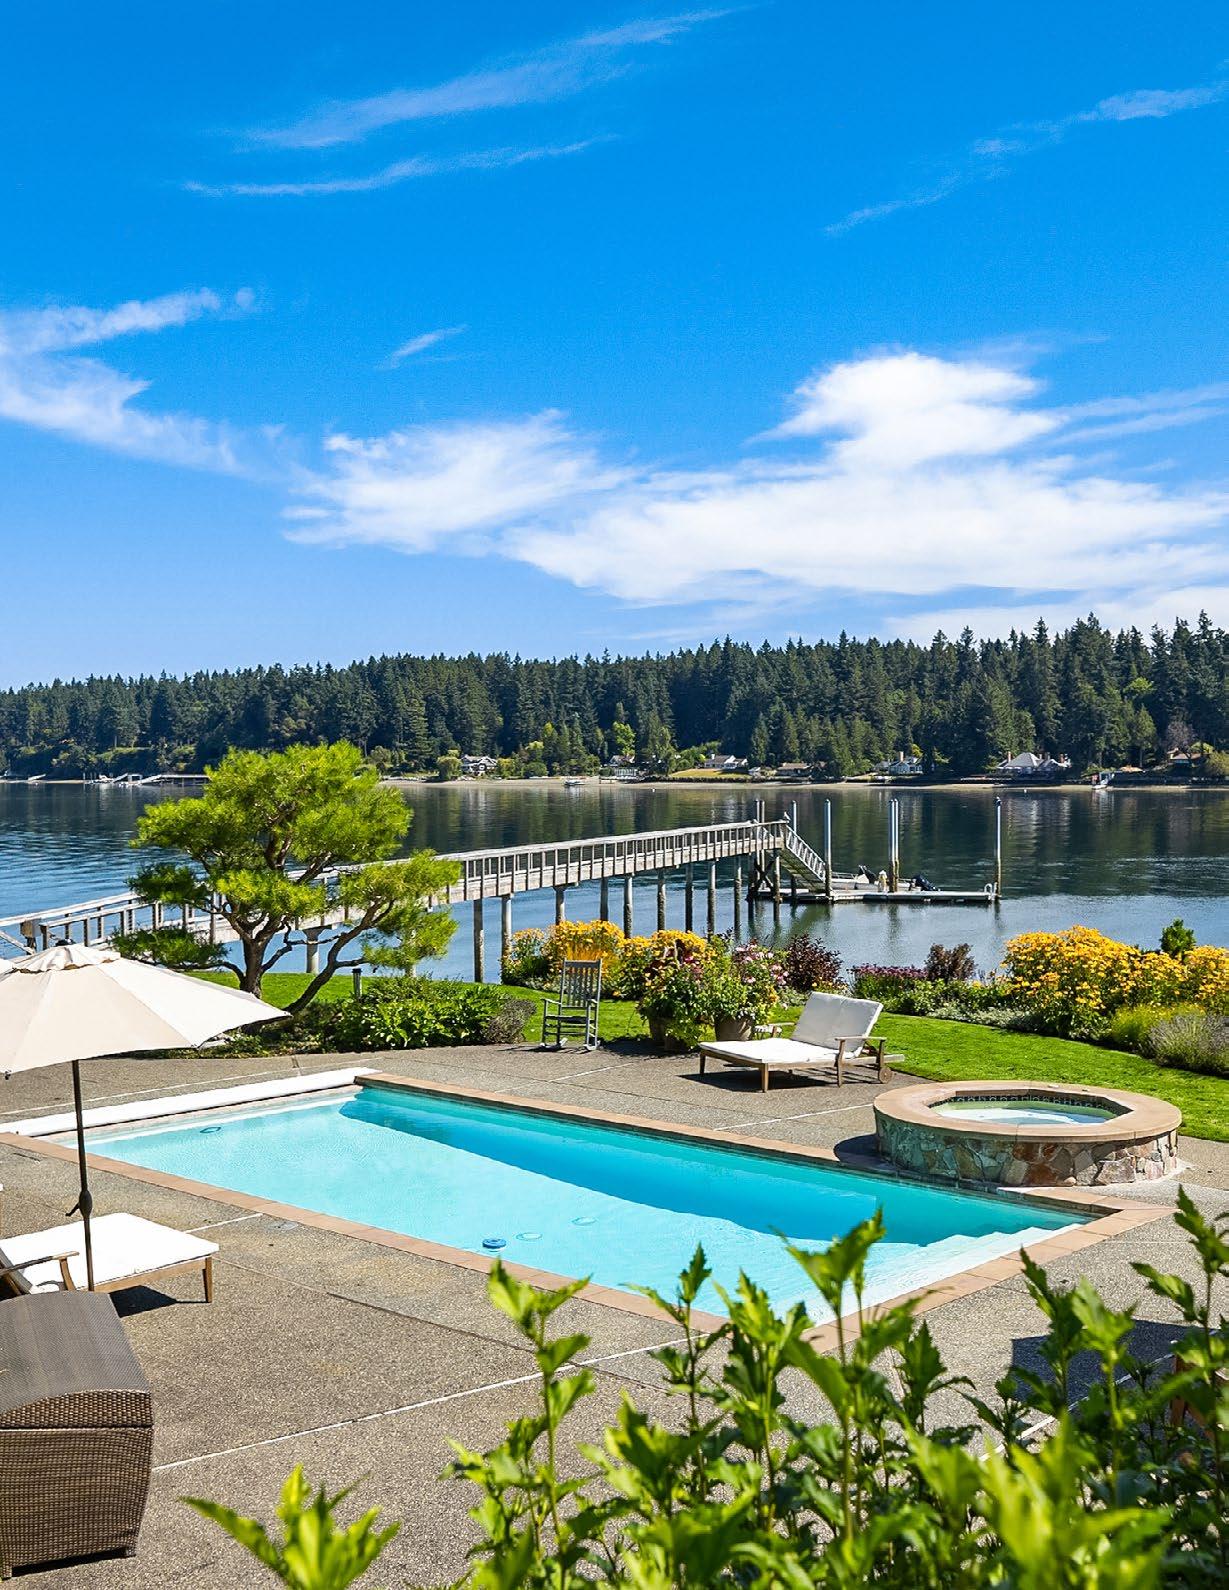
Buyers who purchased their waterfront residence on Gig Harbor or Fox Island last year not only received more square footage for a lower price ($560 per square foot) than many of the other waterfront communities analyzed in this report, but they also received more shoreline. The average linear square feet of waterfront was 115 feet— down slightly from 120 feet in 2022. The median sales price stayed relatively the same year over year with a 5.32% increase. The waterfront market in these Pierce County communities makes up a notable portion of the market, with approximately 10 percent of the total residential sales from 2023. With 81 sales, it also ranks second on our list of communities for the number of waterfront sales. These are popular shorelines to own property along, and although homes sat on the market for 57 days on average, with an experienced broker like a Realogics Sotheby’s International Realty advisor, sellers found success.
MEDIAN SALES PRICE
Single-Family
(5.32%)
AVERAGE LINEAR WATERFRONT FOOTAGE
Single-Family
AVERAGE DAYS ON MARKET
Showing
AVERAGE PRICE PER SQ. FT.
Single-Family Homes ↓(2.92%)
TOP THREE WATERFRONT SALES IN 2023 1 2 3
8004 Warren Dr NW, Gig Harbor
MLS #2163508 | $8,500,000
8024 Goodman Dr NW, Gig Harbor
MLS #2071337 | $5,327,578
53 Raft Island Dr NW, Gig Harbor
MLS #2069033 | $3,600,000
CLOSED SALES IN 2023
Single-Family Homes
The waterfront community in Kirkland, situated on the beautiful shores of Lake Washington, is smaller than most of the other communities in our Waterfront Report, with just eight sales in 2023 which accounted for approximately 1 percent of the total sales in this Eastside city. There was a 16.85% year-over-year decrease in the median sales price, dropping from $6,795,000 in 2022 to $5,650,000 in 2023. There was also a decrease in the average price per square foot, decreasing from $1,702 to $1,492. Although this market felt the effects of the stormy market last year, it is certainly in a prime position to rebound in 2024, with consistent population and economic growth ensuring that an Eastside address remains desirable, and a waterfront Eastside address is even better.
MEDIAN SALES PRICE
AVERAGE LINEAR WATERFRONT FOOTAGE
Single-Family
AVERAGE DAYS ON MARKET
Showing Waterfront Data Over The Last Three Years
TOP THREE WATERFRONT SALES IN 2023
1 2 3
213 Lake St S, Kirkland
MLS #2029128 | $10,500,000
201 Lake Ave W, Kirkland MLS #2056867 | $10,400,000
11037 Champagne Point Rd NE, Kirkland
MLS #2036962 |
CLOSED SALES IN 2023
Single-Family Homes
EXCLUDING BAINBRIDGE ISLAND
Our Kitsap County reporting excludes Bainbridge Island, so explore the report further to examine that waterfront community’s data separately. For the rest of Kitsap County, price growth remained relatively flat year over year, with a 1.59% increase in median sales price from $942,500 in 2022 to $957,000 in 2023. The average price per square foot decreased slightly from $451 to $429. Homebuyers who decided to purchase in Kitsap County were treated to more shoreline than many other waterfront areas in the region, as the average linear square footage came in at 116 last year. More feet of shoreline means more opportunities to enjoy the waterfront right outside your door, not to mention the added bonus of extra privacy. As we witnessed in other communities, homes sat on the market longer than they did in previous years where buyer demand was higher and properties were sold as soon as they hit the market, it seemed.
AVERAGE LINEAR WATERFRONT FOOTAGE
Single-Family
TOP THREE WATERFRONT SALES IN 2023
1 2
3
28657 Shorebrook Dr NW, Poulsbo MLS #2057432 | $2,600,000
33220 Eglon Rd NE, Poulsbo* MLS #2075701 | $2,400,000
37563 Vista Key Dr NE, Poulsbo*
AVERAGE DAYS ON MARKET
Showing Waterfront Data Over The
PRICE PER SQ. FT.
CLOSED SALES IN 2023
Single-Family Homes
3,197
Some of the most architecturally stunning estates grace the shores of Mercer Island. With the third highest median sales price, a waterfront address in this desirable city remains coveted even during cooler market cycles. The year-over-year decrease in median sales price was minimal, dipping from $5,430,000 in 2022 to $5,175,000 in 2023. It holds the top sales price out of the communities analyzed in our reporting, with an astounding $24,375,000 sales price. Homes listed last year sat on the market longer than in previous years, with average days on market at 76 days. This is to be expected for properties with a higher sales price and a smaller pool of interested buyers, and strategic marketing and the expert guidance of a Realogics Sotheby’s International Realty advisor can ensure that luxury properties such as these will reach interested buyers looking to make their move on Mercer Island.
MEDIAN SALES PRICE
Single-Family
↓(4.70%)
AVERAGE LINEAR WATERFRONT FOOTAGE
Single-Family
AVERAGE DAYS ON MARKET Showing
AVERAGE PRICE PER SQ. FT.
Single-Family Homes ↑(13.73)
TOP THREE WATERFRONT SALES IN 2023
1 2 3
6236 SE 22nd St, Mercer Island
MLS #2136465 | $24,375,000
7838 SE 22nd Pl, Mercer Island
MLS #2042165 | $13,000,000
3310 97th Ave SE, Mercer Island
MLS #2076432 | $8,100,000
CLOSED SALES IN 2023
Single-Family Homes
With just seven total waterfront sales in this community in 2023, accounting for less than half a percent of the community’s total 1,583 sales, the word “rare” comes to mind when considering homes on Northwest Lake Washington. Despite the limited availability of one of these addresses, there was a major decrease in the median sales price last year during the chilly market, with the median diving 46.51% from $4,300,00 to $2,300,000 in 2023. The price range of this market is wide, with the highest sale of 2023 at $16,200,000 and the second highest sale at $2,900,000, a $13,000,000 discrepancy highlighting that although the availability of waterfront properties along Northwest Lake Washington is scarce, there is variety in affordability. The average days on market of the seven homes sold in 2023 was 50 days.
MEDIAN SALES PRICE
Single-Family
↓(46.51%)
AVERAGE LINEAR WATERFRONT FOOTAGE
Single-Family
AVERAGE
Showing
AVERAGE PRICE PER SQ. FT.
Single-Family Homes ↓(15.65%)
TOP THREE WATERFRONT SALES IN 2023
1 2 3 SEATTLE
3201 43rd Ave NE, Seattle* MLS #1971783 | $16,200,000
13194 Riviera Pl NE, Seattle MLS #2048784 | $2,900,000
10706 Riviera Pl NE, Seattle MLS #2054122 | $2,300,000
CLOSED SALES IN 2023
Single-Family Homes
7
1,583
With the lowest average days on market of all the communities examined in our report at 29 days, Poulsbo had more activity, relative to the size of its waterfront market, than many other regions in 2023 affected by the downturn in the market. There was minimal year-over-year change in prices, with a 5.56% decrease in the median sales price to $1,400,000 and just a 2.41% decrease in the average price per square foot from $565 in 2022 to $551 in 2023. The year-over-year similarities don’t stop at pricing—buyers received the same average of linear feet of waterfront in both 2022 and 2023 at an average of 106 feet. During times like the past few years where the market highs soared and the lows were potent, the Poulsbo waterfront market has proven stable. In Poulsbo, 14 out of the 23 waterfront home sales ranged between sales prices of $1 million and $5 million.
MEDIAN SALES PRICE Single-Family
AVERAGE LINEAR WATERFRONT FOOTAGE
Single-Family Homes
AVERAGE DAYS ON MARKET
Showing Waterfront Data Over The Last Three Years
TOP THREE WATERFRONT SALES IN 2023
1 2 3
28657 Shorebrook Dr NW, Poulsbo
MLS #2057432 | $2,600,000
14070 NE Sandy Hook Rd, Poulsbo MLS #2140364 | $2,376,000
275 NW Scandia Rd, Poulsbo* MLS #2051396 | $1,887,000
CLOSED SALES IN 2023
Single-Family Homes
LAKE SAMMAMISH
Issaquah
The waterfront market makes up a smaller portion of these communities, with just 22 sales in 2022 accounting for merely 2.24% of the entire market’s yearly total sales. It stands to reason then that waterfront property in Sammamish and Issaquah is highly desired by buyers looking to escape the hustle and bustle of city life and put down roots east of Seattle. There was slight price growth, with the median sales price increasing from $2,998,000 in 2022 by 6.32% to $3,187,500 in 2023. There was also a year-over-year increase in the average price per square foot, growing from $1,026 to $1,110. Although sellers received higher sales prices in 2023 than those in the previous year, they also had to cope with their property sitting on the market for a longer amount of time with an average of 110 days on market, indicating that there were fewer buyers searching for homes last year.
AVERAGE DAYS ON MARKET
Showing Waterfront Data Over The Last
AVERAGE PRICE PER SQ. FT.
Single-Family
TOP THREE WATERFRONT SALES IN 2023
1 2 3
2005 E Lake Sammamish Pl SE, Sammamish
MLS #2067611 | $7,000,000
3607 E Lake Sammamish Shore Ln NE, Sammamish
MLS #2168606 | $6,700,000
181 E Lake Sammamish Pkwy SE, Sammamish MLS #1951751 | $6,400,000
CLOSED SALES IN 2023 Single-Family
22
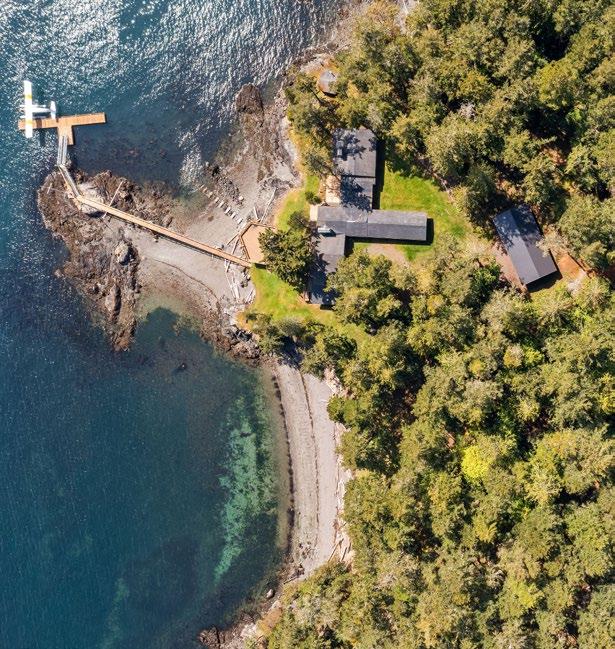
Boasting some of the most quintessential Pacific Northwest waterfront views, opportunities, and scenery, a home on one of the many idyllic islands that comprise the San Juan Islands remains a major goal for many buyers. This is evidenced by the significant year-over-year increase in median sales price, leaping a notable 42.44% from $1,537,500 to $2,190,000 in San Juan County, proving that even during a year where many buyers paused their home-buying plans due to high interest rates and low inventory, the islands fared well and continued to beckon buyers to their iconic shorelines. One of the largest appeals of purchasing on one of the islands is the sheer amount of waterfront land you can own, with an average of 430 linear feet in 2023. The waterfront market is a large portion of the total market in this county, making up 21.24% of total sales.
MEDIAN SALES PRICE
Single-Family
↑(42.44%)
AVERAGE LINEAR WATERFRONT FOOTAGE
Single-Family Homes
AVERAGE DAYS ON MARKET
Showing
AVERAGE PRICE PER SQ. FT.
Single-Family Homes ↑(1.32%)
TOP THREE WATERFRONT SALES IN 2023
1 2 3
Lot #2, Henry Island
MLS #1966524 | $14,253,850
158 Maddie Ln, Orcas Island
MLS #2049449 | $6,000,000
209 Driftwood Dr, Blakely Island MLS #2069499 | $5,550,000
CLOSED SALES IN 2023
Single-Family Homes
48
It’s interesting that floating homes seem quintessentially “Seattle” when they only accounted for less than half of a percent of the total sales in the city in 2023. Rare, unique, and for the homeowner who believes being near the water isn’t enough when they could be on the water, Seattle floating homes range from quaint and cozy to luxurious and grand. This market saw major price growth in 2023 with the largest increase in median sales prices out of all the communities analyzed in our reporting, increasing 60.94% from $742,500 in 2022 to $1,195,000 in 2023. There was price growth in the average price per square foot but not nearly as much, increasing from $1,140 to $1,245. Given the niche nature of this market, it is not uncommon for these homes to sit on the market longer than more widely appealing properties, with 2023 showing an average of 53 days on market.
MEDIAN SALES PRICE
Single-Family Homes ↑(60.94%)
AVERAGE DAYS ON MARKET
Showing Waterfront Data Over The Last Three Years
AVERAGE PRICE PER SQ. FT.
TOP THREE WATERFRONT SALES IN 2023
1
2
3 LAKE UNION
3010 Fuhrman Ave E, Seattle
MLS #2034213 | $5,825,000
2017 Fairview Ave E #G, Seattle*
MLS #2057451 | $4,260,000
2821 Fairview Ave E #1, Seattle
#2064645 | $3,878,000
CLOSED SALES IN 2023
Single-Family Homes
5,939
The real estate market was challenged by high interest rates and a lack of inventory with both buyers and sellers hesitant to make moves amid the obstacles, and Sequim’s waterfront market did not escape from the overall market downtown. There was minimal year-over-year decrease in the average price per square foot, declining 5.7% from 554 to $523, but the real change from 2022 to 2023 is seen within the median sales price with a sizable 44.02% decrease from 2022’s median of $1,270,000 to 2023’s median of $711,000. It should be noted that with only 7 waterfront sales last year (accounting for 2.06% of the total 340 sales in Sequim) this is a smaller pool of data, and any changes in sold prices year over year make a significant difference in our statistical analysis. Second only to Camano Island for the lowest top sales price, Sequim remains one of the more affordable communities to purchase a waterfront property.
MEDIAN SALES PRICE
Single-Family
AVERAGE LINEAR WATERFRONT FOOTAGE
Single-Family
AVERAGE DAYS ON MARKET
Showing Waterfront Data Over The Last Three Years
AVERAGE PRICE PER SQ. FT.
Single-Family
TOP THREE WATERFRONT SALES IN 2023
1 2 3
213 Mariners Point Rd, Sequim MLS #1994125 | $1,950,000
100 Jamestown Beach Ln, Sequim
MLS #2148944 | $1,180,000
61 Three Crabs Rd, Sequim MLS #2037869 | $772,000
CLOSED SALES IN 2023
Single-Family Homes
7
The West Seattle waterfront home market did not see the price growth that other waterfront communities in the region did, but with just a 10.12% decrease from $2,470,000 to $2,220,000, the percentage of change was more minimal than it was in other nearby areas, like Ballard and Magnolia or further east in Kirkland. Those who purchased their homes in this area in 2023 received less water frontage—at an average of 45 linear feet—than those who purchased in 2022, at an average of 58 linear feet. However, as with any in-city residence, the amount of land, waterfront or otherwise, will typically be less than outside of the city where the population is sparser and opportunities for large lots are more readily available. Although sellers had to practice patience, the average days on market in West Seattle was lower—at 35 days— than it was in other waterfront markets.
MEDIAN SALES PRICE
Single-Family Homes ↓(10.12%)
LINEAR WATERFRONT FOOTAGE
AVERAGE DAYS ON MARKET Showing Waterfront Data Over The Last Three Years
THREE WATERFRONT SALES IN 2023 1 2 3
3001 Alki Ave SW, Seattle MLS #2166211 | $3,900,000
5617 Beach Dr SW, Seattle MLS #2137229 | $3,550,000
5049 Beach Dr SW, Seattle MLS #2127327 | $3,300,000
IN 2023 Single-Family
These local definitions will not only familiarize you with waterfront terminology but also provide quick access tools to research waterfront properties in depth. Here is a helpful resource for commonly used terms related to waterfront real estate.
A broad inlet of the sea where the land curves inward.
A structure at the edge of the water used to house boats.
A wall that separates a property from the water; in some cases, property owners are responsible for maintaining the bulkheads.
An anchored float serving as a navigation mark to show reefs or other hazards, or for mooring.
Of or located near a coast.
A small, sheltered bay.
Logs lost from towed rafts or other wood debris which becomes lodged in the seafloor.
A usually wooden pier used as a landing place or moorage for boats.
A floating residence constructed according to city code and connected to city sewer, water, and electricity; usually located in a co-op-owned or condo slip.
The part of a shore between high and low water marks or between the water and cultivated or developed land.
A strip or extent of land abutting water; the boundary between the water and land fronting on and providing access to a watercourse, bay or lake.
A place on the coast where vessels may find shelter, especially one protected from rough water by piers, jetties, and other artificial structures.
No access to the water and located on a cliff or steep slope, deep water below with dramatic views.
A barge designed and equipped for use as a dwelling.
A landing stage or small pier at which boats can dock or be moored.
The land along the edge of a lake.
Zone or nearshore, the part of a sea, lake, or river that is close to the shore, extending from the high water mark, which is rarely inundated, to shoreline areas that are permanently submerged; often refers to the rights and privileges that are incidental to owning property on the shore of sea or a lake.
Easy access by a small flight of stairs or an easy climb, many low banks have pocket beaches with docks.
Access to the water with option of watching from above, sometimes access is tide dependent.
Any permanent structure to which a vessel may be secured; a place where a boat or ship is moored.
Smooth transition to the beach and directly into the water; often referred to as beach front.
Not affected by tides.
The land that borders the ocean.
A platform supported on pillars or girders leading out from the shore into a body of water, used as a landing stage for boats.
Heavy stakes or posts installed to support a structure, often found in waterfront properties.
A beach that is owned by a person, a group of people, or a company; the beach is not accessible to the general public.
Private dock or slip to moor a boat.
Shoreline protection is intended to decrease or eliminate coastal erosion; protection involves the construction of engineered structures or techniques that slow erosion.
Relating or situated on the banks of a river; often refers to rights and privileges that are incidental to the ownership fronting on a body of water.
Seawater and things found in saltwater, living in the sea.
Shared beach access from multiple properties.
Shared dock where more than one property can moor their boats.
The line alongside a large body of water where it meets the land.
A designated docking boat space that is protected on three sides.
An inlet linked to the ocean by a strait; the Puget Sound is linked to the ocean by the Strait of Juan De Fuca, Seattle is situated on its eastern shore.
A narrow passage of water connecting two seas or two other large areas of water.
Relating or affected by tides.
Land submerged during high tide.
Land above water at a normal low tide.
An isolated pocket of seawater found where the ocean meets the land and is usually packed with sea life.
Waterfront lands located above the highwater mark.
A pleasing view, especially one seen through a long, narrow opening.
Accessible from property by small beach or stairs.
Water is viewable from the property.
A level quayside area to which a ship may be moored to load and unload.