( This page intentionally left blank )

( This page intentionally left blank )
State of Utah
FOR THE FISCAL YEAR ENDED JUNE 30, 20 2 2
CERTIFICATE
INDEPENDENT AUDITOR’S REPORT
BASIC FINANCIAL STATEMENTS 35
Government-wide Financial Statements
Statement of Net Position 37
Statement of Activities 38
Governmental Funds Financial Statements
Balance Sheet – Governmental Funds 40
Reconciliation of the Balance Sheet – Governmental Funds to the Statement of Net Position ................... 41
Statement of Revenues, Expenditures, and Changes in Fund Balances – Governmental Funds 42
Reconciliation of the Statement of Revenues, Expenditures, and Changes in Fund Balances – Governmental Funds to the Statement of Activities 43
Statement of Revenues, Expenditures, and Changes in Fund Balances –Budget and Actual – General Fund ........................................................................................................ 44
Statement of Revenues, Expenditures, and Changes in Fund Balances –Budget and Actual – Redevelopment Agency of Riverton City .............................................................. 46
Statement of Revenues, Expenditures, and Changes in Fund Balances –Budget and Actual – Riverton Law Enforcement Service Area .............................................................. 47
Proprietary Funds Financial Statements
Statement of Net Position – Proprietary Funds 50
Statement of Revenues, Expenses, and Changes in Net Position – Proprietary Funds ................................ 52
Statement of Cash Flows – Proprietary Funds 53
Notes to the Financial Statements
Note 1 – Summary of Significant Accounting Policies 54
Note 2 – Stewardship, Compliance, and Accountability 60
Note 16 – Riverton Law Enforcement Service Area 78
REQUIRED SUPPLEMENTARY INFORMATION ............................................................................................ ......................... 80
Schedule of the Proportionate Share of the Net Pension Liability ................................................................... 80
Schedule of Contributions .................................................................................................... ............................ 83 Notes to the Required Supplementary Information ............................................................................... ......... 84
SUPPLEMENTARY SECTION ......................................................................................................... ....................................... 85
Combining Balance Sheet – Nonmajor Governmental Funds ....................................................................... 85
Combining Statement of Revenues, Expenditures, and Changes in Fund Balances –
Nonmajor Governmental Funds ................................................................................................. ........... 86
Schedule of Revenues, Expenditures, and Changes in Fund Balances –
Major Capital Projects Fund – REDIIF – Budget and Actual ................................................................... 87
Schedule of Revenues, Expenditures, and Changes in Fund Balances –
Major Capital Projects Fund – Capital Improvements Grants – Budget and Actual .............................. 88
Schedule of Revenues, Expenditures, and Changes in Fund Balances –
Nonmajor Capital Projects Fund – Community Impact Parks – Budget and Actual .............................. 88
Schedule of Revenues, Expenditures, and Changes in Fund Balances –
Nonmajor Capital Projects Fund – Community Impact Fire – Budget and Actual ................................. 89
Schedule of Revenues, Expenditures, and Changes in Fund Balances –
Nonmajor Capital Projects Fund – Community Impact Stormwater – Budget and Actual .................... 90
Schedule of Revenues, Expenditures, and Changes in Fund Balances –
Nonmajor Capital Projects Fund – Community Impact Roads – Budget and Actual ............................. 91 Schedule of Revenues, Expenditures, and Changes in Fund Balances –
Nonmajor Capital Projects Fund – Capital Improvements – Budget and Actual ................................... 92
Schedule of Revenues, Expenditures, and Changes in Fund Balances –
Nonmajor Capital Projects Fund – Capital Improvements – Stormwater – Budget and Actual ............ 93 Schedule of Revenues, Expenditures, and Changes in Fund Balances –
Nonmajor Capital Projects Fund – Capital Improvements – First Class Roads – Budget and Actual ..... 94
Schedule of Revenues, Expenditures, and Changes in Fund Balances –Component Unit – Riverton Fire Service Area – Budget and Actual...................................................... 95
DEBT CAPACITY 119
Ratios of Outstanding Debt by Type 119
Ratios of General Bonded Debt Outstanding.............................................................................................. 120
Direct and Overlapping Governmental Activities Debt 121
Legal Debt Margin Information 122
Pledged Revenue Coverage 123
DEMOGRAPHIC AND ECONOMIC INFORMATION 124
Demographic and Economic Indicators ...................................................................................................... 124
Principal Employers 125
OPERATING INFORMATION 126
Full–Time Equivalent Employees by Function/Program – Government–wide ........................................... 126
Operating Indicators by Function/Program 127
Capital Asset Statistics by Function/Program 128


( This page intentionally left blank )
Presented to Riverton City Utah
For its Annual Comprehensive Financial Report For the Fiscal Year Ended June 30, 2021
Executive Director/CEO
 Government Finance Officers Association
Trent Staggs, Mayor
Sheldon Stewart, Councilmember
Troy McDougal, Councilmember
Tawnee McCay, Councilmember
Tish Buroker, Councilmember Claude Wells, Councilmember
December 13, 2022
To the Mayor, City Council, and Residents of Riverton,
The Annual Comprehensive Financial Report (hereafter using then new acronym “ACFR”) of the City of Riverton for the fiscal year ended June 30, 2022, is hereby submitted. State law requires that all local governments publish, within 180 days of the close of each fiscal year, a complete set of financial statements presented in conformity with Generally Accepted Accounting Principles (GAAP) and audited in accordance with Generally Accepted Auditing Standards (GAAS) by a firm of licensed certified public accountants.

This year’s ACFR has been prepared by the City’s Administrative Services Department. Management assumes full responsibility for the completeness and accuracy of the information presented in this report. To provide a reasonable basis for making these representations, management of the City of Riverton has established a comprehensive internal control framework that is designed both to protect the government’s assets and to compile accurate and reliable information for the preparation of the City’s financial statements in conformity with GAAP. Because the cost of internal control should not exceed anticipated benefits, the objective is to provide reasonable, rather than absolute, assurance that the financial statements are free of any material misstatements. The Administrative Services Department asserts, to the best of its knowledge and belief, this financial report is complete and reliable in all material respects.
HBME, LLC, a firm of certified public accountants, has audited Riverton City’s financial statements. The goal of the independent audit was to provide reasonable assurance that the City’s financial statements, for the fiscal year ended June 30, 2022, were free of material misstatement. The independent audit involved examining, on a test basis, evidence supporting the amounts and disclosures in the financial statements, assessing the accounting principles used and significant estimates made by management, and evaluating the overall financial statement presentation.
The independent auditors concluded, based upon the audit, that there was a reasonable basis for rendering an unmodified opinion that the City’s financial statements for the fiscal year ended June 30, 2022, were fairly presented in conformity with GAAP. The independent auditor’s report is included as the first component of the financial section of the ACFR.
GAAP requires that management provide a narrative introduction, overview, and analysis to accompany the basic financial statements in the form of Management’s Discussion and Analysis (MD&A). This letter of transmittal is designed to complement the MD&A and should be read in conjunction with it. The City’s MD&A can be found immediately following the Independent Auditor’s Report.
Riverton was incorporated as a City of the Third Class on July 3, 1967. The City is governed using a six-member council form of government, which means there are six elected officials that make up the governing body; a mayor and five council members. Legislative powers are vested in the five-member Council, while executive powers lie with the Mayor. The Mayor is elected to serve the citizens at large; the Council Members are elected by voting districts. All elected officials serve four–year terms, which are staggered every two years (three Council seats in one election, two Council seats and the Mayor in the next election). The City Manager, employed by city ordinance and reporting directly to the Mayor and City Council, oversees the day–to–day operations and employees of the City. The City Manager and Department Heads comprise the executive staff, which recommends priorities to the Mayor and Council.
The City provides a full range of services to its residents and businesses. General governmental services provided by the City include public safety, building inspection, construction and maintenance of street lighting, construction and maintenance of stormwater distribution lines, roadways, and parks, as well as recreation and cultural events. The City provides culinary water, secondary water, and sanitation utility services. The boundaries of the city cover 12.6 square miles with a population of 45,285 with a potential for approximately 55,000 at build-out.
Citizens, families, businesses, and leaders unite in building a prosperous city with a strong sense of community.
Riverton City provides essential services that enhance the quality of life and sense of community for all citizens. We foster an atmosphere of service and collaboration, generating positive citizen involvement and innovative solutions. We strive to be responsible stewards of public funds and property and act with integrity as we meet the needs of the community.
The following organizational values have been established to guide Riverton City elected officials and employees as they conduct the business of the city government and interact with the public.
Integrity – We are honest in our endeavors and ethical in our actions.
Innovation – We strive to always find the best solution.
Stewardship – We take pride in what we do and in our care of public resources.
Collaboration – We find ways to work together within our city and in the extended community. Service – We serve the community, striving to fulfill our duties with integrity.
Objective 1.1: Maintain a strong sense of community.
Continue to offer, and look for opportunities to improve, a variety of events to ensure the community has opportunities to gather.
Maintain events that promote a sense of patriotism, including Town Days, Veterans Day Program, Wreaths Across America, etc.
Provide and encourage volunteer opportunities.
Continually develop and foster a sense of community pride.
Objective 1.2: Maintain a visible public safety presence and increase citizen engagement.
Maintain appropriate police department staffing levels to ensure timely response to community concerns, measured by relevant and objective metrics.
Ensure the continued visible presence of the police department through active participation in community and neighborhood events.
Prioritize the continued deployment of full-time school resource officers in all public middle schools and high schools in the city.
Objective 1.3: Actively engage and inform residents.
Ensure resident volunteer committees meet on a quarterly basis at minimum and present in a city council meeting once per year.
Continue to expand digital communications efforts.
Disseminate information proactively to educate the public on issues important to the city.
Objective 2.1: Expand, improve, and maintain an active transportation system.
Identify locations to add or expand public trails as well as funding sources for those trails. Explore the feasibility of using canal roads as part of a public trail system and determine the willingness of canal companies to allow their roads to be used for such a purpose.
Identify and map areas in the city that should have sidewalks that don’t currently have them.
Objective 2.2: Properly develop city infrastructure and facilities.
Develop a plan and identify funding sources for a pedestrian bridge near the Welby Jacobs Canal to cross 13400 S.
Identify ways to improve east-west connectivity.
Properly plan for and develop two public parks in the SLR project area.
Explore the viability and cost of improving the Welby Jacobs Canal reservoir into an amenity.
Objective 2.3: Enhance the digital infrastructure of the city.
Increase the number of choices for residential broadband access.
Connect city assets via a private network using ARP funds.
Objective 3.1: Develop a proactive economic development strategy.
Explore the viability and benefits of having a dedicated economic development resource for the city.
Identify areas of the city that can be developed or redeveloped that will broaden sales tax base.
Move sales tax revenue from $10 million to $15 million over the next four years.
Objective 3.2: Attract and recruit businesses to the community.
Incentivize businesses who are large sales tax generators to the city to help minimize the fee and tax burden for residents.
Attract additional sit-down restaurants to the city.
Assist potential businesses with site selection.
Objective 3.3: Enhance the Riverton Town Center area.
Finalize interlocal taxing agreements for the CRAs in the Town Center area.
Complete projects within the next four years in the CRA areas.
Identify opportunities for redevelopment in the Town Center area.
Objective 4.1: Improve and expand the city’s water resources and systems.
Increase the city’s water supply by re-engaging the Green Well, making the city less reliant on the Conservancy District.
Identify funding and install meters on all remaining irrigation water connections that don’t have a meter and promote water conservation.
Purchase enough Welby Jacob Canal water shares to support city needs through build out.
Continually improve the pressurization and filtration of the secondary irrigation water system.
Analyze the quality and age of core water infrastructure and prioritize replacement projects based on need.
Objective 4.2: Remain fiscally responsible and ensure that services are sustainable into the future.
Develop a 5-year, long-range fiscal plan that includes the prioritization and financial implications of specific projects.
Maintain a General Fund balance of at least 20% of revenues.
Work toward saving 180 days cash on hand for enterprise funds with capital assets.
Maintain a 10% fund balance for the Riverton Law Enforcement Service Area and Riverton Fire Service Area.
Consistently budget to lower the debt per capita each year so the city can ultimately become debt free.
Budget 50% of all unprojected net revenue in the General Fund toward lowering callable debt.
Compare bids for sanitation services from external providers to the cost of self-providing sanitation services.
Objective 4.3: Properly plan for the future to ensure the long-term stewardship of city property and facilities.
Ensure city streets, parks, and facilities are properly maintained, using a rating system when possible, and budget accordingly.
Estimate the upfront and ongoing fiscal impact for capital projects.
Because of its prime location between major transportation systems, Riverton City continues to attract the attention of retailers and commercial businesses resulting in a strong and growing sales tax base. Riverton’s sales tax base is becoming more diversified, although the City’s sales tax revenue is still primarily generated by the general retail sector.
Phase 1 of an upscale, mixed-use development was completed in June of 2018, between the Bangerter Highway and the Mountain View Corridor on the City’s west side. The project, Mountain View Village, is being constructed by CenterCal Properties, LLC and includes a vibrant collection of tenants including: grocery stores, restaurants, coffee shops, day care, and other retail shops. The design and aesthetic characteristics of Mountain View Village will make it a destination for the entire region. Phase 2 opened in July 2022, and Phase 3, the final phase, is not far behind. Multiple residential developments surrounding this project area are currently under construction. These projects will bring an additional one thousand plus units. Additionally, just north of the Mountain View Village project is a Costco Wholesale that opened its doors in May 2022.
In the City’s downtown area, over three hundred residential units have recently been completed, or are under construction. The growth in residential population, along with new commercial development, continues to meet the Council’s strategic goal to revitalize this area. Revitalization efforts have greatly increased the potential for higher sales tax revenue from stores and restaurants.
The City continues to improve and upgrade infrastructure including roadways, culinary water, secondary water, and stormwater systems, as well as making improvements to parks and open space. Good infrastructure is a key foundation for a bright economic future.
The City has adopted long-term financial plans for all infrastructure systems including roadways, culinary, and secondary water systems, storm water, and parks. These plans are reviewed annually and updated as needed. Besides infrastructure plans, at the beginning of each calendar year, the City Council holds planning sessions as a kick-off to the budget season for the ensuing fiscal year. The long-range plan is based on the City’s Vision, Mission, and Strategic Themes.
The priorities of the Council, communicated through the Vision, Mission and Strategic Themes, become the catalyst for capital projects and other expenditures for the upcoming budget. The strategic plan is truly a performance-based approach to budgeting and long-term planning. City staff is charged with the duty to report back to the Council and citizens at the end of the year regarding which items have been completed or need to be moved forward to future budget years.
The Government Finance Officers Association of the United States and Canada (GFOA) awarded a Certificate of Achievement for Excellence in Financial Reporting to Riverton City for its Annual Comprehensive Financial Report (ACFR) for the fiscal year ended June 30, 2021. In order to be awarded a Certificate of Achievement, a government must publish an easily readable and efficiently organized ACFR. This report must satisfy both GAAP and applicable legal requirements. A Certificate of Achievement is valid for a period of one year only.

Riverton City also received the Award for Outstanding Achievement for its Popular Annual Financial Report (PAFR) for the fiscal year ended June 30, 2021. The PAFR is designed to meet the needs of interested parties who may be unable or unwilling to use traditional financial reports. The City believes its fiscal year 2022 ACFR and PAFR continue to meet the Certificate of Achievement Program requirements and will submit both reports to the GFOA for consideration.
The preparation of these reports on a timely basis could not have been accomplished without the efficient and dedicated service of the Administrative Services Department. Each member of the department has our genuine appreciation for the contributions made in the preparation of these reports. In closing, we express our sincere thanks and appreciation to members of the City Council and o ur Mayor, Trent Staggs, for their dedication to the City of Riverton and their leadership and support of City staff.
Sincerely,
Kevin Hicks City Manager Administrative Services Director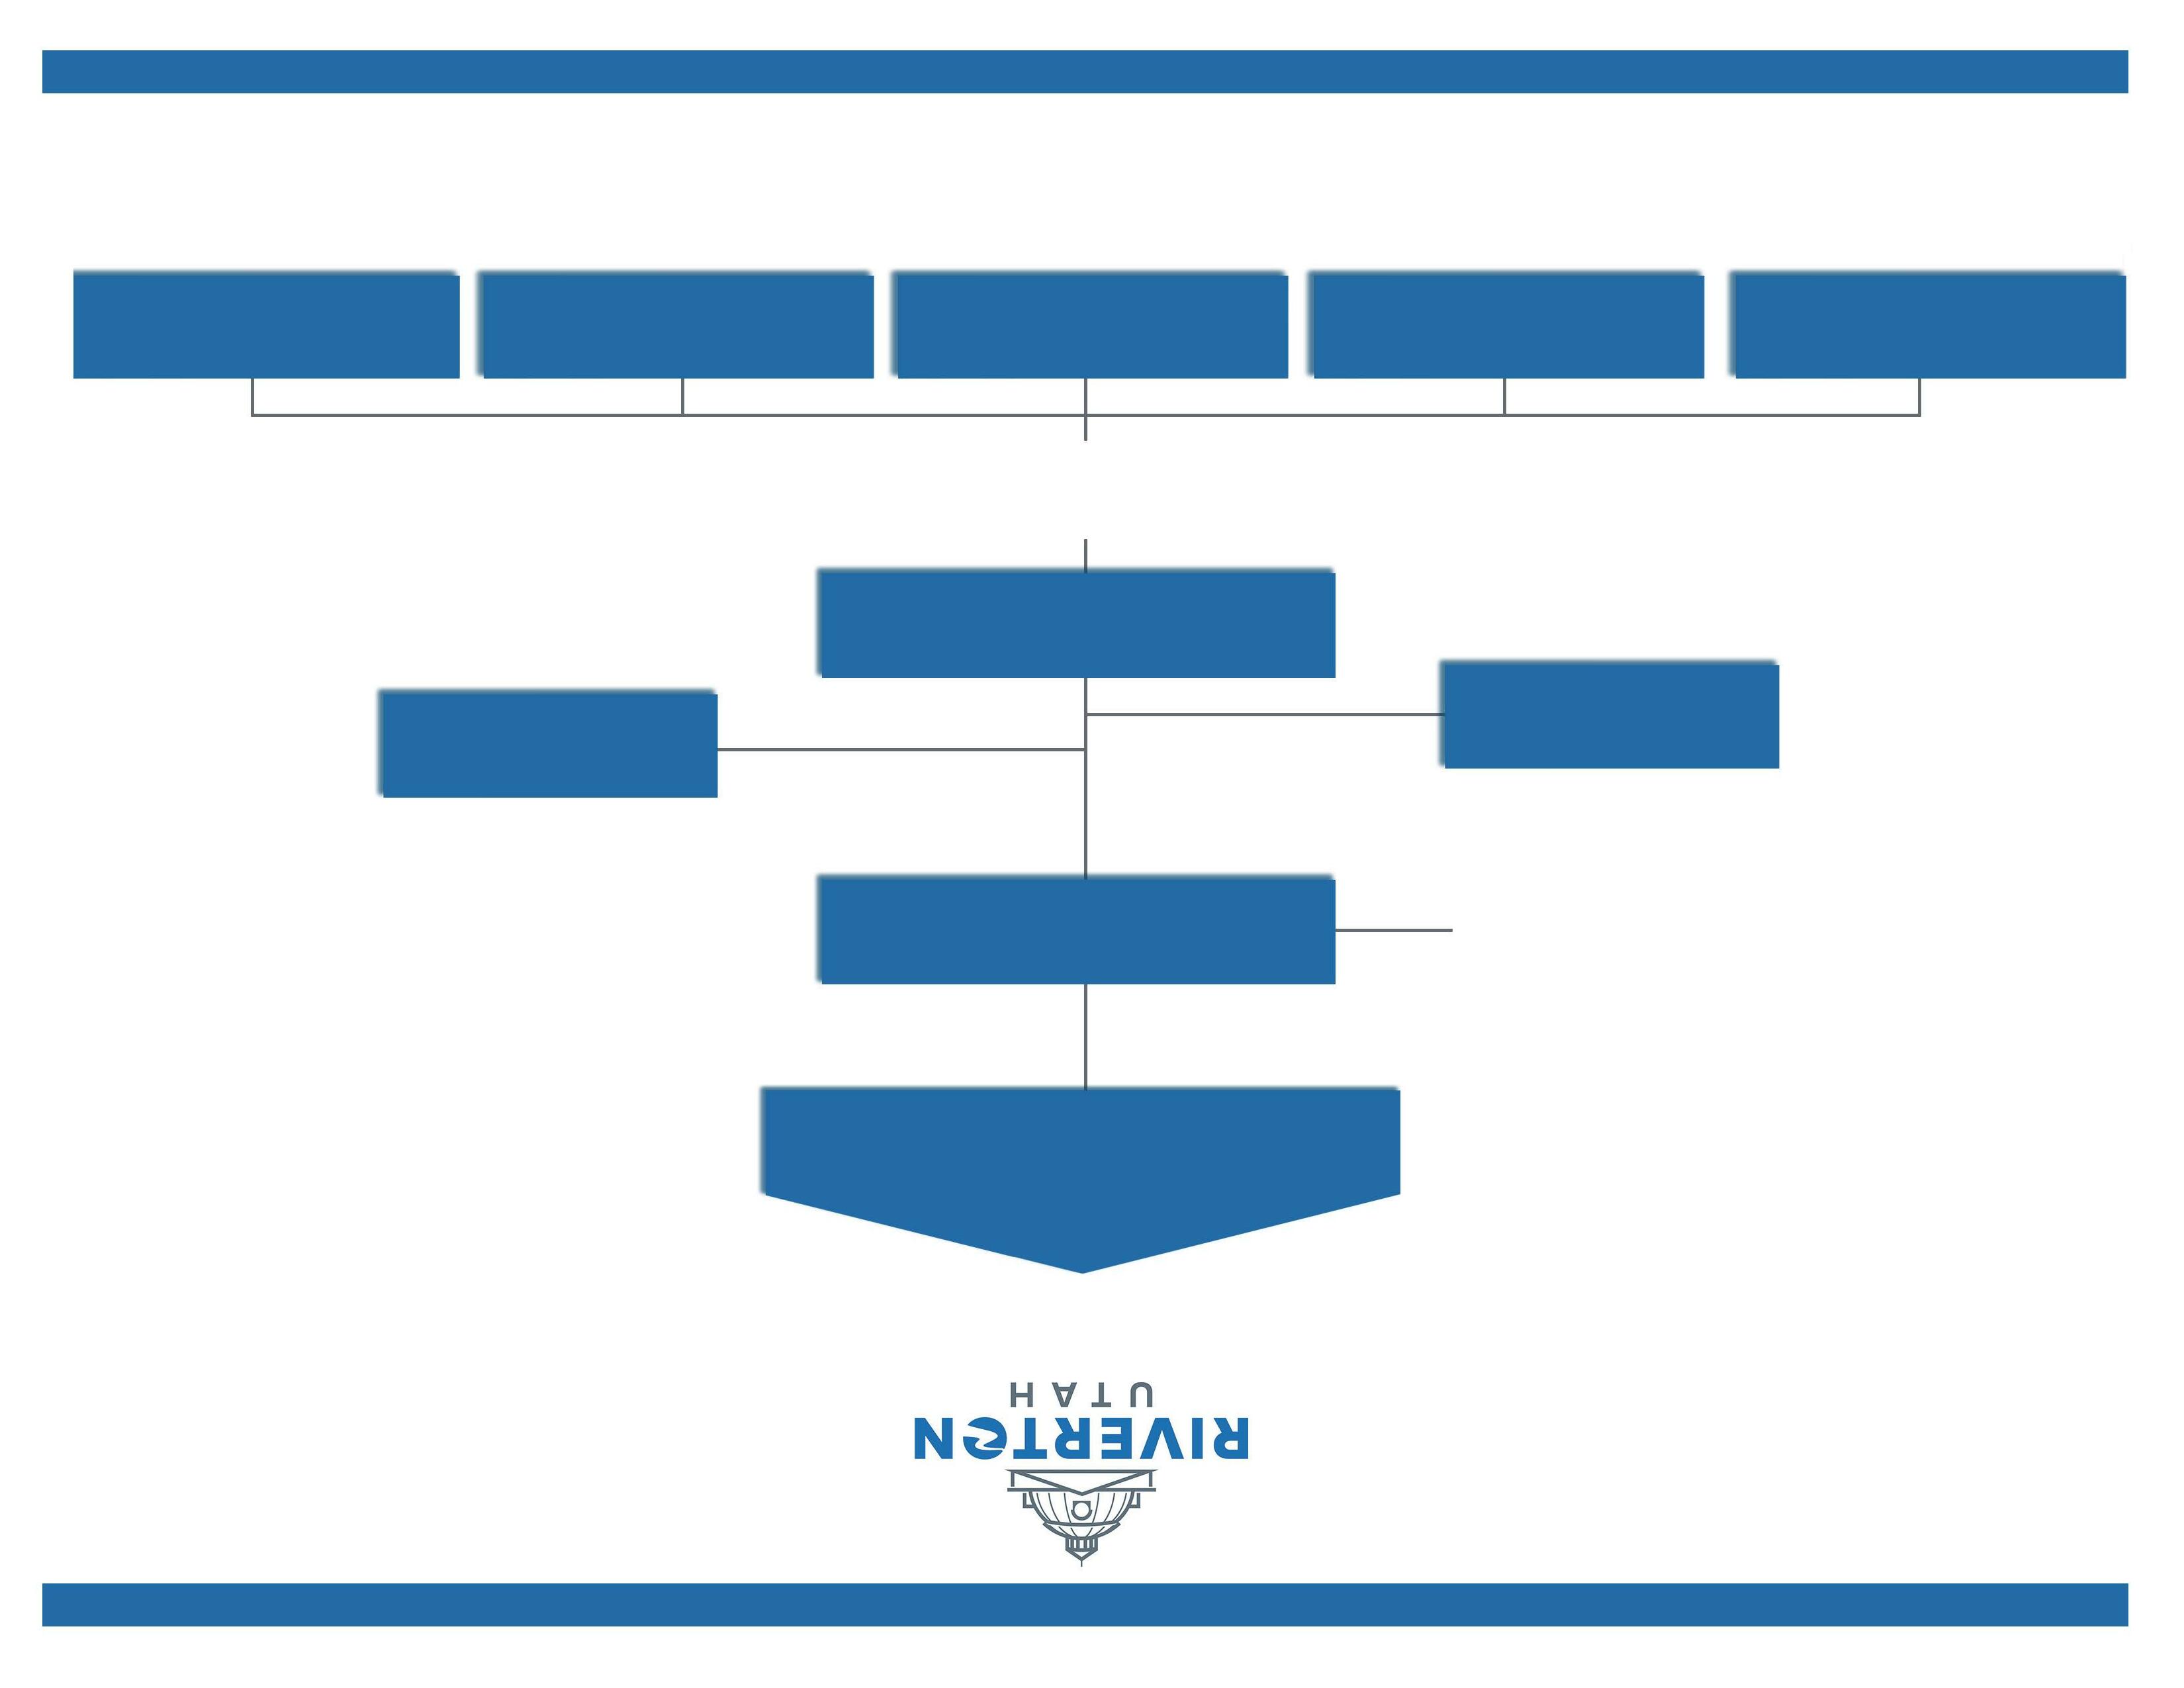


Introductory Section – Elected and Appointed
Mayor Trent Staggs
District 1 Council Member
Sheldon Stewart
District 2 Council Member Troy McDougal
District 3 Council Member
District 4 Council Member
Tawnee McCay
Tish Buroker
District 5 Council Member Claude Wells
City Manager David R. Brickey
Chief of Police
City Attorney
Hutson
Ryan Carter
Communications Director Casey Saxton
Development Services Director ...............Jason Lethbridge
Events and Operations Director Sheril Garn
Public Works Director
Cary Necaise
Administrative Services Director ......................Kevin Hicks

City Engineer Matthew Cassell
City Recorder
Jamie Larsen
City Treasurer Jiny Proctor
Justice Court Judge .......... Christopher G. Bown


( This page intentionally left blank )
E.LYNN HANSEN, CPA
CLARKE R. BRADSHAW, CPA
GARY E. MALMROSE, CPA
EDWIN L. ERICKSON, CPA
MICHAEL L. SMITH, CPA
JASON L. TANNER, CPA
ROBERT D. WOOD, CPA
AARON R. HIXSON, CPA
TED C. GARDINER, CPA
JEFFREY B. MILES, CPA
SHAWN F. MARTIN, CPA
COMMITTED. EXPERIENCED. TRUSTED
Honorable Mayor and Members of the City Council Riverton City Corporation, Utah
We have audited the financial statements of the governmental activities, the business-type activities, each major fund, and the aggregate remaining fund information of Riverton City Corporation, Utah (the City), as of and for the year ended June 30, 2022, and the related notes to the financial statements, which collectively comprise the City’s basic financial statements as listed in the table of contents.
In our opinion, the accompanying financial statements present fairly, in all material respects, the respective financial position of the governmental activities, the business-type activities, each major fund, and the aggregate remaining fund information of Riverton City Corporation, Utah, as of June 30, 2022, and the respective changes in financial position and, where applicable, cash flows thereof for the year then ended in accordance with accounting principles generally accepted in the United States of America.
We conducted our audit in accordance with auditing standards generally accepted in the United States of America (GAAS) and the standards applicable to financial audits contained in Government Auditing Standards, issued by the Comptroller General of the United States. Our responsibilities under those standards are further described in the Auditor’s Responsibilities for the Audit of the Financial Statements section of our report. We are required to be independent of the City and to meet our other ethical responsibilities, in accordance with the relevant ethical requirements relating to our audit. We believe that the audit evidence we have obtained is sufficient and appropriate to provide a basis for our audit opinions.
The City’s management is responsible for the preparation and fair presentation of the financial statements in accordance with accounting principles generally accepted in the United States of America, and for the design, implementation, and maintenance of internal control relevant to the preparation and fair presentation of financial statements that are free from material misstatement, whether due to fraud or error.
In preparing the financial statements, management is required to evaluate whether there are conditions or events, considered in the aggregate, that raise substantial doubt about the City’s ability to continue as a going concern for one year after the date that the financial statements are issued.
Our objectives are to obtain reasonable assurance about whether the financial statements as a whole are free from material misstatement, whether due to fraud or error, and to issue an auditor’s report that includes our opinions. Reasonable assurance is a high level of assurance but is not absolute assurance and therefore is not a guarantee that an audit conducted in accordance with GAAS will always detect a material misstatement when it exists. The risk of not detecting a material misstatement resulting from fraud is higher than for one resulting from error, as fraud may involve collusion, forgery, intentional omissions, misrepresentations, or the override of internal control. Misstatements are considered material if there is a substantial likelihood that, individually or in the aggregate, they would influence the judgment made by a reasonable user based on the financial statements.
In performing an audit in accordance with GAAS, we:
• Exercise professional judgment and maintain professional skepticism throughout the audit.
• Identify and assess the risks of material misstatement of the financial statements, whether due to fraud or error, and design and perform audit procedures responsive to those risks. Such procedures include examining, on a test basis, evidence regarding the amounts and disclosures in the financial statements.
• Obtain an understanding of internal control relevant to the audit in order to design audit procedures that are appropriate in the circumstances, but not for the purpose of expressing an opinion on the effectiveness of the City’s internal control. Accordingly, no such opinion is expressed.
• Evaluate the appropriateness of accounting policies used and the reasonableness of significant accounting estimates made by management, as well as evaluate the overall presentation of the financial statements.
• Conclude whether, in our judgment, there are conditions or events, considered in the aggregate, that raise substantial doubt about the City’s ability to continue as a going concern for a reasonable period of time.
We are required to communicate with those charged with governance regarding, among other matters, the planned scope and timing of the audit, significant audit findings, and certain internal control–related matters that we identified during the audit.
Accounting principles generally accepted in the United States of America require that the management’s discussion and analysis on pages 24-33 and pension schedules on pages 80-84 be presented to supplement the basic financial statements. Such information is the responsibility of management and, although not a part of the basic financial statements, is required by the Governmental Accounting Standards Board who considers it to be an essential part of financial reporting for placing the basic financial statements in an appropriate operational, economic, or historical context. We have applied certain limited procedures to the required supplementary information in accordance with auditing standards generally accepted in the United States of America, which consisted of inquiries of management about the methods of preparing the information and comparing the information for consistency with management’s responses to our inquiries, the basic financial statements, and other knowledge we obtained during our audit of the basic financial statements. We do not express an opinion or provide any assurance on the information because the limited procedures do not provide us with sufficient evidence to express an opinion or provide any assurance.
Our audit was conducted for the purpose of forming opinions on the financial statements that collectively comprise the City’s basic financial statements. The accompanying combining and individual non-major fund financial statements and budgetary comparison information are presented for purposes of additional analysis and are not a required part of the basic financial statements.
The combining and individual non-major fund financial statements and budgetary comparison information are the responsibility of management and was derived from and relates directly to the underlying accounting and other records used to prepare the basic financial statements. Such information has been subjected to the auditing procedures applied in the audit of the basic financial statements and certain additional procedures, including comparing and reconciling such information directly to the underlying accounting and other records used to prepare the basic financial statements or to the basic financial statements themselves, and other additional procedures in accordance with auditing standards generally accepted in the United States of America. In our opinion, the information is fairly stated, in all material respects, in relation to the basic financial statements as a whole.
Management is responsible for the other information included in the annual report. The other information comprises the introductory and statistical sections but does not include the financial statements and our auditor's report thereon. Our opinions on the financial statements do not cover the other information, and we do not express an opinion or any form of assurance thereon. In connection with our audit of the financial statements, our responsibility is to read the other information and consider whether a material inconsistency exists between the other information and the financial statements, or the other information otherwise appears to be materially misstated. If, based on the work performed, we conclude that an uncorrected material misstatement of the other information exists, we are required to describe it in our report.
In accordance with Government Auditing Standards, we have also issued our report dated November 30, 2022 on our consideration of the City’s internal control over financial reporting and on our tests of its compliance with certain provisions of laws, regulations, contracts, and grant agreements and other matters. The purpose of that report is solely to describe the scope of our testing of internal control over financial reporting and compliance and the results of that testing, and not to provide an opinion on the effectiveness of internal control over financial reporting or on compliance. That report is an integral part of an audit performed in accordance with Government Auditing Standards in considering the City’s internal control over financial reporting and compliance.
November 30, 2022
As management of Riverton City Corporation (the City), we offer readers of the City's financial statements this narrative overview and analysis of the financial activities of the City for the fiscal year ended June 30, 2022. We encourage readers to consider the information presented here in conjunction with additional information that we have furnished in our letter of transmittal.
The assets plus deferred outflows of the City exceeded its liabilities plus deferred inflows at the close of 2022 by $316.6 million. Of this amount, unrestricted net position of $32.6 million is available to meet the City’s ongoing obligations to citizens and creditors.
The 2022 increase in net position for governmental activities of $33.3 million consisted of net program expenses of $9.6 million, transfers-in of $22.1 million, and general revenues of $20.8 million. For 2021, net position for governmental activities increased $5.3 million. The increase from 2021 to 2022 was caused primarily by two specific events: 1) the elimination of the Stormwater proprietary fund and consolidating those services into the General Fund. This transfer, along with a few other transfers that will be discussed later in this document, accounted for $22.1 million; and 2) the inclusion of the Riverton Law Enforcement Service Area (RLESA) as a Special Revenue Fund within the City’s governmental activities. RLESA was previously shown as a discretely presented component unit on the City’s financial statements.
Net position for business-type activities decreased by $19.9 million in fiscal year 2022 compared with a $776 thousand increase during fiscal year 2021. Excluding the Stormwater proprietary fund transfer, mentioned in the previous bullet and to be discussed in greater detail later in this document, the business-type activities increased by $2.2 million in fiscal year 2022. The reason for the change was due to small rate increases in the remaining proprietary funds; namely the culinary water, secondary water and sanitation funds.
The City’s governmental activities revenue increased from $28.8 million in 2021 to $38.1 million in 2022. The increase of $9.3 million is the combination of four items: 1) a 13.3% year-over-year increase in sales tax revenue; 2) an increase of $1.3 million in charges for services by consolidating the Stormwater Fund into the General Fund and 3) an increase of $6.4 million in property taxes by bringing RLESA into the City as a special revenue fund.
Overall, total governmental activities program revenues increased by $1.3 million from 2021 to 2022. As is mentioned in the previous bullet, this increase is due bringing the operations of the Stormwater proprietary fund into the General Fund. Stormwater user fees were cut drastically to make room for rate increases across the remaining proprietary funds. A small user fee remained and is now included in the charges for services in the General Fund.
Governmental activities general revenues increased from $12.8 million in fiscal year 2021 to $20.8 million in fiscal year 2022. The City continues to benefit from double digit sales tax revenue increases year over year, a total increase of $1.3 million or 13.3%. In addition, the governmental activities property taxes increased $6.4 million by including RLESA as a special revenue fund. The remaining amount of governmental activities remained relatively flat.
The largest part of the $22.1 million transfers from business-type to governmental activities is consolidation of the Stormwater proprietary fund partially into the General Fund and a smaller amount to a new capital projects fund for stormwater projects. See Note No. 5 of the financial statements for additional transfer details.
The City’s business-type activities revenue decreased from $14.4 million in fiscal year 2021 to $13.5 million in fiscal year 2022. The decrease of $900 thousand is due to rate increases in the culinary, secondary, and sanitation funds and from moving the Stormwater proprietary fund to the governmental activities.
At June 30, 2022, the total fund balance for the City’s General Fund was just over $8.4 million. General Fund balance is divided into three categories: nonspendable fund balance of $159 thousand for prepaid expenditures, restricted fund balance of $1.8 million for Class C Roads, and unassigned fund balance of $6.5 million, which is an increase in unassigned fund balance of $1.3 million over 2021.
The purpose of this discussion and analysis is to introduce the City’s basic financial statements, which are comprised of three components: 1) government–wide statements, 2) fund statements, and 3) notes to the financial statements. Required supplementary information (RSI) is included with supporting notes to the RSI immediately following the basic financial statements. This report contains other supplementary information, which will help the reader to gain a more in–depth understanding of the City’s financial position.
The government–wide financial statements are designed to provide readers with a broad overview of the City’s financial position and changes in financial position, similar to consolidated financial statements in a private sector business. The statements consist of the Statement of Net Position and the Statement of Activities.
The Statement of Net Position presents information on all of Riverton City’s assets, deferred outflows, liabilities, deferred inflows, with the difference reported as net position. Over time, increases or decreases in net position provide an indication of whether the financial condition of the City is improving or deteriorating.
The Statement of Activities presents information showing how the City’s net position changed during the most recent fiscal year. All changes in net position are reported as soon as the underlying event giving rise to the change occurs, regardless of the timing of related cash flows. Thus, revenues and expenses reported in this statement for some items will result in cash flows in future fiscal periods.
Both of the government–wide financial statements distinguish functions of the City that are principally supported by taxes, charges for services, and intergovernmental revenues (governmental activities) from other functions that are intended to recover all, or a significant portion, of their costs through user fees and charges (business–type activities). The governmental activities of the City include general government, public safety, highways and public improvements, and parks and recreation. The business–type activities of the City include culinary water, secondary water, and sanitation.
The government–wide financial statements include not only the City (the primary government), but also two legally separate component units, the Redevelopment Agency of Riverton City and the Riverton Law Enforcement Service Area, for which the City is financially accountable. Financial
information for these blended component units is presented with the financial statements of the City. Both blended component units are reported as special revenue funds.
The government–wide financial statements also include a legally separate component unit, namely, the Riverton Fire Service Area. Financial information for this discretely presented component unit is displayed in a column to the right of the primary government.
The government–wide financial statements are found immediately following this discussion and analysis.
A fund is a grouping of related accounts that is used to maintain control over resources that have been segregated for specific activities or objectives. The City, like other state and local governments, uses fund accounting to ensure and demonstrate compliance with finance–related requirements. All of the City’s funds can be divided into two categories: governmental funds and proprietary funds.
Most of the City’s basic services are reported in governmental funds, which focus on how money flows through those funds and the balances left at year–end. The funds are reported using the modified accrual method of accounting, which measures cash and all other financial assets that can readily be converted to cash. The governmental funds statements present a detailed short–term view of cash, operations, and the basic services provided. Governmental funds information helps users determine whether there are adequate financial resources that can be spent in the near future to finance the City’s programs. The relationship (or differences) between governmental activities (reported in the Statement of Net Position and the Statement of Activities) and governmental activities reported in governmental funds statements is described in reconciliations, which are presented after the fund financial statements.
The City maintains twelve individual governmental funds. Information is presented separately in the governmental funds statements for the General Fund and the other major governmental funds. The nonmajor funds are combined into a single aggregated presentation. Individual fund data for each of these nonmajor governmental funds is provided in the form of combining statements immediately following the notes to the RSI.
Major governmental funds:
General Fund
Capital projects - Grants
Capital projects – Riverton Economic Development Infrastructure and Investment Fund (REDIIF)
Special revenue – Redevelopment Agency of Riverton City (RDA)
Special revenue – Riverton Law Enforcement Service Area (RLESA)
Nonmajor governmental funds:
Capital projects – community impact parks
Capital projects – community impact fire
Capital projects – community impact stormwater
Capital projects – community impact roads
Capital projects – capital improvements
Capital projects – stormwater
Capital projects – first class roads
The City maintains only one type of proprietary fund, namely enterprise funds. Enterprise funds are used to report the same functions presented as business-type activities in the government–wide financial statements.
The City maintains three individual enterprise funds. Information is presented separately in the proprietary funds Statement of Net Position and Statement of Revenues, Expenses and Changes in Fund Net Position. All proprietary funds of the City are major funds.
Major proprietary funds:
Culinary water
Secondary water
The notes provide additional information that is essential to a full understanding of the data provided in the government–wide and fund financial statements. The notes to the financial statements can be found immediately after the statements for major funds.
The Government Accounting Standards Board (GASB) released Statement No. 68, Accounting and Financial Reporting for Pensions in June of 2012. The scope of this statement addresses accounting and financial reporting for pensions that are provided to the employees of state and local governmental employers through pension plans that are administered through trusts.
The included required supplementary information (RSI) details the City’s proportionate share of the net pension liability or asset as well as the City’s pension contributions in relation to covered payroll.
In addition to the basic financial statements and accompanying notes, this report also contains other supplementary information. The combining statements, mentioned earlier, in connection with nonmajor funds are presented immediately after the notes to the RSI. Budget comparisons for governmental funds other than the General Fund, the Redevelopment Agency special revenue fund, and the RLESA special revenue fund are also included.
As noted earlier, net position may serve as a useful indicator of a government’s financial position over time. In the case of Riverton City, assets plus deferred outflows exceeded liabilities plus deferred inflows by $316.6 million at the close of fiscal 2022. By far, the largest portion of the City’s net position ($279.4 million or 88.3%) reflects its net investment in capital assets. The City uses its capital assets to provide services to residents; these assets are not available for future spending. Although the City’s investment in its capital assets is reported net of related debt, it should be noted that the resources needed to repay this debt must be provided from other sources, since the capital assets themselves cannot be used to liquidate these liabilities.
An additional portion of net position ($4.5 million or 1.4%) represents resources that are subject to external restrictions on how they may be used. The remaining balance of unrestricted net position ($32.6 million or 10.3%) may be used to meet the City’s ongoing obligations to its residents and creditors.
Governmental ActivitiesBusiness-type ActivitiesTotal Primary Government
202220212022202120222021
Current and other assets40,203,147 $ 20,345,275 $ 13,455,285 $ 17,280,989 $ 53,658,432 $ 37,626,264 $ Capital assets225,323,349 199,386,592 89,700,636 111,569,569 315,023,985 310,956,161
Total Assets265,526,496 219,731,867 103,155,921 128,850,558 368,682,417 348,582,425
Total deferred outflows of resources3,992,104 4,203,418 829,523 1,131,136 4,821,627 5,334,554
Current and other liabilities5,609,932 4,355,969 2,012,130 3,217,762 7,622,062 7,573,731 Long-term liabilities30,824,501 32,151,627 4,724,970 9,750,943 35,549,471 41,902,570
Total Liabilities36,434,433 36,507,596 6,737,100 12,968,705 43,171,533 49,476,301
Total deferred inflows of resources12,656,633 2,197,255 1,115,325 943,241 13,771,958 3,140,496
Net position
Net investment in capital assets194,917,793 169,180,336 84,500,510 103,882,481 279,418,303 273,062,817 Restricted4,540,227 2,521,841 4,835 1,713,869 4,545,062 4,235,710 Unrestricted20,969,514 13,528,257 11,627,674 10,473,398 32,597,188 24,001,655
Total Net Position220,427,534 $ 185,230,434 $ 96,133,019 $ 116,069,748 $ 316,560,553 $ 301,300,182 $
Fiscal year 2022 revenues of $51.6 million exceeded expenses of $38.2 million, resulting in an increase in net position of $13.4 million, compared with an increase in the net position of $6.1 million in fiscal year 2021. The difference in change in net position between the two years is due to double digit sales tax revenue increases year over year and by bringing the property tax revenue from RLESA into the City’s financials.
The following table provides a summary of the City’s operations for the year ended June 30, 2022.
202220212022202120222021
Revenues:
Program revenues: Charges for services3,363,860 $ 2,108,795 $ 12,662,925 $ 13,047,720 $ 16,026,785 $ 15,156,515 $ Operating grants and contributions5,539,179 9,035,715 - - 5,539,179 9,035,715
Capital grants and contributions8,417,820 4,868,995 645,544 1,180,019 9,063,364 6,049,014
General revenues:
Property taxes6,399,639 - - - 6,399,639Sales taxes11,129,036 9,851,743 - - 11,129,036 9,851,743
Franchise taxes2,579,433 2,445,976 - - 2,579,433 2,445,976 Interest income109,237 158,706 35,771 74,072 145,008 232,778 Miscellaneous321,939 265,019 37,700 80,619 359,639 345,638
Gain on dispostion of assets229,698 93,750 60,159 11,913 289,857 105,663 Gain on disposal of debt- - 47,000 - 47,000Total revenues38,089,841 28,828,699 13,489,099 14,394,343 51,578,940 43,223,042
Expenses:
General government8,472,276 6,855,654 - - 8,472,276 6,855,654 Public safety6,520,947 5,198,262 - - 6,520,947 5,198,262 Highways and public improvements6,424,373 5,443,370 - - 6,424,373 5,443,370 Parks and recreation4,185,817 4,323,736 - - 4,185,817 4,323,736
Interest on long-term debt1,325,879 1,347,313 - - 1,325,879 1,347,313
Culinary water- - 5,769,152 6,142,930 5,769,152 6,142,930 Secondary water- - 3,348,955 3,561,161 3,348,955 3,561,161 Sanitation- - 2,129,537 1,956,139 2,129,537 1,956,139 Storm water- - - 2,314,697 - 2,314,697 Total expenses26,929,292 23,168,335 11,247,644 13,974,927 38,176,936 37,143,262
Increase (decrease) in net position before transfers11,160,549 5,660,364 2,241,455 419,416 13,402,004 6,079,780 Transfers22,178,184 (357,000) (22,178,184) 357,000 - -
Increase (decrease) in net position33,338,733 5,303,364 (19,936,729) 776,416 13,402,004 6,079,780
Net position - beginning, as restated187,088,801 179,927,070 116,069,748 115,293,332 303,158,549 295,220,402
Net position - ending220,427,534 $ 185,230,434 $ 96,133,019 $ 116,069,748 $ 316,560,553 $ 301,300,182 $
The graph below depicts the City’s 2022 program revenues and expenses for governmental activities found on the Statement of Activities. Because program expenses far exceed program revenues in some functions (general government, parks and recreation), general revenues (e.g. sales, and franchise taxes, etc.) are also utilized to provide services for governmental activities.
$$1,000,000 $2,000,000 $3,000,000 $4,000,000 $5,000,000 $6,000,000 $7,000,000 $8,000,000 $9,000,000
General government Public safetyHighways and public improvements
Revenues Expenses
Parks and recreation Interest on longterm debt
The following pie chart depicts revenues by source for governmental activities. Capital grants and contributions are at 22% of all revenues compared with 17% in 2021, which displays the slight increase in development activities. 53% of revenues were generated from the various taxes collected by the City (e.g. sales, property and franchise), up from 43% in 2021. The main reason for this increase is due to the RLESA property taxes brought into the governmental activities as mentioned earlier. Operating grants and contributions are 15% of revenues, compared with 31% for 2021. The remaining revenues represent charges for services and interest income.


Business–type activities generated revenues of $13.5 million in fiscal year 2022 compared with $14.4 million in fiscal year 2021. The $900 thousand decrease is accredited primarily to the movement of the Stormwater Fund to governmental activities and rate increases in the remaining funds in the business-type activities.
Equity investment in a joint venture produced an increase of $404 thousand in fiscal year 2022 compared with an increase of $418 thousand in fiscal year 2021. Income from the joint venture is reported in the nonoperating revenues category in the proprietary fund financial statements, and as a program revenue in the Statement of Activities.
The amount received in capital contributions from development was $645 thousand in fiscal year 2022 compared with $1.18 million in fiscal year 2021. Even though capital contributions from development is showing a decrease, due to the Stormwater Fund movement, the decrease is not as large since the prior year’s figure includes capital contributions for the Stormwater Fund, and the current year’s figure does not. Small fluctuations, up and down, in capital contributions are normal and can be attributed to the timing of when projects get completed. Overall, development within Riverton City is steady.
Interfund transfers are the reciprocal of those described in the governmental activities. A more in-depth narrative of the transfers is addressed in Note No. 5. Net transfers-out from business-type activities of $22.2 million consist of the consolidation of the Stormwater Fund to governmental activities, a transfer from governmental activities to businesstype activities to pay off the 2020B Bond Series, and a small amount of subsidy for operating expenses from REDIIF to the Sanitation Fund. Net transfers-in of $357 thousand in fiscal year 2021 were used entirely for this subsidy of the sanitation fund. The reason for the large decrease in the subsidy from one year to the next is due to an increase in the user rates.
The bar graph to the right portrays the City’s 2022 program revenues and expenses for business–type activities found on the Statement of Activities. The pie chart depicts revenues by source for business–type activities. Nearly all of the revenues come from two categories: charges for services with 94% and capital contributions with 5%.

Business-Type
$$1,000,000 $2,000,000 $3,000,000 $4,000,000 $5,000,000 $6,000,000 $7,000,000 Culinary Water
The focus of these funds is to provide information on near–term inflows, outflows, and balances of spendable resources. Such information is useful in assessing the City’s financing requirements. Because fund balance is only an approximate measure of liquidity, GASB Statement No. 54 requires that governmental fund balances be divided into five categories; nonspendable, restricted, committed, assigned, and unassigned. The total fund balance is a measure of available resources at June 30, 2022. All categories except the fund balance that is in nonspendable form is a measure of available resources.
At the close of the fiscal year, governmental funds reported a combined fund balance of $26.0 million. Of the combined fund balance, $159 thousand is nonspendable prepaid expenditures; $4.5 million is restricted by external agencies; $6.5 million is committed as City Council has adopted an ordinance setting self–imposed limitations on these funds to be used for economic development, infrastructure and redevelopment; $8.4 million is assigned, this money has an intended use determined by City Council through its capital improvements plan, law enforcement operations or redevelopment; and $6.5 million is unassigned. This amount cannot be properly reported in any of the other four components discussed thus far.
The General Fund is responsible for all of the general services provided by Riverton City. At June 30, 2022, the fund balance in the General Fund is categorized in the following ways: nonspendable for prepaid expenditures; restricted for Class C Roads; and unassigned for the remainder. The City’s unrestricted (committed, assigned, unassigned) fund balance in the General Fund at the end of fiscal year 2022 is at 34% of the current year’s actual revenue, which is required by State law to be a minimum of 5% and a maximum of 35%. This percentage is up from 30.1% in 2021, validating the City’s General Fund is in a strong and healthy financial position.
The $2.5 million change in fund balance in the General Fund is primarily made up of a $1.3 million increase in sales tax, a $1.1 million increase in charges for services due to the Stormwater Fund consolidation.
The Grants capital projects fund is a newly created fund for the 2022 fiscal year. The purpose of this fund is to track money received from the federal government, $854 thousand as a
WaterSmart grant and $2.6 million as the City’s first tranche from the American Rescue Plan Act (ARPA). At the conclusion of the fiscal year, the grants fund has a total fund balance of $2.6 million.
The REDIIF capital projects fund has a total fund balance of $6.5 million at June 30, 2022. Of this balance, $1.5 million is in land held for resale, and the remainder of $5.0 million has been committed by ordinance for economic development. The net change in fund balance in the REDIIF capital projects fund was a decrease of $1.1 million. The main reason for this decrease is due the REDIIF fund transferring to the Secondary Water Fund to help in paying off the 2020B Bond Series.
At June 30, 2022, the fund balance of the RDA special revenue fund was zero. In 2021 the fund balance in the RDA was $123 thousand. The entire portion of that fund balance was land held for resale, which has now been conveyed to a local entity as part of a development agreement within the RDA project area. The net change in fund balance for the RDA was a decrease of $123 thousand which is attributed to the accounting loss associated with the above mentioned land conveyance. The above transaction was the final, leftover remnant of the Redwood Road RDA Project Area. The Western Commercial District CDA, a development in the west section of the City, triggered property tax increment during the fiscal year ended June 30, 2022. Additional information on the Redevelopment Agency can be found in Note No. 15.
At June 30, 2022, the fund balance of the RLESA special revenue fund was $2.5 million. The entire fund balance has been assigned to law enforcement. Addititional information on the RLESA special revenue fund can be found in Note No. 16.
During fiscal year 2022 there was a total of $1.3 million increase in appropriations through budget adjustments. Of this increase, $372 thousand was for mid-year wage increases in the police department to remain competitive with the local area, $678 thousand for various public works improvement projects, and several minor increases accounting for budgets that were approved in the previous fiscal year, but due to supply delays and shortages, were not received until the 2022 fiscal year. The budget is closely monitored and adjusted as needed throughout the year. During fiscal year 2022, Council amended the budget when necessary, adjusting budgeted revenues as well as expenditures.
The actual revenues in the General Fund received were 107.3% of the final budgeted revenues. The actual expenditures in the General Fund were 88.8% of appropriations. The final budget, before transfers, included expenditures of $22.3 million, while
actual expenditures totaled $19.8 million. Budget variances resulted in an increase of unassigned fund balance of $1.3 million and an increase in restricted fund balance of $1.2 million.
All recommended amendments for budgetary changes came through the Administrative Services Department to the City
Council via resolution as required by State statute. Public hearings were properly noticed and conducted for formal budget amendments that require the approval of the Council. In accordance with State Code, the Mayor approved intra–departmental budget changes without the approval of the City Council.
The City’s investment in capital assets for its governmental and business–type activities totaled $279.4 million net of combined depreciation, amortization, and related debt at June 30, 2022. Types of assets included in this category are land, construction in progress, water shares, buildings and other improvements, machinery and equipment, and infrastructure. Note No. 7 addresses the City’s investments in capital assets.
202220212022202120222021
Land and rights of ways108,146,461 $ 105,733,107 $ 2,846,219 $ 3,162,260 $ 110,992,680 $ 108,895,367 $
Construction in progress393,867 2,331,417 854,594 466,546 1,248,461 2,797,963 Water shares- - 14,914,588 14,465,916 14,914,588 14,465,916 Buildings and improvements16,337,712 16,612,497 4,696,098 4,788,319 21,033,810 21,400,816 Improvements other than buildings16,082,025 16,938,060 - - 16,082,025 16,938,060 Machinery and equipment1,103,739 816,292 297,524 305,941 1,401,263 1,122,233 Office furniture and equipment449,238 494,068 127,537 168,745 576,775 662,813
Vehicles3,308,679 1,723,136 979,649 1,733,983 4,288,328 3,457,119 Infrastructure79,501,628 54,738,015 64,984,427 86,477,859 144,486,055 141,215,874 -
Total Capital Assets225,323,349 $ 199,386,592 $ 89,700,636 $ 111,569,569 $ 315,023,985 $ 310,956,161 $
As has been mentioned previously, the largest change in capital assets for the current fiscal year was the consolidation of the Stormwater Fund into the General Fund. Other large increases include police vehicles and various infrastructure projects.
The basic financial statements, along with Note No. 11, provide a summary of the City’s long–term debt. At June 30, 2022, Riverton City’s bonded debt, including unamortized premiums, amounted to $36.4 million. All of the City’s bonded debt is known as revenue bonds and is secured by specific revenue sources. Riverton City has $31.2 million of franchise and sales tax revenue bonds and $5.2 million of water revenue bonds.
Governmental ActivitiesBusiness-type ActivitiesTotal Primary Government
202220212022202120222021
Bonds payable: Franchise and sales tax revenue30,441,000 $ 31,512,000 $ - $ - $ 30,441,000 $ 31,512,000 $
Unamortized premiums801,501 931,661 - - 801,501 931,661 Water revenue- - 5,211,000 10,553,000 5,211,000 10,553,000
Unamortized premiums- - 5,846 17,538 5,846 17,538
Unamortized discounts- - - (40,733) - (40,733) Financing leases1,246,820 - - - 1,246,820 -
Total32,489,321 $ 32,443,661 $ 5,216,846 $ 10,529,805 $ 37,706,167 $ 42,973,466 $
Two major debt events occurred during the current fiscal year; an addition of financing leases to purchase police vehicles, and the defeasance of the 2020B bond series. Both transactions will be discussed in greater detail in the notes.
RIVERTON CITY, UTAHSales tax collections continue to remain strong. Over the previous eight years, the average sales tax increase has been 10.4%, which has been an ongoing indicator of the strength and stability of Riverton City’s economy.
Following the slowdown in developments during the previous fiscal years attributed primarily to the COVID-19 pandemic, the City saw the acceleration of many developments within the City. One large residential development that had delayed construction due to the pandemic has broken ground and construction is proceeding on the initial phases during the fall and winter of 2022. In addition, a large multi-family luxury condominium complex (approximately 280 units) is preparing to break ground during the winter of 2022. An additional planned unit development (approximately 350 units) should be nearing completion in late spring of 2023. With more than 1,000 entitled units at various stages in the approval process, Riverton City continues to enjoy a consistently stable permit-authorized construction environment. The value of new construction in Riverton City for permits issued during the fiscal year ended June 30, 2022, was $81.2 million. The City also saw continued residential development in the RDA project area and expansion of multi-family residential projects throughout the City.
Growth in Riverton City’s Western Commercial District (WCD) continues, with completion of over 200,000 square feet of office/warehouse “flex” space, and more in the permitting process. Construction on the CenterCal Properties, LLC retail project, Mountain View Village, an 85-acre site in the Western Commercial District, is nearing completion. Phase 1 of the project was completed in June 2018, while Phase 2 construction opened in July of 2022. Phase 3 (the final phase) was recently submitted for approval and is moving forward. At completion, CenterCal’s project will include over one million square feet of retail and office space, as well as public service and residential components. Riverton City’s investments in the construction of new roads and in upgrading and maintaining existing roads, have been effective in managing current growth, and planning for future growth in a way that provides a sustainable framework for large and small-scale development projects.
As Riverton City continues to enjoy and effectively manage significant residential and commercial growth, ongoing infrastructure and development projects further enhance the quality of life in Riverton, helping to attract and retain quality retail growth and expanded employment with high-paying jobs.

This financial report is designed to provide our residents, taxpayers, investors, and creditors with a general overview of the City’s finances and to show the City’s accountability for the funds and assets it receives. If you have questions about this report, or should you need additional financial information, contact the City’s Administrative Services Department at Riverton City, 12830 S Redwood Road, Riverton, Utah 84065.


COMPREHENSIVE
REPORT FOR THE FISCAL YEAR ENDED JUNE 30, 2022
Financial Section – Government–wide Financial Statements STATEMENT OF NET POSITION – JUNE 30, 2022
Component Unit
Governmental Activities
Business-type ActivitiesTotal RFSA (as of 12/31/21)
ASSETS
Cash and cash equivalents19,881,446 $ 6,276,812 $ 26,158,258 $ 1,165,457 $
Receivables: Accounts134,803 994,108 1,128,911 90,215
Property and sales taxes8,187,427 - 8,187,427Franchise taxes239,226 - 239,226Other governments1,947,583 - 1,947,583 -
Restricted cash and cash equivalents4,694,860 1,043,116 5,737,976 -
Inventories - 595,069 595,069Prepaids159,168 27,494 186,662 -
Evidence held in trust1,490 - 1,490Due from other government, net of discount- - - 726,449 Land held for resale1,515,038 - 1,515,038 -
Net pension asset3,442,106 523,908 3,966,014
Investments in joint ventures- 3,994,778 3,994,778Capital assets, not being depreciated:
Land and right of ways108,146,461 2,846,219 110,992,680 -
Construction in progress393,867 854,594 1,248,461Water shares- 14,914,588 14,914,588Capital assets, net of accumulated depreciation: Buildings and improvements16,337,712 4,696,098 21,033,810 6,720,600
Improvements other than buildings16,082,025 - 16,082,025Machinery and equipment1,103,739 297,524 1,401,263Office furniture and equipment449,238 127,537 576,775Vehicles3,308,679 979,649 4,288,328Infrastructure79,501,628 64,984,427 144,486,055 -
Total assets 265,526,496 103,155,921 368,682,417 8,702,721
Deferred loss on refunding2,083,765 16,720 2,100,485Deferred outflows related to pensions1,908,339 812,803 2,721,142 -
Total deferred outflows of resources3,992,104829,5234,821,627-
Accounts payable1,635,297 1,231,898 2,867,195 -
Accrued liabilities218,491 38,812 257,303 -
Accrued interest payable104,599 37,802 142,401Deposits, retainage and cash held in trust1,230,776 41,900 1,272,676 -
Unearned revenue138,845 - 138,845 -
Noncurrent liabilities: Due within one year Bonds, leases and compensated absenses 2,281,924 661,718 2,943,642 188,735 Due in more than one year Bonds, leases and compensated absenses 30,824,501 4,724,970 35,549,471 3,128,689
Total liabilities36,434,433 6,737,100 43,171,533 3,317,424
Deferred inflows related to pensions5,204,260 1,115,325 6,319,585Deferred inflows - property taxes7,452,373 - 7,452,373 -
Total deferred inflows of resources12,656,633 1,115,325 13,771,958 -
Net investment in capital assets194,917,793 84,500,510 279,418,303 -
Restricted for: Projects, right of way acquisitions and class 'C' roads1,802,330- 1,802,330Impact fees2,737,897 4,835 2,742,732Public safety- - - 5,385,297 Unrestricted20,969,514 11,627,674 32,597,188 -
Total net position220,427,534 $ 96,133,019 $ 316,560,553 $ 5,385,297 $
The accompanying notes are an integral part of this financial statement.
RIVERTON CITY, UTAH
COMPREHENSIVE FINANCIAL REPORT FOR THE FISCAL YEAR ENDED JUNE 30, 2022
Financial Section – Government-wide Financial Statements (continued) STATEMENT OF ACTIVITIES – FOR THE YEAR ENDED JUNE 30, 2022
Program RevenuesNet (Expense) Revenues and Changes in Net Position Primary Government
Component Unit
Expenses
Governmental activities
Charges for Services Governmental Activities Business-type ActivitiesTotal
General government8,472,276 $ 626,013 $ 1,950,279 $ 3,484,427 $ (2,411,557) $ (2,411,557) $
Public safety6,520,947 1,175,747 667,735 - (4,677,465) (4,677,465)
Highways and public improvements6,424,373 947,330 2,921,165 4,065,230 1,509,352 1,509,352
Parks and recreation4,185,817 614,770 - 868,163 (2,702,884) (2,702,884)
Interest on long-term debt1,325,879 - - - (1,325,879) (1,325,879)
Total governmental activities 26,929,292 3,363,860 5,539,179 8,417,820 (9,608,433) (9,608,433)
Culinary water5,769,152 5,660,941 - 139,319 31,108 $ 31,108
Secondary water3,348,955 4,513,546 - 506,225 1,670,816 1,670,816
Sanitation2,129,537 2,488,438 - - 358,901 358,901
Total business-type activities 11,247,644 12,662,925 - 645,544 2,060,825 2,060,825
Total primary government 38,176,936 $ 16,026,785 $ 5,539,179 $ 9,063,364 $ (9,608,433) 2,060,825 (7,547,608)
Component Unit
RFSA (for the year ended 12/31/21)
RFSA (for the year ended 12/31/21)
5,720,249 $ - $ 930,997 $ 3,358,565 $ (1,430,687) $
General Revenues: Taxes
Property6,399,639 - 6,399,639 6,807,098 Sales11,129,036 - 11,129,036Franchise2,579,433 - 2,579,433Interest income109,237 35,771 145,008 8,886
Gain on sale of assets229,698 60,159 289,857 -
Gain on disposal of debt- 47,000 47,000Miscellaneous321,939 37,700 359,639 -
Transfers - net22,178,184 (22,178,184) - -
Total general revenue and transfers 42,947,166 (21,997,554) 20,949,612 6,815,984
Change in net position 33,338,733 (19,936,729) 13,402,004 5,385,297
Net position - beginning, as restated 187,088,801 116,069,748 303,158,549Net position - ending 220,427,534 $ 96,133,019 $ 316,560,553 $ 5,385,297 $
The accompanying notes are an integral part of this financial statement.

The General Fund is the City’s primary operating fund. Taxes, licenses, permits, and fees for services are the financing sources for this fund.

Impact Fee Funds are used to track revenue and expenditures relating to capital improvements to infrastructure which are attributable to growth from new development within the City. The Capital Improvements Fund (CIF) is used to account for capital projects which are ineligible to be financed with impact fees. Riverton Economic Development Infrastructure and Investment Fund (REDIIF) is funded by franchise taxes and committed for economic development throughout Riverton City. The Capital Projects Fund – Grants is used to track the capital projects that are funded by the American Rescue Plan Act as well as other State and local grants.
The Redevelopment Agency of Riverton City (RDA) is accounted for as a special revenue fund. The RDA project area generates tax increment which is used to finance infrastructure and other improvements within the project area. The Riverton Law Enforcement Service Area (RLESA) is accounted for as a special revenue fund. RLESA assesses property taxes to the geographical area that is Riverton City. Revenue generated by RLESA is used to fund the operations of the Riverton Police Department that is included in the City’s General Fund.
COMPREHENSIVE FINANCIAL REPORT FOR THE FISCAL YEAR ENDED JUNE 30, 2022
Financial Section – Governmental Funds Financial Statements (continued) BALANCE SHEET – GOVERNMENTAL FUNDS - JUNE 30, 2022
CapitalCapitalSpecialSpecial Nonmajor General Projects FundProjects FundRevenue FundRevenue FundGovernmental FundGrantsREDIIFRDARLESAFundsTotal
Cash and cash equivalents6,712,736 $ 2,621,923 $ 4,378,670 $ 77,918 $ 2,483,944 $ 3,606,255 $ 19,881,446 $ Restricted cash and cash equivalents1,419,594 - 418,775 - - 2,856,491 4,694,860
Receivables: Accounts134,803 - - - - - 134,803
Property and sales taxes1,986,708 - - - 6,200,719 - 8,187,427 Franchise taxes- - 239,226 - - - 239,226 Intergovernmental638,500 - - 1,309,083 - - 1,947,583 Prepaids159,168 - - - - - 159,168
Evidence held in trust1,490 - - - - - 1,490 Land held for resale- - 1,515,038 - - - 1,515,038
Total assets 11,052,999 $ 2,621,923 $ 6,551,709 $ 1,387,001 $ 8,684,663 $ 6,462,746 $ 36,761,041 $
Accounts payable1,057,004 $ - $ 55,302 $ 77,918 $ - $ 445,073 $ 1,635,297 $
Accrued liabilities218,491 - - - - - 218,491
Developer and customer deposits1,182,846 - - - - 46,440 1,229,286
Cash held in trust1,490 - - - - - 1,490 Due to other governments44,392 - - - - - 44,392
Unearned revenue138,845 - - - - - 138,845
Total liabilities 2,643,068 - 55,302 77,918 - 491,513 3,267,801
Unavailable revenue - property taxes- - - 1,309,083 6,143,290 - 7,452,373
Total deferred inflows of resources - - - 1,309,083 6,143,290 - 7,452,373
Nonspendable: Prepaids159,168 - - - - - 159,168 Restricted: Impact fees- - - - - 2,737,897 2,737,897 Class C roads1,802,330 - - - - - 1,802,330 Committed: Economic development- - 6,496,407 - - 6,496,407 Assigned: Capital outlays- 2,621,923 - - - 3,233,336 5,855,259 Law enforcement- - - - 2,541,373 - 2,541,373 Unassigned6,448,433 - - - - - 6,448,433
Total fund balances 8,409,931 2,621,923 6,496,407 - 2,541,373 5,971,233 26,040,867 Total liabilities, deferred inflows of resources and fund balances 11,052,999 $ 2,621,923 $ 6,551,709 $ 1,387,001 $ 8,684,663 $ 6,462,746 $ 36,761,041 $
The accompanying notes are an integral part of this financial statement.
RIVERTON CITY, UTAH Governmental FundsRIVERTON CITY, UTAH
COMPREHENSIVE FINANCIAL REPORT FOR THE FISCAL YEAR ENDED JUNE 30, 2022
Financial Section – Governmental Funds Financial Statements (continued)
RECONCILIATION OF THE BALANCE SHEET – GOVERNMENTAL FUNDS TO THE STATEMENT OF NET POSITION –JUNE 30, 2022
Amounts reported for governmental activities in the Statement of Net Position are different because:
Total fund balances for governmental funds (page 40) 26,040,867 $ 44,392 225,323,349

Year-end balances between the primary government and component unit are eliminated in the Statement of Net Position
Capital assets used in governmental activities are not financial resources and therefore, are not reported in the funds.
Other long-term assets not available for current period expenditures and are therefore deferred in the funds balance sheet.
Net pension asset 3,442,106
Deferred loss on refunding 2,083,765
Interest expense is not due and payable in the current period and therefore, is not recorded in the funds.
Long-termliabilities,includingbondspayable,leases,andcompensatedabenses,arenotdueandpayableinthecurrentperiodand, therefore, not reported in the funds.
Net pension liabilities and deferred inflows relating to pensions are not due and payable in the current period and, therefore, not reported in the funds.
Deferred outflows of resources relating to pensions 1,908,339 (104,599) (33,106,425) (5,204,260)
Net position of governmental activities (page 37) 220,427,534 $
The accompanying notes are an integral part of this financial statement.

RIVERTON CITY, UTAH
COMPREHENSIVE FINANCIAL REPORT FOR THE FISCAL YEAR ENDED JUNE 30, 2022 Financial Section – Governmental Funds Financial Statements (continued)
STATEMENT OF REVENUES, EXPENDITURES, AND CHANGES IN FUND BALANCES – GOVERNMENTAL FUNDS – FOR THE YEAR ENDED JUNE 30, 2022
CapitalCapitalSpecialSpecial Nonmajor General Projects FundProjects FundRevenue FundRevenue FundGovernmental FundGrantsREDIIFRDARLESAFundsTotal
Taxes: Sales11,129,036 $ - $ - $ - $ - $ - $ 11,129,036 $ Franchise- - 2,579,433 - - - 2,579,433 Property- - - - 6,399,639 - 6,399,639 Licenses and permits942,298 - - - - - 942,298
Intergovernmental3,211,129 3,484,427 - 1,309,083 - 700,000 8,704,639
Charges for services1,975,143 - - - - - 1,975,143
Rental income225,161 - - - - - 225,161 Impact fees- - - - - 2,114,795 2,114,795 Fines and forfeitures221,258 - - - - - 221,258 Grants616,196 - - - - - 616,196 Interest26,241 12,051 21,208 - 23,367 26,370 109,237 Miscellaneous321,939 - - - - - 321,939
Total revenues 18,668,401 3,496,478 2,600,641 1,309,083 6,423,006 2,841,165 35,338,774
Current: General government5,475,510 - 41,681 1,481,557 - - 6,998,748 Public safety6,585,247 - - - - - 6,585,247 Highways and public improvements3,933,113 - - - - - 3,933,113 Parks and recreation2,639,719 - - - - - 2,639,719
Capital expenditures2,381,224 874,555 1,072,765 - - 4,552,834 8,881,378
Debt service: Rent/lease203,073- - - - - 203,073 Principal on debt- - 1,071,000 - - - 1,071,000 Interest- - 1,299,454 - - - 1,299,454
Total expenditures 21,217,886 874,555 3,484,900 1,481,557 - 4,552,834 31,611,732
Excess (deficiency) of revenues over (under) expenditures (2,549,485) 2,621,923 (884,259) (172,474) 6,423,006 (1,711,669) 3,727,042
Proceeds from financing leases1,443,736 - - - - - 1,443,736
Sale of capital assets276,331 - - - - 452,174 728,505
Transfers in7,274,990 - 1,110,000 49,674 - 4,107,476 12,542,140
Transfers out(3,901,322) - (1,330,495) - (5,740,000) (1,218,838) (12,190,655)
Total other financing sources (uses) 5,093,735 - (220,495) 49,674 (5,740,000) 3,340,812 2,523,726
Net change in fund balances 2,544,250 2,621,923 (1,104,754) (122,800) 683,006 1,629,143 6,250,768
Fund balances, beginning of year 5,865,681 - 7,601,161 122,800 1,858,367 4,342,090 19,790,099
Fund balances, end of year 8,409,931 $ 2,621,923 $ 6,496,407 $ - $ 2,541,373 $ 5,971,233 $ 26,040,867 $
The accompanying notes are an integral part of this financial statement.
Governmental FundsCOMPREHENSIVE FINANCIAL REPORT FOR THE FISCAL YEAR ENDED JUNE 30, 2022
Financial Section – Governmental Funds Financial Statements (continued)
RECONCILIATION OF THE STATEMENT OF REVENUES, EXPENDITURES, AND CHANGES IN FUND BALANCES –GOVERNMENTAL FUNDS – TO THE STATEMENTS OF ACTIVITIES FOR THE YEAR ENDED JUNE 30, 2022
Amounts reported for governmental activities in the Statement of Activities are different because:
Net change in fund balances for governmental funds (page 42) 6,250,768 $ 294,037
Year-end balances between the primary government and component unit are eliminated in the Statement of Activities
Governmentalfundsreportcapitaloutlaysasexpenditures.However,intheStatementofActivitiesthecostofthoseassetsisallocated over their estimated useful lives and reported as depreciation expense. The effect of various miscellaneous transactions involving capital assets (i.e., sales, trade-ins, and donations) is to decrease net position.
Capital outlay 9,144,490 Depreciation expense (6,847,032)
Contributedassetsarenotrecordedingovernmentalfundsbecausecurrentresourcesarenotexpendedforacquisition.TheStatementof Activities records these contributed assets at their estimated fair value on the date of contribution.
Net book value of assets sold (cost of assets less accumulated depreciation)(498,807) Net book value of assets transferred to governmental activities from business-type activities21,910,774 2,227,332
Theissuanceoflong-termdebt(e.g.,bonds,leases)providescurrentfinancialresourcestogovernmentalfunds,whilethepaymentofthe principaloflong-termdebtconsumesthecurrentfinancialresourcesofgovernmentalfunds.Neithertypeoftransaction,however,has any effect on net position. Also, governmental funds report the effect of issuance costs, premiums, discounts, and similar items when debt isfirstissued.TheseamountsaredeferredandamortizedintheStatementofActivities.Theamountsaretheneteffectofthedifferences in the treatment of long-term debt and related items.
Principal reduction of long-term liability 1,071,000 Accrued interest 3,212
Amortization of bond premiums 130,160
Amortization of deferred loss (153,640)
Adjustmentstoaccruedpensioncostsarenotreportedasanexpenditureinthecurrentperiodforgovernmentalfundsbutarerecorded as an adjustment to expenses in the statement of activities.
Principal increase for new long-term liability (1,246,820) 1,190,601
Expensesarerecognizedinthegovernmentalfundswhenpaidordue;however,theStatementofActivitiesispresentedontheaccrual basisandexpensesandliabilitiesarereportedwhenincurred,regardlessofwhenfinancialresourcesareavailableorexpensesarepaidor due. These adjustments reflect the changes due to compensated absences.
Compensated absences (137,342)
Change in net position of governmental activities (page 38) 33,338,733 $
The accompanying notes are an integral part of this financial statement.
FOR THE FISCAL YEAR ENDED JUNE 30, 2022
Financial Section – Governmental Funds Financial Statements (continued)
STATEMENT OF REVENUES, EXPENDITURES, AND CHANGES IN FUND BALANCES – BUDGET AND ACTUAL –GENERAL FUND – FOR THE YEAR ENDED JUNE 30, 2022
Actual Variance with OriginalFinalAmountsFinal Budget
Taxes: Sales9,750,000 $ 10,122,000 $ 11,129,036 $ 1,007,036 $ Licenses and permits1,220,800 1,220,800 942,298 (278,502) Intergovernmental2,696,000 2,696,000 3,211,129 515,129
Charges for services1,979,100 1,980,600 1,975,143 (5,457)
Rental income145,000 145,000 225,161 80,161
Fines and forfeitures248,500 248,500 221,258 (27,242)
Grants 256,000 636,000 616,196 (19,804)
Interest 35,000 35,000 26,241 (8,759) Miscellaneous315,500 315,500 321,939 6,439
Total revenues 16,645,900 17,399,400 18,668,401 1,269,001
General government: Legislative21,350 21,350 10,895 10,455 Executive14,300 14,300 6,275 8,025 Administrative119,300 121,300 76,062 45,238 Recorder 82,950 82,950 37,334 45,616 Utilities and taxes488,350 488,350 419,209 69,141 Non-departmental196,750 241,750 222,734 19,016 Administrative services203,750 275,250 249,805 25,445 Development services302,450 352,450 365,336 (12,886) Attorney's office45,000 45,000 16,191 28,809 Computer/IT579,750 607,750 488,896 118,854
City committees and boards30,000 30,000 12,621 17,379 Wages and salaries3,601,850 3,601,850 3,570,152 31,698
Total general government5,685,800 5,882,300 5,475,510 406,790
Public safety:
Law enforcement operations1,000,000 1,005,000 895,512 109,488 Fire operations212,500 212,500 108,838 103,662 Utilities9,500 9,500 8,276 1,224 Wages and salaries5,727,250 6,099,250 5,775,694 323,556
Total public safety6,949,250 7,326,250 6,788,320 537,930
(continued)
The accompanying notes are an integral part of this financial statement.
FOR THE FISCAL YEAR ENDED JUNE 30, 2022 Financial Section – Governmental Funds Financial Statements (continued)
STATEMENT OF REVENUES, EXPENDITURES, AND CHANGES IN FUND BALANCES – BUDGET AND ACTUAL –GENERAL FUND (continued) – FOR THE YEAR ENDED JUNE 30, 2022
Actual Variance with OriginalFinalAmountsFinal Budget
Highways and public improvements:
Engineering282,650 $ 262,650 $ 237,595 $ 25,055 $ Operational services255,500 255,500 235,394 20,106 Road maintenance and street lighting1,273,250 1,148,250 728,971 419,279 Stormwater42,000 62,000 37,077 24,923 Wages and salaries2,861,600 2,861,600 2,694,076 167,524
Total highways and public improvements4,715,000 4,590,000 3,933,113 656,887
Parks and recreation:
Parks and recreation1,211,350 1,230,850 944,404 286,446 Cemetery9,000 9,000 10,250 (1,250) Celebration219,000 219,000 197,563 21,437 Utilities162,750 162,750 124,830 37,920 Wages and salaries1,531,500 1,531,500 1,362,672 168,828
Total parks and recreation3,133,600 3,153,100 2,639,719 513,381
Capital outlay: Public safety40,000 70,000 1,510,852 (1,440,852) Highways and public improvements470,000 1,148,000 760,555 387,445 Total capital outlay510,000 1,318,000 2,381,224 (1,063,224)
Total expenditures 20,993,650 22,269,650 21,217,886 1,051,764
Excess (deficiency) of revenues over (under) expenditures (4,347,750) (4,870,250) (2,549,485) 2,320,765
Proceeds from financing leases- - 1,443,736 1,443,736 Sale of capital assets- 35,000 276,331 241,331
Transfers in7,482,323 7,854,323 7,274,990 (579,333) Transfers out(3,182,323) (3,843,323) (3,901,322) (57,999)
Net other financing sources (uses) 4,300,000 4,046,000 5,093,735 1,047,735
Net change in fund balance (47,750) $ (824,250) $ 2,544,250 3,368,500 $
Fund balance, beginning of year 5,865,681 Fund balance, end of year 8,409,931 $
The accompanying notes are an integral part of this financial statement.
RIVERTON CITY, UTAH
COMPREHENSIVE
REPORT FOR THE FISCAL YEAR ENDED JUNE 30, 2022
Financial Section – Governmental Funds Financial Statements (continued)
STATEMENT OF REVENUES, EXPENDITURES, AND CHANGES IN FUND BALANCES – BUDGET AND ACTUAL –REDEVELOPMENT AGENCY OF RIVERTON CITY – FOR THE YEAR ENDED JUNE 30, 2022
Budgeted Amounts
Actual Variance with OriginalFinalAmountsFinal Budget
Intergovernmental revenue1,731,229 $ 1,731,229 $ 1,309,083 $ (422,146) $
Total revenues 1,731,229 1,731,229 1,309,083 (422,146)
Current: Redevelopment1,906,2292,108,029 1,481,557 626,472
Total expenditures 1,906,229 2,108,029 1,481,557 626,472
Excess (deficiency) of revenues over (under) expenditures (175,000) (376,800) (172,474) 204,326
Transfers in175,000 254,000 49,674 (204,326) Total other financing sources (uses) 175,000 254,000 49,674 (204,326)
Net change in fund balance - $ (122,800) $ (122,800) - $
Fund balance, beginning of year 122,800 Fund balance, end of year - $
The accompanying notes are an integral part of this financial statement.
RIVERTON CITY, UTAH
COMPREHENSIVE FINANCIAL REPORT FOR THE FISCAL YEAR ENDED JUNE 30, 2022
Financial Section – Governmental Funds Financial Statements (continued)
STATEMENT OF REVENUES, EXPENDITURES, AND CHANGES IN FUND BALANCES – BUDGET AND ACTUAL –RIVERTON LAW ENFORCEMENT SERVICE AREA – FOR TH E YEAR ENDED JUNE 30, 2022
Actual Variance with OriginalFinalAmountsFinal Budget
Taxes: Property 6,302,104 $ 6,302,104 $ 6,399,639 $ 97,535 $
Intergovernmental 128,473 128,473 - (128,473) Interest 25,500 25,500 23,367 (2,133) Miscellaneous 1,500 1,500 - (1,500)
Total revenues 6,457,577 6,457,577 6,423,006 (34,571)
Current: Public safety 500500- 500 Total expenditures 500 500 - 500 Excess (deficiency) of revenues over (under) expenditures 6,457,077 6,457,077 6,423,006 (34,071)
Transfers out(6,417,500) (6,417,500) (5,740,000) 677,500 Total other financing sources (uses) (6,417,500) (6,417,500) (5,740,000) 677,500
Net change in fund balance 39,577 $ 39,577 $ 683,006 $ 643,429 $
Fund balance, beginning of period 1,858,367 Fund balance, end of period 2,541,373 $
The accompanying notes are an integral part of this financial statement.
This fund accounts for activities of the City’s culinary water system. The culinary water system is comprised of approximately 183 miles of water transmission and distribution lines providing over 4,000 acre-feet of culinary water to the residents of the City.
This fund accounts for activities of the City’s secondary water system. The secondary water system is comprised of one deep well, five shallow wells and 28 booster pumps that provide water from the Jordan River and four canals that run through the City. This water, the majority originating from Utah Lake, is pushed through approximately 165 miles of pipeline. The secondary water system was designed to provide pressurized water for outdoor watering needs, including residential sprinkling system. By using lower-grade, non-potable water sources to meet outdoor water needs, the City is able to extend the useful life of the culinary water system and adds additional capacity to meet the growing culinary water needs of the City.

This fund is used to account for the activities relating to providing solid waste collection services to the residents of the City.
This fund accounts for activities of the City’s storm water system. Created July 1, 2010, the storm water utility fee helps the City finance operations to be in compliance with The Utah Water Quality Act. This law requires cities to protect streams, rivers, and lakes in their jurisdictions from polluted storm water. As of July 1, 2021, the operations of the Stormwater Fund were consolidated into the General Fund and the Capital Projects Fund – Stormwater in the Governmental Activities.

COMPREHENSIVE
REPORT FOR THE FISCAL YEAR ENDED JUNE 30, 2022
Financial Section – Proprietary Funds Financial Statements (continued) STATEMENT OF NET POSITION – PROPRIETARY FUNDS – JUNE 30, 2022
Enterprise Funds CulinarySecondaryStorm WaterWaterSanitationWaterTotal ASSETS
Current assets:
Cash and cash equivalents5,900,701 $ 13,326 $ 362,785 $ - $ 6,276,812 $ Restricted cash and cash equivalents4,410 1,038,706 - - 1,043,116 Total cash and cash equivalents5,905,111 1,052,032 362,785 - 7,319,928
Accounts receivable, net459,738 342,848 191,522 - 994,108 Prepaids13,747 13,747 - - 27,494
Inventories432,267 162,802 - - 595,069
Total current assets 6,810,863 1,571,429 554,307 - 8,936,599
Noncurrent assets:
Capital assets: Land545,628 2,300,591 - - 2,846,219 Water shares- 14,914,588 - - 14,914,588 Construction in progress- 854,594 - - 854,594 Buildings and improvements4,339,810 3,268,681 - - 7,608,491 Machinery and equipment523,381 151,939 - - 675,320 Office furniture and equipment235,961 197,742 - - 433,703 Vehicles1,064,994 528,199 - - 1,593,193 Infrastructure47,304,221 50,178,221 - - 97,482,442 Accumulated depreciation(19,273,526) (17,434,388) - - (36,707,914)
Net capital assets34,740,469 54,960,167 - - 89,700,636
Other assets:
Net pension asset253,428 235,182 35,298523,908 Equity investment in joint venture- - 3,994,778 - 3,994,778
Total other assets253,428 235,182 4,030,076 - 4,518,686
Total noncurrent assets 34,993,897 55,195,349 4,030,076 - 94,219,322
Total assets 41,804,760 56,766,778 4,584,383 - 103,155,921
Deferred loss on refunding- 16,720 - - 16,720
Deferred outflows related to pensions474,839 310,313 27,651 - 812,803
Total deferred outflows of resources 474,839 327,033 27,651 - 829,523
The accompanying notes are an integral part of this financial statement.
REPORT FOR THE FISCAL YEAR ENDED JUNE 30, 2022
Financial Section – Proprietary Funds Financial Statements (continued) STATEMENT OF NET POSITION – PROPRIETARY FUNDS (continued) – JUNE 30, 2022
Enterprise Funds CulinarySecondaryStorm WaterWaterSanitationWaterTotal
Current liabilities:
Accounts payable449,908 $ 236,343 $ 545,647 $ - $ 1,231,898 $
Accrued liabilities21,929 15,619 1,264 - 38,812
Accrued interest payable- 37,802 - - 37,802 Deposits and retainage29,888 12,012 - - 41,900
Compensated absences76,658 54,298 4,916 - 135,872 Bonds payable, net- 525,846 - - 525,846
Total current liabilities 578,383 881,920 551,827 - 2,012,130
Noncurrent liabilities:
Compensated absences19,165 13,576 1,229 - 33,970 Bonds payable, net- 4,691,000 - - 4,691,000
Total noncurrent liabilities 19,165 4,704,576 1,229 - 4,724,970
Total liabilities 597,548 5,586,496 553,056 - 6,737,100
Deferred inflows related to pensions577,179478,44759,699- 1,115,325
Total deferred inflows of resources 577,179 478,447 59,699 - 1,115,325
Net investment in capital assets34,740,469 49,760,041- - 84,500,510 Restricted for impact fees4,410425- - 4,835 Unrestricted6,359,993 1,268,402 3,999,279 - 11,627,674
Total net position 41,104,872 $ 51,028,868 $ 3,999,279 $ - $ 96,133,019 $
The accompanying notes are an integral part of this financial statement.
RIVERTON CITY, UTAHCOMPREHENSIVE
REPORT FOR THE FISCAL YEAR ENDED JUNE 30, 2022
Financial Section – Proprietary Funds Financial Statements (continued)
STATEMENT OF REVENUES, EXPENSES, AND CHANGES IN NET POSITION – PROPRIETARY FUNDS –FOR THE YEAR ENDED JUNE 30, 2022
Enterprise Funds CulinarySecondaryStorm WaterWaterSanitationWaterTotal
Sales and charges for services5,157,201 $ 3,545,938 $ 2,083,693 $ - $ 10,786,832 $
Impact fees457,782 939,341 - - 1,397,123 Connection fees45,958 28,267 - - 74,225 Miscellaneous19,861 3,936 13,903 - 37,700
Total operating revenues 5,680,802 4,517,482 2,097,596 - 12,295,880
Wages and benefits1,509,553 1,143,084 122,931 - 2,775,568
Utilities241,245 325,584 62,000 - 628,829
Source and supply2,374,066 107,704 - - 2,481,770
Landfill fees- - 396,970 - 396,970
Sanitation charges- - 1,508,031 - 1,508,031 Shop and garage310,047 94,712 - - 404,759
System maintenance123,989 245,534 - - 369,523 Administrative238,895 239,822 39,605 - 518,322 Depreciation971,357 993,150 - - 1,964,507
Total operating expenses 5,769,152 3,149,590 2,129,537 - 11,048,279
Operating income (loss) (88,350) 1,367,892 (31,941) - 1,247,601
Equity gain from joint venture- - 404,745 - 404,745 Interest income24,996 9,404 1,371 - 35,771
Interest expense- (199,365) - - (199,365)
Gain (loss) on disposal of assets57,690 2,469 - - 60,159
Gain (loss) on disposal of debt- 47,000 - - 47,000
Total nonoperating revenues (expenses) 82,686 (140,492) 406,116 - 348,310
Income (loss) before contributions and transfers (5,664) 1,227,400 374,175 - 1,595,911
Capital contributions139,319 506,225 - - 645,544
Transfers in- 2,080,415 30,000 - 2,110,415
Transfers out- - - (24,288,599) (24,288,599)
Change in net position 133,655 3,814,040 404,175 (24,288,599) (19,936,729)
Total net position, beginning 40,971,217 47,214,828 3,595,104 24,288,599 116,069,748
Total net position, ending 41,104,872 $ 51,028,868 $ 3,999,279 $ - $ 96,133,019 $
The accompanying notes are an integral part of this financial statement.
COMPREHENSIVE FINANCIAL REPORT FOR THE FISCAL YEAR ENDED JUNE 30, 2022
Financial Section – Proprietary Funds Financial Statements (continued) STATEMENT OF CASH FLOWS – PROPRIETARY FUNDS – FOR THE YEAR ENDED JUNE 30, 2022
Enterprise Funds
CulinarySecondaryStorm WaterWaterSanitationWaterTotal
Cash flows from operating activities
Receipts from customers and users5,524,344 $ 4,553,735 $ 2,074,451 $ 289,445 $ 12,441,975 $ Payments to suppliers(3,645,257) (1,006,218) (1,775,902) (229,234) (6,656,611) Payments to employees(1,883,207) (1,357,337) (130,626) (108,238) (3,479,408)
Net cash provided (used) by operating activities (4,120) 2,190,180 167,923 (48,027) 2,305,956
Cash flows from noncapital financing activities
Due to / from other funds905,000 (905,000)Transfers to/from other funds- 1,225,821 30,000 (1,523,234) (267,413)
Net cash provided (used) by noncapital financing activities 905,000 320,821 30,000 (1,523,234) (267,413)
Cash flows from capital and related financing activities
Acquisition of capital assets(1,107,764) (412,162) - - (1,519,926)
Proceeds from sale of assets162,645 56,639 - - 219,284
Principal paid on capital debt- (5,295,000) - - (5,295,000)
Interest paid on capital debt- (180,742) - - (180,742)
Net cash used by capital and related financing activities (945,119) (5,831,265) - - (6,776,384)
Cash flows from investing activities
Interest received24,996 9,404 1,371 - 35,771
Net cash provided by investing activities 24,996 9,404 1,371 - 35,771
Net increase (decrease) in cash and cash equivalents (19,243) (3,310,860) 199,294 (1,571,261) (4,702,070)
Cash and cash equivalents, beginning of year 5,924,354 4,362,892 163,491 1,571,261 12,021,998
Cash and cash equivalents, end of year 5,905,111 $ 1,052,032 $ 362,785 $ - $ 7,319,928 $
Cash and cash equivalents 5,900,701 $ 13,326 $ 362,785 $ - $ 6,276,812 $
Restricted cash and cash equivalents 4,410 1,038,706 - - 1,043,116
Total Cash 5,905,111 $ 1,052,032 $ 362,785 $ - $ 7,319,928 $
Reconciliation of operating income to net cash provided (used) by operating activities
Operating income (loss)(88,350) $ 1,367,892 $ (31,941) $ - $ 1,247,601 $
Adjustments to reconcile operating income (loss) to net cash provided (used) by operating activities:
Depreciation971,357 993,150 - - 1,964,507
Net pension adjustment(342,201) (184,905) (4,823) (42,942) (574,871)
Changes in assets and liabilities:
Accounts receivable(160,119) 36,253 (23,145) 289,445 142,434
Prepaids12,805 (1,563) - 2,304 13,546
Inventories(99,042) (4,652) - - (103,694)
Accounts payable(270,778) 6,221 230,704 (231,538) (265,391)
Accrued liabilities(45,710) (35,033) (2,635) (24,166) (107,544)
Deposits and retainage- 7,132 - - 7,132
Deferred revenue3,661 - - - 3,661
Compensated absences14,257 5,685 (237) (41,130) (21,425)
Net cash provided (used) by operating activities (4,120) $ 2,190,180 $ 167,923 $ (48,027) $ 2,305,956 $
Noncash investing, capital and financing activities
Capital contributions - developers139,319 $ 506,225 $ - $ - $ 645,544 $
The accompanying notes are an integral part of this financial statement.
TABLE OF CONTENTS
Note 1 – Summary of Significant Accounting Policies ................................................................................... 54
Note 2 – Stewardship, Compliance, and Accountability 60
Note 3 – Deposits and Investments 61
Note 4 – Restricted Cash and Cash Equivalents ............................................................................................ 63
Note 5 – Interfund Receivables, Payables, and Transfers 63
Note 6 – Equity Investment in Joint Venture ................................................................................................ 64
Note 7 – Capital Assets 64
Note 8 – Grants 66
Note 9 – Developer and Customer Deposits ................................................................................................. 66
Note 10 – Financial Leases 66
Note 11 – Long-term Liabilities ..................................................................................................................... 67
Note 12 – Conduit Debt Obligations 69
Note 13 – Risk Management 69
Note 14 – Retirement Plans .......................................................................................................................... 70
Note 15 – Redevelopment Agency of Riverton City 77
Note 16 – Riverton Law Enforcement Service Area ...................................................................................... 78
Note 17 – Riverton Fire Service Area 78
Note 18 – Contingent Liabilities 78
Note 19 – Commitments and Agreements ................................................................................................... 78
Note 20 – Subsequent Events 79
Riverton City Corporation (the City) was incorporated on July 3, 1967, as a third-class city under the provisions of the State of Utah and operates under a six-member council form of government with City Manager by ordinance. The governing body consists of six elected officials; a Mayor and five Council Members Department heads are under the direction of the City Manager. The City provides the following services:
• General administrative services
• Public safety
• Highways and public improvements including stormwater construction and operations
• Parks and recreation
• Community development
• Culinary water utility
• Secondary water utility
• Sanitation utility
The City’s financial statements are prepared in accordance with Generally Accepted Accounting Principles (GAAP). The Governmental Accounting Standards Board (GASB) is the accepted standards–setting body for establishing accounting and financial reporting principles. The accounting policies of the City conform to accounting principles generally accepted in the United States of America as applicable to governmental units. The more significant accounting policies established by GAAP and used by the City are discussed below.
In evaluating how to define the City for financial reporting purposes, management has considered all potential component units. The decision to include a potential component unit in the reporting entity was made by applying the criteria set forth in the related GASB 61 pronouncement. The basic, but not the only, criterion for including a potential component unit within the reporting entity is the governing body's ability to exercise oversight responsibility. The most significant manifestation of this ability is financial interdependency and accountability. Other expressions of the ability to exercise oversight responsibility include, but are not limited to, the selection of governing authority, the designation of management, and the ability to significantly influence operations and accountability of fiscal matters. The other criterion used to evaluate potential component units for inclusion or exclusion from the reporting entity is the existence of special financing relationships, regardless of whether the City is able to exercise oversight responsibilities.
The accompanying financial statements present the government and its component units, entities for which the government is considered to be financially accountable. Blended component units, although legally separate entities, are in substance, part of the government’s operations.
The Redevelopment Agency of Riverton City (RDA) was established to prepare and carry out plans to improve, rehabilitate and redevelop blighted areas within the City. In addition to the redevelopment project areas, the City may also have Economic Development Areas (EDA), or Community Development Areas (CDA) within the agency’s boundaries. Collectively, any RDA, CDA and EDA project areas will be identified as the Riverton City RDA The RDA is governed by a board composed of the members of the City Council and the Mayor. Although it is a legally separate entity from the City, the RDA is reported as if it were part of the primary government because of the City’s ability to impose its will upon the operations of the RDA. In conformity with GAAP, the financial statements of the RDA have been included in the financial reporting entity as a blended component unit. The RDA is included in these financial statements as a special revenue fund. Separate financial statements are not issued for the RDA.
The Riverton Law Enforcement Service Area (RLESA) was established to fund the operations of the Riverton Police Department. RLESA is a separate legal taxing entity that assesses property taxes annually. RLESA is governed by a board composed of the members of the City Council and the Mayor. Although RLESA is a legally separate entity, it is reported as if it were part of the primary government because of the City’s ability to impose its will upon RLESA. In conformity with GAAP, the financial statements of RLESA have been included in the financial reporting entity as a blended component unit. RLESA is included in these financial statements as a special revenue fund. Separate financial statements are not issued for RLESA
The Riverton Fire Service Area (RFSA) was established as a taxing entity to fund fire suppression services provided to the geographical area of Riverton City. Fire suppression services are provided by the Unified Fire Authority. RFSA is a separate legal taxing entity that assesses property taxes annually. RFSA is governed by a board composed of the members of the City Council and the Mayor. RFSA is reported as a discretely presented component unit to offer clarification to the reader
as its accounting and State reporting period is a calendar year instead of a fiscal year. Separate financial statements for RFSA have been prepared in conformity with GAAP and have been audited by an external auditor. The full financial statements for RFSA can be obtained by contacting the Riverton City Administrative Services Department, 12830 S Redwood Road, Riverton, UT 84065.
The City is not a component unit of any other entity. The City’s basic financial statements include all City operations. These statements include both government–wide (reporting the City as a whole) and fund financial statements (individually reporting the City’s major funds). Both the government–wide and fund financial statements categorize primary activities as either governmental or business–type. The City’s general government, public safety, highways and public improvements including stormwater operations, and parks and recreation are classified as governmental activities. The City’s culinary water, secondary water, and sanitation are classified as business–type activities.
The government–wide financial statements (i.e., the Statement of Net Position and the Statement of Activities) report information on all of the governmental and businesstype activities of the City and its component units. As a general rule, the effect of interfund activity has been removed from these statements. Governmental activities, which normally are supported by taxes, charges for services, and intergovernmental revenues, are reported separately from business–type activities, which rely, to a significant extent, on fees and charges for services.
The Statement of Activities demonstrates the degree to which the direct expenses of a given function or segment is offset by program revenues. Direct expenses are those which are clearly identifiable with a specific function or segment. Program revenues include 1 ) Charges to customers or applicants who purchase, use or directly benefit from goods, services or privileges provided by a given function or segment, and 2 ) Grants and contributions that are restricted to meeting the operational or capital requirements of a particular function or segment. Taxes and other items properly excluded from program revenues are reported instead as general revenues.
Separate financial statements are provided for governmental funds and proprietary funds. Major individual governmental funds and major individual enterprise funds are reported as separate columns in the fund financial statements.
The City holds a small amount of custodial funds in the form of stale-dated checks that have not yet been sent to the State of Utah’s Unclaimed Property Division ($2,749). In addition, the City also holds a small amount of Evidence Held-in-trust ($1,490), as well as a small amount of Court Trust ($16,154). Under normal circumstances, these funds would be considered and reported as a Fiduciary Fund. However, management does not consider these balances to be material and has therefore determined it prudent to continue reporting these funds within the General Fund.
The government–wide financial statements are reported using the economic resources measurement focus and the accrual basis of accounting, as are the proprietary fund financial statements Revenues are recorded when earned and expenses are recorded when a liability is incurred, regardless of the timing of related cash flows. Property taxes are recognized as revenues in the year for which they are levied. Grants and similar items are recognized as revenue as soon as all eligibility requirements imposed by the provider have been met.
The use of financial resources to acquire capital assets is capitalized as assets in the government–wide financial statements, rather than reported as expenditures. Proceeds of long–term debt are recorded as a liability in the government–wide financial statements, rather than other financing sources Amounts paid to reduce long–term debt of the City are reported as reductions of the related liability
Governmental fund financial statements are reported using the current financial resources measurement focus and the modified accrual basis of accounting. Revenues are recognized when they are both measurable and available (i.e. collectable within the current period or soon enough thereafter to satisfy current liabilities) For this purpose, the City considers all revenues available if they are collected within 60 days of the end of the current fiscal period. Expenditures generally are recorded when a liability is incurred, as under accrual accounting. However, debt service expenditures, as well as expenditures related to compensated absences, claims, and judgments are recorded only when payment is due.
Sales tax, franchise taxes, licenses, interest, and earned but unreimbursed state and federal grants are considered to be susceptible to accrual and have been so recognized as revenues of the current fiscal period. Property taxes are measurable as of the date levied (assessed) and are recognized as revenues when they become available. Available means when due, or past due, and received within the current period or collected soon enough thereafter (within 60 days) to be used to pay liabilities of the current period. All other revenues are considered to be measurable and available only when cash is received by the City.
The City reports the following major governmental funds:
• The General Fund is the City’s primary operating fund. It accounts for all financial resources of the general government, except for those required to be accounted for in another fund.
• The Riverton Economic Development Infrastructure and Investment Fund (REDIIF) – Capital Projects Fund accounts for the financial resources to finance economic development including the acquisition or construction of major projects of the City.
• The Grants Capital Projects Fund was established to account for the revenues and expenditures associated with federal grants.
• The Redevelopment Agency of Riverton City – Special Revenue Fund is used to account for the property tax increment received from other taxing entities, and the expenditures related to, any RDA, EDA, or CDA within the agency’s boundaries.
• The Riverton Law Enforcement Service Area – Special Revenue Fund is used to account for the assessment and collection of property taxes of the service area, and transfer said funds to the General Fund to fund the Riverton Police Department operations.
The City reports the following major proprietary funds:
• The Culinary Water Fund accounts for the activities of the City’s culinary water distribution system including billing customers, collections from customers, and system repairs and improvements
• The Secondary Water Fund accounts for the activities of the City’s secondary water distribution system including billing customers, collections from customers, and system repairs and improvements.
• The Sanitation Fund accounts for the activities of the City’s solid waste collection operations including billing customers, collections from customers, garbage collection contract, and tipping and disposal fees.
As a general rule, the effect of interfund activity has been eliminated from the government–wide financial statements. Exceptions to this general rule are allocations of costs from the General Fund to various enterprise funds for providing administrative and billing services for such funds. Elimination of these charges would distort the direct costs and program expenditures reported for the various functions concerned.
Another exception to this rule is non-cash, or nonreciprocal, transfers that are recorded from the funds to account for the City’s internal use of utilities that are not billed. The City has determined that it will not charge itself for any Rivertonprovided utility services (culinary water, secondary water, and sanitation) used for municipal purposes.
Amounts reported as program revenues include 1.) Charges for goods, services, or privileges provided, 2 ) Tax increment received from other taxing entities, operating grants and contributions, and 3.) Capital grants and contributions, including special assessments. General revenues include all taxes imposed by the City.
Proprietary funds distinguish operating revenues and expenses from nonoperating items. Operating revenues and expenses generally result from providing services and producing and delivering goods in connection with a proprietary fund’s principal ongoing operations.
The principal operating revenues of all enterprise funds are charges to customers for sales and services. Operating expenses for enterprise funds include the cost of sales and services, administrative expenses, and depreciation on capital assets. All revenues and expenses not meeting this definition are reported as nonoperating revenues and expenses.
When both restricted and unrestricted resources are available for use, it is the City’s policy to use restricted resources before unrestricted resources.
Cash includes cash on hand, demand deposits with banks and other financial institutions, and deposits in other types of accounts or cash management pools that have the general characteristics of demand deposit accounts. The City follows
the Utah Money Management Act (UMMA or “the Act”) for all investments, which allows for the investment of funds with federally insured depositories, investment in the Utah Public Treasurer’s Investment Fund (UPTIF) and other investments allowed by the State of Utah’s Money Management Act. Investments are reported at cost, which approximates fair value. The UPTIF operates in accordance with State laws and regulations. The reported value of the investment fund is approximately the same as the fair value of its shares, in accordance with GASB Statement No. 72, Fair Value Measurement and Application.
Cash equivalents are defined as short–term, highly liquid investments that are both readily convertible to known amounts of cash and so near their maturities that they present insignificant risk of changes in value due to fluctuations in interest rates. Investments with maturities of three months or less when purchased meet this definition.
Activities between funds that are representative of lending/borrowing arrangements outstanding at the end of the fiscal year are referred to as “due to or due from other funds.” Advances between funds, as reported in the fund financial statements, are offset by fund balance reserve accounts in applicable governmental funds to indicate they are not available for appropriation and are not available financial resources.
Other receivables at June 30, 2022, consist of intergovernmental revenue, sales tax, franchise taxes, grants and utility billings The utility billings for charged services are billed to customers on a monthly basis. Unbilled service accounts receivable at June 30, 2022, is recorded based on July billings and are included in the operating revenues and accounts receivable at year end. Taxes, grants, and utility charges are deemed collectible in full, so no allowance for doubtful accounts is recorded.
Certain assets are classified as restricted because their use is limited by independent third parties, enabling legislation, or other laws and statutes. These restrictions may include future debt service payments, unexpended portions of bonds issued for capital construction, unexpended Class “C” revenue, unexpended impact fees, and other agreements with third parties.
Inventories of materials and supplies in the proprietary funds, consisting principally of materials used in the repair of the
distribution and collection systems, are valued at cost and accounted for on a first–in, first–out basis (FIFO). Certain payments to vendors reflect costs applicable to future accounting periods and are recorded as prepaid items, using the consumption method, in both government–wide and fund financial statements.
The investment in Trans–Jordan Cities Landfill represents the City’s 11.20% ownership in a joint venture and is accounted for by the equity method of accounting. Under this method, the Sanitation Fund (enterprise fund) records its share of the joint venture’s net income or loss for each period.
Capital assets, which include property, plant, equipment, and infrastructure assets (e.g., roads, bridges, sidewalks, and similar items), are reported in the applicable governmental or business–type activities columns in the government–wide financial statements.
Capital assets are defined by the City as assets with an initial, individual cost of more than $5,000 and an estimated useful life in excess of one year. Such assets are recorded at historical cost or estimated historical cost if purchased or constructed. Donated capital assets are recorded at acquisition value at the date of donation. The City reports infrastructure assets on a network and subsystem basis. Accordingly, the amounts spent for the construction or acquisition of infrastructure assets are capitalized and reported in the government–wide financial statements.
The costs of normal maintenance and repairs that do not add to the value of the asset or materially extend the useful life of the asset are not capitalized. Major outlays for capital assets and improvements are capitalized as projects are completed.
Property, plant, and equipment is depreciated using the straight–line half-year method over the following estimated useful lives:
Assets Years
Infrastructure:
Water distribution systems 60
Curbs, gutters, and sidewalks 40
Storm water collection systems 40
Bridges 40 Streets 30 - 40
Street lighting systems 30
Buildings and improvements 20 - 40
Improvements other than buildings 20 - 40
Machinery and equipment 10 - 15
Office furniture and equipment 10 Vehicles 5 - 10
Unearned revenue arises when resources are received by the City before it has a legal claim to them, as when grant monies are received prior to the incurrence of qualifying expenditures. In subsequent periods, when both revenue recognition criteria are met, or when the City has a legal claim to the resources, the revenue is recognized.
For governmental funds, amounts of accumulated vacation leave and compensatory time that are not expected to be liquidated with expendable, available, financial resources are reported as liabilities in the government–wide Statement of Net Position. Current year compensatory time and accumulated vacation leave are reported as expenses in the government–wide Statement of Activities. No expenditures are reported for these amounts in the fund financial statements.
The General Fund is the governmental fund that is used for liquidating compensated absences.
Accumulated vacation leave, and compensatory time of proprietary funds are recorded as expenses and liabilities of those funds as the benefits accrue and are thus recorded in both the government–wide financial statements and the individual fund financial statements. The maximum, annual, carry-forward of accrued vacation is 200 hours. Compensatory time is earned based on Fair Labor Standards Act (FLSA) overtime rules and is fully vested when earned. The maximum number of compensatory time an employee can carry is 80 hours. When an employee leaves or is terminated, accumulated vacation and compensatory hours are paid out at his or her current hourly rate.
In addition to assets, financial statements will sometimes report a separate section for deferred outflows of resources. This separate financial statement element, deferred outflows of resources, represents a consumption of net assets that applies to a future period(s) and will not be recognized as an outflow of resources (expense/expenditure) until then.
A deferred loss on refunding results from the difference in the carrying value of the refunded debt and the reacquisition price.
In addition to liabilities, the financial statements will sometimes report a separate section for deferred inflows of resources. This separate financial statement element, deferred inflows of resources, represents an acquisition of net assets that applies to a future period(s) and will not be recognized as an inflow of resources (revenue) until that time.
Governmental funds report revenue that is unavailable as deferred inflows of resources, such as revenue from property taxes and special assessments. These amounts are deferred and recognized as revenue in the periods that they become available.
For purposes of measuring the net pension liability, deferred outflows of resources and deferred inflows of resources related to pensions, and pension expense, information about the fiduciary net position of the Utah Retirement Systems Pension Plan (URS) including additions to and deductions from URS's fiduciary net position, have been determined on the same basis as they are reported by URS. For this purpose, benefit payments (including refunds of employee contributions) are recognized when due and payable in accordance with the benefit terms. Investments are reported at fair value.
The General Fund is the governmental fund that is used for liquidating any pension related liabilities.
Long–term debt and other long–term obligations are reported as liabilities in the applicable columns for governmental activities or business–type activities and are also reported in the proprietary fund financial statements. Bond premiums and
discounts are deferred and amortized over the life of the applicable debt. In the governmental fund financial statements, bond premiums and discounts are recognized during the current period as other financing sources and uses. The par value of debt issued is also reported in the category with other financing sources Issuance costs, whether or not withheld from the actual debt proceeds received, are reported as debt service expenditures in the current period
The categories and descriptions of fund balance are as follows: Nonspendable Fund Balance – Prepaid expenditures, and other similar assets not in spendable form or that are contractually required to be maintained intact are classified as nonspendable fund balance.
Restricted Fund Balance – Assets that are constrained by externally imposed restrictions, or by law through constitutional provisions or enabling legislation are classified as restricted fund balance.
Committed Fund Balance – Amounts formally designated by City Council through ordinance for a specific purpose that cannot be used for another purpose unless the City Council formally changes the use through a superseding ordinance are classified as committed fund balance.
Assigned Fund Balance – Amounts constrained by City Council, for a specific purpose, through the appropriations process in establishing and amending budgets are classified as assigned fund balance Furthermore, funds in special revenue, capital project, and permanent funds are by their nature assigned to the purpose for which the resources are collected.
Unassigned Fund Balance – Amounts that may be used for any governmental purpose are classified as unassigned fund balance. The General Fund is the only fund that reports a positive unassigned fund balance. In other governmental funds it is not appropriate to report a positive unassigned fund balance
However, in governmental funds other than the General Fund, if expenditures incurred for specific purposes exceed the amounts that are restricted, committed, or assigned to those purposes, it may be necessary to report a negative unassigned fund balance in that fund.
When an expenditure qualifies to be used from more than one fund balance classification identified above, it is the City’s policy to use resources in the following order: restricted, committed, assigned, and then unassigned.
In June 2017, the Governmental Accounting Standards Board (GASB) issued Statement No. 87, Leases, which establishes criteria for identifying and properly reporting Leases for all state and local governments. The Statement establishes a single model for lease accounting based on the principle that leases are financings of the right to use an asset.
Riverton City has adopted this standard for the fiscal year ended June 30, 2022. However, an in-depth analysis of the City’s agreements found that no lease arrangements that are subject to GASB 87 exist.
The preparation of the financial statements in accordance with GAAP requires management to make estimates and assumptions that affect the reported amounts of certain financial statement balances. Actual results could vary from those estimates.
Estimated revenues and appropriations may be increased or decreased by resolution of the City Council at any time during the year. A public hearing must be held prior to any proposed increase in a fund's appropriations. Annual budgets are established for all funds of the City. The level of the City's budgetary control (that is, the level at which the City's expenditures cannot legally exceed the appropriated amounts) is established at the department level (i.e. development services, parks and public services, and public works). Department heads are responsible to the City Manager and governing body for operating within their approved appropriations. All annual budgets lapse at fiscal year–end
Utah State law prohibits the appropriation of Fund Balance until the sum of unassigned, assigned, and committed General Fund balance exceeds 5% of the actual General Fund revenues. Until the sum of the stated fund balance categories is greater than 5%, fund balance cannot be budgeted, but is used to provide working capital to meet emergency expenditures and to cover unanticipated deficits until tax revenue is received.
Utah State law also prohibits the accumulation of the stated General Fund balance categories in any amount greater than 35% of the current year’s actual General Fund revenues.
Once adopted, the budget can be amended by subsequent City Council action. The City Council can amend the budget to any extent, provided the budgeted expenditures do not exceed budgeted revenues and appropriated fund balance, in which case a public hearing must be held. The Mayor may reallocate unexpended appropriated balances from one expenditure account to another within that department during the budget year.
Annual budgets for the General Fund, special revenue funds, and capital projects funds were legally adopted by the City Council and are prepared on the modified–accrual method of accounting. Encumbrance accounting is not used by the City. Although Utah State law requires the initial preparation of budgets for all City funds (both governmental and proprietary), it only requires the reporting of budget versus actual for governmental funds. Expenditures in the capital projects funds are also budgeted annually

In accordance with State law, annual budgets are prepared and adopted by the City Council on or before June 22, for the ensuing fiscal year when no property tax increases are being imposed In the event of a property tax increase, annual budgets are prepared and adopted on or before August 17.
On or before June 22 of each year, the City sets the property tax rate If the City intends to increase property tax revenues above that of the previous year, State law requires the City to provide public notice to property owners and to hold public hearings. When these special public hearings are necessary, the adoption of the final budget must be done before August 17. All property taxes levied by the City are assessed and collected by Salt Lake County. Taxes are levied as of January 1

TAX REVENUES (continued)
and are due November 30; any delinquent taxes are subject to penalties. Unless the delinquent taxes and penalties are paid before January 15, a lien is attached to the property, and the amount of taxes and penalties bears interest from January 1 until paid; once paid, the lien is removed.
If after five years, delinquent taxes have not been paid, the County sells the property at a tax sale. Tax collections are remitted to the City from the County on a monthly basis.
Sales and use and telecom taxes are collected by the Utah State Tax Commission and remitted to the City monthly. An accrual has been made for all taxes received by the State for the period ended June 30, and thus due and payable to the City.
Franchise taxes are collected by natural gas, electric utilities, and cable television companies and remitted to the City regularly. As of June 30, accruals have been made for all fees due and payable to the City.
includes cash accounts that are separately held by several of the City's funds.
The City’s deposit and investment policy is to follow UMMA; however, the City does not have a separate deposit and investment policy that addresses specific types of deposit and investment risks to which the City is exposed.
As of June 30, 2022, the City’s demand deposits and cash on hand amounted to $2,657,903. The City’s cash and cash equivalents and investments are exposed to certain risks as outlined below
This is the risk that, in the event of a bank or counterparty failure, the City’s deposits or investments may not be returned. As of June 30, 2022, the City held $3,976,798 with its bank. Of that amount, $3,726,798 of the City’s bank balance was exposed to custodial credit risk because it was uninsured and uncollateralized. As of June 30, 2022, the City had investments in the Utah Public Treasurers Investment Fund (UPTIF) of $24,878,151
The Utah Money Management Council has the responsibility to advise the State Treasurer about investment policies, and to promote measures that will assist in strengthening the banking and credit structure of the State. The Utah Money Management Council also reviews the rules adopted under the authority of the UMMA that relate to the deposit and investment of public funds.
The City maintains a cash and investment pool that is available for use by all funds. Cash includes amounts in demand deposits as well as term deposits. Investments are stated at cost, which approximates fair value. Each fund's portion of this pool is displayed on the combined balance sheet as "cash and cash equivalents” and “restricted cash and cash equivalents,” which
The City follows the requirements of the Utah Money Management Act (Utah Code, Title 51, Chapter 7) in handling its depository and investment transactions. UMMA requires the depositing of City funds in a qualified depository. UMMA defines a qualified depository as any financial institution whose deposits are insured by an agency of the Federal Government and which has been certified by the State Commissioner of Financial Institutions as meeting the requirements of the Act and adhering to the rules of the Utah Money Management Council.
UMMA defines the types of securities authorized as appropriate investments for the City’s funds and the conditions for making investment transactions. Investment transactions may be conducted only through qualified depositories, certified dealers, or directly with issuers of the investment securities.
Statutes authorize the City to invest in negotiable or nonnegotiable deposits of qualified and permitted negotiable depositories. The statute also allows the City to purchase:
• commercial paper that is classified as “first tier” by two nationally recognized statistical rating organizations
• bankers’ acceptances
• obligations of the U.S. Treasury including bills, notes, and bonds
• obligations, other than mortgage derivative products, issued by U.S. government-sponsored enterprises (U.S. Agencies) such as the Federal Home Loan Bank System, Federal Home Loan Mortgage Corporation (Freddie Mac), and Federal National Mortgage Association (Fannie Mae)
• bonds, notes, and other evidence of indebtedness of political subdivisions of the State
• fixed rate corporate obligations and variable rate securities rated “A” or higher, or the equivalent of “A” or higher, by two nationally recognized statistical rating organizations
• shares or certificates in a money market mutual fund as defined in the Act
• UPTIF
The State Treasurer’s Office operates the Utah Public Treasurers’ Investment Fund The UPTIF is available for investment of funds administered by any Utah public treasurer and is not registered with the SEC as an investment company. The UPTIF is authorized and regulated by the Money Management Act. The Act established the Utah Money Management Council which oversees the activities of the State Treasurer and the UPTIF and details the types of authorized investments. Deposits in the UPTIF are not insured or otherwise guaranteed by the State of Utah, and participants share proportionally in any realized gains or losses on investments.
The UPTIF operates and reports to participants on an amortized cost basis. The income, gains, and losses of the UPTIF, net of administration fees, are allocated based upon the participant’s average daily balance. The fair value of the UPTIF investment pool is approximately equal to the value of the pool shares.
The City measures and records its investments using fair value measurement guidelines established by GAAP These guidelines recognize a three-tier fair value hierarchy, as follows:
• Level 1: Quoted prices for identical investments in active markets
• Level 2: Observable inputs other than quoted market prices
• Level 3: Unobservable
At June 30, 2022, the majority of the City’s investments, an amount totaling $24,878,151 was held at the UPTIF. UPTIF applied the June 30, 2022, fair value factor, as calculated by the Utah State Treasurer using the market approach, and applies to the City’s daily balance in the Fund The method used for valuing PTIF approximates cost, thus any significant change in the valuation method is not considered material.
The UPTIF investment is considered a Level 2 investment according to the fair value hierarchy.
Riverton City has no investments that would be classified Level 1 or Level 3 according to the three–tier hierarchy.
This is the risk that changes in interest rates will adversely affect the fair value of an investment. The City’s policy for managing its exposure to fair value loss from changes in interest rates is to follow UMMA The Act requires that the remaining term to maturity of investments may not exceed the period of availability of the funds to be invested. Investments within the UPTIF have a weighted average maturity of less than 90 days.
Credit risk is the risk that an issuer or other counterparty to an investment will not fulfill its obligations. The City’s policy for reducing its exposure to credit risk is to comply with the State’s Money Management Act, as previously discussed.
This is the risk of loss attributed to the magnitude of the City’s investment in a single issuer. The City’s policy for reducing this risk of loss is to comply with the rules of the Money Management Council. The UPTIF is highly diversified and must comply with various rules of the UMMA and the Money Management Council.
Certain cash and cash equivalents are restricted to use as follows as of June 30, 2022:
Amount
Restricted cash - Governmental activities
Restricted for "C" road funds 1,419,594 $
Restricted for projects and debt service 418,775
Restricted for impact fees 2,856,491
Total governmental activities 4,694,860
Restricted cash - Business-type activities
Restricted for debt service 927,753
Restricted for impact fees 115,363
Total business-type activities 1,043,116
Total restricted cash and cash equivalents 5,737,976 $
The City does not have any interfund balances as of June 30, 2022
Various transfers that are not intended to be repaid occurred throughout the year. The purpose of the transfers was to provide cash flows for normal operations. Such amounts for the fiscal year ended June 30, 2022, were as follows:
Transfers inTransfers out
General 7,274,990 $ 3,901,322 $ Gov't funds asset group 22,681,293 854,594 REDIIF 1,110,000 1,330,495 Redevelopment Agency 49,674RLESA - 5,740,000
Nonmajor govermental funds 4,107,476 1,218,838 Secondary water 2,080,415Sanitation 30,000Storm water - 24,288,599 37,333,848 $ 37,333,848 $
The largest of the transfers noted above is for the transfer of cash, capital assets, and liabilities from the Stormwater proprietary fund into the General Fund and Capital Projects Fund – Stormwater. The City Council decided to drastically reduce the Stormwater user fee as a method to increase other usage fees for culinary water, secondary water, and sanitation. This large reduction in Stormwater fees eliminated the ability to treat the Stormwater Fund as an enterprise fund; all operations were rolled into the General Fund and the capital projects were assigned to a new capital projects fund.
The General Fund transferred funds to the various capital projects funds to fund its capital facilities plan.
The RLESA special revenue fund transfers the bulk of its property tax revenue each year to the General Fund to cover the operations of the Riverton Police Department.

The REDIIF capital projects made transfers to the RDA to cover administrative costs and transferred funds to the Secondary Water Fund to help payoff the 2020B Bond Series.
In addition to receiving all of the capital assets transferred from the Stormwater Fund, the governmental assets group also transferred a CIP asset to the Secondary Water Fund.
There were also a couple of transfers from the parks and roads community impact capital projects funds to the REDIIF fund for impact fee buy-in to cover debt service.
The City has a 11.20% ownership in the Trans–Jordan Cities Landfill (Trans–Jordan), which is accounted for in the Sanitation Fund using the equity method. In addition to the City, Trans–Jordan is owned by the cities of Draper, Midvale, Murray, Sandy, South Jordan, and West Jordan which own 10.40%, 5.16%, 7.90%, 28.28%, 15.69% and 21.36%, respectively. Trans–Jordan is a separate legal entity and political subdivision of the State of Utah and was formed pursuant to the provisions of the Interlocal Cooperation Act.
Trans–Jordan was formed to construct, operate, and maintain a refuse dumping facility. Trans–Jordan is governed by its board of directors. Under the organization agreement, the board of directors is appointed by the members. The management is under the board of directors, which elects officers and appoints management staff.
The City purchased an equity investment in Trans–Jordan on July 1, 1997. The City agreed to pay a total of $26.4 million for an interest in the landfill. On July 1, 2012, the City fulfilled its obligation to make capital contributions at Trans–Jordan Cities Landfill.
Annually, the City recognizes its pro–rata share of Trans–Jordan’s operating income or loss. For fiscal year 2022, Trans–Jordan reported an increase in net position of $3,585,149. The City recognized an equity gain from the joint venture of $404,745 which is reported in the Sanitation enterprise fund under the nonoperating revenues (expenses) heading for the fund financial statements and as a program revenue in the Statement of Activities
The complete financial statements for Trans-Jordan for the year ended June 30, 2022, can be obtained from Trans-Jordan Cities Landfill, 10873 South 7200 West, South Jordan, Utah, 84095.
Capital asset activity for the year ended June 30, 2022, was as follows: 07/01/21 Increases Decreases Transfers 06/30/22
Capital assets, not being depreciated: Land and rights of way 105,733,107 $ 2,097,313 $ - $ 316,041 $ 108,146,461 $ Construction in progress 2,331,417 1,236,573 - (3,174,123) 393,867
Total capital assets, not being depreciated 108,064,524 3,333,886 - (2,858,082) 108,540,328
Capital assets, being depreciated: Building and improvements 23,345,648 245,143 - 154,489 23,745,280 Improvements other than buildings 32,921,615 673,162 - 20,716 33,615,493 Machinery and equipment 1,654,693 435,426 (122,198) 22,067 1,989,988 Office furniture and equipment 1,679,008 60,659 - 26,451 1,766,118 Vehicles 3,834,469 2,230,562 (997,368) 1,067,957 6,135,620 Infrastructure 122,794,470 4,392,984 - 43,438,819 170,626,273
Total capital assets, being depreciated 186,229,903 8,037,936 (1,119,566) 44,730,499 237,878,772
Accumulated depreciation:
Building and improvements (6,733,151) (674,417) - - (7,407,568) Improvements other than buildings (15,983,555) (1,549,913) - - (17,533,468) Machinery and equipment (838,401) (104,711) 57,599 (736) (886,249)
Office furniture and equipment (1,184,940) (125,659) - (6,281) (1,316,880) Vehicles (2,111,333) (920,656) 563,160 (358,112) (2,826,941) Infrastructure (68,056,455) (3,471,676) - (19,596,514) (91,124,645)
Total accumulated depreciation (94,907,835) (6,847,032) 620,759 (19,961,643) (121,095,751)
Total capital assets being depreciated, net 91,322,068 1,190,904 (498,807) 24,768,856 116,783,021
Governmental capital assets, net 199,386,592 $ 4,524,790 $ (498,807) $ 21,910,774 $ 225,323,349 $
Business-type activtities
Capital assets, not being depreciated:
07/01/21 Increases Decreases Transfers 06/30/22
Land 3,162,260 $ - $ - $ (316,041) $ 2,846,219 $ Water shares 14,465,916 448,672 - - 14,914,588 Construction in progress 466,546 - - 388,048 854,594
Total capital assets, not being depreciated 18,094,722 448,672 - 72,007 18,615,401
Capital assets, being depreciated:
Buildings and improvements 7,510,146 69,932 - 28,413 7,608,491
Machinery and equipment 647,387 50,000 - (22,067) 675,320 Office furniture and equipment 444,750 15,404 - (26,451) 433,703 Vehicles 2,680,141 227,678 (273,329) (1,041,297) 1,593,193
Infrastructure:
Culinary water system 46,117,635 1,012,590 - 173,995 47,304,220 Secondary water system 49,786,821 341,194 - 50,207 50,178,222 Storm water system 41,107,224 - - (41,107,224) -
Total capital assets, depreciated 148,294,104 1,716,798 (273,329) (41,944,424) 107,793,149
Accumulated depreciation:
Buildings and improvements (2,721,827) (190,566) - - (2,912,393)
Machinery and equipment (341,446) (37,086) - 736 (377,796) Office furniture and equipment (276,005) (36,442) - 6,281 (306,166) Vehicles (946,158) (139,705) 114,207 358,112 (613,544)
Infrastructure:
Culinary water system (16,090,660) (721,513) - - (16,812,173) Secondary water system (14,846,647) (839,195) - - (15,685,842) Storm water system (19,596,514) - - 19,596,514 -
Total accumulated depreciation (54,819,257) (1,964,507) 114,207 19,961,643 (36,707,914)
Total capital assets being depreciated, net 93,474,847 (247,709) (159,122) (21,982,781) 71,085,235
Business-type capital assets, net 111,569,569 $ 200,963 $ (159,122) $ (21,910,774) $ 89,700,636 $
In the government–wide financial statements depreciation was charged as follows by program or activity:
Governmental activities:
General government 1,875,097 $ Public safety 709,302
Highways and public improvements 2,611,964 Parks and recreation 1,650,669 Total depreciation expense - governmental activities 6,847,032 $
Business-type activities:
Culinary water 971,357 $ Secondary water 993,150
Total depreciation expense - business-type activities 1,964,507 $

The City receives financial assistance from federal and state governmental agencies in the form of grants. The disbursement of funds received under these programs generally requires compliance with terms and conditions specified in the grant agreements and are subject to audit by the City’s independent auditors and other governmental auditors. Any disallowed claims resulting from such an audit could become a liability of the General Fund or other applicable funds. Based on prior experience, City administration believes such disallowance, if any, would be immaterial.
Developer and customer deposits are typically deposits that are held by the City for construction projects until such time that refund or forfeiture is warranted.
The City has entered into financing lease agreements, as lessee, for financing the acquisition of police vehicles totaling
$1,443,736. The lease arrangement for these vehicles is such that ownership transfers to the City immediately upon the signing of the lease. Thus, these lease arrangements are treated as financing mechanisms and are not governed by GASB 87.
At year end, the future principal and interest lease payments for this financing arrangement is $1,296,633. Interest rates for this balance vary from 1.25% to 2.25% This financing lease is for governmental activities.
The future minimum lease obligations as of June 30, 2022, were as follows:
Year ending June 30, 2023 359,797 $ 2024 418,009 2025 337,646 2026 181,180
Total minimum lease payments 1,296,633
Less amount representing interest 49,814
Present value of minimum lease payments 1,246,820
Amount due within one year 516,521
Amount due after one year 730,298 $
Long–term debt activity for the year ended June 30, 2022, was as follows:
07/01/21 Increases Decreases 06/30/22 Due in One Year
Governmental activities

Bonds payable: Franchise and sales tax revenue bonds 31,512,000 $ - $ (1,071,000) $ 30,441,000 $ 1,157,000 $ Unamortized premiums 931,661 - (130,160) 801,501 114,720
Total bonds payable 32,443,661 - (1,201,160) 31,242,501 1,271,720
Financing leases - 1,443,736 (196,916) 1,246,820 516,521
Compensated absences 479,762 510,583 (373,241) 617,104 493,683
Governmental activities, long-term liabilities 32,923,423 $ 1,954,319 $ (1,771,317) $ 33,106,425 $ 2,281,924 $
Business-type activities
Bonds payable: Water revenue bonds 10,553,000 $ - $ (5,342,000) $ 5,211,000 $ 520,000 $ Unamortized premiums 17,538 - (11,692) 5,846 5,846 Unamortized discounts (40,733) - 40,733 - -
Total bonds payable 10,529,805 - (5,312,959) 5,216,846 525,846 Compensated absences 191,267 148,889 (170,314) 169,842 135,872
Business-type activities, long-term liabilities 10,721,072 $ 148,889 $ (5,483,273) $ 5,386,688 $ 661,718 $
GOVERNMENTAL ACTIVITIES:
Series 2012 Franchise and Sales Tax RevenueRefundingBonds,originalissue of $2,268,000, principalduein annualinstallmentsbeginning December 2013, interest at 2.39% dueinsemi-annualinstallmentsbeginning June 2013, with thefinalpaymentdue December 2024. Thebonds were issued to refundthe series 2004A Franchise and Sales Tax RevenueBonds,which were issued to financetherenovationand reconstruction of City Hall.
Series 2013 Franchise and Sales Tax RevenueBonds,originalissue of $18,500,000, principaldueinannual installmentsbeginning December 2017, interest at 2.00% to 5.25% dueinsemi-annualinstallments beginningJune 2014, with thefinalpaymentdue December 2040. Thebonds were issued to financethe costs of renovationand construction of the City's mainregional park, other park open space improvements, and construction andequipping of a new law enforcement facility. $17,880,000 of these bonds were defeased bythe Series 2019 bonds.Theremainingamount of the 2013 bond series willbepaid off December 2022.
Series 2016 Franchise and Sales Tax RevenueRefundingBonds,originalissue of $10,180,000, principalduein annualinstallmentsbeginningJune 2018, interest at 2.00% to 5.00% dueinsemi-annualinstallments beginningJune 2016, with thefinalpaymentdueJune 2031. Thebonds were issued to refundthe series 2007 Franchise and Sales Tax Revenue Bonds, which were issued to finance road construction.
Series 2019 Franchise and Sales Tax RevenueRefundingBonds,originalissue of $20,511,000, principalduein annualinstallmentsbeginning December 2019, interest at 1.45% to 4.00% dueinsemi-annualinstallments beginning December 2019, with thefinalpaymentdue December 2040. Thebonds were issued to refundthe a portionof the series 2013 Franchise and Sales Tax RevenueBonds,which were issued to financethe costs of renovationand construction of the City's mainregional park, other park open space improvements,and construction and equipping of a new law enforcement facility.
853,000 $
165,000
9,195,000
20,228,000
Total Franchise and Sales Tax Revenue Bonds - Governmental Activities 30,441,000 $
Series 2011 Water RevenueRefundingBonds,originalissue of $4,615,000, principaldueinannual installmentsbeginning September 2013, interest at 2.00% to 3.00% dueinsemi-annualinstallments beginning March 2012, with thefinalpaymentdue September 2022. Thebonds were issued to refund a portionof the series 2003 Water RevenueBonds,which were issued to financethe cost of construction and implementation of the City's secondary water system.
Series 2020A Water RevenueBonds,originalissue of $5,491,000, principaldueinannualinstallments beginning September 2021, interest at 2.085% dueinsemi-annualinstallmentsbeginning September 2020, with thefinalpaymentdue September 2035. Thebonds were issued to financethe cost of construction and improvements to the City's secondary water system.
520,000 $
4,691,000
Total Water Revenue Bonds - Business-type Activities 5,211,000 $
The City’s general obligation debt is limited by Utah law to 4% of taxable assessed value; which is $162,774,419 for 2022. Riverton City does not have any general obligation debt outstanding as of June 30, 2022 All of the City’s Water Revenue and Franchise and Sales Tax Revenue Bonds are payable solely by a pledge and assignment of their associated revenue sources. The current revenue recognized during the period for pledged Water Revenue Bonds was $10,198,284 compared to the principal and interest of $1,469,198; which is 14% of the total pledged revenue. Note that the principal and interest figure noted here for water revenue bonds does not include the payoff of the 2020B Bond Series discussed later in this section. The current revenue recognized during the period for pledged Franchise and Sales Tax Revenue Bonds was $13,708,469 compared to the principal and interest of $2,349,554; which is 17% of the total pledged revenue.
The debt service requirements to maturity are as follows:
Year Ending June 30,
Principal Interest Totals 2023
1,157,000 $ 1,199,429 $ 2,356,429 $ 2024 1,361,000 1,003,582 2,364,582 2025 1,402,000 956,464 2,358,464 2026 1,454,000 910,580 2,364,580 2027 1,509,000 850,500 2,359,500 2028-2032 8,156,000 3,270,804 11,426,804 2033-2037 7,886,000 1,982,857 9,868,857 2038-2041 7,516,000 591,464 8,107,464 30,441,000 $ 10,765,680 $ 41,206,680 $
Year Ending June 30,
Principal Interest Totals 2023 520,000 $ 105,608 $ 625,608 $ 2024 318,000 94,492 412,492 2025 324,000 87,799 411,799 2026 331,000 80,971 411,971 2026 338,000 73,997 411,997 2028-2032 1,799,000 260,155 2,059,155 2033-2036 1,581,000 66,792 1,647,792 5,211,000 $ 769,814 $ 5,980,814 $
In December 2021, using a portion of the REDIIF fund balance and remaining construction funds from the 2020A Bond Series, the City paid off the 2020B Bond Series in full. As part of the payoff of this debt series, $47,000 was recognized as a gain on disposal of debt because the State of Utah noted that it was not part of the original payoff quoted. The purpose for the bond series was to add secondary water meters to all secondary water connections throughout the City. The City decided to forgo utilizing debt to pay for this project and instead submitted applications for grant funding to finish the project. The City was notified that it has received the grant funding; thus, the project will continue once the grant funding is received.
In October 2009, the City issued conduit debt for Hospital Revenue Bonds Series 2009 of $250 million. The bonds are payable solely and exclusively from the revenues arising from the pledge of a note, which the private company has given as security for the bonds. Neither the City, the State, nor any political subdivision thereof is obligated in any manner for repayment of the bonds. Accordingly, the bonds are not reported as liabilities in the accompanying financial statements. As of July 2018, this debt has been refunded outside of the conduit.
In October 2012, the City issued additional conduit debt for Hospital Revenue Bonds Series 2012A of $200 million to refund Hospital Revenue Bonds series 2007. The bonds are payable solely and exclusively from the revenues arising from
the pledge of a note, which the private company has given as security for the bonds. Neither the City, the State, nor any political subdivision thereof is obligated in any manner for repayment of the bonds. Accordingly, the bonds are not reported as liabilities in the accompanying financial statements. As of June 30, 2022, the outstanding amount of this obligation is $200 million.
The City is exposed to various risks of loss related to torts; theft of, damage to, and destruction of assets; errors and omissions; injuries to employees; and natural disasters. The City is a member of an insurance risk pool known as the Utah Local Governments Trust (the Trust), which covers all of these risks except natural disasters. The City is covered under a general liability insurance policy, with a $5,000 deductible and a policy
Plan description: Eligible plan participants are provided with pensions through Utah Retirement Systems (URS or Systems). URS are comprised of the following pension trust funds:
• Public Employees Noncontributory Retirement System (Noncontributory System); is a multiple employer, cost sharing, public employee retirement system.
• Public Safety Retirement System (Public Safety System) is a cost-sharing, multiple employer public employee retirement system.
• Tier 2 Public Employees Contributory Retirement System (Tier 2 Public Employees System); is a multiple employer, cost sharing, public employee retirement system.
• Tier 2 Public Safety and Firefighter Contributory Retirement System (Tier 2 Public Safety and
Firefighters System) is a multiple employer, cost sharing, public employee retirement system.
The Tier 2 Public Employees System became effective July 1, 2011. All eligible employees beginning on or after July 1, 2011, who have no previous service credit with any URS employer, are members of the Tier 2 Retirement System.
The Utah Retirement Systems (URS or Systems) are established and governed by the respective sections of Title 49 of the Utah Code Annotated 1953, as amended. The Systems' defined benefit plans are amended statutorily by the State Legislature. The Utah State Retirement Office Act in Title 49 provides for the administration of the Systems under the direction of the Utah State Retirement Board, whose members are appointed by the Governor. The Systems are fiduciary funds defined as pension (and other employee benefit) trust funds. URS is a component unit of the State of Utah. Title 49 of the Utah Code grants the authority to establish and amend the benefit terms.
URS issues a publicly available financial report that can be obtained by writing Utah Retirement Systems, 560 E. 200 S., Salt Lake City, Utah 84102 or visiting the website: www.urs.org/general/publications.
URS provides retirement, disability, and death benefits. Retirement benefits are as follows:
System Final Average Salary Years of service required and/or age eligible for benefit Benefit percent per year of service COLA**
Noncontributory System
Highest 3 years 30 years, any age 25 years, any age* 20 years, age 60* 10 years, age 62* 4 years, age 65
Public Safety System
Highest 3 Years 20 years, any age 10 years, age 60 4 years, age 65
Tier 2 Public Employees System
Highest 5 Years 35 years, any age 20 years, age 60* 10 years, age 62* 4 years, age 65
2.0% per year all years Up to 4%
2.5% per year up to 20 years; 2.0% per year over 20 years Up to 2.5% or 4% depending upon employer
1.50% per year all years Up to 2.5%
Tier 2 Public Safety and Firefighter System
*Actuarial reductions are applied.
Highest 5 Years 25 years, any age 20 years, age 60* 10 years, age 62* 4 years, age 65
1.5% per year to June 2020 2.00% per year July 2020 to present
Up to 2.5%
**All post-retirement cost-of-living adjustments (COLA) are non-compounding and are based on the original benefit except for Judges, which is a compounding benefit. The COLAs are also limited to the actual Consumer Price Index (CPI) increase for the year, although unused CPI increases not met, may be carried forward to subsequent years.
As a condition of participation in the Systems, employers and/or employees are required to contribute certain percentages of salary and wages as authorized by statute and specified by the Utah State Retirement Board. Contributions are actuarially determined as an amount that, when combined with employee contributions (where applicable), is expected to finance the costs of benefits earned by employees during the year, with an additional amount to finance any unfunded actuarial accrued liability. Contribution rates as of June 30, 2022 are as follows:
System Employee Employer Employer 401(k)
Contributory System
11 Local Government Div - Tier 1 6.00 14.46 N/A
111 Local Government Div - Tier 2 N/A 16.07 0.62 Noncontributory System
15 Local Government Div - Tier 1 N/A 18.47 N/A
Public Safety System Contributory
122 Tier 2 DB Hybrid Public Safety 2.27 23.74 N/A Noncontributory
49 Other Div B with 2.5% COLA N/A 32.28 N/A Tier 2 DC Only
211 Local Government N/A 6.69 10.00
222 Public Safety N/A 9.74 14.00 **Tier 2 rates include a statutory required contribution to finance the unfunded actuarial accrued liability of the Tier 1 plans
For fiscal year ended June 30, 2022, the employer and employee contributions to the Systems were as follows:
Employer Contributions Employee Contributions
Noncontributory System 770,246 $ N/A
Public Safety System 598,495Tier 2 Public Employees System 392,402Tier 2 Public Safety and Firefighter 157,830Tier 2 DC Only System 23,901 N/A Tier 2 DC Public Safety and Firefighter System 5,324 N/A
Total Contributions 1,948,198 $ - $ Contributions reported are the URS Board -approved required contributions by System. Contributions in the Tier 2 System are used to finance the unfunded liabilities in the Tier 1 Systems.
At June 30, 2022, the City had a net pension asset of $3,966,014 and a net pension liability of $0 Measurement Date - December 31, 2021
System
Noncontributory System 2,906,281 $ - $ 0.5074611% 0.5199924%(0.0125313%)
Contributory System - - 0.0% 0.0% 0.0%
Public Safety System 990,462 - 2.7657221% 2.7571947%0.0085274%
Firefighters System - - 0.0% 0.0% 0.0%
Judges Retirement System - - 0.0% 0.0% 0.0%
Governors & Legislators Plan - - 0.0% 0.0% 0.0%
Tier 2 Public Employees System 56,670 - 0.1338969% 0.1508901%(0.0169932%)
Tier 2 Public Safety and Firefighter 12,601 - 0.2493144% 0.2750341%(0.0257197%) 3,966,014 $ - $
COMBINED PENSION ASSETS, LIABILITIES, EXPENSE, AND DEFERRED OUTFLOWS AND DEFERRED INFLOWS OF RESOURCES RELATED TO PENSIONS (continued)
The net pension asset and liability were measured as of December 31, 2021, and the total pension liability used to calculate the net pension asset and liability was determined by an actuarial valuation as of January 1, 2021 and rolled-forward using generally accepted actuarial procedures. The proportion of the net pension asset and liability is equal to the ratio of the employer's actual contributions to the Systems during the plan year over the total of all employer contributions to the System during the plan year.
For the year ended June 30, 2022, we recognized pension expense of $180,437. At June 30, 2022, we reported deferred outflows of resources and deferred inflows of resources relating to pensions from the following sources:
Deferred Outflows of Resources Deferred Inflows of Resources
Differences between expected and actual experience 967,981 $ 9,372 $
Changes in assumptions 512,291 50,682
Net difference between projected and actual earnings on pension plan investments - 6,223,875
Changes in proportion and differences between contributions and proportionate share of contributions 257,398 35,656
Contributions subsequent to the measurement date 983,472Total 2,721,142 $ 6,319,585 $ $983,472 reported as deferred outflows of resources related to pensions results from contributions made by us prior to our fiscal year end, but subsequent to the measurement date of December 31, 2021. These contributions will be recognized as a reduction of the net pension liability in the upcoming fiscal year. Other amounts reported as deferred outflows of resources and deferred inflows of resources related to pensions, will be recognized in pension expense as follows:
Deferred Outflows (Inflows) of Resources 2022 (550,959) $ 2023 (1,603,157) 2024 (1,480,865) 2025 (1,025,817) 2026 12,773 Thereafter 66,111
Year Ended December 31,
For the year ended June 30, 2022, we recognized pension expense of ($439,428) At June 30, 2022, we reported deferred outflows of resources and deferred inflows of resources relating to pensions from the following sources:
Description
Deferred Outflows of Resources Deferred Inflows of Resources
Differences between expected and actual experience 304,402 $ - $
Changes in assumptions 272,765 18,760
Net difference between projected and actual earnings on pension plan investments - 3,912,921
Changes in proportion and differences between contributions and proportionate share of contributions 15,934 31,068
Contributions subsequent to the measurement date 388,051Total 981,152 $ 3,962,749 $
$388,051 reported as deferred outflows of resources related to pensions results from contributions made by us prior to our fiscal year end, but subsequent to the measurement date of December 31, 2021.
SUMMARY OF BENEFITS BY SYSTEM (continued)
NONCONTRIBUTORY SYSTEM PENSION EXPENSE, AND DEFERRED OUTFLOWS AND INFLOWS OF RESOURCES (continued)
These contributions will be recognized as a reduction of the net pension liability in the upcoming fiscal year. Other amounts reported as deferred outflows of resources and deferred inflows of resources related to pensions, will be recognized in pension expense as follows:
Year Ended December 31,
Deferred Outflows (Inflows) of Resources
2022 (643,508) $ 2023 (1,127,560) 2024 (948,432) 2025 (650,147)
For the year ended June 30, 2022, we recognized pension expense of $356,457.
At June 30, 2022, we reported deferred outflows of resources and deferred inflows of resources relating to pensions from the following sources:
Description
Deferred Outflows of Resources Deferred Inflows of Resources
Differences between expected and actual experience 625,249 $ - $
Changes in assumptions 172,545 29,146
Net difference between projected and actual earnings on pension plan investments - 2,132,413 Changes in proportion and differences between contributions and proportionate share of contributions 202,466Contributions subsequent to the measurement date 306,286Total 1,306,546 $ 2,161,559 $
$306,286 reported as deferred outflows of resources related to pensions results from contributions made by us prior to our fiscal year end, but subsequent to the measurement date of December 31, 2021.
These contributions will be recognized as a reduction of the net pension liability in the upcoming fiscal year. Other amounts reported as deferred outflows of resources and deferred inflows of resources related to pensions, will be recognized in pension expense as follows:
Year Ended December 31,
Deferred Outflows (Inflows) of Resources
2022 127,139 $ 2023 (431,858) 2024 (500,224) 2025 (356,355)
For the year ended June 30, 2022, we recognized pension expense of $196,974
At June 30, 2022, we reported deferred outflows of resources and deferred inflows of resources relating to pensions from the following sources:
Description
Deferred Outflows of Resources Deferred Inflows of Resources
Differences between expected and actual experience 27,532 $ 7,302 $
Changes in assumptions 52,841 536
Net difference between projected and actual earnings on pension plan investments - 140,025
Changes in proportion and differences between contributions and proportionate share of contributions 31,832 -
Contributions subsequent to the measurement date 204,311Total 316,516 $ 147,863 $
$204,311 reported as deferred outflows of resources related to pensions results from contributions made by us prior to our fiscal year end, but subsequent to the measurement date of December 31, 2021.
These contributions will be recognized as a reduction of the net pension liability in the upcoming fiscal year. Other amounts reported as deferred outflows of resources and deferred inflows of resources related to pensions, will be recognized in pension expense as follows:
Year Ended December 31,
Deferred Outflows (Inflows) of Resources
2022 (26,117) $ 2023 (33,536) 2024 (24,275) 2025 (13,895) 2026 11,150 Thereafter 51,017
For the year ended June 30, 2022, we recognized pension expense of $66,434 At June 30, 2022, we reported deferred outflows of resources and deferred inflows of resources relating to pensions from the following sources:
Deferred Outflows of Resources Deferred Inflows of Resources
Differences between expected and actual experience 10,798 $ 2,070 $
Changes in assumptions 14,140 2,240
Net difference between projected and actual earnings on pension plan investments - 38,516
Changes in proportion and differences between contributions and proportionate share of contributions 7,166 4,588
Contributions subsequent to the measurement date 84,826Total 116,930 $ 47,414 $
(continued)
TIER 2 PUBLIC SAFETY SYSTEM PENSION EXPENSE, AND DEFERRED OUTFLOWS AND INFLOWS OF RESOURCES (continued
$84,826 reported as deferred outflows of resources related to pensions results from contributions made by us prior to our fiscal year end, but subsequent to the measurement date of December 31, 2021.
These contributions will be recognized as a reduction of the net pension liability in the upcoming fiscal year. Other amounts reported as deferred outflows of resources and deferred inflows of resources related to pensions, will be recognized in pension expense as follows:
Year Ended December 31,
Deferred Outflows (Inflows) of Resources
2022 (8,473) $ 2023 (10,203) 2024 (7,933) 2025 (5,420) 2026 1,622 Thereafter 15,094
The total pension liability in the December 31, 2021, actuarial valuation was determined using the following actuarial assumptions, applied to all periods included in the measurement:
Inflation 2.50%
Salary increases 3.25 - 9.25%, average, including inflation Investment rate of return 6.85%, net of pension plan investment expense, including inflation
Mortality rates were adopted from an actuarial experience study dated January 1, 2020. The retired mortality tables are developed using URS retiree experience and are based upon gender, occupation, and age as appropriate with projected improvement using 80% of the ultimate rates from the MP-2019 improvement assumption using a base year of 2020. The mortality assumption for active members is the PUB-2010 Employees Mortality Table for public employees, teachers, and public safety members, respectively.
The actuarial assumptions used in the January 1, 2021, valuation were based on the results of an actuarial experience study for the five year period ending December 31, 2019.
The long-term expected rate of return on pension plan investments was determined using a building-block method, in which best estimate ranges of expected future real rates of return (expected returns, net of pension plan investment expense and inflation) are developed for each major asset class and is applied consistently to each defined benefit pension plan. These ranges are combined to produce the long-term expected rate of return by weighting the expected future real rates of return by the target asset allocation percentage and by adding expected inflation. The target allocation and best estimates of arithmetic real rates of return for each major asset class are summarized in the following table:
Asset Class
Target Asset Allocation Real Return Arithmetic Basis
Long-term expected portfolio real rate of return
Equity securities 37.00% 6.58% 2.43%
Debt securities 20.00% -0.28% -0.06%
Real assets 15.00% 5.77% 0.87%
Private equity 12.00% 9.85% 1.18%
Absolute return 16.00% 2.91% 0.47%
Cash and cash equivalents 0.00% -1.01% 0.00%
Totals 100.00% 4.89%
Inflation 2.50%
Expected arithmetic nominal return 7.39%
The 6.85% assumed investment rate of return is comprised of an inflation rate of 2.50%, and a real return of 4.35% that is net of investment expense.
Discount rate: The discount rate used to measure the total pension liability was 6.85 percent. The projection of cash flows used to determine the discount rate assumed that employee contributions will be made at the current contribution rate, and that contributions from all participating employers will be made at contractually required rates that are actuarially determined and certified by the URS Board. Based on those assumptions, the pension plan's fiduciary net position was projected to be available to make all projected future benefit payments of current, active, and inactive employees. Therefore, the long-term expected rate of return on pension plan investments was applied to all periods of projected benefit payments, to determine the total pension liability. The discount rate does not use the Municipal Bond Index Rate. The discount rate was reduced from 6.95 percent to 6.85 percent from the prior measurement date.
Sensitivity of the proportionate share of the net pension asset and liability to changes in the discount rate: The following presents the proportionate share of the net pension liability calculated using the discount rate of 6.85 percent, as well as what the proportionate share of the net pension liability (asset) would be if it were calculated using a discount rate that is 1 percentage point lower (5.85 percent) or 1 percentage point higher (7.85 percent) than the current rate:
System
1% Decrease or 5.85% Discount Rate of 6.85%
1% Increase or 7.85%
Noncontributory System 1,562,797 $ (2,906,281) $ (6,634,861) $ Public Safety System 1,818,105 (990,462) (3,278,998)
Tier 2 Public Employees System 337,653 (56,670) (359,429)
Tier 2 Public Safety and Firefighter 101,091 (12,601) (102,857)
Total 3,819,646 $ (3,966,014) $ (10,376,145) $
***Pension plan fiduciary net position: Detailed information about the fiduciary net position of the pension plans is available in the separately issued URS financial report
The Defined Contribution Savings Plans are administered by the Utah Retirement Systems Board and are generally supplemental plans to the basic retirement benefits of the Retirement Systems but may also be used as a primary retirement plan. These plans are voluntary tax-advantaged retirement savings programs authorized under sections 401 (k), 457(b) and 408 of the Internal Revenue Code. Detailed information regarding plan provisions is available in the separately issued URS financial report.
Riverton City participates in the following Defined Contribution Savings Plans with Utah Retirement Systems:
• 401 (k) Plan
• 457(b) Plan
• Roth IRA Plan
• Traditional IRA Plan
SUMMARY OF BENEFITS BY SYSTEM (continued)
DEFINED CONTRIBUTION
PLANS (continued)
Employee and employer contributions to the Utah Retirement Defined Contribution Savings Plans for fiscal year ended June 30th were as follows:
2022 2021 2020
Employer Contributions 159,743 $ 124,956 $ 128,812 $ Employee Contributions 78,533 $ 74,069 $ 83,158 $
Employer Contributions 62,413 $ 60,106 $ 51,571 $ Employee Contributions 99,914 $ 95,455 $ 65,204 $
Roth IRA Plan
Employer Contributions N/A N/A N/A Employee Contributions 42,135 $ 35,714 $ 28,500 $
Employer Contributions N/A N/A N/A Employee Contributions 2,250 $ 1,055 $ 780 $
In addition to participation in Utah Retirement Systems, the City also participates in a 401(a)-plan provided by International City Management Association Retirement Corporation (ICMA-RC), a multiple-employer defined contribution plan. Employees are fully vested upon contribution to the 401(a) plan, into which the City contributes 6.5% of eligible employees’ gross earnings. These funds are the property of each employee and as such, the City has no claims on these funds. City contributions to the plan for fiscal years ended June 30, 2022, 2021, and 2020, were $658,735, $624,230, and $580,887, respectively.
The City offers its employees a defined contribution plan with ICMA -RC (457 plan) in accordance with Internal Revenue Code Section 457(b). The 457 plan is available to eligible City employees and permits employees to defer a portion of their salaries until future years. Employees are eligible to voluntarily participate from the date of employment and are vested immediately upon participation. The payment of deferred compensation is not available to employees, or their beneficiaries, until termination, retirement, death, or an unforeseeable emergency.
In accordance with Utah State law, the City makes the following disclosures relative to the Redevelopment Agency of Riverton City (RDA). The RDA received $1,309,083 of incremental tax revenues assessed and collected by other taxing entities for its Western Commercial District (WCD) project area. Of this amount, $1,231,703, was spent in developer infrastructure reimbursements and $77,380 as a tax increment rebate to Salt Lake County. The RDA spent $2,580 for administrative costs relating to the CDA commercial project area in the WCD and $47,094 in administrative costs in preparation to establish two new project areas. The City also recognized $122,800 in a loss on land that was due to a parcel of land conveyed to a developer as part of a development with the Downtown Redwood Road Project Area that has since been closed. This transaction was the last remaining remnant of that project area.
During the fiscal year ended June 30, 2022, two new project areas were approved, the 12600 S Community Reinvestment Project Area and the Redwood Road Community Reinvestment Project Area.
The Riverton Law Enforcement Service Area (RLESA) is a taxing district created on January 1, 2018, for the purpose of collecting property taxes to pay for law enforcement services. Riverton City created RLESA in part to mitigate the 2018 property tax increase already approved by the Salt Lake Valley Law Enforcement Service Area (SLVLESA). Riverton City agreed by resolution to stay within SLVLESA until the end of calendar year 2017; RLESA became an active entity beginning January 1, 2018. RLESA is a blended component unit of the City as its governing body is comprised of the Riverton City Council and Mayor, as well as because it shares the same accounting period as the City. RLESA is treated as a special revenue fund for purposes of these financial statements
For the year ended June 30, 2022, RLESA received $6.4 million in property and fee-in-lieu taxes, and $23 thousand in interest. Expenditures for the entity were a $5.7 million in law enforcement services transferred to the Riverton City Police Department. Governmental activities net position was restated to consolidate the fiscal year 2021 ending net position for governmental activities and the ending net position for RLESA.
The Riverton Fire Service Area (RFSA) is a taxing district created on October 13, 2020, for the purpose of collecting property taxes to pay for fire suppression services. Riverton City created RFSA in part to mitigate intent of the Unified Fire Service Area (UFSA) in raising property taxes for the 2021 property tax year. Riverton City received fire suppression services from the Unified Fire Authority (UFA). Prior to the creation of RFSA, UFSA was the funding mechanism, holding the taxing authority to assess property taxes and remit payment to UFA for fire suppression services. RFSA has replaced UFSA as the taxing entity, however, UFA continues to provide fire suppression services for the geographical boundaries of Riverton City. RFSA became an active entity beginning January 1, 2021, when it established its first property tax assessment. RFSA is a component unit of the City as its governing body is comprised of the Riverton City Council and Mayor. Financial statements for RFSA are included with the Riverton City Financial Statements presented as a component unit.
RFSA has elected to report its financials on a calendar year basis. For the period ended December 31, 2021, the entity received $6.8 million in property and fee-in-lieu taxes, $8 thousand in interest, and $931 thousand as intergovernmental revenue. In addition, RFSA received, and later paid off $5.06 million in proceeds from a Tax Revenue Anticipation Note (TRAN). Expenditures for the entity include $5.4 million in fire suppression services, $314 thousand payment to UFSA as part of the agreement to leave the service area, $9 thousand in administrative costs, $14 thousand in TRAN cost of issuance and $35 thousand in TRAN interest costs. A complete copy of the audited financial statements can be obtained by writing Riverton City, Administrative Services Department, 12830 S Redwood Rd, Riverton, UT 84065
The City is a defendant in various claims and lawsuits arising from the ordinary course of business. The City has an insurance policy, which covers any adverse judgment as it applies to lawsuits up to $5 million each claim. In the opinion of the City’s legal counsel, the resolution of these matters will not have a material adverse effect on the financial condition of the City and any adverse judgment claimed has been accepted by the insurance carrier. There has been no significant change in insurance coverage during the year ended June 30, 2022, nor have the amounts of settlements exceeded insurance coverage during the past three fiscal years.
The City has an agreement with Jordan Valley Water Conservancy District to purchase all its culinary water supply
As a result of the economic impact due to COVID-19, the City was the direct recipient of a federal grant totaling $5,259,502 under the American Rescue Plan Act of 2021 (ARPA), paid in two equal distributions of $2,629,751 during July 2021 and 2022, respectively. Allowable uses of ARPA funds include “necessary investments in water, sewer, or broadband infrastructure.” The City intends to utilize these funds for water and broadband projects.
The City has also received notice of award for an $8.8 million grant from the State of Utah for the purpose of finishing its secondary metering project. This is a 70% matching grant.
RIVERTON CITY, UTAH
COMPREHENSIVE FINANCIAL REPORT FOR THE FISCAL YEAR ENDED JUNE 30, 2022 Financial Section – Required Supplementary Information
LAST 10 FISCAL YEARS*
Fiscal Year 2022 Measurement Date 12/31/21
Noncontributory Retirement System Public Safety System Tier 2 Public Employees
Tier 2 Public Safety and Firefighters Retirement System Noncontributory Retirement System Public Safety System Tier 2 Public Employees
Tier 2 Public Safety and Firefighters Retirement System
Proportion of the net pension liability (asset) 0.5074611%2.7657221%0.1338969%0.2493144%0.5199924%2.7571947%0.1508901%0.0027503%
Proportionate share of the net pension liability (asset) (2,906,284) $ (990,462) $ (56,670) $ (12,601) $ 266,726 $ 991,300 $ 21,702 $ 24,669 $
Covered payroll 4,319,262 $ 2,076,393 $ 2,487,285 $ 596,210 $ 4,386,342 $ 1,981,278 $ 2,412,093 $ 548,015 $
Proportionate share of the net pension liability (asset) as a percentage of its covered payroll -67.29%-47.70%-2.28%-2.11% 6.08%50.03%0.90%4.50%
Plan fiduciary net position as a percentage of the total pension liability 108.70%105.10%103.80%102.80% 99.20%94.50%98.30%93.10%
Fiscal Year 2021 Measurement Date 12/31/20 (continued)
RIVERTON CITY, UTAH
ANNUAL COMPREHENSIVE FINANCIAL REPORT FOR THE FISCAL YEAR ENDED JUNE 30, 2022 Financial Section – Required Supplementary Information (continued)
LAST 10 FISCAL YEARS* (CONTINUED)
Fiscal Year 2020 Measurement Date 12/31/19
Noncontributory Retirement System Public Safety System Tier 2 Public Employees
Fiscal Year 2018 Measurement Date 12/31/17
Tier 2 Public Safety and Firefighters Retirement System Noncontributory Tier 2 Public Employees Noncontributory Tier 2 Public Employees
Proportion of the net pension liability (asset) 0.5122293%1.6639331%0.1398949%0.1705244%0.5049889%0.1304926%0.5045584%0.1345390%
Proportionate share of the net pension liability (asset) 1,930,525 $ 826,309 $ 31,463 $ 16,040 $ 3,718,599 $ 55,887 $ 2,210,622 $ 11,862 $ Covered payroll 4,433,893 $ 1,174,064 $ 1,943,601 $ 280,659 $ 4,420,106 $ 1,522,892 $ 4,373,601 $ 1,316,286 $
Proportionate share of the net pension liability (asset) as a percentage of its covered payroll 43.54%70.38%1.62%5.72%84.13%3.67%50.54%0.90% Plan fiduciary net position as a percentage of the total pension liability 93.70%91.70%96.50%89.60%87.00%90.80%91.90%97.40%
Fiscal Year 2019 Measurement Date 12/31/18 (continued)
ANNUAL COMPREHENSIVE FINANCIAL REPORT FOR THE FISCAL YEAR ENDED JUNE 30, 2022
Financial Section – Required Supplementary Information (continued)
SCHEDULE OF THE PROPORTIONATE SHARE OF THE NET PENSION LIABILITY – UTAH RETIREMENT SYSTEMS
LAST 10 FISCAL YEARS* (CONTINUED)
Fiscal Year 2017 Measurement Date 12/31/16
Fiscal Year 2016 Measurement Date 12/31/15
Implementation Fiscal Year 2015 Measurement Date - 12/31/14
Noncontributory
Proportion of the net pension liability (asset)
Proportionate share of the net pension liability (asset)
Tier 2 Public Employees Noncontributory
Tier 2 Public Employees Noncontributory Tier 2 Public Employees
0.5356606%0.1389913%0.5480067%0.1403570%0.5244048%(0.1465361%)
3,439,597 $ 15,504 $ 3,100,888 $ (306) $ 2,277,089 $ (4,441) $ Covered payroll 4,707,677 $ 1,139,840 $ 4,686,432 $ 906,827 $ 4,472,523 $ 718,882 $
Proportionate share of the net pension liability (asset) as a percentage of its covered payroll 73.06%1.36% 66.17%(0.03%) 50.90%(0.60%) Plan fiduciary net position as a percentage of the total pension liability 87.30%95.10% 87.80%100.20% 90.20%103.50%
* In accordance with paragraph 81a of GASB 68, employers will need to disclose a 10-year history of their proportionate share of the net pension liability (asset) in their RSI. This schedule will need to be built prospectively. The schedule above is only for the prior eight years.
RIVERTON CITY, UTAHSystem
Noncontributory System
Public Safety System
Tier 2 Public Employees System*
As of fiscal year ended June 30,
Actuarially determined contributions
Contributions in relations to the contractually required contribution
Contribution deficiency (excess) Covered payroll
Contributions as a percentage of covered payroll
2014 726,384 $ 726,384 $ - $ 4,347,095 $ 16.71%
2015 827,455 827,455 - 4,635,350 17.85%
2016 842,727 842,727 - 4,735,054 17.80%
2017 832,609 832,609 - 4,691,541 17.75%
2018 771,617 771,617 - 4,352,276 17.73%
2019 787,268 787,268 - 4,459,341 17.65%
2020 773,925 773,925 - 4,361,580 17.74%
2021 786,077 786,077 - 4,413,524 17.81%
2022 770,246 770,246 - 4,325,989 17.81%
2014 - $ - $ - $ - $ 0.00%
2015 - - - - 0.00%
2016 - - - - 0.00% 2017 - - - - 0.00% 2018 - - - - 0.00% 2019 69,711 69,711 - 224,816 31.01% 2020 550,729 550,729 - 1,910,624 28.82% 2021 588,893 588,893 - 2,046,751 28.77% 2022 598,495 598,495 - 2,191,123 27.31%
2014 85,142 $ 85,142 $ - $ 608,594 $ 13.99% 2015 118,953 118,953 - 796,203 14.94% 2016 139,975 139,975 - 938,797 14.91% 2017 180,539 180,539 - 1,210,065 14.92% 2018 215,436 215,436 - 1,427,802 15.09% 2019 265,271 265,271 - 1,707,407 15.54% 2020 345,466 345,466 - 2,217,544 15.58% 2021 396,598 396,598 - 2,507,967 15.81% 2022 392,402 392,402 - 2,443,667 16.06%
Tier 2 Public Safety System* 2014 - $ - $ - $ - $ 0.00% 2015 - - - - 0.00% 2016 - - - - 0.00% 2017 - - - - 0.00% 2018 - - - - 0.00% 2019 3,786 3,786 - 17,996 21.04% 2020 111,380 111,380 - 532,352 20.92% 2021 132,137 132,137 - 557,541 23.70% 2022 157,830 157,830 - 669,966 23.56%
Tier 2 Public Employees DC Only System*
2014 - $ - $ - $ - $ 0.00% 2015 - - - - 0.00% 2016 - - - - 0.00% 2017 - - - - 0.00% 2018 - - - - 0.00% 2019 3,279 3,279 - 53,984 6.07% 2020 11,531 11,531 - 174,515 6.61% 2021 18,167 18,167 - 271,555 6.69% 2022 23,901 23,901 - 357,236 6.69%
Tier 2 Public Safety and Firefighter DC Only System* 2022 5,324 $ 5,324 $ - $ 54,663 $ 9.74%
*Contributions in Tier 2 include an amortization rate to help fund the unfunded liabilities in the Tier 1 system. The Tier 2 System was created effective July 1, 2011.
** In accordance with paragraph 81a of GASB 68, employers will need to disclose a 10-year history; however, this is the information available from the implementation year of GASB 68 through the current year.
The investment return assumption was decreased by 0.10% to 6.85% for use in the January 1, 2021, actuarial valuation. This assumption change was based on analysis performed by the actuary and adopted by the Utah State Retirement Board. In aggregate, this assumption change resulted in a $509 million increase in the Total Pension Liability, which is about 1.3% of the Total Pension Liability as of December 31, 2020, for all systems combined. The demographic assumptions were reviewed and updated in the January 1, 2020, actuarial valuation and are currently scheduled to be reviewed in the year 2023.
Ending Values
GASB 68 Schedule NPL/(NPA) Asset Liability NPL/(NPA) Asset Liability
Noncontributory 266,726 $ - $ 266,726 $ (2,906,281) $ (2,906,281) $ - $ Public Safety 991,300 - 991,300 (990,462) (990,462) -
Tier 2 Public Employees 21,702 - 21,702 (56,670) (56,670) -
Tier 2 Public Safety 24,669 - 24,669 (12,601) (12,601) -
Total 1,304,397 $ - $ 1,304,397 $ (3,966,014) $ (3,966,014) $ - $
Net Pension Liability/(Asset) at 12/31/20
Net Pension Liability/(Asset) at 12/31/21
Retirement System System Total NPL/(NPA)
Proportionate Share Ending Values System Total NPL/(NPA)
Proportionate Share Beginning Values Noncontributory
Local Government 51,294,272 $ 0.519992%266,726 $ (572,710,696) $ 0.5074610%(2,906,281) $ Other Div B 35,953,226 2.757195%991,300 (35,812,064) 2.7657220%(990,462)
Tier 2 Public Employees 14,382,778 0.150890%21,702 (42,323,712) 0.1338970% (56,670)
Tier 2 Public Safety 8,969,463 0.275034%24,669 (5,054,238) 0.2493140% (12,601)
Total 110,599,739 $ 1,304,397 $ (655,900,710) $ (3,966,014) $
RIVERTON CITY, UTAH
ANNUAL COMPREHENSIVE FINANCIAL REPORT FOR THE FISCAL YEAR ENDED JUNE 30, 2022
Financial Section – Supplementary Section COMBINING BALANCE SHEET – NONMAJOR GOVERNMENTAL FUNDS – JUNE 30, 2022
Total
Community Community Community Community Capital Capital Nonmajor Impact Impact Impact Impact Capital ImprovementsImprovementsGovernmental Parks Fire Stormwater Roads ImprovementsStormwater First Class Roads Funds ASSETS
Cash and cash equivalents - $ - $ - $ - $ 2,253,116 $ 1,353,139 $ - $ 3,606,255 $ Restricted cash and cash equivalents 121,133 - 770,880 1,964,478 - - - 2,856,491
Total assets 121,133 $ - $ 770,880 $ 1,964,478 $ 2,253,116 $ 1,353,139 $ - $ 6,462,746 $
Accounts payable 118,594 $ - $ - $ - $ 120,872 $ 205,607 $ - $ 445,073 $ Accrued liabilities - - - - - - - -
Developer and customer deposits - - - - 13,863 32,577 - 46,440 Due to other funds - - - - - - -Deferred revenue - - - - - - - -
Total liabilities 118,594 - - - 134,735 238,184 - 491,513
Restricted: Impact fees 2,539 - 770,880 1,964,478 - - - 2,737,897 Assigned: Capital expenditures - - - - 2,118,381 1,114,955 - 3,233,336
Total fund balances 2,539 - 770,880 1,964,478 2,118,381 1,114,955 - 5,971,233
Total liabilities and fund balances 121,133 $ - $ 770,880 $ 1,964,478 $ 2,253,116 $ 1,353,139 $ - $ 6,462,746 $
RIVERTON CITY, UTAH
ANNUAL COMPREHENSIVE FINANCIAL REPORT FOR THE FISCAL YEAR ENDED JUNE 30, 2022
Financial Section – Supplementary Section (continued) COMBINING STATEMENT OF REVENUES, EXPENDITURES, AND CHANGES IN FUND BALANCES –NONMAJOR GOVERNMENTAL FUNDS –FOR THE YEAR ENDED JUNE 30, 2022 Total
Community Community Community Community Nonmajor Impact Impact Impact Impact Capital Capital Capital Governmental Parks Fire Stormwater Roads ImprovementsImprovementsImprovementsFunds
Impact fees 868,163 $ 108,734 $ 433,437 $ 704,461 $ - $ - $ - $ 2,114,795 $ Intergovernmental revenue - - - - - - 700,000 700,000 Interest 2,353 104 3,487 7,674 8,577 4,175 - 26,370
Total revenues 870,516 108,838 436,924 712,135 8,577 4,175 700,000 2,841,165
Capital expenditures 395,099 - 219,198 1,400 1,648,595 1,588,542 700,000 4,552,834
Total expenditures 395,099 - 219,198 1,400 1,648,595 1,588,542 700,000 4,552,834
Excess (deficiency) of revenues over (under) expenditures 475,417 108,838 217,726 710,735 (1,640,018) (1,584,367) - (1,711,669)
Sale of capital assets - - - - 452,174 - - 452,174
Transfers in - - 553,154 - 855,000 2,699,322 - 4,107,476
Transfers out (670,000) (108,838) - (440,000) - - - (1,218,838)
Total other financing sources (uses) (670,000) (108,838) 553,154 (440,000) 1,307,174 2,699,322 - 3,340,812
Net change in fund balance (194,583) - 770,880 270,735 (332,844) 1,114,955 - 1,629,143
Fund balances, beginning of year 197,122 - - 1,693,743 2,451,225 - - 4,342,090
Fund balances, end of year 2,539 $ - $ 770,880 $ 1,964,478 $ 2,118,381 $ 1,114,955 $ - $ 5,971,233 $
REPORT FOR THE FISCAL YEAR ENDED JUNE 30, 2022 Financial Section – Supplementary Section (continued)
SCHEDULE OF REVENUES, EXPENDITURES, AND CHANGES IN FUND BALANCES – MAJOR CAPITAL PROJECTS FUND –REDIIF – BUDGET AND ACTUAL – FOR THE YEAR ENDED JUNE 30, 2022
Actual Variance with Original Final Amounts Final Budget
Franchise taxes
2,415,000 $ 2,415,000 $ 2,579,433 $ 164,433 $ Intergovernmental - 50,000 - (50,000) Interest 22,500 22,500 21,208 (1,292) Miscellaneous 1,300,000 1,300,000 - (1,300,000)
Total revenues 3,737,500 3,787,500 2,600,641 (1,186,859)
Current: General government: Wage and benefits 77,500 77,500 41,681 35,819
Capital expenditures: Information technology - 50,000 47,296 2,704 Highways and public improvements 625,000 1,147,500 1,025,469 122,031
Debt service: Principal 1,071,000 1,071,000 1,071,000Interest 1,296,000 1,296,000 1,299,454 (3,454)
Total expenditures 3,069,500 3,642,000 3,484,900 157,100
Excess (deficiency) of revenues over (under) expenditures 668,000 145,500 (884,259) (1,029,759)
Transfers in 1,433,000 1,433,000 1,110,000 (323,000)
Transfers out (2,082,000) (2,377,000) (1,330,495) 1,046,505
Total other financing sources (uses) (649,000) (944,000) (220,495) 723,505 Net change in fund balance 19,000 $ (798,500) $ (1,104,754) (306,254) $
Fund balance, beginning of year 7,601,161
Fund balance, end of year 6,496,407 $
COMPREHENSIVE FINANCIAL REPORT FOR THE FISCAL YEAR ENDED JUNE 30, 2022 Financial Section – Supplementary Section (continued)
SCHEDULE OF REVENUES, EXPENDITURES, AND CHANGES IN FUND BALANCES – MAJOR CAPITAL PROJECTS FUND – CAPITAL PROJECTS FUNDS - GRANTS – BUDGET AND ACTUAL – FOR THE YEAR ENDED JUNE 30, 2022
Actual Variance with OriginalFinalAmountsFinal Budget
Intergovernmental
2,480,000 $ 2,480,000 $ 3,484,427 $ 1,004,427 $ Interest - - 12,051 12,051
Total revenues 2,480,000 2,480,000 3,496,478 1,016,478
EXPENDITURES
Capital expenditures: General government1,200,000 2,200,000874,555(1,325,445)
Total expenditures 1,200,000 2,200,000 874,555 (1,325,445)
Excess (deficiency) of revenues over (under) expenditures 1,280,000 280,000 2,621,923 (308,967)
Net change in fund balance 1,280,000 $ 280,000 $ 2,621,923 2,341,923 $ Fund balance, beginning of yearFund balance, end of year 2,621,923 $
SCHEDULE OF REVENUES, EXPENDITURES, AND CHANGES IN FUND BALANCES – NONMAJOR CAPITAL PROJECTS FUND –COMMUNITY IMPACT PARKS – BUDGET AND ACTUAL – FOR THE YEAR ENDED JUNE 30, 2022
Actual Variance with OriginalFinalAmountsFinal Budget REVENUES
Impact fees
2,500,000 $ 2,500,000 $ 868,163 $ (1,631,837) $ Interest 2,500 2,500 2,353 (147)
Total revenues 2,502,500 2,502,500 870,516 (1,631,984)
EXPENDITURES
Capital expenditures: Parks and recreation 410,000 410,000 395,099 14,901 Total expenditures 410,000 410,000 395,099 14,901
Excess (deficiency) of revenues over (under) expenditures
OTHER FINANCING SOURCES
2,092,500 2,092,500 475,417 (1,617,083)
Transfers out (993,000) (993,000) (670,000) 323,000
Total other financing sources (993,000) (993,000) (670,000) 323,000
Net change in fund balance 1,099,500 $ 1,099,500 $ (194,583) (1,294,083) $
Fund balance, beginning of year 197,122 Fund balance, end of year 2,539 $
COMPREHENSIVE FINANCIAL REPORT FOR THE FISCAL YEAR ENDED JUNE 30, 2022
Financial Section – Supplementary Section (continued)
SCHEDULE OF REVENUES, EXPENDITURES, AND CHANGES IN FUND BALANCES – NONMAJOR CAPITAL PROJECTS FUND –COMMUNITY IMPACT FIRE – BUDGET AND ACTUAL – FOR THE YEAR ENDED JUNE 30, 2022
Budgeted Amounts
Actual Variance with Original Final Amounts Final Budget
Impact fees 215,000 $ 215,000 $ 108,734 $ (106,266) $ Interest - - 104 104
Total revenues 215,000 215,000 108,838 (106,162)
Current: Public Safety 2,500 2,500 - 2,500 Total expenditures 2,500 2,500 - 2,500
Excess (deficiency) of revenues over (under) expenditures 212,500 212,500 108,838 (103,662)
Transfers out (212,500) (212,500) (108,838) 103,662
Total other financing sources (212,500) (212,500) (108,838) 103,662
Net change in fund balance - $ - $ - - $
Fund balance, beginning of year -
Fund balance, end of year - $
RIVERTON CITY, UTAH
COMPREHENSIVE FINANCIAL REPORT FOR THE FISCAL YEAR ENDED JUNE 30, 2022 Financial Section – Supplementary Section (continued)
SCHEDULE OF REVENUES, EXPENDITURES, AND CHANGES IN FUND BALANCES – NONMAJOR CAPITAL PROJECTS FUND –COMMUNITY IMPACT STORMWATER – BUDGET AND ACTUAL – FOR THE YEAR ENDED JUNE 30, 2022
Budgeted Amounts
Actual Variance with Original Final Amounts Final Budget
Impact fees
550,000 $ 550,000 $ 433,437 $ (116,563) $ Interest 5,000 5,000 3,487 (1,513)
Total revenues 555,000 555,000 436,924 (118,076)
EXPENDITURES
Capital expenditures: Highways and public improvements 401,905 485,589 219,198 266,391
Total expenditures 401,905 485,589 219,198 266,391
Excess (deficiency) of revenues over (under) expenditures 153,095 69,411 217,726 148,315
Transfers in 410,365 410,365 553,154 142,789
Total other financing sources (uses) 410,365 410,365 553,154 142,789
Net change in fund balance 563,460 $ 479,776 $ 770,880 291,104 $
Fund balance, beginning of year -
Fund balance, end of year 770,880 $
REPORT FOR THE FISCAL YEAR ENDED JUNE 30, 2022 Financial Section – Supplementary Section (continued)
SCHEDULE OF REVENUES, EXPENDITURES, AND CHANGES IN FUND BALANCES – NONMAJOR CAPITAL PROJECTS FUND –COMMUNITY IMPACT ROADS – BUDGET AND ACTUAL – FOR THE YEAR ENDED JUNE 30, 2022
Budgeted Amounts
Actual Variance with
Original Final Amounts Final Budget
Impact fees 830,000 $ 830,000 $ 704,461 $ (125,539) $ Interest 2,500 2,500 7,674 5,174
Total revenues 832,500 832,500 712,135 (120,365)
Capital expenditures: Highways and public improvements 260,000 260,000 1,400 258,600
Total expenditures 260,000 260,000 1,400 258,600
Excess (deficiency) of revenues over (under) expenditures 572,500 572,500 710,735 138,235
Transfers out (440,000) (440,000) (440,000) -
Total other financing sources (uses) (440,000) (440,000) (440,000) -
Net change in fund balance 132,500 $ 132,500 $ 270,735 138,235 $
Fund balance, beginning of year 1,693,743 Fund balance, end of year 1,964,478 $
RIVERTON CITY, UTAHCOMPREHENSIVE FINANCIAL REPORT FOR THE FISCAL YEAR ENDED JUNE 30, 2022 Financial Section – Supplementary Section (continued)
SCHEDULE OF REVENUES, EXPENDITURES, AND CHANGES IN FUND BALANCES – NONMAJOR CAPITAL PROJECTS FUND –CAPITAL IMPROVEMENTS – BUDGET AND ACTUAL – FOR THE YEAR ENDED JUNE 30, 2022
Actual Variance with OriginalFinalAmountsFinal Budget
Interest 5,000 $ 5,000 $ 8,577 $ 3,577 $
Total revenues5,000 5,000 8,577 3,577
Capital expenditures: General government805,500 920,500 500,420 420,080 Highways and public improvements1,305,000 1,650,000 857,982 792,018 Parks and recreation380,000 330,000 290,193 39,807
Total expenditures2,490,500 2,900,500 1,648,595 1,251,905
Excess (deficiency) of revenues over (under) expenditures (2,485,500) (2,895,500) (1,640,018) 1,255,482
Sale of capital assets356,000356,000452,174 96,174 Transfers in825,000 855,000 855,000Total other financing sources (uses) 1,181,000 1,211,000 1,307,174 96,174
Net change in fund balance(1,304,500) $ (1,684,500) $ (332,844) 1,351,656 $
Fund balance, beginning of year 2,451,225
Fund balance, end of year 2,118,381 $
RIVERTON CITY, UTAHRIVERTON CITY, UTAH
COMPREHENSIVE FINANCIAL REPORT FOR THE FISCAL YEAR ENDED JUNE 30, 2022 Financial Section – Supplementary Section (continued)
SCHEDULE OF REVENUES, EXPENDITURES, AND CHANGES IN FUND BALANCES – NONMAJOR CAPITAL PROJECTS FUND –CAPITAL IMPROVEMENTS - STORMWATER – BUDGET AND ACTUAL – FOR THE YEAR ENDED JUNE 30, 2022
Budgeted Amounts
REVENUES
Actual Variance with
Original Final Amounts Final Budget
Interest - $ - $ 4,175 $ 4,175 $
Total revenues - - 4,175 4,175
EXPENDITURES
Capital expenditures: Highways and public improvements
1,617,323 2,335,639 1,588,542 747,097
Total expenditures 1,617,323 2,335,639 1,588,542 747,097 Excess (deficiency) of revenues over (under) expenditures (1,617,323) (2,335,639) (1,584,367) 751,272
Transfers in 1,917,323 2,392,323 2,699,322 306,999
Total other financing sources (uses) 1,917,323 2,392,323 2,699,322 306,999
Net change in fund balance 300,000 $ 56,684 $ 1,114,955 1,058,271 $ Fund balance, beginning of yearFund balance, end of year 1,114,955 $
COMPREHENSIVE
REPORT FOR THE FISCAL YEAR ENDED JUNE 30, 2022 Financial Section – Supplementary Section (continued)
SCHEDULE OF REVENUES, EXPENDITURES, AND CHANGES IN FUND BALANCES – NONMAJOR CAPITAL PROJECTS FUND –CAPITAL IMPROVEMENTS – FIRST CLASS ROADS – BUDGET AND ACTUAL – FOR THE YEAR ENDED JUNE 30, 2022
Budgeted Amounts
Actual Variance with Original Final Amounts Final Budget
700,000 $ 700,000 $ 700,000 $ - $ Interest - - - -
Intergovernmental revenue
Total revenues 700,000 700,000 700,000EXPENDITURES
Capital expenditures: Highways and public improvements 700,000 700,000 700,000 -
Total expenditures 700,000 700,000 700,000Excess (deficiency) of revenues over (under) expenditures - - - -
Net change in fund balance - $ - $ - - $
Fund balance, beginning of yearFund balance, end of year - $
RIVERTON CITY, UTAHCOMPREHENSIVE FINANCIAL REPORT FOR THE FISCAL YEAR ENDED JUNE 30, 2022
Financial Section – Supplementary Section (continued)
SCHEDULE OF REVENUES, EXPENDITURES, AND CHANGES IN FUND BALANCES – COMPONENT UNIT –RIVERTON FIRE SERVICE AREA – BUDGET AND ACTUAL – FOR THE PERIOD ENDED DECEMBER 31, 2021
Actual Variance with
Original Final Amounts Final Budget
Taxes: Property 6,310,000 $ 6,310,000 $ 6,407,558 $ 97,558 $ Fee in lieu of taxes 300,000 $ 300,000 $ 399,540 $ 99,540 $ Intergovernmental 138,000 138,000 930,997 792,997 $ Interest - - 8,886 8,886
Total revenues 6,748,000 6,748,000 7,746,981 998,981
General government: Fire service fees
5,600,000 5,600,000 5,391,574 208,426 Administration 355,000 355,000 9,434 345,566
Debt service: Principal 5,060,000 5,060,000 5,239,311 (179,311) Interest and other financial 150,000 150,000 184,541 (34,541)
Total expenditures 11,165,000 11,165,000 10,824,860 340,140
Excess (deficiency) of revenues over (under) expenditures (4,417,000) (4,417,000) (3,077,879) 1,339,121
Proceeds from notes payable - TRAN
5,060,000 5,060,000 5,060,000Total other financing sources (uses) 5,060,000 5,060,000 5,060,000 -
Net change in fund balance 643,000 $ 643,000 $ 1,982,121 $ 1,339,121 $
Fund balance, beginning of period -
Fund balance, end of period 1,982,121 $

( This page intentionally left blank )
This part of the City’s annual comprehensive financial report presents detailed information as a context for understanding what the information in the financial statements, note disclosures, and required supplementary information says about the City’s overall financial health and vitality.
FINANCIAL TRENDS – These schedules contain trend information to help the reader understand how the City’s financial performance has changed over time.
Net Position by Component ........................................................................................................................ 100
Changes in Net Position 102
Fund Balances – Governmental Funds 105
Change in Fund Balances – Governmental Funds ....................................................................................... 106
REVENUE CAPACITY – These schedules contain information to help the reader assess the City’s most significant local revenue sources: property tax, sales tax, franchise tax and water revenue.
Assessed Value and Estimated Actual Value of Taxable Property – Riverton City ...................................... 108
Assessed Value and Estimated Actual Value of Taxable Property Riverton Law Enforcement Service Area.............................................................................................. 109
Direct and Overlapping Property Tax Rates 110
Principal Property Tax Payers 111
Property Tax Levied and Collected – Riverton City ..................................................................................... 112
Property Tax Levied and Collected – Riverton Law Enforcement Service Area 113
Point of Sale (POS) Sales Tax Revenue by Category .................................................................................... 114
Total Sales Tax Revenue 114
Direct and Overlapping Sales Tax Rates 115 Sales Tax Revenue by Category ................................................................................................................... 116
Franchise Tax Revenue by Category 117
Franchise Tax Rates by Category ................................................................................................................. 117
Enterprise Fund Revenues 118
DEBT CAPACITY – These schedules present information to help the reader assess the affordability of the City’s current levels of outstanding debt and the government’s ability to issue additional debt in the future.
Ratios of Outstanding Debt by Type 119 Ratios of General Bonded Debt Outstanding .............................................................................................. 120
Direct and Overlapping Governmental Activities Debt ............................................................................... 121
Legal Debt Margin Information 122
Pledged Revenue Coverage ........................................................................................................................ 123
DEMOGRAPHIC AND ECONOMIC INFORMATION – These schedules offer demographic and economic indicators to help the reader understand the environment within which the City’s financial activities take place.
Demographic and Economic Indicators ...................................................................................................... 124
Principal Employers 125
OPERATING INFORMATION – These schedules contain service and infrastructure data to help the reader understand how the information in the City’s financial report relates to the services the City provides and the activities it performs.
Full–Time Equivalent Employees by Function/Program – Government–wide 126
Operating Indicators by Function/Program ................................................................................................ 127
Capital Asset Statistics by Function/Program 128
Sources: Unless otherwise noted, the information in these schedules is derived from the audited financial statements of Riverton City for the relevant year.
RIVERTON CITY, UTAH
COMPREHENSIVE FINANCIAL REPORT FOR THE FISCAL YEAR ENDED JUNE 30, 2022 Statistical Section – Financial Trends
Fiscal Year
Governmental activities:
Net investment in capital assets 151,980,222 $ 155,913,935 $ 152,688,514 $ 150,440,957 $ 154,728,458 $ 159,491,227 $ 165,269,212 $ 166,750,301 $ 169,180,336 $ 194,917,793 $ Restricted4,817,503 5,198,992 4,572,671 5,270,736 5,046,288 2,807,088 2,963,609 2,529,538 2,521,841 4,540,227 Unrestricted4,134,730 2,282,865 3,114,791 5,168,897 8,056,216 7,103,818 9,770,374 10,647,231 13,528,257 20,969,514 Total governmental activities net position160,932,455 163,395,792 160,375,976 160,880,590 167,830,962 169,402,133 178,003,195 179,927,070 185,230,434 220,427,534
Business-type activities: Net investment in capital assets 77,292,124 81,341,833 83,417,451 85,404,222 89,228,665 94,561,971 97,740,254 102,972,640 103,882,481 84,500,510 Restricted4,056,922 4,465,474 5,436,701 6,617,159 7,862,280 6,228,840 5,436,654 1,848,968 1,713,869 4,835 Unrestricted9,137,722 9,083,402 9,406,296 10,360,407 10,189,161 10,016,184 11,294,459 10,471,724 10,473,398 11,627,674
Total business-type activities net position90,486,768 94,890,709 98,260,448 102,381,788 107,280,106 110,806,995 114,471,367 115,293,332 116,069,748 96,133,019
Primary government:
Net investment in capital assets 229,272,346 237,255,768 236,105,965 235,845,179 243,957,123 254,053,198 263,009,466 269,722,941 273,062,817 279,418,303 Restricted8,874,425 9,664,466 10,009,372 11,887,895 12,908,568 9,035,928 8,400,263 4,378,506 4,235,710 4,545,062 Unrestricted13,272,452 11,366,267 12,521,087 15,529,304 18,245,377 17,120,002 21,064,833 21,118,955 24,001,655 32,597,188
Total primary government net position251,419,223 $ 258,286,501 $ 258,636,424 $ 263,262,378 $ 275,111,068 $ 280,209,128 $ 292,474,562 $ 295,220,402 $ 301,300,182 $ 316,560,553 $
Governmental activities: General government 6,902,547 $ 3,466,560 $ 4,799,704 $ 4,027,942 $ 4,412,719 $ 6,735,711 $ 4,149,290 $ 6,498,388 $ 6,855,654 $ 8,472,276 $ Public safety 888,693 875,733 935,460 1,081,649 1,124,135 851,864 2,028,432 4,946,611 5,198,262 6,520,947 Highways and public improvements 4,590,945 4,745,206 4,717,251 4,086,277 7,240,818 4,434,347 5,676,457 6,161,892 5,443,370 6,424,373 Parks and recreation 2,821,206 3,523,181 3,605,841 3,859,128 3,803,814 4,646,338 4,377,814 4,384,579 4,323,736 4,185,817 Interest on long-term debt 1,140,081 1,779,556 1,611,562 1,550,342 1,382,149 1,389,123 1,369,001 1,216,403 1,347,313 1,325,879
Total governmental activities expense 16,343,472 14,390,236 15,669,818 14,605,338 17,963,635 18,057,383 17,600,994 23,207,873 23,168,335 26,929,292
Business-type activities:
Culinary water 3,708,189 3,594,811 3,862,349 4,700,864 5,522,647 5,153,720 5,252,310 5,874,741 6,142,930 5,769,152 Secondary water 3,302,634 2,720,531 2,750,892 2,833,363 3,033,097 2,944,117 3,088,423 3,544,103 3,561,161 3,348,955 Sanitation 1,335,140 1,271,226 1,315,396 1,365,505 1,890,102 1,314,983 1,525,054 1,943,929 1,956,139 2,129,537 Storm water 1,309,645 1,440,155 1,452,557 1,519,786 1,716,585 1,939,995 2,040,144 2,204,344 2,314,697 -
Total business-type activities expenses 9,655,608 9,026,723 9,381,194 10,419,518 12,162,431 11,352,815 11,905,931 13,567,117 13,974,927 11,247,644
Total primary government expenses 25,999,080 23,416,959 25,051,012 25,024,856 30,126,066 29,410,198 29,506,925 36,774,990 37,143,262 38,176,936
(continued)
RIVERTON CITY, UTAH2013 2014 2015 2016 2017 2018 2019 2020 2021 2022
Governmental activities: Charges for service General government 611,403 $ 536,891 $ 613,077 $ 661,632 $ 712,230 $ 596,132 $ 621,876 $ 689,531 $ 512,452 $ 626,013 $ Public safety 545,499 682,026 863,368 1,168,182 1,638,160 1,299,688 861,591 995,399 1,107,952 1,175,747 Highways and public improvements 8,728 21,816 5,118 12,412 3,449 223 1,980 1,440 3,420 947,330 Parks and recreation 401,854 309,176 385,314 410,033 420,572 323,874 352,305 769,060 484,971 614,770
Operating grants and contributions 1,338,968 1,482,819 1,532,594 1,616,502 1,963,549 1,822,487 2,980,187 8,417,406 9,035,715 5,539,179 Capital grants and contributions 2,029,361 6,662,860 3,271,716 2,982,697 11,718,349 6,870,999 11,133,113 3,712,829 4,868,995 8,417,820
Total governmental activities program revenues 4,935,813 9,695,588 6,671,187 6,851,458 16,456,309 10,913,403 15,951,052 14,585,665 16,013,505 17,320,859
Business-type activities: Charges for service
Culinary water 4,001,271 4,087,318 4,047,327 6,042,541 6,078,224 5,572,402 5,698,574 5,328,971 5,735,743 5,660,941 Secondary water 3,709,061 3,815,591 3,866,737 4,147,059 4,343,139 4,255,149 3,465,064 3,617,943 3,819,679 4,513,546 Sanitation 434,340 451,660 481,165 498,190 493,578 513,945 1,378,587 1,451,896 1,859,792 2,488,438 Street lighting 523 - - - - - - - -Storm water 887,126 1,091,858 1,432,767 1,675,787 1,901,245 1,732,563 1,622,486 1,757,822 1,632,506Capital grants and contributions 1,235,848 2,977,041 2,899,907 1,392,171 3,215,157 1,668,969 2,670,111 1,095,900 1,180,019 645,544
Total business-type activities program revenues 10,268,169 12,423,468 12,727,903 13,755,748 16,031,343 13,743,028 14,834,822 13,252,532 14,227,739 13,308,469
Total primary government program revenues 15,203,982 22,119,056 19,399,090 20,607,206 32,487,652 24,656,431 30,785,874 27,838,197 30,241,244 30,629,328
RIVERTON CITY, UTAHRIVERTON CITY, UTAH
COMPREHENSIVE FINANCIAL REPORT FOR THE FISCAL YEAR ENDED JUNE 30, 2022 Statistical Section – Financial Trends (continued)
2013 2014 2015 2016 2017 2018 2019 2020 2021 2022
Total Net (Expense)/Revenue
Governmental activities (11,407,659) $ (4,694,648) $ (8,998,631) $ (7,753,880) $ (1,507,326) $ (7,143,980) $ (1,649,942) $ (8,622,208) $ (7,154,830) $ (9,608,433) $ Business-type activities 612,561 3,396,745 3,346,709 3,336,230 3,868,912 2,390,213 2,928,891 (314,585) 252,812 2,060,825
Total primary government net (expense) revenue (10,795,098) (1,297,903) (5,651,922) (4,417,650) 2,361,586 (4,753,767) 1,278,949 (8,936,793) (6,902,018) (7,547,608)
General Revenues and
Governmental activities:
Taxes
Property 173,780 9,265 7,663 2,566 1,517 1,365 - - - 6,399,639 Sales 5,037,087 5,267,634 5,601,642 5,935,097 6,376,764 6,908,620 7,548,936 8,307,412 9,851,743 11,129,036 Franchise 2,497,357 2,495,880 2,436,228 2,538,504 2,515,892 2,497,572 2,427,058 2,420,802 2,445,976 2,579,433 911 269,976 233,796 257,879 277,752 290,959 - - - -Investment earnings 58,020 113,255 73,397 81,774 109,966 199,619 261,531 376,146 158,706 109,237 Miscellaneous - - - - - - 363,479 136,419 265,019 321,939 Gain (loss) on disposal of assets - - - - - - - 36,500 93,750 229,698 Interfund transfers 4,921,066 (961,845) (941,495) (700,000) (837,400) (892,025) (350,000) (731,196) (357,000) 22,178,184
Total governmental activities 12,957,286 7,157,985 7,435,314 8,135,693 8,457,698 8,715,151 10,251,004 10,546,083 12,458,194 42,947,166
Business-type activities: Investment earnings 59,431 45,351 49,472 85,110 150,801 244,651 329,556 253,406 74,072 35,771 Miscellaneous - - - - - 50,582 48,228 80,619 37,700 Gain (loss) on disposal of assets - - 3,063 - 41,199 - 5,343 103,720 11,913 107,159 Interfund transfers (4,921,066) 961,845 941,495 700,000 837,400 892,025 350,000 731,196 357,000 (22,178,184)
Total business-type activities (4,861,635) 1,007,196 994,030 785,110 1,029,400 1,136,676 735,481 1,136,550 523,604 (21,997,554)
Total primary government 8,095,651 8,165,181 8,429,344 8,920,803 9,487,098 9,851,827 10,986,485 11,682,633 12,981,798 20,949,612
Governmental activities 1,549,627 2,463,337 (1,563,317) 381,813 6,950,372 1,571,171 8,601,062 1,923,875 5,303,364 33,338,733 Business-type activities (4,249,074) 4,403,941 4,340,739 4,121,340 4,898,312 3,526,889 3,664,372 821,965 776,416 (19,936,729)
Total primary government (2,699,447) $ 6,867,278 $ 2,777,422 $ 4,503,153 $ 11,848,684 $ 5,098,060 $ 12,265,434 $ 2,745,840 $ 6,079,780 $ 13,402,004 $
Note:
From 2012 – 2017 the City received the 911 surcharge and remitted it to the Valley Emergency Communications Center (VECC); beginning in 2018, the 911 surcharge is remitted directly to VECC
Public Safety expenses decreased increased in 2019 for start-up expenses related to the Riverton Police Department
Beginning with January 1, 2012, the City decreased its property tax rate to 0.000000 as part of its annexation to the SLVLESA
Beginning in FY 2022, the City included the Riverton Law Enforcement Service Area (RLESA) as a special revenue within the City’s operations, including the RLESA property tax revenue
The Stormwater enterprise fund consolidated its operations into the General Fund, still maintaining a small user fee, during FY 2022
RIVERTON CITY, UTAH
COMPREHENSIVE FINANCIAL REPORT FOR THE FISCAL YEAR ENDED JUNE 30, 2022 Statistical Section – Financial Trends (continued)
2013 2014 2015 2016 2017 2018 2019 2020 2021 2022
General fund
Nonspendable 33,406 $ 64,016 $ 79,519 $ 60,893 $ 95,108 $ 142,905 $ 110,974 $ 100,184 $ 132,471 $ 159,168 $ Restricted 1,290,898 916,210 411,113 699,136 899,534 1,259,270 624,594 547,967 630,976 1,802,330 Unassigned 1,459,244 1,370,207 1,157,530 1,289,014 2,004,753 2,670,853 3,101,506 3,677,666 5,102,234 6,448,433
Total general fund 2,783,548 $ 2,350,433 $ 1,648,162 $ 2,049,043 $ 2,999,395 $ 4,073,028 $ 3,837,074 $ 4,325,817 $ 5,865,681 $ 8,409,931 $
All other governmental funds Reserved
Nonspendable 599,763 $ 740,244 $ 590 $ 122,800 $ 1,183,492 $ - $ 1,636,188 $ - $ - $ - $ Restricted for: Projects 405,258 12,400,365 2,806,150 2,941,439 1,665,199 - 1,800,000 311,077 -Impact fees 3,121,347 2,477,546 1,905,985 1,656,259 2,481,555 1,547,818 1,491,212 583,549 1,890,865 2,737,897 Committed for: Economic development 3,095,240 1,656,998 3,140,491 4,699,777 5,518,284 6,679,999 4,973,966 8,372,929 7,601,161 6,496,407 Assigned for: Redevelopment - - - - - - - 122,800 122,800Vehicle replacements 280,000 35,000 13,738 - - - - - -Capital projects 182,093 329,915 321,163 236,027 793,407 641,259 847,803 1,398,022 2,451,225 5,855,259 Law enforcement - - - - - - - - - 2,541,373
Unassigned (1,326,844) (1,565,032) (1,870,689) (1,690,315) (1,835,898) (1,489,303) - - - -
Total all other governmental funds 6,356,857 $ 16,075,036 $ 6,317,428 $ 7,965,987 $ 9,806,039 $ 7,379,773 $ 10,749,169 $ 10,788,377 $ 12,066,051 $ 17,630,936 $
RIVERTON CITY, UTAH ANNUAL COMPREHENSIVE FINANCIAL REPORT FOR THE FISCAL YEAR ENDED JUNE 30, 2022 Statistical Section – Financial Trends (continued)
CHANGES IN FUND BALANCES – GOVERNMENTAL FUNDS – LAST TEN FISCAL YEARS – RIVERTON CITY CORPORATION, UTAH 2013 2014 2015 2016 2017 20182019 202020212022
Taxes: Property 173,780 $ 9,265 $ 7,663 $ 2,566 $ 1,517 $ 1,365 $ - $ - $ - $ 6,399,639 $ Sales 5,037,087 5,267,634 5,601,642 5,935,097 6,376,764 6,908,620 7,548,936 8,307,412 9,851,743 11,129,036 Franchise 2,497,357 2,495,880 2,436,228 2,538,504 2,515,892 2,497,572 2,427,058 2,420,802 2,445,976 2,579,433 911 269,976 233,796 257,879 277,752 290,959 - - - -Licenses and permits 528,281 579,895 620,502 935,568 1,267,034 1,027,563 631,233 750,318 826,135 942,298 Intergovernmental 1,785,173 4,044,926 2,065,658 2,756,377 2,247,188 1,858,970 7,397,460 9,580,302 9,185,107 8,704,639
Charges for services 668,825 597,809 740,501 883,109 1,045,146 813,393 708,604 1,159,887 903,704 1,975,143 Rental income 68,670 77,892 86,039 117,309 133,441 141,461 138,602 144,397 141,861 225,161
Impact fees 643,253 762,197 830,448 1,185,006 2,203,630 1,666,901 1,475,912 1,530,114 3,188,516 2,114,795
Fines and forfeitures 203,063 160,163 163,421 158,929 210,324 157,170 149,313 190,828 237,095 221,258
Grants - - - - - - 6,130 69,801 146,983 616,196 Interest 58,020 113,255 73,397 81,774 109,966 199,621 261,531 376,146 158,706 109,237 Miscellaneous 92,564 72,043 97,682 78,249 39,371 591,721 573,479 346,419 265,019 321,939
Total revenues 12,026,049 14,414,755 12,981,060 14,950,240 16,441,232 15,864,357 21,318,258 24,876,426 27,350,845 35,338,774
General government 6,517,534 3,016,061 4,103,589 3,743,943 4,387,099 3,723,614 3,496,981 5,864,600 6,336,976 6,998,748 Public safety 881,331 867,730 938,053 1,007,410 1,092,444 817,333 2,016,222 4,701,769 5,108,500 6,585,247 Highways and public improvments 2,896,127 2,738,796 2,772,853 2,070,934 2,194,042 2,299,707 3,321,577 3,833,661 3,064,314 3,933,113 Parks and recreation 1,931,180 1,871,753 2,411,969 2,259,897 2,436,286 2,464,928 2,726,380 2,811,365 2,734,645 2,639,719
Capital expenditures 5,255,800 12,242,359 10,015,513 1,116,895 3,265,056 4,870,632 4,012,920 4,378,612 4,683,903 7,437,642 Debt service: Rent/lease - - - - - - - - - 203,073 Principal 645,000 705,000 730,000 761,000 787,000 851,000 923,000 1,186,000 1,034,000 1,071,000 Interest 802,112 1,496,874 1,656,925 1,532,079 1,514,160 1,483,751 1,464,298 1,112,325 1,326,706 1,299,454 Bond issuance costs 29,500 250,821 - 156,869 - - - 90,000 -Total expenditures 18,958,584 23,189,394 22,628,902 12,649,027 15,676,087 16,510,965 17,961,378 23,978,332 24,289,044 30,167,996 Excess of revenues over (under) expenditures (6,932,535) (8,774,639) (9,647,842) 2,301,213 765,145 (646,608) 3,356,880 898,094 3,061,801 5,170,778
RIVERTON CITY, UTAH
ANNUAL COMPREHENSIVE FINANCIAL REPORT FOR THE FISCAL YEAR ENDED JUNE 30, 2022 Statistical Section – Financial Trends (continued)
IN FUND BALANCES – GOVERNMENTAL FUNDS (continued) – LAST TEN FISCAL YEARS – RIVERTON CITY CORPORATION, UTAH
2013201420152016201720182019202020212022
Revenue bonds issued$ 18,500,000 $ - $ - $ - $ - $ - $ - $ - $ - $ Refunding bonds issued2,268,000 - - 10,180,000 - - - 20,511,000 -Payment to refunding bond escrow agent(2,080,236) - - (11,452,363) - - - (20,418,090) -Premium on bond issued- 465,082 - 1,471,674 - - - - -Proceeds from sale of assets29,050 44,966 31,296 126,116 260,880 186,000 126,562 268,143 112,737 728,505 Contributions from government- - - - 2,601,779 - - - -Transfers in2,114,662 1,758,000 1,983,267 1,834,176 2,326,955 1,919,285 2,541,555 3,222,556 3,829,034 12,542,140 Transfers out(2,988,800) (2,708,345) (2,826,600) (2,534,176) (3,164,355) (2,811,310) (2,891,555) (3,953,752) (4,186,034) (12,190,655)
Total other financing sources (uses)(657,324) 18,059,703 (812,037) (374,573) 2,025,259 (706,025) (223,438) (370,143) (244,263) 1,079,990
Net change (before prior period adj) (7,589,859) 9,285,064 (10,459,879) 1,926,640 2,790,404 (1,352,633) 3,133,442 527,951 2,817,538 6,250,768 Prior period adjustment- - - - 122,800 - - - - -
Net change in fund balances(7,589,859) $ 9,285,064 $ (10,459,879) $ 1,926,640 $ 2,913,204 $ (1,352,633) $ 3,133,442 $ 527,951 $ 2,817,538 $ 6,250,768 $
Debt service as a percentage of noncapital expenditures11%8%21%91%16%17%18%12%12%9%
Note:
Rental income was not tracked separately until fiscal year 2013
From 2012 – 2017 the City received the 911 surcharge and remitted it to the Valley Emergency Communications Center (VECC); beginning in 2018, the 911 surcharge is remitted directly to VECC Public safety expenditures increased in 2019 for start-up expenses related to the Riverton Police Department
Beginning with January 1, 2012, the City decreased its property tax rate to 0.000000 as part of its annexation to the SLVLESA
Beginning in FY 2022, the City included the Riverton Law Enforcement Service Area (RLESA) as a special revenue within the City’s operations, including the RLESA property tax revenue
The Stormwater enterprise fund consolidated its operations into the General Fund, still maintaining a small user fee, during FY 2022
ANNUAL COMPREHENSIVE FINANCIAL REPORT FOR THE FISCAL YEAR ENDED JUNE 30, 2022 Statistical Section – Revenue Capacity
ASSESSED VALUE AND ESTIMATED ACTUAL VALUE OF TAXABLE PROPERTY – RIVERTON CITY – LAST TEN FISCAL YEARS
RIVERTON CITY CORPORATION, UTAH
Taxable
Note:
20122,498,277,042 $ 503,914,790 $ 1,124,224,669 $ 1,877,967,163 $ 0.0000003,002,191,832 $ 62.55%
20132,651,085,589 527,646,034 1,192,988,515 1,985,743,108 0.0000003,178,731,623 62.47%
20142,912,604,935 527,954,827 1,310,672,221 2,129,887,541 0.0000003,440,559,762 61.91%
20153,145,992,838 551,796,268 1,415,696,777 2,282,092,329 0.0000003,697,789,106 61.72% 20163,408,003,416 622,383,791 1,533,601,537 2,496,785,670 0.0000004,030,387,207 61.95% 20173,751,204,555 673,293,883 1,688,042,050 2,736,456,388 0.0000004,424,498,438 61.85%
20184,204,334,287 761,201,909 1,891,950,429 3,073,585,767 0.0000004,965,536,196 61.90% 20194,630,155,887 845,689,859 2,083,570,149 3,392,275,597 0.0000005,475,845,746 61.95% 20204,851,666,929 935,867,482 2,183,250,118 3,604,284,293 0.0000005,787,534,411 62.28% 20215,574,823,298 1,003,207,672 2,508,670,484 4,069,360,486 0.0000006,578,030,970 61.86%
Taxable Value is market value less any applicable reduction allowed for residential property under Section 59-2-103.
Sources: Utah State Tax Commission and the Salt Lake County Auditor
ANNUAL COMPREHENSIVE FINANCIAL REPORT FOR THE FISCAL YEAR ENDED JUNE 30, 2022 Statistical Section – Revenue Capacity
RIVERTON CITY CORPORATION, UTAH
Tax Year
Note:
Taxable Assessed Value as a Percentage of Estimated Actual Value
2012$ - $ - $ - $ - $ 2013- - - -2014- - - -2015- - - -2016- - - -2017- - - -2018- - - -20194,630,155,887 845,689,859 2,083,570,149 3,392,275,597 0.0017265,475,845,746 61.95% 20204,851,666,929 935,867,482 2,183,250,118 3,604,284,293 0.0016655,787,534,411 62.28% 20215,574,823,298 1,003,207,672 2,508,670,484 4,069,360,486 0.0015036,578,030,970 61.86%
Taxable Value is market value less any applicable reduction allowed for residential property under Section 59-2-103. The Riverton Law Enforcement Service Area was established tax year 2021
Sources: Utah State Tax Commission and the Salt Lake County Auditor
20120.0000000.0000000.0000000.0000000.0073600.0034200.0000210.0004430.0004070.0004550.0020790.001999 20130.0000000.0000000.0000000.000000 0.0071320.0039350.0000210.0004240.0003960.0004460.0021920.002230 20140.0000000.0000000.0000000.0000000.0067000.003448 0.0000200.0003990.0003710.0004220.0020970.002145 20150.0000000.0000000.0000000.0000000.0068720.0032140.0000190.0004000.0003540.000405 0.0020000.002042 20160.0000000.0000000.0000000.0000000.0069060.0030100.0000180.0003720.0003310.0004000.0018880.001925 20170.0000000.0000000.0000000.0000000.0064240.0028500.0000170.0004000.0003160.0004000.0018120.002033 20180.0000000.0018490.0000000.0018490.0065010.0025840.000015 0.0004000.0002960.0004000.0018580.000000 20190.0000000.0017260.0000000.0017260.0066760.0024690.0000140.0003830.000280 0.0004000.0017460.000000 20200.0000000.0016650.0000000.0016650.0065670.0024630.0000130.0003660.0002710.000400 0.0017170.000000 20210.0000000.0015030.0159700.0174730.6567000.0022510.0000120.0003690.0002500.0004000.000000 0.000000
Note:
Salt Lake County rate includes the Salt Lake County and the Salt Lake County Library
Riverton City annexed into the Salt Lake Valley Law Enforcement Service Area (SLVLESA) January 1, 2012
Riverton City left the Salt Lake Valley Law Enforcement Service Area January 1, 2018 and annexed into the newly created Riverton Law Enforcement Service Area Riverton City left the Unified Fire Service Area January 1, 2021, and annexed into the newly created Riverton Fire Service Area
Source: www.taxrates.utah.gov for the respective entities
ANNUAL COMPREHENSIVE FINANCIAL REPORT FOR THE FISCAL YEAR ENDED JUNE 30, 2022 Statistical Section – Revenue Capacity (continued) Tax Year Riverton City Basic Rate Riverton Law Enforcement Service Area Riverton Fire Service Area Total Direct Rate Jordan School District Salt Lake County (includes SL County Library) South Salt Lake Valley Mosquito Abatement District Jordan Valley Water Conservancy District South Valley Sewer District Central Utah Water Conservancy District Unified Fire Service Area Salt Lake Valley Law Enforcement Service AreaTax Year 2021
Taxpayer
Taxable Assessed Value Rank
Percentage of Total City Taxable Assessed Value
Riverton Centercal LLC 118,196,000 $ 1 2.90%
Tax Year 2012
Taxable Assessed Value Rank
Percentage of Total City Taxable Assessed Value
On Point Properties LLC 41,631,200 2 1.02% 31,636,100 $ 1 1.54%
Wal-Mart Real Estate Business Trust 29,112,400 3 0.72% 19,505,900 2 0.95%
MMA LLC 25,134,010 4 0.62% 12,122,550 3 0.59%
Park Avenue Apartments, LLC 19,772,885 5 0.49%
Legacy Spring, LTD 18,705,445 6 0.46% 9,466,160 7
Lowe's HIW, Inc 13,681,600 7 0.34% 10,338,000 5 0.50%
HD Development of Maryland Inc 12,176,200 8 0.30% 9,561,200 6 0.47%
Bucklyn Rose Health 12,121,600 9 0.30%
Rose Creek Lofts, LLC 11,417,990 100.28% 0.00%
Tanglewood Investors LP 0.00% 10,664,400 4 0.52%
CML-UT Riverton LLC 9,217,500 8 0.45%
Rose Creek Crossing LLC 8,281,840 9 0.40% Riverton Plaza 7,770,300 10 0.38%
Total 301,949,330 $ 7.42% 128,563,950 $ 5.80%
Source: Salt Lake County Assessor
Note:
Tax Year Total Tax Levied
Current Tax Collected Percentage of Levy Collected in Subsequent YearsAmount
Percentage of Levy
201240 $ 40 $ 100.00%$ 40 $ 100.00% 2013- - 100.00%- - 100.00% 2014- - 100.00%- - 100.00% 2015- - 100.00%- - 100.00% 2016- - 100.00%- - 100.00% 2017- - 100.00%- - 100.00% 2018- - 100.00%- - 100.00% 2019- - 100.00%- - 100.00% 2020- - 100.00%- - 100.00% 2021- - 100.00%- - 100.00%
RIVERTON CITY, UTAH Statistical Section – Revenue Capacity (continued) Total Collected to Date Riverton City assessed a 0.000000 property tax rate for tax years 2012, through 2019. Salt Lake County records show a $40 levy for tax year 2012 The above collections are for property taxes and do not include tax increment received from other governments Source: Salt Lake County AuditorRIVERTON CITY, UTAH
ANNUAL COMPREHENSIVE FINANCIAL REPORT FOR THE FISCAL YEAR ENDED JUNE 30, 2022
Statistical Section – Revenue Capacity (continued)
RIVERTON CITY CORPORATION, UTAH
Total Collected to Date
Note:
Tax Year Total Tax Levied
Current Tax Collected Percentage of Levy Collected in Subsequent Years Amount Percentage of Levy
2012 - - 100.00% - - 100.00% 2013 - - 100.00% - - 100.00% 2014 - - 100.00% - - 100.00% 2015 - - 100.00% - - 100.00% 2016 - - 100.00% - - 100.00% 2017 - - 100.00% - - 100.00%
2018 5,686,922 5,561,525 97.79% 64,517 5,626,042 98.93%
2019 5,888,676 5,729,917 97.30% 82,254 5,812,171 98.70%
2020 6,007,537 5,867,384 97.67% 49,486 5,916,870 98.49%
2021 6,126,076 6,001,413 97.97% - 6,001,413 97.97%
The Riverton Law Enforcement Service Area did was established January 1, 2018
The above collections are for property taxes and do not include tax increment received from other governments
Source: Salt Lake County Audito
RIVERTON CITY, UTAH
ANNUAL COMPREHENSIVE FINANCIAL REPORT FOR THE FISCAL YEAR ENDED JUNE 30, 2022 Statistical Section – Revenue Capacity (continued)
POINT OF SALE (POS) SALES TAX REVENUE BY CATEGORY – LAST TEN FISCAL YEARS – RIVERTON CITY CORPORATION, UTAH
Category2013201420152016201720182019202020212022
Retail & grocery1,469,467 $ 1,440,017 $ 1,502,769 $ 1,757,709 $ 2,090,174 $ 2,198,182 $ 2,488,190 $ 2,509,123 $ 2,369,716 $ 3,202,119 $ Internet sales- - - - - - 1,003,530 1,437,212 1,844,461 2,433,814
Utility & communication453,219 457,575 465,627 489,853 473,091 463,300 446,970 471,074 392,584 393,911
Construction & home improvement515,139 621,824 808,938 804,126 744,874 838,360 850,217 1,125,368 1,254,493 1,306,417
Eating & drinking establishments445,672 478,317 430,732 455,767 505,555 520,129 605,640 651,981 636,758 800,304
Auto sales & supplies296,467 271,769 320,234 269,669 313,285 355,449 111,069 125,262 184,111 190,790
Fuel & service stations149,829 157,957 220,197 239,708 253,123 258,803 320,743 300,835 239,267 388,310
All other outlets238,483 276,777 263,067 356,338 391,727 559,083 337,955 465,752 557,792 803,811
Totals3,568,276 $ 3,704,236 $ 4,011,564 $ 4,373,170 $ 4,771,829 $ 5,193,306 $ 6,164,314 $ 7,086,607 $ 7,479,182 $ 9,519,476 $
Fiscal Year
Year TOTAL SALES TAX REVENUE – LAST TEN FISCAL YEARS – RIVERTON CITY CORPORATION, UTAH 2013201420152016201720182019202020212022
Riverton portion - point of sale (POS)1,784,311 $ 1,852,242 $ 2,005,782 $ 2,186,586 $ 2,385,932 $ 2,573,926 $ 3,082,157 $ 3,543,304 $ 4,284,707 $ 4,759,738 $ State sharing pool3,252,776 3,415,392 3,595,860 3,748,511 3,990,832 4,334,694 4,466,779 4,764,108 5,567,036 6,369,298
Totals5,037,087 $ 5,267,634 $ 5,601,642 $ 5,935,097 $ 6,376,764 $ 6,908,620 $ 7,548,936 $ 8,307,412 $ 9,851,743 $ 11,129,036 $
Note:
Beginning in 2019 a new category of ‘Internet Sales’ was added.
Utah State Tax Commission distributes sales tax revenue based on a two-part calculation: POS and the State’s sharing pool. The City is guaranteed ½ of 1% of all sales tax generated in Riverton. The other ½ of 1% of the sales tax generated in Riverton becomes part of the State’s sharing pool and is distributed to local governments based on factors, including population.
RIVERTON CITY, UTAH
COMPREHENSIVE FINANCIAL REPORT FOR THE FISCAL YEAR ENDED JUNE 30, 2022
Financial Section – Revenue Capacity (continued)
Fiscal Year ended June 30, Riverton City Direct Rate State of UtahSalt Lake County
County Option Transportation Mass Transit
Botanical, Cultural, Zoo (County) Total Sales Tax Rate
2013 1.00%4.70% 0.25% 0.25% 0.55% 0.10% 6.85% 2014 1.00%4.70% 0.25% 0.25% 0.55% 0.10% 6.85% 2015 1.00%4.70% 0.25% 0.25% 0.55% 0.10% 6.85% 2016 1.00%4.70% 0.25% 0.25% 0.55% 0.10% 6.85% 2017 1.00%4.70% 0.25% 0.25% 0.55% 0.10% 6.85% 2018 1.00%4.70% 0.25% 0.25% 0.55% 0.10% 6.85% 2019 1.00%4.85% 0.25% 0.50% 0.55% 0.10% 7.25% 2020 1.00%4.85% 0.25% 0.50% 0.55% 0.10% 7.25% 2021 1.00%4.85% 0.25% 0.50% 0.55% 0.10% 7.25% 2022 1.00%4.85% 0.25% 0.50% 0.55% 0.10% 7.25%
Source: Utah State Tax Commission – July 1, 2022 date taken on September 28, 2022, from https://tax.utah.gov/salestax/rate/21q3combined.pdf ,
RIVERTON CITY, UTAH
ANNUAL COMPREHENSIVE FINANCIAL REPORT FOR THE FISCAL YEAR ENDED JUNE 30, 2022 Statistical Section – Revenue Capacity (continued)
Fiscal Year 2022
Fiscal Year 2013
Category Point of Sale Tax Percentage of Total Point of Sale Tax Percentage of Total
Retail & grocery 3,202,119 $ 33.64% 1,469,467 $ 41.18% Internet sales 2,433,814 25.57% - 0.00%
Construction & home improvement 1,306,417 13.72% 515,139 14.44%
Eating & drinking establishments 800,304 8.41% 445,672 12.49%
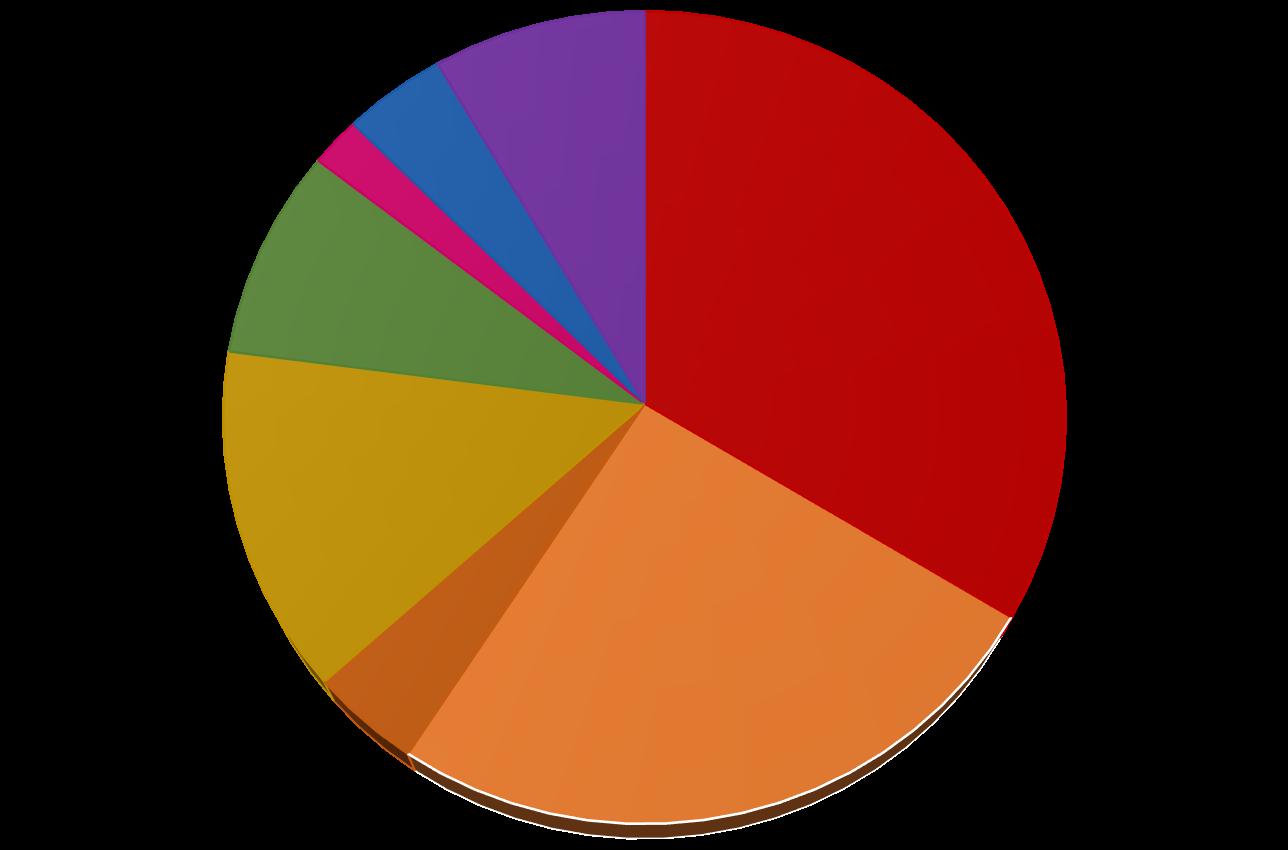
All other outlets 803,811 8.44% 238,536 6.68%
Utility & communication 393,911 4.14% 453,219 12.70%
Fuel & service stations 388,310 4.08% 149,829 4.20% Auto sales & supplies 190,790 2.00% 296,467 8.31%
Total 9,519,476 $ 100.00% 3,568,329 $ 100.00%
Auto Sales and Supplies 2%
Fuel and Service Stations 4%
Eating and Drinking Establishments 8%
All Other Outlets 8%
Construction and Home Improvement 14%
Utility and Communication 4%
Note:
Beginning in 2019 a new category of ‘Internet Sales’ was added
Retail and Grocery 34% Internet sales 26%
RIVERTON CITY, UTAH
ANNUAL COMPREHENSIVE FINANCIAL REPORT FOR THE FISCAL YEAR ENDED JUNE 30, 2022
Financial Section – Revenue Capacity (continued)
FRANCHISE TAX REVENUE BY CATEGORY – LAST TEN FISCAL YEARS – RIVERTON CITY CORPORATION, UTAH
Fiscal Year
2013201420152016201720182019202020212022
Power1,237,034 $ 1,286,161 $ 1,281,983 $ 1,344,684 $ 1,342,358 $ 1,309,022 $ 1,314,069 $ 1,326,534 $ 1,377,612 $ 1,385,270 $ Gas563,288 603,883 560,617 591,289 568,493 614,896 577,973 583,143 614,105 749,618 Comm. and mobile phone554,680 455,358 437,334 428,951 398,745 353,193 306,836 267,684 204,803 178,313 Cable142,355 150,478 156,294 173,580 206,296 220,461 228,180 243,441 249,456 266,232
Totals2,497,357 $ 2,495,880 $ 2,436,228 $ 2,538,504 $ 2,515,892 $ 2,497,572 $ 2,427,058 $ 2,420,802 $ 2,445,976 $ 2,579,433 $
Fiscal Year
Power6.0%6.0%6.0%6.0%6.0%6.0%6.0%6.0%6.0%6.0% Gas6.0%6.0%6.0%6.0%6.0%6.0%6.0%6.0%6.0%6.0%
Comm. and mobile phone3.5%3.5%3.5%3.5%3.5%3.5%3.5%3.5%3.5%3.5% Cable5.0%5.0%5.0%5.0%5.0%5.0%5.0%5.0%5.0%5.0%
RIVERTON CITY, UTAH
ANNUAL COMPREHENSIVE FINANCIAL REPORT FOR THE FISCAL YEAR ENDED JUNE 30, 2022 Statistical Section – Revenue Capacity (continued)
2013201420152016201720182019202020212022
Culinary water sales3,612,778 $ 3,599,506 $ 3,601,263 $ 4,739,165 $ 5,097,470 $ 4,876,447 $ 4,863,489 $ 5,059,813 $ 5,365,468 $ 5,157,201 $
Culinary impact fees270,836 369,637 354,869 1,194,097 817,338 588,466 774,717 213,488 315,624 457,782
Secondary water sales3,360,386 3,484,108 3,547,103 3,572,673 3,544,669 3,603,839 3,098,334 3,140,151 3,231,084 3,545,938
Secondary impact fees345,427 330,914 316,401 569,629 698,115 571,846 327,840 443,851 551,347 939,341
Other water revenue120,905 118,744 94,428 114,036 263,771 186,953 110,454 99,190 138,724 98,022 Sanitation434,340 451,660 481,165 498,190 493,578 513,945 1,168,160 1,223,646 1,475,442 2,097,596
Storm water772,055 805,095 1,128,330 1,249,279 1,272,047 1,324,230 1,374,821 1,368,344 1,419,434Storm water impact fees115,071 286,763 304,437 426,508 629,198 408,333 249,155 351,164 213,072Street lighting523 - - - - - - - - -
Totals9,032,321 $ 9,446,427 $ 9,827,996 $ 12,363,577 $ 12,816,186 $ 12,074,059 $ 11,966,970 $ 11,899,647 $ 12,710,195 $ 12,295,880 $
Note:
Other water revenue includes meter set fees and connection fees
Culinary water rates increased by $1 a month in 2022
Secondary water rates increased by $2.50 a month in 2022 Sanitation user fee was reduced from $12.50 to $1.00 a month for each first container as of January 1, 2012; this fee was increased to $5.00 a month in 2019, $6.00 a month in 2020, and $10 a month in 2022
Street lighting user fee was eliminated, and the operations were absorbed into the General Fund as of January 1, 2012 Stormwater user fees were decreased by $5,95 a month and the stormwater operations were consolidated into the Governmental activities in 2022
2013$ 18,655,949 $ 13,140,626 $ 31,796,575 $ 3.44%805 $ 2014- 36,847,353 11,747,192 48,594,545 4.83%1,203 2015- 36,048,67510,348,760 46,397,435 4.50%1,118 2016- 35,495,0718,920,327 44,415,398 3.74%1,060 2017- 34,541,2837,397,894 41,939,177 3.38%979 2018- 33,560,1235,857,461 39,417,584 2.95%909 2019- 32,506,9634,282,028 36,788,991 2.57%828 2020- 33,607,82112,140,728 45,748,549 3.31%996 2021- 32,443,66110,529,805 42,973,466 2.83%949 2022- 31,242,5015,216,846 36,459,347 2.43%803
RIVERTON CITY, UTAHRIVERTON CITY, UTAH
ANNUAL COMPREHENSIVE FINANCIAL REPORT FOR THE FISCAL YEAR ENDED JUNE 30, 2022 Statistical Section – Debt Capacity (continued)
Fiscal Year
Estimated Actual Value of Property Percentage of Estimated Actual Value of Property Per Capita
2013$ 18,655,949 $ 18,655,949 $ 3,002,191,832 $ 0.62%472 $ 2014- 36,847,353 36,847,353 3,178,731,623 1.16%912 2015- 36,048,675 36,048,675 3,440,559,762 1.05%869 2016- 35,495,071 35,495,071 3,697,789,106 0.96%847 2017- 34,541,283 34,541,283 4,030,387,207 0.86%806 2018- 33,560,123 33,560,123 4,424,498,438 0.76%774 2019- 32,506,963 32,506,963 4,965,536,196 0.65%732 2020- 33,607,821 33,607,821 5,475,845,746 0.61%731 2021- 32,443,661 32,443,661 5,787,534,411 0.56%716 2022- 31,242,501 31,242,501 6,578,030,970 0.47%688
Note: Actual value of property estimated based on data from Utah State Tax Commission See ‘Demographic and Economic Statistics’ for population data
Source: Utah State Tax Commission
LAST TEN FISCAL YEARS – RIVERTON CITY CORPORATION, UTAH
Government Unit
Debt repaid with property taxes
General Obligation Debt Outstanding
Statistical Section – Debt Capacity
Estimated Percentage Applicable
Estimated Share of Direct and Overlapping Debt
Central Utah Water Conservancy District 176,332,015 $ 2.9% 5,026,757 $
Jordan School District 202,927,000 2.8% 5,760,855
Jordan Valley Water Conservancy District - -Salt Lake County (includes SL County Library) 133,245,000 2.8% 3,782,666
South Salt Lake Valley Mosquito Abatement - - -
South Valley Sewer District - -Riverton Law Enforcement Service Area - - -
Subtotal, overlapping general obligation debt 14,570,278
Direct:
General obligation debt -
Franchise and sales tax revenue bonds 30,441,000
Unamortized premiums 801,501
Total direct debt 31,242,501
Total direct and overlapping general obligation debt 45,812,779 $
Note:
Overlapping governments are those that coincide with the geographic boundaries of the City. This schedule represents the portion of outstanding debt of those overlapping governments that is sustained by the residents and businesses of Riverton City. This process recognizes that, when considering the City’s ability to issue and repay long-term debt, the entire debt burden borne by the residents and businesses should be taken into account. The estimated percentage applicable is Riverton City’s taxable assessed value divided by the total taxable assessed values of overlapping government units.
Source: Audited financial reports for the most recent fiscal year from the individual agencies - www.taxrates.utah.gov for the respective entities
ANNUAL COMPREHENSIVE FINANCIAL REPORT FOR THE FISCAL YEAR ENDED JUNE 30, 2022 Statistical Section – Debt Capacity (continued)
2013 2014 2015 2016 2017 2018 2019 2020 2021 2022
Debt Limit 75,118,687 $ 79,429,724 $ 85,195,502 $ 91,283,693 $ 99,871,427 $ 109,458,256 $ 122,943,431 $ 135,691,024 $ 144,171,372 $ 162,774,419 $
Total net debt applicable to limit - - - - - - - - -Legal debt margin 75,118,687 $ 79,429,724 $ 85,195,502 $ 91,283,693 $ 99,871,427 $ 109,458,256 $ 122,943,431 $ 135,691,024 $ 144,171,372 $ 162,774,419 $
Total net debt applicable to the limit as a percentage of debt limit - - - - - - - - - -
Taxable assessed value 4,069,360,486 $ Debt limit (4% of assessed value) 162,774,419 Debt applicable to limit: General obligation bondsLess: Amount set aside for repayment of general obligation debtTotal net debt applicable to limitLegal debt margin 162,774,419 $
Note:
The City has not issued General Obligation Bonds in the past 10 years. Under the Utah State Constitution, Article XIV, Section 4, general obligation debt for the City should not exceed 4% of the total taxable assessed property value
RIVERTON CITY, UTAH Legal Debt Margin Calculation for Fiscal Year 2022COMPREHENSIVE FINANCIAL REPORT FOR THE FISCAL YEAR ENDED JUNE 30, 2022 Statistical Section – Debt Capacity (continued)
Fiscal Year Franchise / Sales Tax Revenue Principal Interest Coverage Ratio Water Revenue Less: Operating Expenses
Net Available Revenue Principal Interest Coverage Ratio
2013 7,534,444 $ 650,000 $ 777,130 $ 5.28 7,710,332 $ 4,889,531 $ 2,820,801 $ 1,228,000 $ 439,277 $ 1.69
2014 7,763,514 715,000 1,488,549 3.52 7,902,909 4,574,991 3,327,918 1,366,000 259,239 2.05
2015 8,037,870 735,000 1,648,434 3.37 7,914,064 4,848,963 3,065,101 1,371,000 261,798 1.88
2016 8,473,601 766,000 1,524,687 3.70 10,189,600 5,698,212 4,491,388 1,401,000 246,020 2.73
2017 8,892,656 582,000 1,510,368 4.25 10,421,363 6,671,655 3,749,708 1,495,000 227,547 2.18
2018 9,406,192 851,000 1,483,751 4.03 9,827,551 6,182,791 3,644,760 1,513,000 205,304 2.12
2019 9,975,994 923,000 1,456,948 4.19 9,174,834 6,226,844 2,947,990 1,548,000 179,088 1.71
2020 10,728,214 1,186,000 1,099,574 4.69 8,956,493 7,184,589 1,771,904 1,603,000 132,888 1.02
2021 12,297,719 1,034,000 1,313,958 5.24 9,602,247 7,607,528 1,994,719 1,600,000 204,282 1.11
2022 13,708,469 1,071,000 1,278,554 5.83 10,198,284 6,954,235 3,244,049 1,300,000 169,197 2.21
Note:
Details regarding the City’s outstanding debt can be found in Note No. 10
Operating expenses do not include interest, depreciation, or amortization costs
The total principal payment for water revenue bonds does not include the full defeasance of the 2020B Bond Series using left over construction proceeds from the 2020A Bond Series and fund balance in the City REDIIF fund. Including this principal figure would create a distorted coverage ratio.
DEMOGRAPHIC AND ECONOMIC INDICATORS –LAST TEN FISCAL YEARS – RIVERTON CITY CORPORATION, UTAH
Fiscal YearPopulation
Personal Income
Per Capita Personal Income Unemployment Rate
201340,398923,867,391 $ 22,869 $ 6.0% 201440,9481,006,113,125 24,571 5.0% 201541,5001,031,506,498 24,856 3.5% 201641,9001,185,992,416 28,305 3.6% 201742,8381,239,724,187 28,940 3.4% 201843,3441,334,574,253 30,790 3.0% 201944,4191,433,310,659 32,268 2.5% 202045,9491,383,229,771 30,104 3.4% 202145,2851,519,215,389 33,548 2.6% 202245,4021,497,965,492 32,993 2.2%
Riverton City Unemployment Rate & Population
Note:
6.00%
5.00%
4.00%
3.00%
2.00%
1.00%
37,000 38,000 39,000 40,000 41,000 42,000 43,000 44,000 45,000 46,000 47,000 0.00%
7.00% 2013201420152016201720182019202020212022
Personal income is for each respective income tax year that ends during the fiscal year Unemployment rate is for the Salt Lake City, Utah, Metropolitan Statistical Area The population reported for fiscal years 2013 – 2020 and 2022, are estimates; however, the fiscal year 2021 population matches the 2020 United States Census
Sources: Unemployment rate – July 2022 taken from https://www.bls.gov/web/metro/laulrgma.htm on September 29, 2022 Personal Income – each respective year found at http://tax.utah.gov/econstats/income/federal-returns on September 29, 2022
Statistical Section – Demographic and Economic Information
PRINCIPAL EMPLOYERS – CURRENT YEAR AND NINE YEARS PRIOR RIVERTON CITY CORPORATION, UTAH
2022 2013
Employer
Employees Rank
Percentage of Total City Employment Employees Rank
Percentage of Total City Employment
Jordan School District 1351 1 13.10% 1110 2 14.22%
LDS Church 1200 2 11.63% 1247 1 15.97%
Riverton IHC Hospital 1144 3 11.09% 825 3 10.57%
Walmart 530 4 5.14% 336 5 4.30%
Stamin' Up! 353 5 3.42% 400 4 5.12%
Costco Wholesale 255 6 2.47%
Harmons 179 7 1.74%
Riverton City 161 8 1.56% 90 9 1.15%
Lowe's Home Improvement 160 9 1.55% 150 6 1.92%
Home Depot 158 10 1.53% 135 7 1.73%
Peterson's Marketplace 130 8 1.67% Kohl's 85 10 1.09%
FULL–TIME EQUIVALENT EMPLOYEES BY FUNCTION/PROGRAM – GOVERNMENT–WIDE
LAST TEN FISCAL YEARS – RIVERTON CITY CORPORATION, UTAH 20132014201520162017 20182019202020212022
City Council
2.500 2.500 2.500 2.500 2.500 2.500 2.500 2.500 2.500 2.500
Mayor's Office 0.500 0.500 0.500 0.500 0.500 0.500 0.500 1.500 1.500 0.500
City Manager's Office 3.000 3.000 4.000 4.000 3.000 2.000 1.500 1.500 1.500 1.500
Facilities maintenance 2.000 3.000 3.000 3.000 3.000 3.000 7.500 6.500 6.500 6.500
City Recorder's Office 2.000 2.000 2.000 2.000 2.000 2.000 2.000 2.000 1.000 1.000
City Attorney's Office 3.000 3.000 3.000 3.000 3.000 3.500 2.500 2.500 3.000 3.500
Communications & IT - - - - - - 6.000 6.500 7.500 8.500
Administrative Services 13.000 13.000 14.000 15.000 16.250 16.250 15.000 14.000 14.000 13.000
Justice court Judge 0.500 0.500 0.500 0.500 0.500 0.500 0.500 0.500 0.500 0.500
Planning and zoning 2.000 2.000 2.000 2.000 3.000 3.000 4.000 4.000 3.000 4.000
Building inspections 3.000 3.000 3.000 3.000 3.000 3.000 3.000 3.000 3.000 3.000 Ordinance enforcement/AC 1.500 1.500 1.500 1.000 1.000 3.000 2.000 2.000 2.000 2.000 Police - - - - - - 39.000 39.000 39.000 40.000 Crossing Guards - - - - - - 3.460 3.460 3.460 3.460 Parks and recreation Parks 6.000 7.000 9.000 12.000 11.750 12.750 12.250 12.750 12.750 13.500 Recreation and comm. events 4.000 4.000 4.000 6.000 5.500 6.500 6.500 6.500 6.500 6.000 Senior center 1.000 1.000 1.500 1.500 1.500 1.500 1.500 1.500 1.500 1.500
Highways and public improvements
Engineering 12.000 12.000 14.000 16.000 16.000 16.000 16.000 15.000 12.000 11.000 Fleet 1.000 1.000 1.000 1.000 1.000 1.000 2.000 2.000 2.000 2.000 Secondary Water Bond Project - - - - - - 3.000 3.000 -Street maintenance 9.500 11.500 11.500 11.500 10.500 11.500 11.500 12.500 12.500 12.500 Street lighting 2.000 2.000 2.000 2.000 2.000 2.000 2.000 2.000 2.000 2.000 Storm water 4.000 4.000 4.000 4.000 5.000 5.000 5.000 5.000 5.000 5.000 Water 17.000 19.000 19.000 16.000 17.000 17.000 17.000 18.000 18.000 18.000
Total full-time equivalent employees 89.500 95.500 102.000 106.500 108.000 112.500 166.210 167.210 160.710 161.460
Notes: Animal Control services (included in ordinance enforcement) were contracted out beginning in 2012 and then brought back in house in 2018 – Riverton Police Department was established, and all employees hired in 2019 in anticipation for a July 1, 2019 start of operations
Source: Riverton City Human Resources
RIVERTON CITY, UTAH
COMPREHENSIVE FINANCIAL REPORT FOR THE FISCAL YEAR ENDED JUNE 30, 2022 Statistical Section – Operating Information (continued)
Fiscal Year
2013201420152016201720182019202020212022
Building permits issued 131 142 131 203 259 210 127 97 152 178
Accessory building permits / solar/ etc. 93 123 140 287 439 264 184 274 400 354
Booking arrests - - - - - - - 86 132 101
Traffic citations - - - - - - - 1,315 1,606 1,793 Misdemeanor citations - - - - - - - 176 231 193
Total calls for police service - - - - - - - 7,533 15,196 18,282
Asphalt overlay contract (sf) 17,581211,953302,705 - 94,225140,330 275,914 904,132 128,217 434,879
Asphalt slurry/chip contract (sy) 354,440247,454379,086 - 424,478 - - 357,851 374,791 99,954
Asphalt repairs (sf) 46,229 18,787 13,674 28,541 11,630 25,524 26,513 18,225 13,924 16,402
Concrete sidewalk replaced (sf) 3,689 7,731 - 2,633 9,952 18,506 3,378 2,500 7,829 3,674
Concrete curb replaced (lf) 526 151 166 105 107 168 29 23 71 33
Trip hazards completed 71 6 19 46 83 17 12 19 15 32
Street light repaired 422 374 437 479 519 703 683 809 602 562
Signs repaired 267 264 178 142 107 86 78 80 46 32 Street sweeping (miles) 2,464 3,855 2,453 2,744 3,573 4,265 1,556 1,789 359 1,113
Catch basins, manholes, and pipes cleaned 42 157 198 67 311 498 222 50 90 255
Parks and recreation
Community center reservations 77 102 574 597 652 653 1,044 719 677 764
Community event participants 29,000 31,000 36,000 23,050 27,230 14,670 26,200 23,703 12,080 43,128
Community events held 14 19 24 48 34 34 34 27 12 12
Program and class participants 4,700 3,755 4,277 7,337 7,904 7,673 9,657 4,735 6,427 9,056 Recreation programs offered 38 27 29 29 61 61 61 24 63 63 Outdoor pavilion reservations 687 680 1,001 544 584 581 562 375 408 507
Indoor pavilion reservations 219 154 363 222 235 237 197 86 73 113
Old Dome reservations - - - 43 67 70 75 54 51 55
Old Dome events - - - 8 12 14 15 4 5 4
New connections 117 239 105 157 260 325 97 63 87 77
Avg. daily consumption (1000 gal) 4,465 3,896 3,743 3,710 4,367 4,253 3,856 4,139 4,377 4,223
Avg. daily consumption per capita (gal) 111 93 89 89 88 98 87 90 103 93
Annual water usage
Purch. from JVWCD (1000 gal) 229,399 202,014 594,156 1,354,342 1,624,586 1,552,616 1,407,337 1,511,015 1,597,806 1,541,286
City wells (1000 gal) 1,313,632 1,192,492 772,220 57,467 - - - - - -
% purch. from JVWCD 14.87%14.49%43.48%95.93%100.00%100.00%100.00%100.00%100.00%100.00%
Source: Riverton City Corporation
RIVERTON CITY, UTAH
Public works
Note:
COMPREHENSIVE FINANCIAL REPORT FOR THE FISCAL YEAR ENDED JUNE 30, 2022 Statistical Section – Operating Information (continued)
BY FUNCTION/PROGRAM – LAST TEN FISCAL YEARS – RIVERTON CITY CORPORATION, UTAH 2013201420152016201720182019202020212022
Streets (road miles) 137 139 141 141 145 145 145 149 149 151
Streetlights 3,075 3,132 3,141 3,190 3,192 3,263 3,292 3,283 3,325 3,325
Traffic signals 9 15 16 16 17 17 17 17 19 19
Parks and recreation
Parks 31 31 31 31 31 31 31 33 33 34
Acreage 220 220 220 220 220 220 220 220 220 246
Trees 3,337 3,206 3,206 3,701 3,850 4,010 4,151 4,212 4,295 4,421
Pavilions 20 18 18 18 22 22 22 28 28 28
Restrooms 13 10 10 10 14 14 14 14 14 14
Playgrounds 28 28 28 30 32 32 32 32 32 32
Baseball/softball diamonds 15 15 15 15 15 15 15 12 12 12
Soccer/football fields 23 23 23 23 23 23 23 22 22 22
Culinary water lines (miles) 167 167 167 167 167 178 183 187 191 195
Culinary storage capacity (1000 gal) 6,500 6,500 6,500 6,500 6,500 11,500 11,500 11,500 11,500 11,500
Culinary water accounts 9,156 9,395 9,500 9,657 9,918 10,243 10,340 10,403 10,511 10,554
Secondary water lines (miles) 165 165 165 165 165 165 165 167 173 176
Secondary water shares (af) 8,814 8,950 9,769 10,103 10,301 10,715 10,853 10,999 11,176 11,381
Storm drain lines (miles) - 77 80 81 83 83 84 86 87 89
Manholes - 1,680 1,701 1,704 1,710 1,745 1,748 1,844 1,873 1,959
Catch basins - 2,170 2,152 2,152 2,152 2,178 2,239 2,316 2,361 2,445
Detention / retention basins (acres) - 53 53 53 53 53 46 58 58 58
Drywells - - - - - - - 59 59 65
Storm water assets were not inventoried until fiscal year 2014, Drywells were not tracked until 2020
Sources: Riverton City Corporation and the Utah Department of Transportation