
APPLYING SOCIAL DETERMINANTS OF HEALTH INDICATORS TO ADVANCE HEALTH EQUITY 1 APPLYING SOCIAL DETERMINANTS OF HEALTH INDICATOR DATA FOR ADVANCING HEALTH EQUITY A Guide for Local Health Department Epidemiologists and Public Health Professionals

This guide was produced by the Bay Area Regional Health Inequities Initiative (BARHII) Data Committee.
Matt Beyers, Alameda County Public Health Department
Brad Jacobson, San Mateo County Public Health, Policy and Planning
Amy V. Smith, Bay Area Regional Health Inequities Initiative
SDOH INDICATOR PROJECT LEADS
Rochelle Ereman, Marin County Health and Human Services
Sandra Witt, formerly of Alameda County Public Health Department
Njoke Thomas, formerly of Bay Area Regional Health Inequities Initiative
Saleena Gupte, formerly of Bay Area Regional Health Inequities Initiative
PRODUCED IN COLLABORATION WITH THE CALIFORNIA DEPARTMENT OF PUBLIC HEALTH, OFFICE OF HEALTH EQUITY, HEALTHY COMMUNITY DATA AND INDICATORS (HCI) PROJECT STAFF
Dulce Bustamante-Zamora, California Department of Public Health, Office of Health Equity
Neil Maizlish, California Department of Public Health, Office of Health Equity
Diem Tran, Peter Armstrong, and HCI project staff at the Institute for Health & Aging, University of California San Francisco
WE WOULD LIKE TO THANK PAST MEMBERS OF THE BARHII DATA COMMITTEE WHO DEVELOPED THE BARHII FRAMEWORK AND THE SOCIAL DETERMINANTS OF HEALTH (SDOH) INDICATOR LISTS
Crispin Delgado, formerly of San Mateo County Public Health, Policy and Planning
Helena Hawks, formerly of Solano County Public Health Department
Letitia Henderson-Souza, formerly of Bay Area Regional Health Inequities Initiative
Tony Iton, formerly of Alameda County Public Health Department
ST Mayer, San Mateo County Public Health, Policy and Planning
Chuck McKetney, formerly of Contra Costa County Health Services
Bob Prentice, formerly of Bay Area Regional Health Inequities Initiative
Ginger Smyly, formerly of San Francisco Department of Public Health
Irene Yen, former consultant of Bay Area Regional Health Inequities Initiative
DESIGN, LAYOUT, AND FORMATTING
Maria Grace Abuzman, Bay Area Regional Health Inequities Initiative
Kristen Light, Alameda County Public Health Department
PROGRAM EXAMPLES
Adriana Mercedes Alvarado, Alameda County Public Health Department
Elaine Bautista, Alameda County Public Health Department
Janet Berryman, City of Berkeley Public Health Department
Navin Bhandari, former intern at Marin County Health and Human Services
Edith Cabuslay, San Mateo County Family Health Services
Jose Ducos, City of Berkeley Public Health Department
Rochelle Ereman, Marin County Health and Human Services
Sandi Galvez, Bay Area Regional Health Inequities Initiative
Megan Gaydos, formerly of San Francisco Department of Public Health
Michael Gibson, Alameda County Public Health Department
Logan Harris, intern at Contra Costa County Health Services
Jennifer Henn, Napa County Public Health Department
Tamiko Johnson, Alameda County Public Health Department
Maeve Johnston, San Mateo County Public Health, Policy and Planning
Michael Kent, Contra Costa County Health Services
Michelle Kirian, San Francisco Department of Public Health
Abigail Kroch, Contra Costa County Health Services
Zoe Levitt, Alameda County Public Health Department
Mia Luluquisen, Alameda County Public Health Department
Liz Maker, Alameda County Public Health Department
Sarah Mollenkopf, former intern at Marin County Health and Human Services
Tram Nguyen, Alameda County Public Health Department
David Rebanal, Bay Area Regional Health Inequities Initiative
Randy Reiter, San Francisco Department of Public Health
Katherine Schaff, Alameda County Public Health Department
Pamela Stoddard, Santa Clara County Public Health Department
Brianna Van Erp, Santa Clara County Public Health Department
Meg Wall Shui, San Francisco Department of Public Health
Pam Willow, Alameda County Public Health Department
Diane Woloshin, Alameda County Public Health Department
Brenda Yamashita, Alameda County Public Health Department
Karen Yu, San Francisco Department of Public Health
This guide was made possible by funding from The California Endowment, the San Francisco Foundation, and Kaiser Permanente. BARHII receives fiscal sponsorship from the Public Health Institute.
Bay Area Regional Health Inequities Initiative. 2015. Applying Social Determinants of Health Indicators to Advance Health Equity: A Guide for Local Health Department Epidemiologists and Public Health Professionals. Oakland, CA.
Copyright © 2015, Bay Area Regional Health Inequities Initiative
I. Purpose of the Guide 2
II. About the Bay Area Regional Health Inequities Initiative (BARHII) 3
III. The Social Determinants of Health and the BARHII Framework 3
IV. BARHII Recommendations for use of Social Determinant of Health Living Condition Indicators in Local Public Health Practice 4
V. Frequently Asked Questions Regarding SDOH-LC Data and Limitations 6
VI. SDOH-LC Indicators Included in the guide 21
Income Distribution 27
Unemployment 33 Housing Cost Burden 45 Living Wage 53 Food Insecurity 65 Foregoing Health Care 75
SERVICE DOMAIN
Violent Crime 81
SOCIAL DOMAIN
Educational Attainment 93 Voter Participation 101 Social Capital/Social Support 107 English Language Learners 117
Air Contamination 123
Access to Public Transportation 131 Alcohol Access 137 Food Access 145
Appendix A: Notes about the Social Gradient and Mortality Analysis 157
Appendix B: Download and Analysis Steps for the American Community Survey 163
Appendix C: Download and Analysis Steps for the California Health Interview Survey 177
Appendix D: Download and Analysis Steps for the Healthy Community Data and Indicators Project 187
Appendix E: Technical Notes and Limitations for the American Community Survey and Other Data Sources 195
Appendix F: Social Determinants of Health (SDOH) Indicators List 205
The public health community has reached a consensus that where you live determines how long and how well you will live, with neighborhood wealth as one of the most important influences. In societies where everyone is supported to flourish socially and financially, people are healthier and so is the economy.
According to the World Health Organization, “(p)olicies that recognize that what makes societies prosper and flourish can also make people healthy have more impact. Fair access to education, good work, decent housing and income all support health. Health contributes to increased pro ductivity, a more efficient workforce, healthier ageing and less expenditure on sickness and social benefits. The health and well-being of the population are best achieved if the whole of government works together to address the social and individual determinants of health.” As part of traditional public health practice, health departments collect data and implement programs based on indi vidual health behaviors and outcomes—including indicators related to health and risk behaviors, infection, disease, injury, birth, and death. With most of these data, there are differences in out comes and disparities in health between population groups classically defined by race, ethnicity, gender, disability status, and age. Public health interventions typically have been designed to reach and meet the needs of specified groups with higher rates of particular conditions—such as diabetes among Hispanic/Latinos or hypertension among African Americans/Blacks. Although there is an important role for culturally appropriate programs that build awareness and self-efficacy to make healthier individual choices (for example, in nutrition and exercise), this traditional, downstream view often also propagates a misunderstanding that individual behavior (i.e., “personal responsibility”) is the principle or only cause of preventable disease.
While this perspective has some merit, it ignores the influence of historically discriminatory public and economic polices that determine poverty, educational attainment, and neighborhood living conditions. These upstream social determinants promote, enable, and reinforce the unhealthy behaviors leading to preventable disease, disability, and death. Thus the use of the term ‘health inequities, defined by the World Health Organization as “the differences in health status and mortal ity rates across population groups that are systemic, avoidable, unfair, and unjust.”
The purpose of this guide is to show local health department (LHD) epidemiologists, data ana lysts, and other professionals how to collect, analyze, and display a prioritized list of social deter minant of health living condition (SDOH-LC) indicators and frame these data in the context of neighborhood mortality, morbidity, and social conditions.
The recommendations in this guide are designed to help local health departments (LHDs) use SDOH-LC indicators to make measurable improvements in health and quality of life—particu larly for neighborhoods and populations that emerge from the data as having the greatest SDOH needs.
By following the recommendations outlined in this guide, we expect the reader will be able to:
• Understand the importance of SDOH-LC indicators and their role in local public health equity work.
• Conduct a health equity analysis of death certificate files available to all LHDs.
• Collect and analyze key SDOH-LC indicators for use in local public health activities and to monitor changes over time.
• Respond to common questions and known limitations to SDOH indicators.
• Connect SDOH-LC indicators to the ten essential public health services.
• Show examples of successful partnerships from San Francisco Bay Area health departments with institutions traditionally outside of health and human services to address the SDOH.
The Bay Area Regional Health Inequities Initiative (BARHII) is a collaboration of public health staff and leadership from 11 of the San Francisco Bay Area LHDs whose mission is to “transform public health practice for the purpose of eliminating health inequities using a broad spectrum of approaches that create healthy communities.” This charge is carried out by an in-kind LHD staff committee structure, which includes a Data Committee (DC) composed of LHD epidemiologists and analysts. The DC addresses factors identified by research as underlying the health inequities seen between population groups, especially socioeconomic inequalities in living conditions, and helps build local capacity in epidemiology and evaluation to monitor these conditions and the strategies and actions to improve them.
This BARHII indicator project began in February 2009 to develop a set of indicators that best illustrate the effects of the SDOH on inequitable health outcomes for the purposes of: showing the connections between inequities and health; developing more effective public health interventions; creating data support for public health interventions that might fall outside of the traditional public health models for interventions; and to support and develop more effective approaches in health departments which address living conditions and other social determinants. This information can also be used for policy makers, program evaluation, data monitoring—including countylevel tracking over time, input on statewide indicator projects, future grant funding, and as a source of potential ‘gaps’ in currently tracked indicators.
The BARHII Data Committee started out by compiling a comprehensive set of over 300 indica tors from the literature, including several well-documented pioneering SDOH indicator lists such as the Centers for Disease Control and Prevention (http://www.cdc.gov/dhdsp/docs/data_set_directory.pdf), the San Francisco Healthy Development Measurement Tool, and the World Health Organization—The Solid Facts. Additional sources included newly published reports such as Galea’s Estimated Deaths Attributable to Social Factors in the US, Healthy People 2020 SDOH
SOCIAL DETERMINANTS OF HEALTH INDICATORS TO ADVANCE
indicators, and an extensive literature review showing the effects of living conditions on health outcomes. Then, utilizing local knowledge and expertise, the DC followed a process of narrow ing the list to a core set of 72 health equity measures (Appendix F). Criteria for inclusion in the list included the strength of each indicator in the literature reviewed and the degree to which each measure would impact health inequities. Data availability was not included in the selection criteria at this stage because the DC wanted to identify a ‘wish list’ of priority indicators to advocate for future tracking by the State of California. The 72 indicators were categorized along the same orga nization as the living conditions associated with health inequities from the BARHII Framework: economic environment, social environment, physical environment, and service environment.
In 2012, the data committee took the list of 72 core, prioritized indicators and, now also considering data availability, voted on which 15 SDOH indicators to use as examples in this ‘how to’ guide.
In the 2008 BARHII report, Health Inequities in the Bay Area, an analysis of mortality, neighbor hood poverty, race, and ethnicity among BARHII member counties from 1999 to 2001 showed a strong, inverse relationship between Census tract poverty and life expectancy. Figure 1 is the updated version based on deaths in the Bay Area from 2009 to 2011 and the 2010 Census. While improvements in life expectancy have occurred since 2000, differences in life expectancy by race, ethnicity, and neighborhood poverty continue to exist.
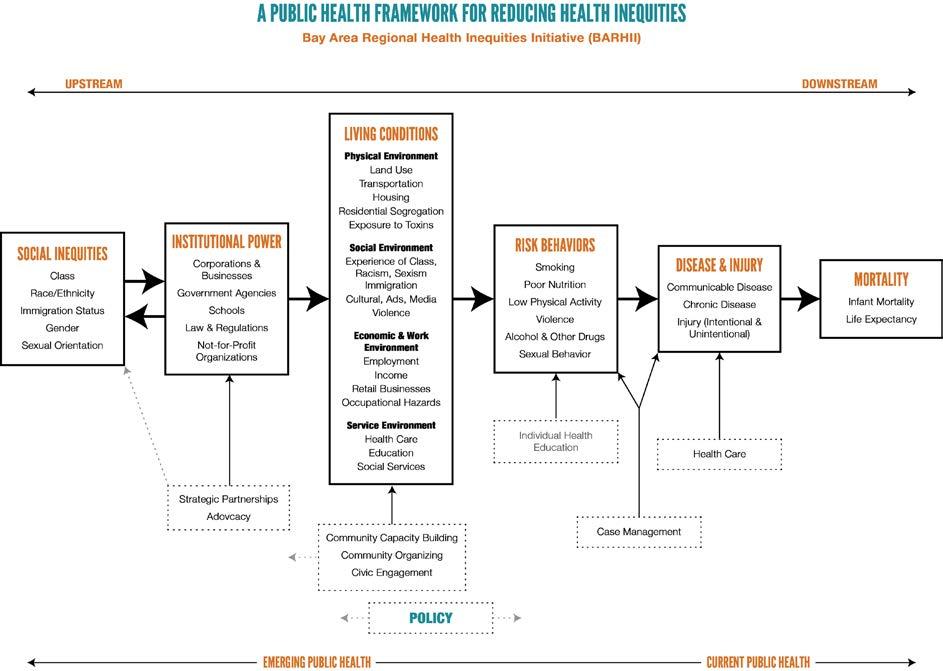
In an attempt to explain and ultimately eliminate these differences, BARHII developed a theoreti cal framework (Figure 2) showing how upstream factors produce and reproduce health inequities across populations.
The BARHII framework argues that living conditions, institutional power, and social inequalities are factors “upstream” to the individual and mostly out of his or her control, but they directly determine his or her health behavior, morbidity, and mortality. The collection of these upstream factors (the social inequality, institutional power, and living conditions boxes in the framework), are defined as the social determinants of health (SDOH). Many of the inequities in the SDOH are associated with each other, and many groups suffering from the worst health profiles also struggle in many of these social and economic indicators.
This guide focuses on SDOH indicators in the living conditions column where concrete measure ments of built environment and social factors can be examined. As explained in Health Inequities in the Bay Area, “Neighborhoods with high rates of poverty, often disproportionately communities of color, are more likely to have high concentrations of retail outlets that specialize in alcohol, to bacco, and fast foods, a relative absence of stores that sell fresh produce at reasonable prices, a lack of open space, limited public transportation, housing adjacent to ports, rail yards, freeways and/ or other sources of toxic exposures and socially segregated housing that contributes to high rates
FIGURE 1: NEIGHBORHOOD POVERTY VERSUS LIFE EXPECTANCY AT BIRTH, BARHII REGION, 2009-2011
Life Expectancy at Birth (Years)
90
85
80
75
70
65
<5.0%5.0-9.9%10.0-19.9%20.0-29.9%30.0%+
Neighborhood Poverty Group
FIGURE 2: THE BARHII FRAMEWORK
Asian Hisp/Lat All Races White AfAm/Black

SOCIAL DETERMINANTS OF HEALTH INDICATORS TO ADVANCE HEALTH EQUITY
of community violence. These conditions constitute risk factors for heart disease, cancer, stroke, diabetes, asthma, alcohol and drug abuse, and homicide, among others.”
While the broad relationship between wealth, place, and health is known, LHDs are confronted with three questions: (1) What is different about the social, environmental, and living conditions of wealthier places versus poorer places that could explain this life expectancy gap?; (2) Once these differences are identified, how can communities best invest resources to improve disparate neighborhood conditions, considering the multitude of factors and the large economic and politi cal capital required to change them?; and (3) What is a local public health department’s role in facilitating this change? Beginning with an equity analysis of birth and death certificates, a welldesigned, locally focused SDOH indicator project can begin to answer these questions.
This guide will focus on 15 SDOH living condition (SDOH-LC) indicators that BARHII has identified as significant influences on health, which can be collected, analyzed, and monitored by LHDs. Taken together with health data (e.g., morbidity, mortality, and risk behaviors), data from SDOH-LC indicators can help show (a) the complex and multifaceted nature of social inequities leading to health inequities; (b) outcomes of the discriminatory, inequitable, and unethical exer cise of institutional power; (c) the cross-domain and cumulative burdens of those suffering from the worst inequities; (d) the many pathways to policies, programs and practices that can reduce these inequities; and (e) the need for those concerned with local health inequities to work with other partners beyond the healthcare and public sector to address SDOH inequities.
An important first step in transforming local public health practice to address the upstream health inequity factors is the collection and monitoring of SDOH-LC indicators. BARHII has drafted this guide to support health departments in doing so, especially those with limited resources. BARHII has developed eight general recommendations for LHD epidemiologists on how to col lect and analyze SDOH-LC indicators. In addition to basic technical steps, BARHII also urges health departments to apply these indicators to program work and advises on where to begin in accomplishing this with examples from LHDs. In addition, BARHII has a report, Healthy Plan ning Guide, available online at http://barhii.org/resources/healthy-planning-guide/, to assist health departments in defining local policy recommendations, action steps and community partners with whom to build partnerships for healthy planning.
Recommendation 1. Analyze mortality and morbidity data to show health disparities, identify causes of death attributable to social and economic factors, and prioritize places and populations for further public health surveillance, intervention, and evaluation.
BARHII recommends that health departments analyze death certificate data to produce the charts and tables in this section. This analysis will identify priority places and populations for health equity work and track progress in building health equity over time. Stratification of life expectancy
EQUITY
at birth and mortality by educational attainment and neighborhood poverty is essential because these two SDOH-LC indicators are: (1) among the strongest predictors of life expectancy and pre mature mortality; (2) factors on which public policy makers at all levels have significant influence; (3) factors recommended by the World Health Organization to be monitored as part of a health equity surveillance system; and (4) are readily available to most health departments. By identifying causes of death with a strong, statistical relationship with poverty or low educational attainment, LHDs can better tailor programs to improve the health of socially disadvantaged populations. While these are recommendations to analyze causes of death, they are based on the International Classification of Diseases version 10 (ICD-10) codes, the same codes that are found in electronic medical records (EMR); therefore, health departments can apply the methods here to monitor patient morbidity from EMRs as data become available. Further, this analysis can be considered a health equity analysis and can meet many of the data analysis and monitoring requirements for community health benefit reports or applications to the Public Health Accreditation Board.
Figure 3 shows neighborhood poverty versus life expectancy at birth (LEB) stratified by race and ethnicity in the Bay Area. LEB is a good overall measure of population health. Every LHD’s equity goal is to increase life expectancy in places and populations where it is lowest and reduce the disparities in this measure by race and ethnicity. Figure 3 shows that as poverty increases, LEB decreases for the total population and White and African American/Black races in the Bay Area. This gradient does not hold up as well for Asians and Hispanic/Latinos.
FIGURE 3: NEIGHBORHOOD POVERTY VERSUS LIFE EXPECTANCY AT BIRTH, BARHII REGION, 2009-2011
Life Expectancy at Birth (Years)
Neighborhood Poverty Group
Asian Hisp/Lat All Races White AfAm/Black
90
FIGURE 4: NEIGHBORHOOD HIGH SCHOOL GRADUATION RATE VERSUS LIFE EXPECTANCY AT BIRTH, BARHII REGION, 2009-2011
85
80
75
70
65
<70.0%70.0-79.9%80.0-89.9%90.0-100.0%

Asian Hisp/Lat All Races White AfAm/Black
Another strong predictor of health determined by upstream policy is educational attainment, which is typically measured as the prevalence of adults 25 years and older with a high school education or its equivalent. As Figure 4 shows, neighborhoods with the highest rate of high school graduation also have the highest LEB in the Bay Area. However, the data suggest that educational attainment is not as strong a predictor of life expectancy than neighborhood poverty especially when broken out by race/ethnicity. For example, there is little change in LEB in the tracts with a 70-79% and 80-89% high school graduation rate, except for African Americans/Blacks and Whites. Conversely, as Figure 3 shows, there is at least some incremental change in LEB across all races as neighborhood poverty increases.
Figure 5 shows that rates of mortality increase substantially with neighborhood poverty. Mortality rates among White and African American/Black populations living in poverty are most affected, while rates of mortality in Asian and Hispanic/Latino populations are less affected by neighbor hood poverty.
Overall, rates of mortality decrease in neighborhoods as the proportion of adults living in that neighborhood with a high school education increases (Figure 6). However, this relationship is not as strong as neighborhood poverty versus age-adjusted mortality when stratified by race and ethnicity. This suggests that other factors—such as neighborhood poverty—confound the relation ship between educational attainment and mortality rates and more robust epidemiologic analysis is needed to control for these other factors. The technical appendix discusses in greater detail the issues of colinearity and confounding.
Deaths per 100,000 Population
1,200
1,000
800
600
400
200
Deaths per 100,000 Population

0
<5.0%5.0-9.9%10.0-19.9%20.0-29.9%30.0%+
Neighborhood Poverty Group
AfAm/Black White All Races Hisp/Lat Asian
FIGURE 6: NEIGHBORHOOD HIGH SCHOOL GRADUATION RATE VERSUS ALL-CAUSE, AGE-ADJUSTED MORTALITY RATE, BARHII REGION, 2009-2011
1,400
1,200
1,000
800
600
400
200
<70.0%70.0-79.9%80.0-89.9%90.0-100.0%
Neighborhood HS Graduation Rate

AfAm/Black White All Races Hisp/Lat Asian
FIGURE 5: NEIGHBORHOOD POVERTY VERSUS ALL-CAUSE, AGE-ADJUSTED MORTALITY RATE, BARHII REGION, 2009-2011 0
APPLYING SOCIAL DETERMINANTS OF HEALTH INDICATORS TO ADVANCE HEALTH EQUITY
Table 1 shows how much having no high school diploma affects the population attributable risk for specific causes of death among adults (25 to 64 years). The population attributable risk column estimates—in order of highest risk—the excess burden of mortality among adults with low educational attainment. The analysis was limited to adults of working age because those deaths have the most significant economic and political impact on a community. For example, the rate of death by pedestrian collisions is 27.3% higher in adults 25 to 64 years with no high school diploma com pared to adults who graduated high school. This analysis suggests that in the Bay Area, adults with low educational attainment share a higher burden of external causes of death (accidents, violence, and substance abuse). For detailed notes on how to calculate the population attributable fraction, see Appendix A.
TABLE 1: TOP 15 CAUSES OF DEATHS OF ADULTS (25 TO 64 YEARS) WITHOUT A HIGH SCHOOL EDUCATION BY POPULATION ATTRIBUTABLE RISK, BARHII REGION, 2009-2011
GROUP CAUSE OF DEATH
GROUP CAUSE OF DEATH CODE
POPULATION ATTRIBUTABLE RISK NO HIGH SCHOOL DIPLOMA (%)
Accidental choking 318 28.2
Pedestrian collisions 296 27.3
Organic dementia 136 25.0
Pneumonitis due to food and vomit 209 24.8
Duodenal ulcer 218 24.3
Assault by sharp object 341 23.0
Mental and behavioral disorders due to substance abuse 139 19.6
Occupant of motor vehicle collision 301 19.3
Alzheimer’s disease 148 18.9
Rheumatic aortic valve disease 58 17.5
HIV resulting in other conditions 42 17.3
Assault by other types 346 17.3
Other transport accidents 311 17.2
Intestinal infections 7 17.0
Assault by firearm 340 17.0
An advanced method to measure the relationship between neighborhood poverty and mortality is the slope index of inequality (SII). This method calculates a log-linear regression coefficient of Census tract poverty versus cause-specific death rates in those Census tract poverty groups. Causes of death with a more negative slope index (e.g., assault by firearm) suggest a stronger association with neighborhood poverty (i.e., as neighborhood poverty decreases so do the death rates of that cause of death). Slopes indices closer to zero (e.g., trachea, bronchus, and lung cancer) indicate that the effect of neighborhood poverty on that cause of death is weaker compared to other causes. BARHII calculated the slope index of inequality for all group causes of death of adults 18 to 64 years living in BARHII counties, 2009-2011. Those shown in the table are statistically significant (p < .05) and had the steepest and most negative slope index score compared to other causes. For example, Figure 7 illustrates the slope index of inequality for “Other COPD” (ICD-10 group cause of death 205). The observed values fit the predicted model well.
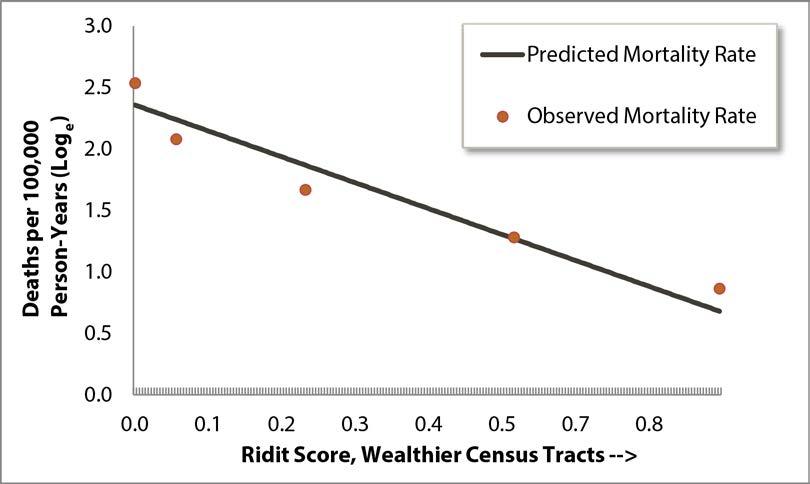
The charts of the SIIs for the other causes of death in Table 2 look very similar, which are avail able on request. While this method is complex and requires geocoded mortality data and statistical software (BARHII used SAS version 9.3), it is an additional, useful method to suggest relation ships with specific causes of death and neighborhood poverty.
TABLE 2: STATISTICALLY SIGNIFICANT SLOPE INDICES OF INEQUALITY (CENSUS TRACT POVERTY) OR CAUSE OF DEATH OF ADULTS (18 TO 64 YEARS), BARHII REGION, 2009-2011
GROUP CAUSE OF DEATH GROUP CAUSE OF DEATH CODE SLOPE INDEX (MORE NEGATIVE IS MORE UNEQUAL)
Assault by firearm 340 -4.09
Other ill-defined and unknown causes of mortality 293 -2.31
Mental and behavioral disorders due to use of alcohol 138 -2.30
Accidental poisoning by and exposure to drugs and other biological substances 327 -2.17
Hypertensive heart disease 162 -2.06
Other chronic obstructive pulmonary disease 205 -1.97
Intracerebral and other intracranial hemorrhage 183 -1.88
Viral hepatitis 38 -1.86
Cardiomyopathy 176 -1.78
Atherosclerotic cardiovascular disease, so described 167 -1.42
Diabetes mellitus 124 -1.39
Alcoholic liver disease 230 -1.15
All other forms of chronic ischemic heart disease 168 -1.03
Trachea, bronchus, and lung cancer 73 -0.79
Recommendation 2. Track morbidity and mortality data in priority places and populations over time to measure progress in affecting the SDOH indicators attributable to these health disparities.
BARHII recommends that health departments monitor changes in mortality over time and priori tize those places or populations with an increase in adverse mortality measures or little improve ment in mortality outcomes for further intervention and assessment. One important limitation to this analysis is that some communities may experience displacement where the age, gender, race, or ethnic composition of a community in 2000 may have changed significantly in 2010 because of changes in the local economy. In other words, decreases in neighborhood morbidity and mortality could be explained by one population displacing another due to gentrification. Gentrification oc
curs when rent and other costs of living became too high for the original population, forcing them to leave.
When reviewing trends in LEB, it is expected that they will improve naturally:
The trend in the life expectancy of humans during the past thousand years has been character ized by a slow, steady increase—a pattern frequently punctuated by a volatility in death rates caused by epidemics and pandemic infectious diseases, famines, and war.
Olshansky et al, 2005
However, Olshansky and colleagues (2012) argue that LEB for different populations based on race, ethnicity, education, or social status will change at different rates, leaving some population groups behind others in gains in LEB. Analysis of local data will help identify those populations specific to individual health departments.

Figure 8 illustrates that residents of all neighborhood poverty groups in the Bay Area experienced gains in life expectancy at birth from 2000 to 2010, with the sharpest increase in the highest poverty neighborhood (30% or more poverty). However, overall gaps in LEB between neighborhood poverty groups have not closed significantly except the gap between the 20.0-29.9% poverty groups and 30%+ poverty groups. While the population has migrated to and from and within all these areas—the poverty groups are not cohorts—there is significance in neighborhood poverty rate as a place-based unit, as concentrated poverty affects individuals as well as neighborhood conditions. Further assessment is needed to examine cohorts of population and to look at migration, especially in and out of high-poverty neighborhoods.
FIGURE 8: TRENDS IN LIFE EXPECTANCY AT BIRTH BY NEIGHBORHOOD POVERTY GROUP, BARHII REGION, 2000 TO 2010
<5.0% 5.0-9.9% 10.0-19.9% 20.0-29.9% 30.0%+
FIGURE 9: TRENDS IN LIFE EXPECTANCY AT BIRTH, 30%+ NEIGHBORHOOD POVERTY GROUP, BARHII REGION, 2000 TO 2010
85
80
75
70
65
Life Expectancy at Birth (Years) Asian Hisp/Lat All Races White AfAm/Black
60
90 2000 2010
FIGURE 10: TRENDS IN ALL-CAUSE, AGE-ADJUSTED MORTALITY RATES, 30%+ NEIGHBORHOOD POVERTY GROUP, BARHII REGION, 2000 TO 2010
1,400
1,200
1,000
800
600
400
Figure 9 illustrates trends in LEB in the highest poverty group in the Bay Area, stratified by race and ethnicity. From 2000 to 2010, LEB improved for each population group in high-poverty neighborhoods, but racial and ethnic inequities persist. Figure 10 has a pattern similar to Figure 9, except it is expressing mortality rates. Mortality declined from 2000 to 2010 for all racial and ethnic groups. However, differences by race and ethnicity continue to exist. 0
Deaths per 100,000 Population AfAm/Black White All Races Hisp/Lat Asian


200
1,600 2000 2010
Recommendation 3. Identify the Census tracts in your jurisdiction with a high prevalence of people living below 100% or 200% FPL.
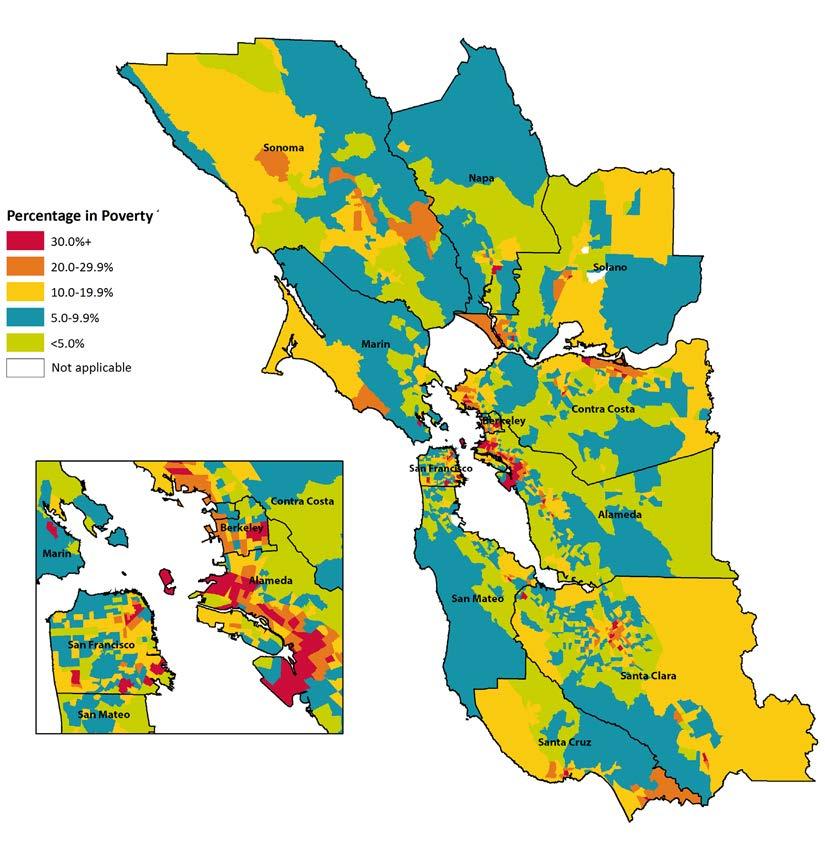
Poverty is an outcome of social, public, and economic policies, and poverty contributes to high morbidity, high mortality, and low quality of life. In the technical appendix, BARHII specifically recommends creating a geographic information systems (GIS) layer showing high poverty at the Census tract level and using this layer to identify Census tracts, their respective cities, and the populations living in them to build health equity. Areas identified with the highest proportion of people living in poverty should be designated as priority areas for equity work. Census tracts in red in Figure 11 meet these criteria. These data are freely available from the American Community Survey. See Appendix B for steps on how to download and display the data.
FIGURE 11: NEIGHBORHOOD POVERTY, BARHII REGION, 2008-2012
Recommendation 4. Collect, analyze, and interpret 15 SDOH-LC indicators recommended in this guide.
By collecting SDOH data in the neighborhoods and populations identified by mortality and morbidity analysis, comprehensive and need-based prioritization can occur. If certain neighborhoods and communities have high need in several SDOH indicators, then the data exist to justify and prioritize these neighborhoods for programming and policy change.
These 15 indicators were narrowed from an initial list of several hundred selected by members of the BARHII data committee. The criteria included relevance and availability. Members drew on a review of the literature and years of experience in LHD epidemiology. Each of the 15 indicators has its own chapter that outlines how to locate, analyze, and tailor indicators to local health equity work. Furthermore, examples of how BARHII-member health departments have used these indi cators (or related data) in public health practice are included at the end of each chapter.
Recommendation 5. Track SDOH-LC indicators over time to show improvement, de cline, or stagnation in the totality of policies, programs, and procedures related to that indicator for a geography and population over time.
To determine if public health activities and other equity work are improving the living conditions that influence life expectancy and mortality, SDOH-LC indicators are needed to identify what conditions are present before an intervention, or a baseline measure, and if any change in SDOHLC has occurred along with the health outcomes after the intervention’s implementation. From this, decision-makers can see whether programs or policies can continue as implemented or if they need modification. Typically, an indicator trend chart will look like Figure 12 showing trends in educational attainment in San Pablo versus the San Francisco Bay Area.
Following trends and changes in indicators over time are part of the health impact assessment (HIA) framework (Figure 13), which is frequently used to identify the effects of transportation and land use planning on health. For example, the rate of accidents and at a busy intersection could be used to evaluate the effectiveness of investment in traffic-calming devices.
Health Impact Assessment (HIA) is a means of assessing the health impacts of policies, plans and projects in diverse economic (and social) sectors using quantitative, qualitative and participa tory techniques. HIA is a practical approach used to judge the potential health effects of a policy, program or project on a population, particularly on vulnerable or disadvantaged groups. Rec ommendations are produced for decision-makers and stakeholders, with the aim of maximizing the proposal’s positive health effects and minimizing its negative health effects.
World Health Organization, 2008
Recommendation 6. Use SDOH-LC analysis to write competitive funding applications. Describing communities through SDOH-LC indicators can help local agencies and health depart ments craft funding proposals that are more likely to be successful for two reasons. First, initial analysis of SDOH-LC indicators can determine if the funding opportunity actually aligns with
FIGURE 12: EDUCATIONAL ATTAINMENT, BARHII REGION AND SAN PABLO, 2000 TO 2008–2010
80%
100% S Education 20%
P
60%
40% Percentage HS E d
BARHII Region San Pablo 0% 2000 2005-20072008-2010
FIGURE 13: THE HIA PROCEDURE
Quickly establishes ‘health relevance’ of the policy or project—is HIA required? SCREENING
Policy and program development phase for prospective assessments
Identifies key health issues and public concerns, establishes terms of reference, sets boundaries. SCOPING
Rapid or in-depth assessment of health impacts using available evidence—who will be affected, baseline, prediction, significance, and mitigation
Policy implementation phase

Conclusions and recommendations to remove/mitigate negative impacts on health or to enhance positive impacts
Where appropriate, to monitor actual impacts on health to enhance existing evidence base
SOCIAL DETERMINANTS OF HEALTH INDICATORS TO ADVANCE HEALTH EQUITY
the identified needs of a community. Second, philanthropic and government funders favor ap plications from data-literate agencies that can articulate needs through data, collaborate across sectors, and show measurable progress on program or funding objectives.
Recommendation 7. Use SDOH-LC indicators to mobilize community partnerships with organizations traditionally outside health and human services.
One of the ten essential public health services is to mobilize community partnerships. Because health departments are not experts in most of the SDOH-LC indicators discussed in this guide, progress in these domains will only come from constructive partnerships from the relevant institutions and organizations. Collectiing and analyzing SDOH-LC indicators is an important contri bution that health departments can make to help establish external partnerships where they do not already exist.
A health department’s work connecting SDOH-LC data to neighborhood health outcomes show where to allocate resources under its control and where to build cross-sector partnerships for increasing health equity. After LHDs have analyzed basic health and SDOH-LC data, partner ships with other institutions can be developed where more granular data can be shared. Collabora tive evaluation and analysis of granular data leads to progressive policies and programming across public and private sectors advancing health in all policies. Further, SDOH-LC indicators will help health departments and community agencies identify opportunities for effective collaborations and grass-roots organization for equitable, local policy change.
Once the priority places and populations are identified through analysis of mortality and SDOHLC data, public health can collaborate with other sectors to integrate strategies that affect social determinants. For example, a youth tobacco education program may work with schools on high school graduation goals in addition to health messages regarding smoking, as higher educational attainment is linked to lower rates of smoking. Public health departments may also find ways to leverage their current contracts and cross-sector agreements to influence progressive policies. For example, staff inspecting restaurants for health and safety code violations may also inquire about worker pay and labor law violations before granting licenses, with the understanding that a live able wage and humane working conditions are public health issues that affect health and wellbeing. For additional examples, see the indicator chapters.
One approach to working across sectors for improved health outcomes is modeled by the Cali fornia Department of Public Health (CDPH)’s Health in All Policies (HiAP) program within the Office of Health Equity. According to the CDPH definition, “Health in All Policies is a collabora tive approach to improving the health of all people by incorporating health considerations into decision-making across sectors and policy areas.” The HiAP program produced a guide for local and state governments on how to work collaboratively across disciplines to incorporate health into all policy sectors.
Another highly effective, cross-sectoral, collaborative approach in the research in recent years is the concept of collective impact. Initiatives that include the following five key conditions distinguish collective impact from other forms of collaborative efforts.
Common Agenda All participants have a shared vision for change including a common understanding of the problem and a joint approach to solving it through agreed upon actions
Shared Measurement
Collecting data and measuring results consistently across all participants ensures efforts remain aligned and participants hold each other accountable
Mutually Reinforcing Activities
Continuous Communication
Backbone Organization
Participant activities must be differentiated while still being coordinated through a mutually reinforcing plan of action
Consistent and open communication is needed across the many players to build trust, assure mutual objectives, and appreciate common motivation
Creating and managing collective impact requires a separate organization(s) with staff and a specific set of skills to serve as the backbone for the entire initiative and coordinate participating organizations and agencies
Due to the complex nature of most social programs, this collective impact approach of using shared data and collective action increases the breadth of impact and sustainability of efforts.
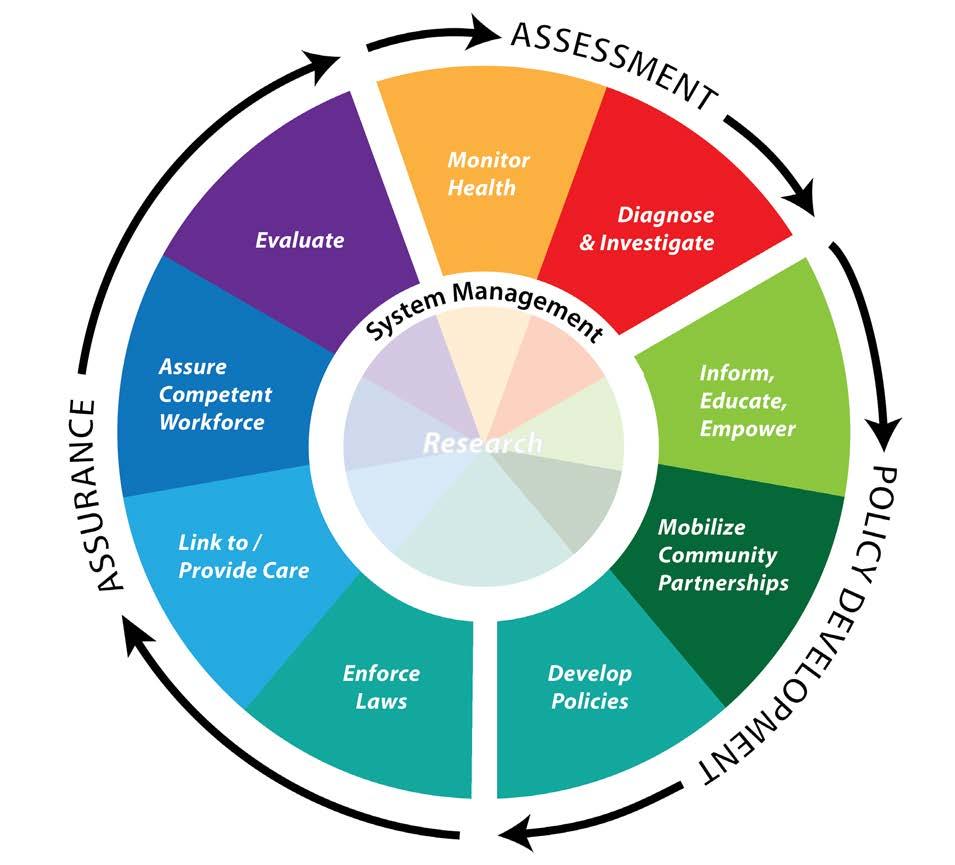
Recommendation 8. Use SDOH-LC and mortality indicators in the design, implemen tation, and evaluation of the other ten essential public health services to build health equity.
The ten essential services of public health (Figure 14) provide a guiding framework for the responsibilities of public health systems. The following describes how each essential service can more intentionally and explicitly address health inequities experienced by residents of your community.
Mobilize Community Partnerships: As discussed in recommendation 7, the formation of com munity partnerships outside of the public health system is essential to addressing the conditions that most influence health inequities. The selection of SDOH-LC indicators can help a health department prioritize with which community organizations and government agencies to form relationships. LHDs can help engage community members, bring together key players in local decision-making, and give these community partners the SDOH data to identify priority social determinants in their community in which to focus their advocacy that are beyond the capabilities of the health department.
Monitor Health: Through tracking SDOH-LC indicators in addition to vital records, public health departments can highlight the broader health issues and risk factors of its population. These data
and skills are unique to public health professionals and will become more valuable as medical records become digitized and their analysis becomes mandated.
Diagnose and Investigate: SDOH-LC indicators are diagnostic tools to identify possible disease risk behaviors, as well as social and environmental risk factors, in populations not captured by classic infectious disease diagnosis techniques. Because most of the leading causes of morbidity and mor tality today are not microorganisms, public health diagnosis and investigation must find causes other than bacteria and viruses. Unfavorable SDOH contribute substantially to disease outcomes.
Evaluate: Health departments have traditionally evaluated the effectiveness of health care and health promotion programs as part of quality improvement. Public health evaluation methods are backed by empirical research and have been shown to improve programs and ultimately health.
Many of the quantitative methods in public health evaluation can also be applied to evaluate the effectiveness of the social and economic policies that determine health. Assure Competent Workforce: The more LHD staff that receive training on SDOH and are aware of and can discuss SDOH issues, the more likely they are to find ways to address them in their work. Despite the limitations of categorical programs and services in public health, LHD staff have some discretion in how these services are provided. Information on SDOH-LC indicators can help staff identify and apply that discretion to deliver more effective services and create more effective part nerships to advance health equity.
Inform, Educate, Empower: In some areas, the health department may be the only organization that can credibly speak to the relationship of social determinants and health. LHDs are often expected to advise other institutions as well as the public on health and disease. Using SDOH-LC indicators will improve the LHD’s ability to fulfill this role of informing, educating, and empowering both other institutions and individuals by relating health to larger social and environmental fac tors and encouraging action to improve these living conditions for all communities.
Develop Policies: Through monitoring SDOH-LC indicators, LHDs are better equipped to iden tify how local policies affect health. If a LHD can ensure that SDOH-LC and health outcomes are considered in the creation of its own policies, it will gain the experience and credibility to guide HiAP work with other institutions. In addition, as LHDs are increasingly being invited to inform policy-making, by developing local policy review criteria that prioritizes health equity, LHDs can provide consistent, equitable, public health responses to local policy and planning issues that are related to SDOH-LC.
Enforce Laws: By monitoring SDOH indicators, a health department can ensure that the laws it is responsible to enforce (e.g., food safety, sanitation, occupational health, and hygiene) are promot ing better health outcomes for all populations and can also help identify unintended consequences leading to inequitable outcomes. In addition, LHDs can leverage their public health mandates (e.g., restaurant health and safety inspection certificates) to ensure other SDOH issues are also being addressed (e.g., fair labor practices for employees of inspected restaurants). Tracking SDOH indicators can also help monitor the enforcement of laws of other institutions that lead to dispro portionately negative health impacts.
Research: SDOH-LC indicators provide a common framework for health departments to share their program and policy experiences addressing the social determinants, and to facilitate and expand the research process to address the underlying conditions that influence health outcomes.
What is a social determinant of health (SDOH-LC) indicator? Administrative data from agencies, governments, institutions, and programs about a SDOH summarized to a geographic level, which may not include data about specific individuals.
Who are the audiences for SDOH-LC indicators? SDOH-LC indicators are intended for LHDs and the citizens, community groups, and institutions they wish to partner with or influence. For ex ample, in working with land use planning policy-makers, demonstrating the overall cost benefit of affordable housing to the health and well-being of the community at large would be helpful data to support progressive housing policies in high need areas. Whereas, in working with community members, SDOH-LC indicators will help these audiences identify the underlying causes of disease and community assets needed to address them. From these data, more encouraging, structural strategies to positively affect the highlighted needs can be designed.
Why not just use poverty as a proxy for all SDOH-LC indicators? BARHII considers neighborhood poverty (proportion of individuals living below the federal poverty level) the fundamental SDOHLC indicator and recommends that every health department identify the Census tracts with the highest concentration of people living below the federal poverty level. (See recommendation 3 in this guide.) This recommendation is supported by the conclusions of the Harvard Health Dis parities Geocoding project, which shows that poverty alone can serve as a proxy for many of the individual SDOHs.
While poverty is the fundamental SDOH-LC indicator, analysis of it alone is not sufficient for a health department to develop robust interventions tailored to the specifics of a place and its in habitants. For example, if a local data analysis reveals that high and disproportionate incarceration rates are one of its main concerns in one high-poverty neighborhood, the health department may choose to focus strategies on crime, violence prevention, or police profiling policies. It is possible that analysis of the same indicator in another high-poverty neighborhood may not identify incarceration rates as a priority.
Won’t SDOH-LC Indicators single out, blame, or disfavor communities and populations? There is a risk that some communities may take offense when they are shown SDOH-LC data, although a health department may have the best of intentions. The risk of offending communities can be avoided through carefully framing messages and building trust with communities so that open and honest dialogue about improving health and living conditions can take place. At a minimum, any messages or conclusions that are adverse must be delivered using language that is respectful, honest, understandable to the audience, and not inflammatory. There is a body of literature on how to do this. Other suggestions when discussing these issues include: 1) describing the positive attributes of a community (i.e., resilience factors and assets); 2) displaying data that compare communities with themselves over time; and 3) comparing SDOH-LC data with communities similar in demographic and economic composition. BARHII also recommends seeking the advice of a health educator on how to best frame messages about the SDOHs.
Haven’t communities already seen enough charts, maps, and graphs of problems they are already aware of? If the indicators continue to say the same thing with little change over time, something needs to change. To understand this, health departments must build relationships with community members and leaders to obtain data with a purpose of identifying and evaluating the specific poli cies, programs, and procedures within a priority area that drive improvement in living conditions.
How can a health department identify or track the specific policies, programs and procedures from these broad indicators? The SDOH-LC indicators in this guide are a starting point for the health depart ment to address the SDOH in its own work. Because of the inherent limitations of the data, it is true that specific solutions to unfavorable SDOHs will not reveal themselves from these broad indicators, but they will show a LHD where to begin to look. Once the places and populations most affected by the SDOH are known and revealed by these indicators, the LHD can evaluate its own programs and build partnerships to identify and address causes.
Public health professionals are not experts in economic development, transportation, law enforcement, urban planning, or education. What gives public health the credibility to advise or influence these institutions? Why should local health departments spend its limited resources in areas where they have little expertise or control? Public health’s purpose is to promote health and prevent disease. Many of public health’s successful services used in the 20th century to prevent infectious disease are applicable to preventing chronic disease in the 21st. Because these services are numerous and complex, this guide recommends identifying which of the ten essential services health departments can offer to other institutions to advance health. It is through the improved delivery of the essential services, that the LHD will gain the trust and credibility it needs to advise and influence other institutions. The real-world program and policy examples in this guide show how LHDs in the Bay Area have integrated health into social and economic policies and applied SDOH data analy ses and the ten essential public health services to local health equity work.
How does stress link to SDOH-LC indicators and health outcomes and how can it be measured? The indicators of both acute and chronic stress are not often captured directly in public health data collection and analysis. However, there are clear pathways that link the mental and physical effects of stress to poorer health outcomes as well as unhealthy behavioral decision-making, including alcohol and drug use as self-medication or a coping mechanism.
In addition, disadvantaged populations are often poorly affected by stressful living and working conditions (e.g., crowded housing, violence, toxic environments, unemployment and financial stress, occupational hazards, trauma leading to the inability to work or stay in school, lack of supportive personal relationships). Many of these risk factors that cause stress are not under the control of the individual to change, rather are affected by unhealthy social and political systems of inequality.
There are then physiological effects of stress on the body, such as raised blood pressure and cortisol levels, that increase the risks for harmful effects of pre-term labor and chronic disease (e.g., cancer, cardiovascular disease). Community empowerment and a sense of control over ones’ circumstances have been shown to be positively associated with decreased stress.
Due to these links between stress and health outcomes, BARHII recommends that public health departments include research-validated questions about perceived individual stress as well as questions that assess a wider sense of control and community empowerment in their community health assessments, and other data collection and analyses.
TABLE 3: SDOH-LC INDICATORS PRESENTED IN THIS GUIDE
Economic Income distribution
American Community Survey (ACS); Healthy Community Data and Indicators Project (HCI)
Economic Unemployment California Employment Development Department (EDD)
Economic Housing cost burden ACS, HCI, U.S. Department of Housing and Urban Development
Economic Living wage
MIT Poverty in America Living Wage Calculator, ACS, EDD; HCI
Economic Food insecurity California Health Interview Survey (CHIS); HCI
Economic Foregoing health care CHIS
Service Violent crime Uniform Crime Reports; HCI
Social Educational attainment ACS; HCI
Social Voter participation HCI
Social Social capital/social support CHIS 2003
Social English language learners ACS
Physical Air contamination HCI
Physical Access to public transportation HCI
Physical Alcohol access California Alcohol and Beverage Commission (ABC)
Physical Food access California Nutrition Network; Dun and Bradstreet
Bay Area Regional Health Inequities Initiative (BARHII). 2008. Health Inequities in the Bay Area. http:// barhii.org/resources/health-inequities-in-the-bay-area/. Accessed October 2014.
California Department of Public Health. 2014. Health in All Policies http://www.cdph.ca.gov/programs/ Pages/HealthinAllPolicies.aspx. Accessed October 2014.
Hanleybrown F, Kania J, Kramer M. Channeling Change: Making Collective Impact Work. Stanford Social Innovation Review 2012(2). http://www.ssireview.org/blog/entry/channeling_change_making_collective_ impact_work. Accessed October 2014.
Isreal BA, Checkoway B, Schultz A, Zimmerman M. 1994. Health Education and Community Empowerment: Conceptualizing and Measuring Perceptions of Individuals, Organizational, and Community Control. Health Education Behavior 21(2):149-170.
Kania J, Kramer M. Collective Impact. Stanford Social Innovation Review 2011 http://www.ssireview.org/ articles/entry/collective_impact. Accessed October 2014.
Krieger N, Chen JT, Waterman PD, Soobader MJ, Subramanian SV, Carson R. 2002. Geocoding and Monitoring of US Socioeconomic Inequalities in Mortality and Cancer Incidence,: Does the Choice of Area-Based Measure and Geographic Level Matter? American Journal of Epidemiology 156(5):471-482.
Olshansky SJ, Antonucci T, Berkman L, Binstock RH, Boersch-Supan A, Cacioppo JT, et al. 2012. Differences in Life Expectancy Due to Race and Educational Differences Are Widening, and Many May Not Catch Up. Health Affairs 31(8):1803-1813.
Olshansky SJ, Passaro DJ, Hershow RC, Layden J, Carnes BA, Brody J, et al. 2005. A Potential Decline in Life Expectancy in the United States in the 21st Century. The New England Journal of Medicine 352(11):1138-1145.
Public Health Accreditation Board. 2013. Standards and Measures. http://www.phaboard.org/wp-content/ uploads/SM-Version-1.5-Board-adopted-FINAL-01-24-2014.docx.pdf. Accessed October 2014.
Schneier MC, Castillo-Salgado C, Bacallao J, Loyola E, Mujica OJ, Vidaurre M, Roca A. 2005. Methods for Measuring Health Inequalities (Part II). Pan American Health Organization Epidemiological Bulletin 26:1.
Whitehead, M. 1990. The Concepts and Principles of Equity and Health. World Health Organization, Regional Office for Europe. http://whqlibdoc.who.int/euro/-1993/EUR_ICP_RPD_414.pdf. Accessed October 2014.
World Health Organization, Commission on Social Determinants of Health. 2008. Closing the Gap in a Generation: Health Equity through Action on the Social Determinants of Health http://www.who.int/social_ determinants/thecommission/finalreport/en/. Accessed October 2014.
World Health Organization, Regional Committee for Europe. 2012. Health 2020. http://www.euro.who. int/en/health-topics/health-policy/health-2020-the-european-policy-for-health-and-well-being. Accessed October 2014.
SOCIAL DETERMINANTS OF HEALTH INDICATORS TO ADVANCE HEALTH EQUITY
Income is linked to one’s ability to acquire resources for healthy living. Both household income and the distribution of income across a society independently contribute to the overall health status of a community. Western industrialized nations with large disparities in income distribution tend to have poorer health status than similarly advanced nations with a more equitable distribution of income. It is estimated that approximately 119,200 (5%) of the 2.4 million United States deaths in 2000 were attributable to income inequality. The pathways by which income inequality act to increase adverse health outcomes are not known with certainty, but policies that provide for a strong safety net of health and social services have been identified as potential buffers. Many cross sectional, ecological studies have compared western industrialized countries, including the United States, along a gradient of a health outcome and the corresponding gradient of income inequality using the Gini coefficient, a measure of inequality of income and wealth. Studies using this index often show a linear relationship between increasing income inequality and poorer health outcomes such as life expectancy, infant mortality, obesity, mental illness, homicide, and other outcomes. Several, large longitudinal studies that followed healthy participants at baseline were combined to estimate the number of U.S. deaths in 2000 attributable to income inequality.
How to Analyze the Gini Coefficient (Gini)
Note to LHDs in California: The California Department of Public Health’s Health Communities Data and Indicators (HCI) project has collected, cleaned, and compiled the Gini coefficient for cities with greater than 20,000 residents, counties, and regional transportation planning districts in California, which can be found at http://www.cdph.ca.gov/programs/Pages/HealthyCommuni tyIndicators.aspx. Appendix D explains how to download and filter these data. The Gini is the easiest measure to indicate the distribution of income or wealth across a geograph ic area. The Gini is a score between zero and one. A geography with a Gini value of zero signifies that every household in that geography owns an equal share of income or perfect income equal ity. Conversely, a Gini value of one signifies that one household owns all of the income or perfect inequality. Thus, a higher Gini means more inequality. The main drawback to the Gini is that the magnitude of the wealth or poverty is not measured, just the spread. Thus, if you had a very seg regated high-income neighborhood, the Gini would be low. However, if you have a neighborhood that has mixed incomes, the Gini would be high. So it’s best to use the Gini at larger geographic regions, and best to compare across time rather than across geographies.
The normal geographic unit of analysis is the metropolitan area. These can be seen as commute sheds, where people may live in any part of the area and work in any part. For the Bay Area, the nine counties are considered the metro area. Another common geographic unit of analysis is the nation.
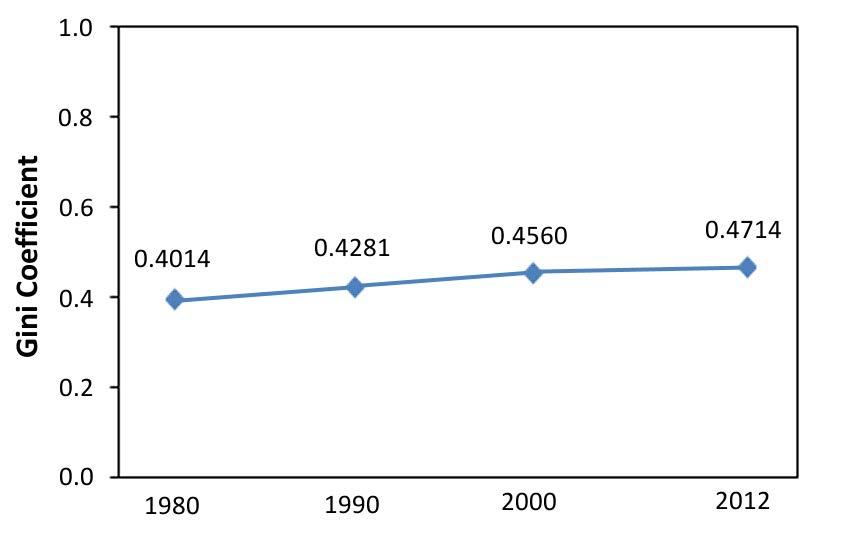
For a detailed explanation of how to access American Community Survey data, see Appendix B. The American Community Survey reports the Gini for every level of geography in indicator B19083. However, for the reasons explained above, BARHII does not recommend displaying maps of Census tracts with high Gini coefficients. Instead, BARHII recommends showing trends in the Gini coefficient at the county or regional level like the figure below. With caution, larger cities may also be used. The Bay Area nine-county region’s Gini increased steadily from 0.4014 in 1980 to 0.4714 in 2012.
FIGURE 15: GINI COEFFICIENT, SAN FRANCISCO BAY AREA, 1980–2012
SOURCE: 1980, 1990, AND 2000 CALCULATED BY BARHII; 2012 FROM 1-YEAR ACS ESTIMATES.
Alternatively and for older data, the Gini can be calculated manually. This is an elaborate process. The Gini is the ratio of two areas derived from the Lorenz curve. The cumulative share of popula tion is on the x-axis (p in Figure 16) and the cumulative share of income is on the y-axis (L). The line of parity is where each household has the same income (solid blue line). The Lorenz curve shows the actual distribution (dotted blue line). As the Lorenz curve bows away from the line of parity, income distribution is becoming more unequal. The ratio of the area of A to the area of A plus B is the Gini. If the income is evenly distributed, the ratio would be zero, while a ratio of one would mean that all the income belongs to one household.
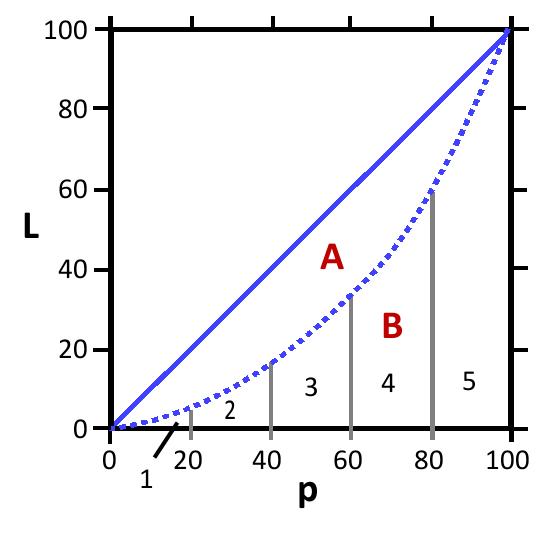
FIGURE 16: MAKING THE LORENZ CURVE AND CALCULATING THE GINI COEFFICIENT USING SAMPLE DATA
Top 20% 42.7 100 100
4th 20% 24.4 80 57.3 3rd 20% 17.1 60 32.9 2nd 20% 11.1 40 15.8 Lowest 20% 4.7 20 4.7
FIGURE 16 (CONTINUED)
Area A + Area B 100*100 / 2 = 5,000
Area 1 20*4.7/2 = 47
Area 2 20*(4.7+15.8)/2 = 205
Area 3 20*(15.8+32.9)/2 = 487
Area 4 20*(32.9+57.3)/2 = 902
Area 5 20*(57.3+100)/2 = 1573
Total Area B 3,214
Area A 5,000 – 3,214 = 1,786 Gini Coefficient 1,786/5,000 = 0.357
FIGURES ADAPTED FROM FRANÇOIS NIELSEN, http://www.unc.edu/~nielsen/special/s2/s2.htm
Alameda County Public Health Department
The Alameda County Public Health Department’s (ACPHD) Place Matters Economics Workgroup is leading a stakeholder process to explore ways that Alameda County can sup port low-income, underbanked residents to protect their income and assets and build longterm financial health. As envisioned by ACPHD Place Matters and its advisory partners, a healthy credit program would leverage existing county funds in order to expand credit and financial opportunities for low-income county residents, support small lenders in reach ing a wider pool of underserved people, and reduce predatory lending and the associated financial and health consequences for low-income communities.
Contra Costa County Public Health Department
Contra Costa inserted a program into their Women, Infants, & Children (WIC) services to help WIC recipients understand the income tax process and apply for the Earned Income Tax Credit. Agency leaders understood that poverty is a major determinant of poor health, and that by helping support asset development and economic sustainability, the health department can advance the health of women and children in their community. So far, over 6,000 women have participated, and participants report feeling more confident about handling money and have an improved understanding of the impact of money on health.
SOCIAL DETERMINANTS OF HEALTH INDICATORS TO ADVANCE HEALTH EQUITY
Commission on the Social Determinants of Health. 2008. Closing the Gap in a Generation: Health Equity through Action on the Social Determinants of Health: Final Report of the Commission on Social Determinants of Health. Geneva: World Health Organization. http://www.who.int/social_determinants/thecommission/ finalreport/en/index.html. Accessed February 2013.
Galea S, Tracy M, Hoggatt KJ, DiMaggio C, Karpati A. 2011. Estimated Deaths Attributable to Social Factors in the United States. American Journal of Public Health 101(8):1456-1465.
Parthasarathy P, Dailey DE, Young MED, Lam C, Pies C. 2014. Building Economic Security Today: Making the Health–Wealth Connection in Contra Costa County’s Maternal and Child Health Programs. Maternal and Child Health Journal 18(2):396-404
Wilkinson R, Pickett K. 2009. The Spirit Level: Why Equal Societies Almost Always Do Better. London, Pilgrim Press.
Unemployment is associated with higher rates of self-reported poor health, long-term illnesses, higher incidence of risky health behaviors (e.g., alcoholism, smoking), and increased mortality. These negative health outcomes affect not only the unemployed persons but can extend to their families. Longer unemployment can be associated with higher odds of negative health effects. Various explanations have been proposed for the link between poor health and unemployment; for example, economic deprivation that results in reduced access to essential goods and services. Another explanation is that unemployment causes the loss of latent functions (e.g., social contact, social status, time structure, and personal identity) that can result in stigma, isolation, and loss of self-worth. The safety net available to the unemployed is weaker than in the past due to the deterioration of employment rights and a decrease in social support and welfare systems. Studies at the county level found a positive association between higher unemployment and overall mortality and death due to cardiovascular disease and suicide; however, a negative relationship was detected with deaths due to motor-vehicle accidents. Individual level longitudinal studies showed that the unemployed had higher rates of poor physical health, suicides, mental health problems (e.g., depression, stress, anxiety), and greater use of healthcare services. Other studies found re duced access to healthcare services and higher likelihood to delay care among the unemployed. The population in the labor force is the civilian non-institutionalized population 16 years and older who have jobs or are actively looking for jobs. Persons in the labor force are classified as unemployed if they do not have a job, are currently available for work, and have actively looked for work in the previous month (for instance, attending interviews, sending out resumes, or filling out applications). People that do not have a job and are not looking for one are considered not to be in the labor force. Women, youth (16 to 24 years), the least educated, and ethnic minorities are more likely to be unemployed.
Note to LHDs in California: The Healthy Community Indicators project has already downloaded and compiled these data; see Appendix C. The screen shots are for regions outside of California. To track unemployment, two data sources are needed. One is table DP03 from the American Community Survey at the Census tract level and the other are Local Area Unemployment Sta tistics (LAUS) from the Bureau of Labor Statistics. For a detailed explanation of how to access American Community Survey data, see Appendix B. The ACS data can identify unemployment rates in Census tracts and provide race and ethnic stratification in those tracts. The LAUS can
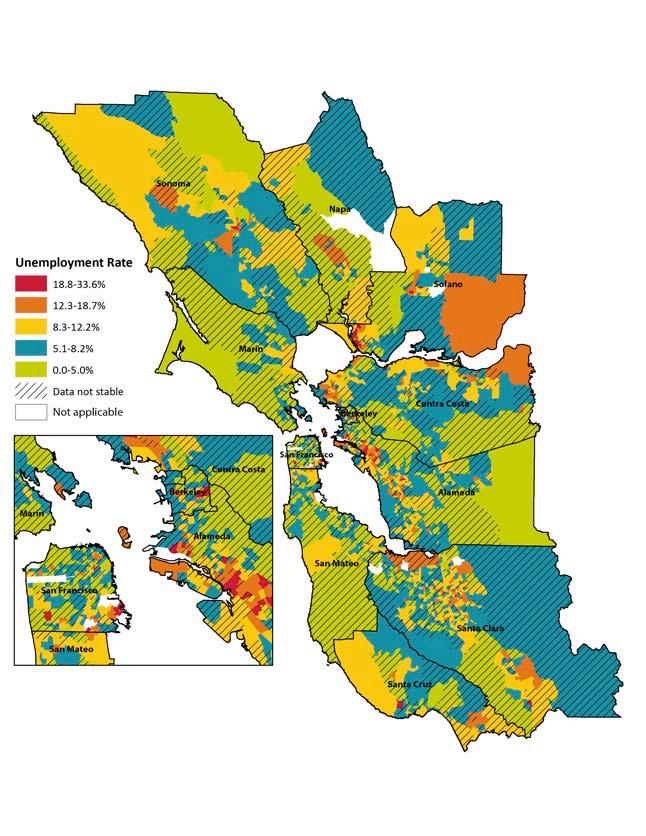
identify trends in counties and cities with 25,000 inhabitants and greater. For steps on how to download and map data from the American Community Survey, see Appendix B. Figure 17 shows the percent of resident actively seeking work who are unemployed at the Census tract level. Strati fication by race and ethnicity is also available from the five-year ACS files. Tracts in red should be considered for further health department assessment and intervention.
FIGURE 17: UNEMPLOYMENT RATE, BARHII REGION, 2006–2010
Trends are available for states, counties, and localities with 25,000 people or greater from the LAUS dataset. LAUS can monitor overall trends in unemployment in cities and towns of 25,000 people and above. Data for Oakland, California was obtained with these steps:
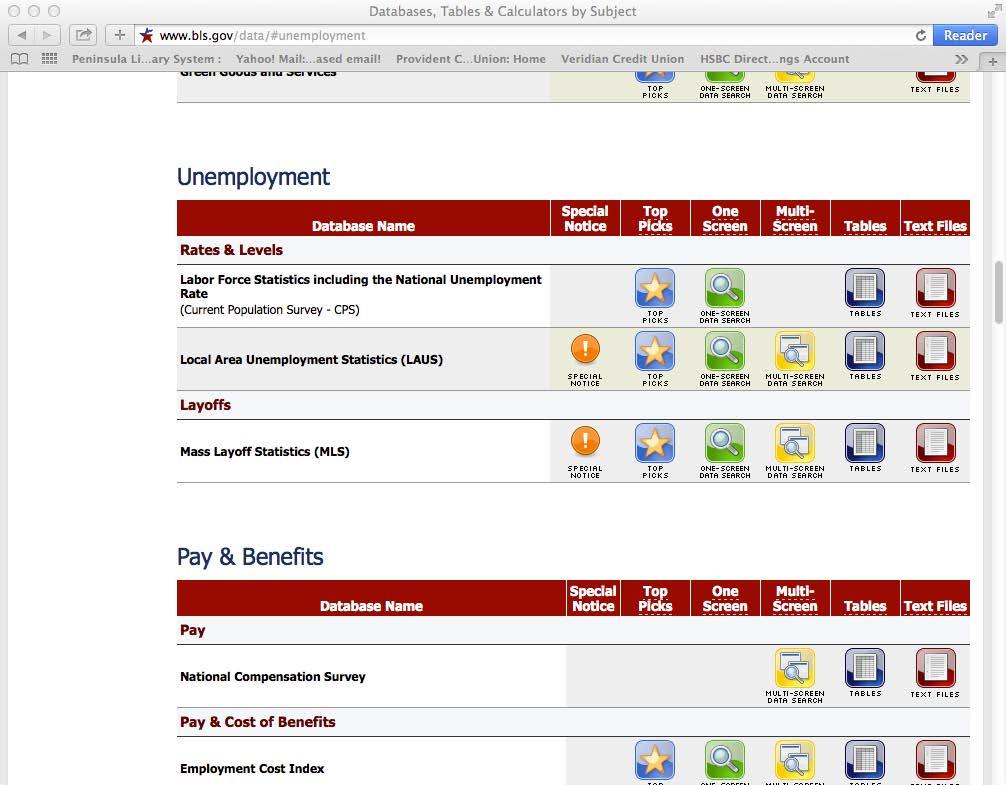
How To Analyze Rates of Unemployment STEP 01. Go to http://www.bls.gov/lau. On the home page menu, click on “Data Tools.”
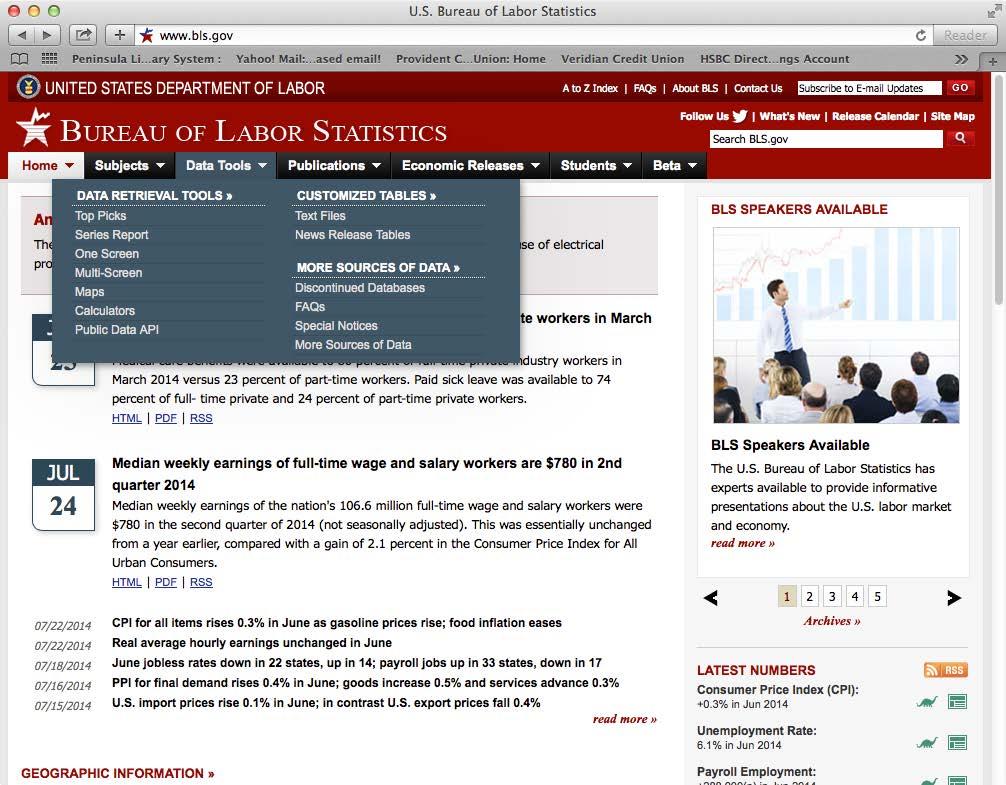
STEP 02. On the Data Tools page, click “Unemployment.”
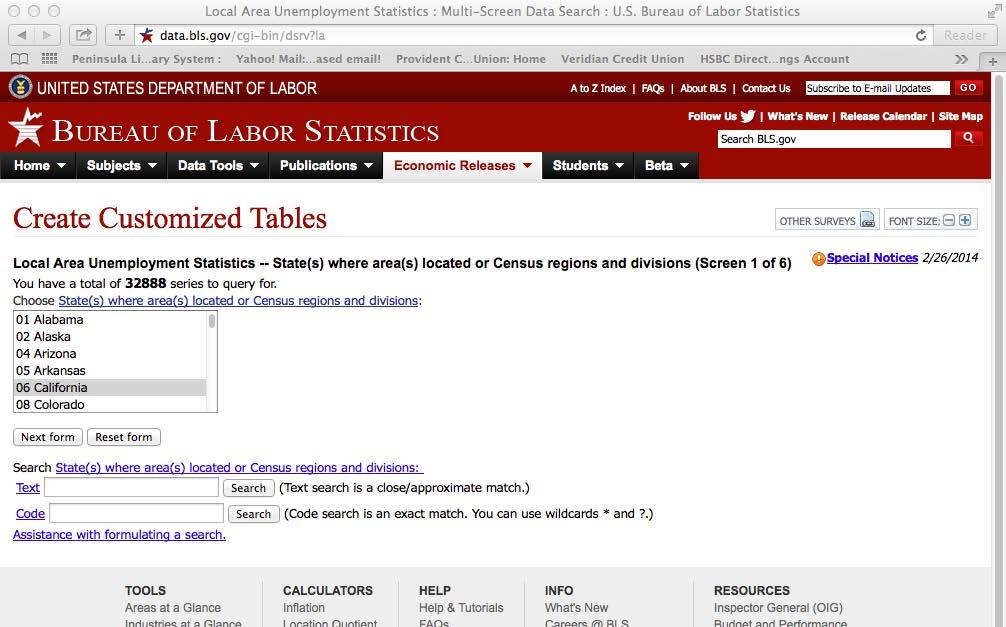
STEP 03. Click on Local Area Unemployment Statistics (LAUS), “Multi screen data search.”

STEP 04. Select “California”, click “Next form.”
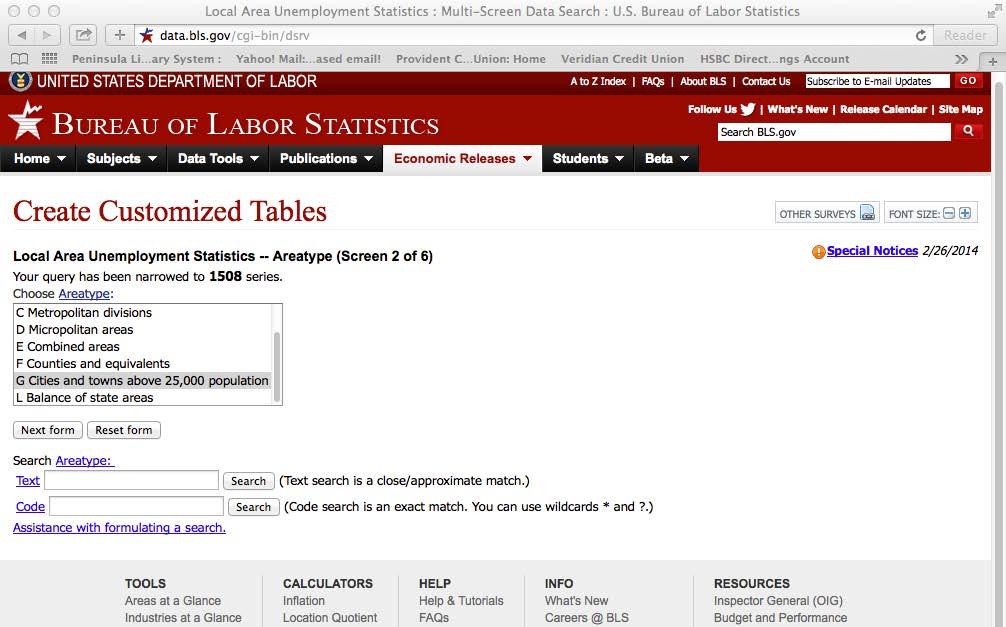
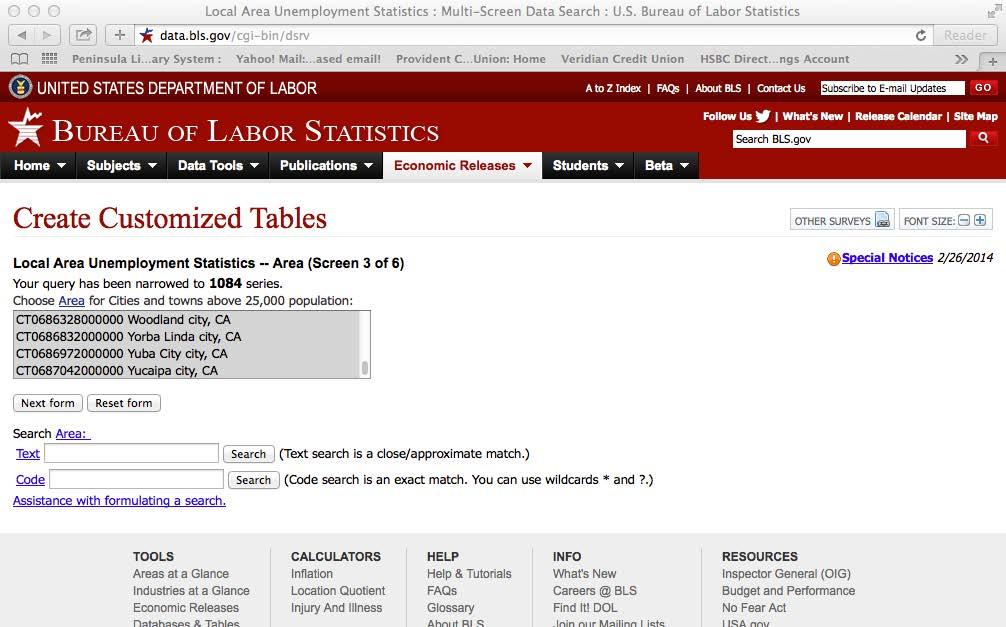
STEP 05. Select “Cities and Towns above 25,000 Population,” click “Next form.” County-level data can be acquired by selecting “Counties and Equivalents” and following the sub sequent steps.
STEP 06. Select all the cities in the list, click “Next form.”
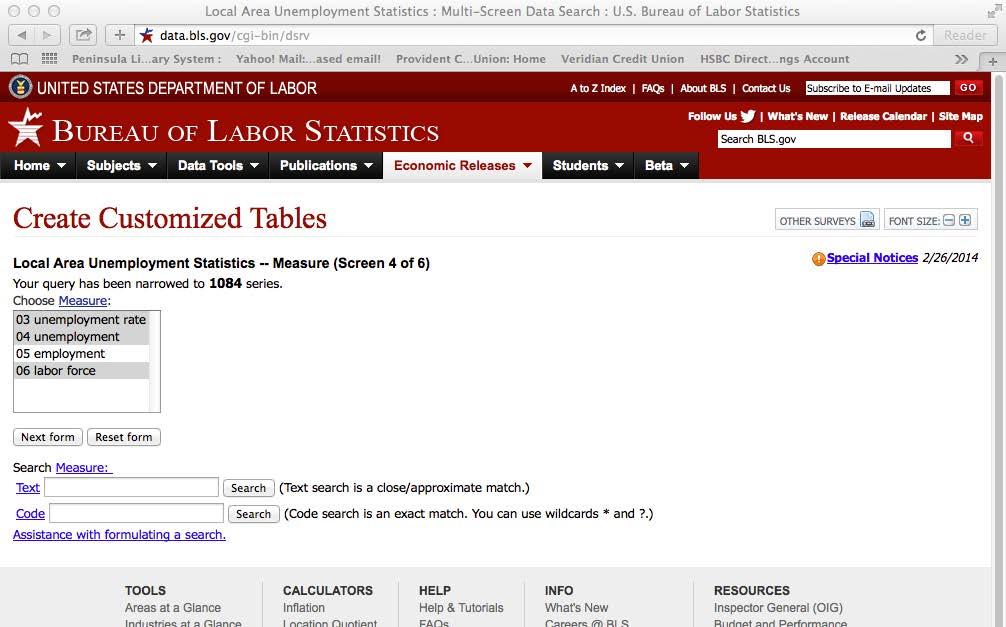
STEP 07. Select “unemployment rate,” “unemployment,” and “labor force,” click “Next form.”
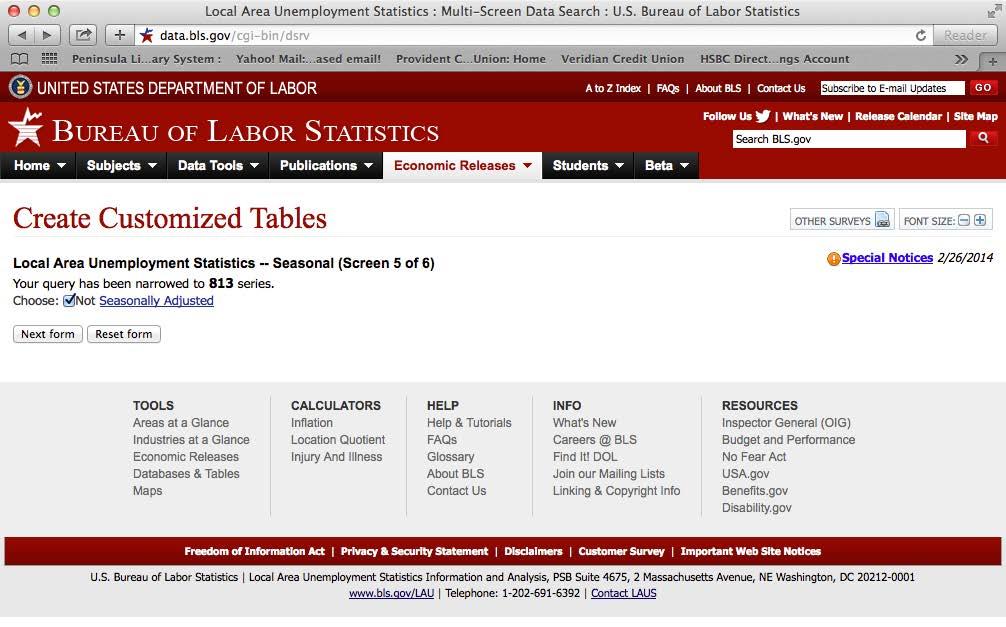
STEP 08. Check the box for “Not Seasonally Adjusted,” click “Next form.”
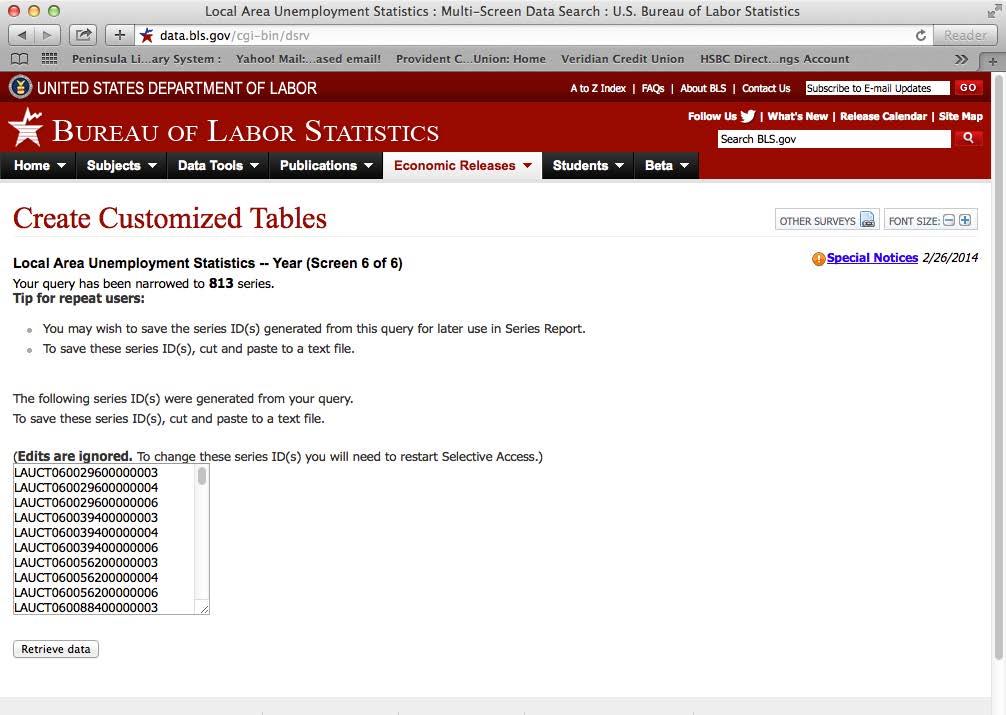
STEP 09. Click “Retrieve data.”
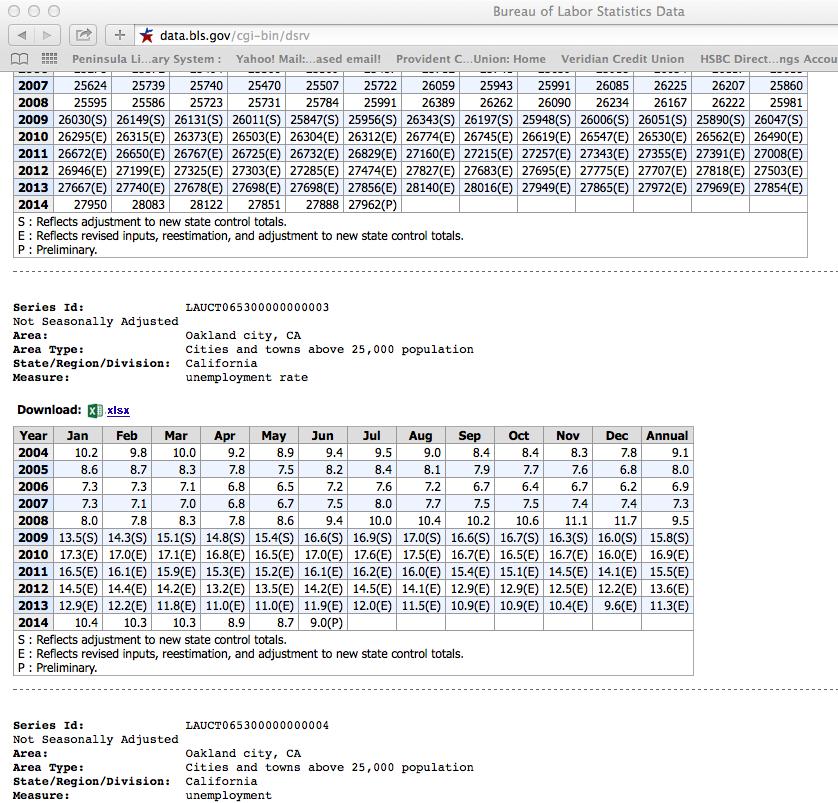
STEP 10. This step creates a printout of all localities in California with 25,000 people or great er. Scroll down to the city of your choice, Oakland in this example. These data can be pasted in a spreadsheet program. The screenshot below shows HTML, but a CSV file can be generated by clicking “More Formatting Options.”
STEP 10A (optional) These data are also available as a CSV file, which can be more easily imported into a new spreadsheet. If a CSV file of LAUS is downloaded, a crosswalk file is needed to match the record ID number in the LAUS file with a city name located in the crosswalk. Download the crosswalk and the code list files located at http://www.bls.gov/lau/crosswalk.xlsx. This file matches the ID number with a city name. Additional manipulation is needed to merge the two datasets.
STEP 11. Identify the cities in your county with the highest rate of unemployment and con struct a trend chart like the one below. Data for Alameda County, which contains Oakland, can be acquired in the same way as for Oakland. To do so, begin at step 5 and repeat steps 6 through 10.
Sample interpretation: From 2004–2013, trends in unemployment for the city of Oakland mirrored those of Alameda County. Both Oakland and Alameda County experienced significant increases in unemployment due to the financial crisis in 2008 and the subsequent recession, but Oakland’s unemployment rate was higher. In recent years, unemployment has been declining in both Alameda County and in the City of Oakland.
FIGURE 18: UNEMPLOYMENT RATE, ALAMEDA COUNTY AND OAKLAND, 2004–2013
18%
16%
14%
Percentage

12%
10%
8%
6%
4%
2%
0%
Oakland Alameda County
2004200520062007200820092010201120122013
Alameda County Public Health Department
The Emergency Medial Services (EMS) Corps is a highly selective, rigorous academy that trains aspiring emergency medical professionals who are from the community and ready to serve. It is a paid (stipend) program whose mission is to increase the number of underrep resented emergency medical technicians through youth development, mentorship, and job training. Program elements include EMT training, transformative mentoring/male devel opment, life coaching, case management, mentorship, mental health and self-care reform, and academic tutoring.
The primary purpose of Alameda County EMS, a division of Health Care Services Agen cy, is to provide oversight and administration of medical 911 responses throughout the county. Parts of their responsibilities are education and community programs. There was a growing concern with seeing a disproportional representation of minorities in the pool of EMTs and firefighters serving their communities. After uncovering approaches in finding pathways to emergency medical careers, there was a conscience effort to provide training for young minority adults, including offering trainings through a local juvenile hall facil ity. In addition, Alameda County EMS leveraged their contracts with local 911 responder companies to make the hiring of EMS Corps graduates a priority. This training and its job connections allows them to serve their communities and become competent contributors and members of the changing and growing pool of first responders.
Bambra C, Eikemo TA. 2009. Welfare State Regimes, Unemployment and Health: A Comparative Study of the Relationship between Unemployment and Self-Reported Health in 23 European Countries. Journal of Epidemiology and Community Health 63:92–98.
Janlert U, Hammarström A. 2009. Which Theory is Best? Explanatory Models of the Relationship between Unemployment and Health. BMC Public Health 9:235.
Bambra C. 2010. Yesterday Once More? Unemployment and Health in the 21st Century. Journal of Epidemiology and Community Health 64:213-215.
Bureau of Labor Statistics. 2014. Labor Force Statistics from the Current Population Survey. http://www.bls. gov/cps/cps_htgm.htm. Accessed June 2014.
Employment Conditions Knowledge Network (EMCONET). 2007. Employment Conditions and Health Inequalities. Accessed June 2014.
Jin R, Chandrakant PS, Tomislav JS. 1995. The Impact of Unemployment on Health: A Review of the Evidence. Canadian Medical Association Journal 153(5):529-540.
Mossakowski K. 2009. The Influence of Past Unemployment Duration on Symptoms of Depression among Young Women and Men in the United States. American Journal of Public Health 99(10):1826-1832.
Pharr JR, Moonie S, Bungum T. 2012. The Impact of Unemployment on Mental and Physical Health, Access to Health Care and Health Risk Behaviors. ISRN Public Health Volume 2012, Article ID 483432, 7 pages.
Affordable, quality housing is central to health, conferring protection from the environment and supporting family life. Substandard housing is associated with increased risks of injury and respi ratory ailments. Homes can be a source of exposure to radon, lead, asbestos or other hazardous agents. In children, lead exposure increases the risk of neurological impairment and developmental delays. Chronic homelessness is associated with higher rates of injuries, cancer, cardiovascular disease, substance addictions, mental disorders and death. Children and adolescents with transient housing have impaired academic performance. Housing costs—typically the largest, single expense in a family’s budget—also affect decisions that affect health. As housing consumes larger propor tions of household income, families have less income for nutrition, health care, transportation, or education. Severe cost burdens may induce poverty, which is associated with developmental and behavioral problems in children and accelerated cognitive and physical decline in adults. Low-in come families and minority communities are disproportionately affected by the lack of affordable, quality housing.
Controlled studies of the impact of housing characteristics or cost burdens on specific health outcomes are limited. However, cohort studies have documented adverse effects to health. Moisture linked to household mold was associated with respiratory illness, nausea, and fatigue. Lead abate ment in residential housing was associated with abnormally elevated blood lead levels in children. Overcrowding in households was associated with higher incidence of tuberculosis. Housing insecurity, especially triggered by poverty, was associated with behavioral problems in children and excessive school absences.
Note to LHDs in California: The California Department of Public Health’s Healthy Communities indicator (HCI) project has already collected, cleaned, and compiled these data for this indicator for California, which can be found at http://www.cdph.ca.gov/programs/Pages/HealthyCom munityIndicators.aspx. For instructions on how to download and filter data from the HCI, see Appendix D.
Two datasets are used to understand housing cost burden at the local level. The ACS collects data on the percentage of household income spent on housing. These data are available for Census tracts in five-year aggregated samples through American FactFinder (tables DP04, B25070, and B25091). For a detailed explanation of how to ACS data, see Appendix B. Additionally, The U.S. Department of Housing and Urban Development (HUD) releases their Comprehensive Housing
Households paying more than 30% or 50% of income on housing
Affordability Strategy (CHAS) data, available at http://www.huduser.org/portal/datasets/cp.html.
The advantage to CHAS data over the ACS tabulations is that CHAS data combine ACS micro data with HUD-adjusted median family incomes (HAMFI) to create estimates of the number of households that would qualify for HUD assistance.
The CHAS data also incorporate household characteristics (e.g., race/ethnicity, age, family size, and disability status) and housing unit characteristics (e.g., number of bedrooms and renter or owner costs). HAMFI is calculated at a place (i.e., city) level and is adjusted based on the apart ment size, family size, ages of family members, cost of utilities, as well as other characteristics. It is also possible with CHAS data to include all households, discluding only those households where no rent or mortgage is paid. The smallest geography available for these data is at the Census place level (i.e., cities). For more information on HAMFI and HUD qualification, see the HUD website at http://www.huduser.org/publications/pdf/CHAS_affordability_Analysis.pdf.
The indicators available are households spending 30% or more of adjusted household income on housing and households spending 50% or more of adjusted income on housing, which include rent and home ownership costs. The maps below show housing cost burden at the place level from CHAS and at the Census tract level from the ACS.
A spreadsheet with the housing cost burden data at the Census place level was joined to an Arc GIS shapefile to produce the maps below. Categories are identified with the natural breaks method in ArcGIS. Upon examination of mapped CHAS data, there appears to be multiple Census places (i.e., towns and cities) in Alameda and Contra Costa counties where a higher percentage of households are spending more than 30% of their adjusted income on housing. To examine more closely, example 2 illustrates the percentage of households paying 50% or more of adjusted income on housing at the Census tract level in Alameda and Contra Costa counties using ACS data. Areas marked as unstable had a relative standard error greater than 30, which is explained in more detail in Appendix D.
Figure 20 shows housing cost burden downloaded from the ACS at the Census tract level. While data from the ACS alone is less robust than the data from HUD–CHAS, it does estimate hous ing burden at the Census tract level, compared to the city level available only with CHAS. Cen sus tract level analysis may be more useful for health departments if less precise than city-level estimates. The map identifies Census tracts in the western region of Contra Costa and Alameda County where greater than 25% of households are paying more than 50% of their income on
housing. Areas marked as unstable had a relative standard error greater than 30, which is explained in more detail in Appendix D.
FIGURE 19: PERCENTAGE OF HOUSEHOLDS PAYING GREATER THAN 30% OF INCOME ON HOUSING BY CENSUS PLACE, BARHII REGION, 2006–2010
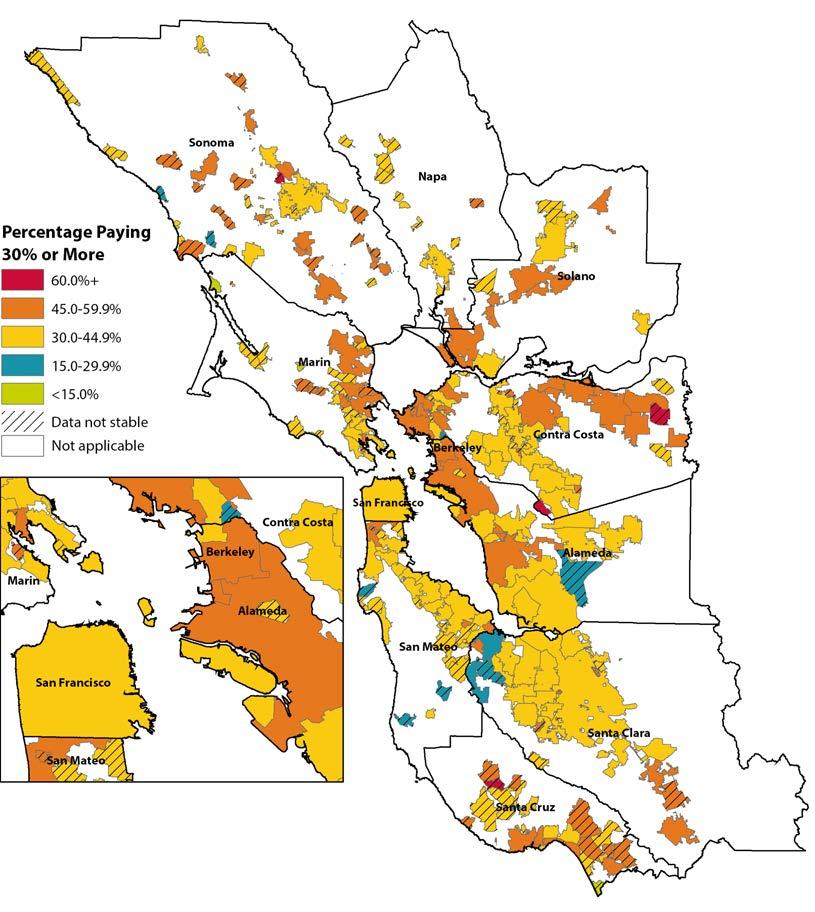
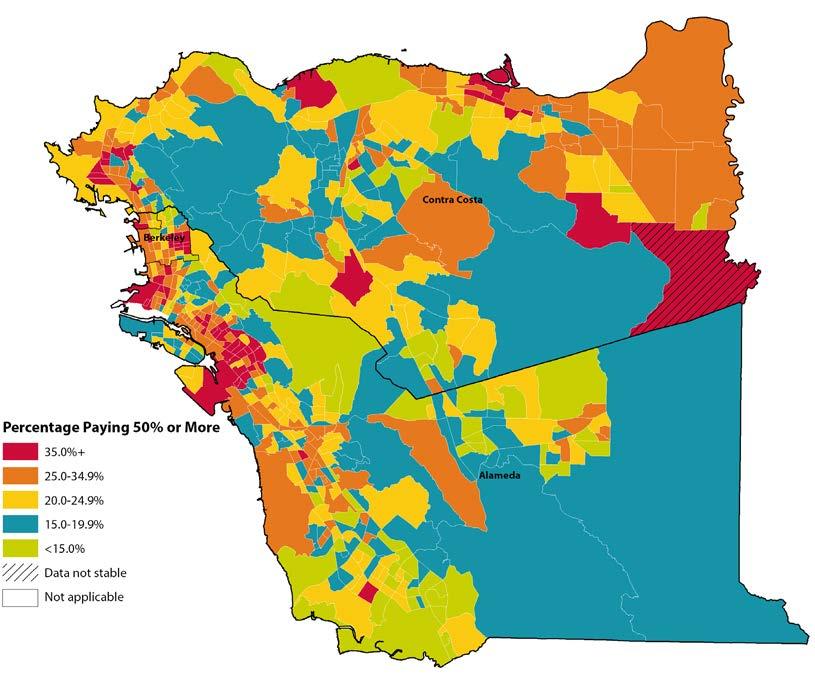
Contra Costa Health Services (CCHS) is working with the City of Richmond to support affordable housing policies that maximize health equity within the city. This partnership arose from a draft health impact assessment (HIA) by CCHS on the Richmond Livable Corridors Project, a zoning change within central Richmond. In this HIA, CCHS identi fied connections between housing and health as a key area of health concern: approximately half of the city’s households pay more than they can afford for housing, with even greater proportions for low-income households (61% of renters and 82% of homeowners). Richmond has also recognized quality affordable housing as a key element of their HiAP framework.
To address this issue, CCHS has drafted a report that analyzes potential updates to Rich mond’s inclusionary zoning ordinance—a policy that requires new market rate housing
developments to include some percentage of affordable housing, or else to contribute fees to an affordable housing fund. The report uses criteria on the connections between health and housing, such as cost burden, housing quality, and housing stability, to recommend a variety of policy options. These options include targeting households at lower income levels, raising fees to encourage market rate developers to build affordable housing on site, and lengthening the terms of affordability on housing units. CCHS has been invited to present this work to key decision-makers within the city and plans to continue partnering with Richmond to support healthy housing policy.
The Alameda County Public Health Department (ACPHD) Place Matters Housing Work group partnered with community-based organizations and tenant advocates in Oakland to provide research and city council testimony on the impacts of rising rental costs and lack of affordable, quality housing for neighborhood stability and health. In spring of 2014, the Tenant Justice Coalition won improvements to Oakland’s rent ordinance which capped all rent increases at 10% annually and reduced the amount in rent that landlords can pass through to tenants when making capital improvements on their properties. These policy changes are the first significant reforms for tenants in Oakland in more than ten years. Additionally, in collaboration with Causa Justa::Just Cause, ACPHD formed a research partnership to analyze gentrification and displacement from a public health and tenants’ rights perspective, and to recommend strategies for preventing displacement in future development. The partnership tackles the controversial and often misunderstood issue of gentrification, and seeks to provide analysis grounded in community experience that leads to policy and systems change for the benefit of communities most affected by gentrification and displacement—urban low-income communities and communities of color. A report, Development without Displacement: Resisting Gentrification in the Bay Area, was released in April 2014 from this partnership and can be found at http://cjjc.org/publications/reports/ item/1421-development-without-displacement-report
Alameda County Public Health Department’s Asthma Start and Alameda County Healthy Homes programs works with Oakland families to eliminate asthma triggers in their homes. Some triggers are impossible to remove without the landlord’s help, like moldy carpet. In fact, Asthma Start reported that for a recent 12-month period, over 40% of the 370 homes they visited contained some signs of mold. The Place Matters Housing Workgroup priori tized advancing policies that will improve rental housing. They have partnered with the
EQUITY
City of Oakland and code enforcement officials to effectively address housing conditions that are linked with poor health in Oakland rental properties. They researched new models of code enforcement that are more focused on preventing health harming conditions and presented the findings to City staff and a Building Services Improvement Taskforce. The Oakland City Council’s Community and Economic Development Committee approved the Task Force’s recommendations to move forward with piloting this model. The proposed pro gram design can be found at http://www2.oaklandnet.com/oakca/groups/ceda/documents/ report/oak033410.pdf.
Baggett TP, Hwang SW, O’Connell JJ et al. 2013. Mortality among Homeless Adults in Boston: Shifts in Causes of Death over a 15-year Period. JAMA Internal Medicine 173(2):189-195.
Robert Wood Johnson Foundation, Commission to Build a Healthier America. 2008. Housing and Health, Issue Brief 2
Stone ME. 2006. What is Housing Affordability? The Case for the Residual Income Approach. Housing Policy Debate 17(1):151–184.
Thomson H, Thomas S, Sellstrom E, Petticrew M. 2013. Housing Improvements for Health and Associated Socio-economic Outcomes. Cochrane Database of Systematic Reviews 2:335.
Office of the Deputy Prime Minister. 2004. The Impact of Overcrowding on Health & Education: A Review of Evidence and Literature. Wetherby, UK: Office of the Deputy Prime Minister Publications.
California Department of Housing & Community Development. 2013. Housing and Health.
Economic policy debates have long focused on the unemployment rate and poverty rate as indica tors of economic well-being. While these measures are certainly not irrelevant, they are insufficient in that the picture of economic hardship they create is incomplete. The unemployment rate looks solely at those who are working versus those who are both without jobs and searching for a job. The poverty rate, on the other hand, only considers income in relation to a basic food budget de termined by the United States Department of Agriculture (USDA) in 1962 and is adjusted annu ally for inflation. The working poor—a group of people who are employed but do not earn a wage adequate for sustaining good health and quality of life—are overlooked by both measures and subsequently neglected by policy makers who fail to consider additional indicators incorporating measures of basic needs being met.
In order to consider a more comprehensive view of economic hardship and not overlook subsets of the population, such as the working poor that face true struggles in their daily life pertaining to sustaining good health and quality of life, we propose using a new indicator. Living wage is an indicator that takes into account not only employment status and ability to purchase food, but also the ability to acquire basic needs: housing, food, transportation, health insurance, and child care. It is a useful indicator for measuring income above or below a specific threshold that consid ers basic needs, which are essential not only for subsistence but for healthy living and maintaining quality of life.
How Living Wage Affects Health Research has demonstrated extensively that income level is associated with health. Adverse health outcomes are more likely to occur throughout the entire lifetime of low-income individuals including infant mortality, all-cause mortality, various diseases, self-reported health status, and mental health with relative risks inversely proportional to income.
Housing fundamentally protects us from the elements of nature and functions as a space for activi ties of daily living. However, inadequate housing has a variety of pathogeneses through which it contributes to disease morbidity and mortality. The contribution of housing to health is detailed in the chapter on Housing Cost Burden. Here, we will focus on food, transportation, health insur ance, and child care.
Transportation is a means to access jobs or job interviews, education, and other everyday activi ties but it can also be instrumental for gaining access to healthy foods and medical attention. The USDA estimates that 23.5 million people in the United States live in food deserts—neighbor hoods or towns without “ready access to fresh, healthy, and affordable food.” Many people in these
neighborhoods are forced to subsist on food from fast food restaurants and convenience stores that lack essential nutrients or are saturated with sodium, sugar, saturated fats, and chemical preserva tives and contribute to diet-related diseases such as diabetes and heart disease. For these people, 13.5 million of which are low income, reliable transportation may be the pivotal factor for gaining access to nutritious food and good health.
Health insurance directly affects health by contributing to the timeliness, appropriateness, and financial accessibility of clinical preventive services and treatment for illness and injury. Individuals with health insurance are more likely to foster ongoing relationships with a medical professional. They are more likely to receive screenings that enable early diagnosis and drastically decrease mortality of diseases such as breast cancer, cervical cancer, prostate cancer, or melanoma. They are more likely to have regular checkups and obtain medications to help control chronic medical con ditions such as heart disease, diabetes, HIV, or mental illness. Subsequently they are more likely to have positive health outcomes. One national study in the United States found that over a 17-year follow-up period the risk of mortality was 25% greater among adults who did not have health insurance at the beginning of the study than those who had private health insurance. The availability of safe and reliable child care is imperative for working parents to gain or maintain employment, but also has considerable implications for the livelihood of children themselves. Several studies have found that children who attended quality preschool programs earned up to $2,000 more per month than those who did not, were more likely to graduate from high school, more likely to own homes, and more likely to have longer marriages. Furthermore, they were less likely to repeat grades in school, need special attention, or get into future trouble with the law. Children with the opportunity to attend a quality childcare institution make developmental gains that confer a substantial benefit throughout their life. Additionally, safe and sanitary childcare in stitutions also play a role in preventing the transmission of communicable diseases such as hepati tis A or influenza as well as preventing accidental injuries and death.
The living wage is a no-frills, minimum standard of living that should be considered a step above the poverty rate and not a lifestyle most middle-class Americans would desire. It does not include income set aside for children’s post-secondary education, pension, retirement, or savings for wealth accumulation (investments, home ownership). The budget also does not include money for restaurant meals or entertainment, leisure activities, or vacations. Regional cost adjustments were available for some of the cost categories. However, local variation in costs within regions was not accounted for. Family income for married couples can reflect two earners. Standard errors for per
centage of families below the living wage were not calculable from American Community Survey data.
Using the Poverty in America Living Wage Calculator
Note to LHDs in California: The California Department of Public Health’s Healthy Communities Data and Indicators Project (HCI) project has already collected, cleaned, and compiled the data for this indicator for California, which can be found at http://www.cdph.ca.gov/programs/Pages/ HealthyCommunityIndicators.aspx. Further, the HCI project has estimated the percentage of California families who earn less than this living wage using data from the American Community Survey. For instructions on how to download and filter data from the HCI, see Appendix D. For LHDs outside of California, it is necessary to download the data from the Poverty in America Liv ing Wage Calculator and compare that with population estimates from the American Community Survey.
The Poverty in America Living Wage Calculator can be used to determine the living wage required for families of different compositions, geographies, and ethnicities. This calculator was created by Dr. Amy K. Glasmeier in the Department of Urban Studies at the Massachusetts Institute of Tech nology in conjunction with Poverty in America, an accelerated research, data development and distribution research program that began at Penn State. These researchers have compiled nation wide economic data and developed user-friendly tools in order to provoke research into the causes, effects, and existence of economic inequity in the United States.
The data represent a synthesis of multiple data sources including USDA’s 2010 low-cost food plan (food costs); Parents and the High Cost of Child Care—2011 Update, National Association of Child Care Resource and Referral Agencies (child care); 2010 Consumer Expenditure Survey and the 2010 wave of the Medical Expenditure Panel Survey (health care); 2010 Fair Market Rents produced by U.S. Department of Housing and Urban Development (housing); 2010 Consumer Expenditure Survey (transportation); and federal payroll taxes as well as federal and state income taxes for the 2011 tax year (taxes). Income data were tabulated from sequence tables (B19139) of the ACS, 2006-2010, and stratified by race/ethnicity (county, region, state). Prevailing (median) wages for selected occupations in 2010 were downloaded from the Employment Development Department, Labor Market Information website (http://www.labormarketinfo.edd.ca.gov) based on the first quarter of the Occupational and Employment Statistics (OES) Survey, 2009.
How to Identify the Living Wage for a Place or County from the Poverty in America Living Wage Calculator
STEP 01. Go to http://livingwage.mit.edu. Select the state for which you would like to investi gate the living wage.
SOCIAL DETERMINANTS OF HEALTH INDICATORS TO ADVANCE HEALTH EQUITY
STEP 02. Choose the county or place for which you would like to investigate the living wage (e.g., Marin County).
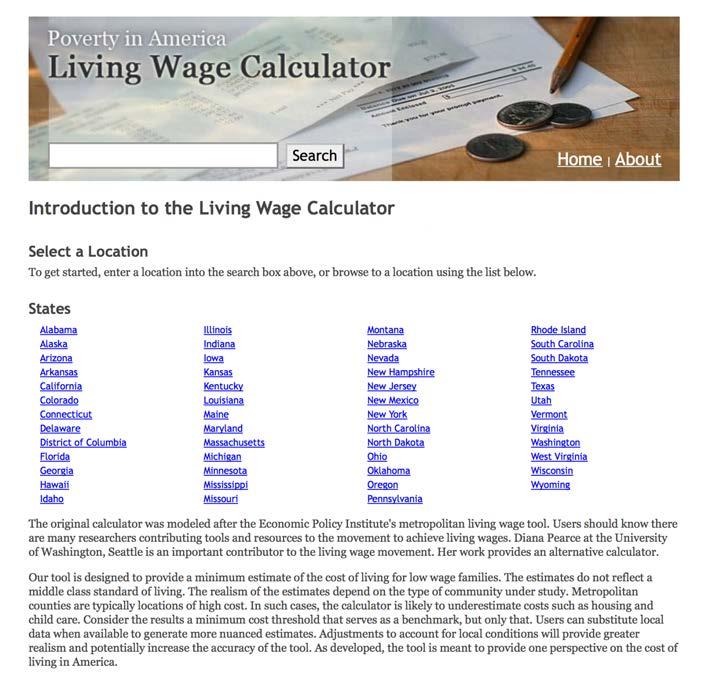
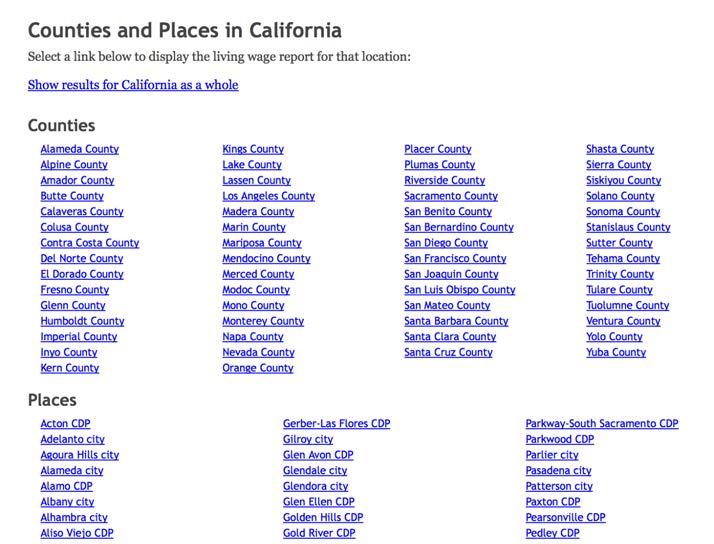
The following wages chart will be returned with the living wage, poverty wage, and minimum wage required for different family compositions.
How to Analyze Living Wage Data from the CDPH Healthy Communities Data and Indi cators (HCI) Project
EXAMPLE 1: ANALYSIS BY COUNTY FOR ALL OF CALIFORNIA
The HCI project has estimated the number of families in California—stratified by family com position, race, and ethnicity—who earn less than a living wage using data using the living wage calculator. These data are found at http://www.cdph.ca.gov/programs/Pages/HealthyCommunity Indicators.aspx. Population estimates for two family compositions are available: married coupled families with two children and single mother families with two children.
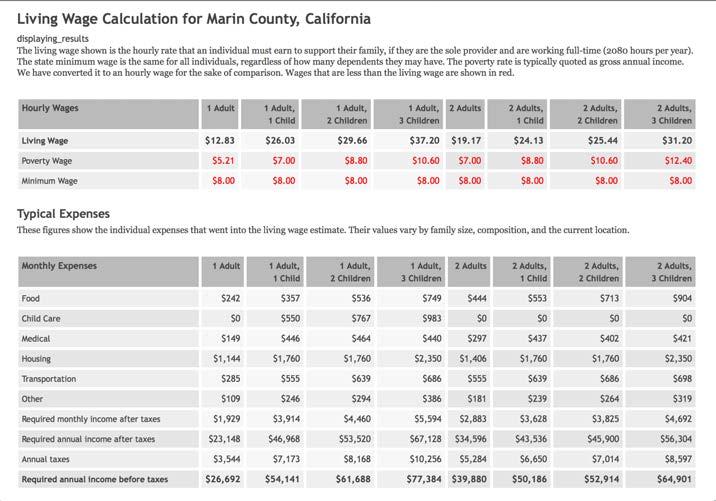
After downloading and filtering the data from the HCI project as explained in Appendix D, figure 21 shows the percentage of married couple, two children and single mother, two children families in California who live below a living wage by California county.

FIGURE 21: PERCENTAGE OF FAMILIES LIVING BELOW THE LIVING WAGE, CALIFORNIA COUNTIES
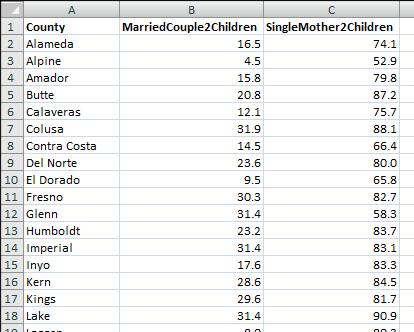
Figure 22 shows estimates the percentage of families—stratified by race/ethnicity—in Marin county California who earn less than a living wage. These data were downloaded from the same dataset in example one and filtered to display Marin County.
FIGURE 22: PERCENTAGE OF FAMILIES LIVING BELOW THE LIVING WAGE, MARIN COUNTY, BY RACE/ETHNICITY
Married Couple–Two Children Single Mother–Two Children
Through participatory research projects, the San Francisco Department of Public Health (SFDPH) has learned that wage theft, or non-payment of wages earned, and employer negligence for work-related injuries are common in certain service industries. These work conditions negatively affect health. For example, 50% of Chinatown restaurant workers re ported not receiving minimum wage, 90% of domestic workers reported a lack of overtime pay, and many day laborers have no access to workers’ compensation.
Working to translate knowledge into policy, SFDPH has begun to explore how to lever age its regulatory authority over restaurants and other businesses to protect worker health. Recognizing that labor agencies have limited staffing or capacity to monitor all businesses, SFDPH seeks to complement, not duplicate, labor enforcement activities by supporting monitoring efforts and targeting of chronic violators.
Using legal authority established by local and state health code, SFDPH suspended health permits of restaurants and other health-permitted businesses found to be noncompliant with San Francisco’s minimum wage law. In multiple cases, health permit suspension led to payment of tens of thousands of dollars in back wages owed to workers within in a couple weeks or months, after one to four years of employer noncompliance with the labor agency ruling.
According to California Health and Safety Code (Part 7 §113715), all food facilities must be in compliance “with all applicable local, state, and federal statutes, regulations, and ordinances” in order to operate in California. To receive a new health permit for operation, SFDPH has begun to require proof of workers compensation (WC) coverage, which is required under state law. Among permitted facilities, SFDPH also randomly selects 10% of facilities to request proof of WC compliance annually. Failure to provide proof of insurance results in suspension of the health permit and reporting to state labor enforcement agency. SFDPH has also piloted projects to observe labor law postings and identify sentinel worker health and safety hazards as part of routine inspections.
To date, SFDPH has conducted this pilot work with minimal staffing and no outside funds. However, additional funds and staff could increase the scale and scope of labor com pliance work. For more information, visit http://www.sfhealthequity.org/elements/work.
In 1999, the city of San Francisco proposed a living wage ordinance that would create a wage minimum of $11 per hour for firms that provided services to, or lease land from, local government. Support for the law was based on the idea that employees who provide services for local government should be paid wages that sufficiently meet the local cost of living.
The first living wage ordinance was adopted in Baltimore, Maryland in 1994. Since that time approximately 30 other cities in the United States have taken on such laws including three in California—Los Angeles (1997), San Jose (1998), and Oakland (1998).
San Francisco Department of Public Health (SFDPH) decided to conduct an analysis of a proposed living wage ordinance for San Francisco with respect to its impact on health. The analysis documented the benefits to adult health and children’s education achievement attributable to the adoption of a living wage of $11.00 per hour. The findings were sig nificant. SFDPH predicted adoption of the increased would result in decreases in the risk of premature death by 5% for adults 24 to 44 years in households whose current income was around $20,000. For the offspring of these workers, a living wage would result in an increase of a quarter of a year of completed education, a 34% increased odds of high school
completion, and a 22% decrease in the risk of early childbirth. The American Journal of Public Health published this analysis in 2001.
In 2002, city legislators invited SFDPH to participate in city policy discussions on aug menting local minimum wage standard for all San Francisco residents. In 2003, San Fran cisco residents passed a minimum wage ordinance, increasing the minimum wage from $6.75 to $8.50 for over 50,000 workers in San Francisco. As of 2014, the new minimum wage is $12.66/hour and it is expected that a proposal to raise the minimum wage to $15/ hour will appear on the November 2014 ballot.
For more information, visit http://www.sfhealthequity.org/elements/work/22-elements/ work/83-living-wage-and-health.
SOCIAL DETERMINANTS OF HEALTH INDICATORS TO ADVANCE HEALTH EQUITY
Backlund E, Sorlie PD, Johnson NJ. 1999. A Comparison of the Relationship of Education and Income with Mortality: The National Longitudinal Mortality Study. Social Science & Medicine 49(10):1373-1384. Institute of Medicine. 2002. Care Without Coverage: Too Little Too Late. http://www.iom.edu/Reports/2002/ Care-Without-Coverage-Too-Little-Too-Late.aspx. Accessed February 2014.
National Education Association. 2014. Early Childhood Education http://www.nea.org/home/18163.htm Accessed February 2014.
US Department of Agriculture. 2014. Agricultural Marketing Service—Creating Access to Healthy Affordable Food. http://apps.ams.usda.gov/fooddeserts/Default.aspx. Accessed February 2014.
US Department of Health and Human Services. 2014. Frequently Asked Questions Related to the Poverty Guidelines and Poverty. http://aspe.hhs.gov/poverty/faq.cfm#developed. Accessed February 2014.
World Health Organization. 2011. Environmental Burden of Disease Associated with Inadequate Housing. Geneva, Switzerland: World Health Organization Regional Office for Europe.
The United States Department of Agriculture defines food security as regular access to enough food to lead a healthy and active life. In contrast, individuals who experience food insecurity may cut the size of their meals, be unable to eat balanced meals, forgo eating when hungry, or eat less than needed because of an inability to afford or access food. Inadequate diets can impair intellectual performance and have been linked to more frequent school absence and poorer educational achievement in children. Nutrition also plays a significant role in causing or preventing a number of illnesses, such as cardiovascular disease, some cancers, obesity, type 2 diabetes, and anemia. Inadequate food intake can also adversely affect learning, development, and physical and psycho logical health.
At least two factors influence the affordability of food and the dietary choices of families—the cost of food and family income. The inability to afford food is a major factor in food insecurity, which has a spectrum of effects including anxiety over food sufficiency or food shortages; reduced quality or desirability of diet; and disrupted eating patterns and reduced food intake.
Low-income, ethnic minority, and female-headed households are at the highest risk for food inse curity. In 2011, approximately 15% of U.S. households were food insecure at some time during the year, meaning that the food intake of one or more household members was reduced and eating patterns were disrupted because the household lacked money and other resources for food. Inad equate diet and physical inactivity are responsible for approximately 17% of deaths in the United States.
The steps outlined here to analyze survey data about food insecurity are part of the service diag nose and investigate. Completion of this step allows a health department to identify the priority populations where to focus other essential public health services primarily: evaluate, monitor health, and mobilize community partnerships. Based on the results of this analysis, a health de partment can identify the community organizations and stakeholders working with priority popu lations to mobilize into a partnership first. Once created, the first crucial outcome of this partner ship is the inter-agency sharing of data about programmatic and health outcomes of the priority populations. This partnership can then specifically identify the needs of the priority populations through sharing this data, which this broad SDOH-LC indicator cannot capture. The partnership can then design policies, programs, and other interventions tailored to the priority populations identified in the “diagnose and investigate” step from this collaboratively-created needs assess
ment. The partnership, after implementation of an intervention, can use this SDOH-LC indicator to evaluate the progress and to monitor the health and quality of life in priority populations over time.
There are two sources of data for health departments in California—the California Health In terview Survey (CHIS) and the California Department of Public Health’s Healthy Communities Data and Indicator (HCI) project.
CHIS collects data on food insecurity from adults with household incomes that are less than 200% of the federal poverty level (FPL) (i.e., lower-income households). Ideally, in order to identify disparities in food security, it is best to look at differences among adults from lower- and higher-income households. However, the CHIS data can be used to identify lower-income adults who are most at risk of food insecurity, such as those from disadvantaged racial/ethnic groups or older adults. Considering the limitations of CHIS (and phone-based surveys in general), BARHII suggests that health departments always triangulate estimates from CHIS with other SDOH-LCs and other neighborhood-level data. In the case of the food insecurity indicator, we can assume that areas with a higher prevalence of people living below 200% FPL also face a higher prevalence of food insecurity. Based on this assumption, further assessment about food insecurity in high-pover ty areas (as shown on the poverty map in the introduction) can occur to mitigate the limitations of phone-based surveys such as CHIS. For a detailed set of instructions with screen shots of how to access these data, see Appendix C.
In addition, HCI has developed their own data for this indicator for California, which can be found at http://www.cdph.ca.gov/programs/Pages/HealthyCommunityIndicators.aspx. For the detailed instructions on how to download and filter data from the HCI, see Appendix D. Each of these methods is outlined below.
The method outlined for CHIS to identify priority places and populations for a health outcome or social determinant of health can be applied to local surveys or others outside of California. CHIS asked a series of five questions developed by the USDA about nutrition in the past 12 months, such as whether the food that the household bought lasted, or whether they had enough money to purchase more to measure food security. These questions can be found on the CHIS adult questionnaire at http://healthpolicy.ucla.edu/chis/design/Pages/questionnaires.aspx.
For more information on how the responses to these five questions were combined into a single overall measure of household food security that can be viewed on AskCHIS, see http://www.ers. usda.gov/topics/food-nutrition-assistance/food-security-in-the-us/measurement.aspx.

Use the method from Appendix C to identify disparities in food security by race/ethnicity among adults from low-income households. In this case, we used the BARHII region (the Bay Area plus Santa Cruz) as the geography, comparing food security by race/ethnicity over time.
Interpret the trend chart to determine priority populations among race and ethnicities with statis tically stable estimates. Race/ethnicities (with statistically stable estimates) among people living be low 200% FPL with the highest prevalence of food insecurity have seen an increase or no change in food insecurity over time should be designated as intervention priorities. Based on this procedure, recommended ranked priority populations of people living below 200% FPL by race and ethnicity for food-security interventions include those of two or more races, African American/ Black and Hispanic/Latino (tie), Asian, and White. Because Native Hawaiian and American In dian population responses were unstable, their rank could not be determined from these data, al though they could experience food insecurity greater than or equal to other race/ethnicities. Right now, this can only be determined with local-level assessment or oversampling of these populations by CHIS, which can be cost prohibitive. In late 2014, CHIS will release the CHIS Neighborhood Edition, which will allow geographies including zip codes to be grouped together for analysis. An interpretation of the trend chart would be that, in 2009, food insecurity among those living below 200% FPL in the BARHII region increased since 2001 with the most significant change af ter 2007. In 2009, Multirace individuals living below 200% FPL had the most significant increase in food insecurity since 2001, followed by Hispanic/Latinos and African Americans/Blacks (tie), Asian, and White populations. Although sometimes reported, data on food insecurity for Native
FIGURE 23: FOOD INSECURITY, BARHII REGION
Hawaiian/Pacific Islander, and Native Americans could not be determined with CHIS because of unstable data. Although the data from CHIS cannot determine food insecurity for Native Ameri cans and Native Hawaiian populations living below 200% FPL, these populations may still experi ence food insecurity equal to or greater than race/ethnicities identified in this analysis. This can be examined more closely with local-level assessment or oversampling of these populations by CHIS.
Consider more robust analysis of survey date (e.g., small area analysis) if resources permit. BARHII concedes that there are superior, more rigorous methods to analyze CHIS and other sur veys than those presented here. These methods require additional data collection on populations (i.e., oversampling) or sophisticated survey modeling. Both of these alternatives, while providing better results, can be methodologically complex and cost prohibitive to LHDs. However, synthetic estimates and some other small area analysis techniques exist.
Identify the potential community-based organizations in priority areas to mobilize community partnerships to increase food security.
Use the method from Appendix D to download data from the California Department of Public Health’s Healthy Communities Data and Indicator (HCI) project.
The HCI presents the ratio of dollars to purchase an annual market basket of foods for a femaleheaded household with children less than 18 years, relative to her annual inflation-adjusted income. The cost of food is based on the USDA’s low-cost food plan, which includes a market basket of items that families would have to purchase to provide a nutritious diet for each family member. To determine the costs, the USDA conducts a monthly national market basket survey of food items. The USDA tabulates per person costs by age for children less than 11 years, and age and gender for those 12 years to those 71 years and older. For the HCI project, family costs were the sum of costs for the female head of household and the per child-cost multiplied by the area average number of children under 18 years, taking into account their age distribution. The USDA annual costs were expressed in constant 2010 dollars and adjusted for regional differences (Los An geles, Bay Area, San Diego, California average) based on the Consumer Price Index food at home.
STEP 01. Go to http://www.cdph.ca.gov/programs/Pages/HealthyCommunityIndicators.aspx
STEP 02. Open the “Food Affordability” Microsoft Excel sheet (xls).
STEP 03. Choose filters based on your analysis. For this example, we will be comparing race/ ethnicities in the entire state of California. So under ‘geotype’ choose “CA.” This will bring up each race/ethnicity category as rows.
STEP 04. The affordability shown is for a female-headed household with children under 18 years. The affordability ratio is the food cost divided by median income for that race/ ethnicity. Copy the data into a new Excel sheet.
STEP 05. Create a visual representation.
0.35
0.30
Ratio
0.15
0.25 of Food Cost to Median Income
0.20 All RacesAmerIndAsianAfAm/ Black Hisp/ Lat PacIslWhiteMultiraceSome Other Race
0.10
In 2011, Marin County convened a CalFresh collaborative to address the low penetration of CalFresh enrollment in Marin, as Marin has one of the lowest in the state. The collaborative convened representatives from the local food bank; the di rector of Health and Human Services and Social Services; policy analysts; Commu nity Health and Prevention staff; Women, Infants, and Children (WIC) staff, and Epidemiology Program staff. A data presentation on food insecurity, food stamp gaps, and needs in Marin was provided by the epidemiologists.
In 2012, as a direct outcome of the collaborative, a CalFresh application assister was hired by the Division of Social Services, and located at the WIC office to assist WIC clients with completing CalFresh applications. It was clear from this pilot that the assister was able to effectively reach CalFresh eligible families, dispel myths about the program, and be a friendly and accessible face of the program.
Later in 2012, the recently convened Marin Food Policy Council chose CalFresh enrollment as a program goal and explored opportunities to support CalFresh outreach and enrollment activities and the systems and policy changes that were required to make an impact on this issue. The council drafted a resolution to the
board of supervisors recognizing May as Marin’s first ever CalFresh Awareness Month, and supported a range of awareness activities for the month, including:
• Coordinating a CalFresh application assister training in which 30 community-based application assisters were trained to complete CalFresh applications. These CBO staff are now poised to do outreach and enrollment in the community and can better address myths about the program.
• Developing a plan for a community advisory board comprised of low-income resi dents to guide healthcare reform and other public assistance enrollment efforts, including CalFresh.
• Strengthening CalFresh outreach and promotion materials. These materials include a CalFresh insert that was printed in English and Spanish and was distributed in the Sunday Marin Independent Journal and will be available for future community events. They also produced a CalFresh video.
• Coordinating Marin’s first CalFresh in a Day outreach event, in which applicants bring their applications and are certified as eligible on the same day.
Increasing access to farmers’ markets and community-supported agriculture projects in communities can promote the consumption of fruits and vegetables. However, since low-income residents must often purchase food with CalFresh Electronic Benefits Trans fer/Food Stamps, access may be limited if farmers’ markets do not accept CalFresh. To promote increased access to healthy foods and beverages among low-income families, the Santa Clara County Public Health Department (SCCPHD) worked with farmers’ markets, farmers’ market associations, city officials, and a local coalition of stakeholders to increase acceptance of CalFresh at farmers’ markets. The work was supported by a Center for Dis ease Control and Prevention Communities Putting Prevention to Work grant. SCCPHD staff provided one-on-one guidance to the cities, towns, farmers’ markets, and farmers’ market associations on the application process to offer CalFresh, as well as on building community support and utilizing marketing materials to promote the use of markets by low-income families. Since the work began, ten markets have completed the application to accept CalFresh, obtained a wireless point-of-sale machine, and promoted CalFresh accep tance. Farmers’ markets that successfully implemented market acceptance of CalFresh were in locations of the county with high populations of low-income residents. Through part nerships with local cities and farmers’ markets associations, 23 farmers’ markets now accept CalFresh in Santa Clara County.
In addition, The Health Trust (a local foundation) with funds from CPPW and in collabo ration with key stakeholders advocated for the adoption of an ordinance streamlining the
process for new certified farmers’ markets in the City of San Jose. The ordinance eliminates barriers to San Jose’s farmers’ market permitting process and creates a requirement that all new farmers’ markets accept food assistance benefits, CalFresh and WIC.
Through CPPW funding, SCCPHD also worked with food retailers to apply to the US DA’s Restaurant Meals Program. This program allows CalFresh-approved clients that are disabled, homeless, or elderly to purchase prepared meals at participating retailers. SC CPHD and the Santa Clara County Social Services Agency (SSA) identified and prioritized regions in the county to target, providing technical assistance to retailers in completing Restaurant Meals Program (RMP) applications and assisted with marketing efforts. For ex ample, SSA provided a venue for promotion of retailers participating in the RMP on their website and at their monthly Safety Net meetings. As a result, 14 additional restaurant retail locations in Santa Clara County in geographic areas with high need accept CalFresh.
Agricultural Research Service. 2010. Report of the Dietary Guidelines Advisory Committee on the Dietary Guidelines for Americans, 2010. Washington, DC: Department of Agriculture and United States Department of Health and Human Services. http://www.cnpp.usda.gov/Publications/ DietaryGuidelines/2010/DGAC/Report/2010DGACReport-camera-ready-Jan11-11.pdf. Accessed January, 2013.
Coleman-Jensen A, Nord M, Andrews M, Carlson S. 2012. Household Food Security in the United States in 2011. Washington, D.C.: Economic Research Service, United States Department of Agriculture.
Franklin B, Jones A, Love D, Puckett S, Macklin J, White-Means S. 2011. Exploring Mediators Food Insecurity and Obesity: A Review of Recent Literature. Journal of Community Health 37(1):253-264.
Harrison GG, Sharp M, Manalo-LeClair G, Ramiriez A, McGarvey N. 2007. Food Security Among California’s Low-Income Adults Improves. But Most Severely Affected Do Not Share Improvement. Los Angeles: UCLA Center for Health Policy Research.
Mokdad AH, Marks JS, Stroup DF, Gerberding JL. 2004. Actual Causes of Death in the United States, 2000. JAMA 291(10):1238-1245.
Poverty, unemployment, and a lack of access to health insurance can all affect one’s ability to afford personal healthcare costs. For people without health insurance, this lack of healthcare access can seriously affect life stability and mental health as well as physical health outcomes. People without health insurance are more likely to die early and have poor health status. In addition, infectious diseases that go untreated can also increase health risks for the larger community. Uninsured people often postpone getting health care, have difficulty obtaining care when they ultimately seek it, and may have to bear the full brunt of healthcare costs. According to one study, uninsured families can afford to pay for only 12% of hospitalizations that they experience. Even for people with healthcare insurance, high premiums and out-of-pocket payments can be a significant barrier to accessing needed medical treatment and preventive care. Almost 50% of personal bankruptcy filings in the United States are due to medical expenses.
For a detailed explanation of how to access CHIS data, see Appendix C. How to Use AskCHIS to Find Information on Foregoing Health Care
STEP 01. Log in to your account.
STEP 02. Pick the geographic area that you want to explore. Choose the Bay Area Regional Health Inequities Initiative (BARHII) region—all the Bay Area counties plus Santa Cruz County. When you are finished, press the “Select” button.
STEP 03. To find those who delayed medical care, choose “Access & Utilization.” Under that, choose “Delay of Care.” The topics available for “Delay of Care” will populate on the right side of the page. Select the first topic, “Delayed or didn’t get other medical care.”
STEP 04. The next page asks you to compare by other groups or conditions. For now we are skipping comparing, so we press the “Population” button at the top. Here you can choose to limit the data by age, race/ethnicity, gender, and/or federal poverty level factor for the household. We limit to adults under 65 years only by entering 18 and 64 in the age boxes. When ready, press the green button, “Get Results.” The results are displayed for the most recent year the data are available. In this case, the data dis play for 2011–2012. The result is that 15.2% of adults delayed or didn’t get medical care.
STEP 05. We can further refine this by pooling together multiple years. To do this, hover over “Time Period” and click “Pool Data Together” and choose the years you want. In this case we chose 2009 and 2011–2012. The results are again displayed, this time show ing 15.7% of adults delayed or didn’t get medical care. Other indicators available in AskCHIS include “Delayed or didn’t get prescription medicine” and from 2001, the reasons that health care or medications were delayed.
Napa County
In 2009, Napa County Public Health Department helped to launch and promote a pre scription drug discount card under a program sponsored by the National Association of Counties (NACo). The program helps consumers cope with the high cost of prescription drugs by offering an average of 22% off retail prices of commonly prescribed drugs. All Napa County residents, regardless of age, immigration status, income, or existing health coverage, may use the prescription discount card. There is no enrollment form, no membership fee, and no restrictions or limits on frequency of use. Cardholders and their families may use the card any time their prescriptions are not covered by insurance. Napa County Public Health Department targeted promotion efforts to uninsured and underinsured residents of the county by holding information sessions with groups representing senior citizens, such as the local chapter of American Association of Retired Per sons; providing outreach materials to all programs within the Health and Human Ser vices Agency and to local non-profits serving indigent and other at-risk populations; and through information distributed to the local news media.
San Francisco County Department of Public Health
Launched in 2007, Healthy San Francisco (HSF) is a program designed to make healthcare services available and affordable to uninsured San Francisco residents. Operated by the San Francisco Department of Public Health, HSF is available to all San Francisco residents regardless of immigration status, employment status, or pre-existing medical conditions.
The program currently provides health coverage to over 50,000 uninsured San Francisco residents.
HSF was launched after the passage of the Health Care Security Ordinance, which re quired employers with 20 or more employees to satisfy an employer spending requirement in one of three ways: 1) make payments for health, dental, and/or vision insurance for employees; 2) contribute to a city option; or 3) make contributions to programs that reim burse employees for out-of-pocket health care costs.
Employees of employers that contribute to the city option and who meet program eligi bility requirements are invited to apply for HSF. Employees who are not eligible for HSF are assigned medical reimbursement accounts to pay for out-of-pocket medical expenses. While Healthy San Francisco provides basic and ongoing medical care, the program is not health insurance. Therefore, if employers offer health insurance they should not drop it. People who qualify for Healthy San Francisco include the following:
• A San Francisco resident.
• Uninsured for the last 90 days.
• Not eligible for public insurance programs such as Medi-Cal or Healthy Families.
• Between the ages of 18 and 64 years.
• Living within program income guidelines.
Agency for Healthcare Research and Quality. 2012. 2012 National Healthcare Disparities Report: http:// www.ahrq.gov/research/findings/nhqrdr/nhdr12/chap9.html. Accessed October 2014.
Alexander GC, Casalino LP, Meltzer DO. 2003. Patient–Physician Communication about Out-of-Pocket Costs. JAMA 290(7):953-958.
Chappel A, Kronick R, Glied S. 2011. The Value of Health Insurance: Few of the Uninsured Have Adequate Resources to Pay Potential Hospital Bills. ASPE Research Brief. Washington, DC: U.S. Department of Health and Human Services. http://aspe.hhs.gov/health/reports/2011/ValueofInsurance/rb.pdf. Accessed June 2013.
Durham J, Owen P, Bender B, et al. 1998. Self-assessed health status and selected behavioral risk factors among persons with and without healthcare coverage—United States, 1994-1995. MMWR 47(9):176-180.
Hadley J. 2007. Insurance Coverage, Medical Care Use, and Short-term Health Changes Following an Unintentional Injury or the Onset of a Chronic Condition. JAMA 297(10):1073-1084.
Institute of Medicine. 2004. Insuring America’s Health: Principles and Recommendations
Jacoby M, Sullivan T, Warren E. 2000. Medical Problems and Bankruptcy Filings. Norton’s Bankruptcy Law Adviser 5:1-12.
Violent crime is a public issue that affects everyone’s health. In addition to contributing to death and disability, violence exacerbates various chronic diseases by inducing stress and fear. Constant stress and fear evoke unhealthy physical responses (e.g., high blood pressure), confine residents to their homes eliminating the health benefits of physical activity, and prohibit commuting via walking or bicycling to jobs, goods, and services. In addition, residents in high-crime areas mis trust neighbors and public institutions, leading to further social disintegration, which perpetuates further violence and stifles economic development.
Poverty and educational attainment are significantly associated with violence as measured through violent intentional injuries. As in the introduction, those with low educational attainment or who live in high-poverty neighborhoods suffer a high burden of fatal, intentional injuries. Upstream policies and programs that reduce poverty, increase educational attainment, and improve other SDOHs can also reduce violent crime.
Traditionally, health and law enforcement institutions have acted independently in their responses to violent crime despite the interconnectedness of its causes and consequences. Public health essential services, in partnership with community stakeholders, can integrate these historically separate downstream and upstream services into a holistic approach to prevent violence.
Note to LHDs in California: The California Department of Public Health’s Healthy Community Indicators (HCI) project has already collected, cleaned, and compiled these data from the Uni form Crime Reports for communities in California, which can be found at http://www.cdph. ca.gov/programs/Pages/HealthyCommunityIndicators.aspx. Appendix D explains how to down load and filter these data. Counties outside of California can acquire the data from Uniform Crime Reports.
Uniform Crime Reports (UCR) is a nationwide, cooperative statistical effort of nearly 18,000 city, university and college, county, state, tribal, and federal law enforcement agencies that voluntarily report data on crimes discovered by police and those reported to the police by the general public. The Federal Bureau of Investigation compiles these reports in a standard format annually. Four types of major crimes fall into the category of violent crimes: 1) murder and non-negligent man slaughter, forcible rape, robbery, and aggravated assault. These tend to be more reliably reported than other less serious crimes, but underreporting has been well documented. Crime data are based on incidents that are reported to law enforcement agencies.
Furthermore, these data do not reflect crime in unincorporated areas or reported by spe cial law enforcement agencies, such as transit or port authority law enforcement agencies. Limitations in the use of these data are detailed at http://www.fbi.gov/about-us/cjis/ucr/ ucr-statistics-their-proper-use
While there are limitations to the UCR, they are freely available and easy to analyze. The procedure below shows how to download and analyze the UCR. These steps will enable a health depart ment to prioritize partnerships with local law enforcement agencies and other community groups. For organizations in California, the California Department of Public Health Healthy Community Indicators project has already cleaned and compiled UCR data for all places in California that report to the UCR.
STEP 01. Download the table “Offenses Known to Law Enforcement” by state and city (table 8) in an Excel spreadsheet for the most recent year (2011 at the time of printing) from the FBI website http://www.fbi.gov/about-us/cjis/ucr/crime-in-the-u.s.
First click on the year of interest:
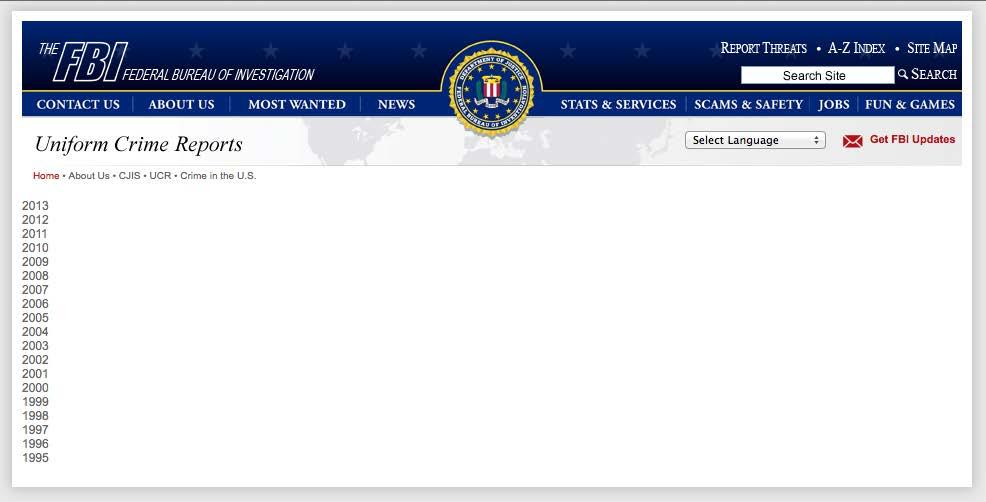
Then, click on “Offenses Known to Law Enforcement.”
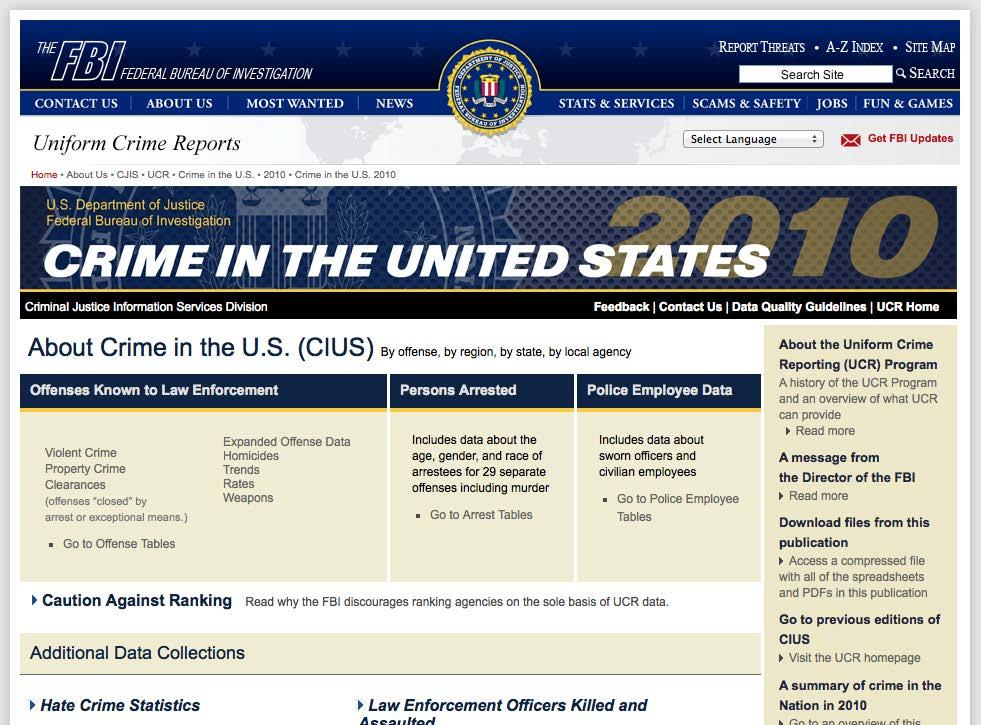
Then, click on Table 8, and click on California. There is a link that says “Download Excel.”
STEP 02. Obtain the total number of people living in your county/region from the 2010 Census. For the Bay Area, 7,391,453 people in 2010.
STEP 03. Identify the cities in your county/region
STEP 04. From the downloaded spreadsheet in Step 01, calculate the following statistics based on the variables in the UCR “violentcrime” and “population.”
A. Violent crime rate per 1,000 residents
Rate = violent crime population * 1000
B. Standard error, Poisson distribution (SE)
SE = violent crime Population
C. Lower 95% confidence limit
LL_95CL = Rate – (1.96 * SE)
D. Upper 95% confidence limit
UL_95CL = Rate + (1.96 * SE)
E. Relative standard error (RSE)
RSE = SE Rate
STEP 05. Sort the spreadsheet to rank from highest to lowest for each city’s violent crime rate per 1,000 inhabitants in your jurisdiction.
STEP 06. Calculate a cumulative total or running total of the population.
STEP 07. Identify the cities with the highest rate of crime and whose cumulative population approaches 10% of the jurisdictions’ population. (This 10% cutoff is arbitrary, but
it serves as a good starting point for analysis absent other methods.) Health depart ments should routinely monitor those cities and approach law enforcement and other community organizations for long-term violence prevention interventions. Using this method for the Bay Area, the cities of Oakland, Emeryville, Richmond, Antioch, East Palo Alto, and San Pablo (highlighted in yellow) would serve as priority cities.
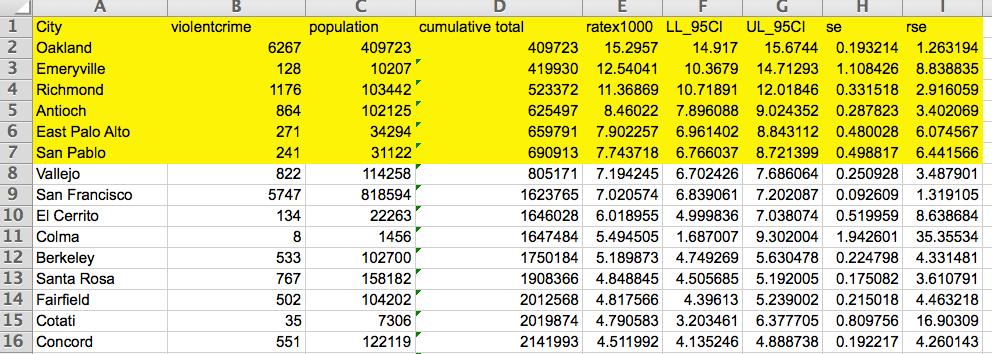
STEP 08. Consider excluding the places identified in Step 07 with fewer than ten violent crimes per year, a low population, a wide 95% confidence interval and/or a relative standard of error (variable: RSE) >30%. A jurisdiction’s crime rate and population that meet any of these criteria are considered unstable and should be interpreted with caution. For example, the City of Colma, although its violent crime rate places in the top ten in the Bay Area, meets all of the unstable data criteria.
STEP 09. For each priority city, download UCRs from previous years (Step 01) and construct a trend graph showing changes in violent crime over time.
STEP 10. Identify the priority cities with no decrease or little increase in violent crime over time. Based on these criteria, the cities of Antioch and Richmond should be priori tized for further health department, law enforcement, and other stakeholder inter ventions if they are not already.
STEP 11. Identify local agencies and institutions in the priority cities (step 7) for potential partnership.
FIGURE 25: RATE OF VIOLENT CRIME, ANTIOCH, 2006 TO 2010
FIGURE 26: RATE OF VIOLENT CRIME, EAST PALO ALTO, 2006 TO 2010


FIGURE 27: RATE OF VIOLENT CRIME, EMERYVILLE, 2006 TO 2010

FIGURE 28: RATE OF VIOLENT CRIME, OAKLAND, 2006 TO 2010

FIGURE 29: RATE OF VIOLENT CRIME, RICHMOND, 2006 TO 2010

FIGURE 30: RATE OF VIOLENT CRIME, SAN PABLO, 2006 TO 2010

Use of indicators and other data obtained through interagency cooperation has been crucial to the success of the East Palo Alto Fit Zone project. East Palo Alto is identified as a priority city in the Bay Area by the UCRs. The UCRs cannot, however, identify where within the city to plan interventions. Consequently, cooperation between community, law enforcement, and health agencies is needed to identify the high-crime areas to best direct resources.
Through this cooperation, the San Mateo County Health Department obtained and ana lyzed gunshot time and location data provided by the East Palo Alto Police Department’s shot-spotter system. This analysis—combined with disease prevalence data from the Raven swood Family Health Center and a survey conducted by the UC Berkeley Center for Law and Social Policy—identified two neighborhoods for Fit Zone activities. These activities, funded by the California Endowment, include police officers leading fitness classes, field games, and bike rides as they provide security in the Fit Zones. In addition, health navigators from the Ravenswood clinic educate parents on site about nutrition and other healthy behaviors.
While this project is only in its ninth month at the time of this writing, preliminary results are encouraging. The frequency of gun shots in the Fit Zones have declined, police officers report more positive interactions with youth, and residents have more opportunities for physical activity and health education. Furthermore, the project is partnering with com munity organizations to identify Fit Zone residents who can eventually lead activities. The project has its challenges, and questions about its long-term effectiveness and sustain ability exist. Nevertheless, the East Palo Alto Fit Zone Project is a promising real-world example of how interagency collaboration and the health department’s application of at least one essential service “diagnose and investigate” led to an innovative intervention to improve social cohesion, address violence, and promote physical activity.
Access to employment, housing, and healthcare resources for people reentering our communities from the criminal justice system can make a big impact on their health and the health of our communities. It can also reduce recidivism, or the likelihood that someone will return to the criminal justice system. Because supporting successful reentry is critical
to the health of communities in Alameda County, the Alameda County Community Cor rections Partnership Executive Committee provided approximately two million dollars to support innovative approaches to reentry in 2013.
Staff from the Alameda County Public Health Department’s Place Matters Criminal Justice team are managing the funding process and the launch of Innovations in Reentry. This is a pilot grant program designed to spur innovative approaches to addressing the needs of the adult reentry population and reducing recidivism in Alameda County. The nine inaugural grantees are implementing programs in vocational training and entrepreneurship, mentor ing, fair chance employment, and disease management.
While grantees may focus on services or policy, this project is an opportunity to advance criminal justice policy goals and influence larger criminal justice-related funding decisions.
For additional information on funded programs, visit http://www.innovationsinreentry. org/Grantee-Profiles.
EpiCenter: California Injury Data Online. 2013. Assault/Homicide. Sacramento, CA: California Department of Public Health. http://epicenter.cdph.ca.gov/ReportMenus/InjuryDataByTopic.aspx Accessed February 2013.
Fowler PJ, Tompsett CJ, Braciszewski JM, Jacques-Tiura AJ, Baltes BB. 2009. Community Violence: A Meta-analysis on the Effect of exposure and Mental Health Outcomes of Children and Adolescents. Development and Psychopathology 21(1):227-259.
Takagi D, Ken’ichi I, Kawachi I. 2012. Neighborhood Social Capital and Crime Victimization: Comparison of Spatial Regression Analysis. Social Science & Medicine 75(10):1895-1902.
Education is linked to health outcomes in many ways. It provides individuals with knowledge and cognitive abilities to make healthier behavioral choices. It often leads to increased employment at higher income levels and in safer, healthier working conditions. It also provides social and psycho logical benefits, which increase problem-solving skills, teamwork, internal locus of control, social support, and other life skills that help people navigate risks and provide a foundation for improved health outcomes over a lifetime. Despite the complexity of the multiple factors that link education to health, staying in school to graduate is one of the strongest predictors of health, regardless of the school environment or the quality of the education. For these reasons, the high school gradua tion rate was chosen to best represent the effect of educational attainment as a SDOH.
Research demonstrates that educational attainment level is linked to a variety of health outcomes. Individuals without a high school diploma not only have higher incidences of risk behaviors (e.g., smoking, drinking), chronic disease (e.g., obesity, cancer, heart disease, diabetes), and other nega tive health outcomes (e.g., infant mortality), but they also have higher mortality rates and shorter lifespans compared with high school graduates. Health burdens due to low educational attainment disproportionately influence African Americans/Blacks, Hispanic/Latinos, and other race/ethnici ties who are negatively affected by high dropout rates and the educational achievement gap. It is estimated that approximately 245,000 (10%) of the 2.4 million U.S. deaths in 2000 were attribut able to low education. The mortality rates of high school dropouts 25 to 64 years are more than twice as high as those with some college education.
High school graduates earn more money than those with a general education degree (GED) or the same number of years of schooling but no diploma, which can lead to more access to resources and healthier work and living conditions. Earning a higher income provides the ability to purchase health care, have access to better housing and schooling, and engage in recreational activities, resulting in a better quality of life.
The causal relationship between education and health goes in both directions. For example, the mental and physical health of students and their families are major factors that affect the ability of children to learn and graduate. Studies show that children in poor health miss more days of school, have a higher likelihood of dropping out, and are more likely to become unhealthy adults. Some of the factors leading to school dropout are directly related to socioeconomic status. For example, students who work more than 20 hours a week to support their family, have low Englishlanguage proficiency, or who otherwise lack social or parental support are more likely to drop out than their peers.
In addition, because most public schools in the United States are funded by the assessed value of property (property taxes), schools in poorer communities often do not have the same resources to maintain a school climate that is as healthy and as conducive to learning as wealthier com munities. Wealthier communities are able to provide other essential components of a healthy school climate beyond teachers and schools supplies, which include healthy food, opportunities for physical activity, and psycho-social support services. To be able to achieve academic success, students need to feed their brains and bodies with nutritious food options at school. Since many students consume more than half of their meals at school, it is essential that healthy options are readily available. When children consume healthy diets, optimal growth and development are pro moted. When they eat a healthy breakfast, the associated benefits are improved mood, cognitive functioning, memory, and reduced absenteeism. A positive school climate has also been linked to students having a stake in caring for the school, as well as fewer behavioral and emotional chal lenges in students. This is because a positive school climate includes established norms and expec tations that enable students to feel physically and emotionally safe and supported by those in their environment.
The methods to download data from the American Community Survey are in Appendix B. Census tracts with low educational attainment are identified using the Jenks natural breaks method in the map below. For example, this method identifies with red Census tracts in the city of San Pablo (Contra Costa County) as having low educational attainment. Therefore, this area should be desig nated as a priority area for further public health monitoring. The chart following shows changes in educational attainment for this city over time compared with the Bay Area. Trend analysis was conducted for San Pablo with the lowest overall educational attainment. From 2000 to 2007, the city experienced an increase in educational attainment, but returned to its 2000 level from 2007 to 2010. These changes are not statistically significant.
FIGURE 31: EDUCATIONAL ATTAINMENT, BARHII REGION, 2006–2010
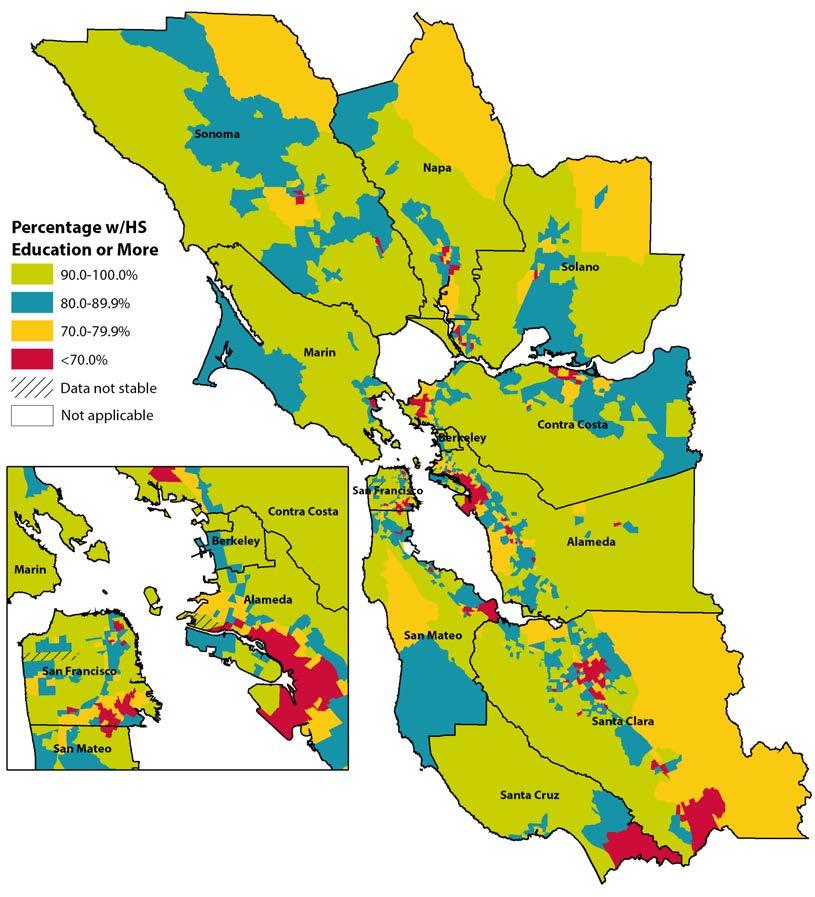
FIGURE 32: EDUCATIONAL ATTAINMENT, BARHII REGION AND SAN PABLO, 2000 TO 2008–2010
80%
60%
100% S Education 20%
P
40%
60% Percentage HS E d
BARHII Region
San Pablo 0% 2000 2005-20072008-2010
CARECOACHING MODEL FOR THE SOBRANTE PARK YOUTH ACTION PROJECT Alameda County Public Health Department
The CareCoaching 4 Sobrante Park Youth (SPY)–Action Project began in 2010 in response to the 60% high school graduation rate in Oakland Unified School District. The project addresses discriminatory beliefs, institutional power, social inequities, and risk factors as a way to encourage and promote educational attainment. In addition to the Bay Area Regional Health Inequities Initiative framework, project staff used several proven models to create an appropriate mix of services to meet the needs of the youth and implemented a program with four components: (1) care coaching—an intensive, one-on-one approach to assist youth participations with academic and social prerequisites for graduation and post-graduate plans; (2) skill-building educational workshops; (3) community engagement and positive role modeling; and (4) educational field trips. These services motivate youth to focus on their future and to ensure that they have the tools to successfully complete the program, earn their high school diploma, and create a plan to enter college or a vocational training program after high school.
Results of the project are encouraging. Five seniors who participated in the program all graduated high school and have a clear plan for after high school. Furthermore, 11 low erclassmen identified a career that interests them through the intensive care coaching and workshops that were provided.
Since 2013, the Alameda County Public Health Department has leveraged lessons learned from the project and other youth interventions and brought economic development resources to expand and replicate the CareCoaching model countywide. For example, to provide psycho-social support, the project added a mental health specialist. Each youth is assessed by this specialist to identify psycho-social needs and offer appropriate support. In addition, the project supports the participant through continuous meetings with their principal, teachers, and family to develop, implement, and monitor plans to ensure wellbeing and academic achievement. The project is currently being piloted at the East Oak land Boxing Association, which helps Oakland youth achieve success in school, learn life skills, and build self-esteem in preparation for their future.
Chronic health conditions, especially asthma, often contribute to chronic absenteeism among students. The ACPHD Place Matters Criminal Justice Workgroup, the ACPHD Chronic Disease Program, and the Alameda County District Attorney’s Office created a case management component for the Alameda County truancy court—a court where the prosecutor, judge, and case managers work with parents of chronically absent children to improve school attendance. A process is now in place where judges can refer families with chronic disease issues to the county’s chronic disease program for case management. This has improved attendance. Asthma Start and partners are now exploring partnerships with local school districts to address truancy problems related to chronic disease earlier through a new project, Addressing Chronic Absenteeism. This effort aims to improve children’s health, reduce absenteeism, and improve children’s educational outcomes, which are di rectly linked to long-term health outcomes. For more information, visit http://www.acphd. org/asthma.aspx
Alameda County Public Health Department
With funding from the W.K. Kellogg Foundation, ACPHD staff from Place Matters, the City–County Neighborhood Initiative, and the Community Assessment, Planning, and Evaluation (CAPE) Unit conducted a health impact assessment (HIA) on funding for mulas for the Oakland Unified School District (OUSD). The HIA specifically looks at how modifying the current results-based budgeting formula to include a weighted student formula would decrease education inequities and the resulting health inequities.
The HIA considers different ways of addressing equity in school funding to improve academic performance through teaching quality, family and student engagement, improving
access to health and support services at schools, and providing safer school environments. Staff presented this information to OUSD stakeholders, parents, and caregivers in the Oakland Housing Authority’s leadership program. They also provided the information to organizations that worked on passing a weighted student formula at for the state of Cali fornia, which was successful in July 2013. For more on this HIA, visit http://www.acphd. org/social-and-health-equity/policy-change/place-matters/workgroups/education.aspx or http://www.healthimpactproject.org/resources/body/Brandon-ACPHD.pdf.
APPLYING SOCIAL DETERMINANTS OF HEALTH INDICATORS TO ADVANCE HEALTH EQUITY
Adler NE, Newman K. 2002. Socioeconomic Disparities in Health: Pathways and Policies. Health Affairs 21(2):60-76.
Cameron SV, Heckman JJ. 1993. The Nonequivalence of High School Equivalents. Journal of Labor Economics 11(1):1-47.
Ross CE, Wu C. 1995. The Links Between Education and Health. American Sociological Review 60(5):719745.
Ross CE, Wu C. 1996. Education, Age and the Cumulative Advantage in Health. Journal of Health and Social Behavior 37(1):104-120.
Centers for Disease Control and Prevention. 2014. Nutrition and the Health of Young People. http://www. cdc.gov/healthyyouth/nutrition/facts.htm. Accessed October 2014.
Cutler D, Lleras‐Muney A. 2006. Education and Health: Evaluating Theories and Evidence. National Poverty Center Working Paper Series 06-19. http://www.npc.umich.edu/publications/workingpaper06/paper19/ working-paper06-19.pdf. Accessed October 2014.
Delong JB, Katz L, Goldin G. 2003. “Sustaining U.S. Economic Growth,” in H. Aaron, J. Lindsay, and P. Nivola, eds., Agenda for the Nation. Washington, D.C.: Brookings Institution Press.
National Poverty Center. 2007. Education and Health. Policy Brief 9. http://www.npc.umich.edu/ publications/policy_briefs/brief9/policy_brief9.pdf. Accessed October 2014.
Freudenberg N, Ruglis J. 2007. Reframing School Dropout as a Public Health Issue. Preventing Chronic Disease 4(4).
Let’s Move. 2014. http://www.letsmove.gov/. Accessed October 2014.
Marshall M. Center for Research on School Safety, School Climate, and Classroom Management. Georgia State University. 2014. http://schoolsafety.education.gsu.edu/publications/. Accessed October 2014.
National School Climate Center. 2014. http://www.schoolclimate.org/climate/. Accessed October 2014.
Promising Practices Network. 2011. Promising Practices for Promoting High School Graduation. http://www. promisingpractices.net/briefs/briefs_highschoolgrad.asp. Accessed October 2014.
The National Bureau of Economic Research. The Effects of Education On Health. http://www.nber.org/ digest/mar07/w12352.html. Accessed June 2013.
SOCIAL DETERMINANTS OF HEALTH INDICATORS TO ADVANCE HEALTH EQUITY
Political participation can be associated with the health of a community through two possible mechanisms: through the implementation of social policies or as an indirect measure of social capital. Political participation is directly related to the socioeconomic status and other demo graphic characteristics of individuals, with lower levels of participation observed in people with low income and low education levels. Disparities in political participation across socioeconomic groups matters for political outcomes; additionally, the resulting policies could have an impact on the opportunities available to the poor to live a healthy life. Lower representation of poorer voters could result in reductions of social programs aimed toward supporting disadvantaged groups. Although there is no direct evidentiary connection between voter registration or participation and health, there is evidence that populations with higher levels of political participation also have greater social capital. Social capital refers to the existence of trust and mutual aid among the mem bers of a society and high participation of its members in civic associations. There is evidence of a positive association between social capital and lower mortality rates and higher self-assessed health ratings. This linked knowledge allows inferring that there could be more favorable public health outcomes in populations with higher political participation.
There are multiple measures of social capital including participation, reciprocity, trust, and social support systems. Multiple studies have found that higher social capital, regardless of measure, consistently increases the odds of self-reported good health and other favorable health outcomes. In one study, the likelihood of mortality was more than double among people who lacked social and community ties (low social capital), after adjusting for age and self-reported health status and practices. Levels of political participation are negatively correlated with levels of mistrust, which is an indication of depletion in social capital. Certain social and health outcomes among African Americans/Blacks—like the graduation rates and suspension rates of students and infant mortal ity rates—were found negatively correlated with minority diversity by state in the United States, which could be related to lack of political support for policies that support minorities.
Note to LHDs in California: The California Department of Public Health’s Healthy Communities Data and Indicator (HCI) project has already collected, cleaned, and compiled these data for this indicator for California, which can be found at http://www.cdph.ca.gov/programs/Pages/Healthy CommunityIndicators.aspx. For instructions on how to download and filter data from the HCI,
see Appendix D. For jurisdictions outside of California, it is possible to obtain voter registration and participation data from the local registrar of voters or secretary of state.
To determine voter registration rates, these data can be geocoded and compared to Census 2010 data, which has the population 18 years and older by geographic area. One limitation of this method is that the data are not adjusted for non-citizens, felons in prison, and supervised felon parolees. For California, these categories make up 15.8% of the voting age population. One way to adjust for felons in prison would be to subtract out those persons in correctional institutions, available in Census 2010. These data are not available in the American Community Survey.
To calculate voter participation rates, the data are more straightforward. The data from the regis trar of voters has the information on whether individuals voted in the last, and sometimes previ ous, election. Geocoded data, then, will include both the numerator and the denominator for the geographic area of interest.
Estimates of the number of people who are eligible to vote were obtained from the California Secretary of State’s Reports of Registration (15 days prior to a general election) for counties and the state. The eligible population of voters is the number of individuals in the population that are 18 years and older, are citizens and not felons in prisons or supervised felon parolees. Eligible popula tion is obtained by subtracting from population counts published by the California Department of Finance, the population that is 17 years or below, non-citizens, felons in prison, and supervised felon parolees. Complete enumeration data at the Census block level on the number of people 18 years and older who registered to vote and those who voted in the general elections was ob tained from the statewide database. Data was aggregated into Census tracts, cities/towns, counties, regions, and the state. Regional estimates of the population eligible to vote were also obtained. Decile rankings of places and relative risk in relation to state average were calculated. Addition ally, information on the population 18 years and older or voting age population (VAP) for the state and counties was obtained from the Department of Finance for all years available is included for those interested. Estimates of the VAP for cities/places and Census tracts were obtained from Census 2010.
Voter registration is determined using the number of individuals who are eligible to vote and registered to do so. Registered voters can be expressed as a proportion of the eligible population. Voter participation is calculated by assessing the number of individuals who voted in the most re
cent election among those registered to vote, and can be expressed as a percentage of all registered voters.

After downloading and filtering the data downloaded from the HCI project as explained in the note to health departments in California above, the chart below displays percentages of voter participation in BARHII member counties, which include all counties in the Bay Area and Santa Cruz.
Figure 34 shows voter participation in places (i.e., towns and cities) in Napa County. These data were downloaded from the same dataset in example one but filtered to display places in Napa County. MoskowiteCorner Deer Park Calistoga Angwin American Canyon
FIGURE 34: VOTER PARTICIPATION, NAPA COUNTY CITIES AND PLACES, 2008
THE CITY–COUNTY
INITIATIVE Alameda County Public Health Department
The City–County Neighborhood Initiative (CCNI) in the Sobrante Park neighborhood of Oakland is staffed by members of the Alameda County Public Health Department (ACPHD) and the City of Oakland. The CCNI is a community-building effort aimed at empowering the residents. The Sobrante Park Resident Action Council (RAC) made sever al efforts to encourage voter registration and promote education of issues on the ballot. The RAC went door to door in the neighborhood, handing out 837 voter registration forms. In addition, the RAC held voter education forums with the local League of Women Voters (LWV) chapter. The community also held debates on local issues and a candidate night.
Baum FE, Bush RA, Modra CC, Murray CJ, Cox EM, Alexander KM, Potter RC. 2000. Epidemiology of Participation: An Australian Community Study. Journal of Epidemioly and Community Health 54(6):414423.
Berkman LF, Syme SL. 1979. Social Networks, Host Resistance, and Mortality: A Nine-year Follow-up Study of Alameda County Residents. American Journal of Epidemioly 109(2):186-204.
Braveman PA, Egerter S, Woolf SH, Marks JS. 2011. When Do We Know Enough to Recommend Action on the Social Determinants of Health? American Journal of Preventive Medicine 40(1S1):S58-S66 .
Gilbert KL, Quinn SC, Goodman RM, Butler J, Wallace J. 2013. A Meta-analysis of Social Capital and Health: A Case for Needed Research. Journal of Health Psychologygy 18(11):1385-1399.
Hero RE, Tolbert CJ. 1996. A Racial/ethnic Diversity Interpretation of Politics and Policy in the States of the U.S. American Journal of Political Science 40(3):851-871.
Kawachi I. Social capital and community effects on population and individual health. Ann N Y Acad Sci 1999; 896: 120-130.
“Social capital” refers to those features of social relationships—such as interpersonal trust, norms of reciprocity, and membership of civic organizations—which act as resources for individuals and facilitate collective action for mutual benefit. It refers to the social, non-economic resources avail able to people through their relationships with others as being part of social groups, networks, or communities. There is no single accepted definition of social capital. Labeling it as “capital” gets at its central idea: that social relations and connections can be a resource to people, separate from the direct control of economic resources (or economic capital). It can be conceived as a character istic of individuals but is usually considered to be a collective property of communities or groups, which is how it is used here.
Social capital is important to community participation in improving health or eliminating dispari ties, because it is an important feature allowing collective community action to improve local con ditions. It may help communities with few economic resources help each other get by, especially in times of economic downturns or dislocations. Communities with more social capital may have greater capacity to mobilize for social, political, or interpersonal actions to improve their health conditions.
The availability of benefits of social capital to community members might be unevenly distributed through processes of social inclusion or exclusion, including discrimination, in which case that part of the population may be more in need of such mobilization, but possibly less likely to par ticipate and be represented in such actions.
Social capital has long been studied by social scientists who have characterized it in various ways, including its structural, relational, or cognitive dimensions; or bonding (intragroup) or bridging (intergroup) social capital. Social capital (or components of it) can be measured as distributions of individual-level, community, social relational characteristics (e.g., neighborhood trustworthiness or willingness to provide mutual aid), or by community-level, structural indicators like levels of civic organizational capacity or participation. It has become much more widely used as an important social determinant of health in the past decade or so. Health research has commonly measured the relational dimension of social capital, based on the character of social ties: e.g., trust, reciprocity, cooperation, or identification with a group or network.
There are at least three ways in which assessing social capital can be important for monitoring or intervening on conditions affecting health and health inequities:
• As a factor related to health outcomes, either directly or as a moderating or exacerbating factor in the health impacts of other living conditions.
• As a real or potential resource in the capacity to mobilize communities to participate in health interventions on their own behalf.
• As another measure of the social inequities underlying health inequities across different parts of a local health jurisdiction’s population.
The concept of social cohesion is closely related to social capital—many of the components of social capital mentioned above overlap with components of measures of social cohesion. Cohe sion generally refers to the degree of shared commitment to a common task and to the group. The European Organization for Economic Cooperation and Development conceptualizes social capital as related to social inclusion (the extent to which no parts of the population are systematically excluded from access to community resources, often through acts of discrimination) and social mobility (the capacity of members of disadvantaged populations to improve their conditions) in that these three characteristics are needed to produce a socially cohesive society. Social exclusion can make community social capital less available to some parts of the community, or concentrate some excluded groups into communities with less social (and economic) capital. Thus, the distri bution of access to social capital is a key component of social and health inequity.
High ratings on measures like trusting neighbors or seeing them as willing to help each other can be interpreted through either a social cohesion lens to mean people feel a common commitment to each other, or through a social capital lens to mean that they are more likely to see others as a resource and potentially to use or work with them for an individual or common purpose.
When a person’s particular relationships, through their social networks, provide them with one or several individuals who can provide them various kinds of resources, then it is generally referred to as social support. Individuals in communities with low levels of social capital may still get needed personal support through their personal social connections, but may find it difficult to act together as a community on their own behalf to improve conditions.
Social support can include a number of separate dimensions (e.g., emotional, informational, ap praisal, or tangible support) that have been found in research to be related to health, including physical health and mortality but most strongly to psychological well-being and social function ing. It is measured by questions asking about the availability to the person of someone to provide the type of support of interest, either in general or in times of need (see the Maternal and Infant Health Assessment questions in Table 4).
Dimensions of individuals’ social support (including networks, connections, or isolation) have been measured and found to be associated with increased risk or protection from various physical and mental health outcomes in different populations. Those dimensions include:
• Structure of relationships (e.g., partner, family, friend, co-workers).
• Quality or intensity of relationship (e.g., good or poor, frequent or infrequent, routine interac tions or availability in time of need).
• Function of relationship (e.g., positive interactions, relaxation, emotional support, tangible support).
Studies have shown that different components of social support matter differently to the risk of ill health or recovery of different parts of the population (such as men or women, low income or high income, older or younger) or in different contexts (such as for those experiencing stressful life events, job strain, or economic insecurity).
Evidence suggests that social support and social capital might affect health either directly, or through moderating effects on the likelihood that certain conditions (such as low income, job strain, economic insecurity, or other stressful experiences) can produce ill health or influence recovery from it. In addition to its impact on adults, there is evidence that social capital influences the health and well-being of children and adolescents and at least the mental health of the elderly. The potential impact of social capital has mostly been studied in low-income populations or neighborhoods. In disadvantaged populations with low levels of access to material resources, social capital or social support may be especially important to measure to identify vulnerability or resilience factors. The assessment of community social capital can help identify areas and subpopu lations of social exclusion and segregation. This offers the opportunity to improve factors such as trust, capacity, and social connections that, in return, could allow for improving access to existing social resources and for community mobilization to address concerns affecting health.
People’s experience of the availability of social capital and social support is an important com ponent of civil society in a democracy. It represents the feeling of being part of a society. That membership can help people find ways to meet their needs in ordinary or unusual circumstances that they cannot manage adequately by themselves with the material resources regularly available to them through family or work. Resources available through public programs may be economic resources, but are also like social capital in that they express (or their absence denies) the public’s will to provide resources to its members who are qualified for them.
There is no single accepted definition of social capital. Because of this and because several compo nents of both social support and social capital have been associated with different health risks or protections in different populations, there are not single, standardized measures of each. There is
also no source of population-wide data for either social capital or social support that is currently regularly available for California or Bay Area counties.
Nevertheless, both collective social capital and individual social support are important enough de terminants of health and health inequities to include them here despite the lack of a single defined indicator or population-level data source to recommend, as this guide does for the other SDOH.
In this case, we recommend:
(a) Long-term development of a common population-level data source, such as the California Health Interview Survey (CHIS), for social capital measures of community-level resources for social participation or action, and also for the availability to individuals of tangible, social or emotional social support.
(b) Short-term interim use and development of local data sources for information on social capital and social support for all or (especially vulnerable) parts of populations. Useful local sources may be available to cover the whole population periodically (such as CHIS 2003 or CHIS 2011–12), through individual county-level surveys (such as in San Mateo County or Santa Clara County), or for particular subpopulations (such as the MIHA survey of post-partum women or California Healthy Kids Survey (CHKS) surveys of school children).
Other subpopulation data may be available through sources like: public health nursing home visit assessments of social support needs for high-risk pregnant women; local targeted needs as sessments; or non-health related community satisfaction or characteristic survey, such as the San Francisco Controller’s regular survey of public satisfaction with and participation in community services.
Potential indicators of social capital that could be compared across socioeconomic environments include the number and density of community and voluntary organizations in a defined geograph ic area, and by the participation level of community members in these organizations. In addition, voter registration and participation can serve as markers for civic engagement and potential for engaging in collective action.
As discussed for indicators throughout this guide, data on social capital or social support should be analyzed by strata for which health inequities are known to exist, including race/ethnicity, income level, jurisdiction or neighborhood, age, and family type (especially single-person and single-parent households).
Some currently available data sources are shown in Table 4.
California Health Interview Survey (CHIS)
(Adults, 2011–2012)
http://ask.chis.ucla.edu/main/ default.asp
Trust (neighborhood, social cohesion section)
• People in this neighborhood can be trusted.
Reciprocity/cooperation (neighborhood, social cohesion section)
• People in my neighborhood are willing to help each other.
• You can count on adults in this neighborhood to watch out that children are safe and don’t get in trouble.
Safety (neighborhood, safety section)
• Do you feel safe in your neighborhood?
• In the past 12 months, have you done any volunteer work or community service that you have not been paid for?
• In the past 12 months, have you served as a volunteer on any local board, council, or organization that deals with community problems?
• In the past 12 months, have you gotten together informally with others to deal with community problems?
California Healthy Kids Survey (CHKS)
(School children, 2012) http://chks.wested.org /
School, home and peer environment
• Developmental supports at school & at home (Caring relationships, high expectations, opportunities for meaningful participation) School connectedness
• Scale (at school, feel: close to people; happy; part of school; teachers treat students fairly; safe)
Maternal & Infant Health Assessment (MIHA)
(Post-partum Women, 2011, 2012)
http://www.cdph.ca.gov/data/ surveys/MIHA/Pages/Maternalan dInfantHealthAssessment%28MI HA%29survey.aspx
(See the chapter on voter registration and participation in this guide.)
• During your pregnancy, did you have someone you could turn to if you needed practical help, like getting a ride somewhere, or help with shopping or cooking a meal?
• During your pregnancy, did you have someone you could turn to if you needed someone to comfort or listen to you?
Voter registration and participation
• Percent registered/eligible
• Percent voted in the last presidential election/registered
Several existing local health-related programs involve building social capital and social support. Emergency preparedness builds on or tries to build up social cohesion so it is a resource (social capital) that can be mobilized in emergencies through neighborhood teams and other aspects of volunteering and providing mutual assistance. Public health nurses in home visits to high-risk pregnant women assess their level of social support or isola tion and try to connect those in need to community resources. Black Infant Health (BIH) has recently moved to a group-based model of participation, partly to improve the level of interpersonal and community connections of participants. The CenteringPregnancy model provides group prenatal care, which promotes participants’ becoming interpersonal resources for each other both during and after the life of the group. The below example explicitly addresses neighborhood social capital.
In 2003, the Oakland CCNI was formed as a partnership between the Alameda County Public Health Department, the City of Oakland, and a broad range of community-based organizations and neighborhood resident groups. The initiative’s long-term goal is to fight health inequities in two low-income areas of Oakland, California. CCNI partners include resident groups, community-based organizations, faith-based organizations, educational institutions, and the Oakland Unified School District. Using a community resident engage ment approach, public health and city agency staff work closely with groups of residents to increase their social, economic and political power.
Since research has demonstrated the correlation between social capital and neighborhood health and safety, building social capital among community residents has been an impor tant implementation strategy. CCNI evaluation has tracked the development of social capital at baseline and throughout the intervention using qualitative and quantitative methods, including one-on-one interviews with stakeholders, and community-wide surveys.
Evaluation findings over the first six years of the project indicate that three types of social capital have been built:
• Bonding relationships between immediate family members, neighbors, and close friends.
• Bridging relationships with people who are from different family and peer groups.
• Linking relationships between individuals and those in higher positions of influence outside of the community.
Community members have influenced city and county level policymakers to make policy changes, particularly related to street safety and neighborhood parks.
Evaluation findings further indicate that residents have become more empowered, as demonstrated by increased leadership, greater involvement in neighborhood events and stronger linkages with each other, community groups, and institutions. Neighborhoods have improved, as indicated by greater access to health-promoting resources (such as im munizations and good schools), decreased crime, increased disaster preparedness, renovated parks and open spaces and increased traffic safety. Residents have also perceived that City and County institutions have become more responsive to their needs. The Robert Wood Johnson Foundation highlighted this effort as a great example of how to engage partners and “pillars of the community”; http://www.rwjf.org/en/blogs/new-public-health/2012/10/ engaging_partnersan.html. For more information, visit http://www.acphd.org/social-andhealth-equity/partnerships-and-communities-collaboration/ccni.aspx
Nyqvist F, Forsman AK, Giuntoli G, Cattan M. 2013. Social Capital as a Resource for Mental Well-being in Older People: A Systematic Review. Aging & Mental Health. 17(4):394-410.
Kawachi I, Berkman LF. 2000. “Social Cohesion, Social Capital, and Health.” In L Berkman and I Kawachi, eds. Social Epidemiology. Oxford.
Lantz PM, Pritchard A. 2010. Socioeconomic Indicators that Matter for Population Health. Preventing Chronic Disease 7(4):A74.
Berkman Lf, Glass T. 2000. “Social Integration, Social Networks, Social Support, and Health.” In L Berkman and I Kawachi, eds. Social Epidemiology. Oxford.
Winters L, McAteer S, Scott-Samuel A. 2012. Assessing the Impact of the Economic Downturn on Health and Well-Being. Liverpool Public Health Observatory, Observatory Report Series No. 88.
MacArthur Network (I. Kawachi in collaboration with the Social Environment Working Group). 2000. Social Capital http://www.macses.ucsf.edu/research/socialenviron/capital.php. Accessed April 2014.
OECD. 2011. Perspectives on Global Development 2012: Social Cohesion in a Shifting World. OECD Publishing.
Vyncke V et. al. 2013. Does Neighbourhood Social Capital Aid in Levelling the Social Gradient in the Health and Well-being of Children and Adolescents? A Literature Review. BMC Public Health 13:65. http://www.biomedcentral.com/1471-2458/13/65. Accessed October 2014.
In 2011 in California, 25% of children in immigrant families and 2% of children in United States (US)-born families were in households in which no person 14 years or older speaks only English, and no person 14 years or older who speaks a language other than English speaks English “very well.” The adults and children in these linguistically isolated households have both cultural and language barriers to accessing important services such as health care, social services, utilities, fi nancial services, voting, and education—including available and affordable English as a Second or Other Language (ESOL) classes.
Children’s cognitive scores can be considerably affected by living in a household with linguistic isolation, which is largely influenced by the greater likelihood of people living in poverty in these homes. There are numerous benefits to immigrants who can speak the official language of their new country of residence, especially in regards to employment opportunities and economic suc cess. In addition, studies in the United States show that learning English provides non-economic social capital and that there is a connection between language and social power.
The relationship between linguistic isolation and morbidity and mortality outcomes is complex. At the national and local level, immigrants (many of whom do not speak English) tend to have a longer life expectancy and lower burden of chronic disease morbidity. However, living in a community that is linguistically isolated decreases the social and political power of the individu als within that community and limits access to resources to which those individuals are entitled. Across time and generational status, health outcomes may be affected negatively for individuals living in these communities.
Data about linguistically isolated Census tracts are available from the American Community Sur vey (ACS). For detailed instructions with screen shots on how to download and analyze ACS data and an extended technical discussion of the features and limitations to the ACS, see Appendix A.
For those familiar with ACS data, the map below shows areas in Contra Costa County with a high prevalence of people 14 years or older where no one 14 years or older speaks English only
* The U.S. Census Bureau decided to eliminate the phrase “linguistic isolation” from its terminology starting in 2011. The Bureau explains: “We have changed the terminology to one that we feel is more descriptive and less stigmatizing. The phrase that will appear in all new products will be Households in which no one 14 and over speaks English only or speaks a language other than English at home and speaks English ‘very well.’”
EQUITY
Percentage of people in households where no one 14 years or older speaks English only or speaks English very well
or speaks English very well. These data are five-year estimates from the 2011 ACS table number S1602, mapped using ArcGIS at the Census tract level. We believe maps that assign warmer or more intense colors to Census tracts with more adverse SDOH indicators (i.e., graduated sym bols) are among the most convincing and understandable ways to present place-based SDOH data to stakeholders and the general public. Of the many ways to group Census tracts in ArcGIS, we find natural breaks and geometrical interval to be the most useful, as they are both good at show ing the range of values and the existence of outliers. ArcGIS software typically creates five classes of graduated symbols by default, which we believe is sufficient. For a detailed discussion on map ping Census data, see Appendix A.
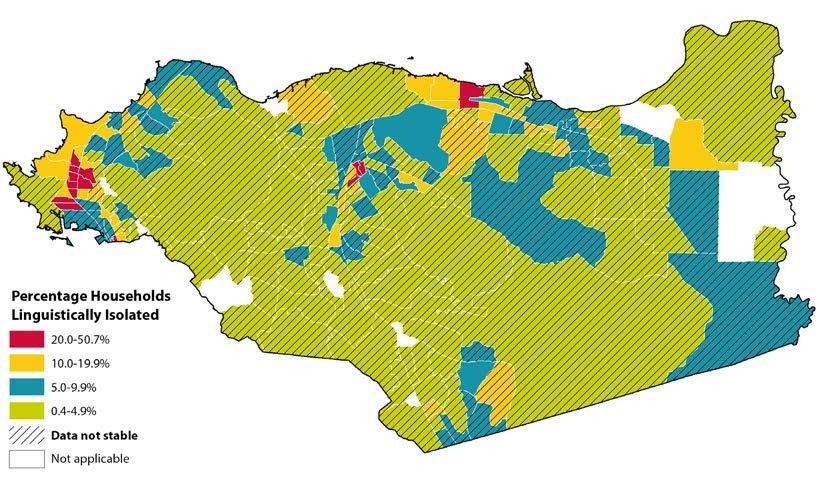
STEP 01. Using the downloaded data, apply the following formula to calculate the standard error for the published proportion.
SE p = MOE p 1.645
SE p is the standard error of the percentage of households where no one speaks English at home or “very well” age 14 and higher (HC01_EST_VC01)
MOE p is the margin of error for the proportion of households where no one speaks English at home or “very well” age 14 and higher (HC01_MOE_VC01)
STEP 02. Calculate the coefficient of variation using this formula.
CV p = SE p percentLI *100
CV p is the coefficient of variation for the percentage.
SEp is the standard error of the proportion of households with linguistic isolation (calculated in Step 1).
percentLI is the proportion of households with linguistic isolation (where no one speaks English at home or “very well” age 14 and higher (HC01_EST_VC01).
STEP 03. Display and interpret Census tracts with a coefficient of variation (CV) below 30% and display Census tracts with a CV slightly greater than 30% (e.g., 32%) with cau tion. For Census tracts with a coefficient of variation substantially greater than 30% (e.g., 80%), one of the following is recommended: 1) do not display those Census tracts, 2) clearly indicate those Census tracts on any map or table and include the fol lowing language: “Data from these Census tracts are statistically unstable and unreli able, interpret with caution.”
PHONE is a network of local community and faith-based organizations that help communicate important health and safety messages to the people they serve during public health emergencies. Napa County Public Health developed PHONE to better deliver public health and safety messages to populations that are harder to reach through mainstream me dia and other typical communication channels, including those who are English language learners and who come from households in which no one 14 years or older speaks English only or speaks English very well.
Trust plays an important role in how people receive messages during an emergency. People tend to rely on individuals and organizations they already know for information more than outside sources, such as the government or mainstream media. The goal of PHONE is to develop and maintain communication channels that may be used during a public health emergency to quickly deliver messages to protect the health and safety of Napa County residents. The network includes a number of organizations that serve Napa County’s monolingual Spanish-speaking population.
During an emergency, Napa County Public Health activates PHONE by sending an alert with critical public health information to PHONE members by phone, email, or another appropriate channel. Upon receipt of the information, PHONE members are respon sible for delivering information to their population group(s) or networks of people who can further deliver the message as a trusted source of information and in a format that is easy for people to understand. For more information, visit http://www.countyofnapa.org/ publichealth/phone/.
Annie Casey Foundation’s Kids Count Website. 2014. http://datacenter.kidscount.org/. Accessed January 2014.
Glick JE, Walker L, Luz L. 2013. Linguistic Isolation in the Home and Community: Protection or Risk for Young Children? Social Science Research 42(1):140-154.
Nawyn SJ, Gjoka L, Agbenyiga, DL, Grace B. 2012. Linguisitc Isolation, Social Capital, and Immigrant Belonging. Journal of Contemporary Ethnography 41(3):255-282.
Park Y, Neckerman K, Quinn J, Weiss C, Jacobson J, Rundle A. 2011. Neighbourhood Immigrant Acculturation and Diet among Hispanic Female Residents of New York City. Public Health Nutrition 14(9):1593-1600.
U.S. Census Bureau. 2009. A Compass for Understanding and Using the American Community Survey Data, What Researchers Need to Know. Appendix 3. http://www.census.gov/acs/www/Downloads/handbooks/ ACSResearch.pdf. Accessed January 2014.
SOCIAL DETERMINANTS OF HEALTH INDICATORS TO ADVANCE HEALTH EQUITY
Poor air quality can contribute to adverse health outcomes. Exposure to higher levels of air pollution may increase the risk of developing health conditions such as heart disease, cancer, and respiratory illness such as asthma. Poor air quality can also exacerbate pre-existing health conditions in already vulnerable groups, such as asthma symptoms in children. Air pollution often results from high levels of ozone and particulate matter released into the environment from sources such as factories or cars. Air pollution is not equally distributed in communities. The burden of breathing in unhealthy air is often disproportionately borne by low income and communities of color, many of which are situated closer to busy highways, ports, factories, and other pollution sources.
Clean air is a fundamental building block of human health. Air pollution from fixed and mobile sources (e.g., factories and cars, respectively) is a complex mixture of gases, fumes, and particles released into the atmosphere from the combustion of fossil fuels and evaporation of solvents. Ozone that forms at the ground level and fine particulate matter (PM) are two indicators of air pollution that are linked to shortand long-term adverse health effects. PM that has an aerodynamic diameter of 2.5 microns or less is called PM2.5 and is capable of reaching deep into the lungs causing a host of diseases including lung cancer, heart disease, respiratory disease, and acute respiratory infections, particularly in children. In California, the Air Resources Board estimated that, given the PM2.5 levels between 2004 and 2006, over 9,300 deaths could be prevented each year if California met its current statewide PM2.5 standard of 12 µg/m3.
Based on numerous community-based epidemiologic studies, both short-term and long-term exposures to PM2.5 increase the risk of cardiovascular disease and mortality, and are linked to adverse respiratory out comes such as chronic obstructive lung disease, hospital and emergency department admissions for asthma, increased respiratory symptoms, altered pulmonary function, and pulmonary inflammation among asth matic children. While not definitive, evidence is accumulating for PM2.5 effects on low birth weight and infant mortality, especially due to respiratory causes during the post-neonatal period.
Note to LHDs in California: The California Department of Public Health’s Healthy Community Indicators (HCI) project has already collected, cleaned, and compiled these data for California from the California Air Resources Board, which can be found at http://www.cdph.ca.gov/programs/Pages/HealthyCommunityIn dicators.aspx. Appendix D explains how to download and filter these data. Counties outside of California may need to contact their state air quality resource board or equivalent agency.
The map below shows the annual mean ambient concentration of fine particulate matter for zip codes in the San Francisco Bay Area. Bay Area Regional Health Inequities Initiative (BARHII) recommends that analysis of this indicator be at the zip code level, which is the smallest level of geography available.
Geographic coverage was not complete because of the limited number and geographic extent of air qual ity monitoring stations. The uncertainty of the interpolated values increases with distance from the nearest monitor. According to the Air Resources Board, values for areas greater than 50 km from the nearest moni tor are very imprecise, and should be regarded as speculative. They are included for the sake of complete ness, but should not be relied upon. Even within populated areas, monitoring stations are often located in areas that cannot detect highly localized areas of pollution that significant numbers or sensitive subgroups (e.g., daycare centers, schools, or hospitals) in the population may encounter. Data were not available to present standard errors.
FIGURE 36: ANNUAL MEAN AMBIENT CONCENTRATION OF FINE PARTICULATE MATTER (PM2.5), BARHII REGION, 2007-2009.
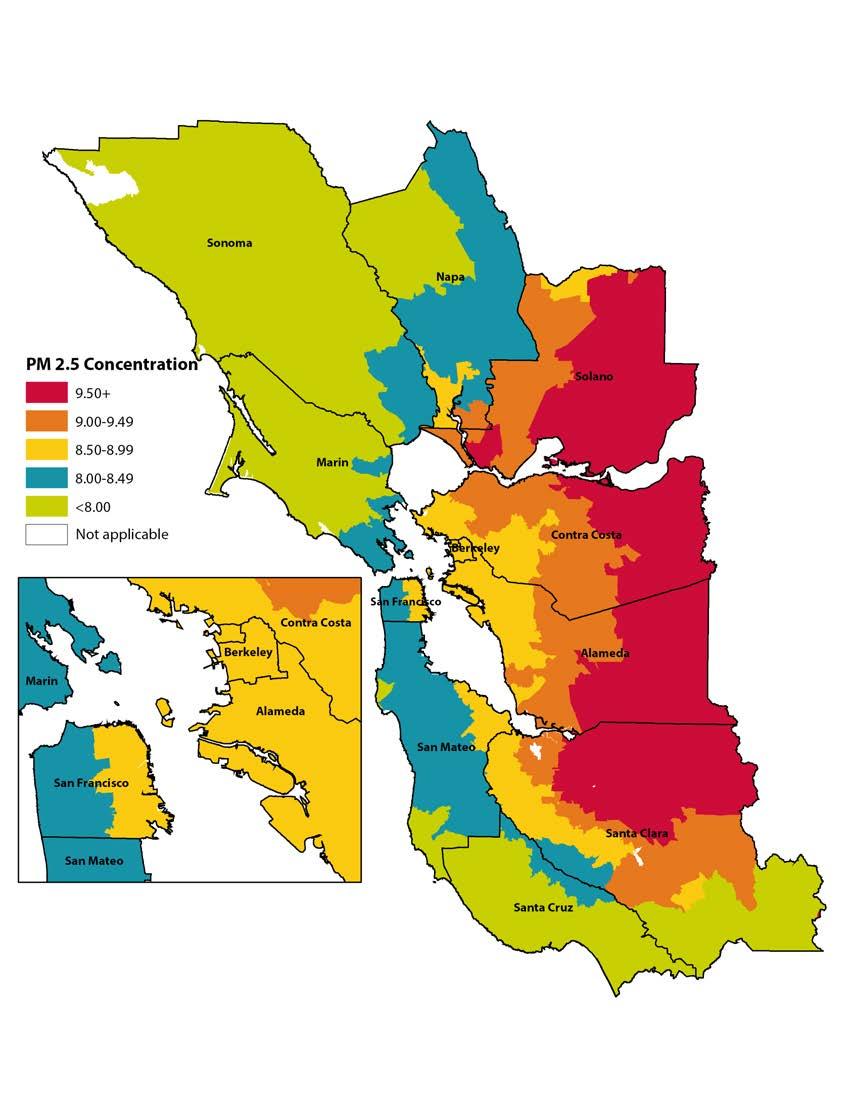
Contra Costa Health Services
Contra Costa Health Serves is a member of the Bay Area Ditching Dirty Diesel Collabora tive, a regional collaborative of grassroots groups, non-governmental organizations and LHDs. The objective of the collaborative is to reduce the burden of diesel pollution on health, especially in low-income, minority communities that are disproportionately af fected by diesel pollution. One of the activities of the collaborative over the last five years has been to influence the Sustainable Communities Strategy (SCS) process under SB375 to better address the health impacts of diesel pollution, especially the impacts on the occupants of new housing and other facilities (e.g., schools, senior centers, medical facilities) that will be cited in close proximity to sources of diesel pollution as a result of the emphasis on in-fill in the SCS.
As a way to support this advocacy effort, one of the members of the collaborative, the Pacific Institute, prepared a report, At a Crossroads in Our Region’s Health: Freight Transport and the Future of Community Health in the San Francisco Bay Area (http://pacinst.org/publication/at-a-crossroads-in-our-regions-health-freight-transport-and-the-future-of-commu nity-health-in-the-san-francisco-bay-area-2/). Contra Costa Health Services participated extensively in the development of this report. The report detailed where new development could occur within areas designated by local jurisdictions as priority development areas for growth that wasn’t exposed to highest levels of risk from diesel sources. This information then served as the basis for policy recommendations for directing growth in a way that would minimize the impact to public health while still meeting the development goals of the SCS.
Contra Costa Health Services continues to be in an active participant in Ditching Dirty Diesel’s follow-up effort to the report called the Pollution Free Housing for All Campaign, which will not only will try to help establish policies and practices for building new housing that is protected from the highest levels of diesel pollution, but will address how to do this without impeding the development of affordable housing. This effort will also address how to lessen the impact of diesel pollution on existing housing without exacerbating the negative impacts of gentrification.
Santa Clara County is a large county with over 1.8 million residents with a very diverse population. Additionally, many people commute to Santa Clara County for work; the county is home to several large technology companies that comprise what is known as Silicon Valley. With a large population of residents and workers, in addition to the county’s geographic location, Santa Clara County often experiences days with poor air quality. In 2014, the county received a “D” grade for high ozone pollution days and for 24-hour particle pollution in the State of the Air report published annually by the American Lung Association.
In efforts to promote active transportation, the Santa Clara County Public Health Depart ment partnered with cities on several strategies through Communities Putting Preven tion to Work (CPPW). Active transportation strategies in partner cities included zoning studies, alternative commute recommendations, bike share program outreach, complete streets (streets designed to provide safe access to all users, regardless of age or transportation mode), and other strategies.
Bay Area Bike Share, one example of a partnership with cities and local agencies to pro mote active transportation, offers the public access to shared bicycles in select locations in the San Francisco Bay Area. The Santa Clara County Public Health Department provided assistance to the City of San Jose, which presently offers 150 bicycles in 15 locations in the downtown area. Two other cities in the county participate in Bay Area Bike Share—Moun tain View and Palo Alto.
Also as part of CPPW, four school districts adopted Safe Routes to School policies. Safe Routes to Schools promotes biking and walking among children as a way to get to and from school. Safe Routes to Schools also emphasizes safety by partnering with cities and schools to promote safe passages for children to get to school, as well as safety training, such correct helmet usage. The adopted polices reach 45,000 students in 76 schools in the county.
As people walk and bike more, they become less reliant on driving to meet their transpor tation needs. A reduction in driving means reduced vehicle emissions, a contributing factor to pollution and poor air quality. Residents that live alongside freeways, such as lower-income families living in multi-unit housing, may be particularly affected by poor air qual ity due to motor vehicle emissions and so may especially benefit from countywide active transportation policies and programs.
San Francisco County Department of Public Health
The San Francisco Department of Public Health’s (SFDPH) Program on Health, Equity and Sustainability received funding from the Robert Wood Johnson Foundation’s Active Living Research program to conduct a health impact assessment (HIA) of a congestionpricing policy under study in San Francisco. Specifically, the San Francisco County Trans portation Authority (SFCTA) was studying a potential program that would charge $3 during rush hours to travel into or out of the congested northeast quadrant of San Fran cisco. This road-pricing fee would fund public transit, road maintenance, and bicycle and pedestrian street improvements.
In the Summer of 2011, SFPDH completed the HIA and found that with the potential future implementation of congestion pricing, San Franciscans could see significant healthrelated improvements relative to a future without road pricing—including fewer deaths due to air pollution, more cycling and walking and associated health benefits, and fewer pedestrian and cyclist injuries. The HIA did not find evidence of inequitable health effects on low-income, elderly, or young populations.
The HIA also estimated that the health-related economic costs of today’s transportation system are very high—as much as $1.12 billion a year. Congestion pricing could gener ate significant economic value by reducing transportation-related adverse health effects and increasing walking and biking. The HIA also made recommendations that specifically target enhancing health benefits of the policy, including increasing congestion pricing fees where they can reduce health risks (e.g., on spare-the-air days) and investing in targeted infrastructure to reduce pedestrian and cyclist injury and increase walking and biking for transportation. For more information see http://www.sfhealthequity.org/elements/ transportation/21-elements/transportation/116-road-pricing-health-impact-assessment-hia
American Lung Associate. 2014. Disparities in the Impact of Air Pollution http://www.stateoftheair. org/2014/health-risks/health-risks-disparities.html. Accessed January 2014.
Drechsler D, Garcia C, Tran H, Mehadi A, Nystrom M, Propper R, et al. 2005. Review of the California Ambient Air Quality Standard For Ozone. Vol 4. Table B-5: California Annual Health Impacts of Current Ozone Concentrations Compared to the State 8-hour Ozone Standard of 0.070 ppm. Sacramento, CA: California Environmental Protection Agency, Air Resources Board. http://www.arb.ca.gov/carbis/research/ aaqs/ozone-rs/rev-staff/vol4.pdf. Accessed January 2014.
Garzón C, Ditching Dirty Diesel Collaborative Freight Transport Committee, et al. 2011. At a Crossroads in Our Region’s Health: Freight Transport and the Future of Community Health in the San Francisco Bay Area. http://pacinst.org/publication/at-a-crossroads-in-our-regions-health-freight-transport-and-the-future-ofcommunity-health-in-the-san-francisco-bay-area-2/. Accessed June 2014.
Particulate Matter Integrated Science Assessment Project Team. 2009. Integrated Science Assessment for Particulate Matter. Research Triangle Park, NC: U.S. Environmental Protection Agency. http://cfpub.epa. gov/ncea/cfm/recordisplay.cfm?deid=216546#Download. Accessed January 2014.
San Francisco Department of Public Health Program on Health, Equity, and Sustainability. 2014. Road Pricing Health Impact Assessment (HIA): How Could Road Pricing Impact on Our Health? http://www. sfhealthequity.org/elements/transportation/21-elements/transportation/116-road-pricing-health-impactassessment-hia. Accessed June 2014.
Tran HT, Alvarado A, Garcia C, Motallebi N, Miyasato L, Vance W. 2009. Methodology for Estimating Premature Deaths Associated with Long-term Exposures to Fine Airborne Particulate Matter in California (Draft: Staff Report). Sacramento, CA: California Air Resources Board. http://www.arb.ca.gov/research/ health/pm-mort/pm-mort_final.pdf. Accessed August 2013.
SOCIAL DETERMINANTS OF HEALTH INDICATORS TO ADVANCE HEALTH EQUITY
A strong and sustainable public transportation system supports safe, reliable, and affordable op portunities for walking, bicycling, and public transit. It helps reduce health inequities by provid ing more access to healthy food, jobs, health care, education, and other essential services. Active and public transportation promote health by enabling individuals to increase their level of physical activity, potentially reducing the risk of heart disease and obesity, improving mental health, and lowering blood pressure. Furthermore, the transition from automobile-focused transport to public and active transport offers environmental health benefits, including reductions in air pol lution, greenhouse gases, and noise pollution, and leads to greater overall safety in transportation. Compared to public transit, a higher portion of trips by automobiles are associated with traffic accidents and increased air pollution, which are linked to increased rates of respiratory illness and heart disease.
Note to Health Departments in California: The California Department of Public Health’s Healthy Communities Data and Indicators (HCI) Project has acquired data for this indicator for the Bay Area from the San Francisco Bay Area Metropolitan Transportation Commission and for Southern California from the Southern California Association of Governments. These data are available at http://www.cdph.ca.gov/ programs/Pages/HealthyCommunityIndicators.aspx. For instructions on how to download and filter data from the HCI, see Appendix D.
To analyze this indicator for jurisdictions outside of California, GIS software and two data sources are needed—a Census block GIS layer that has population denominators from the Census Bureau Census 2010 PL94-171 data; and a GIS shapefile of geocoded transit stops with a headway (i.e., wait time ) of 15 minutes or less. The latter can be obtained from local or regional transportation planning authorities. Using GIS software, a buffer of one-half mile is drawn around a public tran sit stop to identify the Census blocks. Census blocks are dissolved (another GIS technique) into Census tracts to improve accuracy. From this, an estimate of the population living near a public transportation stop is identified for that Census tract.
Figure 37 shows walkable access to public transportation for the Bay Area. These data were down loaded and filtered from the HCI project. The red Census tracts show a low percentage of people living near a transit stop. Data for Santa Cruz County were not available at the time of publica-
tion. These areas should be considered for additional assessment and intervention to improve walkable access to public transportation.
FIGURE 37: PERCENTAGE OF RESIDENTS WITHIN ONE-HALF MILE OF A PUBLIC TRANSPORTATION STOP, SF BAY AREA, 2010
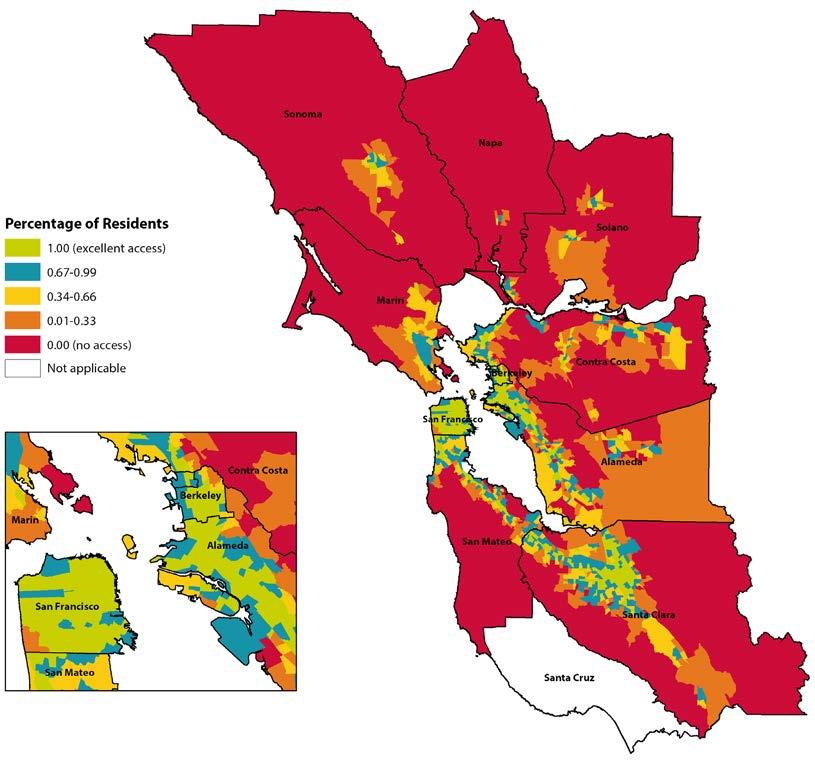
For this indicator, it is essential to know the rural verses urban geographic and population at tributes, which do not always appear on maps. Without this knowledge, maps and the resulting analysis can be misinterpreted. For example, based on the map of this indicator for San Mateo County, it appears that the inhabitants of the central and coastal regions either live far from or
must wait more than 15 minutes for public transportation. Following BARHII’s recommenda tions and based on this map, the central and coastal regions of San Mateo County should be pri oritized to improve access to public transportation, but this is an erroneous interpretation. These regions of San Mateo County are sparsely populated rural areas where the public transportation needs are substantially different from the urban parts of San Mateo County. For rural areas in general, further assessment is needed to determine if the public transportation is reliable, sustainable to rural transportation agencies, and can easily connect to larger regional public transportation networks.
SAN MATEO COUNTY, 2010
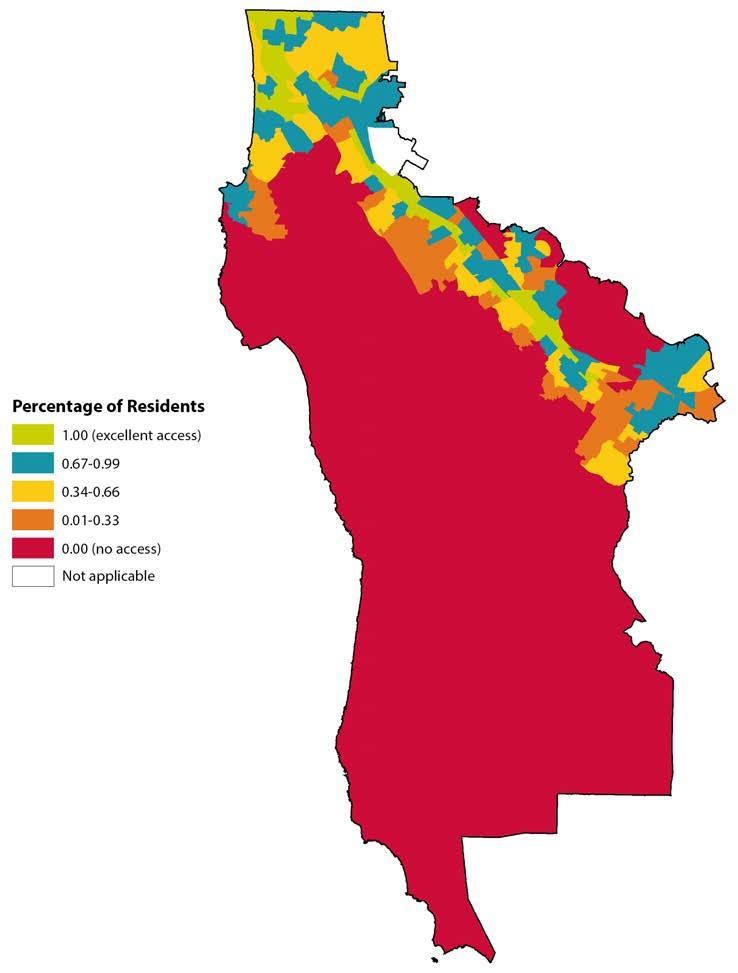
Alameda County Public Health Department
Alameda County Public Health Department’s Place Matters initiative released a health impact assessment (HIA), Getting on Board for Health: A Health Impact Assessment of Bus Funding and Access, which examines the connections between bus access, mobility, and health. Over 15 non-profit organizations, community groups, and public agencies worked in partnership to produce the report. The group surveyed transit-dependent riders about how bus service cuts and fare increases affect affordability and quality of their trip experience, as well as their ability to get to essential destinations, all of which can affect health.
The report included recommendations to the Metropolitan Transportation Commission to help inform the Regional Transportation Plan. This is the long-term transportation plan for how $289 billion will be spent throughout the nine-county Bay Area between 2013 and 2040 on transportation plans and projects, which was adopted as part of Plan Bay Area in July 2013.
The HIA includes primary data showing how access to public transit affects people’s ability to get to their job, healthcare appointments, school, and social activities, as well as how service cuts can directly affect safety, mental health, and social isolation. It also shows how fare increases affect personal income and can result in difficult choices between paying for transportation or food, medical care, and other necessities.
The San Mateo County Health System has worked closely with the City of San Mateo to develop the City’s Sustainable Streets Plan—a plan that incorporates complete streets and green streets concepts for a walkable, bikeable, transit-accessible community with environmentally friendly landscaping features. Using demographic and crash data, the health system provided recommendations for targeted infrastructure and policy improvements to encourage active transportation and transit use. Currently, a large housing develop ment is being constructed at Bay Meadows, where over 1,000 new housing units with 10% affordable- to moderate-income families will be located in a bikeable, transit-adjacent neighborhood.
The development adheres to the recommendations of the Sustainable Streets Plan and will connect families to local and regional transit an easy walking or biking distance away. Ex tensive walking and biking facilities, such as separated bike paths and a walking trail, will make this trip to public transit appealing and safe. Additional information on sustainable streets San Mateo can be found at http://www.sustainablestreetssanmateo.com
Besser LM, Dannenberg AL. 2005. Walking to Public Transit: Steps to Help Meet Physical Activity Recommendations. American Journal of Preventive Medicine 29(4):273-280.
Centers for Disease Control and Prevention, National Center for Environmental Health. 2008. CDC Recommendations for Improving Health through Transportation Policy http://www.cdc.gov/transportation/ Accessed October 2014.
Ewing R, Cervero R. 2010. Travel and the Built Environment: A Meta-analysis. Journal of the American Planning Association 76(3):265-294.
Frank LD, Andresen M, Schmid T. 2004. Obesity Relationships with Community Design, Physical Activity, and Time Spent in Cars. American Journal of Preventive Medicine 27(2):87-96.
Excessive alcohol consumption caused approximately 88,000 deaths and 2.5 million years of potential life lost annually in the United States from 2006 to 2010, making it the fourth leading preventable cause of death. Evidence shows that high density and proximity to alcohol outlets in neighborhoods is associated with higher rates of binge drinking and associated harms, like drinking and driving, motor vehicle-related pedestrian injuries, child abuse and neglect, youth drinking, intimate partner violence, and violent crime.
In California, the rate of alcohol-attributable deaths (ADD/year/100,000 population, 2006–2010) is higher for males (43.6) and African Americans/Blacks (36.6) in comparison with the total popu lation (29.4). Low-income and minority neighborhoods are more likely to have higher concentrations of stores selling alcohol.
Alcohol outlet density is controlled by the states and local regulations. In California the number of on-sale and off-sale alcohol licenses at the county level is restricted based upon the ratio of number of current licenses to the population within each Census tract. Additional licenses may be allowed based on a showing of public convenience or necessity. Limiting alcohol outlet density through the use of regulatory authority (e.g., licensing and zoning) is a public health strategy to prevent deaths and harms associated with excessive alcohol consumption. Multiple studies provide empiri cal evidence that higher alcohol outlet density and closer proximity to alcohol outlets is positively associated with outcomes like excessive alcohol consumption and other alcohol related harms like injuries and violence. However, some studies have found variations in the patterns; for example, four California cities showed higher rates of heavy drinking in high income neighborhoods with low alcohol outlet density than in lower income neighborhoods.
Raw data is available from the California Department of Alcoholic Beverage Control (ABC) and is refreshed on a weekly basis. https://www.abc.ca.gov/datport/DataExport.html. The data are avail able in an unformatted ASCII file for the entire state.
STEP 01. After downloading the file from the website, open Microsoft Excel. Choose “Open” from the File menu and in the dropdown menu choose “All Files (*.*)”. Navigate to the place where the downloaded file is saved, select the file and choose “Open”.
STEP 02. To format the file, use the Data Layout and Code References available on the ABC website to determine the column placement. Using Microsoft Excel, the file can be
formatted by selecting “Text to Columns” under the Data menu in Excel, choosing “Fixed Width” and then manually selecting the column width and choosing the col umn locations based on the reference PDF file. Excel versions may vary slightly, but all versions will have the capacity to delineate the columns manually upon opening the unformatted file.
STEP 03. It is of particular importance to format the Census tract column initially as a text col umn so that leading and following zeros will not be eliminated in automated format ting done by Microsoft Excel upon file import. After import, for ease of mapping, the ‘.’ character should be eliminated from the Census tract column using the find/ replace function.
Data are restricted by license type, application status, and duplication in this exam ple. Data were restricted to Contra Costa County and then restricted by license types 20 and 21 for off-sale. For these retail outlets, alcohol is sold in sealed original con tainers for consumption off the premises of the retailer. For reference, review license types on the ABC website at http://www.abc.ca.gov/permits/licensetypes.html. We further restricted the data for analysis to licenses (removing applications for which licenses have not yet been issued) and to active status licenses (removing pending and expired licenses). We removed duplicates in the dataset by excluding entries with identical premise name and premise address.
To calculate alcohol outlet density, it is not necessary to geocode the data at this point. The Census tracts provided in the download from ABC are adequate to proceed with mapping. However, if other analyses are required, it is possible to geocode the data using the premise address for further spatial analysis.
To calculate density, the number of outlets per Census tract can be calculated by importing the data into a statistical package (e.g., SAS) or by using a pivot table in Microsoft Excel. To construct a pivot table in Excel 2010:
STEP 04. Select the column with the Census tracts in the spreadsheet.
STEP 05. In the Insert menu, select Add PivotTable and add the table to a new worksheet.
STEP 06. Click the Census tract box in the pivot table field list.
STEP 07. Drag the Census tract label in the field list and drop it in the value field.
STEP 08. For Values, ensure value field settings is set to Count.
At this point, you should have a column of Census tracts and a column with the number of alcohol outlets per Census tract.
To calculate and map outlets and display the relative numbers, you must join the table to a shapefile by Census tract. In this case, we used a 2010 Census layer that includes 2010 population numbers. After joining, Census tracts with no outlets will have a <Null> value for outlet number. To convert those values to 0, export the data to a new shapefile and show that shapefile on the map.
FIGURE 39: NUMBER OF ALCOHOL OUTLETS BY CENSUS TRACT, CONTRA COSTA COUNTY, 2014
To map the number of alcohol outlets per 10,000 people by Census tract, carry out the following steps.
STEP 09. Export the shapefile created above from ArcGIS.
STEP 10. Open the .dbf file, which contains the spreadsheet of data, in Excel.
STEP 11. Delete all columns except the Census tract identifier, number of outlets, and 2010 Census population numbers.
STEP 12. Calculate the density per 10,000 people by creating an additional column and divid ing the number of outlets by the 2010 Census population and multiplying by 10,000
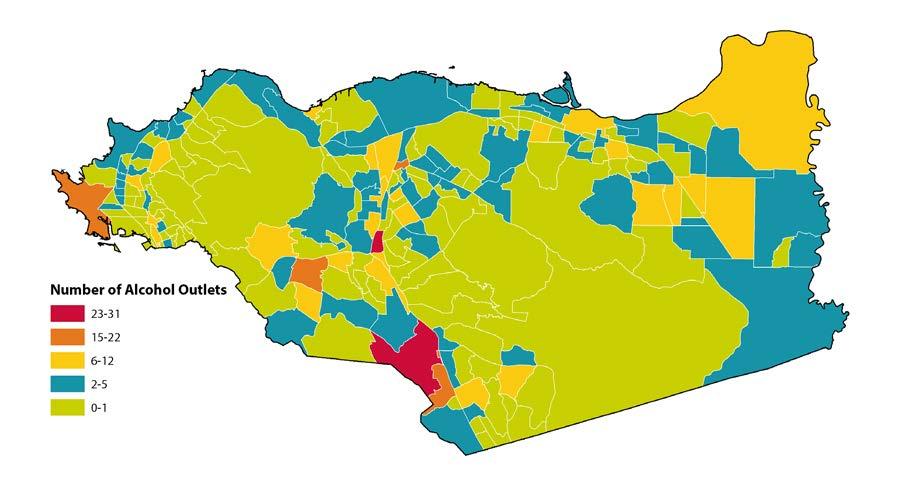
STEP 13. Save and close the new Excel file.
STEP 14. Open ArcGIS and join the new data file to the Census tract shapefile by Census tract. Recall that as the shapefile includes both boundaries and population estimates, the exported joined data will have both the 2010 population estimates and alcohol
outlets. These data can also be obtained in American Factfinder, for details on how to download ACS or decennial data, please see the Appendix B.
Figure 40 shows the density of alcohol outlets per 10,000 people. By normalizing to population numbers, we see more areas of high density than on the previous map. To understand the impact of alcohol outlets on the population, the density relative to the number of people is a more effective measure.
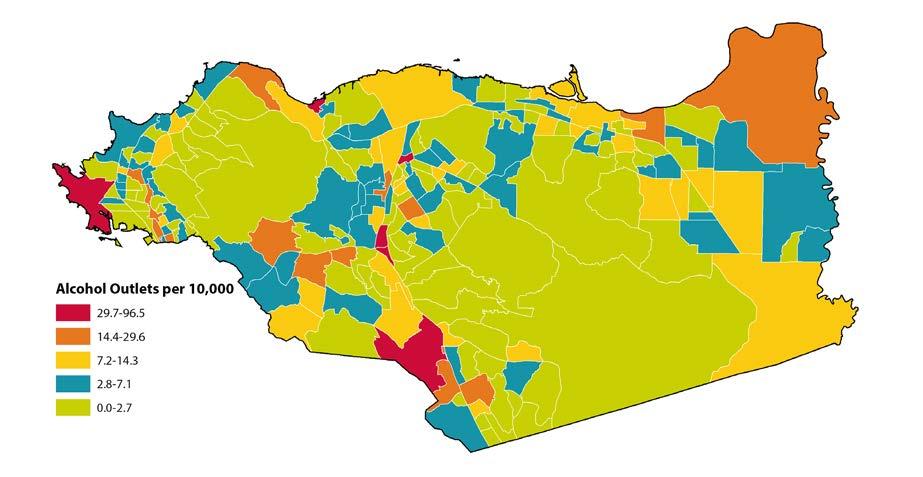
How a community is designed can significantly affect the health of those who live there. Community design can affect public safety, housing, food security, and transportation, which also affects access to health care, school, and work; air pollution and other aspects of environmental quality; alcohol, tobacco, and fast food density and other aspects of land use; and social isolation. Improving the built environment of communities across Alameda County will ensure that everyone has an opportunity to be healthy and thrive.
The Ashland/Cherryland community is seeking to address health inequities by creating a health element in their county general plan. The general plan serves as the “constitu tion” of a community and guides all local government land use decisions and policies. Since general plans create a long-term vision, strong health elements can powerfully orient government actions for decades and can help prioritize a community’s health-related goals. Developing a health element is also an opportunity to engage community members in
SOCIAL DETERMINANTS OF HEALTH INDICATORS TO ADVANCE HEALTH EQUITY
identifying important local health issues. The Alameda County Public Health Department (ACPHD) assisted the community in providing data and other support to include this health element. Funding for this project was provided jointly by the ACPHD, the Alameda County Planning Department, and Supervisor Nate Miley. For more information, visit http://ashlandcherryland.org/
Once input has been gathered from internal Alameda County stakeholders, the health ele ment will be presented at various community meetings to gain feedback from the commu nity. The health element should be approved by the Board of Supervisors in early 2015.
In 2005, a Youth Access Survey, administered locally, assisted in uncovering the retail and social outlet sources of alcohol for youth. The survey found that 77% of teen surveyed reported family and friends as a primary source of alcohol for youth. Few municipalities had ordinances or laws in place to address young people accessing alcohol in retail or social settings, and those in place were not being routinely and consistently enforced.
Starting in October 2006, and continuing over the following three years, a total of twelve Social Host Accountability Ordinances (SHAOs) were passed or amended in Marin County. These policy changes came as part of a coordinated effort under the Marin County Alcohol and Other Drug Prevention Strategic Plan to reduce youth access to alcohol and to transition alcohol and other drug prevention efforts from an individual-focused approach to a community-focused approach, using evidence-based environmental prevention strate gies. The first new ordinance was passed in 2006 by the Marin County Board of Supervi sors and covered unincorporated Marin County. During the following three years, all of Marin’s cities and towns used the county ordinance as a model to pass their own ordinanc es or amend existing ordinances. Sausalito, Mill Valley, Tiburon, Fairfax, Novato, Ross, and San Anselmo amended existing ordinances. Belvedere, Corte Madera, Larkspur, and San Rafael adopted new SHAOs.
SHAOs discourage parents and other adults from hosting underage drinking parties. They also address the commonly held belief that underage drinking is inevitable or simply a rite of passage and that it is, therefore, acceptable to give alcohol to underage youth. SHAOs work as a nuisance abatement strategy, deterring underage drinking parties “by imposing a civil fine on the person responsible for loud or unruly gatherings where alcohol is con sumed by, served to or in the possession of underage persons.” Under SHAOs, the property owner, renter, or lessee, or the party organizer, is held responsible for the event. When a juvenile is the party host, the juvenile, and the parents or guardians of that juvenile, are jointly and severally liable for fines imposed and costs incurred for public safety services. SHAOs send a clear message to adults that providing alcohol to teens is not acceptable.
Gonzalez K, Roeber J, Kanny D, et al. 2014. Alcohol-attributable Deaths and Years of Potential Life Lost—11 States, 2006–2010. MMWR 63(10):213-216.
Michigan Department of Community Health, Bureau of Disease Control, Prevention & Epidemiology. 2011. The Association of Increased Alcohol Outlet Density & Related Harms: Summary of Key Literature Accessed May 2014.
California Department of Alcohol and Drug Programs. Racial/Ethnic Disparities—A Data Informed Perspective. 2013. https://www.michigan.gov/documents/mdch/Outlet_Density_Associated_Harms_ Summary-3.10.2011_373894_7.pdf. Accessed May 2014.
ABC Act (Business and Professions Code Sections 23815-23827). 2014. http://www.abc.ca.gov/cbnpc. html. Accessed May 2014.
Community Anti-Drug Coalitions of America, Center on Alcohol Marketing and Youth, Johns Hopkins Bloomberg School of Public Health. 2011. Regulating Alcohol Outlet Density: an Action Guide. Accessed May 2014.
Guide to Community Preventive Services. 2014. Preventing Excessive Alcohol Consumption. http://www. thecommunityguide.org/alcohol/index.html. Accessed October 2014.
An adequate, nutritious diet is a necessity at all stages of life. Pregnant women, babies, children, adolescents, adults, and older adults depend on adequate nutrition for optimum development and maintenance of health and functioning. Inadequate diets can impair a child’s intellectual performance and have been linked to frequent school absence and poorer educational achieve ment. Nutrition also plays a significant role in causing or preventing a number of illnesses, such as cardiovascular disease, some cancers, obesity, type 2 diabetes, and anemia. These weight-associated illnesses are no longer restricted to adults as the prevalence of obesity has more than doubled in children in the last 40 years. Obese children have an increased risk of heart disease and of becom ing obese adults.
Lower income families are less likely to have a nutritious diet than those with higher incomes. Food environments—defined by the types of foods available in a neighborhood, including stores, restaurants, schools, and worksites—also influences peoples’ food choices and their likelihood of being overweight or obese. There is a strong association between consumption of calorie-dense foods with low nutritional value and being overweight or obese when one or more calorie-dense meals are consumed per week. High-fat and high-sugar foods are available at most elementary and middle schools. Since the 1970s, the number of fast food restaurants has more than doubled in the United States, and the proportion of daily calorie intake from foods eaten away from home has increased.
Measures of food availability in the environment include distance to food retailers, cost of foods, and the number of food outlets in a given area. Due to the lack of standardization of food en vironment metrics and differences among populations studied, it is difficult to generalize the evidence on the relationship between food environments and health. Nevertheless, various crosssectional and longitudinal studies show a positive association between the number of fast-food restaurants and/or convenience stores in a given area with body mass index (BMI), obesity and overweight rates; and a negative association with fruit and vegetable intake. The extent of this rela tionship can vary with race/ethnicity. In California, adults living in cities or counties with 16.7% healthy food retailers or less had a 20% higher prevalence of obesity and a 23% higher prevalence of diabetes than adults living in areas with 25% healthy food retailers or more; this relationship held true regardless of household income, race/ethnicity, age, gender, or the physical activity levels of respondents.
The original indicator investigated was the retail food environment index (RFEI), developed by the California Center for Public Health Advocacy. This indicator has been altered by the Center for Disease Control and Prevention (CDC) to the modified RFEI (mRFEI). The equations for each are below.
RFEI
# fast food restaurants + # convenience stores
mRFEI
# healthy food retailers [# supermarkets + # supercenters + # produce stores]
# supermarkets + # produce stores + # farmers’ markets
# healthy food retailers + # less-healthy food retailers [# fast food restaurants + # convenience stores + # small grocery stores]
There are limitations to both the RFEI and the mRFEI, which are especially evident within smaller geographical areas. For example, in a retail-rich area there are typically many more counter or fast food dining establishments even in areas that have more than one supermarket and/or a farmers market nearby. Due to the high number of counter or fast food dining establishments, an area would score poorly on the two measures. In contrast, an area with just one fast food outlet might score high on the two measures.
For this reason, Bay Area Regional Health Inequities Initiative recommends the adoption of the food market score, which is a relative measure of the number and variety of retail food resources within one mile, weighted by food offerings and distance.
This methodology was originally developed for San Francisco, modeling similar techniques used for the walkability measure in the Metropolitan Transportation Commission Snapshot analysis and Walkscore. It is a relative measure, so inherently some areas will score higher or lower depending on the variables listed in the table above. Weights for distance are based on typical walkable distances in an urban environment. Adjustments can be made based on the context of where this measure is adapted.
STEP 01. The first step is to collect geographic information systems (GIS) layers for all of the street intersections in the analysis area and the locations of retail food vendors. Street
intersection locations can generally be obtained from city planning departments or transportation agencies. In California, locations of food retailers can be downloaded from the Network for a Healthy California GIS Map Viewer (http://www.cnngis. org/). Follow these steps to download the data:
1) Open up the layer list and select the farmers’ markets, general grocery, convenience group, department stores, single category and other, and fruit and vegetable markets layers.
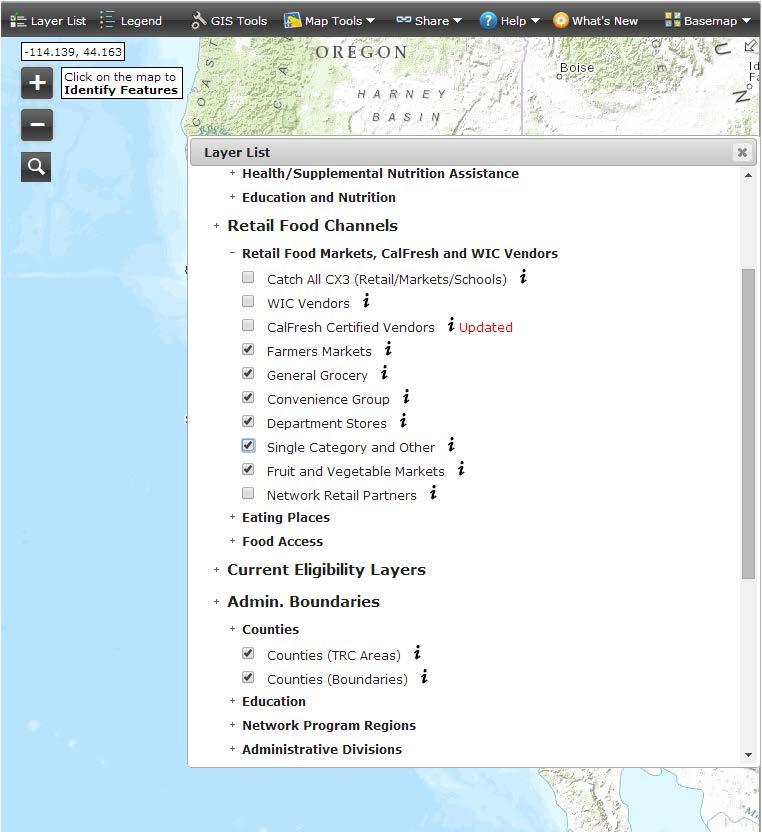
SOCIAL DETERMINANTS OF HEALTH INDICATORS TO ADVANCE HEALTH EQUITY
2) Zoom to your region of interest.
3) Click on GIS tools and select a target layer and click summarize data. Repeat for all six layers. In some cases, you may have more than 1,000 businesses in your current view; however, the program cannot download that many. One solution is to click “Selection” and then select the stores you are interested in downloading by drawing boxes around the items, which will create a light blue outline around them. Then, when using “Summarize Data,” select “Current Selections.”
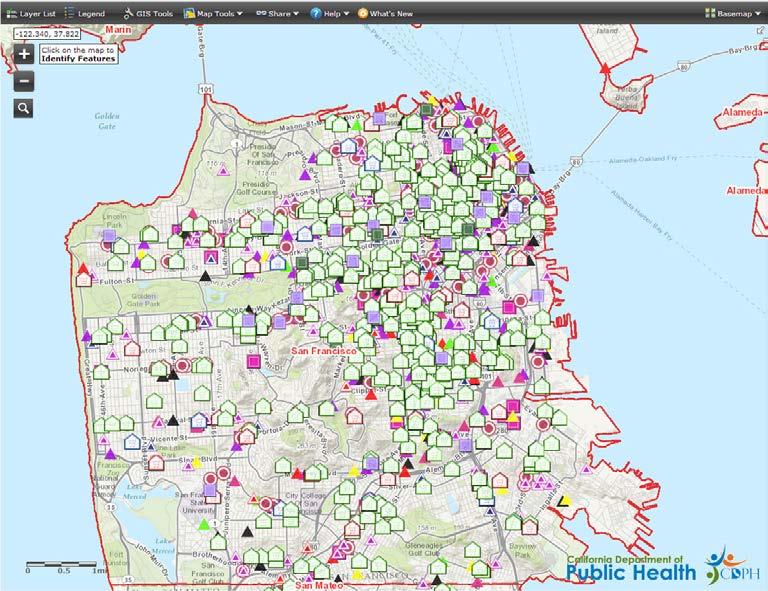
4) After clicking “Summarize Data,” click “Download Data.” Make sure that your pop-up blocker is off, as the download window will appear as a pop-up. Proceed to save the resulting CSV file for geocoding later.
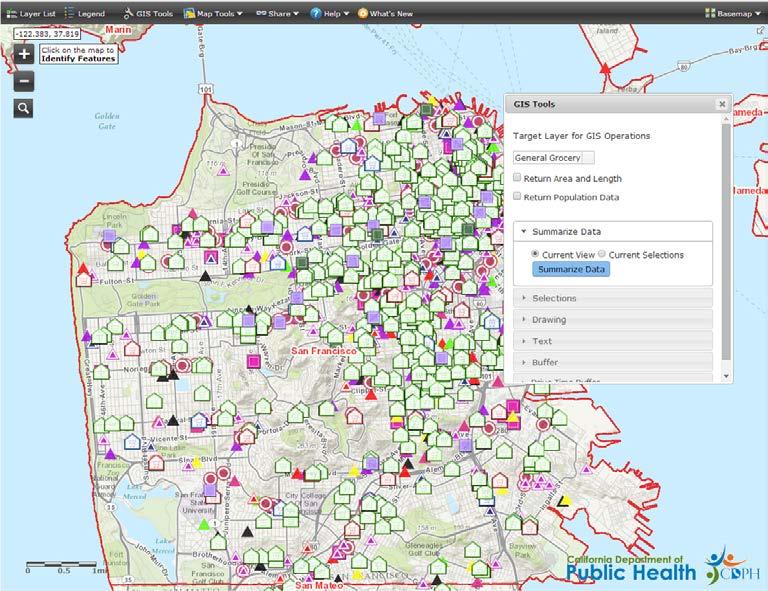
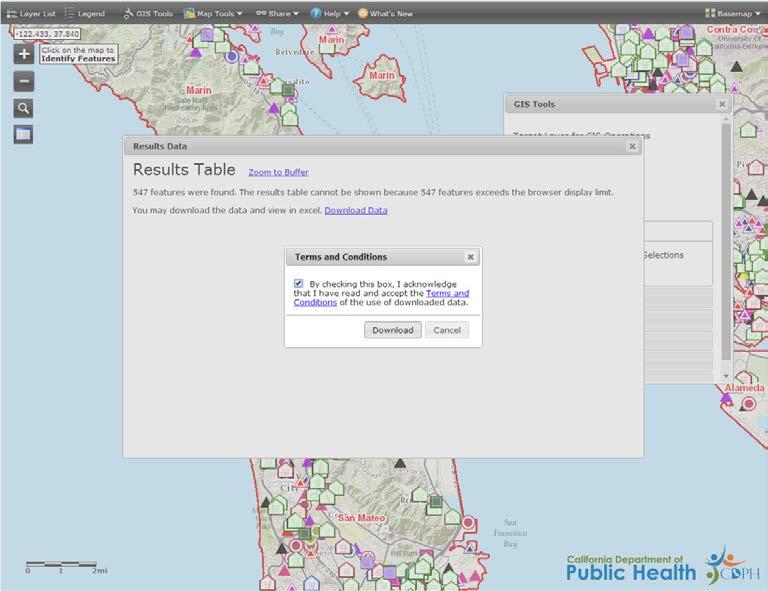
STEP 02. The next step is to geocode the business addresses in the six CSV files you have downloaded and then to clean, reclassify, and merge the files. There are many options for geocoding that exceed the guidance provided here—work with your local GIS expert to geocode each file to the best degree of accuracy possible. After geocoding the files, it is recommended to check that the stores listed do indeed sell food and are still operating. For example, many pharmacies and discount retailers, like Target, have significant fresh food options and should be included. Exclude other stores from the “Department Stores” sheet that are not known to sell food. While CDPH has fortu nately done some very helpful preliminary cleaning and classification of these stores, business-listing data is notoriously inaccurate. Clean the files to a point that you are comfortable with and are willing to go back and correct errors iteratively.
The next step is to create a “Supermarkets” category from the “General Grocery” file. In ArcGIS, add a new field called “Type.” Use the field calculator to assign “Su permarket” to all stores that are already classified as small or large chain stores. To determine whether other non-chain stores should be considered supermarkets, use the additional information about store size, revenue, and number of employees, as well as common knowledge of the retail stores in your community, to decide which stores should be classified as supermarkets. In San Francisco, stores in the general grocery category that had 5,000 square feet or more, made $1 million or more in annual sales, were part of a local chain, or had six to 20 employees and grossed between $500k to $1 million in sales were classified as supermarkets, but in less dense areas these criteria may not be as useful. For the remaining stores, label them as “Small Grocery” in the “Type” field using the field calculator. San Francisco has used Yelp searches and examination with Google Street View to verify that stores should be classified as “grocery” and not “convenience.” Then merge the files together as one shapefile using the merge tool in ArcGIS.
STEP 03. The next step is to assign quality weights to each store type. To do this, San Francisco did a small sample survey of supermarkets, small grocery stores, convenience/liquor stores, produce markets, meat markets, and chain pharmacies in different parts of the city, using a store survey that looked at the variety of healthy or whole foods avail able in each surveyed store. The survey contained sections for produce, dairy, whole grains, and protein. The produce section represented 51% of the total possible points (59 points possible), while the dairy, whole grains, and protein sections accounted for 10%, 19%, and 20% of the points respectively. To arrive at the final store type scores, the median number of points for each store type was divided by the median super market points (57). Final scores are listed in Table 5.
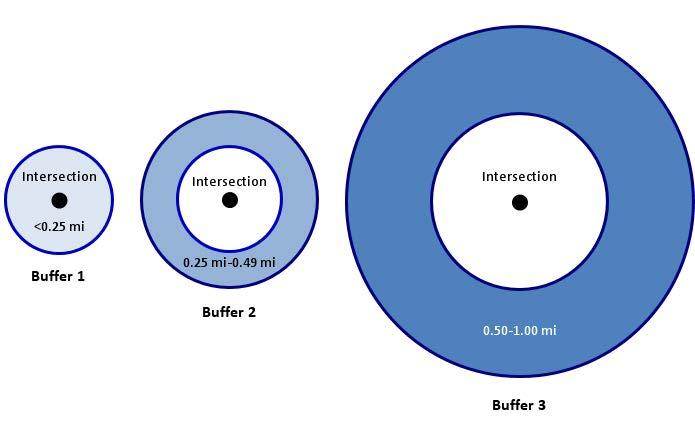
Score
Supermarket 1.00
Produce market 0.90
Other grocery 0.72
Farmers’ market 0.51
Pharmacy 0.41 Meat/seafood market 0.35 Convenience/liquor store 0.25
Other jurisdictions could adopt these scores or choose to conduct a survey of their local stores using San Francisco’s survey instrument. Create a new field for “Type Score” and populate it with the appropriate score for each store type.
STEP 04. The next step is to do a spatial join to all of the food stores within one mile of each intersection and to assign a distance score for each intersection–store join. The distance scores are as follows: if the store is less than 0.25 miles from an intersection it gets a 1.00, if it is between 0.25 and 0.49 miles it gets a 0.90, and if it is between 0.50 and 1.00 miles away from the intersection it gets a 0.75. The easiest way to make these joins and to attach the appropriate score is to create buffers around the intersections. Start by making a quarter-mile buffer around each intersection. Then make another quarter-mile buffer around the first quarter-mile buffer, excluding the buffer shape area (so it resembles a donut). Then make one last half-mile buffer around the half-mile donut buffer to create another donut buffer that covers the area 0.50 to 1.00 miles from each intersection. Using these three new buffer shapefiles use the spatial join tool to do a one-to-many join of the food markets to each of the buf
fers (specify that the points must be completely within the buffer, not intersecting)— making sure that an ID field that relates back to the original intersection is preserved. The result will be three new shapefiles that have the intersections listed many times with the different stores that are within each distance specific buffer. In each file, cre ate a new field titled “Distance Score” and populate that column with the appropriate distance score (1.00, 0.90, or 0.75) depending on whether the file relates to the less than quarter-mile buffer, the second quarter-mile buffer, or the final half-mile buffer. Merge the three files into one. There will likely be thousands of records at this point.
STEP 05. Now that you have a master file that has a unique record for every intersection-tostore join, with the accompanying store type score and distance score, create a new field for “DT Score.” Before populating this field, select all of the records for in tersections connected to a convenience/liquor store with a distance score of 0.9 or 0.75 and delete them. Convenience stores that are more than quarter-mile away are not considered because residents would not travel further than that to go to a con venience store. Next, use the field calculator to multiply the distance score by the store type score for each record to populate the DT Score field. To account for the overabundance of some store types skewing the results, a score cap is applied to each store type. To do this, select the records by store type and summarize by intersection, essentially creating eight summary tables by intersection. Adjust the sums in each table so that an intersection receives no more than the equivalent of three stores of any type within one-quarter of a mile; in other words, 3.00 points for supermarkets, 2.70 points for produce stores, and 2.16 points for other grocery stores. For meat and seafood markets, pharmacies, and convenience and liquor stores, the top number of points an intersection should receive from each store type is 0.70, 0.82, and 0.50 re spectively—or the equivalent of two stores within that quarter mile. There is no score cap for farmers’ markets.
STEP 06. Merge the eight tables into one and summarize the capped products of store type score times distance score for each intersection. The resulting table should have the same number of records as the intersections shapefile, unless some intersections had no stores within one mile, in which case they may not be represented. Join this summary table by attributes using the intersection ID to the intersections shapefile. Now every intersection should have a score for the number and variety of retail food re sources within one mile, weighted by food offerings and distance. Create a new field called “Final Score.” Populate this field by normalizing the DT Score Sum to a score of zero to 100 using the formula (x - min(x))/(max(x) - min(x)) * 100.
STEP 07. To visualize the intersection scores over a continuous surface, create a raster image using inverse distance weighting. Average scores can be generated for small geographic areas, like neighborhoods or Census tracts, by using the zonal statistics to table tool.
The HOPE Collaborative, a project of Tides Center, seeks to create community-driven and sustainable environment change for Oakland residents through the enhancement of local food systems, small business, and workforce development opportunities. HOPE is working with Alameda County Public Health Department via the Oakland Food Policy Council to increase access to land to grow food, including an edible parks program and opportuni ties to facilitate the sale/lease/use of private property to urban agriculture groups. HOPE is working with the City of Oakland to update mobile food vending zoning, expanding beyond the current limited areas and the current pod format.
HOPE is also working with Inner City Advisors and Urban Development to:
• Conduct a landscape analysis of food and economic justice projects working in lowincome and communities of color in the county.
• Provide capacity building to social entrepreneurs seeking to build their projects towards sustainable business models for food and economic justice in low-income communities of color.
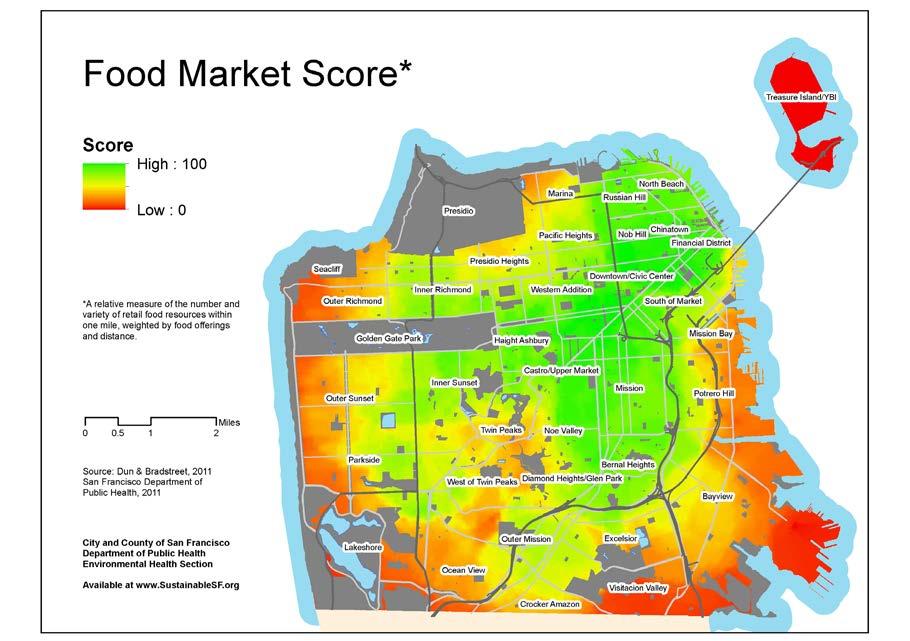
• Improve the ability of local food businesses in Oakland to provide quality fresh and prepared foods.
• Develop a comprehensive food retailer improvement initiative targeted at Oaklandbased corner stores to provide Oakland residents access to high-quality fresh and pre pared food options.
The county government is one of the largest employers in Santa Clara County, with a workforce of more than 15,000 in more than 30 departments and agencies. Many employ ees eat in one of six county-owned cafeterias and cafes, or purchase snacks and drinks from one of more than 200 vending machines. In addition, the county serves six million meals annually to the custodial population through the county hospital, jails, ranches, and other sites.
In 2011 and 2012, the Santa Clara County Public Health Department’s Center for Chronic Disease & Injury Prevention developed a comprehensive set of nutrition standards (with funding from CDC’s Communities Putting Prevention to Work obesity prevention initia tive) based on national guidelines, including the 2010 Dietary Guidelines for Americans. These standards were developed with input from state and national experts and in col laboration with an interagency group that included senior-level representatives from nine county departments. This group, called the Nutrition Standards Committee, worked col laboratively for a year to develop the standards to ensure that food and beverages offered, purchased, or served at county facilities and those provided by county departments were of maximum nutritional value.
The standards were organized by food environment. These included meetings and events, vending machines, cafeterias and cafes, county-leased properties, and custodial populations. The standards were approved by the county board of supervisors in March 2012 and were published and disseminated soon after through an internal marketing campaign and employee trainings.
Assessments in the early stages of implementation revealed improvements in the mix of products offered in vending machines and in the availability of healthier food items in cafeterias, cafes, and custodial sites. The County Nutrition Standards were also used as a model for six cities in Santa Clara County, several other counties across California, and by several other states.
California Center for Public Health Advocacy. 2007. Searching for Healthy Food: The Food Landscape in California Cities and Counties. http://www.publichealthadvocacy.org/RFEI/presskit_RFEI.pdf. Accessed November 2013.
California Center for Public Health Advocacy, PolicyLink, UCLA Center for Health Policy Research. 2008. Designed for Disease: The Link Between Local Food Environments and Obesity and Diabetes http:// www.publichealthadvocacy.org/designedfordisease.html. Accessed November 2013.
Gibson DM. 2011. The Neighborhood Food Environment and Adult Weight Status: Estimates from Longitudinal Data. American Journal of Public Health. 101(1):71-78.
HOPE Collaborative. 2014. Our Work. http://www.hopecollaborative.net/our-work. Accessed June 2014.
Papas MA, Alberg AJ, Ewing R, Helzlsouer KJ, Gary TL, Kalssen AC. 2007. The Built Environment and Obesity. Epidemiologic Reviews 29(1):129-143.
Robert Wood Johnson Foundation Commission to Build a Healthier America. 2009. Improving the Health of All Americans through Better Nutrition. http://www.rwjf.org/en/research-publications/findrwjf-research/2009/07/improving-the-health-of-all-americans-through-better-nutrition.html. Accessed November 2013.
Santa Clara County. Santa Clara County Nutrition Standards 2012. 2012. http://www.sccgov.org/sites/ sccphd/en-us/Newsandevents/Documents/Nutrition%20Standards/Nutrition_Standards_NEW_july2012_ v3.pdf. Accessed June 2014.
U.S. Department of Health and Human Services, Centers for Disease Control and Prevention. 2011. Children’s Food Environment State Indicator Report, 2011 http://www.cdc.gov/obesity/downloads/ childrensfoodenvironment.pdf. Accessed July 2014.
U.S. Department of Agriculture and U.S. Department of Health and Human Services. 2010. Dietary Guidelines for Americans. 7th ed, Washington, DC: U.S. Government Printing Office.
Zenk SN, Lachance LL, Schulz AJ, Mentz G, Srimathi K, Ridella W. 2009. Neighborhood Retail Food Environment and Fruit and Vegetable Intake in a Multiethnic Urban Population. American Journal of Health Promotion 23(4):255-264.
SOCIAL DETERMINANTS OF HEALTH INDICATORS TO ADVANCE HEALTH EQUITY
This appendix is a technical manual to accompany the SDOH guide. We recommend that LHD epidemiologists read the SDOH guide first, then refer to this appendix to read in more detail. This appendix is for the staff that will actually do the work of downloading, cleaning, analyzing, and mapping the data. It was designed with an epidemiology student intern in mind, but more seasoned epidemiologists will benefit by reading this as well. The manual includes steps, screenshots, limitations, and more advanced technical considerations about how to download and ana lyze the core data for SDOHs. Some of these datasets are only available in California (i.e., Califor nia Health Interview Survey and the Healthy Community Indicator Project); nevertheless, health departments outside of California will benefit from the detailed instructions and discussions about analyzing mortality, along with data from the Census Bureau.
For the purposes of this analysis, a neighborhood is defined as a collection of Census tracts categorized by the poverty groups. To calculate it, one must total the numbers of people living below the federal poverty level, normally less than 5.0%, 5.0% to 9.9%, 10.0 to 19.9%, 20.0 to 29.9%, and 30.0% and more, and stratified these rates by race and ethnicity. For this guide, we have Hispanic/ Latino as a mutually exclusive group; note that this is not possible in every dataset. A similar method is used for educational attainment, which is explained elsewhere in this appendix.
To calculate life expectancy at birth along the social gradient, one has to have geocoded mortality data with the Census tract appended. Further, a life table is required as this graph requires 25 sepa rate life expectancy calculations. Methods on life tables can be found in standard textbooks.
In order to remove the effects of age on mortality, deaths rates should be adjusted (i.e., standard ized to the U.S. population) to make meaningful comparison along the social gradient. In order to calculate this, death rates for specific age groups in each social and racial strata should be calcu lated. BARHII used ten-year age groups for its calculations. Methods on age adjustment are found in standard epidemiology textbooks.
Population-attributable risk (PAR) measures the excess incidence of a disease in a population that is attributable to a risk factor, or “no high school education” in this analysis. The PAR for cause-
specific mortality with no high school education as the risk factor in BARHI member counties was calculated by subtracting the incidence of death in adults 25 to 64 years with a high school education or greater from the total incidence of death of adults 25 to 64 years for each group cause of death. The education status of the deceased is indicated on his/her death certificate, which was obtained from the California 2009, 2010, and 2011 Death Statistical Master Files. Population denominators are from Census 2010. This method is found in standard epidemiology textbooks, but this publication, Methods for Measuring Health Inequalities (Part II), from the World Health Organization explains the method well: http://bvs1.panaftosa.org.br/local/file/textoc/SCHNEI DER_CASTILLO_BACALLO_LOYOLA_MUJICA_VIDAURRE_ROCA_methods_inequali ties.pdf
For table 1 in the introduction, the following formula was used:

PARnohs = Population-attributable risk cause-specific mortality, no high school education
I t = Incidence of death in all adults aged 25–64
Ihs = For each group cause of death, the incidence of death of adults aged 25–64 with a high school education or greater.
A more complex method to identify causes of death with the strongest association with neighbor hood wealth is the slope index of inequality (SII). The SII is a regression coefficient that measures the association between neighborhood wealth with a health outcome such as death. BARHII adapted the methods from the WHO publication Methods for Measuring Health Inequalities (Part II) for its analysis. The death rate is calculated from death certificates of adults 18 to 64 years geocoded to their Census tract of residence in BARHII counties from 2009 through 2011. Census tract poverty denominators of those 18 to 64 years are from the American Community Survey table B17024 five-year estimates, which were multiplied by three to estimate person years for BARHII counties. For this model, neighborhood wealth is measured by a ridit score, which is based on the cumulative population living in each Census tract poverty group up the social gradient. The higher the ridit score, the wealthier the Census tract group. Once calculated, a Poisson
regression of neighborhood poverty vs. cause-specific mortality rates was run using the ‘genmod’ procedure in SAS 9.2. The general formula of the SII is as follows:
ln(deathrate) = α + β(ridit) + εv
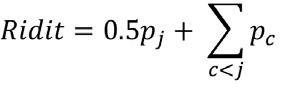
LN(deathrate) = the natural log of the Census tract poverty group death rate for each group cause of death
α = the y-axis intercept
β = the slope index of inequality (i.e., the regression coefficient)
ε = the error factor
Ridit = The formula for a ridit score is as follows:
pj = the prevalence of people living in each Census tract poverty group (<5%, <10%, 20%, 30%+ etc)
pc = the cumulative population
The SII can be plotted visually to better show the relationship between neighborhood wealth and cause-specific mortality rates. For example, Figure A-1 shows the SII for group cause of death 340
FIGURE A-1: SLOPE OF INDEX OF INEQUALITY RATES OF MORTALITY BY ASSAULT BY FIREARM, BARHII REGION, 2009-2011
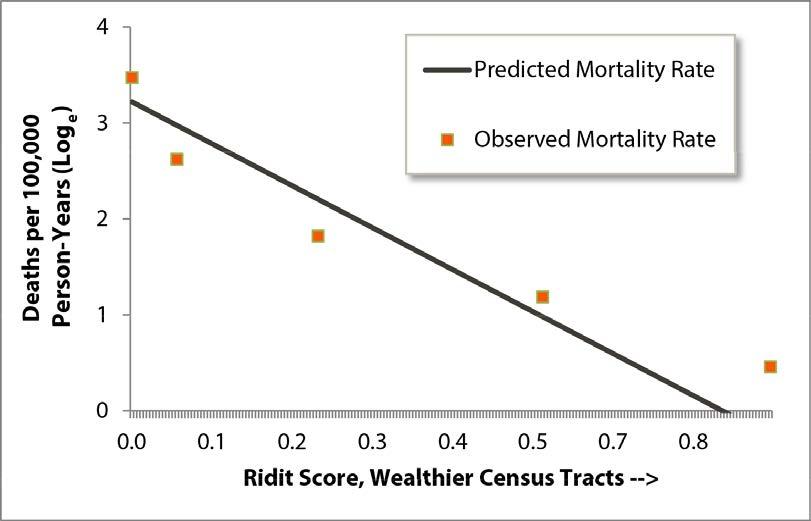
or assault by firearm. Among all causes of death in the BARHII region, this cause had the stron gest association with neighborhood wealth. As shown, the model fits the data well, is statistically significant, and shows how rates of mortality by firearm decrease as neighborhood wealth increas es. Conversely, Figure A-2 shows little association with neighborhood wealth and rates of death by multiple sclerosis (group cause of death 149).
FIGURE A-2: SLOPE INDEX OF INEQUALITY RATES OF MORTALITY BY MULTIPLE SCLEROSIS, BARHII REGION, 2009-2011
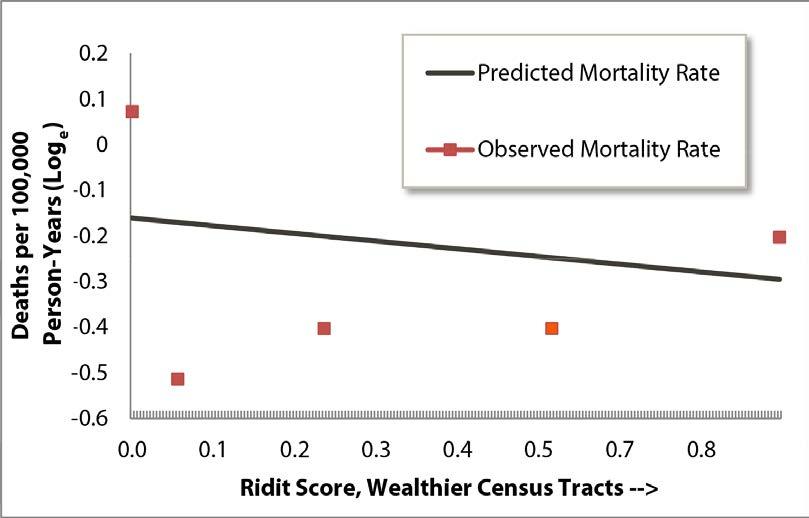
Many of the most important SDOH-LC indicators in this guide come from the American Com munity Survey (ACS). These data are freely available for health departments to download. The steps presented here summarize a very complex survey and only introduce health departments to the ACS and the many technical considerations and limitations that will guide future work with it. The screen shots in steps 1 through 10 describe how to download the data for educational at tainment data from the ACS. For the other indicators in the SDOH Guide from the ACS (i.e., in come distribution, housing affordability, linguistic isolation), the steps are similar but the specific tables will differ. For health departments in California, the Healthy Community Indicators project has already collected and compiled these data for many of the ACS indicators, described in more detail in Appendix D.
The educational attainment measure used here is as the percentage of adults 25 years and older with a high school diploma or equivalent or greater living in each Census tract. BARHII recom mends Census-tract level analysis because it is the smallest level of geography with educational at tainment data available. Also critical to SDOH indicator analysis is monitoring changes overtime at the Census tract level. Unfortunately, Census tract socioeconomic data have only been recently published, which limits time-series analysis at this level. However, time-series analysis will be avail able in the coming years. As a temporary solution, BARHII recommends monitoring educational attainment at the city/place level over time until more long-term, non-overlapping, Census tract data are available; see the next section.
These procedures will show how to download a CSV file from the American Community Survey (ACS), which can be imported into all statistical software (e.g., SAS, SPSS, STATA) or Microsoft Excel. We will use Contra Costa County data as an example. GIS software is recommended to illustrate Census tracts where a health department and partners should further assess and address educational attainment. The maps shown here were made using Esri ArcMap GIS. For depart ments without GIS software, EpiInfo—a free database, statistical, and mapping software package from the CDC—can create basic maps of these data as well using tract shape files from the US Census http://www.census.gov/geo/maps-data/data/tiger.html.
Because this guide cannot describe all of the technical intricacies of the ACS, BARHII recom mends reviewing the US Census Bureau publication “A Compass for Understanding and Using the American Community Survey Data, What Researchers Need to Know” http://www.census. gov/acs/www/Downloads/handbooks/ACSResearch.pdf to learn more about the capabilities and limitations of the ACS.
STEP 01. Visit the American FactFinder, and select “get data” next to the American Community Survey at http://factfinder2.census.gov/faces/nav/jsf/pages/index.xhtml.

STEP 02. On the tool bar on the left hand side, in the “Topics” box, select “People” then “Education” and finally select “Educational Attainment.” Educational attainment will appear in the box “your selections.”
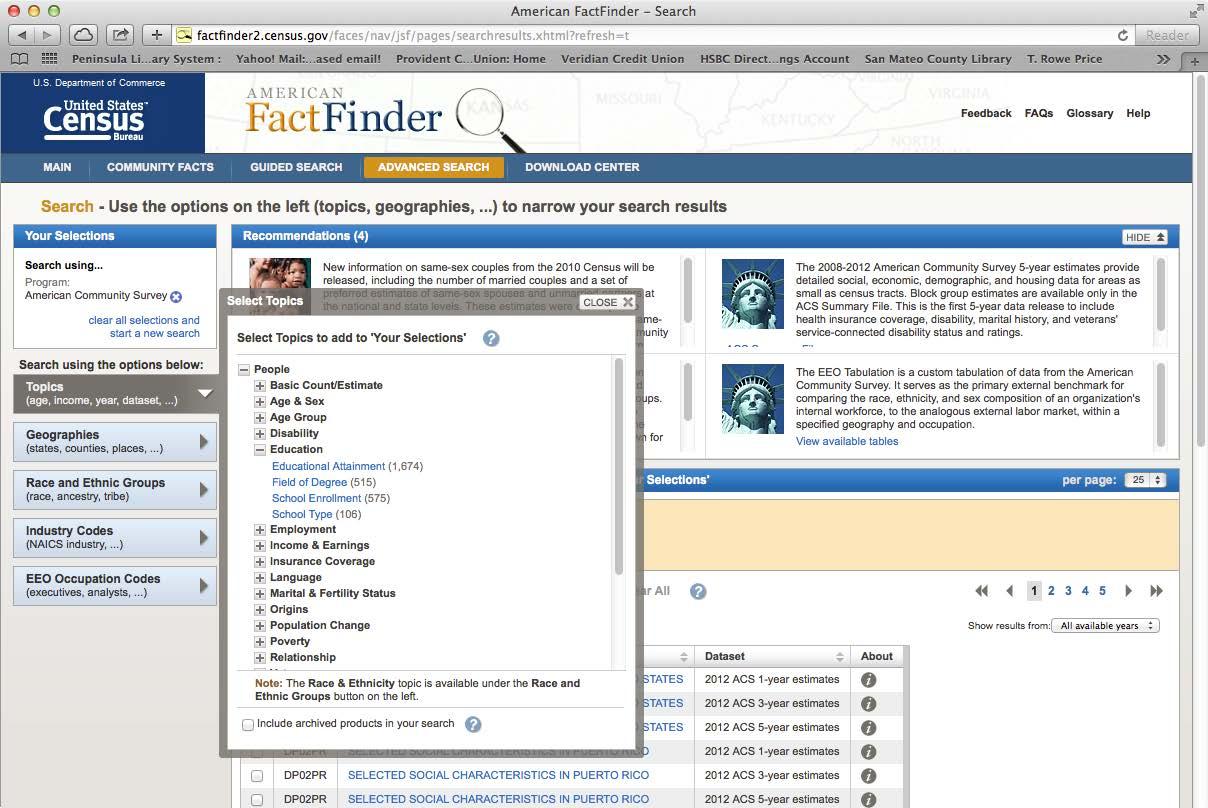
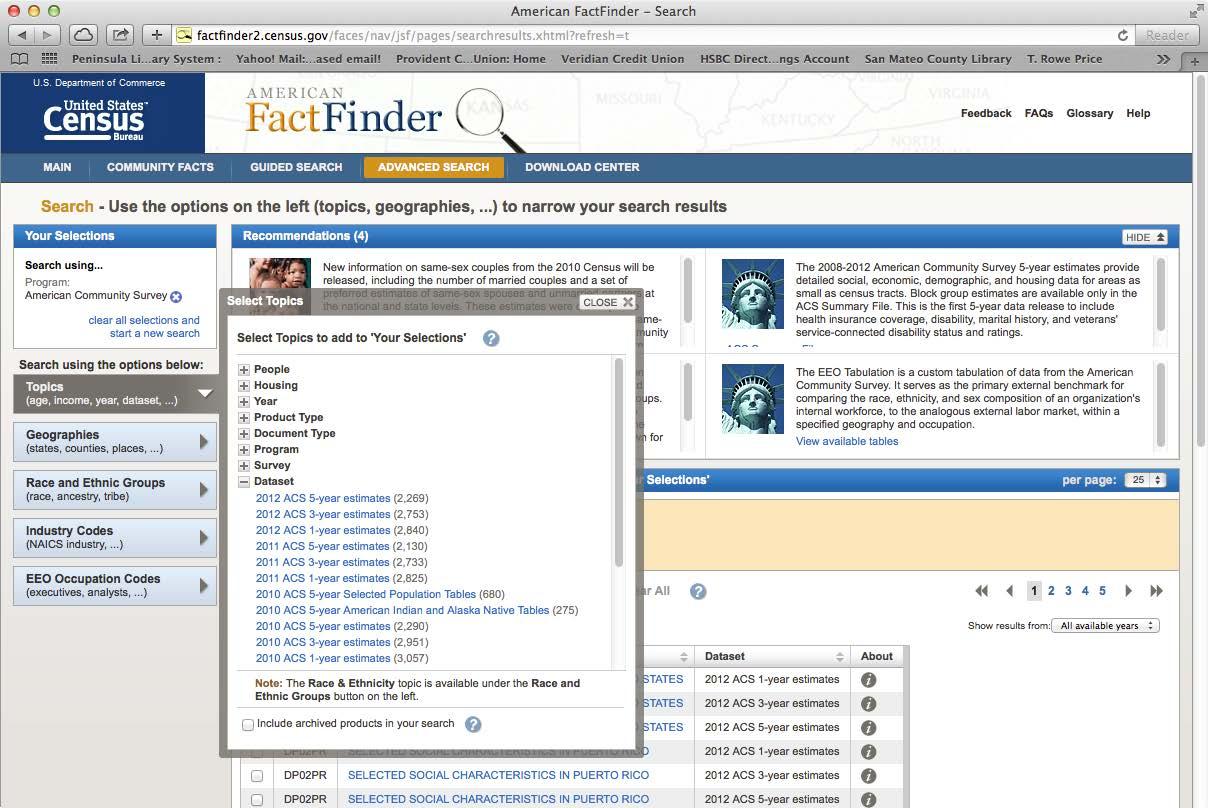
STEP 03. In the “Topics” box, select “Dataset” and then select 2011 American Community Survey 5-year Estimates. 2011 ACS 5-year Estimates will appear in the “Your Selections” box.
STEP 04. Under the “Geographies” box, select geographic type “Census tract – 140”: and identify the state and county that you want to analyze. Select “Add to Your Selections”
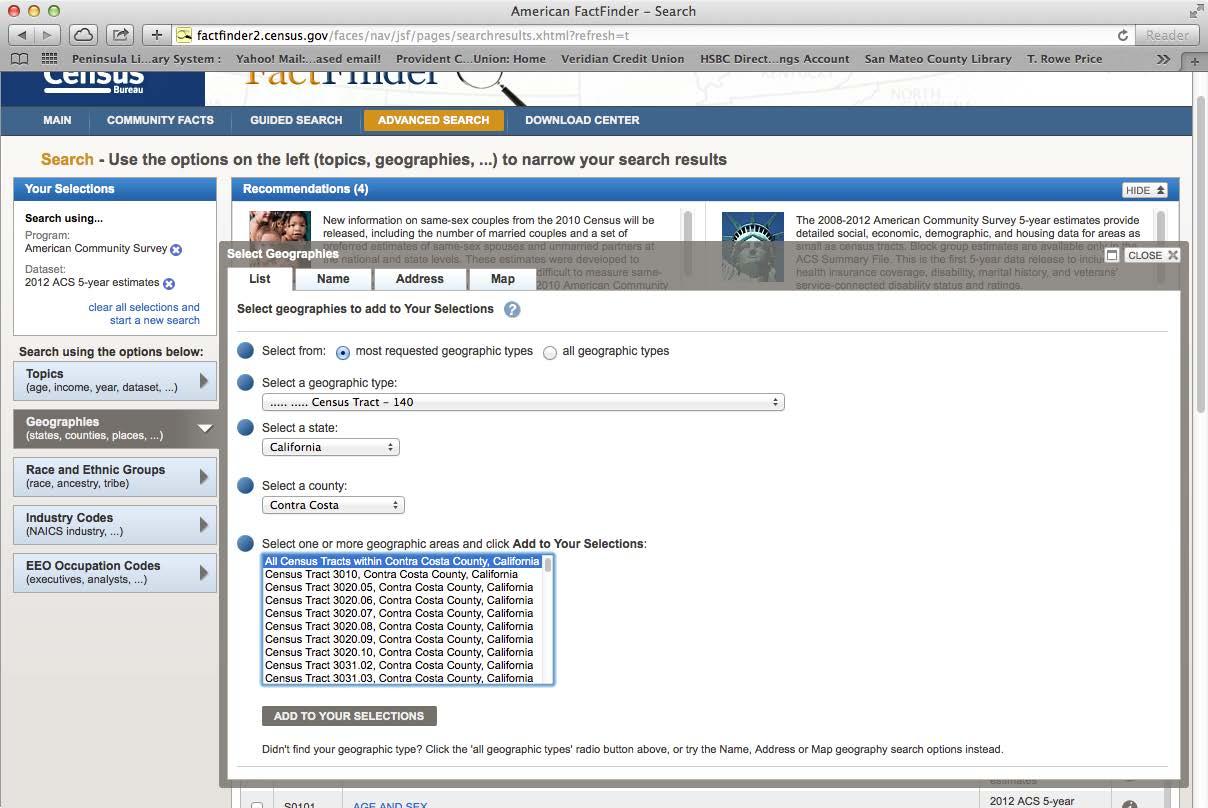
and close the Select Geographies box. The selection “All Census Tracts within Contra Costa County, California” is used in this example.
STEP 05. American FactFinder now shows a list of data tables found in the American Commu nity Survey available for download. In this example, the variable S1501 Educational Attainment was selected by clicking the check box.
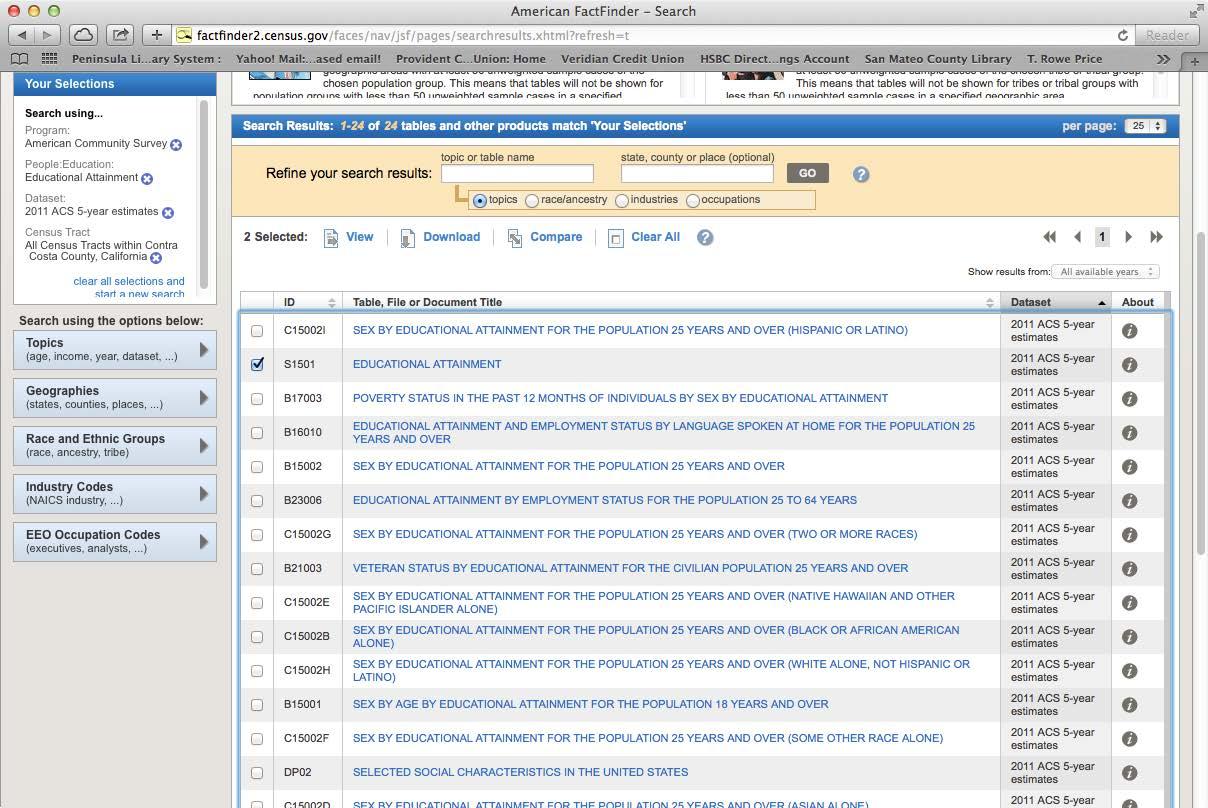
STEP 06. Download the data
STEP 07. American FactFinder will create a zip file containing the data in a .csv format, meta data, and other notes about data reliability.
STEP 08. Import the downloaded data into the statistical software of your choice or simply work with the data in Excel.
Steps 9 and 10 show how to assess the statistical reliability of this indicator
STEP 09. Using the metadata spreadsheet that accompanied the data, locate the variables for the total population aged 25 or over (HC01_EST_VC07), the number of high
school graduates or higher (HC01_EST_VC16), and their margins of error. HC01_ MOE_VC07 and HC01_MOE_VC16, respectively.
Notes on Step 9: The formulae shown here is to calculate the coefficient of variation for a published proportion. There are other formulae to calculate the standard error
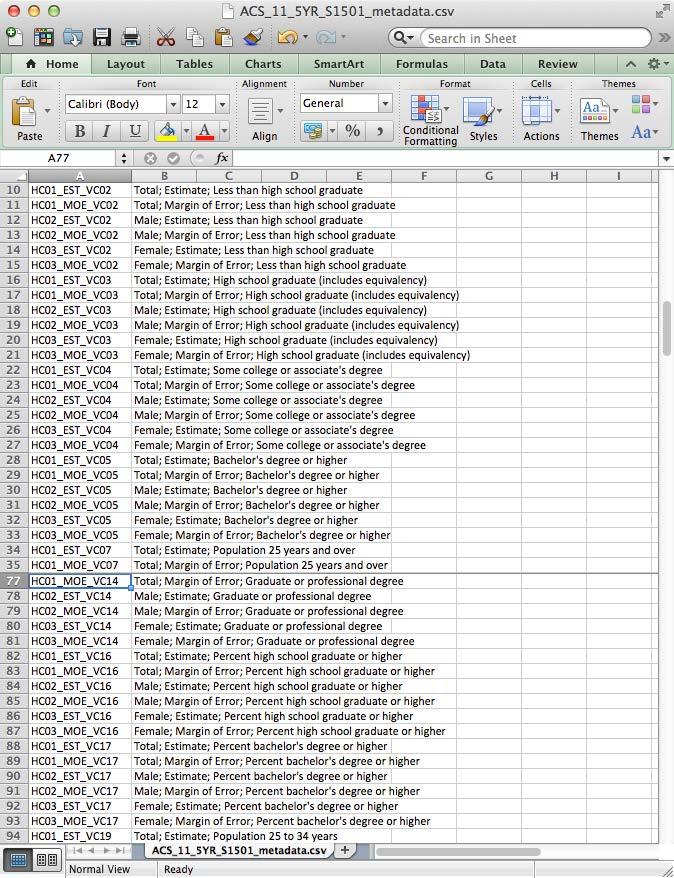
SE p = MOE p 1.645
and coefficient of variation depending on the statistic in question. For more details on this subject, review the following documentation.
STEP 10. Determine statistical reliability for the proportion used in Step 9 by calculating the standard error, 90% confidence interval and the coefficient of variation for each Cen sus tract.
A. Using the downloaded data, apply the following formula to calculate the stan dard error for the published proportion.
SE p standard error of the percent with a high school diploma, equivalent or above (HC01_EST_VC16)
MOE p is the margin of error for the proportion of adults over 25 with a high school education, equivalent, or higher. (HC01_MOE_VC16)
CV p = SE p percentHS *100
B. Calculate the upper and lower 95% confidence limits for the estimate.
Upper and lower 95% confidence limits of the percent LL_95cl = HC01_EST_VC16 – (HC01_MOE_VC16 * (1.96/1.645)) UL_95cl = HC01_EST_VC16 + (HC01_MOE_VC16 * (1.96/1.645))
C. Calculate the coefficient of variation from step a using this formula. CV p is the coefficient of variation for the percent. SE p is the standard error of the proportion of adults with a high school educa tion or equivalent (calculated in step 10a.) percentHS is the proportion of adults aged 25 or older with a high school education or equivalent (HC01_EST_VC16).
D. Display and interpret Census tracts with a coefficient of variation below 30% and display Census tracts with a CV slightly greater than 30% (e.g., 32%) with caution. For Census tracts with a coefficient of variation substantially greater than 30% (e.g., 80%), one of the following is recommended: 1) clearly indi cate those Census tracts on any map or table; or 2) do not display those Census tracts and include the following language: “Data from these Census tracts are statistically unstable and unreliable; interpret with caution.”
STEP 11. Map Census tracts with graduated symbols using the natural breaks or the geometric intervals method
We believe maps that assign warmer or more intense colors to Census tracts with more adverse SDOH indicators (i.e., graduated symbols) are among the most con vincing and understandable ways to present place-based SDOH data to stakeholders and the general public. The display methods built in ArcGIS software sufficiently identify priority areas for SDOH data and are an essential part of any presentation on health inequity or the SDOHs, although more advanced geospatial analysis is recom mended where applicable.
There are several ways to classify graduated symbols in ArcGIS, which include manual, equal interval, defined interval, quantile, natural breaks (Jenks), geometrical interval, and standard deviation. Details on these methods are at http://help.arcgis. com/en/arcgisdesktop/10.0/help/index.html
We find natural breaks and geometrical interval to be the most useful, as they are both good at showing the range of values and the existence of outliers. The natural breaks function looks for groupings in the data that have breaks that best maximize the differences between classes. Geometrical interval is similar to natural breaks in how it looks for class intervals, while creating more consistent intervals between classes. ArcGIS software typically creates five classes of graduated symbols by default, which we believe is sufficient.
For the purposes of health department health equity work, Census tracts in the low est performing symbol classes identified from the natural breaks or geometric interval should be designated as priority areas for focused SDOH health department assessment and intervention. For priority Census tracts that are deemed unreliable (see step 10d), we recommend two options: 1) consider pooling (reference the ACS guide here) with other unstable Census tracts that are similar in population composition (i.e., sparsely populated), physical geography (i.e., open space) or political designa tion (i.e., unincorporated areas vs cities and towns) 2) consider local data collection. If either of these methods is selected, it is advised to seek expert advice specific to your jurisdiction.
STEP 12. Identify priority areas identified from step 11. The map was generated based on this method. Areas that are identified as red are in the lowest performing group and should be prioritize for public health department intervention.
Part
Using the American Community Survey in Cities with 20,000 people or more.
It is recommended to track changes in educational attainment in the Census tract over time. Because of the small population size of a Census tract, tract-level trends are not currently available,
but they will be as time progresses. As a temporary solution, BARHII recommends to track educa tional attainment in cities with 20,000 people or greater using 3-yr estimates from the ACS. The procedure below shows how to identify the cities with the lowest educational attainment to track over time. Cities in the Bay Area will be used in the example. It is the same procedure as that shown above, except a different table is used. BARHII recommends monitoring trends because comparing a locale with itself over time is an efficient way to monitor progress in SDOH.
STEP 01. Visit the American Fact Finder, and select “Get Data” next to the American Commu nity Survey. http://factfinder2.census.gov/faces/nav/jsf/pages/index.xhtml
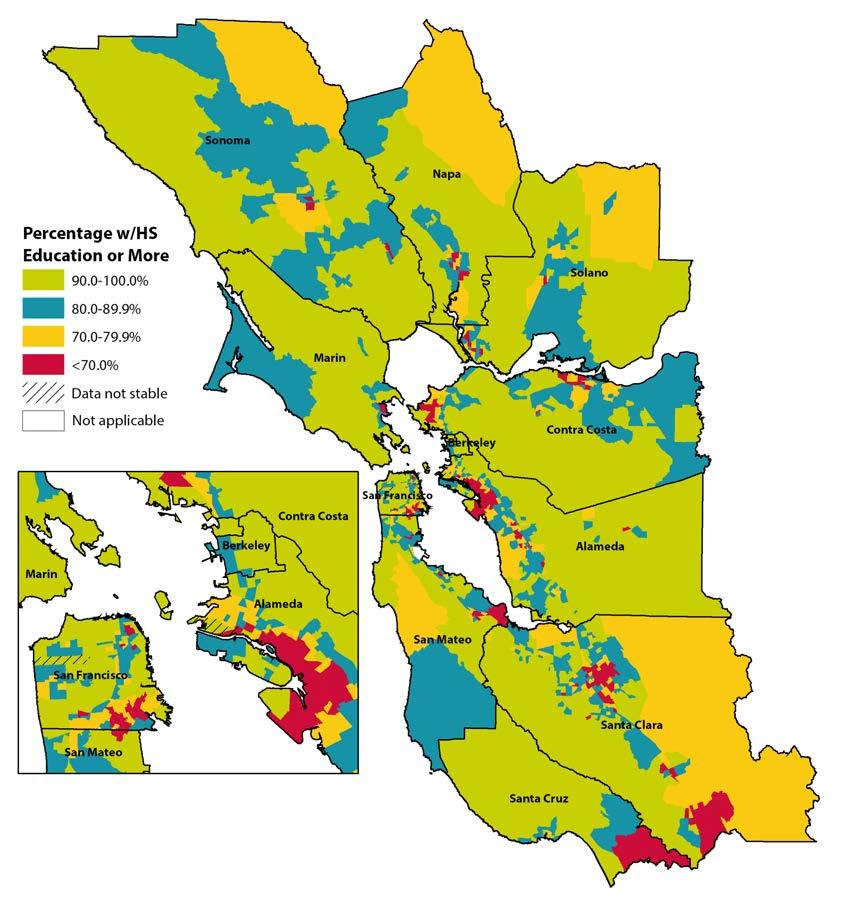
STEP 02. On the tool bar on the left hand side, in the “Topics” box, select “People” then “Edu cation” and finally select Educational Attainment. Educational attainment will appear in the box “Your Selections”
STEP 03. Under the “Topic Box, select “Dataset” and then select 2011 American Community Survey 3-year Estimates. 2011 ACS 3-year Estimates will appear in the box “Your Selections”.
STEP 04. Under the geographies tool box, select geographic type “Place -160”: and identify the state that you want to analyze. Close the “Select Geographies” box. All places in California are used as an example.
STEP 05. American Fact Finder will generate a list of variables that can be found in the Ameri can Community Survey available for download. In this example, the dataset S1501 educational attainment was selected by clicking the check box.
STEP 06. Download the data.
STEP 07. American Fact finder will create a zip file. The file will contain the data in a .csv for mat, metadata, and other notes about data reliability.
STEP 08. Import the downloaded data into the statistical software of your choice, including Excel.
STEP 09. Using the metadata spreadsheet that accompanied the data, locate the variables for the total population 25 or over, the percent of high school graduates or higher, and the margin of error for these variables.
SE p = MOE p 1.645
STEP 10. Using the downloaded data construct a spreadsheet as shown on page XX??.
EstimateHS = the estimated number of adults with a HS education or above = (HC01_EST_VC16 * HC01_EST_VC07) / 100
PercentHS = the percentage of adults > 25 with a high school education or above = HC01_EST_VC16
Total_ad25 = the total number of adults aged 25 or older = HC01_EST_VC07
A. Using the downloaded data, apply the following formula to calculate the stan dard error for the published proportion.
CV p = SE p percentHS *100
SE p = standard error of the percent with a high school diploma, equivalent or above (HC01_EST_VC16)
MOE p is the margin of error for the proportion of adults over 25 with a high school education, equivalent or higher. (HC01_MOE_VC16)
B. Calculate the upper and lower 95% confidence limits for the estimate.
Upper and lower 95% confidence limits of the percent
LL_95cl = HC01_EST_VC16 – (HC01_MOE_VC16 * (1.96/1.645))
UL_95cl = HC01_EST_VC16 + (HC01_MOE_VC16 * (1.96/1.645))
C. Step 10c: Calculate the coefficient of variation from step A using this formula.
CV p is the coefficient of variation for the percent.
SEp is the standard error of the proportion of adults with a high school educa tion or equivalent (calculated in step 10a.)
percentHS is the proportion of adult aged 25 or older with a high school edu cation or equivalent (HC01_EST_VC16).
Notes on Step 10: The formula shown here is to calculate a coefficient of variation for a published proportion. There are other formulae to calculate the standard error depending on the statistic and its use. For more details on this subject, review the following documentation: Instructions for Applying Statistical Testing to the 2008-2010 3-Year Data and the 2006–2010 ACS 5-Year Data, available at http://www.census. gov/acs/www/Downloads/data_documentation/Statistical_Testing/2010StatisticalTe sting3and5year.pdf or A Compass for Understanding and Using the American Commu nity Survey Data, What Researchers Need to Know, Appendix 3, at http://www.census. gov/acs/www/Downloads/handbooks/ACSResearch.pdf.
STEP 11. Calculate the total number of adults aged 25 or over in your jurisdiction or region. For the Bay Area: 4,357,754 adults.
STEP 12. Sort the completed spreadsheet with the cities with the lowest percent of adults with a high school diploma or equivalent at the top.
STEP 13. Calculate a cumulative sum of adults aged 25 or over in the sorted spreadsheet and name it cumtotal.
STEP 14. Cities whose cumulative population (variable cumtotal calculated in step 13) is less than 10% of the jurisdictional or regional population of adults 25 and over (less than 435,775 based on the example in step 11) should be prioritized. The 10% cutoff is arbitrary, but it serves as a good starting point for analysis absent other methods. The figure below outlines the priority cities using this method. Those cities are the ones health departments should consider for routine monitoring and forming community partnerships to address educational attainment. In the table below, this method identifies the following cities and unincorporated areas (CDP) in the Bay Area: Watsonville, San Pablo, East Palo Alto, Bay Point CDP, Ashland CDP, Gilroy, Richmond, Hayward, Pittsburg, and Napa because their cumulative population approaches 10% (372,940 adults) of the Bay Area total. Health departments are free to select and monitor cities not included in the cutoff group for other reasons.
STEP 15. Consider excluding the places identified in step 14 with a low population, a wide 95% confidence interval and/or a coefficient of variation greater than 30%. A city’s
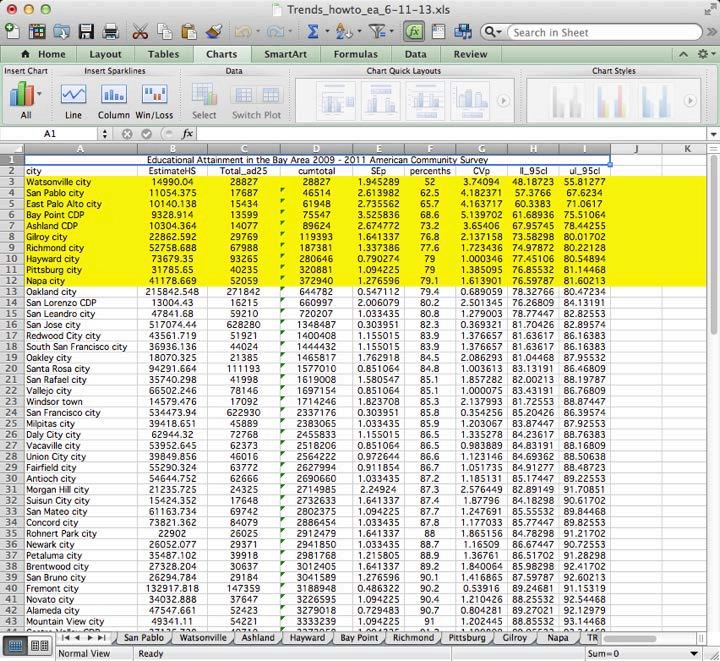
prevalence of high school education or equivalent that meets any of these criteria is considered unstable and should be interpreted with caution.


STEP 16. For each priority city, download 3-yr estimates of educational attainment by city from previous years’ ACS and the 2000 Census and repeat through step 10. Con struct a trend graph showing changes in educational attainment and their associated 95% confidence intervals in these cities. BARHII, following the Census Bureau’s guidance, does not recommend charting overlapping three-year estimates (i.e., 20072009, 2008-2010, and 2009-2011) to monitor trends.
STEP 17. Considering prioritizing the cities identified in step 14 with declines in educational attainment over time followed by cities with no change in educational attainment in the charts in step 15. Based on these criteria, the cities of Watsonville and San Pablo should be prioritized for further public health assessment because of the decline.
FIGURE B-2: PREVALENCE OF HIGH SCHOOL DIPLOMA OR ABOVE ADULTS 25+ YEARS, BARHII REGION AND SELECTED CITIES, 2000 TO 2008-2010 80 90 100 40 50 60 70 P ercentage BARHII Region 0 10 20 30 Gilroy San Pablo Watsonville 2000 2005-20072008-2010
As an example interpretation, the review of these charts indicates that educational at tainment for the BARHII Region has remained steady since 2000. Among the cities with the lowest educational attainment in the Bay Area (Watsonville and San Pablo), improvement in the educational attainment of those cities population peaked in the years 2005–2007 but declined near to year 2000 levels in 2010. Gilroy, another city with lower educational attainment in the Bay Area, has seen the most improvement in educational attainment since 2005–2007. Balance the results and limitations of this analysis with political considerations to identify the local agencies and institutions in the cities identified in step 16 for potential partnership.
Download and Analysis Steps for the California Health Interview Survey
The California Health Interview Survey (CHIS) is the nation’s largest state health survey and a critical source of data on Californians as well as on the state’s various racial and ethnic groups. It is a quick and easy online tool that enables anyone to search and compare health statistics by county, region, or across California.
AskCHIS is a free online tool that enables you to search for and compare health statistics on your county or region and the state as a whole, based on data from the CHIS. See http://healthpolicy. ucla.edu/chis/Pages/default.aspx. For a tutorial on how to use AskCHIS, see http://healthpolicy. ucla.edu/chis/data/Pages/askchis-tour1.aspx.
While CHIS is a complex, well-designed survey, it has some limitations. First, historically, esti mates from CHIS below the county level (e.g., city, Census tract) have been unavailable without oversampling at considerable expense. However, in late 2014, CHIS will begin to release subcounty estimates based on small-area analysis. For the time being, the ability to monitor historical trends from CHIS at these smaller geographies will be limited. Second, estimates about smaller population groups may not be sufficiently statistically reliable for public health practice. Third, for some indicators, CHIS collects data from selected groupings or sample populations (e.g., food insecurity questions are only asked of adults with household incomes that are less than 200% of the federal poverty level).
Considering the limitations of CHIS (and phone-based surveys in general), BARHII suggests that health departments always triangulate estimates from CHIS with other SDOH and other neighborhood-level data. While the example provided is for CHIS, this method to identify priority places and populations for a health outcome or social determinant of health can be applied to local surveys or others outside of California.
to Use AskCHIS to find information on Food Security
STEP 01. Go to http://ask.chis.ucla.edu and log in or create a username and password for the site.
STEP 02. On the first screen, select the geographic area of interest. Click the “Specific Counties in California” button.
STEP 03. Select your county. For BARHII member counties, select all counties in the Greater Bay Area and Santa Cruz.
STEP 04. Click on the “Main Topic” tab at the top of the screen. Select “Public Program Participation” then click the “Select” button next to “Food security (ability to afford
enough food)” to select food security as the main topic. For other years or related data, scroll through the list of main topics to find the topic area or year of interest.
STEP 05. Click on the “Compare By” tab at the top of the screen. To compare food security by
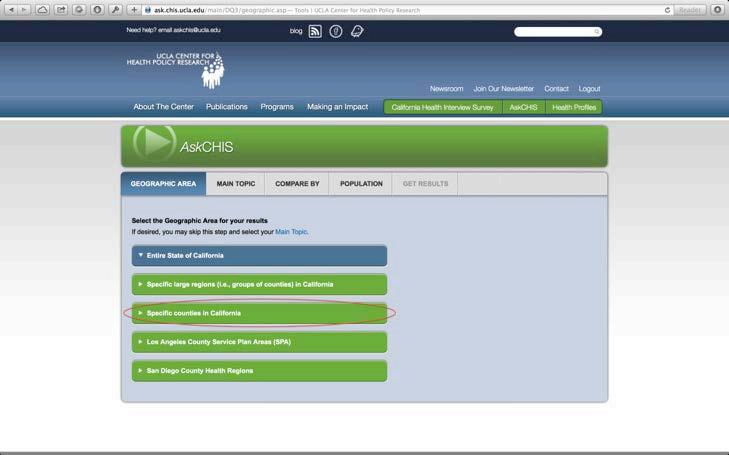
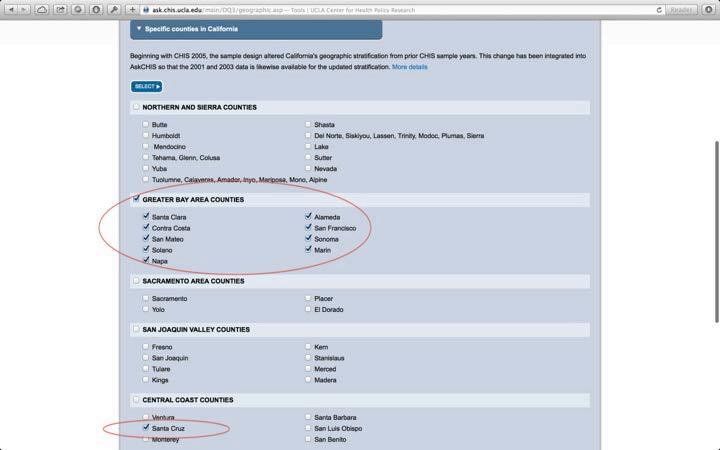
question mark symbol next to the variable title. To use different race/ethnicity clas sifications or race/ethnicity variables from previous administrations of CHIS, scroll through the list of variables to find the categories of interest.
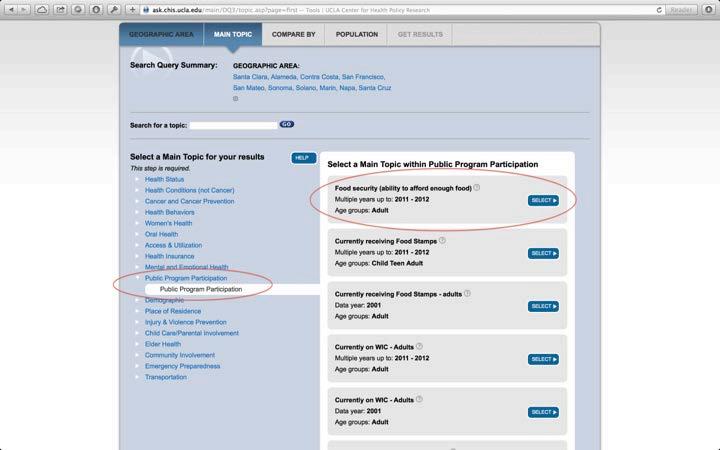
STEP 07. Click on the “Population” tab at the top of the screen. This screen gives users the option to limit the population included in the results. Users can select a specific age
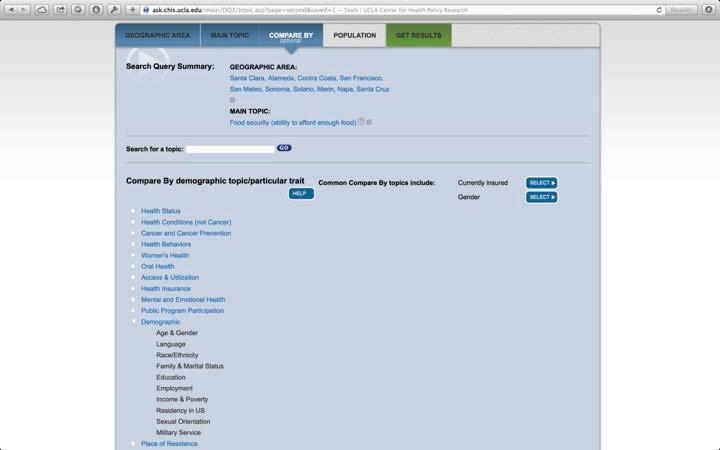
range, race/ethnicity, gender, or federal poverty level as part of their query.
In this example, ensure that the “Include all” option is selected for each of the cat egories (because we want to compare results for all low-income adults), then click the “Get Results” tab at the top of the page.
STEP 08. The resulting search query screen shows food security among low-income adults by race/ethnicity. Each cell contains the percentage of low-income adults who are food
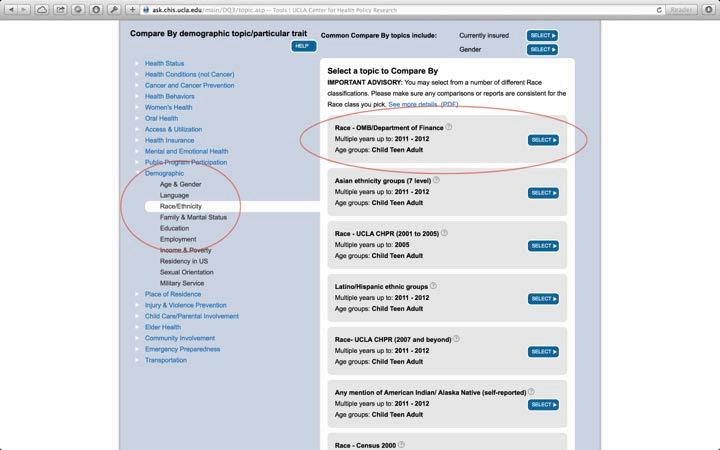
secure or food insecure within a racial/ethnic group, along with the confidence inter val, and estimated count (estimated number of low-income adults in the Bay Area). For example, in the Bay Area, 51.2% of low-income Hispanic/Latino adults experi enced food insecurity in the past year, compared to only 28.9% of low-income White (non-Hispanic/Latino) adults.
Cells marked with a red asterisk mean that the data may be statistically unstable due to a small sample size or high relative standard error. Unstable cells should be viewed
with caution and clearly indicated as unstable if ever presented publicly. For a de tailed discussion on statistical stability in CHIS, please visit the methodology section at http://healthpolicy.ucla.edu/chis/design/Pages/methodology.aspx. Results can be viewed as a data table, pie chart, bar graph, or trend line by clicking on these tabs at the top of the screen.
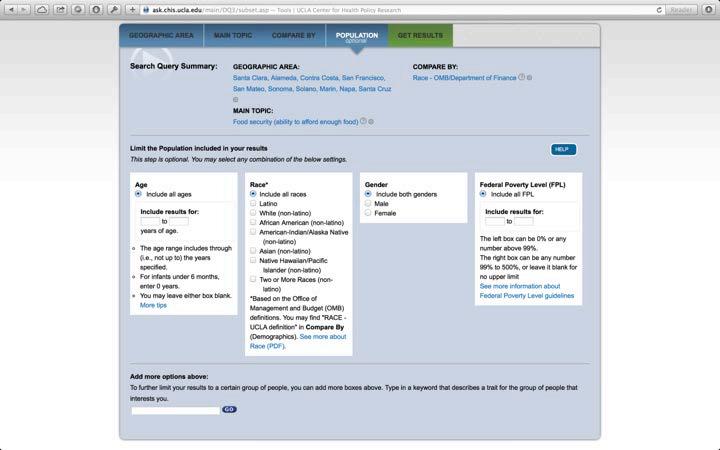
STEP 09. Identify the racial/ethnic groups with statistically unstable results in step 8. In the example above, estimates for American-Indian/Alaska Natives and Native Hawaiian/ Pacific Islanders are statistically unstable.
STEP 10. Run trend analysis of food insecurity for the region and by racial/ethnic groups by clicking the “Trend Line” tab.
STEP 11. Interpret the trend chart to determine priority populations among racial/ethnic groups with statistically stable estimates.
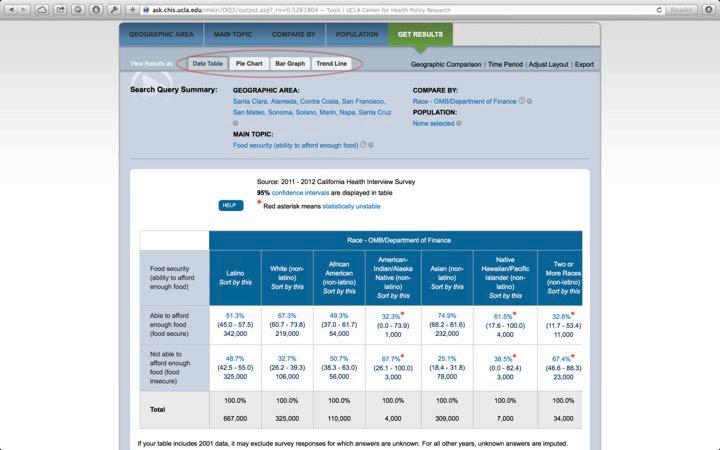
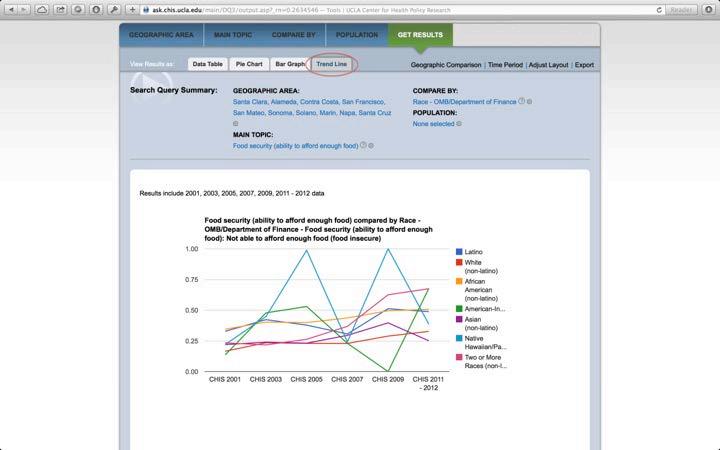
For LHDs in California, the Healthy Community Data and Indicators Project of the California Department of Public Health has collected and compiled data from many sources. As of October 2014, the project includes 21 indicators in various domains: meets basic needs of all, quality and sustainability of environment, adequate levels of economic, social development, health and social equity, and social relationships that are supportive and respectful. For details see http://www.cdph. ca.gov/programs/Pages/HealthyCommunityIndicators.aspx.
Follow these steps at the above link to download data from the California Air Resources Board. Epidemiologists from areas outside California would need to contact their state air resources board for these data.
STEP 01. To the left of the indicator of interest, click the PDF icon for a summary of information about the indicators, the data source, and other information. To download the dataset, click the Excel icon to the left of the indicator. This will start the down load of the spreadsheet. Other indicators may have downloadable data available as a zipped file.
STEP 02. When the spreadsheet has finished downloading, open it. The indicator spreadsheet will have four tabs. For PM2.5, the first tab is called “PM25_zcta_place_co_region_ ca,” and contains the data of interest. The second tab, “Data Dictionary,” contains information on each of the columns in the first tab. The third tab, “DataFilteringIn structions” contains information on how to select geographic areas of interest. These instructions are also contained in this SDOH Guide. The fourth tab, “MPO_County list” provides a MPO (metropolitan planning organizations) region-to-county crosswalk. This is especially important when analyzing data by region in the California.
STEP
The following procedures demonstrate how to set up a file for mapping zip code data for the San Francisco Bay Area.
A. Place cursor in the worksheet.
B. Click the ”Data” tab on top row of tool bar. C.
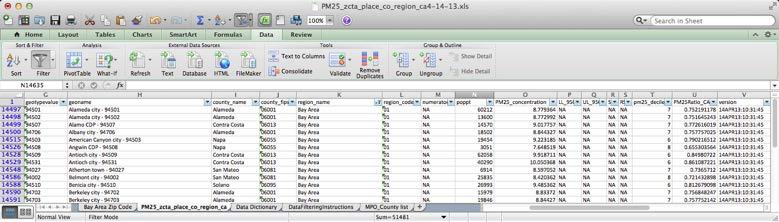
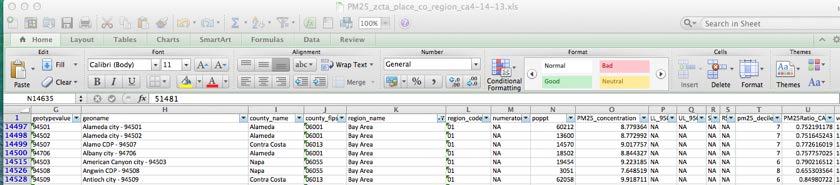
Click the “Filter” icon. Filter picklist arrows will appear in the columns.
D. Click on the Filter picklist arrow in the “geotype” column and select “ZC” for zip code followed by “Bay Area” in the “region_name” column. You can select geographies by city or county as well.
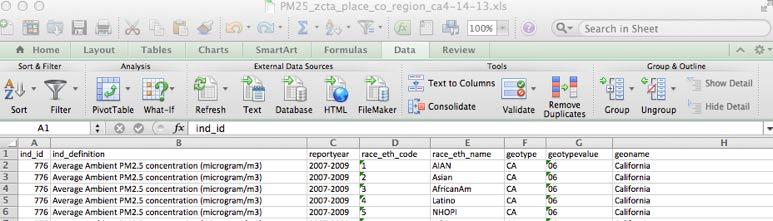
E. Results will look like this:
F. Click on “select all” if you want to start over again.
Fields to filter
Filter Selection Reportyear geotype county_name
Multiple Baay Area cities for a single year 2006 PL
Multiple cities within a single county (e.g., Napa) 2006 PL Napa County totals in the Bay Area 2006 CO
G. For selecting other geographies:
STEP 04. Preparing Excel spreadsheet for mapping
When preparing to map these data by zip code for a region like the San Francisco Bay Area, for example, not all columns will be necessary for mapping purposes.
A. Once the desired geographic area has been selected, copy and paste the new spreadsheet with the filtered data into a separate tab on the worksheet. The new worksheet tab will only contain the filtered data. Keep the original as is in a separate tab.
B. In the tab that contains the filtered spreadsheet, delete all columns except for “geotypevalue,” “geoname,” “county_name,” “poppt,” and “PM25_concentra tion.” Two other data columns, “pm25_decile” and “PM25Ratio_CA,” can also be used for analysis purposes, particularly if mapping statewide mean concen trations. The spreadsheet should look like this.
C. The map can now be created using natural breaks as determined by ArcGIS using the mean concentrations provided in “PM25_concentration.” Categories can also be assigned to each of the mean concentrations using an “IF” formula statement.
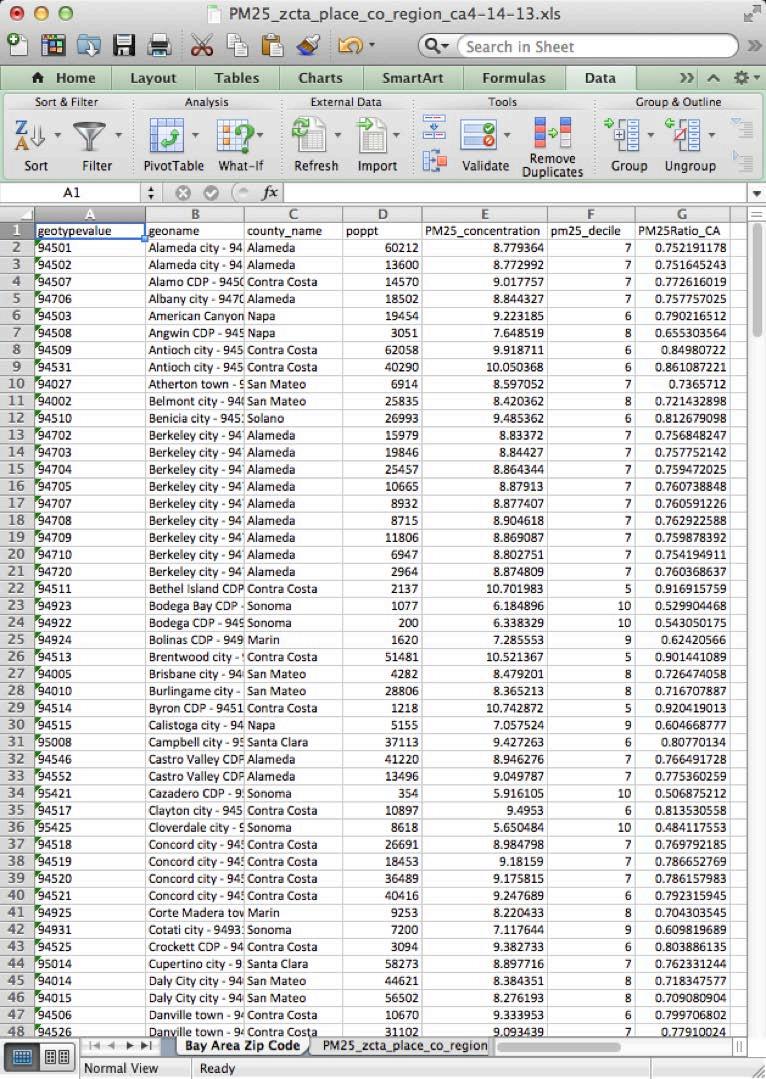
D. In the example provided, we decided to divide the mean PM 2.5 concentration into five categories, “< 8.0,” “8.0 to <8.5,” “8.5 to <9.0,” “9.0 to <9.5,” and “9.5+.”
E. Use this formula to define categories, changing the number parameters as needed: =IF(E2<8,“<8.0”, IF(E2<8.5,“8.0 to <8.5”, IF(E2<9,“8.5 to <9.0”, IF(E2<9.5, “9.0 to <9.5”, “9.5+”))))
F. Before mapping, check that field being used to join the Excel file to the mapping file is defined as a “TEXT” field. In this case, the field that will be mapped is ”geotypevalue” which contains zip codes, but this can vary depend ing on what field will be joined to data in ArcMap.
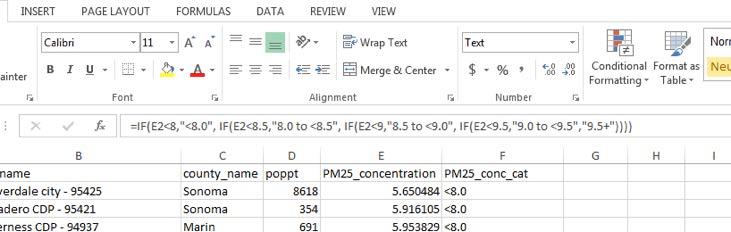
G. The map is colored using the previously defined categories calculated in Excel. Zip codes with lower mean concentrations of PM2.5 (<8.00) are shaded green; Zip codes with the highest mean concentrations of PM2.5 (9.50+) are shaded red. Mapping the mean concentrations of PM2.5 in the Bay Area shows the geographic variability of PM2.5 in the region. Zip codes in the eastern part of the Bay Area, namely in parts of Solano, Contra Costa, Alameda, and Santa Clara Counties, have higher mean concentrations of PM2.5 relative to other Bay Area Zip codes.
The HCI project includes the coefficient of variation (CV) (also known as the relative standard er ror or RSE) for most indicators, especially those based on surveys such as the American Commu nity Survey. Most of the indicators collected by the HCI calculate a coefficient of variation (listed as a relative standard error) using this formula:
CV p = (SEestimate / estimatep) *100
Where: CV p = the coefficient of variation for a percentage estimate SEestimate = the standard error for an estimate estimate = the estimate
A lower CV indicates the estimate is reliable, higher CV means it is less so. If the CV is greater than 30%, the data is generally considered unstable and should be indicated as such on a map, if displayed at all.
FIGURE D-1: ANNUAL MEAN AMBIENT CONCENTRATION OF FINE PARTICULATE MATTER (PM2.5), BARHII REGION, 2007-2009.
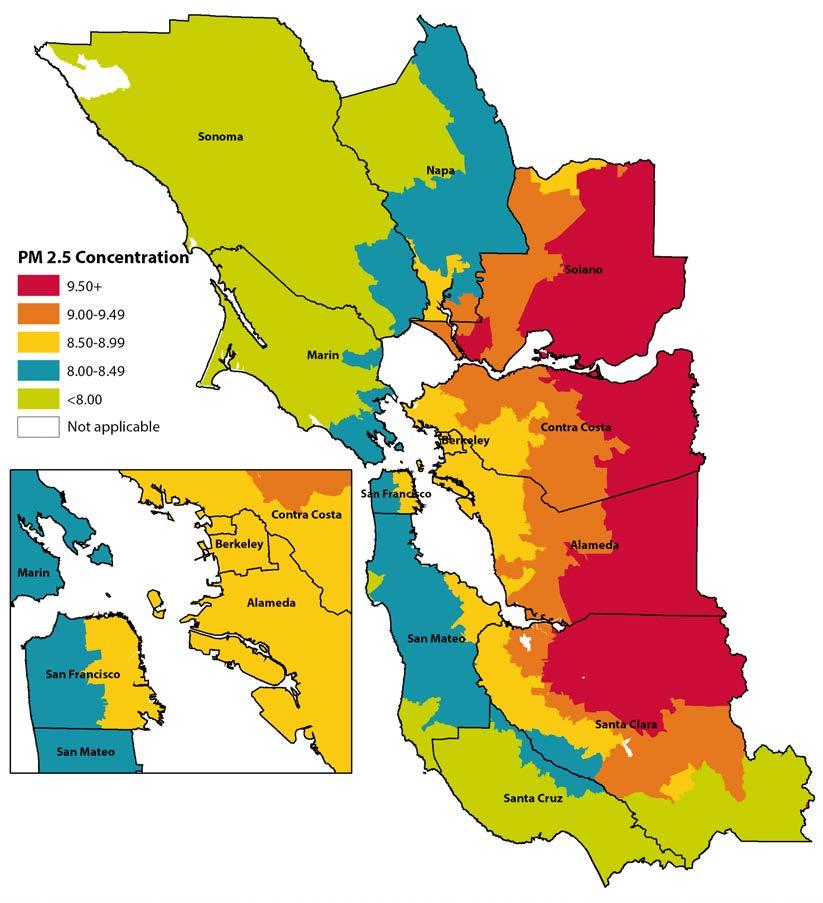
There are many ways to analyze income and poverty for public health. Poverty is better to look at than household income in at least one respect—it adjusts for the size of the household. A household income of $100,000 is much different for a household of two people versus a house hold of eight. The poverty line is based on household size as well as income. The poverty rate is reported by individuals or by families, although poverty status is attributed from the household. The household poverty status is based on total household income and the number of people in the household according to the poverty guidelines from the U.S. Department of Health and Human Services. The poverty line is adjusted for Alaska and Hawaii, but for no other geographies. Thus cost of living is not reflected in calculating poverty.
The poverty line, though, is considered much too low to sustain even a very meager lifestyle. Thus many government programs’ eligibility is determined by some multiple of poverty income. For this reason, the American Community Survey, in indicator C17002, reports on persons with ratios ranging from 50% of poverty level to 200%. Other tables (e.g., B17001) report the poverty level to 500% and over.
The American Community Survey, combined with the decennial Census from 2000 and previous, allows trend analysis of poverty rates. For Census 2000 data, the Census Bureau’s American Fact finder may be used. For decennial Census data before 2000, the easiest site to use is the National Historical Geographic Information System at http://www.nhgis.org. This site gives both data from the decennial Census back to 1790 as well as ArcGIS-compatible boundary files.
To download the poverty data from the American Community Survey, use the methods outlined in Appendix B and look for indicator C17002. This is the data on individual poverty for all races/ ethnicities combined. You can also download data for individual races/ethnicities; these are in the data following B17001, and include B17001A for Whites and B17001B for African Americans/ Blacks.
Median household income, indicator B19013 in the American Community Survey, is the stan dard method of measuring income. Another way to measure income, and a good way to compare between areas, is to calculate the percentage of households in the top income brackets versus the percentage in the lowest income brackets. For the American Community Survey, indicator B19001 may be used. The lowest bracket is less than $10,000 and the highest bracket is $200,000 or more.
Census tracts may have unreliable or unstable estimates because they are truly sparsely populated or have too few people per year living below poverty or other ACS indicators. Areas with few inhabitants typically include rural areas, restricted areas (e.g., airports, reservoirs, military bases), public open spaces (e.g., parks) or unincorporated areas. However, because in some Census tracts the non-response rate to surveys like the ACS might be higher than average due to population characteristics such as immigration status or race/ethnicity, a health department must determine through local assessment efforts if there are populations in their jurisdiction whom the ACS does not represent.
Statistical reliability is one of the most difficult subjects to explain to people unfamiliar with data; however, it is one of the most important. When possible, this guide explains how to calculate standard errors and relative standards errors for indicators to assess data reliability. Assessing the data reliability through the relative standard error (RSE) is important to prevent misinterpretation of data, which could lead to inappropriate policies and poor resource allocation decisions. Gener ally, BARHII recommends the following for any indicator with a RSE greater than 30%: clearly indicate the estimate as unreliable on any map, table, or narrative with the following language: “these data are statistically unreliable, interpret with caution”; avoid using those estimates in any epidemiologic, or financial modeling, consider local data collection in those areas or use a different indicator.
Statistical reliability of estimates could be improved by aggregating estimates to a higher geograph ical level, aggregating over time, or by collapsing categories.
The ACS uses a replicate-based methodology to calculate the standard errors of the sample weighted estimates it publishes. To create categories that go beyond those published by the ACS, stan dard errors for sums, differences, ratios, proportion, or products are derived using an approximate method that is documented in Accuracy of the Data, available at http://www.census.gov/acs/www/ data_documentation/documentation_main/. The standard errors obtained by the approximate method could either underestimate or overestimate the true standard error. Further, as the number of estimates involved in a sum or a difference increases, the approximate standard error will be come increasingly different from the standard errors derived using the replicate method. Although
the accuracy of the standard errors could be improved by using PUMS data. These data are not available for smaller geographical areas such as Census tracts for confidentiality.
When working with data different to the ACS, standard errors might not be available. It is pos sible to approximate the standard error for Poisson (counts) and binomial variables (proportions) as follows:
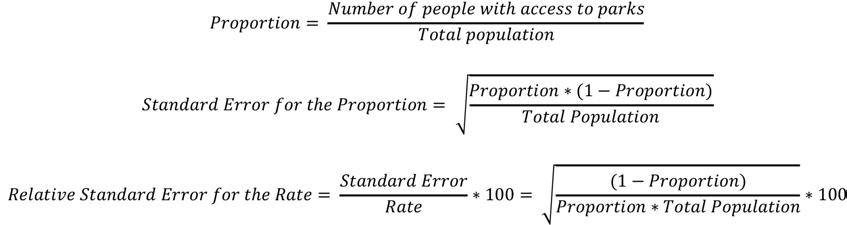
Poisson standard error (counts) example: annual injury rate per 10,000 people
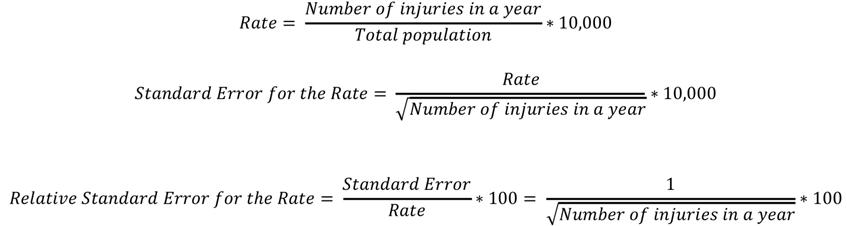
Binomial standard error (proportion) example: access to parks versus no access to parks
In this guide, BARHII recommends calculating 90% confidence intervals for American Com munity Survey data because those are based on margins or error published by the Census. While a 95% confidence interval is a standard most often used in statistics and epidemiology, BARHII recommends to consider an 80% confidence interval for many of the social and economic indicators presented if less statistical precision is needed for a program or policy objective.
Although they are important concepts in the literature about the SDOHs, this guide does not discuss collinearity or confounding, For example, a collinear relationship between poverty and educational attainment exist, potentially confounding the analysis between one of these determinants and health outcomes. Nevertheless, we believe that this limitation does not discredit the recommendations in this guide for these reasons: 1) The expertise required to properly account for collinearity in the SDOHs may be beyond the expertise of most LHDs, and is, therefore, a topic best reserved for research institutions. 2) One such landmark research project, the Harvard Health Disparities Geocoding Project, analyzed many SDOHs in various combinations, morbidity, and mortality and found that poverty alone consistently identified social gradients in health (citation below). This research supports this guide’s recommendations, especially recommendation 3 in the introductions, which recommends using poverty to identify places with the greatest health ineq uity, although collinearity between poverty and other SDOHs may exist.
The advantage of aggregating data over time is an improved reliability of the estimates. The ACS combines population or household data from multiple years to produce statistically reliable numbers for small counties, neighborhoods, and other local areas. In general for any given area, the larger the sample and the more months included in the data, the greater the confidence in the estimate.
The ACS collects data continuously and then aggregates the results over a specific time period to produce one-, three-, and five-year annualized estimates of population or household. In contrast, the decennial Census typically collected data between March and August. As a consequence, estimates might not be comparable between the ACS and the decennial Census. One advantage of spreading data collection evenly across the entire period is that it avoids over-representing any particular month or year within the period.
The key trade-off to be made in deciding whether to use single-year or multiyear estimates is between currency and precision. Multiyear estimates should, in general, be used when singleyear estimates have large RSEs or when the precision of the estimates is more important than the currency of the data. Multiyear estimates should also be used when analyzing data for smaller geographies and smaller populations in larger geographies. Multiyear estimates are also of value when examining change over nonoverlapping time periods and for smoothing data trends over time.
U.S. Census Bureau, 2008
Differences in data collection may cause time discontinuities: changes in a survey question or changes in the sampling universe (e.g., including or excluding group quarters).
Census tract boundaries can change each decennial Census. Census tracts with a significant change in population and in boundaries should be accounted for in any trend analysis. The Cen sus publishes geographic relationship files that show the comparability for the same type of geog raphy over different periods of time (e.g., the relationship between places in 2010 and places in 2000), including estimates on how the Census 2010 population is distributed within the boundar ies of Census 2000 geographies. This information is available at http://www.census.gov/geo/mapsdata/data/relationship.html.
Because of privacy concerns, the Census tract is the smallest level of geography available for all social and economic indicators in the American Community Survey. The ACS publishes one-year estimates for areas with at least 65,000 people, three-year estimates are available for all areas with at least 20,000 people, and five-year estimates are available for all geographic areas down to the block group level.
Understanding the SDOHs at a race or ethnic level is also challenging because the data often fail to account for different ethnicities within a race. Most SDOH indicators in their current form use broad race/ethnic categories (Asian, African American/Black, White, Other/Unknown, Multirace). These categorizations can be misleading. For example, an indicator will often describe the number of Asian people, but it fails to break out by Asian ethnicity (e.g., Korean, Chinese, Vietnamese). Furthermore, Pacific Islanders are often grouped together with Asians. Similarly, the category Hispanic/Latino does not account for the different countries of origin or cultures (e.g., Mexico, Argentina, Spain), and the category American Indian/Alaskan Native includes hundreds of tribes. These categories make it difficult to capture accurate race/ethnicity data, as people who complete the information may be identified incorrectly by someone else, or may not identify with the limited categories. In addition, these groupings make it difficult to develop population-specific health interventions because one ethnicity may have different cultural beliefs and practices about health behaviors (e.g., tobacco, diet) than another, although they share the same racial category. While some ethnicity-specific data are available at the Census tract, block group, and block levels, stratifi cation by social or economic factors is limited. This is a significant limitation of SDOH indicators that can only be currently remedied by place-based population assessment and advocacy for more precise collection and reporting about race and ethnicity in SDOH datasets.
The U.S. Census Bureau estimates that the ACS non-response rate is about 10% for the overall population, but it might rise to 15 to 20% among undocumented migrants. One study indicated
that ACS non-respondents are different from respondents, and are more likely to be male, African American/Black, and between 25 and 44 years. To increase the accuracy of the population counts, the U.S. Census Bureau imputes the existence and number of people living at address with no response. The imputation methods either use rules to determine acceptable answers or use answers from similar housing units or people who provided the item information.
A group quarters (GQ) facility is a facility owned or managed by an entity or organization to provide housing and possibly services for the residents, whom are usually unrelated people. GQs in clude college residence halls, residential treatment centers, skilled nursing facilities, group homes, military barracks, correctional facilities, workers’ dormitories, and facilities for people experiencing homelessness. Young adults and the elderly are more likely than other groups to be living in group quarter facilities. The ACS began including samples of the population living in group quarters in 2006; as a result, 2006 ACS data may not be comparable with data from earlier ACS surveys. GQs are defined according to the housing and/or services provided to residents and are identified by Census GQ type codes. 2010 Group Quarters Classifications in the American Community Survey are found at http://www.census.gov/acs/www/Downloads/data_documentation/CodeLists/2010_ ACS_Code_Lists.pdf
It is important to understand what percentage of the population lives in group quarters in a par ticular geographical area especially at small geographies like Census tracts or in rural areas where GQs could represent a large fraction of the population. Figures 1 and 2 show examples of the percentage of the population that lives in GQ in two regions of California; in the rural county of Lassen almost a third of the population lives in institutionalized GQ (correctional institutions). In order to avoid misleading estimates it is important to remove Census tracts where large group quarter populations are located from certain calculations like poverty.
Significance testing is the determination of whether the difference between two estimates is not likely to be from random chance (sampling error) alone. It is not recommended to rely on overlap ping confidence intervals as a test for statistical significance. It is also not recommended to con duct significance testing using statistically unreliable estimates (RSEs >30%).
Details on how to conduct a test comparing between two years or two geographical regions can be found in Instructions for Applying Statistical Testing at http://www.census.gov/acs/www/ data_documentation/documentation_main/.
When using ACS data, the Census Bureau recommends that when comparing between two differ ent geographic areas, make comparisons within the same estimate type: one-year estimates should only be compared with other one-year estimates, but never with three- or five- year estimates. The Census Bureau also recommends that, when comparing over time, compare periods that do not
FIGURE E-1: PERCENTAGE OF THE POPULATION LIVING IN GROUP QUARTERS BY GROUP QUARTER TYPE, COUNTIES IN THE BAY AREA, CALIFORNIA, APRIL 2010
Institutionalized-Other Institutionalized-Nursing Institutionalized-Juvenile Correction Institutionalized-Correction


FIGURE E-2: PERCENTAGE OF THE POPULATION LIVING IN GROUP QUARTERS BY GROUP QUARTER TYPE, COUNTIES IN THE NORTHEAST SIERRA REGION, CALIFORNIA, APRIL 2010

overlap—comparing 2005–2007 estimates with 2008–2010 estimates, for example. This means waiting longer to identify a trend.
For some indicators it might not be known if the data owners (sources) have rigorously validated the data. Without localized confirmation, errors could result in an inaccurate portrayal of the indi cator. BARHII recommends that SDOH indicators be validated when feasible, primarily through local data collection efforts and especially in priority areas identified.
It is important to be aware and acknowledge the potential problems with data quality when using external data sources to construct indicators. These problems might include low response rates that lead to missing data, systematic error or bias, potential misclassification of observations, or geocoding errors. For example, the Statewide Integrated Traffic Records System (SWITRS) of the California Highway patrol is a database that serves as a means to collect and process data gathered from a collision scene. This is a valuable resource for road traffic injury data by occurrence, but it is known to undercount both fatal and severe injuries compared to death certificates and hospitalizations.
Based on the availability and structure of an indicator, its numerator and denominator may reflect occurrences of anyone in a place whether they reside in that area or not. As an example, in injuries per capita indicators, road traffic injuries are by occurrence while population is by residence.
Inflation affects the comparability of dollar denominated data such as income, rent, home value, and energy costs, across time periods. The ACS adjusts dollar-denominated data amounts using inflation factors based on the Consumer Price Index (CPI). This adjustment is done at the nation al level; the ACS does not adjust for differences in costs of living across different geographic areas.
Caponi V, Plesca M. 2013. Empirical Characteristics of Legal and Illegal Immigrants in the U.S. Discussion paper 7304. Institute for the Study of Labor. http://ftp.iza.org/db7304.pdf. Accessed October 2014.
Krieger N, Chen JT, Waterman PD, Soobader MJ, Subramanian SV, and Carson R. 2002. Geocoding and Monitoring of US Socioeconomic Inequalities in Mortality and Cancer Incidence,: Does the Choice of Area-Based Measure and Geographic Level Matter? American Journal of Epidemiology 156(5):471-482.
Leslie TF, Raglin DA, Braker EM. 2002. Can the American Community Survey Trust Using Respondent Data to Impute Data for Survey Respondents? Are Nonrespondents to the ACS Different from Respondents? http:// www.fcsm.gov/committees/ihsng/2003_pub_ver_tl_10_16.pdf. Accessed October 2014.
U.S. Bureau of Labor Statistics. 2007. The Consumer Price Index. BLS Handbook of Methods. Washington, DC: U.S. Bureau of Labor Statistics. http://www.bls.gov/opub/hom/pdf/homch17.pdf. Accessed January 2013.
U.S. Census Bureau. 2008. A Compass for Understanding and Using American Community Survey Data: What General Data Users Need to Know. Washington DC: U.S. Government Printing Office.
SOCIAL DETERMINANTS OF HEALTH INDICATORS TO ADVANCE HEALTH EQUITY
CATEGORY WHAT TO MEAURE INDICATOR MEASUREMENT
COMMUNITY FINANCIAL INFRASTRUC TURE
Mortgage loan interest rates and approval rates
Mortgage loan approval rates by income level and by race/ethnicity
Underserved communities
Prevalence of mortgages in high-risk markets with high interest rates
DATA SOURCE
Home Mortgage Disclosure Act (HMDA)
Community Reinvestment Act
U.S. Department of Housing and Urban Development
Prevalence of mortgages originated by subprime lenders HMDA
Prevalence of retail banking services
Government direct investment in local business (accountability indicators)
Measures of debt
FOOD INSECURITY
Food prices and foregoing meals
Frequency and amount of small business loans
Dun & Bradstreet and other business databases
Piece together from news sources, city, county board meeting notes, and other public records.
Community Reinvestment Act
Small Business Administration
Ability to afford enough food; percentage foregoing meals from poverty subgroup
HEALTH CARE STRESS/ SECURITY
COST OF LIVING
Percentage foregoing health care due to cost
Measures of income growth and cost of living
PERSONAL WEALTH
Percentage delayed or didn’t get medical care, prescription, test, or treatment
California Health Interview Survey (CHIS)
HCI
CHIS
Oral Health Assessment California Department of Education
Change in income distribution
Local cost of living
ACCRA cost of living index
Distribution of wealth
ACS
Bureau of Labor Statistics, Consumer Price Index
Council for Community and Economic Research
Distribution of wealth (income and assets) Panel Study of Income Dynamics
IRS Statistics of Income
Percentage and number of local jobs filled by local residents
ACS — special extraction
COMMU NITY AND PUBLIC SUPPORT SERVICES
Subsidized housing
Number of public housing units in geog area; ratio of enrolled to qualified to population; number or percentage enrolled and on wait list for PH; number of open/available public housing units; measure of turnover; percentage receiving public housing subsidies
Local housing agency
Public assistance
Percentage of population on General Assistance, Medi-Cal, CalWORKs, CalFresh (food stamps)
Percentage of total eligible on General Assistance, Medi-Cal, CalWORKs, CalFresh (food stamps) using ratio of income to poverty
California Department of Social Services
Local social service agencies
American Community Survey (ACS)
PREDATORY LENDING
EDUCATION
Percent of predatory lending outlets
Kindergarten readiness
CHILD CARE Child care
Car title loan shops, paycheck advance, check cashing, pawn shops
Number and percentage of children that are Kindergarten ready
Number of subsidized licensed center/family child care slots per 100 low-income children
Number of after-school slots per 100 low-income children
Dun & Bradstreet and other business databases
First 5, state/county resource & referral networks
First 5, state/county resource & referral networks
State/county resource & referral networks
PUBLIC SAFETY
Law enforcement intervention by type, frequency, and location
Crime reports rate by type (violent and/or property) Uniform Crime Reports
Healthy Communities Data and Indicators (HCI) Project of California
Domestic violence
Incarcerated Percentage incarcerated
California Health Interview Survey (CHIS)
California Department of Corrections and Rehabilitation
HEALTH CARE
Source of payment Percentage Medi-Cal, Medicare, private insured, out of pocket MEDS database
California Office of Statewide Healthy Planning and Development (OSHPD)
Birth records
Payer mix at private physician’s offices by geographic area. Ingenix nomative health database and other local data collection
ED utilization
Health care providers
Unnecessary emergency department visits OSHPD
Number and density of health care providers by type; accepting MediCal
Home visitation programs Number and percentage of families in the county serviced by home visitation programs
National Plan and Provider Enumeration System
Local social service agencies
California Medical Board (CMB)
Local social service agencies
California Maternal and Early Childhood Home Visiting Survey
Family Health Outcomes Project (FHOP) surveys
ENVIRON
Air, Water, and Soil
Population within 1/4 mile of fixed source
Air contamina tion Peak concentration of CO, lead, NOx, ozone, SO2, PM10, and PM2.5
California Environmental Protection Agency Enforcement and Complicance History Toxic Release Inventory, local hazardous waste data, Clean Water Act data, Clean Air Act data
EPA Air Trends
Healthy Communities Data and Indicators (HCI) Project of California
Local air districts
Water Contami nation Contaminants in drinking water
EPA drinking water data and databases
HCI
Pesticide Use Pounds of chemicals California Department of Pesticide Regulation
History of pounds of chemicals California Department of Public Health Environmental Health Investigations Branch
Population exposed to busy roadways
ENVIRONMENTAL INFRA STRUCTURE
Percentage population within 500 feet of highvolume mobile source CalTrans
Percentage within x miles to park, open, or green space
Parks: public perception of safety
Percent of population who live within 1/2 mile of a park, beach or open space California Protected Areas Database; and American Community Survey (ACS); decennial census
HCI
Public perceptions of safety and access in their neighborhood California Health Interview Survey (CHIS)
Housing dete rioration Broken window index U.S. Postal Service vacant units data
Housing: measures of crowding
Average persons per room ACS Persons per area of residential quarters ACS; and Local assessor’s data
TRANSPOR TATION
Access to local bus or rail link
Access to local bus or rail link
DATA SOURCE
Transit providers; and ACS; decennial census HCI
Biking and walking Biking and walking Walkscore.com
LAND USE Alcohol, tobacco, & fast food outlets
Number and density of alcohol outlets
California Alcohol and Beverage Commission
HCI
Number and density of fast food stores
Network for a Healthy California
Dun & Bradstreet and other business databases
Local environmental health agency
Number and density of tobacco outlets
RFEI (retail food environment index) or other measure of food access
County tobacco programs
Network for a Healthy California or Dun & Bradstreet and other business databases
Local environmental health agency HCI
Neighborhood completeness indicators
Availability of key public services
Availability of key retail services
Dun & Bradstreet and other business databases
Dun & Bradstreet and other business databases
CATEGORY WHAT TO MEAURE INDICATOR MEASUREMENT DATA SOURCE
HOUSE HOLD / FAMILY
ORGANIZED SOCIAL CONNEC TIONS
Family structure/living arrangements
Community organizations
Household type American Community Survey (ACS)
Number of organizations/1000 residents HealthyCity Participation California Health Interview Survey (CHIS)
Civic spaces Availability of theaters, arenas, meeting halls, public rooms Business permit, sales tax and assessors databases
Social indicators Social isolation, relations, and capital CHIS
POLITICAL POWER Voters
Healthy Communities Data and Indicators (HCI) Project of California Registered voters/eligible HCI
Voters/registered voters
CULTURE Linguistic isolation English language learners ACS
Gentrification Several measures available, measuring individual and housing characteristics ACS; decennial census
DIVERSITY Diversity Diversity index ACS; decennial census
RACISM Internalized Meaures of self-efficacy California Healthy Kids Survey (CHKS)
Inter-personal Differentials in medical procedure utilization; patterns of hiring, retention, and promotion; differentials in criminal sentencing; formal discrimination complaints
Electronic medical records; human resource documents; state, federal and local court records; agency grievance reports
Institutional Lawsuits against institutions State, federal, and local court records
EDUCATION Educational attainment
Percentage 25+ yrs graduated high school Percentage 25+ yrs graduated bachelor degree ACS HCI
