
ChattahoocheeRiver
LaundryCreek Stream Restoration
Carl Vinson Institute of Government Institute for Resilient Infrastructure Systems College of Engineering College of Environment + Design Warnell School of Forestry & Natural Resources
Sewelson
LAUNDRY CREEK
PURPOSE OF THIS REPORT
The purpose of this report is to document and evaluate the progress of the feasibility study and concept design related to stream restoration and alignment. This includes evaluating alternative stream alignments and restoration approaches, and providing a stream restoration concept design. Additionally, the report aims to offer a conceptual opinion of probable construction costs and support private consultants during the interim and final design phases. This work will further inform ongoing stormwater studies for the airfield. Notably, the scope of this report excludes specific elements such as drainage design (e.g., Laundry Creek stormwater outfalls, drainage swale), detailed topographic surveys, and geotechnical investigations, which are recognized as beyond the current work’s scope.
DATA COLLECTION
During the Fall and Winter of 2023, several data collection sessions acquired bathymetry and as-built information on structures in the Laundry Creek and Sewelson Creek drainages using Trimble RTK DA2 receivers, SONTEK RS5 Acoustic Doppler Current Profiler, and automatic levels. Data were downloaded and synthesized into existing DEMs provided by the owner (2014) and NOAA (2017). Amended files and points were shared with the project team to inform hydrologic and hydraulic modeling efforts.

LAUNDRY CREEK STREAM RESTORATION | UNIVERSITY OF GEORGIA PAGE 3 1. Credits .................................................................................................................................................................. 04 2. Executive Summary............................................................................................................................................ 06 3. Area Overview and Project Introduction ......................................................................................................... 08 3.1 - Engineering with Nature .......................................................................................................................... 09 3.2 - Overview: Lawson Army Airfield 09 3.3 - Military Mission 09 3.4 - Laundry Creek/Project Watershed 09 3.5 - Laundry Creek Overview ......................................................................................................................... 09 3.6 - Laundry Creek Restoration Alternative 10 4. Environmental Impact Considerations and Regulatory Review ................................................................. 12 4.1 - National Environmental Policy Act (NEPA) .............................................................................................. 13 4.2 - Clean Water Act (CWA)............................................................................................................................ 14 4.3 - Federal and State Protected Species 14 5. Stream Restoration Design ............................................................................................................................... 16 5.1 - Introduction.............................................................................................................................................. 17 5.2 - Historical Maps and Imagery 17 5.3 - Hydrology 17 5.4 - Sediment Transport Analysis 22 5.5 - Concept Design ....................................................................................................................................... 22 5.6 - Hydraulics ................................................................................................................................................ 27 6. Conceptual Opinion of Probable Construction Costs ................................................................................... 54 7. Conclusions and Recommendations ............................................................................................................... 56 7.1 - Conclusions: The Value of Nature-based Solutions ................................................................................ 57 7.2 - Recommendations: Moving Forward 59 8. References .......................................................................................................................................................... 62 9. Appendices 66 Appendix A: Maps and Exhibits 67 Appendix B: Renderings 70 Appendix C: Conceptual (30%) Design Drawings ........................................................................................... 72 Appendix D: Design Calculations .................................................................................................................... 80 Appendix E: Opinion of Probable Construction Costs 85 Appendix F: Hydraulic Analysis Tables and Figures 89 Appendix G: Southeast Conservation Adaption Strategy (SECAS) Letter of Support 104 Appendix H: Southeast Conservation Adaption Strategy (SECAS) Blueprint Report .................................. 106 TABLE OF CONTENTS
01
CREDITS
CREDITS
Defense Community Resilience Program
The University of Georgia’s (UGA) Defense Community Resilience Program (DCRP) is a multi-disciplinary collaborative network working directly with military installations and their surrounding communities to respond with innovative engineering-with-nature approaches to local climate driven vulnerabilities identified by installation personnel and local civilian community leaders in partnership with University of Georgia research and
outreach experts. In partnership with the US Army Corps of Engineers’ Engineering With Nature® (EWN) initiative, the DCRP is a collaboration between two UGA institutes, the Carl Vinson Institute of Government and the Institute for Resilient Infrastructure Systems (IRIS). This partnership provides a proactive mechanism to strengthen military and community resilience by applying EWN principles and practices.
Daniel Wyatt – Project Lead, Defense Community Resilience Program
Dr. Brian Bledsoe, P.E. – Director, Institute of Resilient Infrastructure Systems
J. Scott Pippin, J.D., CFM – Manager, Defense Community Resilience Program
Will Mattison – Water Resources Engineer, Institute of Resilient Infrastructure Systems
Dr. Jon Calabria, PLA – Professor, College of Environment + Design
Dr. James Shelton – Associate Professor, Warnell School of Forestry & Natural Resources
Matthew Shudtz, J.D. – Law and Policy Fellow, Defense Community Resilience Program
Scott Luis, J.D. – Research Professional, Defense Community Resilience Program
Kevin Samples – Geographic Information System Specialist, Institute for Resilient Infrastructure Systems
Kelsey Broich – Landscape Designer, Defense Community Resilience Program
Eleonora Machado – Creative Designer, Infrastructure and Community Resilience, Institute of Government
Ben McGarr, AICP – Community Engagement Coordinator, Defense Community Resilience Program
Wesley Gerrin – Research Outreach Professional, Warnell School of Forestry & Natural Resources
Sarah McNair – Research Outreach Professional, Warnell School of Forestry & Natural Resources
Karla Carvalho de Almeida – Graduate Assistant, College of Environment + Design
Rachel Dingley – Graduate Assistant, College of Environment + Design
Aditya Gupta – Graduate Assistant, College of Engineering
John Paul Montoya – Graduate Assistant, College of Engineering
Haley Selsor – Graduate Assistant, College of Engineering
LAUNDRY CREEK STREAM RESTORATION | UNIVERSITY OF GEORGIA PAGE 5
CREDITS
EXECUTIVE SUMMARY 02
EXECUTIVE SUMMARY
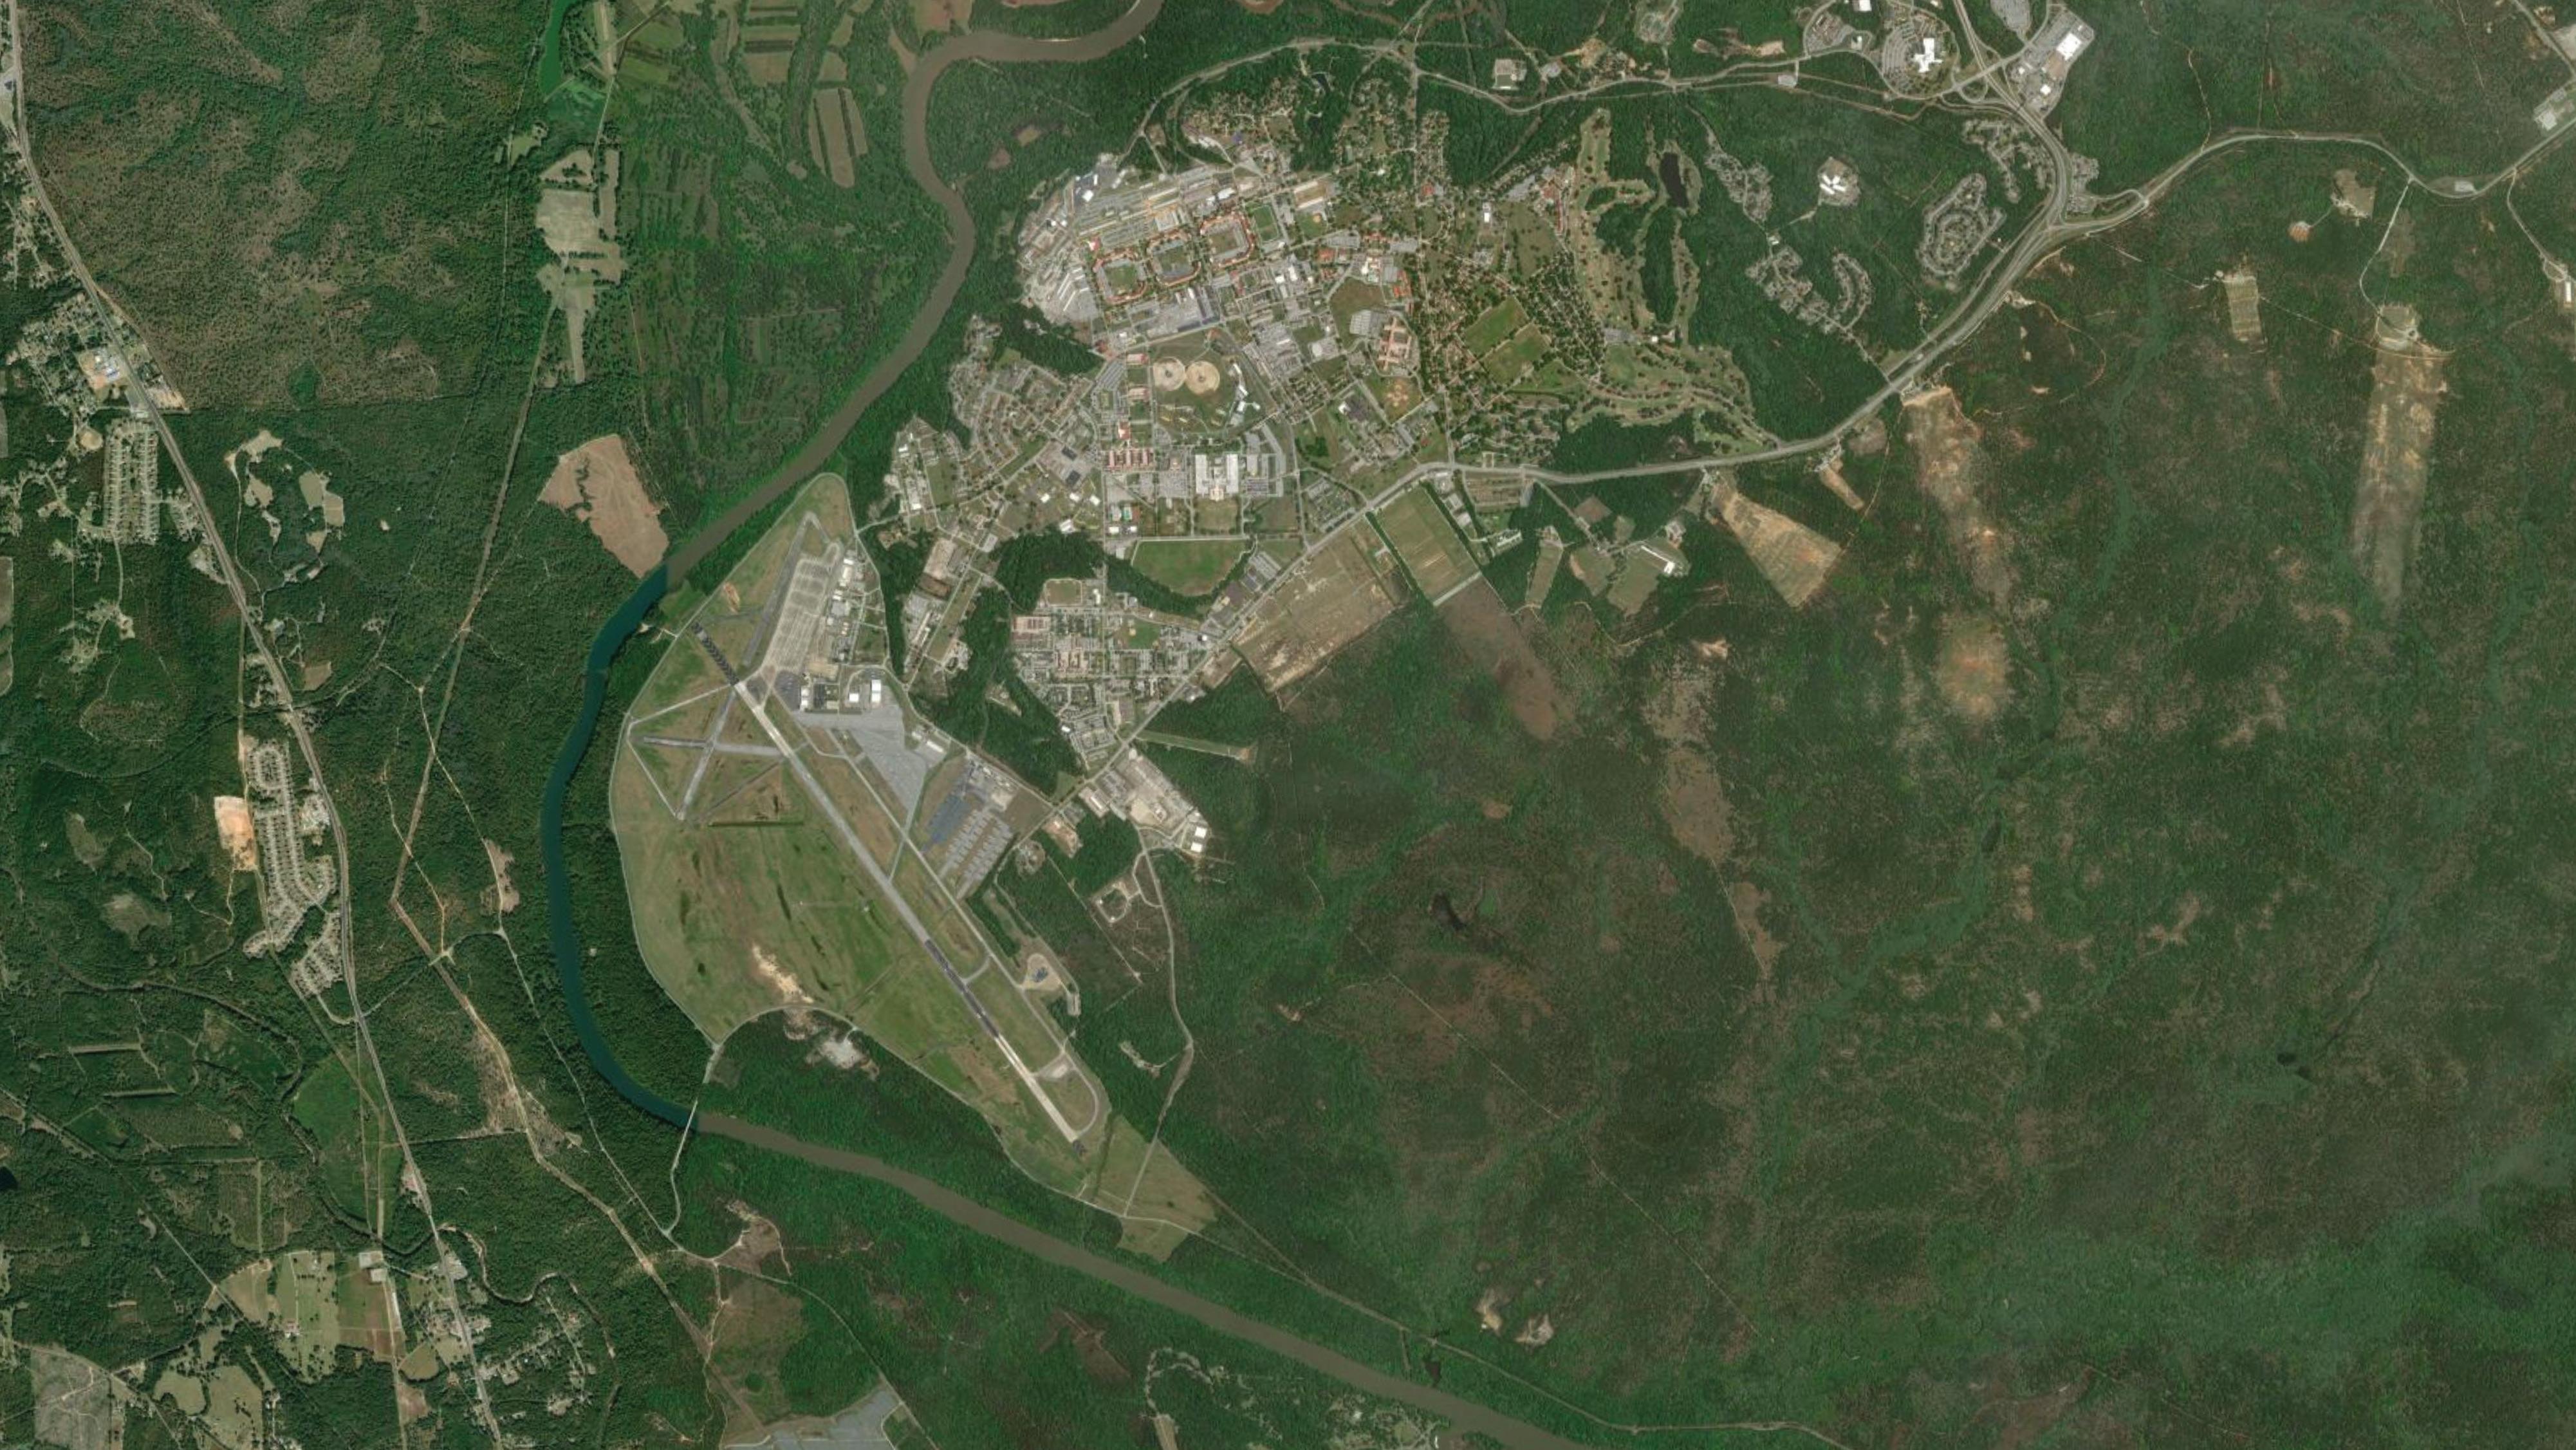
Lawson Army Airfield (AAF) at Fort Moore is a key component of the installation’s capacity for power projection, rapid deployment, and sustaining expeditionary force requirements.
Currently, the mission of Lawson AAF is being jeopardized by the erosion and frequent flooding of Laundry Creek, which runs parallel to the runway and flows across Graded Area/Clear Zone of Lawson AAF. Land use change and the current alignment of the creek have significantly increased both the volume and velocity of water during flooding events, severely incising the channel at the end of the runway. Previous assessments of airfield operations, safety, and infrastructure have noted that the deeply incised channel far exceeds the maximum longitudinal grade change allowed and thus presents a potential safety hazard and functional hindrance to Lawson AAF’s ability to achieve its mission.
This report analyzes the feasibility of an Engineering with Nature® (EWN) project that restores Laundry Creek to its historic valley and floodplain outside of the fence line of Lawson AAF and includes filling the incised channelized reach to meet the safety requirement for maximum longitudinal grade change. Natural processes and stream restoration techniques will be used to restore Laundry Creek and reconnect it to the surrounding floodplain to provide flood risk reduction, water quality, and ecological benefits.
This report and study indicate that the restoration of Laundry Creek is a feasible alternative that can potentially deliver flood risk reduction and net environmental benefits under future climate and land use change scenarios at a reduced cost versus conventional, gray infrastructure approaches. The preliminary concept design, informed by in depth hydrologic and hydraulic analyses, demonstrates that the EWN solution includes potential flood mitigation, less airfield and training downtime, the enhancement of ecological function, and water quality improvement. By integrating natural and engineered solutions, the project offers enhanced sustainability and resilience against the
increasing number of high precipitation events. Moreover, the project demonstrates an innovative approach in military infrastructure development by ensuring operational readiness and fostering environmental stewardship.
This project addresses threats to the military mission at Lawson AAF from an increasing number of flood events and resulting erosion of Laundry Creek’s channel by restoring the historic flow path, removing the creek from the Clear Zone and infilling the current channel at the end of the runway. By doing so, the project addresses immediate safety and operation concerns while laying the groundwork for long-term ecological and infrastructural resilience. This project also underscores the importance of combining military requirements with environmental sustainability, setting the stage for future EWN projects across Lawson AAF and Fort Moore.
LAUNDRY CREEK STREAM RESTORATION | UNIVERSITY OF GEORGIA PAGE 7
EXECUTIVE SUMMARY
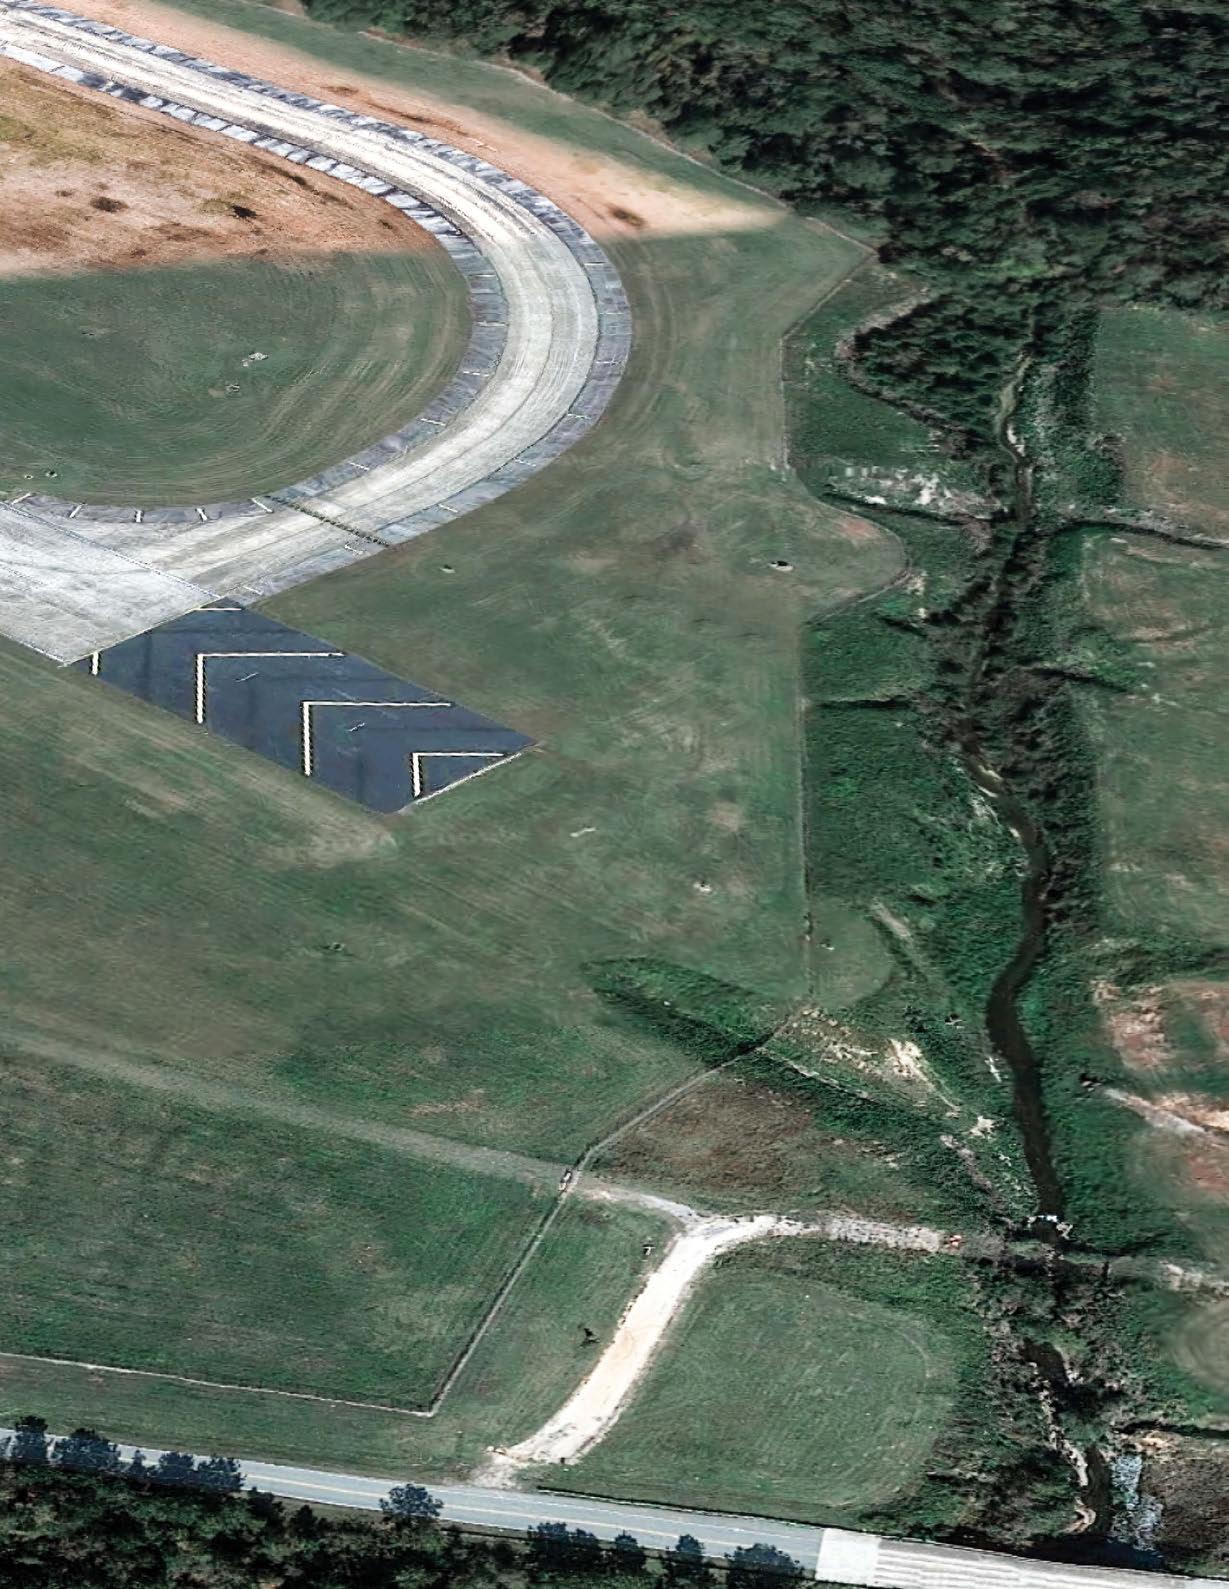
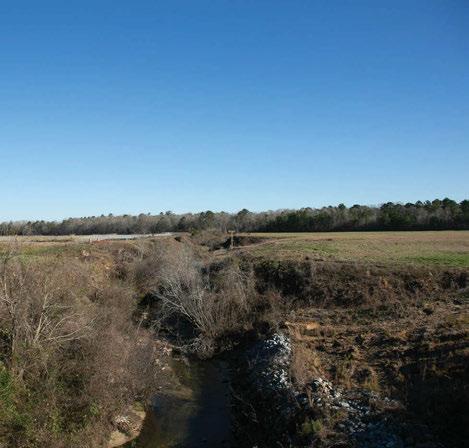
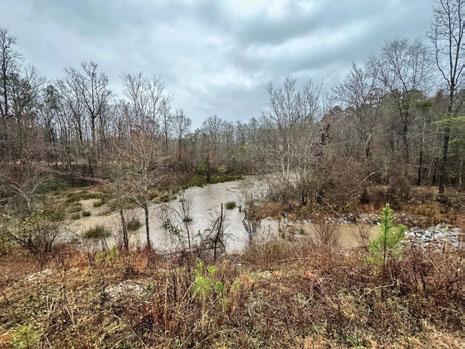
Figure 1: Laundry Creek runs through Lawson Army Airfield’s Clear Zone. The existing stream is unstable and is actively eroding.
AREA OVERVIEW AND PROJECT INTRODUCTION 03
AREA OVERVIEW AND PROJECT INTRODUCTION
3.1 - Engineering with Nature
Engineering with Nature® (EWN) is a U.S. Army Corps of Engineers program that combines conventional engineering principles with natural system components to produce more sustainable and efficient engineering solutions. EWN encourages the conservation, creation, and enhancement of natural systems to achieve social, environmental, and economic benefits (Engineering With Nature, 2018).
3.2 - Overview: Lawson Army Airfield
Lawson Army Airfield serves as the major power projection platform for Fort Moore. Consisting of over 182,000 acres of land in west Georgia and east Alabama, Fort Moore is the sixth-largest military installation in the U.S. and has the third-greatest troop density (U.S. Army Fort Moore, n.d.). For over one hundred years, the airfield has contributed to the training of military personnel and continues to play a vital role in the mission of Fort Moore. The airfield was first established in 1919 and was originally used by the Infantry to determine the use of data collected from balloons. Two small hangers were eventually built to house the balloon units and were also used by aircraft from what is now Maxwell Air Force Base in Montgomery, Alabama. For over a decade, the airfield operated without an official name. On July 6, 1931, the airfield was named after Captain Walter R. Lawson, a native Georgian and World War I pilot who was awarded the Distinguished Service Cross for extraordinary heroism in action. On September 1, 1940, Lawson airfield became the site of the first paratrooper test jump, a(n) (activity/training/operation) that continues today with the location of the Airborne school at Fort Moore. The airfield originally operated under the control of the Air Force until, in 1955, the Army assumed control (Historic Columbus, 2022).
Throughout its life, Lawson Army Airfield has seen many construction projects to increase its capacity and ability to serve the military. However, expanding the capacity of the airfield did not come without its challenges. Given its
location against the Chattahoochee River, the airfield is site to many cultural and ecologically important areas. One of those areas, Laundry Creek, was rerouted into a concrete channel to make room for runway expansion. Today, the current structure that the creek runs through routinely exceeds capacity during rain events, jeopardizing airfield operations due to flooding. Restoring Laundry Creek to a more natural channel would not only mitigate this flooding issue but would also provide enhanced biological benefits in this area of the installation.
3.3 - Military Mission
Fort Moore: The Maneuver Center of Excellence (MCoE) and Fort Moore delivers trained and combat-ready Soldiers and Leaders; develops and integrates the doctrine and capabilities of the Maneuver Force; all while providing a first-class quality of life for those assigned to or employed by Fort Moore, and their Families.
Lawson Army Airfield: Provide a safe Airfield environment by providing Integrated Airfield Services, Flight Management Services, Aircraft Ground Support Services, ATC (Air Traffic Control) Services, and ATC Navigational Aid Maintenance Services in support of the Fort Moore Maneuver Center of Excellence.
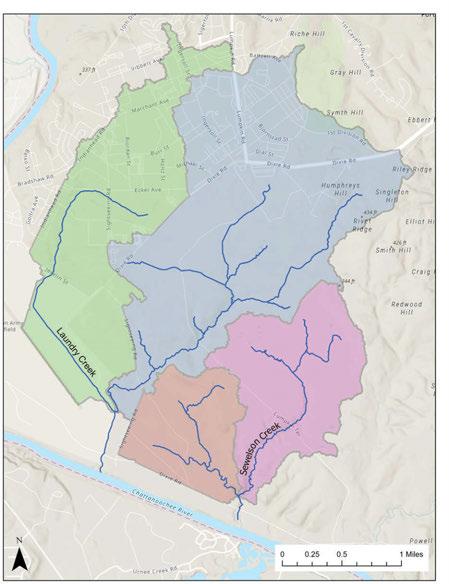
3.4 - Laundry Creek/Project Watershed
The project watershed’s current delineation is an approximate total of 8.12 square miles (or just under 5,200 acres) broken up into four distinct subbasins. The total imperviousness is approximately 1.36 square miles (870 acres). This is all according to the 2021 NLCD data.
3.5 - Laundry Creek Overview
Laundry Creek originates near Eubank Field and the historic parachute jump towers and enters Lawson Army Airfield just west of Red Ramp, crossing under Jecelin Road.
LAUNDRY CREEK STREAM RESTORATION | UNIVERSITY OF GEORGIA PAGE 9 AREA OVERVIEW AND PROJECT INTRODUCTION
The creek runs southeast, parallel to Runway 15-33, and bisects access points for Red Ramp, White Ramp, Blue Ramp and Hazardous Cargo. After turning south at the end of the runway, the creek continues in a southwesterly direction until it reaches the Chattahoochee River.
Within the Airfield, the creek is largely confined to a concrete channel which increases the creek’s velocity during high storm water runoff events. The creek’s current construction leaves it highly prone to flooding, which compromises training activities on the airfield.
3.6 - Laundry Creek Restoration Alternative
The restoration of Laundry Creek seeks to restore the creek’s historic flow path outside of Lawson Army Airfield and reconnect it to the surrounding floodplain. The current construction of the creek’s channel has contributed to increased water velocity during flooding events and has resulted in a deeply incised channel at the end of the runway. According to a draft clear zone study, the creek creates an approximate 20 ft drop in elevation, resulting in a clear zone violation. The study also identifies standing
water close to the airfield that creates a hazard due to birds and other wildlife (Black & Veatch Special Projects Corp., 2024). Utilizing Engineering with Nature® principles and nature-based solutions, this project seeks to improve the functionality and resiliency of the airfield by restoring Laundry Creek to its historic path while providing enhanced ecological benefits to the surrounding environment.
3. AREA OVERVIEW AND PROJECT INTRODUCTION PAGE 10
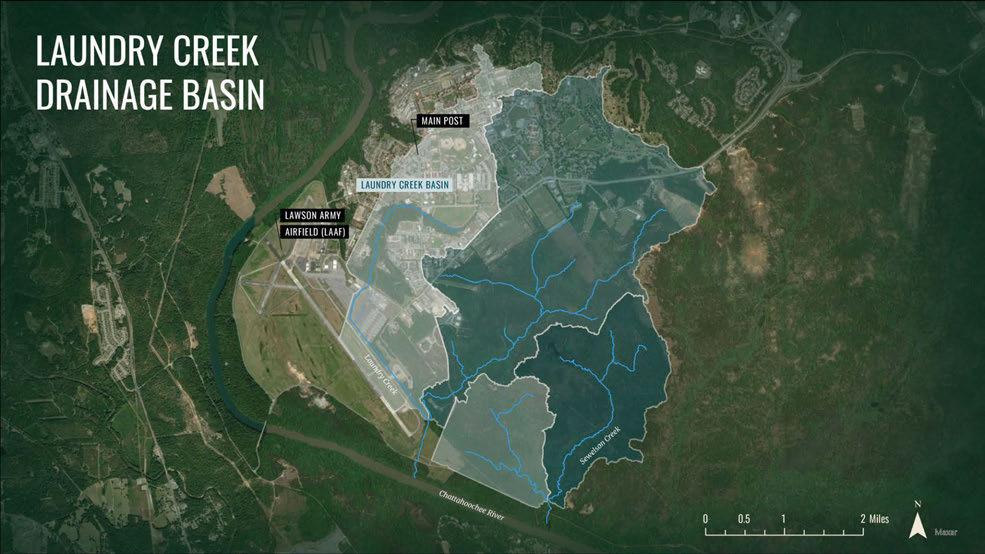
Figure 2 Laundry Creek Drainage Basin
LAUNDRY CREEK STREAM RESTORATION | UNIVERSITY OF GEORGIA PAGE 11 AREA OVERVIEW AND PROJECT INTRODUCTION
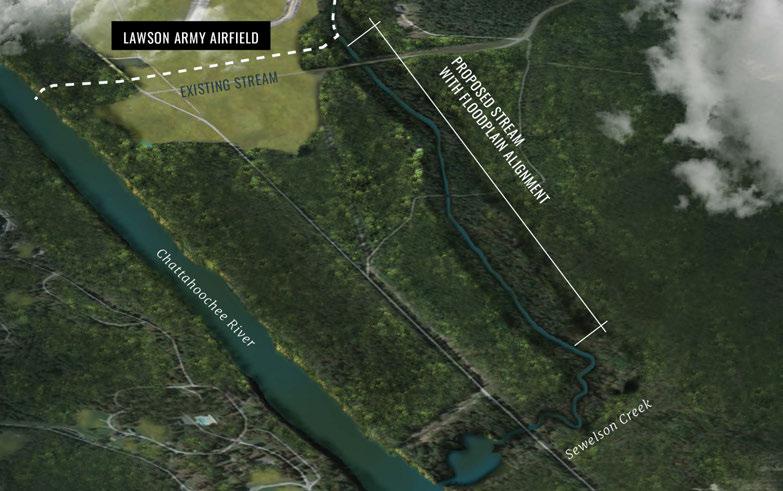
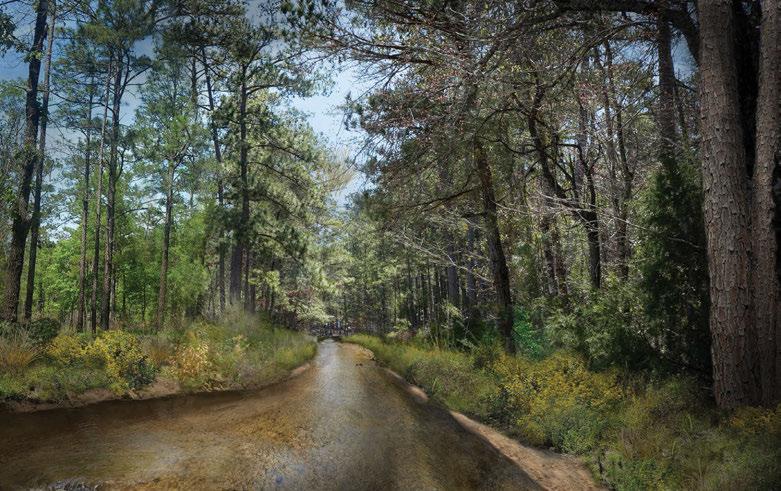
Figure 5: Conceptual rendering of Laundry Creek after new alignment that provides floodplain access with indigenous native vegetation along the streambank and floodplain.
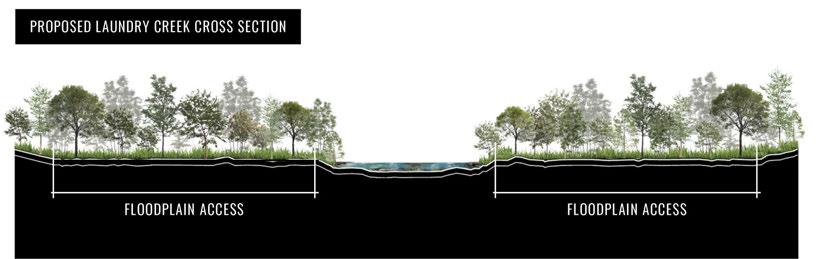
Figure 4: Stream design cross section visualizing the new stream profile that increases floodplain access and reduces flood risk.
Figure 3: Site aerial visualizing the current stream location (dashed) and the stream restoration design. The channel and floodplain will reconnect with Sewelson Creek, then drain to the Chattahoochee River.
4. ENVIRONMENTAL IMPACT CONSIDERATIONS AND REGULATORY REVIEW PAGE 12 ENVIRONMENTAL IMPACT 04
ENVIRONMENTAL IMPACT CONSIDERATIONS AND REGULATORY REVIEW
Our project design is based on the principles of Engineering With Nature, which encourages the conservation, creation, and enhancement of natural systems to achieve a broad array of social, environmental, and economic benefits. As a result, we anticipate our project design will deliver beneficial impacts to hydrology, aquatic and terrestrial resources, and the military mission. Detailed analysis to examine potential impacts to the environment will be undertaken as part of the National Environmental Policy Act compliance efforts.
4.1 - National Environmental Policy Act (NEPA)
For all federal actions that are not statutorily exempt or categorically excluded, NEPA compliance must be achieved through a REC, EA/FONSI, or EIS. Based on our review of NEPA statutory exemptions, the Council on Environmental Quality’s (CEQ’s) government-wide NEPA compliance regulations at 40 CFR Part 1500-1508, and Department of Army NEPA regulations and categorical exclusions at 32 CFR Part 651 and Appendix B to Part 651, we believe this project will necessitate a Record of Environmental Consideration (REC), Environmental Assessment (EA), or Environmental Impact Statement (EIS) – most likely, an EA.
We believe that the amount of work that will be required to complete the project exceeds what can be covered in a Record of Environmental Consideration (REC) Form, FB Form 144-R. As a result, the project will require an EA.
NEPA analysis should examine the direct, indirect, and cumulative effects of an agency action on the human environment. Note that the scope of the EA could be limited to the agency action defined as addressing the abrupt surface irregularity caused by Laundry Creek’s current alignment (small scope) or could be expanded to include consideration of various other airfield compliance needs (e.g., clear zone violations from trees and other objects).
Regardless of the scope of the NEPA analysis, key considerations will include:
- Impacts on water quality: See below (“Clean Water Act”)
- Impact on endangered, threatened, and other species of concern and their habitats: See below (“Federal and State Protected Species”)
- Soil and timber contamination: Due to the area’s prior use for military training, there is potential for exposure or contamination in the area by certain metals used in military equipment and weapon systems. As the proposal develops, we will coordinate with Ft. Moore to conduct any required testing for soil and timber contamination.
- Unexploded ordinance (UXOs): Due to the area’s prior use for military training, the area that this proposal will occur in
has been designated as a UXO hazard area. As the proposal develops, we will coordinate with Ft. Moore to conduct any required UXO clearance and disposal is conducted.
- Impacts on cultural resources: The area where this proposal will occur is known to contain cultural and historic resources from prior settlement by Native American tribes. We will coordinate with Ft. Moore as the proposal develops to ensure all surveys and assessments that are necessary for the area are conducted to protect cultural and historic resources.
- Limits of disturbance: Limits of disturbance will be decided as the proposal develops, and the path of the realignment and areas of construction are established.
Based on the anticipated transitory and limited negative impacts to the human environment and the long-term net-positive impacts on the environment, we anticipate an EA would result in a Finding of No Significant Impact (FONSI).
LAUNDRY CREEK STREAM RESTORATION | UNIVERSITY OF GEORGIA PAGE 13 ENVIRONMENTAL IMPACT CONSIDERATIONS AND REGULATORY REVIEW
4.2 - Clean Water Act (CWA)
Our project meets the criteria for actions that must be permitted under Clean Water Act Section 404, which governs “dredge and fill” of waters of the United States and adjacent wetlands. In preparing their “Draft Lawson Army Airfield Clear Zone Study” (1 March 2024), Black & Veatch subcontractors conducted a wetland delineation study and found ±13.62 acres of jurisdictional wetlands in the clear zone south of Runway 33. Of that total acreage, ±3.92 acres are delineated to include Laundry Creek and ±9.64 acres are described as “adjacent to the Chattahoochee River.” Based on their delineations and input from our engineering team, we believe our project design would only require the fill of wetlands presently found at the incised site of Laundry Creek. Estimated amounts of jurisdictional wetland restoration based on varying floodplain widths are discussed later in the report.
Section 404 is administered jointly by the US Environmental Protection Agency (US EPA) and US Army Corps of Engineers (USACE), with primary permitting for this project to run through the USACE Savannah District Office, Piedmont Branch.
US EPA and USACE have established Nationwide Permit 27 (NWP 27) to facilitate streamlined permitting for “aquatic habitat restoration, establishment, and enhancement activities.” Our project design is intended to fit within NWP 27, including all relevant regional conditions, which would eliminate the need for an individual 404 permit from USACE. CWA permitting through NWP 27 will result in considerable savings in time and resources.
Our project team initiated a preliminary, informal discussion with USACE Savannah District Piedmont Branch staff in January 2024. Fort Moore staff were invited and present for the discussion. We presented the project need, purpose, goals, and design approach, and sought USACE staff feedback on whether the project would likely be permitted under NWP 27. USACE staff could not confirm eligibility (nor would we have expected them to, based on information available at the time) but were generally supportive of the project design and our understanding that the project is suited to NWP 27.
Key next steps for ensuring applicability of NWP 27 include: defining the baseline aquatic functions and services,
clarifying the expected net increases in aquatic functions and resources, defining an ecological reference site (or conceptual model) that will be the basis for the final expected result, developing a monitoring framework, and inviting USACE staff for a site visit. Preliminary estimates by our engineering team suggest that the realignment might lead to aquatic habitat improvement along the approximately 6200 ft of stream restoration alignment, supporting the expectation of net increase of aquatic function and justifying coverage under NWP 27, which would eliminate the need to purchase credits from a mitigation bank.
4.3 - Federal and State Protected Species
Both the US Fish and Wildlife Service (US FWS) and the Georgia Department of Natural Resources’ Wildlife Resources Division (GA DNR) host mapping tools that enable users to obtain lists of protected animal and plant species whose ranges include the project area. The lists obtained from those mapping tools are below. No efforts were made to survey the project area to determine the presence of any species listed below.
4. ENVIRONMENTAL IMPACT CONSIDERATIONS AND REGULATORY REVIEW PAGE 14
GA DNR Biodiversity Portal US FWS IPaC
Scientific name
Common name Scientific name
Common name
Alasmidonta triangulata Southern Elktoe Picoides borealis Red-cockaded Woodpecker
Ameiurus serracanthus Spotted Bullhead Grus americana Whooping Crane
Amphianthus pusillus Pool Sprite, Snorkelwort Macrochelys temminckii Alligator Snapping Turtle
Croomia pauciflora Croomia Danaus plexippus Monarch Butterîy
Cyprinella callitaenia Bluestripe Shiner Silene polypetala Fringed Campion
Dryobates borealis Red-cockaded Woodpecker Arabis georgiana Georgia Rockcress
Elliptio arctata Delicate Spike Rhus michauxii Michaux’s Sumac
Elliptio purpurella Inflated Spike Trillium reliquum Relict Trillium
Elliptoideus sloatianus Purple Bankclimber Haliaeetus leucocephalus Bald Eagle
Etheostoma parvipinne Goldstripe Darter Aimophila aestivalis Bachman’s Sparrow
Gopherus polyphemus Gopher Tortoise Sitta pusilla Brown-headed Nuthatch
Graptemys barbouri Barbour’s Map Turtle Chaetura pelagica Chimney Swift
Hamiota subangulata Shinyrayed Pocketbook Oporornis formosus Kentucky Warbler
Hymenocallis coronaria Shoals Spiderlily Dendroica discolor Prairie Warbler
Macrochelys temminckii Alligator Snapping Turtle Melanerpes erythrocephalus Red-headed Woodpecker
Medionidus penicillatus Gulf Moccasinshell
Nestronia umbellula Indian Olive
Pleurobema pyriforme Oval Pigtoe
Rhus michauxii Dwarf Sumac
Rudbeckia heliopsidis Little River Black-eyed Susan
Strophitus radiatus Rayed Creekshell
Utterbackiana heardi Apalachicola Floater
GA DNR source: https://georgiabiodiversity.org/portal/element_unit_map/huc10/ga_protected - selected Bull CreekChattahoochee River HUC-10 watershed
US FWS source: https://ipac.ecosphere.fws.gov/ - used polygon selection tool
Ensuring compliance with species-protection statutes and implementing regulations, including the federal Endangered Species Act and Georgia Endangered Wildlife Act, may require consultation with US FWS and GA DNR to determine whether permits are necessary or reasonable and prudent measures may suffice to avoid unacceptable impacts to species and their habitat.
LAUNDRY CREEK STREAM RESTORATION | UNIVERSITY OF GEORGIA PAGE 15 ENVIRONMENTAL IMPACT CONSIDERATIONS AND REGULATORY REVIEW
5. STREAM RESTORATION DESIGN PAGE 16 STREAM RESTORATION DESIGN 05
STREAM RESTORATION DESIGN
5.1 - Introduction
Lawson Army Airfield (LAAF) at Fort Moore is a critical infrastructure component that supports power projection, rapid deployment, and expeditionary force requirements. The safety and functionality of LAAF is essential to meeting the military mission of the installation. However, Laundry Creek which was realigned and channelized in the 1920s to flow across Graded Area/Clear Zone of LAAF, poses both a safety hazard and functional hindrance to the airfield. Oversteepening of Laundry Creek as a result of its realignment has resulted in severe and extensive channel incision and abrupt surface irregularities across the entire Graded Area/ Clear Zone, leading to loss of access to floodplain. Previous assessments of airfield operations, safety, and infrastructure have noted that the deeply incised channel far exceeds the maximum longitudinal grade change allowed (2 ft per 100 ft) and thus presents a potential safety hazard. Upstream reaches of Laundry Creek directly adjacent to the airfield also flood the airfield during large precipitation events, halting operations and training until flood waters recede.
The sections below describe the feasibility of a stream restoration plan for Laundry Creek that addresses safety and flooding hazards as a potentially cost-effective alternative to burying the existing incised channel in a concrete box culvert across the entire clear zone. Specifically, the stream restoration alternative restores Laundry Creek to its historic valley and floodplain outside of the fence line of LAAF and includes filling the incised channelized reach to meet the safety requirement for maximum longitudinal grade change. The following sections describe historical, hydrologic, hydraulic, and geomorphic analyses conducted at nested scales (watershed, valley, and reach) to examine the feasibility of this alternative. Several lines of evidence were integrated with analytical and analogy-based stream design methods to develop a preliminary restoration design (Bledsoe et al., 2017).
The stream restoration alternative for Laundry Creek at LAAF is designed to achieve multiple objectives including
remediation of the Graded Area/Clear Zone grade violation, flood risk reduction, ecological uplift, and long-term resiliency in the face of future climate and land use change scenarios.
5.2 - Historical Maps and Imagery
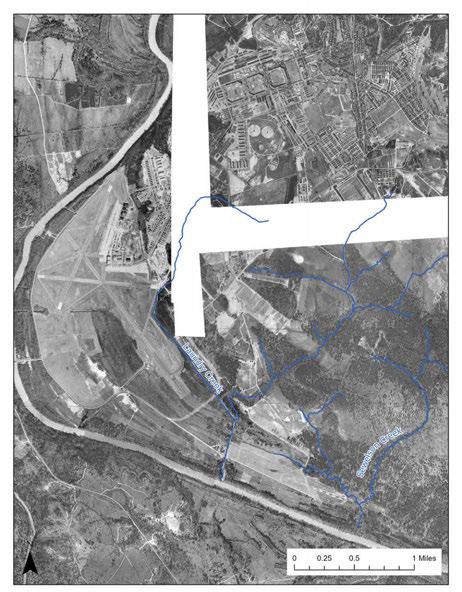
To better understand the legacy of anthropogenic of Laundry Creek disturbances (e.g., channelization and resulting incision), an analysis of historical aerial imagery and topographic maps was conducted. A United States Geological Survey (USGS) topographic map from the early 1900s indicates that Laundry Creek had an east-southeast flow path and discharged directly into Sewelson Creek with its historic valley flowing through LAAF’s current location (Figure 6). The topography of the future site of LAAF during this period included a hill that was > 20 ft higher in some instances than the elevation of the present site. It appears that the construction of the initial airfield, completed in 1921, required the surrounding hillside to be leveled. The grading and excavation for the airfield lowered the elevation of the upstream segments of Laundry Creek which lowered both the elevation at which it flowed across the airfield, as well as its elevation relative to its downstream confluence with Sewelson Creek. Over the next few decades, Laundry Creek was likely realigned and channelized multiple times as the airfield expanded. This ongoing expansion ultimately culminated in being channelized into its current alignment in the 1940s and 1950s (Figure 7 and Figure 8).
5.3 - Hydrology
Future climate scenarios indicate that Fort Moore / LAAF and the Laundry Creek watershed will experience more frequent and intense precipitation events over the next several decades (Swain et al., 2020). In conjunction with future land use change from anticipated development and military training activities, variability and extremes in precipitation and streamflow regimes will likely increase on the installation. A watershed delineation, characterization and hydrologic analyses were conducted to estimate future flow conditions for the restoration design (Copeland et al., 2001).
LAUNDRY CREEK STREAM RESTORATION | UNIVERSITY OF GEORGIA PAGE 17 STREAM RESTORATION DESIGN

5. STREAM RESTORATION DESIGN PAGE 18
Figure 6: Historic USGS topographic map from the early 1900s depicting the historical flow path of Laundry Creek.

LAUNDRY CREEK STREAM RESTORATION | UNIVERSITY OF GEORGIA PAGE 19 STREAM RESTORATION DESIGN
Figure 7: Lawson Army Airfield in 1944 with Laundry Creek channelized in a different location than the current alignment.
Figure 8: Lawson Army Airfield in the late 1950’s with Laundry Creek channelized to its current alignment.
5.3.1 - Watershed Delineation and Characterization
A one-meter resolution digital elevation model (DEM) was derived from 2017 LiDAR data provided by the National Oceanic and Atmospheric Administration (NOAA) that covered the Middle Chattahoochee –Walter F George Watershed (OCM Partners, 2024). The 2017 LiDAR data was supplemented with bathymetry data collected by UGA at the downstream outlet of Sewelson Creek below Sunshine Road. The bathymetry elevations were collected using a remote-controlled boat due to water depths and proximity to an UXO area.
Delineation of the sub-basins for Laundry Creek and the restoration drainage area was conducted using spatial analyst tools in ArcGIS. Initial flow accumulations and flow directions were calculated using the one-meter DEM and subsequently used as inputs for the watershed spatial analyst tool. Four outlet points were specified based on best geographic and hydrologic judgment. The tool was used to generate a preliminary delineation. The preliminary delineation was expected to include errors due to culverts and other stormwater infrastructure in the area. Break-line data was created to remedy the errors by visually distinguishing culverts and their approximate flow directions. The tool was rerun with the break-line data added and the adjusted delineation was visually confirmed using the LiDAR data and knowledge of existing topographic features (e.g., ridges).
The delineation of sub-basins for the project drainage area and Laundry Creek watershed, while sufficient for feasibility level analysis, is not precise, especially in highly urbanized regions of the installation. The presence of stormwater infrastructure, such as storm sewer pipes, can alter estimated flow paths and discharge points of runoff. However, the sub-basins and watershed boundaries were confirmed to the best of our ability using available stormwater infrastructure data provided by Fort Moore’s Directorate of Public Works (DPW).
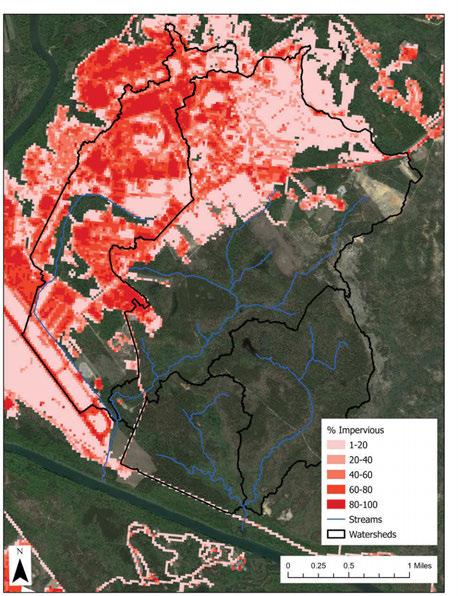
Four distinct sub-basins were delineated for our project area using the data and techniques stated previously (Figure 9). The delineation deviated from previous assessments and encompassed a larger area of the installation. Sub-basins were also characterized by the percentage of impervious cover present based on 2021 data from the USGS National Land Cover Database (Figure 10; Dewitz, 2023).
5. STREAM RESTORATION DESIGN PAGE 20
Figure 9: Drainage area of the Laundry Creek stream restoration alternative.
Figure 10: Percent impervious cover in the watershed of the Laundry Creek stream restoration.
5.3.2 - Estimated Peak Flood Flows
A hydrologic analysis of the project watershed was conducted utilizing standard procedures based on regional flood regression equations and statistics from USGS StreamStats (Perica et al., 2013). The absence of streamflow gages in the area made it necessary to estimate streamflow data using methods developed for prediction in ungaged basins (Bledsoe et al., 2017; Soar & Thorne, 2001). The regional flood regression equations used for this analysis were derived from two USGS publications specific to rural and urban streams in GA, SC, and NC (Feaster et al., 2014, 2023). Both publications provide predictive relationships for annual exceedance probabilities (AEP) ranging from 50 percent to 0.2 percent (2-yr to 500-
yr return period) for five hydrologic regions present in Georgia: Piedmont – Ridge and Valley, Blue Ridge, Sand Hills, Coastal Plain, and Southwest Georgia – Lower Tifton Upland. Per USGS methods, the project is in the Coastal Plain hydrologic region. All the USGS peak flows statistical models depend on drainage area; however, Feaster et al. (2014) also includes precipitation intensity and percent impervious cover as variables to estimate urban stream peak flows. This facilitated modeling of peak flow as a function of both future precipitation and impervious cover. A representative urban peak-flood flow equation for a 2-yr event is depicted by Equation 1 (see Feaster et al. (2014) and Feaster et al. (2023) for all other return interval equations).
Equation 1. Urban peak-flow regression equation from Feaster et al. (2014) for the discharge in cfs of a 2-yr return event where DRNAREA is the drainage area of a basin, IMPNLCD is the percentage of impervious surface, and I24H50Y is the 24-hr, 50-yr precipitation intensity.
Each regression equation was used to calculate the discharges from the four delineated sub-basins. To provide a conservative estimate for our design, estimated peak flows from each sub-basin were not lagged relative to one another, i.e., the peaks were superimposed. While this does not reflect as actual subbasin lag times, the estimate allows for a precautionary restoration design that accounts for increased runoff due to future rainfall scenarios and land use changes in all analyses of flood conveyance capacity.
5.3.2.1 - Future Precipitation Scenarios
The NOAA Atlas 14 Volume 9 contains precipitation frequency estimates that can be attributed to LAAF at different durations and recurrence intervals with a 90% confidence interval (Perica et al., 2013). The USGS Urban Peak Flow regression equations derived from Feaster et al. (2014) required the precipitation intensity for the 24-hour, 50year rainfall event to calculate peak flows for the 2-yr, 5-yr, 10-yr, 25-yr, 50-yr, 100-yr, 200-yr, and 500-yr events. The precipitation intensity for this 24-hr, 50-yr event at Lawson Army Airfield is equal to 8.18 inches per hour (Perica et al., 2013). In the contiguous United States, extreme precipitation events, such as the 50-year event, are expected to increase approximately by 20%-30% in magnitude during the 21st
century (Swain et al., 2020). To account for this scenario in our design, the 24-hour, 50-year precipitation intensity of 8.18 inches per hour was increased by 20% to a value of ̴9.82 inches per hour and used in the USGS flood regression equations to represent nonstationary future conditions.
5.3.2.2 - Future Land Use Scenarios
Predicting future land use changes on military installations can prove challenging, especially in areas that are primarily used as ranges or training grounds. Infrastructure development and expansion within Fort Moore and LAAF will be necessary in the future to meet military missions in the face of ever-changing conditions around the globe. Military training maneuvers have been identified as a major
LAUNDRY CREEK STREAM RESTORATION | UNIVERSITY OF GEORGIA PAGE 21 STREAM RESTORATION DESIGN
����! = 26.3
$%"&
)(10("
)
(����������������������������)"
(10(" "()*)(,-./012"3)
"$($)(,!45$"6)
contributor to land disturbance and can alter landscapes in a short amount of time with lasting impacts (Garten et al., 2003). Disturbances associated with training activities, including mechanized infantry training, often result in reduced forest cover, areas of bare earth, increased runoff, erosion, and gullying (Quist et al., 2003). Soil hydraulic properties, such as soil bulk density and infiltration capacity areas, are also affected (Garten et al., 2003; Perkins et al., 2007). Higher soil bulk density in areas of Fort Moore intended for infantry and tracked vehicles (Garten et al., 2003) indicates compaction, decreased porosity, and leads to increased runoff. Thus, it is important that the restoration design accounts for these types of impacts to account for future conditions as training areas and the installation continue to expand.
5.3.3 - Results
Given future precipitation scenarios and potential land cover change from anticipated training activities, it was determined that the USGS urban equations would be best to estimate peak flows for all sub-basins in the project drainage area. The urban regression equations result in higher peak flood flows compared to equations normally used to calculate flows in rural, forested areas. Table 1 provides future flow estimates for all four sub-basins of the project watershed. These flows were utilized for the preliminary concept design (5.5) and hydraulic analyses (5.6) of the stream restoration.
recommended. Such an analysis will reveal opportunities for integrating the designs of future stormwater control measures with the stream restoration design to enhance flood risk reduction, stream stability, and ecological function.
5.4 - Sediment Transport Analysis
A sediment transport analysis was performed on potential future inflowing sediment loads to assess the potential for aggradation and degradation in the restoration design. Sediment loads were estimated using the total load equations of Brownlie (1981) based on an upstream supply reach (Bledsoe et al., 2017; Stroth et al., 2017). Supply reach characteristics were based on geomorphic measurements and pebble count data collected on a section of Laundry Creek in the Clear Zone of the airfield. The geomorphic assessment included the collection of channel and water surface elevations from 20 cross-sections. At each of the 20 sections, five substrate points were collected along a diagonal transect to create a grain size distribution for the reach. This dataset was used as another line of evidence for preliminary assessments and analyses (e.g., stability assessments and low-flow channel design). However, there is low confidence that the reach is a sufficient supply reach with quasi-equilibrium channel geometry (i.e., little evidence of active erosion or sedimentation) due to ongoing channel incision and head cutting. Results from this preliminary analysis suggest that there is aggradation potential in the design reach and effective management of upstream erosion and sediment supply is an important element of any plan that moves forward.
5.5 - Concept Design
5.5.1 - Introduction
If the stream restoration alternative is selected, additional rainfall-runoff modeling will be necessary to refine the values in Table 1, and to define the geometry of the bankfull channel and floodplain. Mechanistic modeling using HEC-HMS or SWMM with increased resolution in the specification of current and likely future stormwater infrastructure is
In addition to rectifying the Clear Zone violation, a feasible concept design was developed that would enable the Laundry Creek restoration to achieve three main objectives: flood risk reduction, ecological function uplift, and stream system resiliency. Given past flooding of LAAF by Laundry Creek’s propensity to flood LAAF during large precipitation events, the stream restoration was conservatively designed to convey water and debris across a wide range frequent to extreme events. Design events ranged from high frequency, low magnitude annual high flows to extreme floods under future rainfall and land cover change scenarios. To provide
5. STREAM RESTORATION DESIGN PAGE 22
Return Interval (yr) Sub-basin 1 Q (cfs) Sub-basin 2 Q (cfs) Sub-basin 3 Q (cfs) Sub-basin 4 Q (cfs) 2 653 307 76 101 5 833 528 149 200 10 945 695 209 282 25 1066 923 297 402 50 1146 1104 370 504 100 1222 1293 450 615 200 1294 1496 538 738 500 1370 1764 661 910
Table 1. Estimated discharges (Q) for all sub-basins of the project watershed.
ecological uplift, the design reconnects the incised channel of Laundry Creek to its historical valley and floodplain to reestablish natural processes and ecosystem services. Finally, the design enables Laundry Creek to self-adjust and migrate within its floodplain belt width to attain dynamic equilibrium under changing watershed and hydroclimatic conditions.
Analytical and analog (reference) design approaches and multiple lines of evidence were integrated in developing feasibility-level restoration plan. In addition to the hydrologic, hydraulic analyses of one-dimensional flow, and sediment transport computations (Shields et al., 2003; Soar & Thorne, 2001) described above, the preliminary concept design was informed by downstream and at-a-station hydraulic geometry relations derived from the same stream type, sensitivity analysis based on several longitudinal profiles and planforms, and an analysis of potential grade control and bank bioengineering requirements.
5.5.2 - Hydraulic Geometry
Hydraulic geometry, or the shape of a stream channel cross section determined by hydraulic factors, is critical aspect of stream restoration design that affects long-term stability and resilience (Bledsoe et al., 2017; Copeland et al., 2001; NRCS, 2007; Shields et al., 2003). Channels behave differently under a range of discharges and a hydraulic geometry should consider many flow conditions. According to Copeland et al. (2001), an idealized stream cross section is designed for multiple flow conditions including, but not limited to, low-flow, bankfull flows, and even extreme flood flows (e.g., 100-year flood). Table 2 includes the estimated discharges from the hydrologic analysis (5.6) that were design targets for the distinct stages of the channel cross section.
compound stream channel design also meets the other main objectives: ecological uplift and channel resiliency. Multi-stage channels can potentially improve ecological function by allowing flood flows (i.e., flows larger than bankfull discharge) to be reconnected to the floodplain, restore ecosystem services (e.g., water quality improvement) and enhance habitat diversity (NRCS, 2007; Soar & Thorne, 2001). In-stream and riparian habitat availability increases for aquatic species due to adequate water depth during low flow periods and vegetation for cover and shade. Channel stability and resiliency are also improved as large, erosive flows are designed to spread out across the floodplain for energy dissipation. Floodplain zones, because they are less frequently exposed to inundation, can establish vegetation that further stabilizes the channel. Sediment transport is also more effective by maintaining fluvial processes in the bankfull channel, even during low-flow periods (NRCS, 2007).
Each portion of the channel was designed according to flow conditions under future precipitation and land-cover change scenarios. The low-flow channel was designed to convey an estimated low-flow condition of 172 cubic feet per second (cfs) while the bankfull channel was intended to convey an estimated 1.4-year storm event (675 cfs). Finally, the floodplain was designed for any flow condition above the bankfull discharge up to a future, 100-year flood event (3580 cfs).
Analytical approaches, including the USACE-published methods of Soar & Thorne (2001) and NCHRP methods of Bledsoe et al. (2017), were used as guidance for the preliminary hydraulic geometry of the stream restoration design. Soar & Thorne (2001) expanded upon previous studies and created enhanced hydraulic geometry equations to predict channel widths for different categories of bank vegetation. For the preliminary design of Laundry Creek, the median equation (Equation 2) was selected for the feasibility analysis and corroborated with several other downstream hydraulic geometry relationships from the scientific literature (Knighton, 1998).
The restoration design seeks to effectively convey the different conditions utilizing a compound channel design approach that includes a low flow channel, bankfull channel, and broad floodplain (NRCS, 2007; Soar & Thorne, 2001). In addition to effective flow conveyance to meet safety, flood risk reduction, and infrastructure objectives, the
Equation 2. Equation for bankfull top width based on USACE report by Soar & Thorne (2001). Qb is the bankfull discharge in m3/s and width is in meters.
���� = 3.76����!" $
LAUNDRY CREEK STREAM RESTORATION | UNIVERSITY OF GEORGIA PAGE 23 STREAM RESTORATION DESIGN
Channel Section/Stage Return Interval (year) Discharge (cfs) Low Flow N/A 172 Bankfull 1.4 675 Floodplain Terrace 100 3580
Table 2. Estimated target design discharges for the different sections or stages of the compound stream channel.
A bankfull top width of approximately 57 ft was calculated for the stream restoration channel which includes a low-flow, inset channel. Typical stream restoration cross sections are depicted in Appendix C. Other important hydraulic geometry dimensions (e.g., channel depth, bank slopes, etc.), stemming from guidance such as NRCS (2007), Shields et al. (2003), and Soar & Thorne (2001) were designed in accord with the bankfull top width. Calculations and associated worksheets for the dimensions are included in Appendix D. A set of candidate stream sites on the installation were also identified as potential analog reaches to inform the hydraulic geometry design. These reaches were analyzed using desktop methods but further assessment based upon suitable analog criteria outlined in Bledsoe et al. (2017) is required when field access becomes feasible.
An analytical channel stability assessment based on sediment transport capacity was also conducted to improve understanding of the likely geomorphic response and to further evaluate the design (Shields et al., 2003). Copeland’s Method, or the Stable Channel Analytical Method, included in the USACE HEC-RAS software was leveraged to analyze a range of potential slope, width, and depth relationships that would allow the channel to remain geomorphically stable and in dynamic equilibrium. Stability curves were generated for a range of potential sediment concentrations (Figure 11). The relationships were compared to the stream
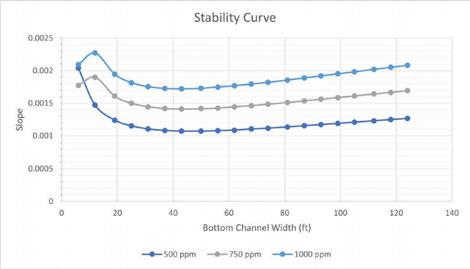
upstream stormwater and erosion management to support effective conveyance of the upstream sediment supply. The unarmored and adjustable compound channel design with a large, reconnected floodplain can partially mitigate variability in sediment supply.
The preliminary design also accounted for the potential energy of the system under future conditions. It was important for design to prevent substantial amounts of scour, allow native vegetation to establish on the floodplain, and protect aquatic habitat. The Manning equation was used to as a check against velocities in the stream channel and on the floodplain. Worksheets developed to calculate estimated velocities are included in Appendix D and indicate that the proposed design did not exceed permissible thresholds.
5.5.3 - Longitudinal Profile and Planform Alignment
The preliminary longitudinal and planform profiles for the stream restoration were grounded in the hydraulic analysis and also integrated both analytical and analog approaches. Candidate analog reaches, as previously noted, were identified, but will require further analyses and surveys for refinement of the preliminary design. Engineering testing and borings will also be required to understand the stratigraphy of the historical Laundry Creek valley and to assess the feasibility of the proposed longitudinal profile given large volumes of fill material that has been emplaced along the historical alignment. The inaccessibility of the UXO zone inhibits ground-truthing of any preliminary findings from desktop analyses. Moving forward, reference reaches can help inform the preliminary design by acting as a partial blueprint for natural river attributes, to the extent that the reference sites represent equilibrium conditions that can adjust to future change (Soar & Thorne, 2001).
5.5.3.1 - Tie-In Locations
channel design’s preliminary dimensions to account for potential aggradation and degradation. The assessment determined that the bankfull channel is potentially susceptible to aggradation at bankfull bed material loads exceeding ~500 ppm and confirmed the need for effective
For the design to effectively convey the estimated future flows, debris loads, and sediment, a downstream tie-in point was chosen that allowed the design to achieve an appropriate channel slope. A remnant segment of Laundry Creek was identified in the DEM, but it was deemed unviable for the design’s objectives because hydraulic analyses showed that reconnecting the entire length of the remnant channel resulted in slopes less than or
5. STREAM RESTORATION DESIGN PAGE 24
Figure 11: Three stability curves for different sediment concentrations developed using Copeland’s Method in HEC-RAS for a future, bankfull discharge.
equal to 0.0001. Such a mild gradient, a consequence of upstream lowering of the channel elevation during airfield construction, could potentially exacerbate inundation of upstream infrastructure during future flow events. Historic manipulation of the landscape, placement of extensive fill in the historic valley, and the incised form of the historical channel remnant precludes full utilization of the historical channel remnant. However, hydraulic analyses confirmed that the restored stream could be connected to a portion of the historic channel and provide effective flood conveyance and attainment of a stable gradient indicated by hydraulic analysis and analog reaches.
5.5.3.2 - Slopes
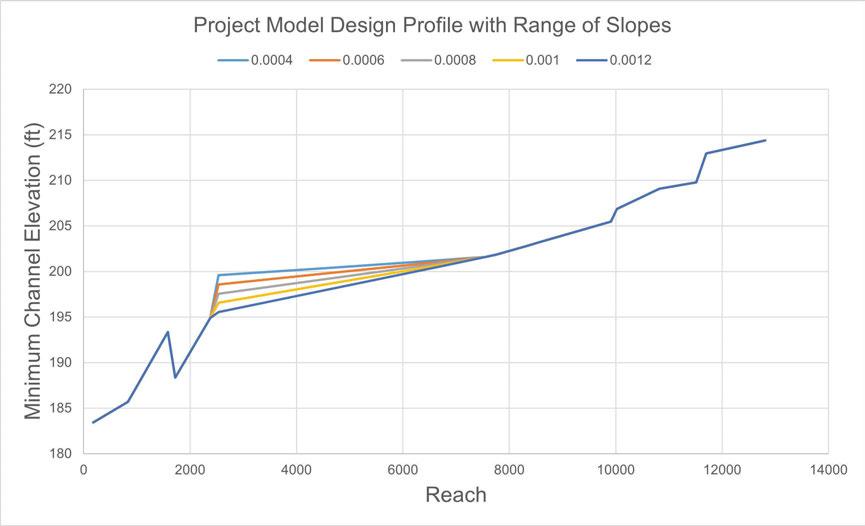
After a feasible downstream tie-in point was located for the restored stream, further hydraulic analyses (5.6) were conducted to establish a range of viable channel slopes that would effectively convey future hydrologic conditions of the proposed watershed. Results indicate that a range of channel slopes from >0.0004 to 0.0013 are feasible to maintain effective conveyance of future flows given valley slope constraints. A channel slope of 0.0008 – 0.00093 was bracketed. These slopes correspond to a sinuosity range of 1.4-1.6. Subsequent analyses and graphics were performed with a preliminary design slope of 0.0008 to depict a gradient that maintains conveyance and reflects a planform alignment based on natural channel geometry (Soar & Thorne, 2001). As noted previously, locally proximate analog reaches have been identified, but further analyses and field surveys will be required to accurately define geometric characteristics for comparison to the proposed design.
5.5.3.3 - Planform/Sinuosity
Alluvial channels naturally meander and migrate (i.e., channel thalwegs tend to assume a sinuous alignment) within certain ranges of stream power (Soar & Thorne, 2001). Sinuous planforms can reduce the erosive power of flood flows and increase the interaction between the channel and floodplain. Meandering rivers have been observed to generate welldeveloped point bars and wider bankfull widths at the meander bend apex. This provides a sheltered flow area near inner bank of the bend that increases habitat complexity and in turn ecological diversity (Soar & Thorne, 2001).
A planform analysis was performed on the historic, remnant channel of Laundry Creek as it is still somewhat indicative
of historical form despite historical incision. Results indicate the remnant channel form has a sinuosity of 1.48, which is indicative of conditions prior to ca. 1950. However, a restored Laundry Creek will be conveying more frequent high flow conditions and have an altered flow of sediment. It is important that the planform design accounts for these altered conditions. A preliminary sine-generated wave, using equations from Yalin (2001) was utilized to design the preliminary planform of the restoration. Previously selected hydraulic geometry (i.e., bankfull width), valley slope, and channel slope were used as inputs (Appendix D). The sinegenerated planform had a sinuosity of approximately 1.63.
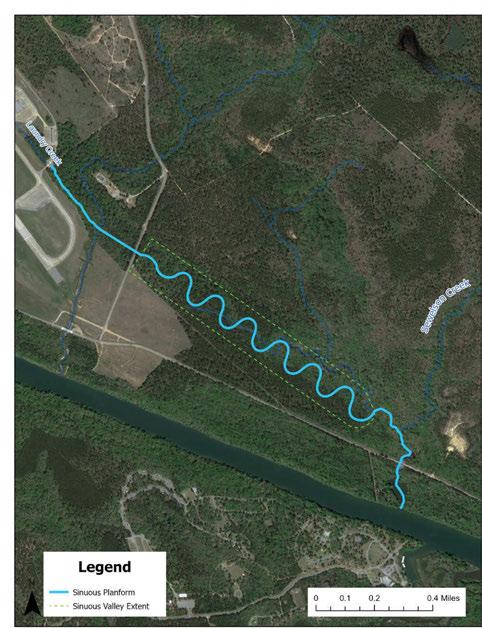
Figure 12 depicts the preliminary sinuosity and floodplain belt width for the restored stream. While meandering channels in nature generally follow the sine-generated form, any future refinements of the planform layout should include deviations within the natural range of variability in radius of curvature and meander wavelength as described by Carson & Lapointe (1983) and Soar & Thorne (2001).
LAUNDRY CREEK STREAM RESTORATION | UNIVERSITY OF GEORGIA PAGE 25 STREAM RESTORATION DESIGN
Figure 12: Proposed sinuous planform and valley for the Laundry Creek stream restoration design.
5.5.3.4 - Grade Control
Grade control structures, or more specifically at-grade hard points, may be necessary for the stream restoration due to incision risk, future risk of increased flows from heavier precipitation events, and potential land cover change. Grade control structures, such as the Newbury riffle example included in Appendix C, can act as rock hardpoints that hold the vertical elevation of the channel at riffle crossings. Hard points should be placed strategically to prevent vertical downcutting of the channel without overreliance on the structures (Hawley, 2018). Excessive grade control, especially with a low slope design, has the potential to induce unwanted deposition of sediment that can bury natural channel features, disrupting aquatic habitat, and decreasing channel capacity. For the preliminary design, hard point structure locations are not defined and an indepth hydraulic analysis with field surveys will be necessary to refine locations for hard point placement.
5.5.3.5 - Roadway Crossings & MultiObjective Culvert Design
The preliminary stream restoration alignment intersects two existing roads on the installation: Sightseeing Road and Sunshine Road. Sightseeing Road, located directly southwest of LAAF, is an important corridor for the installation which serves as the most direct route between Colonel Ralph Puckett Parkway and Sunshine Road. Sunshine Road, located south of LAAF and running parallel to the Chattahoochee River, is also an important corridor for the installation and provides recreational benefits (e.g., biking) for military personnel and the public. Alternative routes will be needed during the construction of stream crossing structures on each road. Traffic control plans will need to allow vehicle passage at Sightseeing Road while Sunshine Road remains open for recreational passage.
Two stream crossing structures are included as part of the preliminary design at both roads. Sightseeing Road does not have an existing structure and Sunshine Road has two, 60” and 84”, reinforced concrete pipes (RCPs). Currently, the structures at Sunshine Road are sized to only handle flows from Sewelson Creek. However, inundation of the two RCPs located at Sunshine Road has been observed due to backwater from the Chattahoochee River during large storm events (Figure 13). These structures have also experienced costly failures in the past.
The two stream crossing structures for the restoration follow a multi-objective culvert design (Gómez et al., 2023). This type of culvert design seeks to achieve three key principles under future climate and land use change scenarios: 1) effectively convey large future flows of water and debris, 2) reduce wildlife vehicle conflicts, and 3) provide aquatic organism passage. In a recent report to the Georgia Department of Transportation, Gómez et al. (in press) identified a set of best practices and design principles for multi-objective culverts. The study highlighted that culvert designed for safe conveyance of flood, sediment, and debris flows under future scenarios can also facilitate safety and wildlife benefits. Multi-objective culverts should include the following attributes:
• Maintain natural substrate using open bottom structures, placing natural channel materials in the culvert, or burying the bottom,
• Include wide, dry paths or ledges that act as “floodplains” and remain dry during all but the highest annual flows,
• Design for sufficient height and length for utilization by terrestrial wildlife that create wildlife vehicle conflicts, for example whitetail deer,
• And design vegetation and cover objects (e.g., flat rocks) at the entrance and within the structure to guide wildlife.
The Federal Highway Administration’s HY-8 Culvert Hydraulic Analysis Program was employed to size the two preliminary
5. STREAM RESTORATION DESIGN PAGE 26
Figure 13: Backwater effect from the Chattahoochee River observed upstream of Sunshine Road culvert after a rain event on 2/12/24.
stream crossing structures. Recommended best practices and design principles from the GDOT study performed by UGA were considered along with analyzing the performance of the structures under future hydrologic conditions in HECRAS (see 5.6). Proposed dimensions were also checked to ensure that the structures would not adversely change the longitudinal profiles of Sightseeing and Sunshine Road. At the proposed Sightseeing Road crossing, results from the analyses recommended that a 32-foot wide, 10-ft rise structure is installed to minimize the risk of the future 100500 yr events adversely affecting LAAF functionality and that all three key principles are met. Results also indicated that the crossing at Sunshine Road would need to be upsized to a structure that was 23-foot wide with a 10-foot rise.
The two concept stream crossing structures at Sightseeing Road and Sunshine Road have a high likelihood to achieve the key principles of a multi-objective culvert. However, further development, including in-depth hydraulic analyses, is recommended to ensure a climate robust design with effective wildlife passage.
5.6 - Hydraulics
5.6.1 - Objectives
The purpose of the numerical modeling is to assess the hydraulic behavior of Laundry creek under existing and future project alignment for steady flow conditions. This includes evaluating the flood risk reduction capabilities of the restoration design and comparing its performance to the existing conditions. The modeling aims to conduct a sensitivity analysis to variations in key parameters such as design slope, bed roughness and backwater effects from Chattahoochee River. The goal is to make an informed decision for resilient flood management and stream restoration strategies.
5.6.2 - Theory
The USACE open-source software Hydraulic Engineering Center-River Analysis System (HEC-RAS) version 6.4.1 was selected for its one-dimensional (1D) modeling capabilities to simulate water surface profiles under steady or varied flow conditions. Water surface profiles in HEC-RAS are computed from one cross section to the next by solving the Energy equation (1) with an iterative procedure called the standard step method.
Z1, Z2 Elevation of the main channel inverts
Y1, Y2 Depth of water at cross sections
V1, V2 Average velocities
α1, α2 Velocity weighting co-efficients
g Gravitational acceleration
he Energy head loss
HEC-RAS evaluates the hydraulic effects of stream restoration measures, such as channel realignment and culvert modification, and allows for predictive analysis of changes in water surface elevations and flow velocities. The sensitivity analysis in HEC-RAS shows how variations in design parameters, such as channel slope, roughness coefficients, and alignment, impact the hydraulic responses of the stream system and potential inundation of LAAF. The HEC-RAS model is integrated with RAS Mapper to create model features and produce flood inundation maps using the DEM. This baseline model is crucial for assessment of the current hydraulic conditions, which are key considerations in developing a stable channel design.
5.6.3 - Study Area
5.6.3.1
- Numerical Model of the Existing Conditions
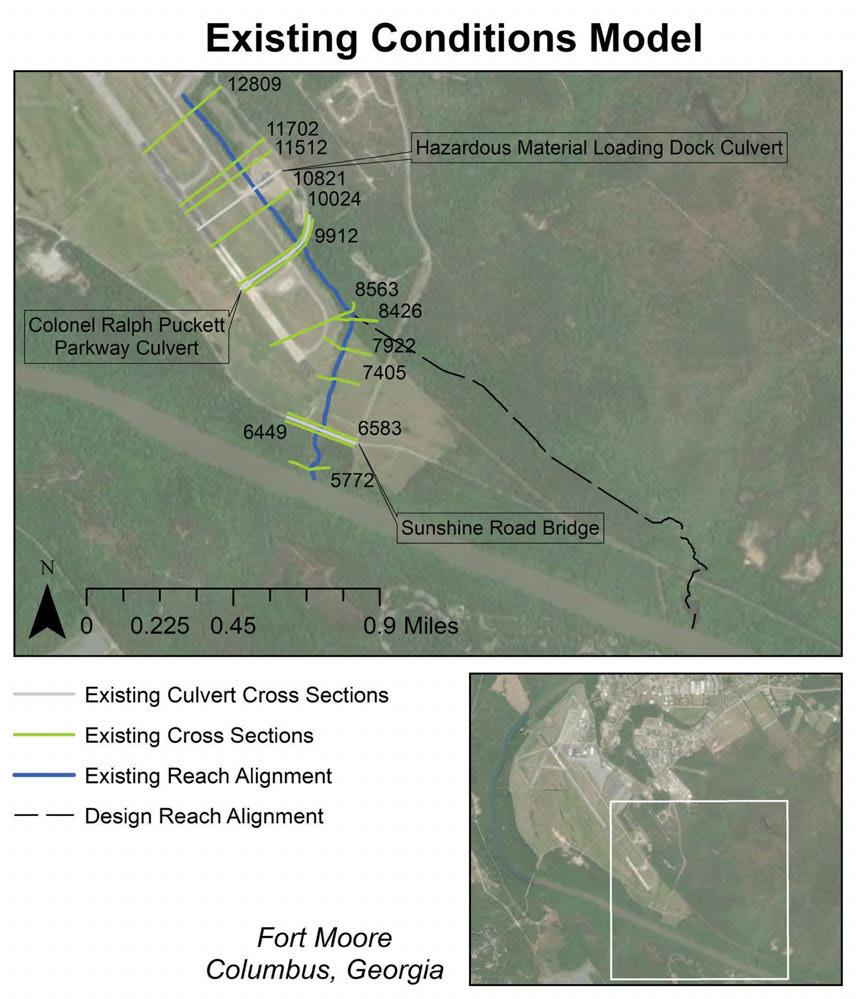
In order to assess the efficacy of the stream restoration alternative, two models were created, one reflecting existing conditions of Laundry Creek and another for the stream restoration project conditions, so the performance of the project with respect to flood risk and other considerations can be evaluated. The existing conditions model has a reach length of approximately 7,200 ft and includes 13 crosssections, a culvert at the Hazardous Material Loading Dock, a culvert at Colonel Ralph Puckett Parkway Road, and a bridge at Sunshine Road. Using RAS Mapper in HECRAS, the thalweg of the channel was traced on the DEM to develop the reach alignment. Similarly, the existing crosssections were generated by drawing a line which determines the location and width of the cross section in RAS Mapper
LAUNDRY CREEK STREAM RESTORATION | UNIVERSITY OF GEORGIA PAGE 27 STREAM RESTORATION DESIGN
����# +
+ ����# ����#! 2���� ℎ$
(1) ����! + ����{! + ����! ����!! 2���� =
����#
and extracting the elevation at points along the line from the DEM. The cross-section locations were chosen to capture the essential features within the reach. The plan view of the existing conditions model features is included in Figure 14.
Dimensions of the existing culverts and bridge were derived from as-builts and other data shared by the installation. The
Hazardous Material Loading Dock culvert is a triple barrel, rectangular, concrete pipe culvert, each with a diameter of 5 ft and 648 ft long. The Colonel Ralph Puckett Parkway Road culvert is a single barrel, corrugated metal, circular, pipe culvert and is 13 ft wide and 110 ft long. The bridge at Sunshine Road has a span of approximately 145 ft and includes a single pier with a width of 2 ft.
STREAM RESTORATION DESIGN PAGE 28
5.
Figure 14: Planview of the existing conditions model depicting the reach alignment, labeled cross-sections, and culvert and bridge locations.
5.6.3.2 - Numerical Model of the Design Reach Alignment
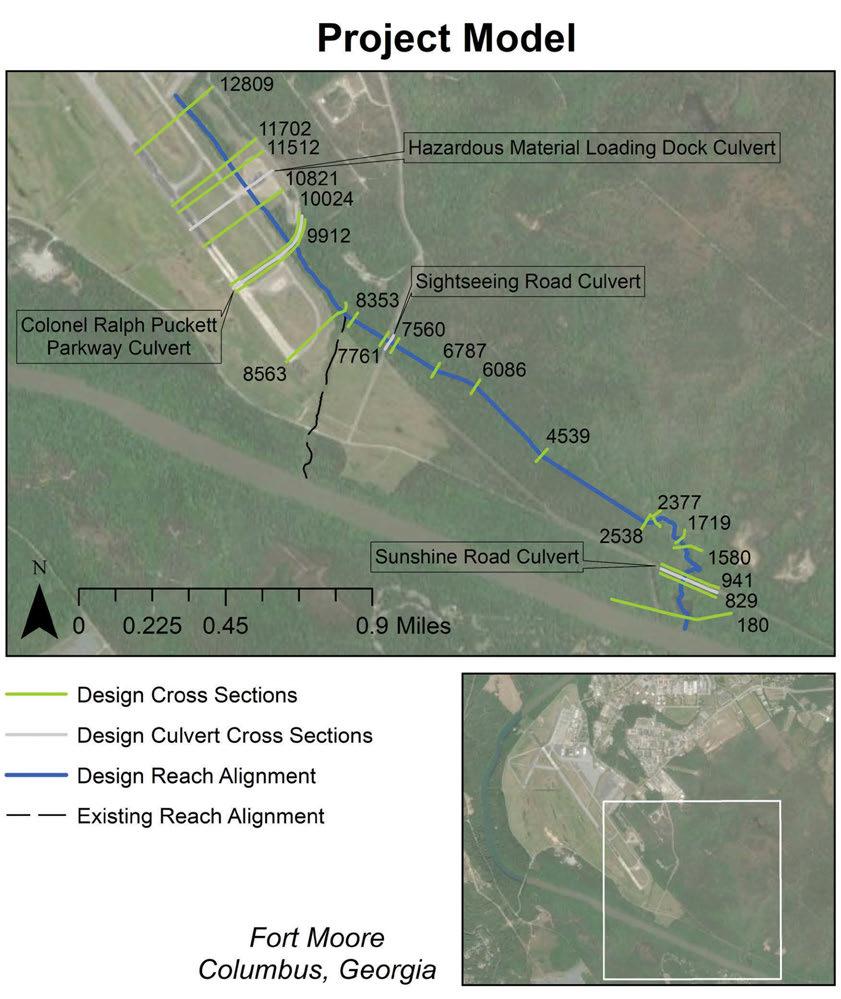
The hydraulic model of the stream restoration alternative has a reach length of approximately 12,810 ft, 20 cross-sections, and includes the existing Hazardous Material Loading Dock and the Colonel Ralph Puckett Parkway Road culverts, a new culvert at Sightseeing Road, and a resized culvert at Sunshine Road. The project model was built similarly to the existing conditions model using RAS Mapper features to determine the reach alignment and cross-sections after the downstream tie-in point with the remnant channel. The restoration alignment follows a low point in the terrain that transverses the landscape towards the remnant channel. It is important to note that the alignment serves as a proof-
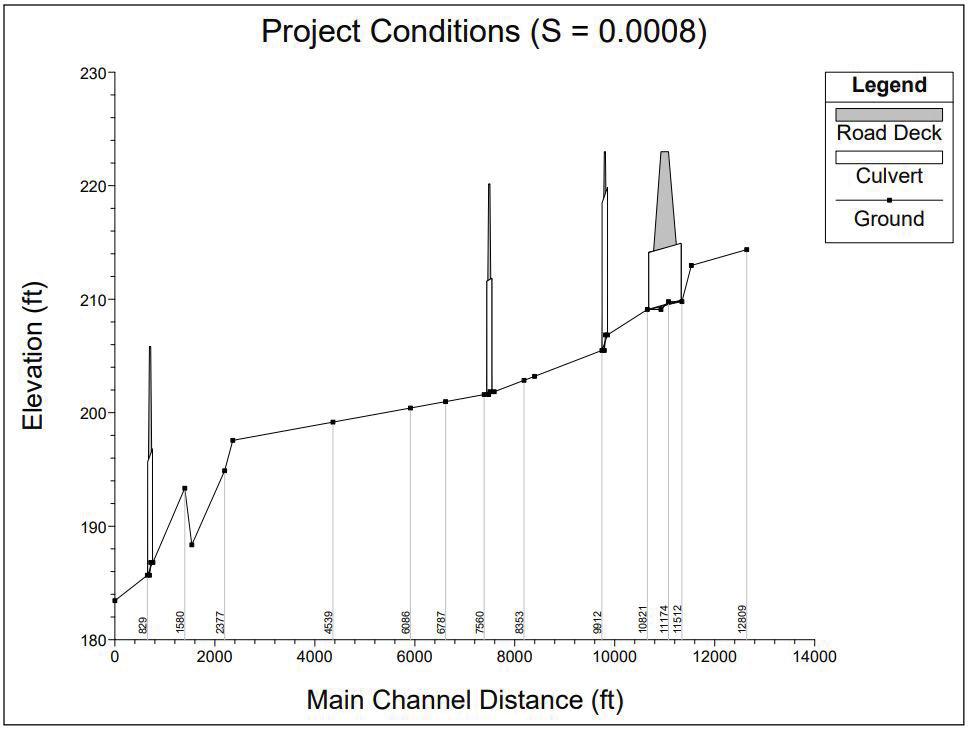
of-concept design for the hydraulic analysis and does not reflect the meandering planform of the design. The channel geometry at River Stations 8353, 7761, 7560, 6787, 6086, 4539 and 2538 were not developed using RAS Mapper since they are the designed portion of the reach. A set of station and elevation points that maintain the design geometry were assigned at these river stations with the elevations adjusted for the desired slope. The plan view of the project model features is included in Figure 16. In Figure 17, the profile plot depicts an increase in minimum channel elevation at river station 1580 after the tie-in to the remnant channel. This abrupt rise in channel elevation is likely due to sediment deposition over time, and if the design is implemented, the higher flows routed through this section of the remnant channel will remove this sediment deposit.
LAUNDRY CREEK STREAM RESTORATION | UNIVERSITY OF GEORGIA PAGE 29 STREAM RESTORATION DESIGN
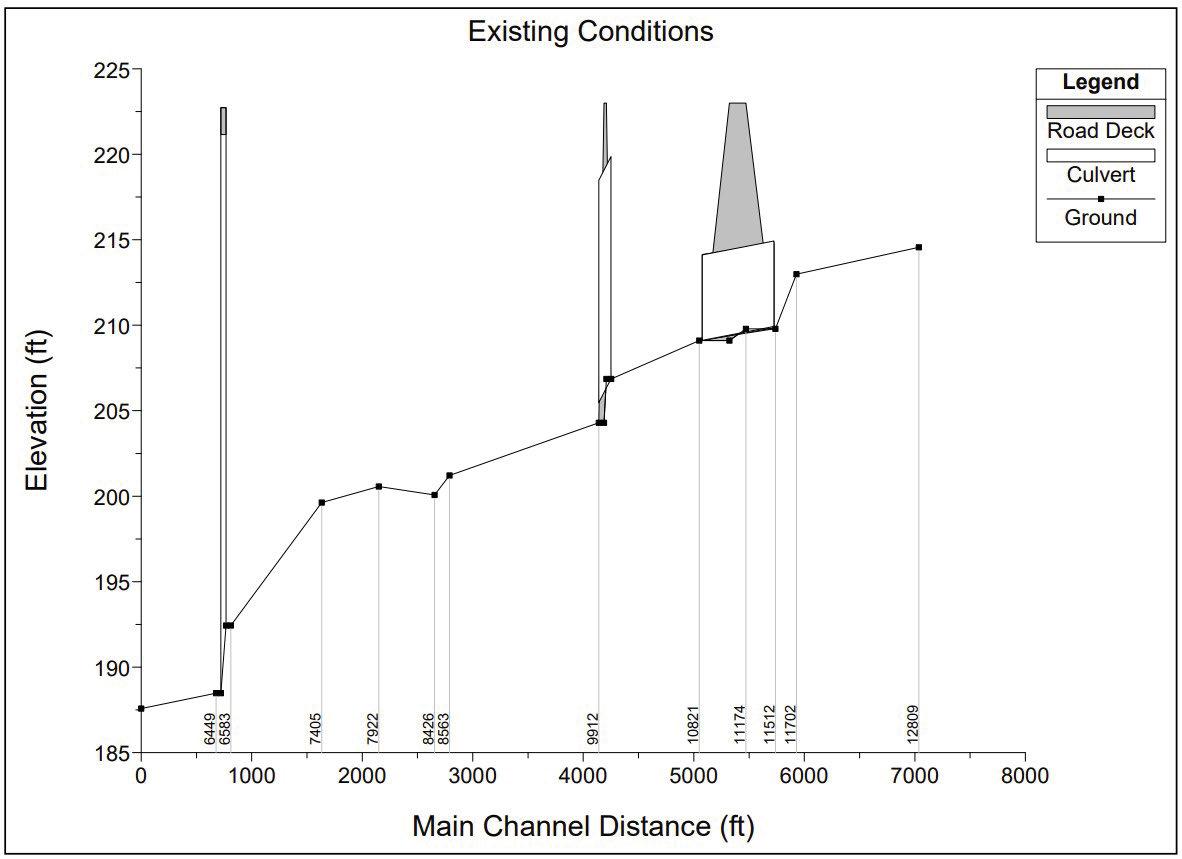
Figure 15: Profile plot of the existing conditions model in HEC-RAS, depicting the minimum channel elevation at each cross section and the location of culverts and bridges.
5. STREAM RESTORATION DESIGN PAGE 30
Figure 16: Plan view of the project model depicting the reach alignment, labeled cross section locations, and culvert locations.
The Federal Highway Administration’s HY-8 Culvert
Hydraulic Analysis Program was used to size the Sightseeing Road culvert and resize the Sunshine Road culvert. The culverts were sized to pass the 100-year future flow without overtopping the road. The Sightseeing Road culvert was modeled as a single barrel, concrete box culvert with a 1:1 Bevel Wingwall inlet configuration. The tailwater condition was based on a rating curve with the downstream channel geometry. The roadway was set to a constant elevation of 220 ft based on the road elevations extracted from the DEM. A minimum culvert size of 15’ span and 10’ rise passed the 100-year future flow of 2515 cfs; however, the
final dimensions were decided upon based on the hydraulic analysis. The Sunshine Road culvert was modeled as a single barrel, concrete box culvert with a 1:1 Bevel Wingwall inlet configuration. The tailwater condition was based on a constant water surface elevation of 187 ft due to its proximity to the Chattahoochee River. The roadway was set to a constant elevation of 203.4 ft based on the road elevations captured by the DEM. A 23’ span and 10’ rise box culvert passed the 100-year future flow of 3580 cfs.
The contraction and expansion coefficients were set to 0.3 and 0.5, common values for bridge sections, in the existing and project models.
LAUNDRY CREEK STREAM RESTORATION | UNIVERSITY OF GEORGIA PAGE 31 STREAM RESTORATION DESIGN
Figure 17: Profile plot of the project model in HEC-RAS, depicting the minimum channel elevation at each cross section and the location of culverts.
5.6.4 - Model Inputs
5.6.4.1 - Flow Rates
A range of flow rates were considered in our analysis (2-yr, 5-yr, 10-yr, 25-yr, 50-yr, 200-yr, and 500-yr). Flows were developed for both current hydrologic conditions and future hydrologic conditions based on anticipated development and climate change. Details on how these flows were calculated are included in the Hydrology section. The existing condition model has flow change locations at stations 12809 and 8426. The project model has three flow change locations at river stations 12809, 8353, and 1580, and the flow rates were increased at these locations accordingly. The flow rates (cfs) are included in Tables 3 and 4. All flow profiles, except the backwater flows, have a downstream boundary condition using a normal depth calculated with the bed slope at the most-downstream cross-section. Additional flow profiles were created for the 100-year current and future flows with a boundary condition of a known water surface elevation of 216 ft. These profiles were used to simulate backwater effects should the Chattahoochee River flood. The water surface elevation of the backwater condition was obtained from the Georgia Department of Natural Resources Flood Map Viewer, which shows flood zones and base flood elevations for the 1% AEP event. A sensitivity analysis of the water surface elevation for the backwater boundary condition was conducted for the 100-yr future event. To consider how climate change and upstream development might increase the backwater condition from the Chattahoochee River, a range of backwater water surface elevations were considered. The backwater water surface elevation was increased in increments of 0.5 feet up to a 3-foot increase (i.e., up to 219 ft) in water surface elevation for the boundary condition.
5.6.4.2 - Bed Roughness
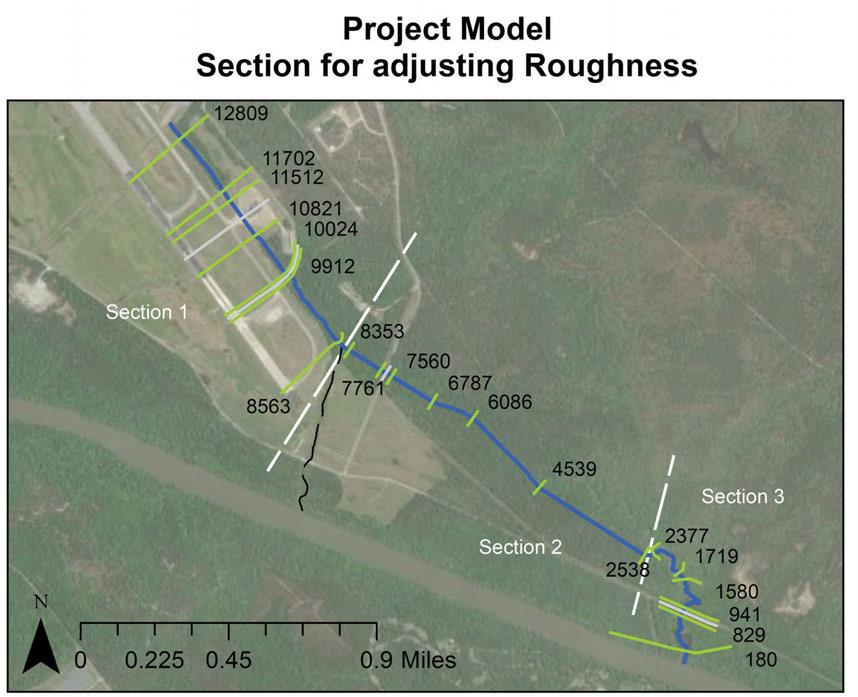
Channel roughness was established by adjusting Manning n parameter to 0.04 and 0.06 for the floodplain across the entire reach, applicable to both existing and project models initially. A sensitivity analysis on Manning n values was performed to evaluate the impact of vegetation succession, anticipated from the restoration design, on flood inundation. For the existing conditions model, Manning n values were uniformly increased throughout the reach. In contrast, for the project model, the reach was segmented into three sections
5. STREAM RESTORATION DESIGN PAGE 32
River station 12809 8426 2-yr 538 790 5-yr 659 1076 10-yr 735 1275 25-yr 817 1524 50-yr 868 1703 100-yr 917 1887 200-yr 963 2075 500-yr 1009 2307 100-yr BW 917 1887 2-Yr Future 653 960 5-Yr Future 833 1361 10-Yr Future 945 1639 25-Yr Future 1066 1989 50-Yr Future 1146 2249 100-yr Future 1222 2515 200-Yr Future 1294 2790 500-Yr Future 1370 3134 100-Yr Fut BW 1222 2515
Table
3 - Existing Conditions Model
Flow rates (cfs)
Table 3 – Flow rates (cfs) for each return period at River Stations 12809 and 8426 which are the flow change locations in the existing conditions model.
River station 12809 8353 1580 2-yr 538 790 937 5-yr 659 1076 1352 10-yr 735 1275 1657 25-yr 817 1524 2059 50-yr 868 1703 2365 100-yr 917 1887 2686 200-yr 963 2075 3025 500-yr 1009 2307 3464 100-yr BW 917 1887 2686 2-Yr Future 653 960 1137 5-Yr Future 833 1361 1710 10-Yr Future 945 1639 2130 25-Yr Future 1066 1989 2688 50-Yr Future 1146 2249 3123 100-yr Future 1222 2515 3580 200-Yr Future 1294 2790 4066 500-Yr Future 1370 3134 4705 100-Yr Fut BW 1222 2515 3580
Table 4 - Project Model Flow
rates (cfs)
Table 4 – Flow rates (cfs) for each return period at River Stations 12809, 8353, and 1580 which the flow change locations in the project model.
(Figure 18) reflecting expected vegetation changes, with Manning n values adjusted for each section accordingly. The scenarios and respective roughness values are included in Tables 5 and 6 below.
Table 5 – The channel and floodplain Manning n value for the different scenarios considered in the existing conditions model.
LAUNDRY CREEK STREAM RESTORATION | UNIVERSITY OF GEORGIA PAGE 33 STREAM RESTORATION DESIGN
Scenario Channel Floodplain Base Scenario 0.04 0.06 Scenario C 0.06 0.09
Table 5 - Existing Conditions Model – Manning n values
Section 1 Section 2 Section 3 Scenario Channel Floodplain Channel Floodplain Channel Floodplain Base Scenario 0.04 0.06 0.04 0.06 0.04 0.06 Scenario A 0.04 0.06 0.06 0.09 0.06 0.12 Scenario B 0.06 0.09 0.06 0.09 0.06 0.12
Table 6 - Project Model – Manning n values
Table 6 – The channel and floodplain Manning n value for the different scenarios considered in the project model.
Figure 18: Project model reach divided into three sections for adjusting the Manning n values for the sensitivity analysis.
5.6.4.3 - Channel Slope
The initial channel slope for the restoration design was set at 0.0008; however, sensitivity analysis was conducted for a range of slopes for the portion of the reach between Sightseeing Road and the down-stream tie-in with the remnant channel. This portion starts at river station 7560
and ends at river station 2538 and represents 83% of the designed reach. Slopes of 0.0004, 0.0006, 0.0008, 0.0010, and 0.0012 were analyzed. The change in minimum cross section elevation to achieve the desired bed slope is depicted in Figure 19.
5.6.5 - Results
5.6.5.1 - Existing Condition Model – Water Surface Elevations
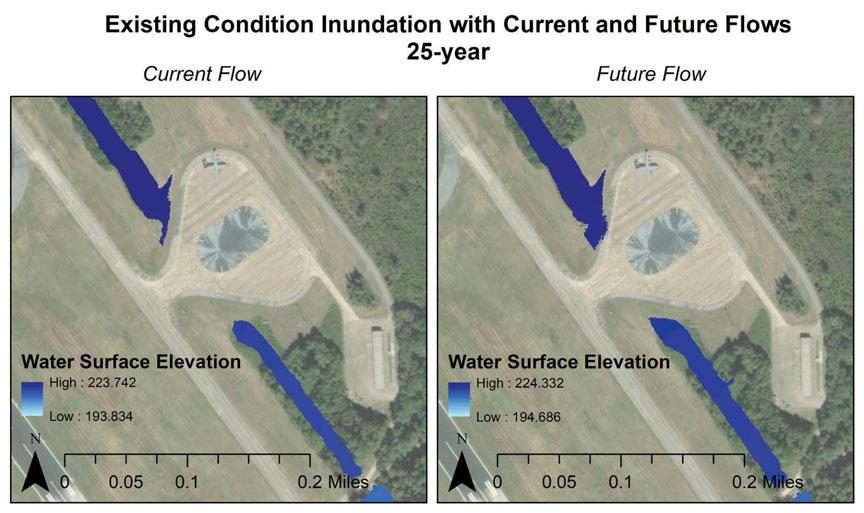
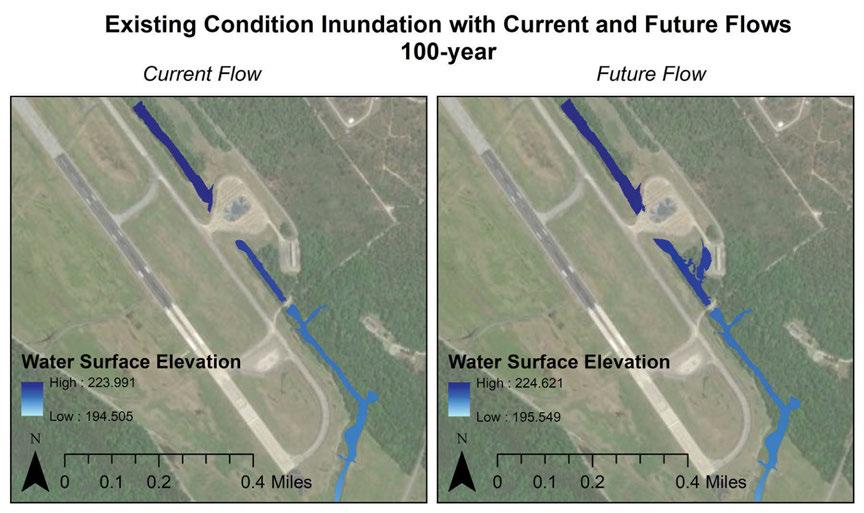
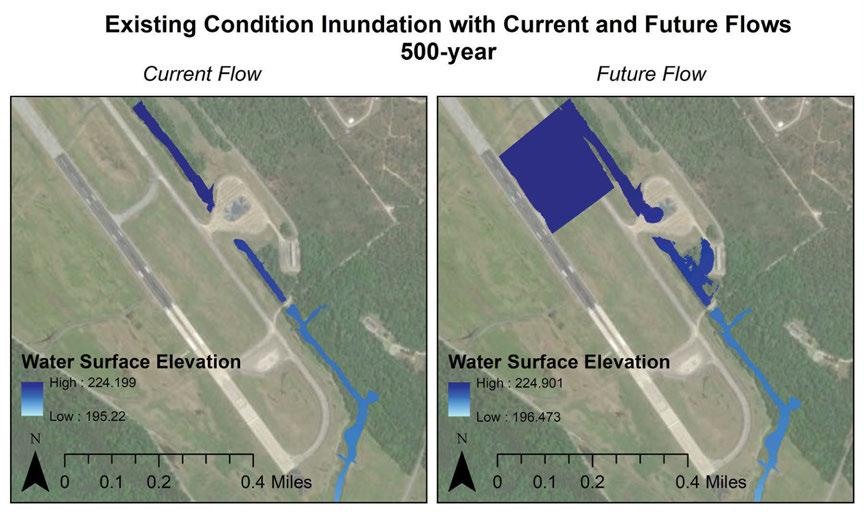
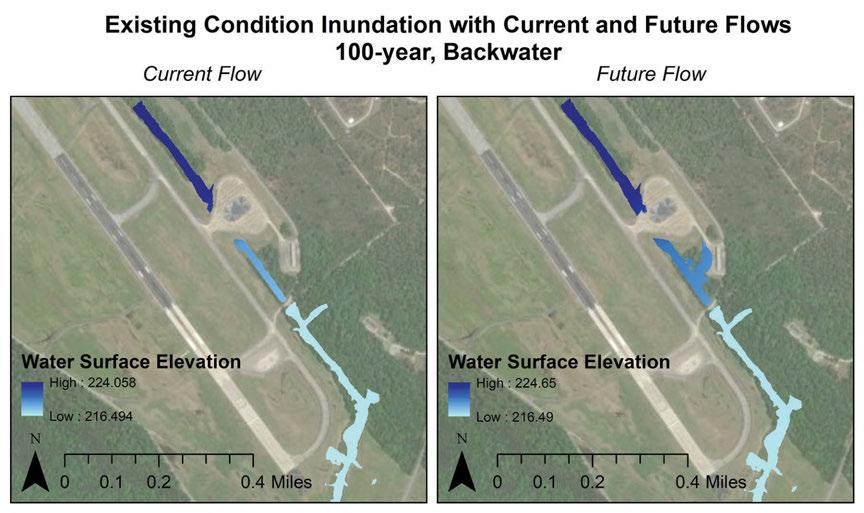
The existing condition model was run with both current and future flows to determine how the existing channel handles increased flows in response to climate change and upstream land use change. The increases in water surface elevation are depicted in Table 7, and the changes that caused inundation of the airfield are highlighted. The changes to inundation are depicted in Figures 20 through 24.
The airfield was not inundated for any scenario in with the current flows, but it was inundated for every event with the future flows to varying degrees. The edge of the hazardous material area is slightly encroached by inundation in the 25-yr future event and grows increasingly inundated for the 100-yr future, 100-yr future backwater, and 200-yr future events. For the 500-yr future event, the runway becomes inundated. This flooding is likely due to the limited capacity of the triple barrel culvert under the hazardous material loading dock to pass future flows.
5. STREAM RESTORATION DESIGN PAGE 34
Figure 19: The minimum channel elevations based on the range of design slopes considered in the sensitivity analysis.
Table 7 – Differences in water surface elevation (ft) for the existing condition model between current and future flows.
Table 7 - Differences in Water Surface Elevation (ft) from future flows compared to existing flows for the existing conditions model
LAUNDRY CREEK STREAM RESTORATION | UNIVERSITY OF GEORGIA PAGE 35 STREAM RESTORATION DESIGN
River Station 25-yr Fut 100-yr Fut 200-yr Fut 500-yr Fut 100-yr Fut BW 12809 0.59 0.63 0.64 0.7 0.59 11702 0.55 0.58 0.59 0.65 0.54 11512 0.54 0.57 0.58 0.64 0.53 11174 HAZMAT Culvert 10821 1.66 1.99 2.14 2.33 1.63 10024 1.57 1.88 2.03 2.2 1.39 9968 CRPP Culvert 9912 0.77 0.87 0.93 1.01 0.09 8563 0.9 1.11 1.22 1.35 0.13 8426 0.86 1.05 1.16 1.27 0.1 7922 0.85 1.05 1.15 1.27 0.07 7405 0.63 0.75 0.78 0.88 0 6538 0.78 0.94 1.01 1.11 0 6516 Sunshine Bridge 6449 0.83 1.02 1.12 1.23 0 5772 0.85 1.05 1.14 1.25 0
Figure 20: Existing condition inundation (ft) for the 25-yr flow and 25-yr future flow.

5. STREAM RESTORATION DESIGN PAGE 36
Figure 22: Existing condition inundation (ft) for the 200-year flow and 200-year future flow.
Figure 21: Existing condition inundation (ft) for the 100-year flow and 100-year future flow.
LAUNDRY CREEK STREAM RESTORATION | UNIVERSITY OF GEORGIA PAGE 37 STREAM RESTORATION DESIGN
Figure 24: Existing conditions inundation (ft) for the 100-year backwater flow and 100-year future backwater flow.
Figure 23: Existing conditions inundation (ft) for the 500-year flow and 500-year future flow.
5.6.5.2 - Project Model with Design Reach –Water Surface Elevations
A design slope of 0.0008 was selected for the comparison with the existing conditions model. The slope represents a preliminary sinuosity of the restoration. The flow rates for the 25-yr future, 100-yr future, 200-yr future, 500-yr future, and 100-yr future backwater events were used for the comparison since they reflect regulatory standards and future conditions for extreme events. The water surface elevations for these events for the existing and project models are included in Table A1 and Table A2 in the Appendix F. The upstream portion of the reach adjacent to the airfield is the same in both models, so the differences in water surface elevations are calculated for these cross-sections (12809 to 8563).
In Table 6, the changes in water surface elevation that induce a change to airfield inundation are highlighted. For the river stations upstream of the Colonel Ralph Puckett Parkway Road culvert (12809 to 10024), there were marginal differences (less than 0.5 inches) in water surface elevation for the 25-year future, 100-year future, and 200-year future events, and the airfield inundation was the same for both models. For the river stations downstream of the Colonel Ralph Puckett Parkway Road culvert (9912 and 8563) for each event, there were larger increases in water surface elevation (up to almost one foot), but they did not cause any changes to airfield inundation since the channel was not overtopped.
There are differences in airfield inundation for the 500-year future and 100-yr future backwater events. For the 100-year future, backwater condition event, there is inundation at the Hazardous Materials Loading Dock in both the existing condition and project models. The water surface elevation at river stations 11512, 10821, and 10024 increases 0.07, 0.25, and 0.35 ft respectively in the project model, which results in inundation that extends slightly further into the Hazardous Materials Loading Dock. The change in inundation at the airfield is depicted in Figure 25.
5. STREAM RESTORATION DESIGN PAGE 38
River Station 25-yr Fut 100-yr Fut 200-yr Fut 500-yr Fut 100-yr Fut BW 12809 0.02 0.03 0.03 -0.07 0.06 11702 0.02 0.04 0.04 0.02 0.07 11512 0.01 0.03 0.03 0.01 0.07 11174 HAZMAT Culvert 10821 -0.02 -0.02 -0.01 -0.02 0.25 10024 0.01 0.02 0.01 0.01 0.35 9968 CRPP Culvert 9912 0.5 0.39 0.43 0.57 0.6 8563 0.25 0.5 0.73 0.98 0.64
Table 8 - Change in WSE between Project Model and Existing Condition Model
Table 8- The differences in water surface elevation (ft) between the project model and existing conditions for the future flows.
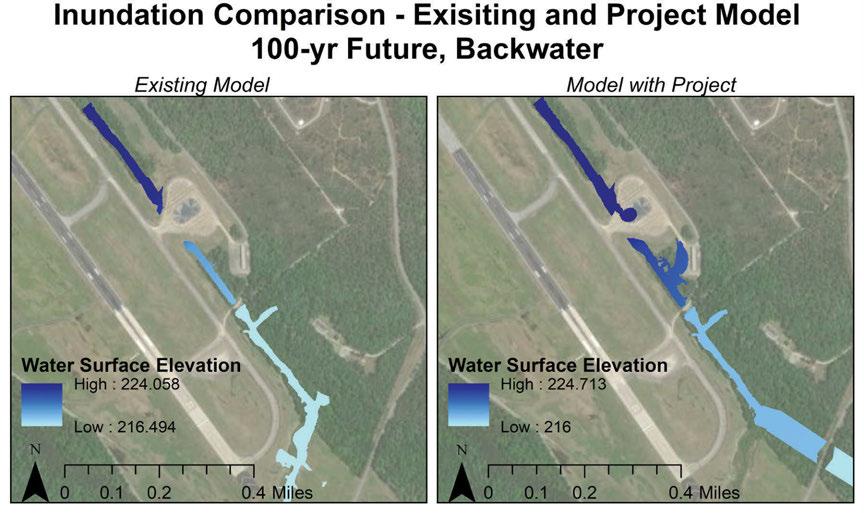
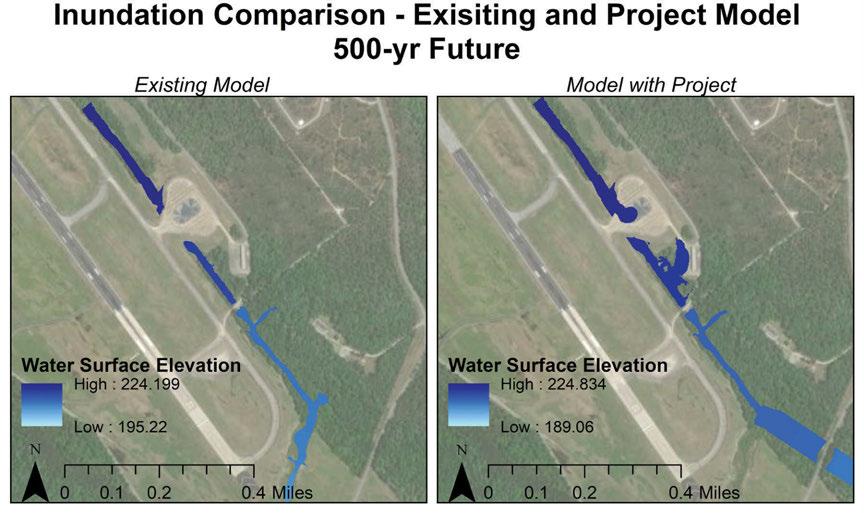
LAUNDRY CREEK STREAM RESTORATION | UNIVERSITY OF GEORGIA PAGE 39 STREAM RESTORATION DESIGN
Figure 25: Comparison of inundation (ft) for the 100-yr future, backwater event for the existing condition and project models.
Figure 26: Comparison of inundation (ft) for the 500-year future event for the project model and existing condition model.
5.6.5.3 - Channel Slope Sensitivity Analysis
A range of slopes were considered to understand how changes in the design channel slope might impact inundation of the airfield. The slopes of 0.0004, 0.0006, 0.0010, and 0.0012 were analyzed in addition to the 0.0008 slope. The changes to the water surface elevation for slopes of 0.0004, 0.0006, 0.0010, and 0.0012 compared to the 0.0008 slope for the 25-year future, 100-year future, 200-yr future, 500-yr future, and 100-yr future backwater events are in Table A3 in the Appendix F.
Since the 0.0004 and 0.0006 slopes are shallower than the 0.0008 slope, the minimum channel elevations along the design reach were elevated, so there are increases in water surface elevation along this portion of the reach (River Station 7560 - 2538). These increases propagate upstream until the Colonel Ralph Puckett Parkway Road culvert, but the river stations further upstream experience negligible changes, so the airfield inundation remains the same as the
0.0008 slope for all the events. For the 0.0010 and 0.0012 slopes, the minimum channel elevations are lower than for the 0.0008 slope, resulting in decreases in water surface elevation along this reach portion (River Station 7560 - 2538).
Again, these decreases propagate upstream until the Colonel Ralph Puckett Parkway Road culvert, and there are negligible changes in water surface elevation at river stations adjacent to the airfield.
5.6.5.4 - Backwater Sensitivity Analysis
For the 100-yr future backwater flow, the boundary condition is a known water surface elevation of 216 ft. Water surface elevations of 216.5, 217, 217.5, 218, 218.5, and 219 ft were considered in the sensitivity analysis. The water surface elevations for the different backwater conditions for the 0.0008 slope are depicted in Table 9, and the water surface elevations that inundate the airfield are highlighted.
5. STREAM RESTORATION DESIGN PAGE 40
River Station 216.5 ft 217 ft 217. 5 ft 218 ft 218.5 ft 219 ft 12809 224.71 224.76 224.80 224.84 224.87 224.88 11702 224.53 224.59 224.63 224.67 224.70 224.71 11512 224.50 224.56 224.60 224.64 224.67 224.69 11174 HAZMAT Culvert 10821 221.31 221.64 222.08 222.55 223.03 223.15 10024 220.30 220.71 221.23 221.78 222.31 223.08 9968 CRPP Culvert 9912 217.79 218.26 218.73 219.22 219.71 220.18 8563 217.93 218.41 218.88 219.37 219.86 220.32 8353 217.93 218.40 218.87 219.37 219.86 220.32 7761 217.86 218.34 218.82 219.32 219.81 220.31 7668 Sightseeing Culvert 7560 216.66 217.14 217.61 218.11 218.60 219.08 6787 216.67 217.15 217.63 218.12 218.61 219.09 6086 216.65 217.14 217.61 218.11 218.60 219.08 4539 216.62 217.11 217.59 218.09 218.58 219.06 2538 216.60 217.09 217.57 218.07 218.56 219.05 2377 216.55 217.04 217.53 218.04 218.53 219.02 1719 216.52 217.02 217.51 218.02 218.52 219.01 1580 216.52 217.01 217.50 218.01 218.51 219.00 941 216.52 217.02 217.51 218.02 218.52 219.01 885 Sunshine Culvert 829 216.50 217.00 217.50 218.00 218.50 219.00 180 216.50 217.00 217.50 218.00 218.50 219.00
Table 9 – Water Surface Elevation (ft) for backwater conditions (S=0.0008)
Table 9 – Water surface elevations (ft) for the project model with 100-yr future backwater boundary conditions.
For the 216 ft backwater elevation (the original boundary condition), the hazardous material area is inundated. As the backwater elevation increases, the inundation in this area expands up to the 217.5 ft condition (river stations 11512, 10821, and 10024). At a backwater elevation of 218 ft, the natural levee between river stations 11512 and 10821 overtops, and the runway is flooded. At backwater elevations of 218.5 and 219 ft, river station 12809 also overtops and floods the runway in other locations. The inundation from these events is depicted in Figure 27.
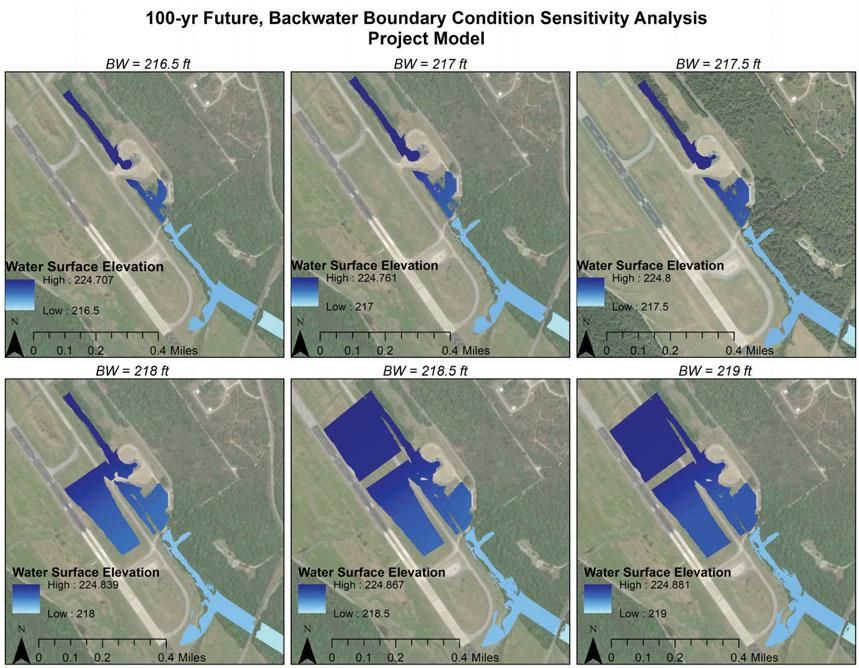
The backwater scenarios were simulated for the range of slopes (0.0004 to 0.0012) to assess how the different slopes accommodated the rise in water surface elevation at the boundary condition. The differences in water surface elevation for the different slopes for the range of backwater event conditions are depicted in Table A4 in the Appendix. Generally, as the slopes became steeper, there were decreases in water surface elevation. However, the decreases were less than 0.5 inch, so they did not induce any changes to inundation from the 0.0008 slope.
5.6.5.5 - Bed Roughness Sensitivity Analysis
The initial project model used Manning n values of 0.04 for the channel and 0.06 for the floodplain (referred to as the ‘base scenario’ in the remainder of this section). Additional scenarios were simulated that increase the roughness values in Scenarios A and B, where roughness in Scenario B was increased more than Scenario A. The changes to water surface elevation caused by raising the roughness values compared to the base scenario for the 0.0008 design slope are in Table 8. Changes to water surface elevation that result in differences in inundation from the base scenario are highlighted
LAUNDRY CREEK STREAM RESTORATION | UNIVERSITY OF GEORGIA PAGE 41 STREAM RESTORATION DESIGN
Figure 27: Changes to inundation (ft) for the different water surface elevations used as the boundary condition for the for the 100-year future, backwater event in the project model.
Table 10 – The difference in water surface elevations (ft) for the project model between Scenario A and the Base Scenario and Scenario B and Base Scenario.
Table 10 - The differences in water surface elevation (ft) from raising the Manning n values in Scenario A and Scenario B WSE
from Scenario A
For scenario A, raising the Manning n values did not alter inundation for the 25-yr future, 100-yr future, 200-yr future, or 500-yr future events. Inundation increased slightly in the hazardous material area for the 100-yr future backwater event with a 0.16 ft increase in water surface elevation at River Station 10821, depicted in Figure 28.
For scenario B, which included the highest Manning n values, inundation increased at all events, but to varying
degrees. Inundation increased at the hazardous material area for the 25-yr future and 100-yr future, backwater events due to increases in water surface elevation at River Stations 11512, 10821, and 10024. For the 100-yr future, 200-yr future, and 500-yr future flow rates, an increase in water surface elevation was observed at river station 12809, which caused overtopping onto the runway not seen in the Base Scenario. The inundation increases are depicted in Figures 19 through 33.
5. STREAM RESTORATION DESIGN PAGE 42
RS 25-yr Fut 100-yr Fut 200-yr Fut 500-yr Fut 100-yr Fut BW 25-yr Fut 100-yr Fut 200-yr Fut 500-yr Fut 100-yr Fut BW 12809 0 0 0.02 0.01 0.01 0.27 0.31 0.09 0.15 0.06 11702 0 0 0.02 0 0.01 0.07 0.07 0.09 0.07 0.08 11512 0 0 0.02 0 0.01 0.05 0.05 0.06 0.04 0.04 11174 HAZMAT Culvert HAZMAT Culvert 10821 0 0 0 0 0.16 0.4 0.4 0.39 0.4 0.7 10024 0 0 0 0 0.2 -0.09 -0.06 -0.04 -0.01 0.46 9968 CRPP Culvert CRPP Culvert 9912 -0.1 0.25 0.44 0.69 0.29 1.87 2.02 2.03 2.02 0.62 8563 0.91 0.96 0.99 1.08 0.29 0.95 0.98 1.01 1.1 0.3 8353 0.89 0.94 0.97 1.07 0.28 0.89 0.94 0.97 1.07 0.28 7761 0.79 0.83 0.88 0.98 0.26 0.79 0.83 0.88 0.98 0.26 7668 Sightseeing Culvert Sightseeing Culvert 7560 1.25 1.46 1.51 1.47 0.25 1.25 1.46 1.51 1.47 0.25 6787 1.11 1.32 1.33 1.24 0.19 1.11 1.32 1.33 1.24 0.19 6086 1.08 1.29 1.28 1.16 0.17 1.08 1.29 1.28 1.16 0.17 4539 0.92 1.17 1.12 0.95 0.14 0.92 1.17 1.12 0.95 0.14 2538 0.58 0.96 0.92 0.72 0.1 0.58 0.96 0.92 0.72 0.1 2377 2.23 1.73 1.28 0.97 0.06 2.23 1.73 1.28 0.97 0.06 1719 1.15 0.87 0.61 0.25 0.02 1.15 0.87 0.61 0.25 0.02 1580 1.42 0.84 0.54 0.14 0.01 1.42 0.84 0.54 0.14 0.01 941 0 0 0 -0.01 0 0 0 0 -0.01 0 885 Sunshine Culvert Sunshine Culvert 829 0 0 0 0 0 0 0 0 0 0 180 0.86 1.02 1.1 1.2 0 0.86 1.02 1.1 1.2 0
Difference
WSE Difference from Scenario B

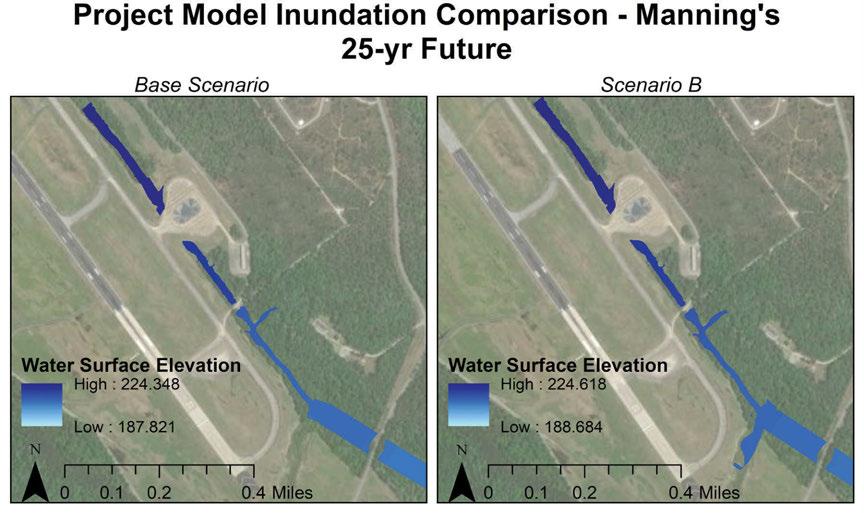
LAUNDRY CREEK STREAM RESTORATION | UNIVERSITY OF GEORGIA PAGE 43 STREAM RESTORATION DESIGN
Figure 28: Inundation (ft) in the project model for the 100-yr future backwater event to compare the Base Scenario and Scenario A roughness values.
Figure 29: Inundation (ft) in the project model for the 25-yr future event to compare the Base Scenario and Scenario B roughness values.
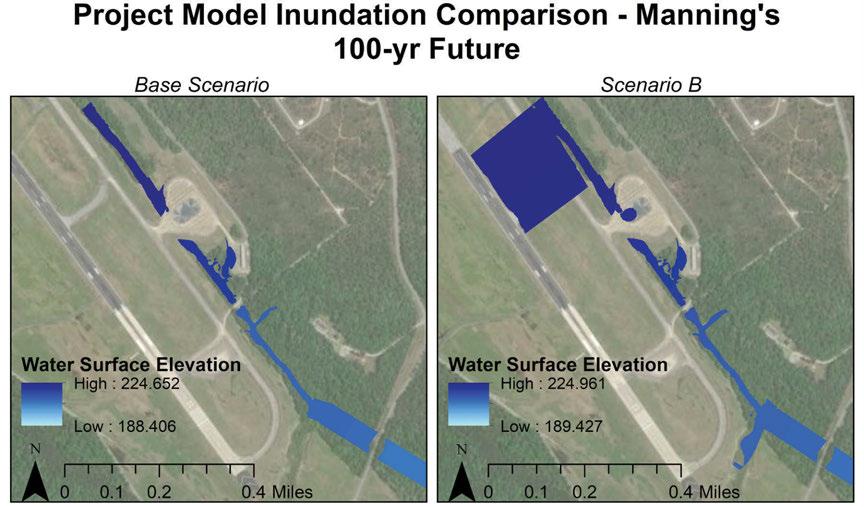
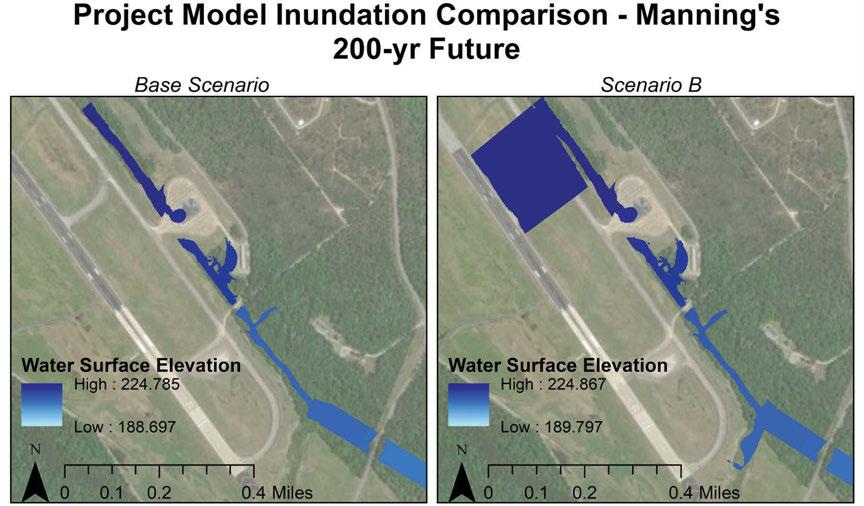
5. STREAM RESTORATION DESIGN PAGE 44
Figure 31: Inundation (ft) in the project model for the 200-yr future event to compare the Base Scenario and Scenario B roughness values.
Figure 30: Inundation (ft) in the project model for the 100-yr future event to compare the Base Scenario and Scenario B roughness values.
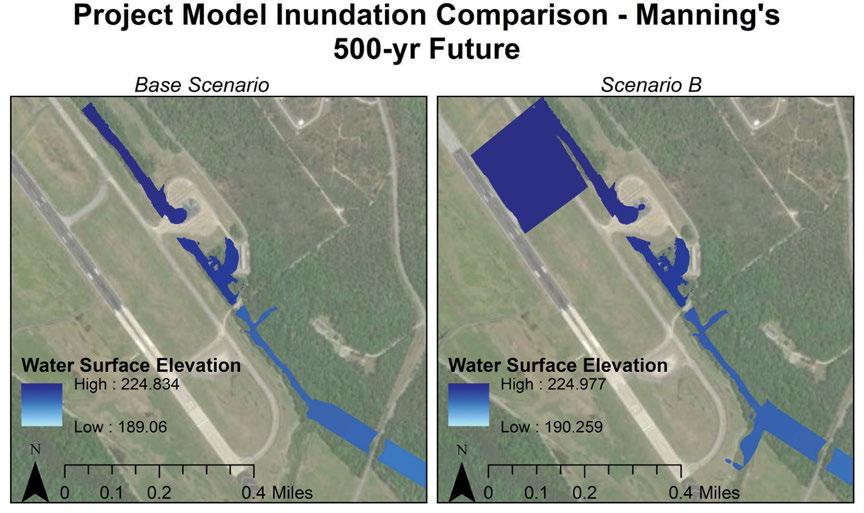
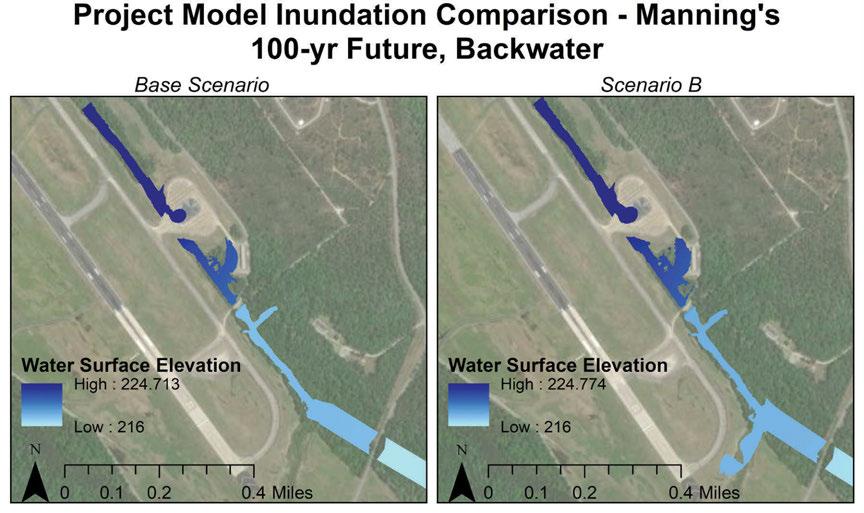
LAUNDRY CREEK STREAM RESTORATION | UNIVERSITY OF GEORGIA PAGE 45 STREAM RESTORATION DESIGN
Figure 33: Inundation (ft) in the project model for the 100-yr future backwater event to compare the Base Scenario and Scenario B roughness values.
Figure 32: Inundation (ft) in the project model for the 500-yr future event to compare the Base Scenario and Scenario B roughness values.
Scenarios A and B were also simulated for the range of slopes, and Table A5 and Table A6 in the Appendix F depict changes to water surface elevation compared to the 0.0008 slope. The changes in water surface elevation that cause changes to airfield inundation are highlighted. For Scenario A, inundation from the 25-year future, 100-year future, 200year future, and 100-year future backwater events remained the same across all slopes. For the 500-year future flow, the inundation remained the same for the 0.0008, 0.0010, and 0.0012 slopes; however, for the 0.0006 and 0.0004 slopes, the 0.01 ft increase in water surface elevation at river
station 12809 caused overtopping, inundating the runway. For Scenario B, there were negligible differences in water surface elevation when comparing the range of slopes to the slope of 0.0008. For this reason, the inundation did not change between the slopes.
The Manning n values were also increased for the existing condition model in Scenario C, and the corresponding changes to water surface elevations are below in Table 11. The changes to inundation caused by the increase in water surface elevation are depicted in Figures 34 through 38.
5. STREAM RESTORATION DESIGN PAGE 46
River Station 25-yr Fut 100-yr Fut 200-yr Fut 500-yr Fut 100-yr Fut BW 12809 0.26 0.32 0.06 0.04 0.33 11702 0.05 0.07 0.07 0.05 0.1 11512 0.03 0.05 0.04 0.02 0.07 11174 HAZMAT Culvert 10821 0.44 0.42 0.42 0.41 0.66 10024 -0.05 -0.04 -0.04 -0.03 0.36 9968 CRPP Culvert 9912 1.84 1.99 2.04 2.09 0.62 8563 1.06 1.13 1.17 1.2 0.29 8426 1.07 1.17 1.2 1.26 0.27 7922 0.78 0.86 0.89 0.94 0.19 7405 1.48 1.72 1.85 1.97 0.09 6538 0.43 0.47 0.49 0.5 0.01 6516 Sunshine Bridge 6449 1.58 1.84 2.05 2.11 0 5772 1.58 1.84 2.07 2.11 0
Table 11 - Increases in WSE for the Existing Conditions Model with Manning roughness values from Scenario C
Table 11 – The difference in water surface elevations (ft) for the existing condition model between Scenario C and the Base Scenario.
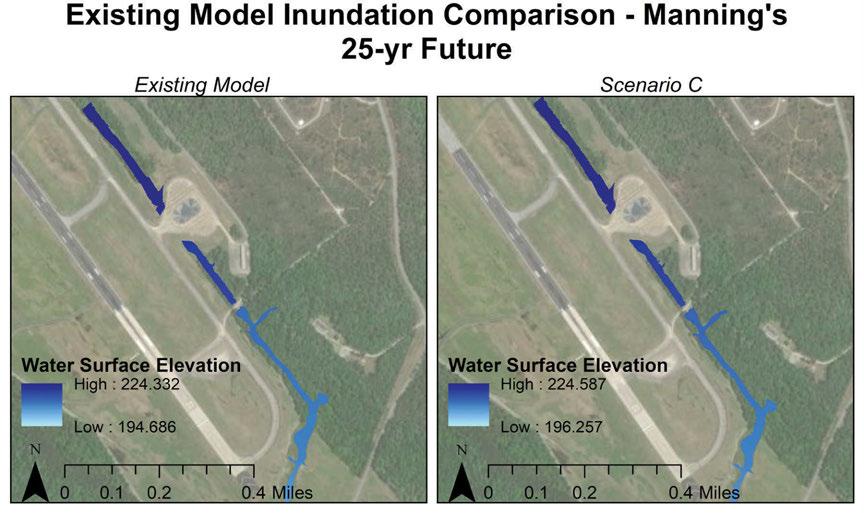
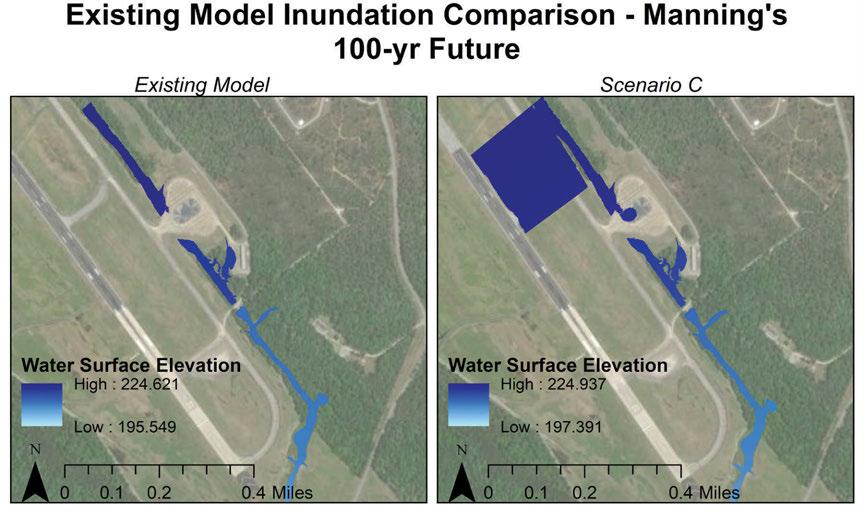
LAUNDRY CREEK STREAM RESTORATION | UNIVERSITY OF GEORGIA PAGE 47 STREAM RESTORATION DESIGN
Figure 35: Inundation (ft) in the existing model to compare the Base Scenario and Scenario C of roughness values for the 100-yr future event.
Figure 34: Inundation (ft) in the existing model to compare the Base Scenario and Scenario C of roughness values for the 25-yr future event.
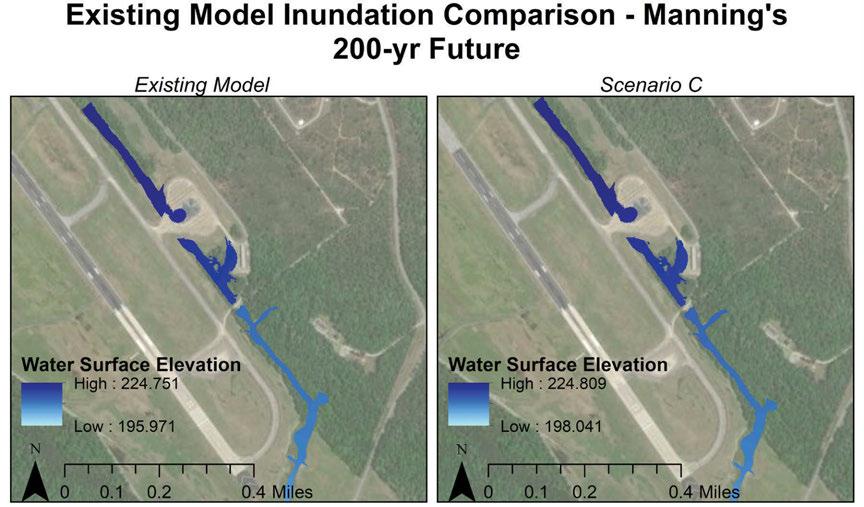
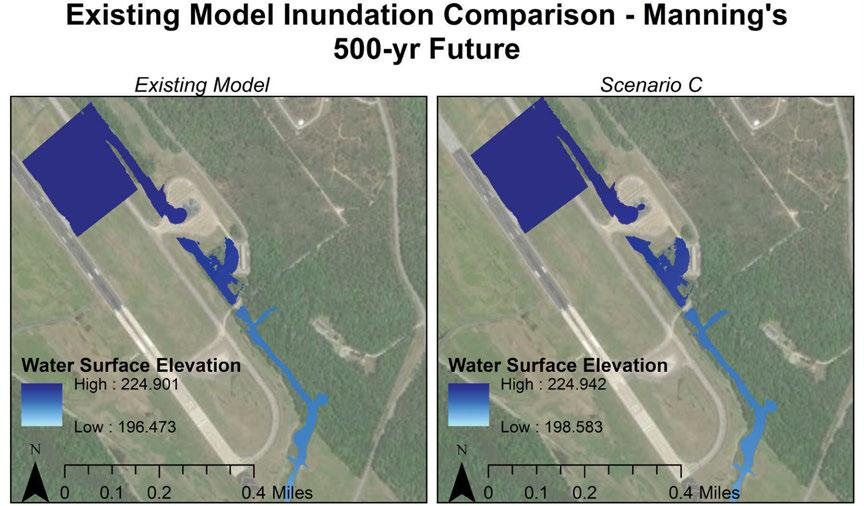
5. STREAM RESTORATION DESIGN PAGE 48
Figure 37: Inundation (ft) in the existing model to compare the Base Scenario and Scenario C of roughness values for the 500-yr future event.
Figure 36: Inundation (ft) in the existing model to compare the Base Scenario and Scenario C of roughness values for the 200-yr future event.
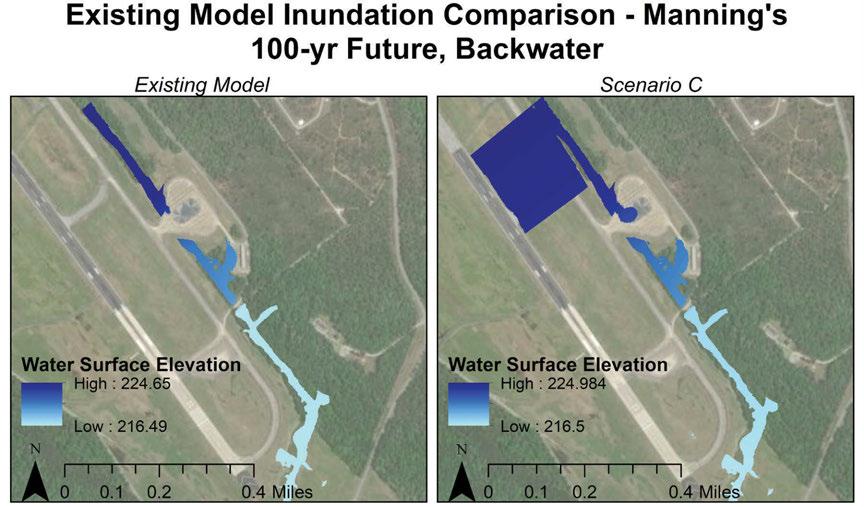
For the existing condition model, raising the Manning roughness values in Scenario C caused increases in inundation for each of the flow rate events compared to the lower roughness values. For the 25-year event, inundation at the hazardous material area was slightly increased. For the 100year future, 500-yr future, and 100-year future backwater events, hazardous material flooding increased and the increase in WSE at river station 12809 caused overtopping that flooded the runway. Interestingly, the overtopping did not occur for the 200-yr future event, but inundation was increased at the hazardous material area. A direct comparison of the impact of raising Manning roughness values cannot be made because the project model and existing conditions models contain different reaches; however, the roughness changes for Scenario B in the project model and Scenario C in the existing model were analogous, and the models respond similarly to the changes.
5.6.5.6 - Overall Changes to Inundation Across Scenarios
Overall, many simulations were run to understand how different parameters impact inundation at LAAF in the future with the project HEC-RAS model and how that compares to the existing conditions model. There were two regions of the airfield that appeared to be inundated: the hazardous materials area and the runway. Table 12, Table 13, Table 14, and Table 15 describe which portion of the airfield appears inundated and how that inundation changes for different parameters.
LAUNDRY CREEK STREAM RESTORATION | UNIVERSITY OF GEORGIA PAGE 49 STREAM RESTORATION DESIGN
Figure 38: Inundation (ft) in the existing model to compare the Base Scenario and Scenario C of roughness values for the 100-yr future backwater event.
Table 12 – Location of inundation in the existing condition model and changes in inundation in the project model for all slopes when compared to the existing conditions.
Table 12 – Location of inundation in the existing condition model and changes to inundation in the project model. 25-yr Fut 100-yr Fut 200-yr Fut 500-yr Fut 100-yr Fut BW
Design (S = 0.0010)
Design (S = 0.0008)
Design (S = 0.0006) Design (S = 0.0004)
Table 13 – Changes to inundation caused by raising the roughness values for the project model in Scenario A compared to the Base Scenario.
Table 13 – Describes change in inundation for the project model between Scenario A and Base Scenario
Design (S = 0.0010)
Design (S = 0.0008)
Design (S = 0.0006)
Design (S = 0.0004)
Runway is now flooded. Inundation is the same for 0.0004 and 0.0006 slopes.
5. STREAM RESTORATION DESIGN PAGE 50
Existing Conditions HAZMAT area is
HAZMAT area is inundated. HAZMAT area is inundated. HAZMAT area and runway are flooded. HAZMAT area is inundated.
No
No
No increase
inundated.
Design (S = 0.0012)
increase compared to existing condition for all slopes.
increase compared to existing condition for all slopes.
compared to existing condition for all slopes. Runway NOT flooded. No increase compared to existing condition for all slopes. Runway NOT flooded. HAZMAT area inundation slightly increases by less than three inches. The inundation is the same across all slopes.
25-yr Fut 100-yr Fut 200-yr Fut 500-yr Fut 100-yr Fut BW Existing Conditions N/A N/A N/A N/A N/A Design
Same as Base Scenario. Same as Base Scenario. Same as Base Scenario. Same as Base Scenario. HAZMAT area inundation slightly increases.
same
all slopes.
(S = 0.0012)
Inundation is the
across
When comparing inundation of the existing and project models, the restoration alternative did not increase flood risks for the 25-yr future, 100-yr future, and 200-yr future events, reduced inundation for the 500-yr event, and slightly increased the water surface at HAZMAT for the 100-yr future backwater event. Results for the project and existing models were insensitive to variations in design slope between
0.0004-0.001. Changes did occur when increasing Manning roughness in scenario A for the 500-year future event, and the 0.0004 and 0.0006 slope models showed noticeably different patterns on inundation versus the other three slopes. All of the slopes produced the same inundation when roughness values were raised to their highest in Scenario B.
Table 14 – Changes to inundation caused by raising the roughness values for the project model in Scenario B compared to the Base Scenario and for the existing model in Scenario C compared to the Base Scenario.
Table 14 – Change in inundation for the project model between Scenario B and Base Scenario and for existing condition model between Scenario C and Base Scenario 25-yr Fut 100-yr Fut 200-yr Fut 500-yr Fut 100-yr Fut BW
Existing Conditions
HAZMAT area inundation slightly increases.
Design (S = 0.0012)
Design (S = 0.0010)
Design (S = 0.0008)
Design (S = 0.0006)
Design (S = 0.0004)
HAZMAT area inundation slightly increases. The inundation is the same across all slopes.
Runway is now flooded.
HAZMAT area inundation slightly increases.
Runway is now flooded. Runway is now flooded.
Runway is now flooded. The inundation is the same across all slopes.
Runway is now flooded. The inundation is the same across all slopes.
Runway is now flooded. The inundation is the same across all slopes.
HAZMAT area inundation slightly increases. The inundation is the same across all slopes.
LAUNDRY CREEK STREAM RESTORATION | UNIVERSITY OF GEORGIA PAGE 51 STREAM RESTORATION DESIGN
Scenario B for the project model and Scenario C for the existing model are very comparable since the roughness values are raised similarly. The increases to roughness values produced similar effects in inundation between the project and existing models. For the 25-yr future event, both models exhibited an increase in inundation at the hazardous material area. For the 100-yr future and 500-yr future events, inundation increases even more, and the runway is flooded.
However, the observed inundation for the other two events is different. For the 200-yr future event, the hazardous material area is slightly more inundated, and the runway is flooded in the project model due to a 0.07 ft increase in water surface elevation, but not in the existing conditions model. In contrast, for the 100-year future backwater event, the runway is flooded in the existing conditions model, and not in the project model.
Table 15 – Changes to inundation caused by increasing the water surface elevation of the boundary condition of the 100-year future, backwater event in the project model.
Table 15 – Change in inundation for the 100-yr Future Backwater water surface elevation boundary conditions compared to the original value of 216 ft.
Design (S = 0.0012)
Runway flooded in two locations.
Runway flooded in two locations. Same for all but the 0.0006 slope. Design (S = 0.0010) Runway flooded in one location. Design (S = 0.0008)
HAZMAT area is inundated. Same across all slopes.
HAZMAT area inundation increases slightly. Same across all slopes. HAZMAT area inundation increases slightly. Same across all slopes. HAZMAT area inundation increases slightly. Same across all slopes.
Runway is now flooded. Same across all slopes.
Runway flooded in two locations. Same for all but the 0.0010 slope. Design (S = 0.0006)
In the simulations of the 100-yr future backwater event with varying water surface elevations for the boundary condition, inundation was the same for all slopes for the 216.5, 217, and 217.5 ft scenarios. In these scenarios, the hazardous material area inundation increased incrementally with increases in backwater elevation, but the runway was never inundated. Inundation from the 218 ft condition was also the same across the slopes, and the channel was overtopped at river station 12809, and the runway was inundated. For the 218.5 and 219 ft conditions, the hazardous material
area inundation increased incrementally, and the runway became inundated, but there were differences across the slopes. For the 218.5 ft condition, the runway experienced inundation from Laundry Creek overtopping at two locations for all slopes except 0.0010 where the overtopping occurred in only one location. Similarly, for the 219 ft condition, the runway was inundated due to overtopping in two locations for all slopes except 0.0006 where overtopping occurred in one location.
5. STREAM RESTORATION DESIGN PAGE 52
216 ft 216.5 ft 217 ft 217.5 ft 218 ft 218.5 ft 219 ft
Runway flooded in one location. Design (S = 0.0004)
Runway flooded in two locations.
5.6.6 - Conclusion
The analysis of Laundry Creek, utilizing HEC-RAS 1D steady flow simulations and subsequent comparisons between existing conditions and future with project restoration revealed minimal differences in Water Surface Elevations (WSE) for standard flow events (25-year, 100-year, and 200-year scenarios). The stream restoration alternative effectively addresses conveyance needs, even up to the 500-year event. This negligible impact on WSE suggests that the modifications, particularly the culvert at Sightseeing Road and resized culvert at Sunshine Roads, demonstrate a proactive flood risk mitigation approach aligned with future hydrologic conditions under altered climate and land use regimes. While the existing and project models depicted slight inundation of the hazardous material area for the future flows due to the limited capacity of the HAZMAT culvert, the future flows represent a worse-case scenario of peak flows syncing throughout the basin and are a very conservative estimate. In this context, implementing upstream stormwater storage measures may emerge as a viable solution to reduce future flow volumes, thereby mitigating downstream flood risks, especially for the smaller events like the 25-year.
The stream restoration alternative demonstrates robustness, showing limited sensitivity to variations in channel slope. Model insensitivity to slope variations across flows and roughness parameters suggests that slight design adjustments are unlikely to adversely affect creek hydrodynamics. However, the model did demonstrate some degree of sensitivity to backwater conditions in the Chattahoochee River. The model depicted a capacity to withstand incremental increases in backwater elevation without significant changes to inundation of the runway up to 217.5 ft. However, increases beyond 218 ft did result in the runway becoming inundated. Additionally, compared to the existing conditions, the project HEC-RAS model depicted slight increases in inundation of the hazardous material area for the 100-yr future backwater event. For this reason, additional refinement of downstream infrastructure will be necessary to ensure no net rise of water surface elevation at this location.
Moreover, the sensitivity analysis depicted the preliminary design’s resilience to variations in Manning roughness, indicating that the design can accommodate minor changes without reducing hydraulic efficiency or elevating flood risk.
However, the analysis also pinpointed areas needing further attention, such as the sensitivity of WSE at river station 12809, which could lead to overtopping. To address this, additional refinement of downstream infrastructure will be necessary to ensure no net rise in WSEs at this location, thus preventing potential overtopping. This recommendation emphasizes the need for additional in-depth analyses in pre-construction engineering and design to fully understand local hydraulic dynamics, ensuring that any intervention does not inadvertently elevate flood risk.
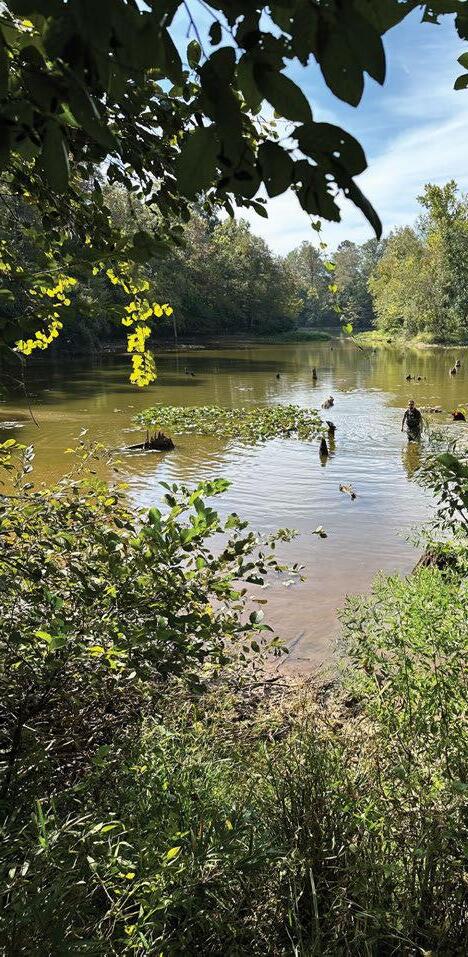
LAUNDRY CREEK STREAM RESTORATION | UNIVERSITY OF GEORGIA PAGE 53 STREAM RESTORATION DESIGN
PAGE 54 6. CONCEPTUAL OPINION OF PROBABLE CONSTRUCTION COSTS PROBABLE CONSTRUCTION COSTS 06
CONCEPTUAL OPINION OF PROBABLE CONSTRUCTION COSTS
This section presents an estimate of probable construction cost for the Laundry Creek Stream Restoration alternative. The estimate was calculated as part of the feasibility study using detailed unit costs and performing quantity take-offs.
This type of estimate strives to be accurate within -5 percent to +10 percent for a preliminary design. These costs were generated using current RSMeans cost data from quarter 1 of 2024 and line items for the anticipated construction activities (Appendix E). The cost estimate for four different scenarios (30% contingency + Long Haul, 30% contingency + Short Haul, 20% Contingency + Long Haul, and 20% Contingency + Short Haul) with site preparation, culvert demolition, excavation and grading, hauling, planting, and UXO survey and clearance are provided in Table 16. A long haul is defined as a roundtrip of 30 miles for moving
excavated earth while a short haul is a roundtrip of 8 miles. A construction contingency equal to 20% to 30% of the construction subtotal has been included. The contingency factors in costs associated with multi-objective culvert installation, grade control structures, and engineering testing (e.g., borings). Line-item totals are broken out according to three general work categories: Demolition and Site Preparation, Channel Restoration, and General Construction. The sum total for all the categories, ES&PC and Dewatering/Bypass, and construction contingency is shown in bold along with values representing the estimate range.
LAUNDRY CREEK STREAM RESTORATION | UNIVERSITY OF GEORGIA PAGE 55 CONCEPTUAL OPINION OF PROBABLE CONSTRUCTION COSTS
General Work Categories Estimated Cost w/ 30% Contingency + Long Haul Estimated Cost w/ 30% Contingency + Short Haul Estimated Cost w/ 20% Contingency + Long Haul Estimated Cost w/ 20% Contingency + Short Haul Demolition and Site Preparation $988,839 $988,839 $988,839 $988,839 Channel Restoration $19,917,607 $13,855,248 $19,917,607 $13,855,248 General Construction $1,364,050 $1,364,050 $1,364,050 $1,364,050 Construction Subtotal $22,270,496 $16,208,137 $22,270,496 $16,208,137 Construction Contingency (20% or 30%) $6,681,149 $4,862,441 $4,454,100 $3,241,628 ES&PC and Dewatering/Bypass (5% of Construction Subtotal) $1,113,525 $810,407 $1,113,525 $810,407 Total Construction Cost (Estimated Range: -5%/+10%) $30,065,169 ($28,561,911$33,071,686) $21,880,983 ($20,786,934$24,069,082) $27,838,120 ($26,446,214$30,621,931) $20,260,170 ($19,247,162$22,286,186)
Table 16. Estimate probable construction costs for the Laundry Creek stream restoration project.
7. CONCLUSIONS AND RECOMMENDATIONS PAGE 56
AND RECOMMENDATIONS 07
CONCLUSIONS
CONCLUSIONS AND RECOMMENDATIONS
7.1 - Conclusions: The Value of Nature-based Solutions
Lawson Army Airfield is a critical asset for Fort Moore, the United States Army, and the nation as a platform for power projection around the globe. The stream restoration alternative for Laundry Creek has the potential to increase the capacity of LAAF to safely and effectively continue operations while meeting long term goals of climate resilient infrastructure and sound environmental stewardship.
The abrupt surface irregularity violation of the Clear Zone associated with Laundry Creek’s current alignment and degradation can be addressed by returning the creek in its historical valley outside of the airfield perimeter. The earthwork generated by the restoration can be used to backfill the current, incised channel; it is estimated that it will take approximately 10% of the excavated material from the project to fill the existing incised channel alignment. The surplus of material will allow Fort Moore to leverage the remaining soil for different projects around the installation (e.g., severely eroded ranges and training grounds).
Flood hazards from the existing condition of Laundry Creek will only worsen as the magnitude and frequency of extreme events are amplified in the future. Hydraulic analyses of the feasibility study indicate that flood risk for LAAF under future conditions will be reduced by the restoration compared to the existing condition. This includes extreme events up to the 500-year flood event.
Improved drainage of LAAF will increase the likelihood that operations will remain functional and meet military mission requirements during extreme events. The proposed stream crossing structures will also facilitate drainage during flood events by conveying extreme flows and protecting upstream infrastructure.
This nature-based design will result in a much higher ecological function compared to the existing channel and any traditional, gray infrastructure alternative. Natural ecological processes and ecosystem services will be restored as the incised channel of Laundry Creek is reconnected to the surrounding floodplain. Placing Laundry Creek back onto its floodplain will provide latitudinal connectivity (i.e., floodplain connectivity) with numerous benefits. Wetlands in the historic valley are anticipated to increase as the hydrologic connectivity between the floodplain and channel are restored. Preliminary estimates for acreage of wetlands created are included in Table 17. Water quality improvements are expected as a result of increased retention of excess nutrients, toxics, and sediment. Floodplain connectivity helps decrease erosive forces and incision by allowing large flow events to spill out and dissipate onto the floodplains. Erosive forces will also be decreased by the sinuous planform design. Habitat for numerous aquatic species will also be enhanced and biodiversity increased. Habitat complexity is created by increasing the channel interaction with the floodplain and riparian ecosystem.
LAUNDRY CREEK STREAM RESTORATION | UNIVERSITY OF GEORGIA PAGE 57 CONCLUSIONS AND RECOMMENDATIONS
Scenarios of Created Wetlands Estimated Acreage (acres) 100% of Floodplain Area 24 75% of Floodplain Area 18 50% of Floodplain Area 12 25% of Floodplain Area 6
Table 17. Estimated amounts of jurisdictional wetland restoration based on varying floodplain widths that meet hydrology, soils, and vegetation criteria.
Longitudinal connectivity for wildlife will be maintained by the multi-objective culverts placed at Sightseeing and Sunshine Road. The Laundry Creek restoration project would address barriers to aquatic organism passage (AOP) located on Sewelson Creek at Sunshine Road and Laundry Creek at Sightseeing Road. The current stream crossings consist of multiple undersized and misaligned culvert structures, indicating the need for replacement based on criteria outlined in the Georgia Aquatic Connectivity Team Stream Crossing Handbook ( https://ga-act.org/ georgia-stream-crossing-handbook/). Poorly designed stream crossing structures can cause perched crossings, high water velocity, formation of upstream backwater, and recurring issues with clogging, all of which can be observed at these sites. All these conditions pose a substantial barrier to the movement of many aquatic organisms. Installation of properly designed road crossing structures would restore aquatic organism passage through Sewelson Creek and Laundry Creek to the Chattahoochee River while reducing the risk of infrastructure damage and maintenance costs.
In addition to the benefits obtained through restoring connection with the Chattahoochee River, the Laundry Creek restoration project would improve available habitat in Sewelson Creek and Laundry Creek. Restoring critical habitat for aquatic organisms is essential to reestablishing
a healthy biological community once passage has been opened. Therefore, designing a project that addresses both aquatic organism passage and stream habitat would address several aquatic organism passage and habitat availability issues in the watershed that would be worsened by the addition of conventional stormwater infrastructure such as standard box culverts.
Much of the construction associated with the proposal will be conducted outside of the airfield fence line and glidepaths, thus LAAF will also experience less airfield and training downtime. Excavation of the proposed channel can be done in the dry as well, reducing construction time.
In addition to the operational, flood risk reduction, erosion control, and ecological benefits, the restoration is a costeffective solution compared to traditional infrastructure alternatives (e.g., enclosed box culvert). With correct management and monitoring, these types of projects can stay resilient by continuing to adapt, lowering lifecycle costs in the face of changing climate and land use conditions. The upfront cost may be lower as well. The probable cost of the project remains highly uncertain. The costs estimated in this study are roughly half the order-ofmagnitude cost estimate on a culvert enclosure project at another installation (personal communication with Andrew Wilson, civil engineer at Fort Moore).
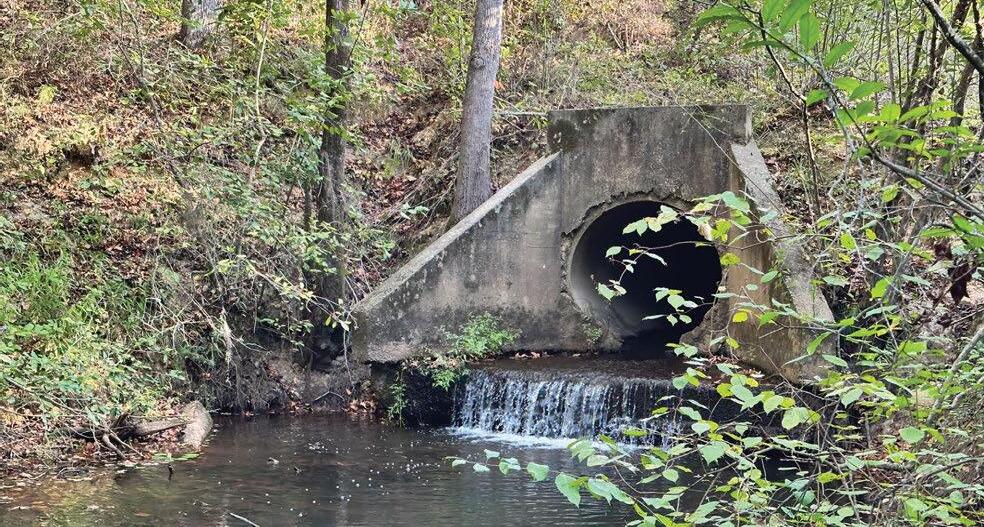
7. CONCLUSIONS AND RECOMMENDATIONS PAGE 58
Figure 39: Perched culvert on Sewelson Creek at Sunshine Road
7.2 - Recommendations: Moving Forward
This study indicates that the Laundry Creek restoration project is a feasible alternative to enclosure of the existing channelized stream in a box culvert. This report describes a feasibility-level study and development of a preliminary concept design that was largely conducted via desktop data collection due to the presence of a UXO zone in the project area. Field surveys and geotechnical investigations will be necessary as soon as the zone is cleared to confirm existing conditions and collect more detailed data.
Additional hydrologic, hydraulic, and sediment transport analysis should be performed to refine the stream restoration design. The analyses included in this report were intended to determine the overall feasibility of a stream restoration of this magnitude is a viable as an alternative that could potentially deliver flood risk reduction for future climate and a broad array of environmental benefits at a reduced cost. The estimations made for the study and design were intended to be conservative and provide proof of concept within reasonable confidence bands. Future estimates will need to be more specific and reflect refinements made in the surveys, analyses, and detailed cost estimates.
7.2.1 - Connections with Stormwater Management
As the stream restoration project is impacted by development upstream in the watershed, stormwater control measures (SCMs) need to be co-designed and integrated with the restoration design. Coordinating efforts to combine SCMs with stream restoration can provide synergistic benefits including reduced risk of channel instability, water quality impacts, habitat degradation, and loss of biodiversity (Lammers et al., 2020). Providing storage opportunities upstream and reducing runoff at the source can decrease flood elevations at the airfield below the existing condition despite anticipated future changes in precipitation and land cover. Additional hydrologic, hydraulic, and sediment transport analyses will be needed for integration of SCMs and to estimate potential benefits.
Finally, a drainage design needs to be developed to handle runoff from LAAF while meeting the maximum longitudinal
grade criteria for the Graded Area/Clear Zone. This study only included the estimated amount of material it would take to fill the existing channel of Laundry Creek. However, a shallow, swale-like feature is recommended to convey existing stormwater outfalls coming from LAAF. The design should also include a drop structure near the bridge of the Sunshine Road crossing to tie the new graded swale into the existing channel topography.
7.2.2 - Monitoring and Adaptive Management Plans
Another essential goal of this project would be to implement a monitoring program which quantifies net increases in ecological functions and services. This monitoring program will assess water quality, water quantity, biological community health (aquatic and riparian), and stream geomorphology changes over time for a minimum of five years.
7.2.2.1 - Water Quality Monitoring
• Continuous water quality monitoring stations will be installed to track changes in multiple water quality parameters through time, including temperature, dissolved oxygen, pH, conductivity, and turbidity.
• Periodic water chemistry and suspended solid samples will be collected during varying weather conditions to capture sediment and nutrient concentrations corresponding to different flow levels.
7.2.2.2 - Streamflow and Groundwater Monitoring
• Continuous water level and periodic stream discharge measurements will be collected to establish a rating curve of stream flow and monitor changes over time.
• The discharge rating curve will be used to calculate continuous estimates of stream flow and nutrient and sediment loads and monitor their changes over time.
• Floodplain inundation and groundwater levels will be assessed with well transects.
7.2.2.3 - Biological Community Monitoring
• Assessments of the fish community will be conducted once per year during the spring or summer following
LAUNDRY CREEK STREAM RESTORATION | UNIVERSITY OF GEORGIA PAGE 59 CONCLUSIONS AND RECOMMENDATIONS
guidelines established in the Georgia Department of Natural Resources Standard Operating Procedures for Assessing Fish Community Health in Wadeable streams.
• Assessments of the benthic macroinvertebrate community will be conducted once per year during the winter following guidelines established in the Georgia Department of Natural Resources Standard Operating Procedures for Assessing Benthic Macroinvertebrate Community Health in Wadeable streams.
• Assessments of riparian vegetation will be conducted during the growing season including:
o Establishment of vegetation from native seed source and survivability of seedlings,
o Establishment rate of planted vegetation,
o Species composition response to floodplain inundation in the growing season.
7.2.2.4 - Stream Geomorphic Response Monitoring
• Assessment of existing conditions of stream geomorphology will be conducted prior to construction, and then again after construction, to characterize the stream’s planform, longitudinal and cross-sectional profiles, bed and bank materials, as well as significant habitat features.
• Permanent cross sections with photo points.
7.2.2.5 - Jurisdictional Wetland Criteria Monitoring
• Assessments of jurisdictional wetland criteria monitoring will focus on the hydrology, soils, and vegetation of the stream restoration design.
In general, the monitoring plan should:
• Define and assess performance standards (physical, chemical, biological) for the entire site,
• Specify the number of locations and duration of monitoring (e.g., collecting at least 10 years of hydrologic and riparian data will provide more confidence),
• Describe a sampling scheme that provides power to detect change,
• Include graphical analysis and interpretation of results to show trends in data; and,
• Utilize recent technology improvements to achieve efficiencies.
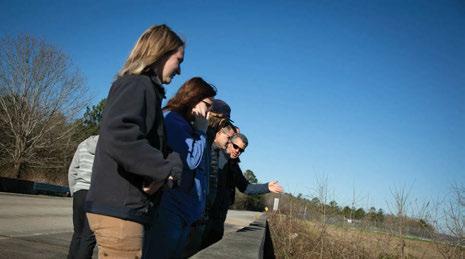
An adaptive management plan would also be necessary to ensure a sustainable project.
The adaptive management plan:
• Requires prior consideration of potential outcomes and management responses that may need to occur;
• Directly addresses the possibility of potential extreme events in the early stages of the project;
• Differentiates localized vs. systemic adjustment;
• Has clear and specific triggers to initiate action / adjustments;
• Grows out of the design process where key uncertainties are identified;
• Allows for positive self-adjustment / evolution of the system; and
• Generates learning for other installations and practitioners.
7. CONCLUSIONS AND RECOMMENDATIONS PAGE 60
[This page intentionally left blank]
LAUNDRY CREEK STREAM RESTORATION | UNIVERSITY OF GEORGIA PAGE 61 CONCLUSIONS AND RECOMMENDATIONS
8. REFERENCES PAGE 62
08
REFERENCES
REFERENCES
Black & Veatch Special Projects Corp. (2024). Lawson Army Airfield Clear Zone Study. U.S. Army Corps of Engineers, Savannah District.
Bledsoe, B., Baker, D., Nelson, P., Rosburg, T., Sholtes, J., & Stroth, T. (2017). Guidance for Design Hydrology for Stream Restoration and Channel Stability: Vol. Research Report 853. The National Academies Press. https://doi.org/10.17226/24879
Brownlie, W. R. (1981). Prediction of Flow Depth and Sediment Discharge in Open Channels
Carson, M. A., & Lapointe, M. F. (1983). The Inherent Asymmetry of River Meander Planform. The Journal of Geology, 91(1), 41–55. https://www.jstor.org/ stable/30060514
Copeland, R. R., McComas, D. N., Thorne, C. R., Soar, P. J., Jonas, M. M., & Fripp, J. B. (2001). Hydraulic Design of Stream Restoration Projects
Dewitz, J. (2023). National Land Cover Database (NLCD) 2021 Products: U.S. Geological Survey data release https://doi.org/10.5066/P9JZ7AO3
Engineering With Nature. (April 2018). What is EWN? Retrieved from https://ewn.erdc.dren.mil/videos/ what-is-ewn/
FAQs: Base Realignment and Closure (BRAC).” Fort Benning. Accessed November 22, 2023. https:// www.moore.army.mil/common/faqs/BRAC_FAQs. pdf
Feaster, T. D., Gotvald, A. J., Musser, J. W., Curtis Weaver, J., Kolb, K. R., Veilleux, A. G., & Wagner, D. M. (2023). Magnitude and Frequency of Floods for Rural Streams in Georgia, South Carolina, and North Carolina, 2017—Results
https://doi.org/10.3133/ sir20235006
Feaster, T. D., Gotvald, A. J., & Weaver, J. C. (2014). Methods for Estimated the Magnitude and Frequency of Floods for Urban and Small, Rural Streams in Georgia, South Carolina, and North Carolina, 2011
https://doi.org/10.3133/sir20145030
Garten, C. T., Ashwood, T. L., & Dale, V. H. (2003). Effect
of military training on indicators of soil quality at Fort Benning, Georgia. Ecological Indicators, 3(3), 171–179. https://doi.org/10.1016/S1470160X(03)00041-4
Gómez, A., Maerz, J., Kinney, V., Bauer, S., & Bledsoe, B. P. (2023). Bridge and Culvert Designs for Reduced Wildlife-Vehicle Conflicts and Improved Climate Resiliency: Phase I
Hawley, R. J. (2018). Making Stream Restoration More Sustainable: A Geomorphically, Ecologically, and Socioeconomically Principled Approach to Bridge the Practice with the Science. In BioScience (Vol. 68, Issue 7, pp. 517–528). Oxford University Press. https://doi.org/10.1093/biosci/biy048
Historic Columbus. ‘Fort Benning (1953 - 1955): The Vital Role of the Airborne Infantryman and Lawson AFB.’ Historic Columbus, July 14, 2022. https://www. historiccolumbus.com/post/fort-benning-19531955-the-vital-role-of-the-airborne-infantrymanand-lawson-afb
Knighton, D. (1998). Fluvial Forms and Processes (2nd ed.). Routledge. https://doi. org/10.4324/9780203784662
Lammers, R. W., Dell, T. A., & Bledsoe, B. P. (2020). Integrating stormwater management and stream restoration strategies for greater water quality benefits. Journal of Environmental Quality, 49(3), 569–581. https://doi.org/10.1002/jeq2.20047
NRCS. (2007). Part 654 Stream Restoration Design National Engineering Handbook, Chapter 10: TwoStage Channel Design
OCM Partners. (2024). 2017 GA DNR Lidar: Middle Chattahoochee - Walter F Watershed from 201006-15 to 2010-08-15. In NOAA National Centers for Environmental Information.
Perica, S., Martin, D., Pavlovic, S., Roy, I., St. Laurent, M., Trypaluk, C., Unruh, D., Yekta, M., & Bonnin, G. (2013). NOAA Atlas 14: Precipitation-Frequency
Atlas of the United States, Volume 9 Version 2.0:
LAUNDRY CREEK STREAM RESTORATION | UNIVERSITY OF GEORGIA PAGE 63 REFERENCES
Southeastern States (Alabama, Arkansas, Florida, Georgia, Louisiana, Mississippi
Perkins, D. B., Haws, N. W., Jawitz, J. W., Das, B. S., & Rao, P. S. C. (2007). Soil hydraulic properties as ecological indicators in forested watersheds impacted by mechanized military training. Ecological Indicators, 7(3), 589–597. https://doi.org/10.1016/j. ecolind.2006.07.003
Quist, M. C., Fay, P. A., Guy, C. S., Knapp, A. K., & Rubenstein, B. N. (2003). Military Training Effects on Terrestrial and Aquatic Communities on a Grassland Military Installation. Ecological Applications, 13(2), 432–442. https://doi.org/10.1890/10510761(2003)013[0432:MTEOTA]2.0.CO
Shields, F. D., Copeland, R. R., Klingeman, P. C., Doyle, M. W., & Simon, A. (2003). Design for Stream Restoration. Journal of Hydraulic Engineering, 129(8), 575–584. https://doi.org/10.1061/ (ASCE)0733-9429(2003)129:8(575)
Soar, P. J., & Thorne, C. R. (2001). Channel Restoration Design for Meandering Rivers.
Stroth, T. R., Bledsoe, B. P., & Nelson, P. A. (2017). Full spectrum analytical channel design with the capacity/supply ratio (CSR). Water (Switzerland), 9(4), 271. https://doi.org/10.3390/w9040271
Swain, D. L., Wing, O. E. J., Bates, P. D., Done, J. M., Johnson, K. A., & Cameron, D. R. (2020). Increased Flood Exposure Due to Climate Change and Population Growth in the United States. Earth’s Future, 8(11). https://doi.org/10.1029/2020EF001778
U.S. Army Fort Moore. (n.d.). About Fort Moore. Retrieved November 22, 2023, from https://home.army.mil/ moore/About
Yalin, M. S. (2001). Fluvial Processes: Vol. IAHR Monograph (1st ed.). International Association of Hydraulic Engineering and Research.
8. REFERENCES PAGE 64
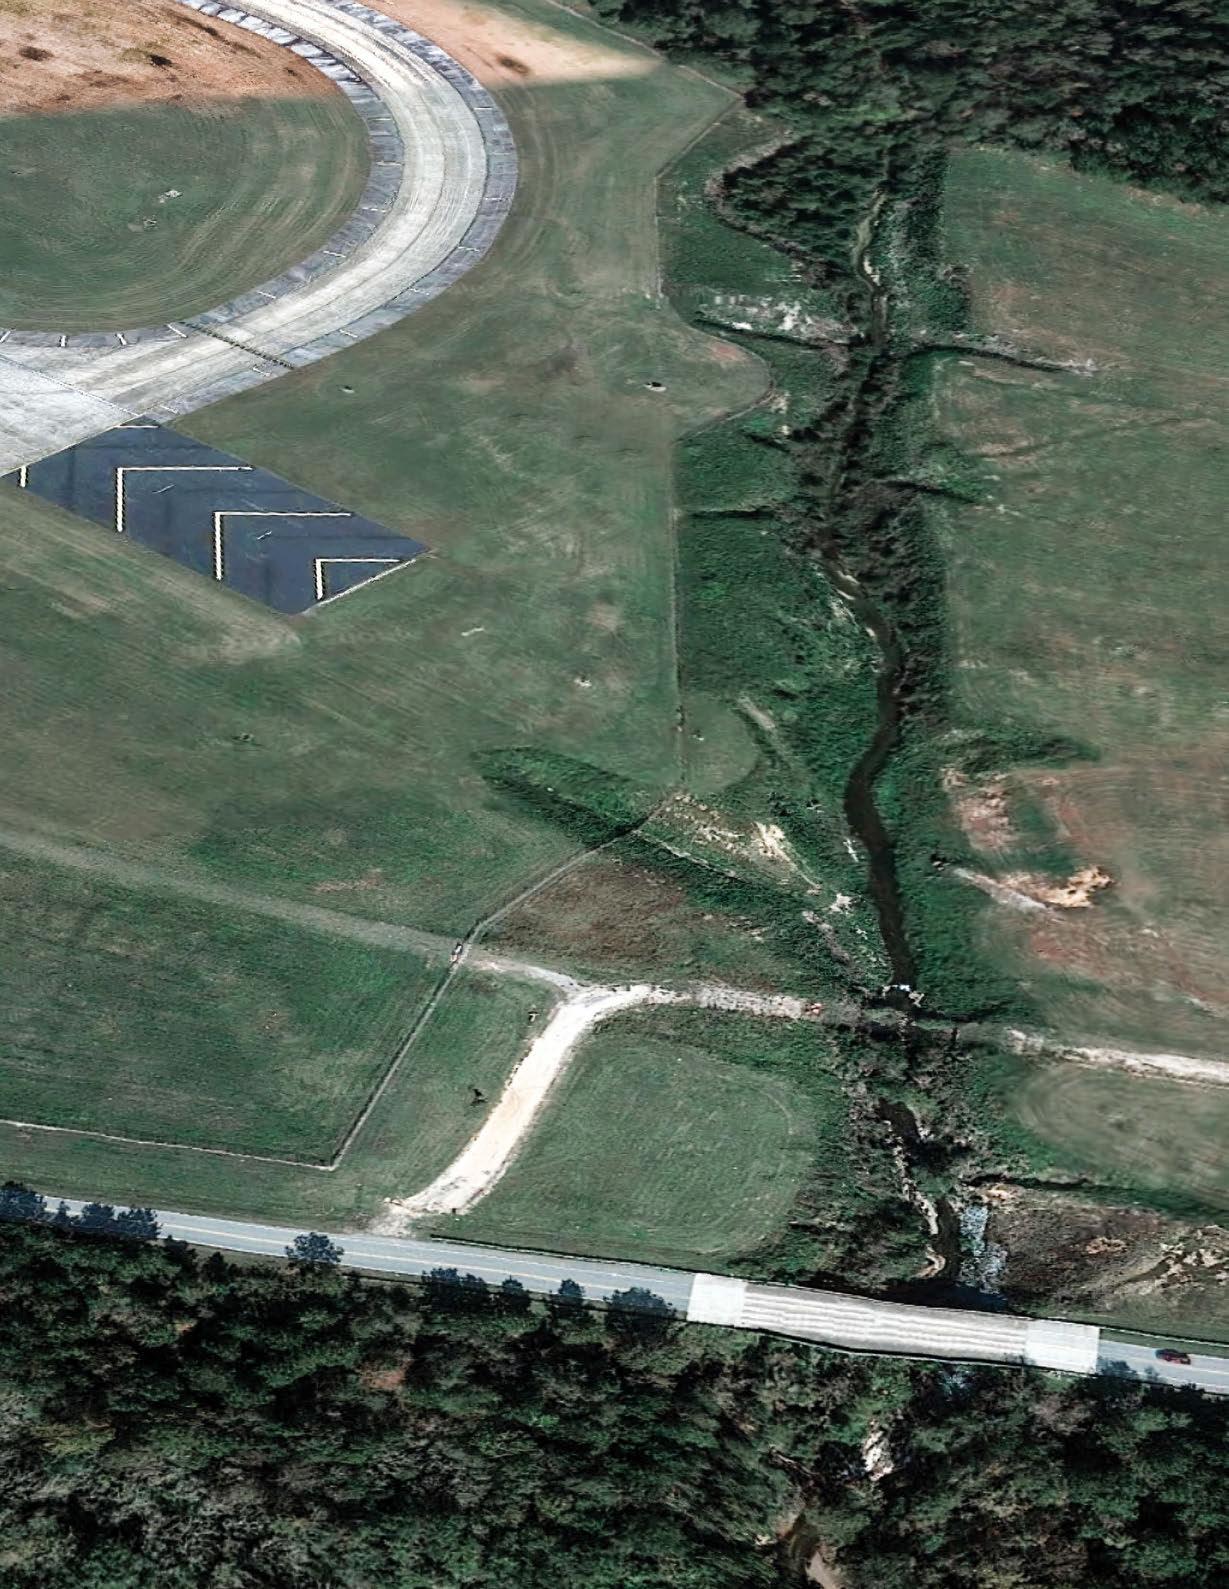 Carl Vinson Institute of Government Institute for Resilient Infrastructure Systems College of Engineering College of Environment + Design Warnell School of Forestry & Natural Resources
PAGE 66
09
APPENDICES
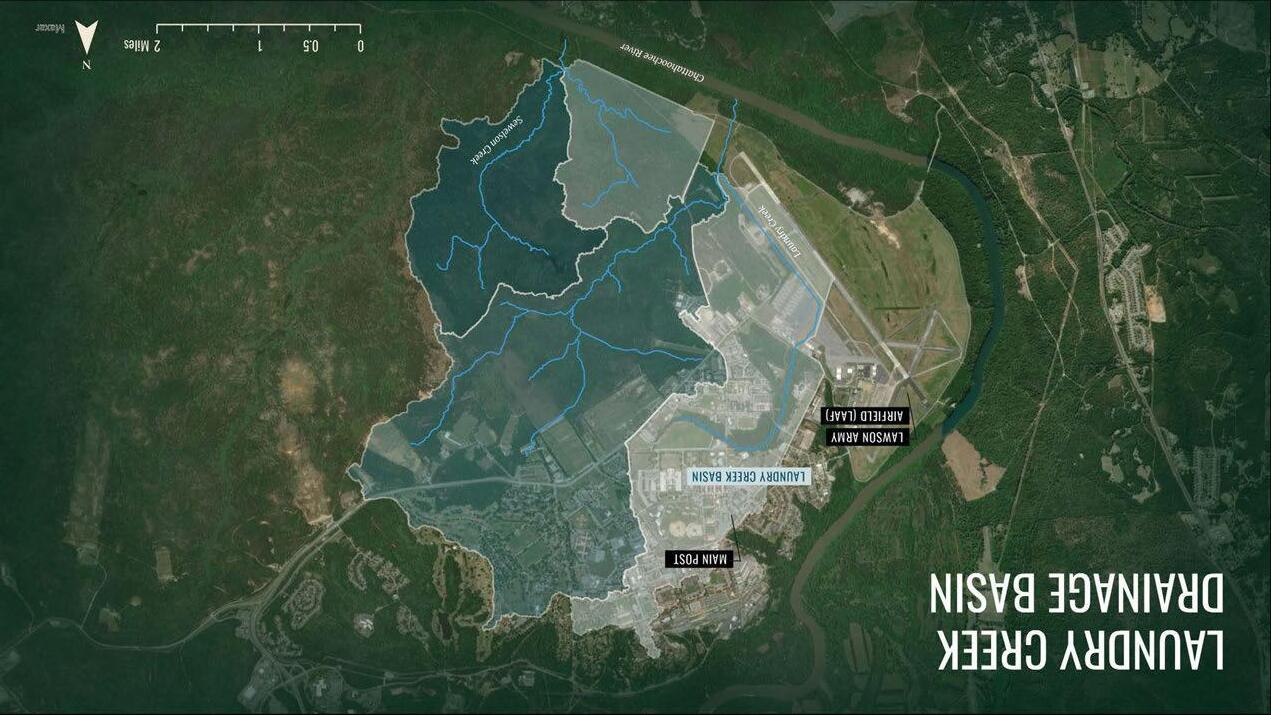
PAGE 67
APPENDIX A: MAPS AND EXHIBITS | LAUNDRY CREEK STREAM RESTORATION
The project watershed’s current delineation is an approximate total of 8.12 square miles (or just under 5,200 acres) broken up into four distinct subbasins. The total imperviousness is approximately 1.36 square miles (870 acres). This is all according to the 2021 NLCD data.
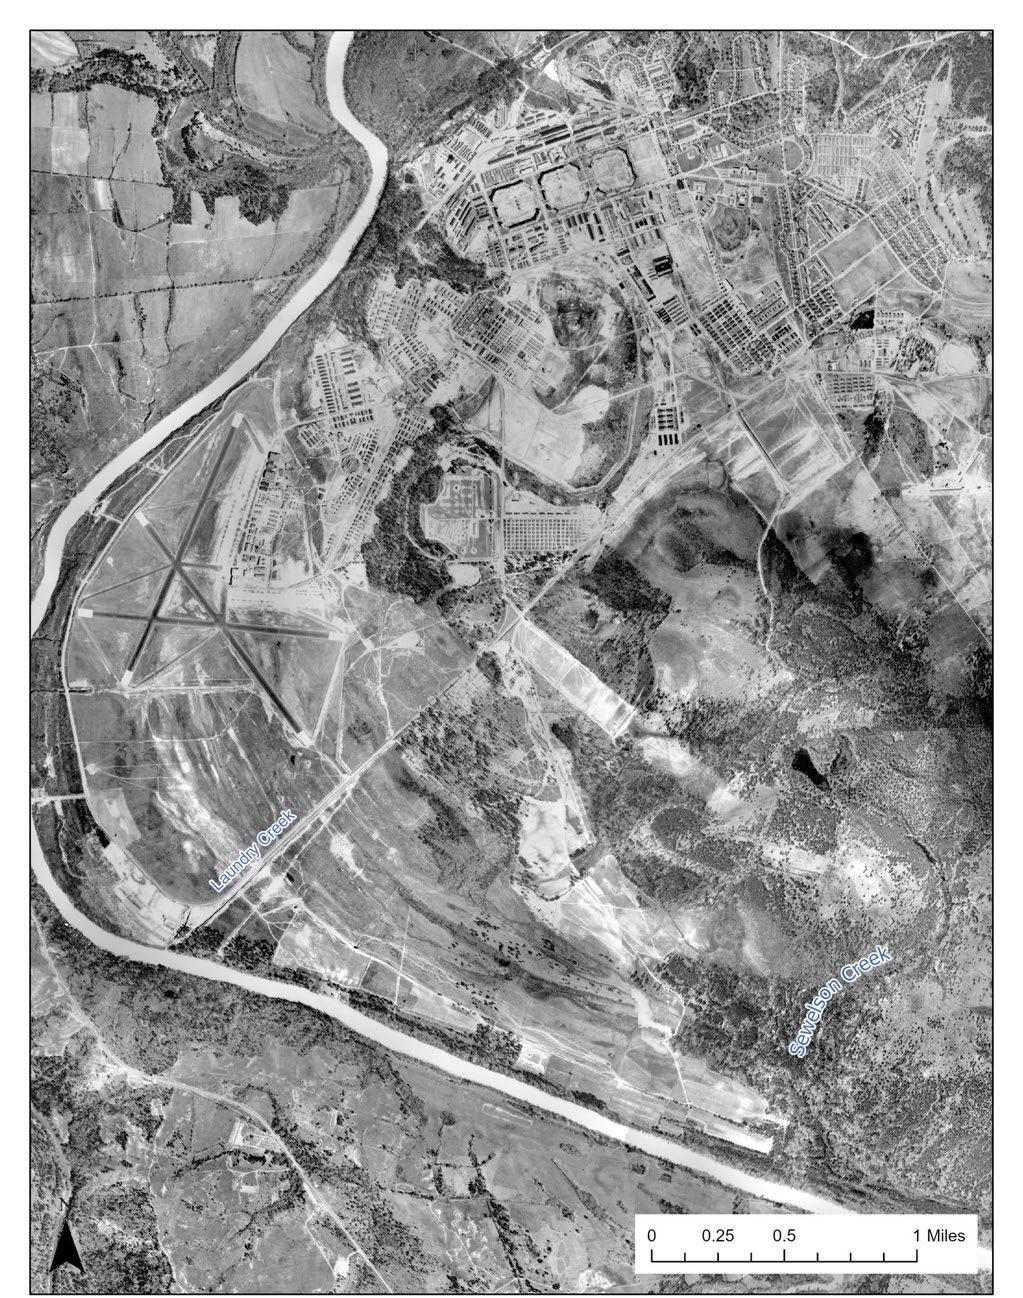
PAGE 68
Lawson Army Airfield in 1944 with Laundry Creek channelized in a different location than the current alignment.
APPENDIX A: MAPS AND EXHIBITS | LAUNDRY CREEK STREAM RESTORATION
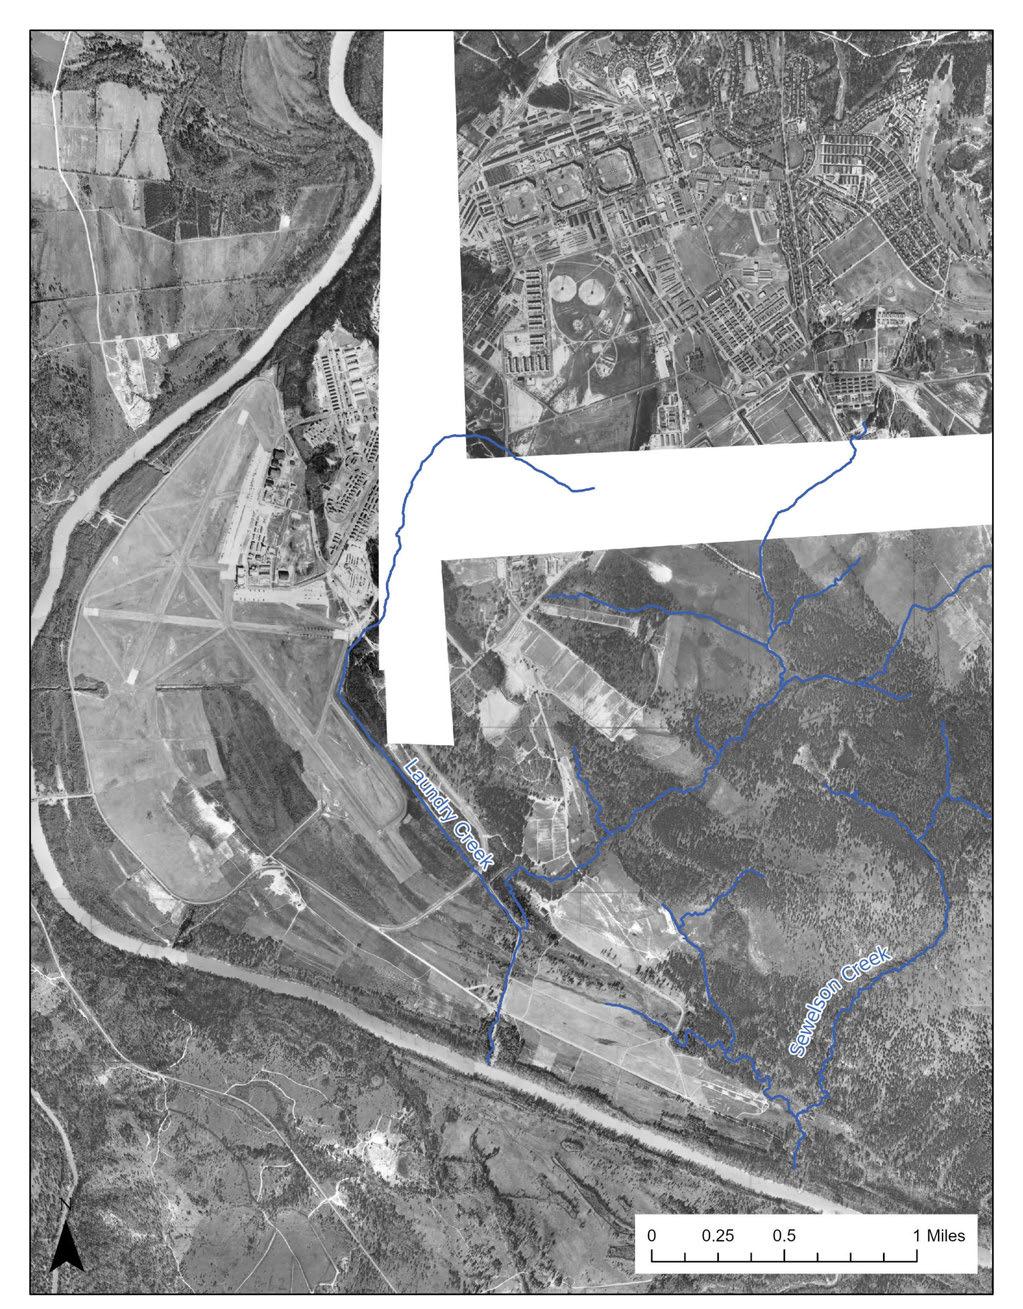
PAGE 69
Lawson Army Airfield in the late 1950’s with Laundry Creek channelized to its current alignment.
APPENDIX A: MAPS AND EXHIBITS | LAUNDRY
CREEK STREAM RESTORATION
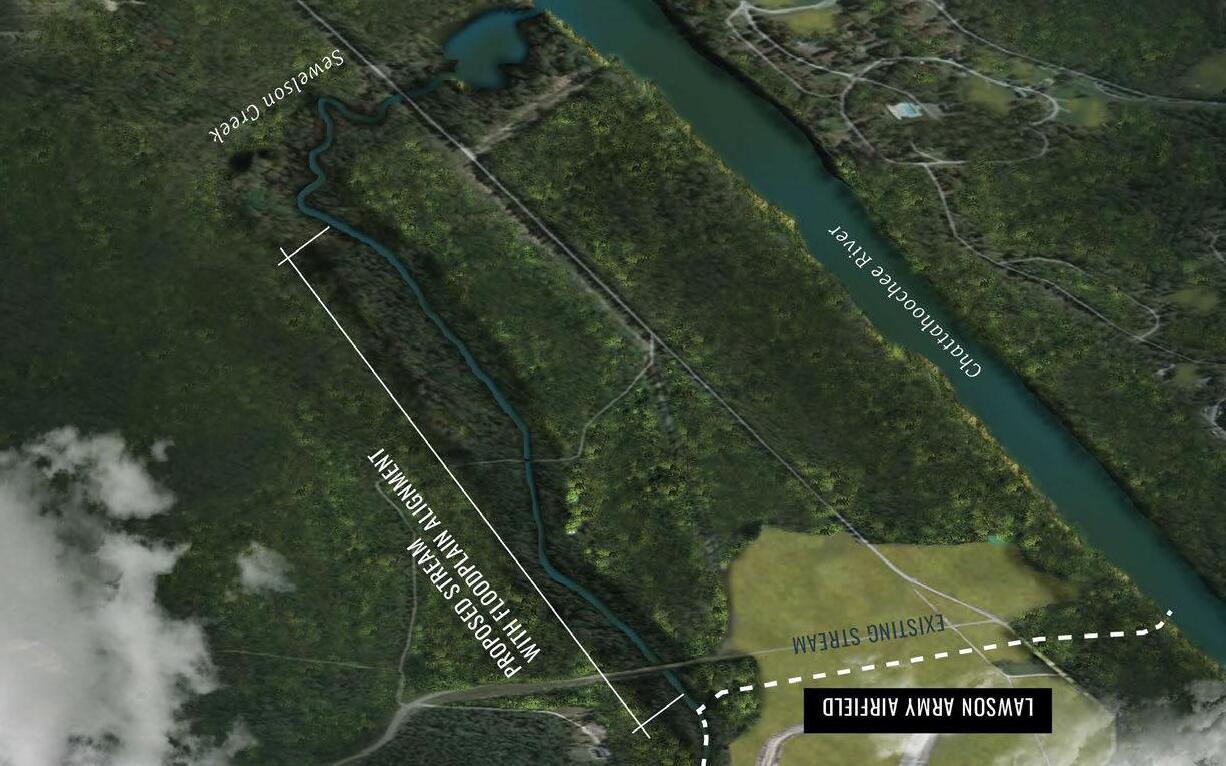
PAGE 70
APPENDIX B: RENDERINGS | LAUNDRY CREEK STREAM RESTORATION
Site Aerial visualizing the current stream location (dashed) and the proposed stream design. The proposed stream and floodplain will reconnect with Sewelson Creek, then drain to the Chattahoochee River.
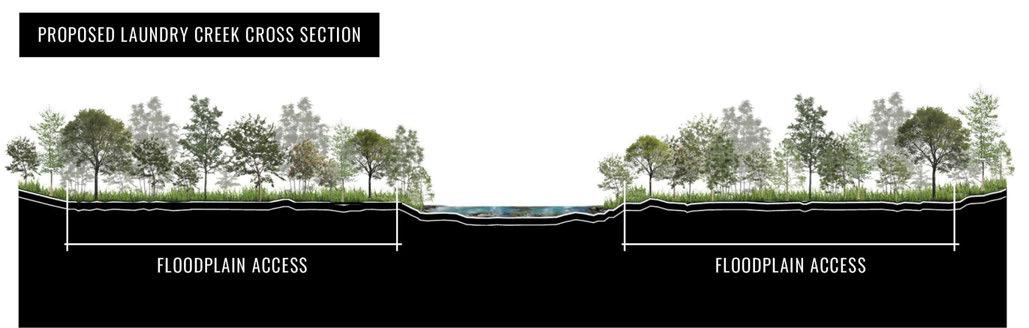
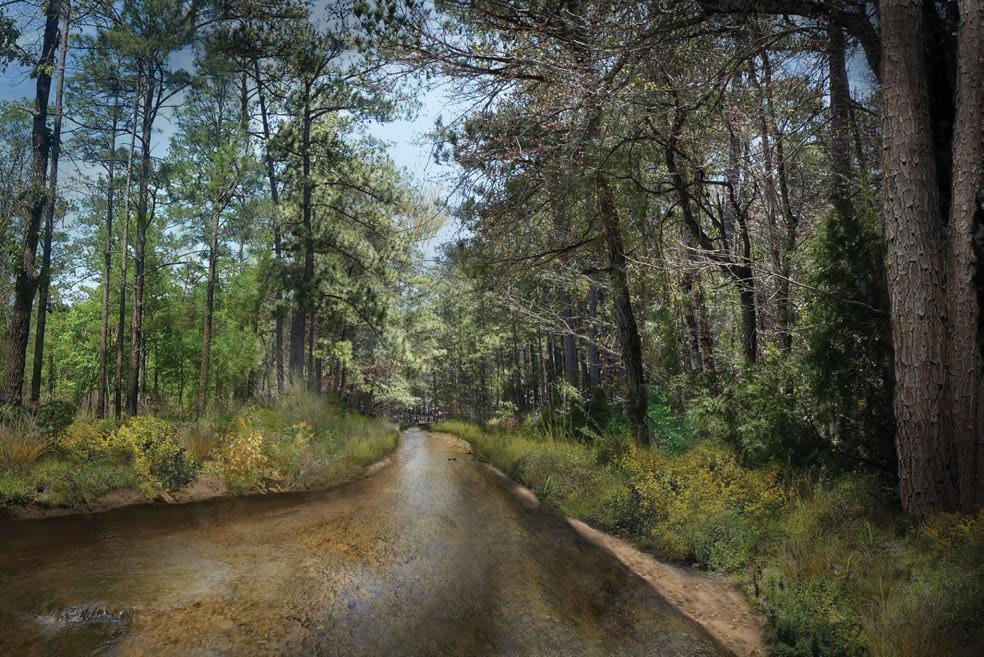
PAGE 71
Stream design cross section visualizing the new stream profile that increases floodplain access and reduces flood risk.
APPENDIX B: RENDERINGS | LAUNDRY CREEK STREAM RESTORATION
Stream design cross section visualizing the new stream profile that increases floodplain access and reduces flood risk.

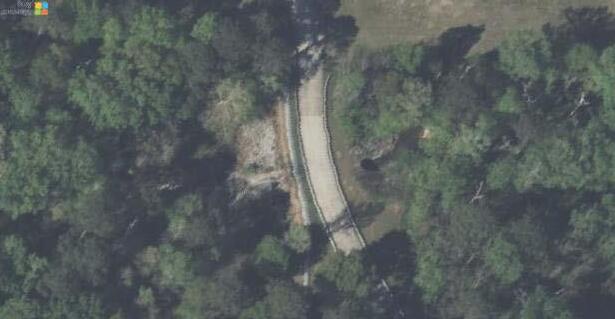
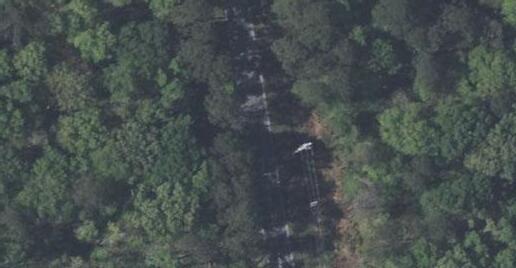
PAGE 72 © 2024 Microsoft Corporation © 2024 Maxar ©CNES (2024) Distribution Airbus DS 162"CONTECHMULTI-PLATESTEEL STRUCTURE110L.F.@1.25% INV:206.86 INV:205.48 ©2024MicrosoftCorporation©2024Maxar©CNES(2024)DistributionAirbusDS © 2024 Microsoft Corporation © 2024 Maxar ©CNES (2024) Distribution Airbus DS iris.uga.edu MARKDATEDESCRIPTION BY 3/22/2024 11:49:40 AM C:\USERS\JPM14762\ONEDRIVE UNIVERSITY OF GEORGIA\IRIS\LAUNDRY CREEK\CAD\MODEL FILES\LAUNDRY CREEK EXISTING CONDITIONS.DWG JOHN P MONTOYA 1 A B C D E F 2 3 4 5 6 7 Bar Measures 1 inch C100 LAUNDRY CREEK EXISTING CONDITIONS 1 W.MATTISON J. MONTOYA B. BLEDSOE Sheet HAZMAT ROAD 110 LF OF 162" CMP INV. OUT 205.48 INV. IN 206.86 MATCH LINE (TYP.) PROPOSED CREEK ALIGNMENT (TYP.) EX. DIRT ROAD TYPE B & D RIP-RAP TYPE B & D RIP-RAP EXISTING CREEK ALIGNMENT SIGHTSEEING ROAD APPROXIMATE LOCATION OF ABANDONED DIRT ROAD EX. DAMAGED CULVERT, UNKNOWN SIZE AND MATERIAL 220 220 210 220 220 210 210 220 220 210 210 220 210 220 220 220 220 218 218 218 220 220 214 214 214 218 214 218 214 NOT FOR CONSTRUCTION APPENDIX C: CONCEPTUAL (30%) DESIGN DRAWINGS | LAUNDRY CREEK STREAM RESTORATION

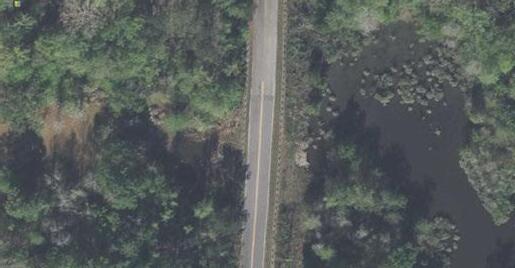
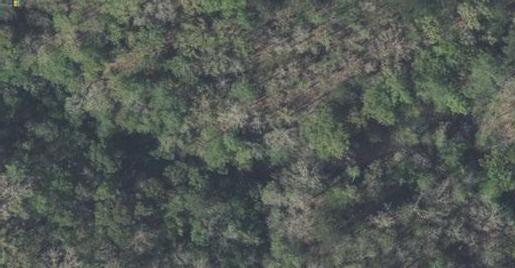

PAGE 73 2024 Microsoft Corporation 2024 Maxar ©CNES (2024) Distribution Airbus ©2024MicrosoftCorporation 2024Maxar©CNES(2024)DistributionAirbusDS 2024 Microsoft Corporation 2024 Maxar ©CNES (2024) Distribution Airbus 2024 Microsoft Corporation 2024 Maxar ©CNES (2024) Distribution Airbus iris.uga.edu MARKDATEDESCRIPTION BY 3/22/2024 11:49:52 AM C:\USERS\JPM14762\ONEDRIVEUNIVERSITY OF GEORGIA\IRIS\LAUNDRY CREEK\CAD\MODEL FILES\LAUNDRY CREEK EXISTING CONDITIONS.DWG JOHN P MONTOYA 1 A B C D E F 2 3 4 5 6 7 Bar Measures 1 inch C101 LAUNDRY CREEK EXISTING CONDITIONS 2 W.MATTISON J. MONTOYA B. BLEDSOE Sheet 90 LF OF 60" RCP SEWELSON CREEK 96 LF OF 84" RCP TIE-IN POINT TO REMNANT CHANNEL SUNSHINE ROAD CONFLUENCE WITH SEWELSON CREEK 220 210 200 200 210 210 200 200 210 220 210 200 220 220 210 200 190 200 210 210 200 200 210 190 190 190 200 200 190 200 200 200 190 NOT FOR CONSTRUCTION APPENDIX C: CONCEPTUAL (30%) DESIGN DRAWINGS | LAUNDRY CREEK STREAM RESTORATION
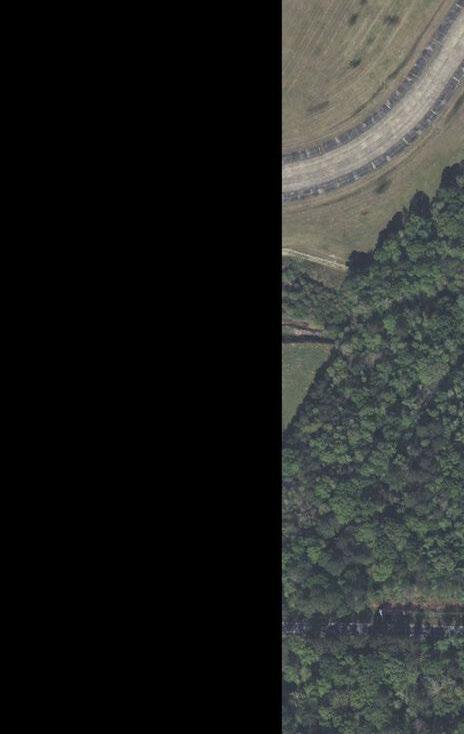
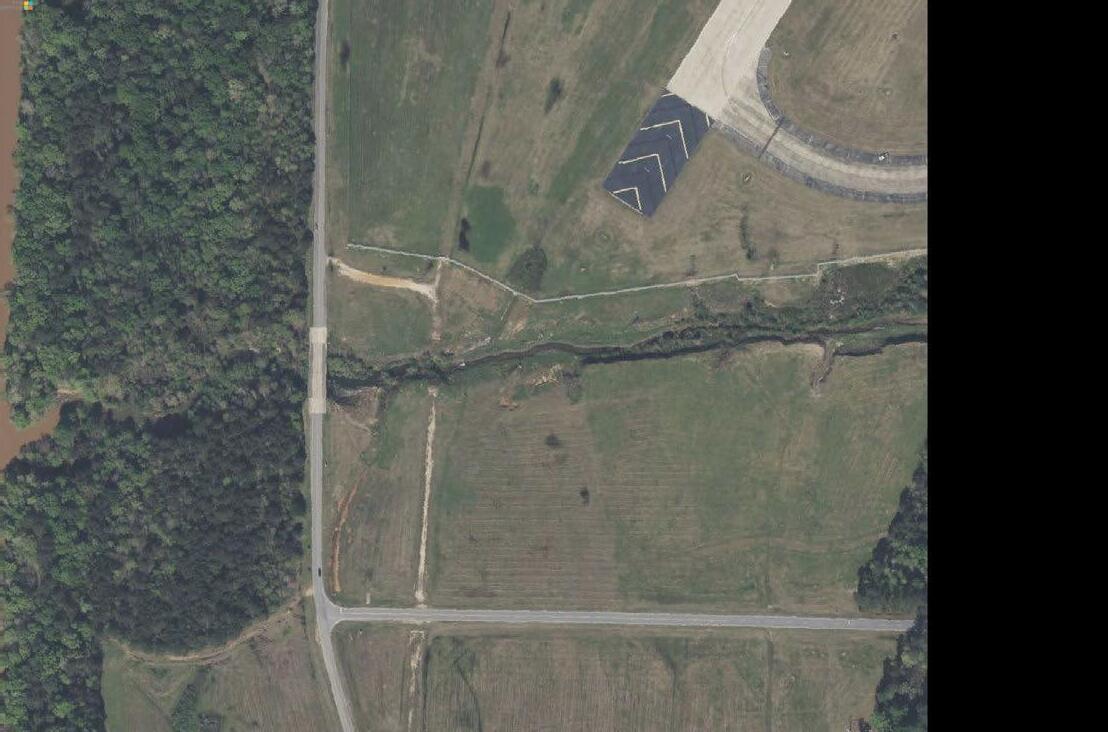
PAGE 74 2024 Microsoft Corporation 2024 Maxar ©CNES (2024) Distribution Airbus DS © 2024 Microsoft Corporation © 2024 Maxar ©CNES (2024) Distribution Airbus DS iris.uga.edu MARKDATEDESCRIPTION BY 3/22/2024 11:49:59 AM C:\USERS\JPM14762\ONEDRIVE UNIVERSITY OF GEORGIA\IRIS\LAUNDRY CREEK\CAD\MODEL FILES\LAUNDRY CREEK EXISTING CONDITIONS.DWG JOHN P MONTOYA 1 A B C D E F 2 3 4 5 6 7 Bar Measures 1 inch C102 LAUNDRY CREEK EXISTING CONDITIONS 3 W.MATTISON J. MONTOYA B. BLEDSOE Sheet EX. LAUNDRY CREEK ALIGNMENT INV. OUT: 205.02 EX. 48" RCP INV. OUT: 212.15 EX. UNKNOWN SIZE CMP INV. OUT: 212.15 EX. 42" RCP EDGE OF RUNWAY (TYP.) SUNSHINE ROAD SIGHTSEEING ROAD CHATTAHOOCHEE RIVER 220 220 220 220 220 210 200 210 220 220 220 210 200 210 220 220 220 220 210 PROPOSED ALIGNMENT 200 190 210 200 190 210 200 190 210 200 190 200 200 210 220 210 220 220 220 220 220 220 220 220 220 220 NOT FOR CONSTRUCTION APPENDIX C: CONCEPTUAL (30%) DESIGN DRAWINGS | LAUNDRY CREEK STREAM RESTORATION
PAGE 75 Elevation Elevation Station EXISTING CONDITIONS 160.00 170.00 180.00 190.00 200.00 210.00 220.00 230.00 240.00 250.00 160.00 170.00 180.00 190.00 200.00 210.00 220.00 230.00 240.00 250.00 -10+00.00-5+00.000+00.005+00.0010+00.0015+00.0020+00.0025+00.0030+00.0035+00.0040+00.0045+00.0050+00.0055+00.0060+00.0065+00.0070+00.0075+00.0080+00.0085+00.0090+00.0095+00.00100+00.00105+00.00110+00.00115+00.00120+00.00125+00.00130+00.00135+00.00140+00.00145+00.00 iris.uga.edu MARKDATEDESCRIPTION BY 3/22/2024 11:50:07 AM C:\USERS\JPM14762\ONEDRIVEUNIVERSITY OF GEORGIA\IRIS\LAUNDRY CREEK\CAD\MODEL FILES\LAUNDRY CREEK EXISTING CONDITIONS.DWG JOHN P MONTOYA 1 A B C D E F 2 3 4 5 6 7 Bar Measures 1 inch C103 LAUNDRY CREEK EXISTING CONDITIONS LONGITUDINAL PROFILE W.MATTISON J. MONTOYA B. BLEDSOE Sheet HAZMAT AREA HAZMAT ROAD AND 110 L.F. OF 162" METAL CULVERT STRUCTURE PROPOSED ALIGNMENT DIVERGES FROM EXISTING EXISTING DIRT ROAD AND DILAPIDATED CULVERT OF UNKNOWN SIZE AND MATERIAL TIE-IN POINT TO REMNANT CHANNEL BEGINNING OF STREAM RESTORATION CONFLUENCE WITH SEWELSON CREEK SUNSHINE ROAD AND DOUBLE CULVERT: 96 L.F. OF 84" RCP 90 L.F. OF 60" RCP END OF STREAM RESTORATION SIGHTSEEING ROAD HORIZONTAL SCALE: VERTICAL EXAGGERATION: 1:40 NOT FOR CONSTRUCTION APPENDIX C: CONCEPTUAL (30%) DESIGN DRAWINGS | LAUNDRY CREEK STREAM RESTORATION
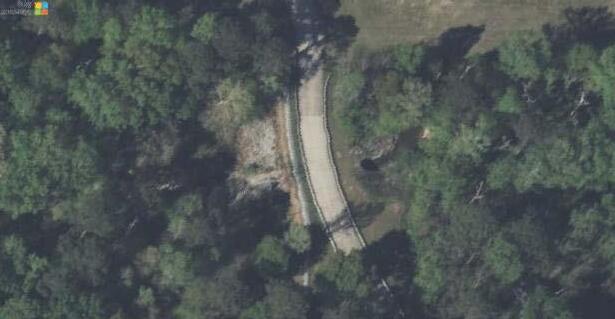
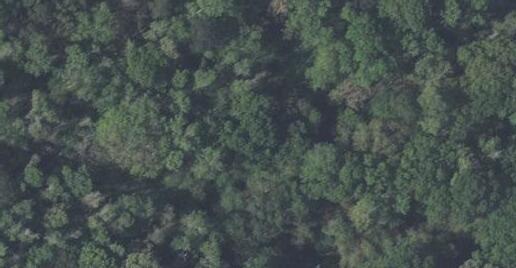
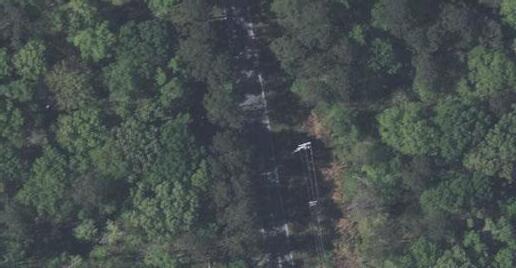
PAGE 76 © 2024 Microsoft Corporation © 2024 Maxar ©CNES (2024) Distribution Airbus DS 162"CONTECHMULTI-PLATESTEEL STRUCTURE110L.F.@1.25% INV:206.86 INV:205.48 2024 Microsoft Corporation 2024 Maxar ©CNES (2024) Distribution Airbus iris.uga.edu MARKDATEDESCRIPTION BY 3/22/2024 11:51:56 AM C:\USERS\JPM14762\ONEDRIVE UNIVERSITY OF GEORGIA\IRIS\LAUNDRY CREEK\CAD\MODEL FILES\LAUNDRY CREEK PROPOSED CONDITIONS.DWGJOHN P MONTOYA 1 A B C D E F 2 3 4 5 6 7 Bar Measures 1 inch C104 LAUNDRY CREEK PROPOSED CONDITIONS 1 W.MATTISON J. MONTOYA B. BLEDSOE Sheet HAZMAT ROAD 110 LF OF 162" CMP INV. OUT 205.48 INV. IN 206.86 PROPOSED CREEK ALIGNMENT (TYP.) EX. DIRT ROAD TYPE B & D RIP-RAP TYPE B & D RIP-RAP EXISTING CREEK ALIGNMENT SIGHTSEEING ROAD 220 220 210 220 220 210 210 220 220 210 210 220 205 210 220 220 205 205 90 LF OF 60" RCP TO BE REMOVED SEWELSON CREEK 96 LF OF 84" RCP TO BE REMOVED SUNSHINE ROAD 192 190 192 200 200 190 200 200 200 192 PROPOSED MULTI-OBJECTIVE CULVERT WIDTH: 32' RISE: 10' LENGTH: 100' PROPOSED MULTI-OBJECTIVE CULVERT WIDTH: 23' RISE: 10' LENGTH: 96' NOT FOR CONSTRUCTION 205 205 205 LOW FLOW CHANNEL EDGE OF FLOODPLAIN APPENDIX C: CONCEPTUAL (30%) DESIGN DRAWINGS | LAUNDRY CREEK STREAM RESTORATION
PAGE 77 Elevation Elevation Station PROPOSED CONDITIONS 160.00 170.00 180.00 190.00 200.00 210.00 220.00 230.00 240.00 250.00 160.00 170.00 180.00 190.00 200.00 210.00 220.00 230.00 240.00 250.00 -10+00.00-5+00.000+00.005+00.0010+00.0015+00.0020+00.0025+00.0030+00.0035+00.0040+00.0045+00.0050+00.0055+00.0060+00.0065+00.0070+00.0075+00.0080+00.0085+00.0090+00.0095+00.00100+00.00105+00.00110+00.00115+00.00120+00.00125+00.00130+00.00135+00.00140+00.00145+00.00 iris.uga.edu MARKDATEDESCRIPTION BY 3/22/2024 11:52:19 AM C:\USERS\JPM14762\ONEDRIVEUNIVERSITY OF GEORGIA\IRIS\LAUNDRY CREEK\CAD\MODEL FILES\LAUNDRY CREEK PROPOSED CONDITIONS.DWGJOHN P MONTOYA 1 A B C D E F 2 3 4 5 6 7 Bar Measures 1 inch C105 LAUNDRY CREEK PROPOSED CONDITIONS LONGITUDINAL PROFILE W.MATTISON J. MONTOYA B. BLEDSOE Sheet HAZMAT AREA HAZMAT ROAD AND 110 L.F. OF 162" METAL CULVERT STRUCTURE TIE-IN POINT TO REMNANT CHANNEL BEGINNING OF STREAM RESTORATION CONFLUENCE WITH SEWELSON CREEK SUNSHINE ROAD AND PROPOSED MULTI-OBJECTIVE CULVERT WIDTH: 23' RISE: 10' LENGTH: 96' END OF STREAM RESTORATION SIGHTSEEING ROAD AND PROPOSED MULTI-OBJECTIVE CULVERT WIDTH: 32' RISE: 10' LENGTH: 100' HORIZONTAL SCALE: VERTICAL EXAGGERATION: 1:40 FINISHED GRADE EXISTING GRADE NOT FOR CONSTRUCTION APPENDIX C: CONCEPTUAL (30%) DESIGN DRAWINGS | LAUNDRY CREEK STREAM RESTORATION
FLOODPLAIN TW = 256.5'
BANKFULL TW = 58.3'
Z = 2
FLOODPLAIN DEPTH = 3.5'
BANKFULL BW =47'
Z = 4
BF DEPTH=3.83'
LOW FLOW CHANNEL Tw =28.0'
Bw =24.0'
Depth = 1.0'
Z = 2
FLOODPLAIN TW = 256.5'
BANKFULL TW = 58.3'
FLOODPLAIN DEPTH = 3.5'
FLOODPLAIN DEPTH = 3.5'
MEANDER BEND RIGHT POOL
BANKFULL BW =47'
FLOODPLAIN TW = 256.5'
BANKFULL TW = 58.3'
MEANDER BEND LEFT POOL
BANKFULL BW =47'
PAGE 78
iris.uga.edu MARKDATEDESCRIPTION BY 3/22/2024 11:52:44 AM C:\USERS\JPM14762\ONEDRIVE UNIVERSITY OF GEORGIA\IRIS\LAUNDRY CREEK\CAD\MODEL FILES\LAUNDRY CREEK PROPOSED CONDITIONS.DWGJOHN P MONTOYA 1 A B C D E F 2 3 4 5 6 7 Bar Measures 1 inch C106 LAUNDRY CREEK CHANNEL CROSS SECTIONS W.MATTISON J. MONTOYA B. BLEDSOE Sheet NOT FOR CONSTRUCTION APPENDIX C: CONCEPTUAL (30%) DESIGN DRAWINGS | LAUNDRY CREEK STREAM RESTORATION
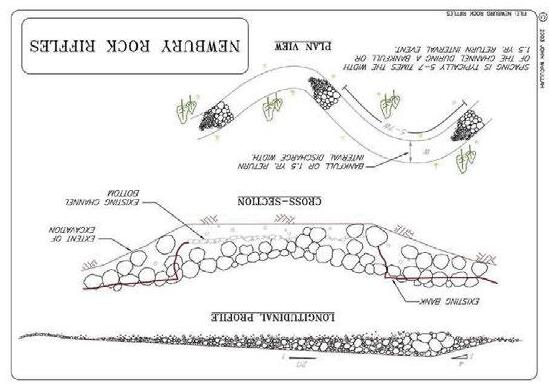
PAGE 79 iris.uga.edu MARKDATEDESCRIPTION BY 3/22/2024 11:53:09 AM C:\USERS\JPM14762\ONEDRIVEUNIVERSITY OF GEORGIA\IRIS\LAUNDRY CREEK\CAD\MODEL FILES\LAUNDRY CREEK PROPOSED CONDITIONS.DWGJOHN P MONTOYA 1 A B C D E F 2 3 4 5 7 Bar Measures 1 inch C107 LAUNDRY CREEK STREAM RESTORATION DETAILS W.MATTISON J. MONTOYA B. BLEDSOE Sheet NOT FOR CONSTRUCTION APPENDIX C: CONCEPTUAL (30%) DESIGN DRAWINGS | LAUNDRY CREEK STREAM RESTORATION
PAGE 80 Precipitation Data I-24hr, 50yr (in) NOAA Atlas 14 8.18 Basin Info Subbasin FID 5 Q (cfs) Subbasin FID 6 Q (cfs) Subbasin FID 9 Q (cfs) Subbasin FID 10 Q (cfs) Swain et al. 2020 9.816 Drainage Area (mi2) 2.21 3.72 0.82 1.37 Percent Impervious (%) 39.64 12.98 0.35 0 Existing Conditions Return Interval (yr) Subbasin FID 5 Q (cfs) Subbasin FID 6 Q (cfs) Subbasin FID 9 Q (cfs) Subbasin FID 10 Q (cfs) Laundry Creek Q (cfs) Existing Ditch Q (cfs) Total Downstream Sum (Sunshine Road Culvert) 2 537.6067387 252.8462503 62.56939742 83.56035176 537.6067387 790.4529889 936.5827381 5 658.9143264 417.1761936 117.8054349 158.342737 658.9143264 1076.09052 1352.238692 10 734.9450698 540.4676957 162.5199188 219.383918 734.9450698 1275.412765 1657.316602 25 816.7879323 706.9112965 227.0922872 308.1874066 816.7879323 1523.699229 2058.978923 50 867.7011662 835.4930724 280.1313459 381.5487203 867.7011662 1703.194239 2364.874305 100 916.9709651 970.2657571 337.6219112 461.4263763 916.9709651 1887.236722 2686.28501 200 962.6776156 1112.763577 400.440684 549.2216498 962.6776156 2075.441192 3025.103526 500 1008.725417 1298.296529 486.4517996 670.1649473 1008.725417 2307.021946 3463.638693 Future Conditions Return Interval (yr) Subbasin FID 5 Q (cfs) Subbasin FID 6 Q (cfs) Subbasin FID 9 Q (cfs) Subbasin FID 10 Q (cfs) Laundry Creek Q (cfs) Existing Ditch Q (cfs) Total Downstream Sum (Sunshine Road Culvert) 2 652.7076514 306.9803079 75.9654251 101.4505158 652.7076514 959.6879593 1137.1039 5 833.2047751 527.5241145 148.9663329 200.2262195 833.2047751 1360.72889 1709.921442 10 944.5228761 694.5881037 208.8642913 281.9436958 944.5228761 1639.11098 2129.918967 25 1066.444141 922.983042 296.5044286 402.3867654 1066.444141 1989.427183 2688.318377 50 1145.795154 1103.264523 369.9120747 503.8332225 1145.795154 2249.059677 3122.804975 100 1221.852508 1292.867161 449.8770348 614.8449584 1221.852508 2514.719668 3579.441661 200 1293.918355 1495.646303 538.2254067 738.1993329 1293.918355 2789.564658 4065.989397 500 1370.186751 1763.521245 660.7643664 910.3083124 1370.186751 3133.707997 4704.780676 APPENDIX D: DESIGN CALCULATIONS | LAUNDRY CREEK STREAM RESTORATION
PAGE 81 Flooplain Top Width 256.5 Floodplain Bottom Width (ft) 228.5 Floodplain Channel Depth (ft) 3.5 Floodplain Terrace Width (ft) 85.75 Bankfull Channel Top Width (ft) 57 Bankfull Channel Bottom Width (ft) 43 Bankfull Channel Depth (ft) 3.5 Slope (same for Channel and Floodplain) 0.0008 Manning's Q Qtotal (cfs) 2655.555 Qmainchannel (cfs) 1679.56 Qfloodplain (cfs) 487.9974 Main Channel Manning's Parameters Area (ft2) 374.5 Channel V (ft/s) Wetted Perimeter (ft) 65.65248 4.472767846 Hydraulic Radius 5.704278 Manning's n 0.03 Floodplain Manning's Parameters Area (ft2) 324.625 Floodplain V (ft/s) Wetted Perimeter (ft) 103.6809 1.499229457 Hydraulic Radius 3.131002 Manning's n 0.06 Divided Channel Method APPENDIX D: DESIGN CALCULATIONS | LAUNDRY CREEK STREAM RESTORATION
Meander Geometry - Sine Generated Wave
Sv = 0.001301811
S = 0.0008
Width bf = 17.37 m
P = 1.627263581
Rc = 44.00764726 m
Langbein and Leopold (1966) approximation
omega = 77.60792953 degreesLangbein and Leopold (1966) approximation
z = 177.5978041 m
lambda = 218.2778576 m
Rc = 53.01294686 m
omega = 1.310623237 radians
Yalin (2001)
Yalin (2001)
Yalin (2001) approximation - must vary omega to solve
Yalin (2001) approximation - must vary omega to make these two cells match
omega = 75.09317999 degrees 1.6272641.627265
amplitude = 120.6948008 m
amplitude = 121.8010459 m
H&W diff = 1.37E-12
From path below based on Yalin
0.043.84023263513.677965961.279059
0.054.93127101917.058206671.258583
0.066.10795053420.409597031.23314
0.077.3856535523.723788791.202831
0.088.7787322926.991161381.167774
0.0910.3002827930.200721491.128109
0.111.9619045733.340053431.083991
0.1113.7734511136.395326121.035596
0.1215.7427781639.351361130.983113
0.1317.8754991242.191764850.926751
0.1420.1747581544.899125170.866731
0.1522.6410328547.455270930.80329
0.1625.2719789149.841589190.73668
0.1728.0623287352.039392620.667162
0.1831.0038549254.030325980.59501
0.1934.0854078255.796798090.520511
0.237.2930330357.322423390.443958
0.2140.6101719658.59245540.365652
0.2244.0179442359.5941940.285904
0.2347.4955065860.317348270.205027
0.2451.0204791460.754338510.123341
0.2554.5694257660.900522970.041168
0.2658.1183723860.75433851 -0.04117
0.2761.6433449460.31734827 -0.12334
0.2865.1209072959.594194 -0.20503
0.2968.5286795658.5924554 -0.2859
0.371.8458184957.32242339 -0.36565
0.3175.053443755.79679809 -0.44396
PAGE 82
Increment 3.551956083 m l/L x (m) y (m) omega (radians) 0 0 0 1.310623 0.010.915952563.4318250131.309977 0.021.849634926.8588688211.304807
0.032.8186318210.276095331.294487
APPENDIX D: DESIGN CALCULATIONS | LAUNDRY CREEK STREAM RESTORATION
Cartesian Coordinates
0.57116.5245051 -23.72378879-1.20283
0.58117.9175838 -26.99116138-1.16777
0.59119.4391343 -30.20072149-1.12811
0.6121.1007561 -33.34005343-1.08399
0.61122.9123026 -36.39532612-1.0356
0.62124.8816297 -39.35136113-0.98311
0.63127.0143506 -42.19176485-0.92675
0.64129.3136097 -44.89912517-0.86673
0.65131.7798844 -47.45527093-0.80329
0.66134.4108304 -49.84158919-0.73668
0.67137.2011802 -52.03939262-0.66716
0.68140.1427064 -54.03032598-0.59501
0.69143.2242593 -55.79679809-0.52051
0.7146.4318846 -57.32242339-0.44396
0.71149.7490235 -58.5924554-0.36565
0.72153.1567958 -59.594194-0.2859
0.73156.6343581 -60.31734827-0.20503
0.74160.1593307 -60.75433851-0.12334
0.75163.7082773 -60.90052297-0.04117
0.76167.2572239 -60.75433851 0.041168
0.77170.7821965 -60.31734827 0.123341
0.78174.2597588 -59.594194 0.205027
1.08227.056435326.991161381.167774
1.09228.577985830.200721491.128109
1.1230.239607633.340053431.083991
1.11232.051154236.395326121.035596
1.12234.020481239.351361130.983113
1.13236.153202242.191764850.926751
1.14238.452461244.899125170.866731
PAGE 83 0.3278.134996654.03032598 -0.52051 0.3381.076522852.03939262 -0.59501 0.3483.8668726149.84158919 -0.66716 0.3586.4978186747.45527093 -0.73668 0.3688.9640933744.89912517 -0.80329 0.3791.263352442.19176485 -0.86673 0.3893.3960733639.35136113 -0.92675 0.3995.3654004136.39532612 -0.98311 0.497.1769469533.34005343 -1.0356 0.4198.8385687330.20072149 -1.08399 0.42100.360119226.99116138 -1.12811
-1.16777
-1.20283
-1.23314
-1.25858
-1.27906
-1.29449 0.49108.2228993.431825013 -1.30481
-3.431825013-1.30998
-6.858868821-1.30481
-10.27609533-1.29449
-13.67796596-1.27906
0.43101.75319823.72378879
0.44103.03090120.40959703
0.45104.207580517.05820667
0.46105.298618913.67796596
0.47106.320219710.27609533
0.48107.28921666.858868821
0.5109.1388515 -2.79776E-14-1.30998 0.51110.0548041
0.52110.9884864
0.53111.9574833
0.54112.9790842
0.55114.0701225 -17.05820667-1.25858
0.56115.2468021 -20.40959703-1.23314
0.79177.6675311 -58.5924554 0.285904 0.8180.98467 -57.32242339 0.365652 0.81184.1922952 -55.79679809 0.443958 0.82187.2738481 -54.03032598 0.520511 0.83190.2153743 -52.03939262 0.59501 APPENDIX D: DESIGN CALCULATIONS | LAUNDRY CREEK STREAM RESTORATION 0.84193.0057241 -49.84158919 0.667162 0.85195.6366702 -47.45527093 0.73668 0.86198.1029449 -44.89912517 0.80329 0.87200.4022039 -42.19176485 0.866731 0.88202.5349249 -39.35136113 0.926751 0.89204.5042519 -36.39532612 0.983113 0.9206.3157985 -33.34005343 1.035596 0.91207.9774203 -30.20072149 1.083991 0.92209.4989708 -26.99116138 1.128109 0.93210.8920495 -23.72378879 1.167774 0.94212.1697525 -20.40959703 1.202831 0.95213.346432 -17.05820667 1.23314 0.96214.4374704 -13.67796596 1.258583 0.97215.4590712 -10.27609533 1.279059 0.98216.4280681 -6.858868821 1.294487 0.99217.3617505 -3.431825013 1.304807 1 218.2777032.78444E-131.309977 1.01219.19365563.4318250131.309977 1.02220.1273386.8588688211.304807 1.03221.096334910.276095331.294487
1.04222.117935713.677965961.279059 1.05223.208974117.058206671.258583 1.06224.385653620.409597031.23314 1.07225.663356623.723788791.202831
1.15240.918735947.455270930.80329 1.16243.54968249.841589190.73668 1.17246.340031852.039392620.667162 1.18249.28155854.030325980.59501 1.19252.363110955.796798090.520511 1.2255.570736157.322423390.443958 1.21258.88787558.59245540.365652 1.22262.295647359.5941940.285904 1.23265.773209660.317348270.205027 1.24269.298182260.754338510.123341 1.25272.847128860.900522970.041168 1.26276.396075460.75433851 -0.04117 1.27279.92104860.31734827 -0.12334 1.28283.398610359.594194 -0.20503 1.29286.806382658.5924554 -0.2859 1.3290.123521557.32242339 -0.36565 1.31293.331146755.79679809 -0.44396 1.32296.412699654.03032598 -0.52051 1.33299.354225852.03939262 -0.59501 1.34302.144575749.84158919 -0.66716 1.35304.775521747.45527093 -0.73668
1.36307.241796444.89912517 -0.80329
1.37309.541055442.19176485 -0.86673
1.38311.673776439.35136113 -0.92675
1.39313.643103536.39532612 -0.98311
1.4315.4546533.34005343 -1.0356
1.41317.116271830.20072149 -1.08399
1.42318.637822326.99116138 -1.12811
1.43320.03090123.72378879 -1.16777
1.44321.30860420.40959703 -1.20283
1.45322.485283517.05820667 -1.23314
1.46323.576321913.67796596 -1.25858
1.47324.597922710.27609533 -1.27906
1.48325.56691966.858868821 -1.29449
1.49326.5006023.431825013 -1.30481
1.5327.4165546 -2.95763E-13-1.30998
1.51328.3325071 -3.431825013-1.30998
1.52329.2661895 -6.858868821-1.30481
1.53330.2351864 -10.27609533-1.29449
1.54331.2567872 -13.67796596-1.27906
1.55332.3478256 -17.05820667-1.25858
1.56333.5245051 -20.40959703-1.23314
1.57334.8022081 -23.72378879-1.20283
1.58336.1952869 -26.99116138-1.16777
1.59337.7168374 -30.20072149-1.12811
1.6339.3784591 -33.34005343-1.08399
1.61341.1900057 -36.39532612-1.0356
1.62343.1593327 -39.35136113-0.98311
1.63345.2920537 -42.19176485-0.92675
1.64347.5913127 -44.89912517-0.86673
1.65350.0575874 -47.45527093-0.80329
1.66352.6885335 -49.84158919-0.73668
1.67355.4788833 -52.03939262-0.66716
1.68358.4204095 -54.03032598-0.59501
1.69361.5019624 -55.79679809-0.52051
1.7364.7095876 -57.32242339-0.44396
1.71368.0267265 -58.5924554-0.36565
1.72371.4344988 -59.594194-0.2859
1.73374.9120611
PAGE 84
-60.31734827-0.20503 1.74378.4370337 -60.75433851-0.12334 1.75381.9859803 -60.90052297-0.04117 1.76385.5349269 -60.75433851 0.041168 1.77389.0598995 -60.31734827 0.123341 1.78392.5374619 -59.594194 0.205027 1.79395.9452341 -58.5924554 0.285904 1.8399.2623731 -57.32242339 0.365652 1.81402.4699983 -55.79679809 0.443958 1.82405.5515512 -54.03032598 0.520511 1.83408.4930774 -52.03939262 0.59501 1.84411.2834272 -49.84158919 0.667162 1.85413.9143732 -47.45527093 0.73668 1.86416.3806479 -44.89912517 0.80329 1.87418.679907 -42.19176485 0.866731 1.88420.8126279 -39.35136113 0.926751 1.89422.781955 -36.39532612 0.983113 1.9424.5935015 -33.34005343 1.035596 1.91426.2551233 -30.20072149 1.083991 1.92427.7766738 -26.99116138 1.128109 1.93429.1697525 -23.72378879 1.167774 1.94430.4474556 -20.40959703 1.202831 1.95431.6241351 -17.05820667 1.23314 1.96432.7151735 -13.67796596 1.258583 1.97433.7367743 -10.27609533 1.279059 1.98434.7057712 -6.858868821 1.294487 1.99435.6394535 -3.431825013 1.304807 2 436.55540615.49338E-131.309977 APPENDIX D: DESIGN CALCULATIONS | LAUNDRY CREEK STREAM RESTORATION
Cycle hauling(wait, load, travel, unload or dump & return) time per cycle, excavated or borrow, loose cubic yards, 20 min load/wait/unload, 20 C.Y. truck, cycle 30 miles, 45 MPH, excludes loading equipment
PAGE 85
Material Labor Equipment Total* Base Total - $ 4,204,863.59 $ 6,207,875.27 $ $ 10,412,738.86 Total O&P - $ 6,267,470.13 $ 6,832,808.88 $ $ 22,270,495.24
Total Cost (including contingency, ESCP, planting, etc.) 30,065,168.57 $ QuantityLineNumberLine Source SubContracted Ind. Description Unit Total O&P Ext. Total O&P Labor Type Notes 240.00 Demolish, remove pavement & curb, remove bituminous pavement, 4" to 6" thick, excludes hauling and disposal fees S.Y. 11.55 $ 2,772.00 $ STD 240.00 Saw cut asphalt up to 3" deep S.Y. 2.31 $ 554.40 $ 236.00 Remove concrete pipe, 60"-84", diameter, excludes excavation L.F. 63.80 $ 15,056.80 $ STD 294.00 Selective demolition, rip-rap & rock lining, slope protection broken stone S.Y. 117.00 $ 34,398.00 $ STD 35.67 Clear and Grubbing, heavy trees and brush, up to 24" diameterAcre 19,375.00 $ 691,201.79 $ 34.25 Rough grading sites, open, 75,000 - 100,000 S.F., grader Ea. 7,150.00 $ 244,855.92 $ STD 1090000.00 Excavating, trench or continuous footing, common earth, 1 C.Y. excavator, 14' to 20' deep, excludes sheeting or dewatering B.C.Y. 7.70 $ 8,393,000.00 $ STD
Estimate Summary: 30% and Long Haul
*"Total" column values include the cost of Exception lines that may not be included in the Material, Labor and Equipment totals.
1224719.10
L.C.Y. 9.41 $ 11,524,606.74 $ STD 35.67 Vegetation and Planting Acre 6,000.00 $ 214,049.59 $ UXO Survey and Clearance 1,150,000.00 $ Erosion & Sediment Control and Dewatering (5% of Subtotal) 1,113,524.76 $ Contingency (30% of Subtotal) 6,681,148.57 $ APPENDIX E: OPINION OF PROBABLE CONSTRUCTION COSTS | LAUNDRY CREEK STREAM RESTORATION
Cycle hauling(wait, load, travel, unload or dump & return) time per cycle, excavated or borrow, loose cubic yards, 20 min load/wait/unload, 20 C.Y. truck, cycle 8 miles, 40 MPH, excludes loading equipment L.C.Y.
$
PAGE 86
Material Labor Equipment Total* Base Total - $ 4,204,863.59 $ 6,207,875.27 $ $ 10,412,738.86 Total O&P - $ 6,267,470.13 $ 6,832,808.88 $ $ 16,208,135.69
Total Cost (including contingency, ESCP, planting, etc.) 21,880,983.18 $ QuantityLineNumberLine Source SubContracted Ind. Description Unit Total O&P Ext. Total O&P Labor Type Notes 240.00 Demolish, remove pavement & curb, remove bituminous pavement, 4" to 6" thick, excludes hauling and disposal fees S.Y. 11.55 $ 2,772.00 $ STD 240.00 Saw cut asphalt up to 3" deep S.Y. 2.31 $ 554.40 $ 236.00 Remove concrete pipe, 60"-84", diameter, excludes excavation L.F. 63.80 $ 15,056.80 $ STD 294.00 Selective demolition, rip-rap & rock lining, slope protection broken stone S.Y. 117.00 $ 34,398.00 $ STD 35.67 Clear and Grubbing, heavy trees and brush, up to 24" diameterAcre 19,375.00 $ 691,201.79 $ 34.25 Rough grading sites, open, 75,000 - 100,000 S.F., grader Ea. 7,150.00 $ 244,855.92 $ STD 1090000.00 Excavating, trench or continuous footing, common earth, 1 C.Y. excavator, 14' to 20' deep, excludes sheeting or dewatering B.C.Y. 7.70 $ 8,393,000.00 $ STD 1224719.10
Estimate Summary: 30% and Short Haul
*"Total" column values include the cost of Exception lines that may not be included in the Material, Labor and Equipment totals.
4.46
5,462,247.19 $ STD 35.67 Vegetation and Planting Acre 6,000.00 $ 214,049.59 $ UXO Survey and Clearance 1,150,000.00 $ Erosion & Sediment Control and Dewatering (5% of Subtotal) 810,406.78 $ Contingency (30% of Subtotal) 4,862,440.71 $ APPENDIX E: OPINION OF PROBABLE CONSTRUCTION COSTS | LAUNDRY CREEK STREAM RESTORATION
Cycle hauling(wait, load, travel, unload or dump & return) time per cycle, excavated or borrow, loose cubic yards, 20 min load/wait/unload, 20 C.Y. truck, cycle 30 miles, 45 MPH, excludes loading equipment
PAGE 87
Material Labor Equipment Total* Base Total - $ 4,204,863.59 $ 6,207,875.27 $ $ 10,412,738.86 Total O&P - $ 6,267,470.13 $ 6,832,808.88 $ $ 22,270,495.24
Total Cost (including contingency, ESCP, planting, etc.) 27,838,119.05 $ QuantityLineNumberLine Source SubContracted Ind. Description Unit Total O&P Ext. Total O&P Labor Type Notes 240.00 Demolish, remove pavement & curb, remove bituminous pavement, 4" to 6" thick, excludes hauling and disposal fees S.Y. 11.55 $ 2,772.00 $ STD 240.00 Saw cut asphalt up to 3" deep S.Y. 2.31 $ 554.40 $ 236.00 Remove concrete pipe, 60"-84", diameter, excludes excavation L.F. 63.80 $ 15,056.80 $ STD 294.00 Selective demolition, rip-rap & rock lining, slope protection broken stone S.Y. 117.00 $ 34,398.00 $ STD 35.67 Clear and Grubbing, heavy trees and brush, up to 24" diameterAcre 19,375.00 $ 691,201.79 $ 34.25 Rough grading sites, open, 75,000 - 100,000 S.F., grader Ea. 7,150.00 $ 244,855.92 $ STD 1090000.00 Excavating, trench or continuous footing, common earth, 1 C.Y. excavator, 14' to 20' deep, excludes sheeting or dewatering B.C.Y. 7.70 $ 8,393,000.00 $ STD
Estimate Summary: 20% and Long Haul
*"Total" column values include the cost of Exception lines that may not be included in the Material, Labor and Equipment totals.
1224719.10
L.C.Y. 9.41
11,524,606.74 $ STD 35.67 Vegetation and Planting Acre 6,000.00 $ 214,049.59 $ UXO Survey and Clearance 1,150,000.00 $ Erosion & Sediment Control and Dewatering (5% of Subtotal) 1,113,524.76 $ Contingency (20% of Subtotal) 4,454,099.05 $ APPENDIX E: OPINION OF PROBABLE CONSTRUCTION COSTS | LAUNDRY CREEK STREAM RESTORATION
$
*"Total" column values include the cost of Exception lines that may not be included in the Material, Labor and Equipment totals.
PAGE 88
Material Labor Equipment Total* Base Total - $ 4,204,863.59 $ 6,207,875.27 $ $ 10,412,738.86 Total O&P - $ 6,267,470.13 $ 6,832,808.88 $ $ 16,208,135.69
Estimate Summary: 20% and Short Haul
Total Cost (including contingency, ESCP, planting, etc.) 20,260,169.61 $ Quantity LineNumberLine Source SubContracted Ind. Description Unit Total O&P Ext. Total O&P Labor Type Notes 240.00 Demolish, remove pavement & curb, remove bituminous pavement, 4" to 6" thick, excludes hauling and disposal fees S.Y. 11.55 $ 2,772.00 $ STD 240.00 Saw cut asphalt up to 3" deep S.Y. 2.31 $ 554.40 $ 236.00 Remove concrete pipe, 60"-84", diameter, excludes excavation L.F. 63.80 $ 15,056.80 $ STD 294.00 Selective demolition, rip-rap & rock lining, slope protection broken stone S.Y. 117.00 $ 34,398.00 $ STD 35.67 Clear and Grubbing, heavy trees and brush, up to 24" diameterAcre 19,375.00 $ 691,201.79 $ 34.25 Rough grading sites, open, 75,000 - 100,000 S.F., grader Ea. 7,150.00 $ 244,855.92 $ STD 1090000.00 Excavating, trench or continuous footing, common earth, 1 C.Y. excavator, 14' to 20' deep, excludes sheeting or dewatering B.C.Y. 7.70 $ 8,393,000.00 $ STD 1224719.10 Cycle hauling(wait, load, travel, unload or dump & return) time per cycle, excavated or borrow, loose cubic yards, 20 min load/wait/unload, 20 C.Y. truck, cycle 8 miles, 40 MPH, excludes loading equipment L.C.Y. 4.46 $ 5,462,247.19 $ STD 35.67 Vegetation and Planting Acre 6,000.00 $ 214,049.59 $ UXO Survey and Clearance 1,150,000.00 $ Erosion & Sediment Control and Dewatering (5% of Subtotal) 810,406.78 $ Contingency (20% of Subtotal) 3,241,627.14 $ APPENDIX E: OPINION OF PROBABLE CONSTRUCTION COSTS | LAUNDRY CREEK STREAM RESTORATION
PAGE 89 APPENDIX F:
HYDRAULIC ANALYSIS TABLES AND FIGURES | LAUNDRY CREEK STREAM RESTORATION
Table A1 – Water surface elevations at each river station in the existing condition model for the 25-yr future, 100-yr future, 200-yr future, 500-yr future, and 100-yr future backwater events. WSE that cause inundation are highlighted.
River Station 25-yr Fut 100-yr Fut 200-yr Fut 500-yr Fut 100-yr Fut BW 12809 224.33 224.62 224.75 224.9 224.65 11702 224.17 224.43 224.55 224.69 224.46 11512 224.15 224.41 224.53 224.67 224.44 11174 HAZMAT Culvert 10821 219.51 220.52 220.98 221.47 220.79 10024 218.3 219.25 219.69 220.15 219.61 9968 CRPP Culvert 9912 212.13 212.52 212.73 212.99 216.71 8563 210.11 211.06 211.52 212.08 216.81 8426 209.75 210.62 211.05 211.55 216.73 7922 208.99 209.86 210.29 210.79 216.66 7405 205.47 206.08 206.36 206.73 216.51 6538 200.05 200.83 201.2 201.64 216.49 6516 Sunshine Bridge 6449 195.7 196.55 196.97 197.46 216.5 5772 194.68 195.55 195.97 196.47 216.5
Table A1 - WSE for the Existing Conditions Model
PAGE 90 APPENDIX F: HYDRAULIC ANALYSIS TABLES AND FIGURES | LAUNDRY CREEK STREAM RESTORATION
Table A2 – Water surface elevations at each river station in the project model for the 25-yr future, 100-yr future, 200-yr future, 500-yr future, and 100-yr future backwater events. WSE that cause inundation are highlighted.
River Station 25-yr Fut 100-yr Fut 200-yr Fut 500-yr Fut 100-yr Fut BW 12809 224.35 224.65 224.78 224.83 224.71 11702 224.19 224.47 224.59 224.71 224.53 11512 224.16 224.44 224.56 224.68 224.51 11174 HAZMAT Culvert 10821 219.49 220.5 220.97 221.45 221.04 10024 218.31 219.27 219.7 220.16 219.96 9968 CRPP Culvert 9912 212.63 212.91 213.16 213.56 217.31 8563 210.36 211.56 212.25 213.06 217.45 8353 210.3 211.51 212.21 213.02 217.45 7761 209.88 211.13 211.84 212.68 217.37 7668 Sightseeing Culvert 7560 208.34 209.13 209.74 210.41 216.18 6787 207.66 208.56 209.32 210.09 216.19 6086 207.17 208.15 209.01 209.83 216.17 4539 206.23 207.43 208.49 209.4 216.13 2538 205.49 206.86 208.09 209.06 216.1 2377 202.09 204.38 206.24 207.25 216.05 1719 201.19 204.03 206.15 207.21 216.02 1580 200.09 203.57 205.93 207 216.01 941 198.54 202.64 205.11 207.05 216.02 885 Sunshine culvert 829 192.95 194.25 194.92 195.75 216 180 187.82 188.41 188.7 189.06 216
Table A2 - WSE for the Model with Project (with S=0.0008)
Table A3 – The differences in water surface elevations for design slopes of 0.0004, 0.0006, 0.0010, and 0.0012 compared to the 0.0008 slope for the 25-yr future, 100-yr future, 200-yr future, 500-yr future, and 100-yr future backwater events.
Table A3 - The differences in water surface elevation for slopes compared to the 0.0008 slope.
PAGE 91 APPENDIX F: HYDRAULIC ANALYSIS TABLES AND FIGURES | LAUNDRY CREEK STREAM RESTORATION
Difference in WSE (S=0.0004) Difference in WSE (S=0.0006) RS 25-yr Fut 100-yr Fut 200-yr Fut 500-yr Fut 100-yr Fut BW 25-yr Fut 100-yr Fut 200-yr Fut 500-yr Fut 100-yr Fut BW 12809 0 0 0 0 0 0 0 0 0 0 11702 0 0 0 0 0 0 0 0 0 0 11512 0 0 0 0 -0.01 0 0 0 0 -0.01 11174 HAZMAT Culvert HAZMAT Culvert 10821 0 0 0 0 0.01 0 0 0 0 0.01 10024 0 0 0 0 0.02 0 0 0 0 0.01 9968 CRPP Culvert CRPP Culvert 9912 -0.07 0.02 0.06 0.1 0.03 -0.03 0.01 0.02 0.05 0.01 8563 0.28 0.24 0.21 0.19 0.02 0.12 0.1 0.09 0.08 0.01 8353 0.29 0.25 0.21 0.19 0.02 0.12 0.11 0.09 0.09 0.01 7761 0.36 0.28 0.25 0.21 0.03 0.15 0.12 0.11 0.09 0.02 7668 Sightseeing Culvert Sightseeing Culvert 7560 0.62 0.58 0.49 0.43 0.03 0.27 0.26 0.22 0.2 0.01 6787 0.85 0.73 0.56 0.46 0.02 0.38 0.33 0.25 0.2 0.01 6086 0.98 0.8 0.57 0.46 0.02 0.44 0.36 0.25 0.2 0.01 4539 1.03 0.7 0.43 0.32 0.01 0.43 0.28 0.17 0.13 0.01 2538 0.16 0.06 0.02 0.02 0 0.06 0.03 0.01 0.01 0 2377 0 0 0 0 0 0 0 0 0 0 1719 0 0 0 0 0 0 0 0 0 0 1580 0 0 0 0 0 0 0 0 0 0 941 0 0 0 0 0 0 0 0 0 0 885 Sunshine Culvert Sunshine Culvert 829 0 0 0 0 0 0 0 0 0 0 180 0 0 0 0 0 0 0 0 0 0
PAGE 92 Table A3 – cont’d Difference in WSE (S=0.0010) Difference in WSE (S=0.0012) RS 25-yr Fut 100-yr Fut 200-yr Fut 500-yr Fut 100-yr Fut BW 25-yr Fut 100-yr Fut 200-yr Fut 500-yr Fut 100-yr Fut BW 12809 0 0 0 0 0.01 0 0 0 0 -0.03 11702 0 0 0 0 0.01 0 0 0 0 -0.03 11512 0 0 0 0 0 0 0 0 0 -0.04 11174 HAZMAT Culvert HAZMAT Culvert 10821 0 0 0 0 0 0 0 0 0 -0.01 10024 0 0 0 0 0 0 0 0 0 -0.01 9968 CRPP Culvert CRPP Culvert 9912 0.03 0 -0.02 -0.03 -0.01 0.05 0 -0.03 -0.05 -0.02 8563 -0.08 -0.07 -0.07 -0.06 -0.01 -0.14 -0.12 -0.12 -0.11 -0.02 8353 -0.09 -0.07 -0.07 -0.06 -0.01 -0.15 -0.12 -0.13 -0.11 -0.02 7761 -0.1 -0.09 -0.08 -0.08 -0.01 -0.18 -0.15 -0.14 -0.13 -0.02 7668 Sightseeing Culvert Sightseeing Culvert 7560 -0.22 -0.22 -0.19 -0.16 -0.01 -0.41 -0.4 -0.35 -0.3 -0.02 6787 -0.34 -0.28 -0.21 -0.17 -0.01 -0.62 -0.5 -0.37 -0.3 -0.02 6086 -0.38 -0.28 -0.2 -0.15 -0.01 -0.69 -0.51 -0.35 -0.27 -0.02 4539 -0.28 -0.19 -0.12 -0.09 0 -0.46 -0.31 -0.2 -0.16 -0.01 2538 -0.03 -0.01 -0.01 0 0 -0.04 -0.02 -0.02 -0.01 0 2377 0 0 0 0 0 0 0 0 0 0 1719 0 0 0 0 0 0 0 0 0 0 1580 0 0 0 0 0 0 0 0 0 0 941 0 0 0 0 0 0 0 0 0 0 885 Sunshine Culvert Sunshine Culvert 829 0 0 0 0 0 0 0 0 0 0 180 0 0 0 0 0 0 0 0 0 0 180 0 0 0 0 0 0 0 0 0 0 APPENDIX F: HYDRAULIC ANALYSIS TABLES AND FIGURES | LAUNDRY CREEK STREAM RESTORATION
PAGE 93 APPENDIX F: HYDRAULIC ANALYSIS TABLES AND FIGURES | LAUNDRY CREEK STREAM RESTORATION
Table A4 – The differences in water surface elevations for design slopes of 0.0004, 0.0006, 0.0010, and 0.0012 compared to the 0.0008 slope for the 216 ft, 216.5 ft, 217 ft, 217.5 ft, 218 ft, 218.5 ft, and 219 ft backwater boundary conditions.
Difference in WSE (0.0004 slope) Difference in WSE (0.0006 slope) RS 216 216.5 217 217.5 218 218.5 219 216 216.5 217 217.5 218 218.5 219 12809 0 0.02 -0.01 -0.01 -0.01 0 0 0 0 0 0 0 0 -0.05 11702 0 0.02 -0.01 -0.01 -0.01 0 0.01 0 0 -0.01 -0.01 0 0 0.02 11512 -0.01 0.02 -0.01 0 0 0.01 0 -0.01 0.01 0 0 0 0 0.01 11174 HAZMAT Culvert HAZMAT Culvert 10821 0.01 0.02 0.02 0.02 0.02 0.01 0 0.01 0.01 0.01 0.01 0.01 0 -0.01 10024 0.02 0.02 0.02 0.02 0.02 0.01 0 0.01 0.01 0.01 0.01 0.01 0 0 9968 CRPP Culvert CRPP Culvert 9912 0.03 0.02 0.02 0.02 0.02 0.01 0.01 0.01 0.01 0.01 0.01 0.01 0.01 0 8563 0.02 0.02 0.02 0.01 0.02 0.01 0.02 0.01 0.01 0 0 0.01 0.01 0.01 8353 0.02 0.02 0.02 0.02 0.02 0.01 0.01 0.01 0.01 0.01 0.01 0.01 0 0.01 7761 0.03 0.02 0.02 0.02 0.01 0.01 0.02 0.02 0.01 0.01 0.01 0.01 0.01 0.01 7668 Sightseeing Culvert Sightseeing Culvert 7560 0.03 0.03 0.02 0.02 0.02 0.02 0.01 0.01 0.01 0.01 0.01 0.01 0.01 0.01 6787 0.02 0.02 0.02 0.01 0.02 0.02 0.01 0.01 0.01 0.01 0 0.01 0.01 0.01 6086 0.02 0.02 0.01 0.02 0.01 0.01 0.01 0.01 0.01 0 0.01 0.01 0.01 0.01 4539 0.01 0.01 0.01 0.01 0.01 0.01 0.01 0.01 0.01 0 0 0 0.01 0.01 2538 0 0 -0.01 -0.01 0 0 0 0 0 0 -0.01 0 0 0 2377 0 0 0 0 0 0 0 0 0 0 0 0 0 0 1719 0 0 0 0 0 0 0 0 0 0 0 0 0 0 1580 0 0 0 0 0 0 0 0 0 0 0 0 0 0 941 0 0 0 0 0 0 0 0 0 0 0 0 0 0 885 Sunshine Culvert Sunshine Culvert 829 0 0 0 0 0 0 0 0 0 0 0 0 0 0 180 0 0 0 0 0 0 0 0 0 0 0 0 0 0
Table A4 – The difference in Water Surface Elevations for the backwater condition for the 0.0004, 0.0006, 0.0010, and 0.0012 slopes compared to the 0.0008 slope.
PAGE 94 Table A4– cont’d APPENDIX F: HYDRAULIC ANALYSIS TABLES AND FIGURES | LAUNDRY CREEK STREAM RESTORATION Difference in WSE (0.0010 slope) Difference in WSE (0.0012 slope) RS 216 216.5 217 217.5 218 218.5 219 216 216.5 217 217.5 218 218.5 219 12809 0.01 -0.02 -0.03 -0.03 -0.03 -0.02 0 -0.03 0.02 -0.03 -0.03 -0.02 0.01 -0.01 11702 0.01 -0.02 -0.04 -0.03 -0.03 -0.01 0 -0.03 0.02 -0.03 -0.03 -0.03 0.01 -0.01 11512 0 -0.01 -0.03 -0.03 -0.02 0 0 -0.04 0.02 -0.03 -0.03 -0.02 0.02 -0.01 11174 HAZMAT Culvert HAZMAT Culvert 10821 0 0 0 -0.01 0 -0.01 -0.01 -0.01 -0.01 -0.01 -0.01 -0.01 -0.01 0 10024 0 0 -0.01 -0.01 0 -0.01 0 -0.01 -0.01 -0.01 -0.02 -0.01 -0.01 0 9968 CRPP Culvert CRPP Culvert 9912 -0.01 -0.01 -0.01 -0.01 0 0 -0.01 -0.02 -0.02 -0.01 -0.01 -0.01 -0.01 -0.01 8563 -0.01 -0.01 -0.01 -0.01 0 -0.01 0 -0.02 -0.02 -0.02 -0.02 -0.01 -0.01 -0.01 8353 -0.01 -0.01 0 0 -0.01 -0.01 0 -0.02 -0.02 -0.01 -0.01 -0.01 -0.01 -0.01 7761 -0.01 -0.01 -0.01 -0.01 -0.01 -0.01 0 -0.02 -0.02 -0.01 -0.02 -0.01 -0.01 -0.01 7668 Sightseeing Culvert Sightseeing Culvert 7560 -0.01 -0.01 -0.01 0 0 0 0 -0.02 -0.01 -0.01 -0.01 -0.01 -0.01 -0.01 6787 -0.01 -0.01 0 -0.01 0 0 0 -0.02 -0.01 -0.01 -0.02 -0.01 0 0 6086 -0.01 0 -0.01 0 0 0 0 -0.02 -0.01 -0.01 -0.01 -0.01 0 0 4539 0 0 0 -0.01 0 0 0 -0.01 0 -0.01 -0.01 0 0 0 2538 0 0 0 0 0 0.01 0 0 0 0 0 0 0.01 0 2377 0 0 0 0 0 0 0 0 0 0 0 0 0 0 1719 0 0 0 0 0 0 0 0 0 0 0 0 0 0 1580 0 0 0 0 0 0 0 0 0 0 0 0 0 0 941 0 0 0 0 0 0 0 0 0 0 0 0 0 0 885 Sunshine Culvert Sunshine Culvert 829 0 0 0 0 0 0 0 0 0 0 0 0 0 0 180 0 0 0 0 0 0 0 0 0 0 0 0 0 0
Table A5 – The differences in water surface elevations for design slopes of 0.0004, 0.0006, 0.0010, and 0.0012 compared to the 0.0008 slope for the 25-yr future, 100-yr future, 200-yr future, 500-yr future, and 100-yr future backwater events for roughness values in Scenario A. Changes to WSEs that cause inundation are highlighted.
Table A5 - The differences in water surface elevation from raising the Manning roughness values in Scenario A for slope of 0.0004, 0.0006, 0.0010, and 0.0012 compared to the 0.0008 slope.
PAGE 95 APPENDIX F: HYDRAULIC ANALYSIS TABLES AND FIGURES | LAUNDRY CREEK STREAM RESTORATION
WSE Difference for 0.0004 WSE Difference for 0.0006 RS 25-yr Fut 100-yr Fut 200-yr Fut 500-yr Fut 100-yr Fut BW 25-yr Fut 100-yr Fut 200-yr Fut 500-yr Fut 100-yr Fut BW 12809 0 0 0.01 0.01 -0.01 0 0 -0.03 0.01 -0.01 11702 0 0 0 0.01 -0.01 0 0 -0.04 0 -0.01 11512 0 0 0.01 0.01 -0.02 0 0 -0.04 0 -0.01 11174 HAZMAT Culvert HAZMAT Culvert 10821 0 0 -0.01 -0.01 0.03 0 0 -0.01 -0.01 0.01 10024 0 0 0 -0.01 0.05 0 0 0 0 0.02 9968 CRPP Culvert CRPP Culvert 9912 0.07 0.17 0.25 0.35 0.06 0.02 0.07 0.09 0.16 0.03 8563 0.38 0.34 0.38 0.44 0.06 0.17 0.15 0.14 0.2 0.03 8353 0.39 0.36 0.39 0.45 0.06 0.17 0.16 0.14 0.2 0.03 7761 0.49 0.43 0.45 0.51 0.06 0.21 0.19 0.16 0.23 0.03 7668 Sightseeing Culvert Sightseeing Culvert 7560 0.65 0.59 0.52 0.49 0.06 0.29 0.27 0.24 0.22 0.03 6787 0.89 0.75 0.62 0.56 0.06 0.41 0.34 0.28 0.25 0.03 6086 1.02 0.81 0.64 0.57 0.05 0.46 0.37 0.28 0.25 0.02 4539 1.12 0.74 0.53 0.46 0.03 0.49 0.31 0.22 0.19 0.01 2538 0.2 0.1 0.06 0.05 0 0.08 0.04 0.02 0.02 0 2377 0 0 0 0 0 0 0 0 0 0 1719 0 0 0 0 0 0 0 0 0 0 1580 0 0 0 0 0 0 0 0 0 0 941 0 0 0 0 0 0 0 0 0 0 885 Sunshine Culvert Sunshine Culvert 829 0 0 0 0 0 0 0 0 0 0 180 0 0 0 0 0 0 0 0 0 0
PAGE 96 Table A5– cont’d APPENDIX F: HYDRAULIC ANALYSIS TABLES AND FIGURES | LAUNDRY CREEK STREAM RESTORATION WSE Difference for 0.0010 WSE Difference for 0.0012 RS 25-yr Fut 100-yr Fut 200-yr Fut 500-yr Fut 100-yr Fut BW 25-yr Fut 100-yr Fut 200-yr Fut 500-yr Fut 100-yr Fut BW 12809 0 0 -0.02 0 -0.01 0 0 -0.02 -0.01 -0.02 11702 0 0 -0.02 0 -0.01 0 0 -0.02 0 -0.02 11512 0 0 -0.02 0 -0.01 0 0 -0.02 -0.01 -0.03 11174 HAZMAT Culvert HAZMAT Culvert 10821 0 0 0 0 -0.01 0 0 0 0 -0.02 10024 0 0 0 0 -0.01 0 0 0 0 -0.03 9968 CRPP Culvert CRPP Culvert 9912 -0.01 -0.06 -0.06 -0.13 -0.02 -0.01 -0.09 -0.11 -0.23 -0.04 8563 -0.12 -0.12 -0.12 -0.17 -0.02 -0.22 -0.22 -0.21 -0.32 -0.04 8353 -0.13 -0.13 -0.12 -0.18 -0.02 -0.24 -0.23 -0.22 -0.33 -0.04 7761 -0.18 -0.15 -0.14 -0.21 -0.02 -0.32 -0.28 -0.26 -0.38 -0.04 7668 Sightseeing Culvert Sightseeing Culvert 7560 -0.25 -0.23 -0.21 -0.2 -0.02 -0.45 -0.43 -0.38 -0.37 -0.04 6787 -0.36 -0.29 -0.23 -0.22 -0.02 -0.67 -0.54 -0.43 -0.4 -0.03 6086 -0.42 -0.3 -0.24 -0.22 -0.02 -0.77 -0.55 -0.43 -0.39 -0.03 4539 -0.36 -0.23 -0.17 -0.15 -0.01 -0.61 -0.4 -0.28 -0.25 -0.02 2538 -0.05 -0.03 -0.02 -0.02 0 -0.08 -0.05 -0.03 -0.03 0 2377 0 0 0 0 0 0 0 0 0 0 1719 0 0 0 0 0 0 0 0 0 0 1580 0 0 0 0 0 0 0 0 0 0 941 0 0 0 0 0 0 0 0 0 0 885 Sunshine Culvert Sunshine Culvert 829 0 0 0 0 0 0 0 0 0 0 180 0 0 0 0 0 0 0 0 0 0
Table A6 – The differences in water surface elevations for design slopes of 0.0004, 0.0006, 0.0010, and 0.0012 compared to the 0.0008 slope for the 25-yr future, 100-yr future, 200-yr future, 500-yr future, and 100-yr future backwater events for roughness values in Scenario B.
Table A6 - The differences in water surface elevation from raising the Manning roughness values in Scenario B for slope of 0.0004, 0.0006, 0.0010, and 0.0012 compared to the 0.0008 slope.
PAGE 97 APPENDIX F: HYDRAULIC ANALYSIS TABLES AND FIGURES | LAUNDRY CREEK STREAM RESTORATION
WSE Difference for 0.0004 WSE Difference for 0.0006 RS 25-yr Fut 100-yr Fut 200-yr Fut 500-yr Fut 100-yr Fut BW 25-yr Fut 100-yr Fut 200-yr Fut 500-yr Fut 100-yr Fut BW 12809 -0.03 0 0 -0.01 -0.01 -0.03 0 0 0.01 0 11702 -0.04 0 0 0 -0.02 -0.03 0 0 0.01 -0.01 11512 -0.03 0 0 -0.01 -0.01 -0.03 0 0 0.01 0 11174 HAZMAT Culvert HAZMAT Culvert 10821 0 0 0 0.01 0.03 0 0 0 0.01 0.01 10024 0 0 0 0.01 0.04 0 0 0 0 0.02 9968 CRPP Culvert CRPP Culvert 9912 -0.08 0.01 0.07 0.17 0.05 -0.04 0 0.02 0.07 0.02 8563 0.37 0.35 0.38 0.44 0.05 0.15 0.15 0.14 0.2 0.02 8353 0.39 0.36 0.39 0.45 0.06 0.17 0.16 0.14 0.2 0.03 7761 0.49 0.43 0.45 0.51 0.06 0.21 0.19 0.16 0.23 0.03 7668 Sightseeing Culvert Sightseeing Culvert 7560 0.65 0.59 0.52 0.49 0.06 0.29 0.27 0.24 0.22 0.03 6787 0.89 0.75 0.62 0.56 0.06 0.41 0.34 0.28 0.25 0.03 6086 1.02 0.81 0.64 0.57 0.05 0.46 0.37 0.28 0.25 0.02 4539 1.12 0.74 0.53 0.46 0.03 0.49 0.31 0.22 0.19 0.01 2538 0.2 0.1 0.06 0.05 0 0.08 0.04 0.02 0.02 0 2377 0 0 0 0 0 0 0 0 0 0 1719 0 0 0 0 0 0 0 0 0 0 1580 0 0 0 0 0 0 0 0 0 0 941 0 0 0 0 0 0 0 0 0 0 885 Sunshine Culvert Sunshine Culvert 829 0 0 0 0 0 0 0 0 0 0 180 0 0 0 0 0 0 0 0 0 0
PAGE 98 Table A6– cont’d APPENDIX F: HYDRAULIC ANALYSIS TABLES AND FIGURES | LAUNDRY CREEK STREAM RESTORATION WSE Difference for 0.0010 WSE Difference for 0.0012 RS 25-yr Fut 100-yr Fut 200-yr Fut 500-yr Fut 100-yr Fut BW 25-yr Fut 100-yr Fut 200-yr Fut 500-yr Fut 100-yr Fut BW 12809 -0.01 0 0 -0.01 0.01 0 0 0 0.01 0.01 11702 -0.01 0 0 -0.01 0 0.01 0 0 0.01 0.01 11512 -0.01 0 0 -0.01 0.01 0.01 0 0 0.01 0.01 11174 HAZMAT Culvert HAZMAT Culvert 10821 0 0 0 0 -0.01 0 0 0 0 -0.02 10024 0 0 0 -0.01 -0.02 0 0 0 -0.01 -0.03 9968 CRPP Culvert CRPP Culvert 9912 0.04 0 -0.01 -0.06 -0.02 0.07 0.01 -0.02 -0.09 -0.04 8563 -0.13 -0.12 -0.11 -0.17 -0.03 -0.22 -0.21 -0.21 -0.32 -0.05 8353 -0.13 -0.13 -0.12 -0.18 -0.02 -0.24 -0.23 -0.22 -0.33 -0.04 7761 -0.18 -0.15 -0.14 -0.21 -0.02 -0.32 -0.28 -0.26 -0.38 -0.04 7668 Sightseeing Culvert Sightseeing Culvert 7560 -0.25 -0.23 -0.21 -0.2 -0.02 -0.45 -0.43 -0.38 -0.37 -0.04 6787 -0.36 -0.29 -0.23 -0.22 -0.02 -0.67 -0.54 -0.43 -0.4 -0.03 6086 -0.42 -0.3 -0.24 -0.22 -0.02 -0.77 -0.55 -0.43 -0.39 -0.03 4539 -0.36 -0.23 -0.17 -0.15 -0.01 -0.61 -0.4 -0.28 -0.25 -0.02 2538 -0.05 -0.03 -0.02 -0.02 0 -0.08 -0.05 -0.03 -0.03 0 2377 0 0 0 0 0 0 0 0 0 0 1719 0 0 0 0 0 0 0 0 0 0 1580 0 0 0 0 0 0 0 0 0 0 941 0 0 0 0 0 0 0 0 0 0 885 Sunshine Culvert Sunshine Culvert 829 0 0 0 0 0 0 0 0 0 0 180 0 0 0 0 0 0 0 0 0 0
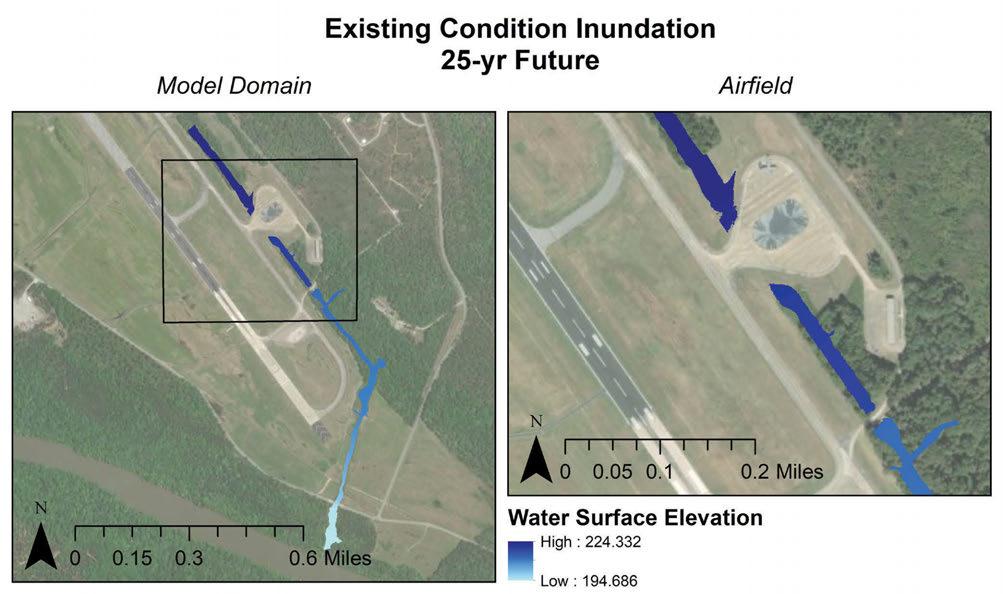
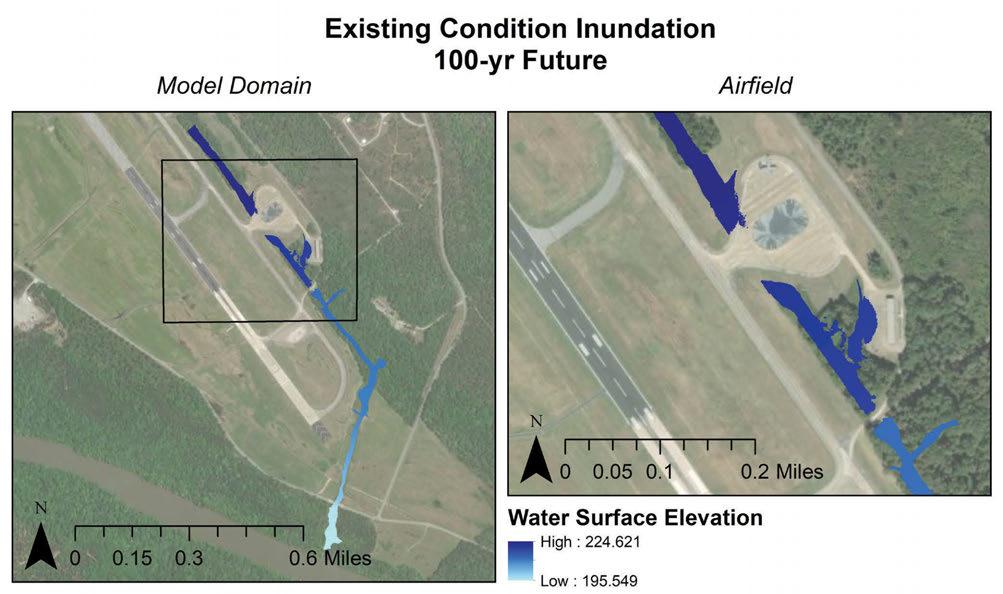
PAGE 99 APPENDIX F: HYDRAULIC ANALYSIS TABLES AND
| LAUNDRY CREEK STREAM RESTORATION
FIGURES
Figure 39: Inundation for the 25-yr future event in the existing condition model.
Figure 40: Inundation for the 100-yr future event in the existing condition model.
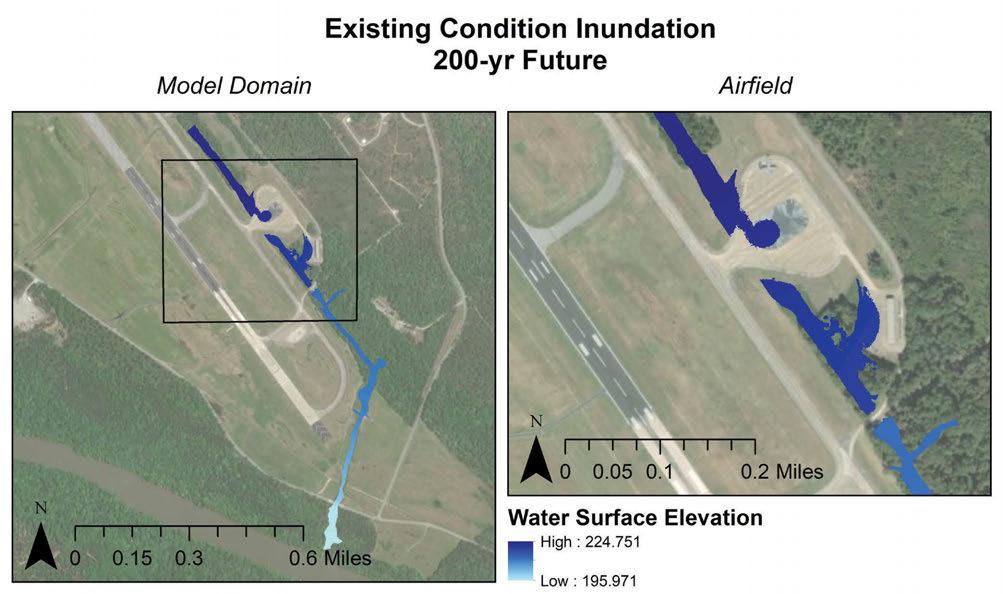
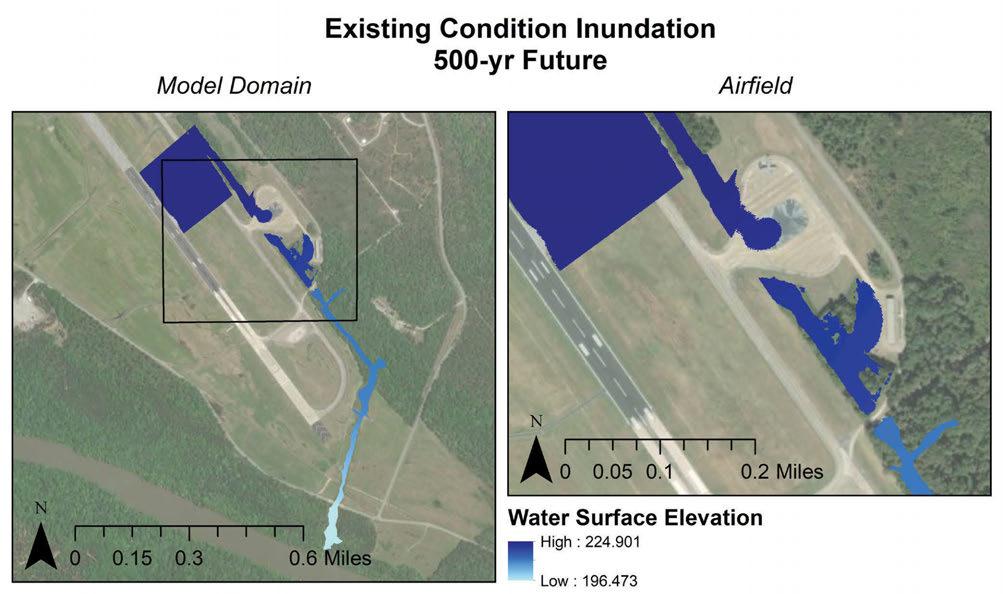
PAGE 100 APPENDIX F: HYDRAULIC ANALYSIS TABLES AND FIGURES | LAUNDRY CREEK STREAM RESTORATION
Figure 41: Inundation for the 200-yr future event in the existing condition model.
Figure 42: Inundation for the 500-yr future event in the existing condition model.
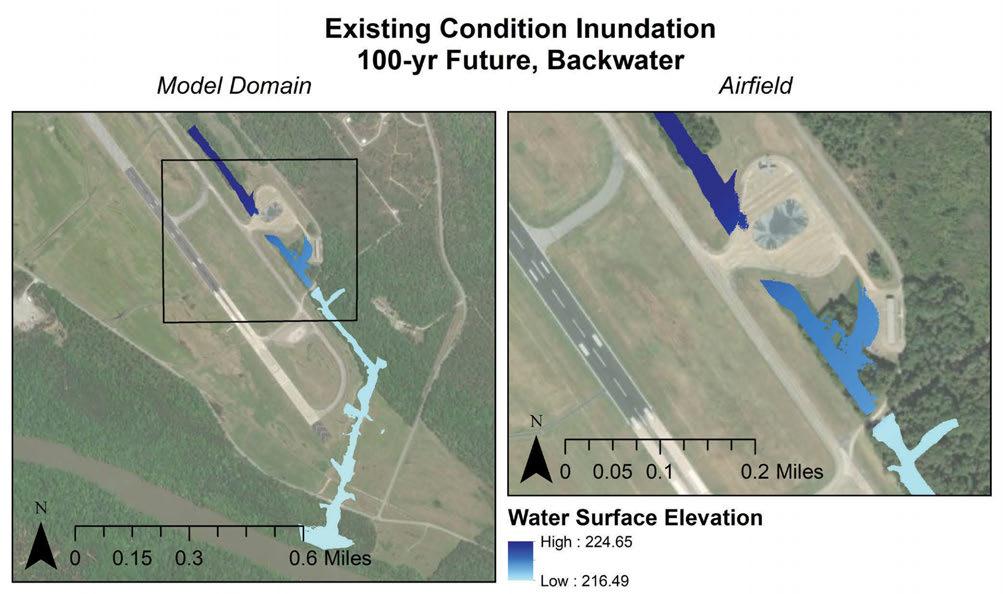
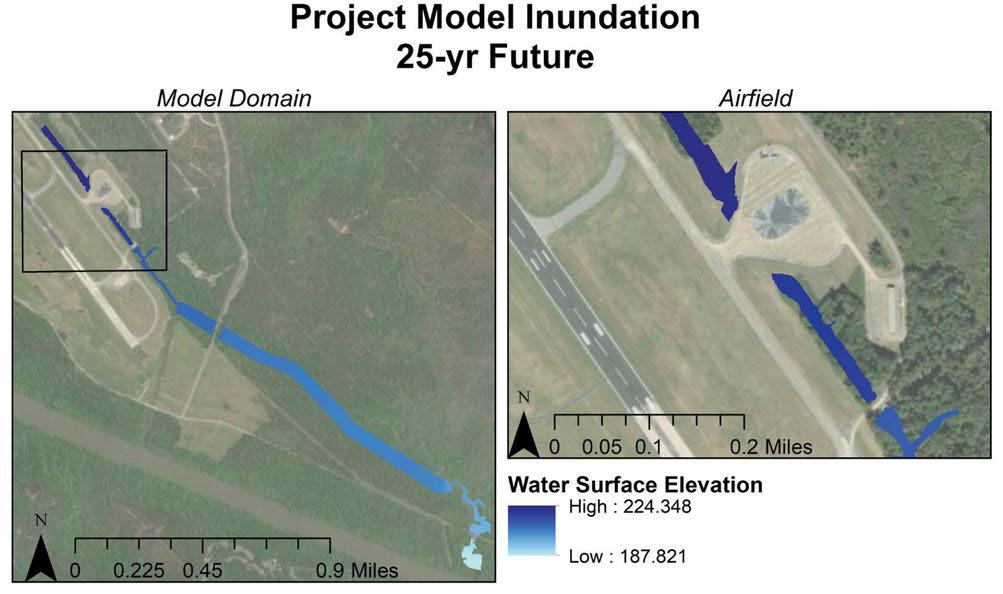
PAGE 101 APPENDIX F: HYDRAULIC ANALYSIS TABLES AND
| LAUNDRY CREEK STREAM RESTORATION
FIGURES
Figure 43: Inundation for the 100-yr future backwater event in the existing condition model.
Figure 44: Inundation for the 25-yr future event in the project model.
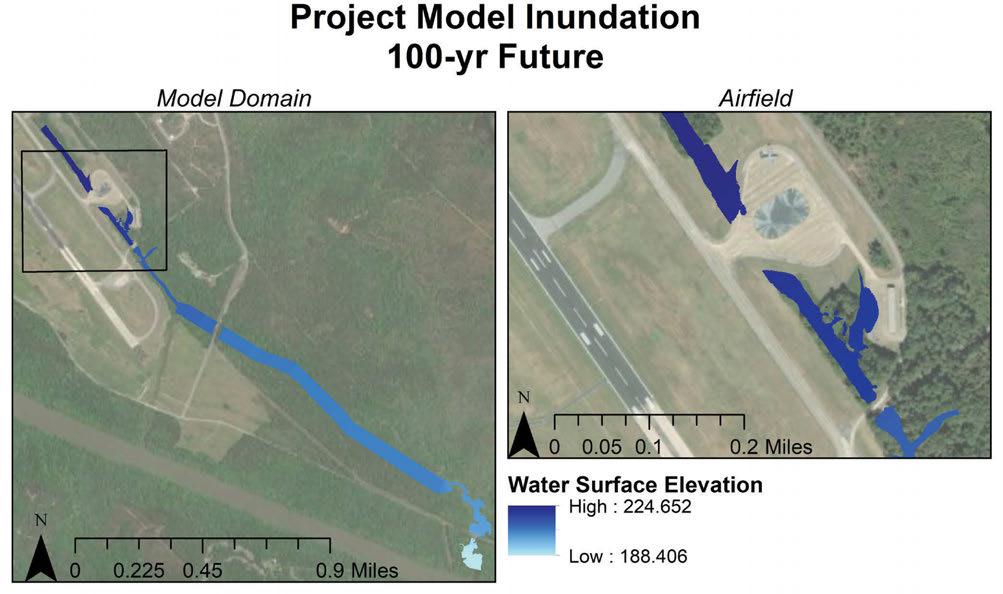
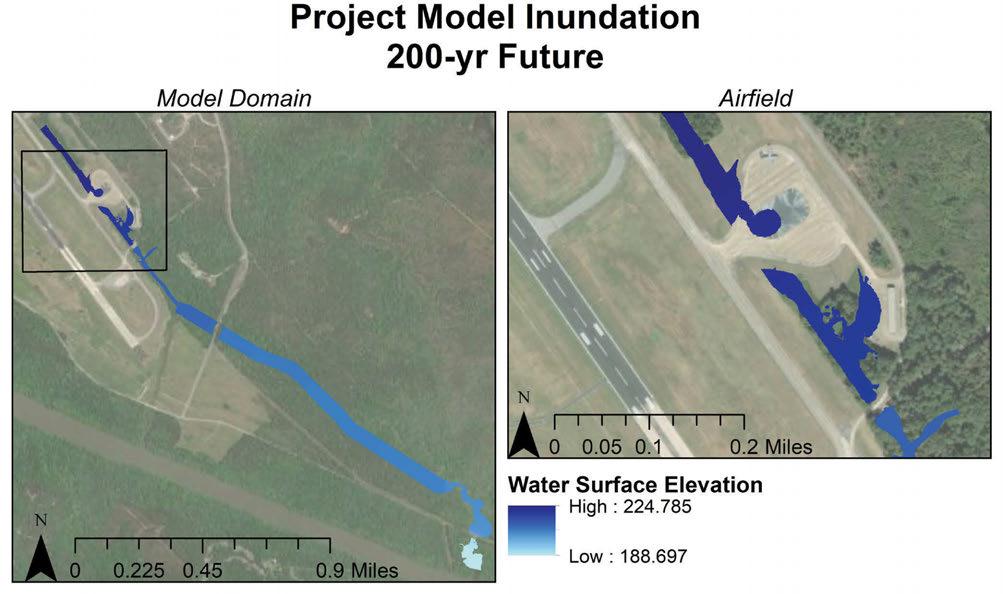
PAGE 102 APPENDIX F: HYDRAULIC ANALYSIS TABLES AND FIGURES | LAUNDRY CREEK STREAM RESTORATION
Figure 45: Inundation for the 100-yr future event in the project model.
Figure 46: Inundation for the 200-yr future event in the project model.
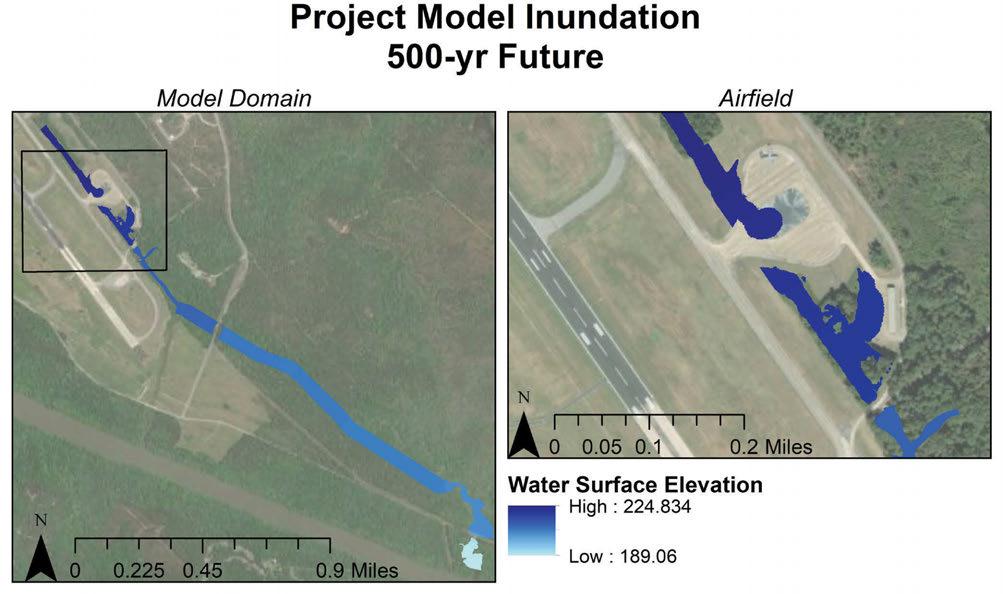
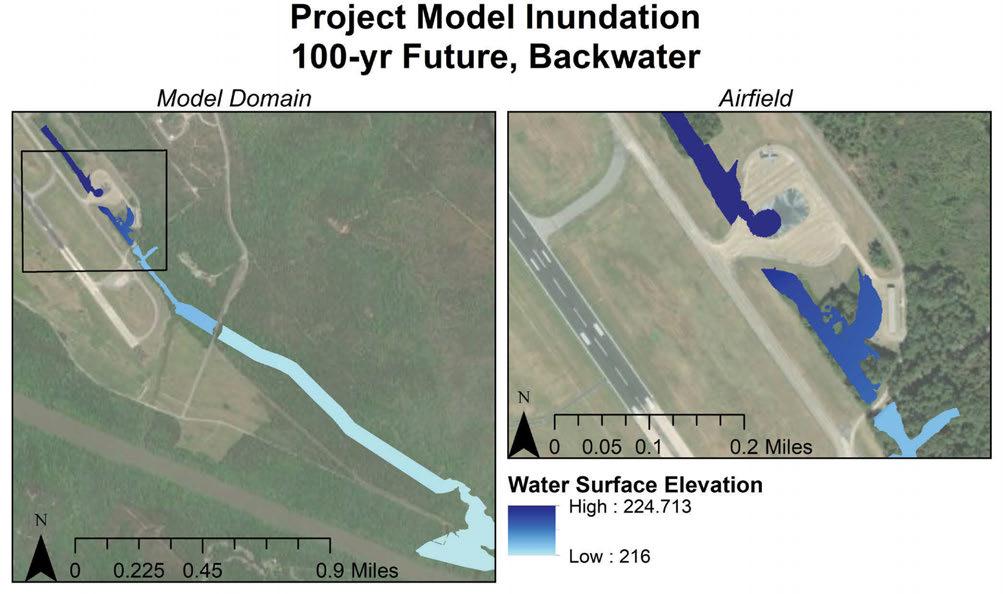
PAGE 103 APPENDIX F: HYDRAULIC ANALYSIS TABLES AND
| LAUNDRY CREEK STREAM RESTORATION
FIGURES
Figure 47: Inundation for the 500-yr future event in the project model.
Figure 48: Inundation for the 100-yr future backwater event in the project model.

Southeast Conservation Adaptation Strategy secassoutheast.org
March 21, 2024
Kirk
Ticknor
Director
of Public Works
The University of Georgia – Fort Moore, Meloy Hall 6605 Meloy Drive, Rm 318 Fort Moore, GA 31905
Dear Mr. Ticknor,
I am writing in my capacity as Coordinator of the Southeast Conservation Adaptation Strategy (SECAS) partnership to express support for the Laundry Creek realignment project at Fort Moore. SECAS is a regional conservation partnership that brings together state and federal agencies, nonprofit organizations, private landowners and businesses, Tribes, partnerships, and universities around a shared vision for the future. SECAS is working to design and achieve a connected network of lands and waters that supports thriving fish and wildlife populations and improved quality of life for people across the Southeast and U.S. Caribbean.
The primary product of SECAS is the Southeast Conservation Blueprint, a living spatial plan that identifies priority areas for conservation regionwide. The Blueprint prioritizes almost the entire footprint of the proposed Laundry Creek realignment project and recognizes it as a regional corridor. Within the surrounding watersheds, the Blueprint also prioritizes this stretch of the Chattahoochee River due to its important aquatic resource values. In those watersheds, 2-3 aquatic Species of Greatest Conservation Need have been observed, and the Chattahoochee is well-connected to a network of 5 different stream size classes, offering opportunities for species to access climate refugia. Restoring and connecting Laundry Creek to the Chattahoochee through the remnant Sewelson Creek channel will help protect and enhance the habitat, water quality, and ecological function of this important river system.
Given the area’s importance for conservation and connectivity, SECAS supports using a nature-based approach to restore a more natural and connected Laundry Creek floodplain, rather than expanding gray infrastructure and further altering the area’s historic hydrology. The proposed realignment is consistent with the SECAS Goal: a 10% or greater improvement in the health, function, and connectivity of Southeastern ecosystems by 2060. Increasing conservation actions within the Blueprint is a key strategy for achieving the SECAS Goal.
I am pleased to support this proposal as it addresses shared conservation values and goals for the Southeast region. Please contact me if you have questions or desire further information about SECAS
Sincerely,
 Amanda Sesser Coordinator, Southeast Conservation Adaptation Strategy (SECAS)
PAGE 104 APPENDIX G: SECAS LETTER OF SUPPORT | LAUNDRY CREEK STREAM RESTORATION
PAGE 105 APPENDIX H: SECAS BLUEPRINT REPORT | LAUNDRY CREEK STREAM RESTORATION Southeast Conservation Blueprint Summary for Laundry Creek Restoration Area Created 03/19/2024 Table of Contents About the Southeast Blueprint 3 Southeast Blueprint Priorities 4 Hubs and Corridors 6 Indicator Summary 8 Threats 27 Ownership and Partners 30 Credits 34
The Southeast Conservation Blueprint 2023
[THIS PAGE INTENTIONALLY LEFT BLANK]
PAGE 106 APPENDIX H: SECAS BLUEPRINT REPORT | LAUNDRY CREEK STREAM RESTORATION
03/19/2024
https://blueprint.geoplatform.gov/southeast Page 2 of 34
Southeast Conservation Blueprint Summary for Laundry Creek Restoration Area Created
using
Southeast Conservation Blueprint Summary for Laundry Creek Restoration Area Created
About the Southeast Blueprint
The Southeast Conservation Blueprint is the primary product of the Southeast Conservation Adaptation Strategy (SECAS). It is a living, spatial plan to achieve the SECAS vision of a connected network of lands and waters across the Southeast and Caribbean. The Blueprint is regularly updated to incorporate new data, partner input, and information about on-the-ground conditions.
The Blueprint identifies priority areas based on a suite of natural and cultural resource indicators representing terrestrial, freshwater, and marine ecosystems. A connectivity analysis identifies corridors that link coastal and inland areas and span climate gradients.
For more information:
•
Visit the Blueprint webpage
•
Review the Blueprint 2023 Development Process
•
View and download the Blueprint data and make maps on the Blueprint page of the SECAS Atlas
We're here to help!
•
•
•
Do you have a question about the Blueprint?
Would you like help using the Blueprint to support a proposal or inform a decision?
Do you have a suggestion on how to improve the Blueprint? The Blueprint and its inputs are regularly revised based on input from people like you.
•
Do you have feedback on how to improve the Simple Viewer interface?
If you need help or have questions, contact Southeast Blueprint staff by reaching out to a member of the user support team.
We're here to support you. We really mean it. It's what we do!
PAGE 107 APPENDIX H: SECAS BLUEPRINT REPORT | LAUNDRY CREEK STREAM RESTORATION
Page 3 of 34
03/19/2024 using https://blueprint.geoplatform.gov/southeast
Southeast Blueprint Priorities
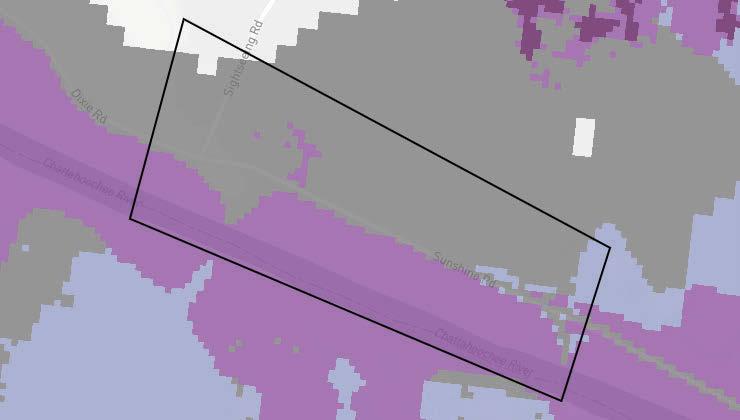
PAGE 108 APPENDIX H: SECAS BLUEPRINT REPORT | LAUNDRY CREEK STREAM RESTORATION
Basemap credits: © Mapbox © OpenStreetMap Improve this basemap 0.9 miles Priorities for a connected network of lands and waters Highest priority High priority Medium priority Priority connections N 0.220.45 Southeast Conservation Blueprint Summary for Laundry Creek Restoration Area Created 03/19/2024 using https://blueprint.geoplatform.gov/southeast Page 4 of 34
Priority Categories
For a connected network of lands and waters
In total, Blueprint priorities and priority connections cover roughly 50% of the Southeast Blueprint geography.
Highest priority
Areas where conservation action would make the biggest impact, based on a suite of natural and cultural resource indicators. This class covers roughly 10% of the Southeast Blueprint geography.
High priority
Areas where conservation action would make a big impact, based on a suite of natural and cultural resource indicators. This class covers roughly 15% of the Southeast Blueprint geography.
Medium priority
Areas where conservation action would make an above-average impact, based on a suite of natural and cultural resource indicators. This class covers roughly 20% of the Southeast Blueprint geography.
Priority connections
Connections between priority areas that cover the shortest distance possible while routing through as much Blueprint priority as possible. This class covers roughly 5% of the Southeast Blueprint geography.
PAGE 109 APPENDIX H: SECAS BLUEPRINT REPORT | LAUNDRY CREEK STREAM RESTORATION
Priority Category Acres Percent of Area Highest priority 0 0% High priority 199 41.9% Medium priority 15 3.1% Priority connections 251 52.9% Lower priority 10 2.1% Total area474 100%
Created 03/19/2024 using https://blueprint.geoplatform.gov/southeast Page 5 of 34
Table 1: Extent of each Blueprint priority category within Laundry Creek Restoration Area.
Southeast Conservation Blueprint Summary for Laundry Creek Restoration Area
Hubs and Corridors
The Blueprint uses a least-cost path connectivity analysis to identify corridors that link hubs across the shortest distance possible, while also routing through as much Blueprint priority as possible.
Inland hubs are large patches (~5,000+ acres) of highest priority Blueprint areas and/or protected lands, connected by inland corridors.
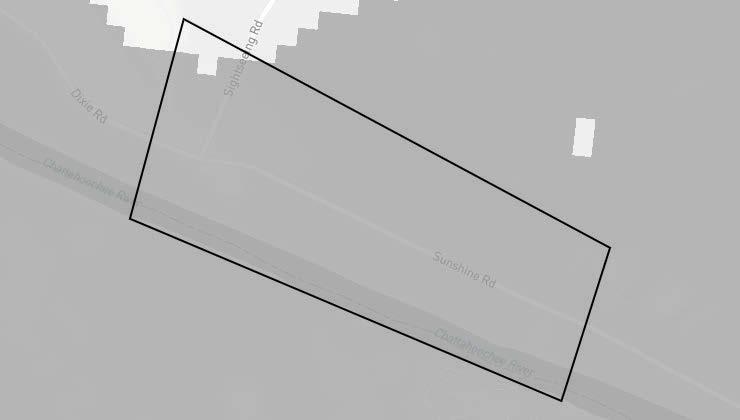
PAGE 110 APPENDIX H: SECAS BLUEPRINT REPORT | LAUNDRY CREEK STREAM RESTORATION
0.9 miles Inland continental hubs Inland continental corridors Not a hub or corridor N 0.220.45 Southeast Conservation Blueprint Summary for Laundry Creek Restoration Area
Basemap credits: © Mapbox © OpenStreetMap Improve this basemap
Created 03/19/2024 using https://blueprint.geoplatform.gov/southeast Page 6 of 34
PAGE 111 APPENDIX H: SECAS BLUEPRINT REPORT | LAUNDRY CREEK STREAM RESTORATION
Type Acres Percent of Area Inland continental corridors 464 97.9% Not a hub or corridor 10 2.1% Total area474 100%
Table 2: Extent of hubs and corridors within Laundry Creek Restoration Area.
7
34
Southeast Conservation Blueprint Summary for Laundry Creek Restoration Area
Created 03/19/2024 using https://blueprint.geoplatform.gov/southeast Page
of
Indicator Summary
Table 3: Terrestrial indicators. Indicator
East Coastal Plain open pine birds
Equitable access to potential parks
Fire frequency ✓
Greenways & trails
Intact habitat cores
Resilient terrestrial sites
South Atlantic amphibian & reptile areas
South Atlantic forest birds
South Atlantic low-urban historic landscapes
Urban park size
Table 4: Freshwater indicators. Indicator
Gulf migratory fish connectivity
Imperiled aquatic species
Natural landcover in floodplains
Network complexity ✓
surface
PAGE 112 APPENDIX H: SECAS BLUEPRINT REPORT | LAUNDRY CREEK STREAM RESTORATION
Present
✓
-
-
✓
✓
-
✓
-
-
Present
-
✓
✓
Page 8 of 34
Permeable
✓ Southeast Conservation Blueprint Summary for Laundry Creek Restoration Area Created 03/19/2024 using https://blueprint.geoplatform.gov/southeast
Terrestrial East Coastal Plain open pine birds
This indicator identifies areas within the historic longleaf pine range east of the Mississippi River where creating or maintaining open pine habitat would most benefit six focal species of birds (Bachman's sparrow, red-cockaded woodpecker, Henslow's sparrow, red-headed woodpecker, Northern bobwhite, brown-headed nuthatch). It prioritizes areas for open pine conservation based on suitability for longleaf pine, feasibility of prescribed burning, proximity to protected lands, habitat suitability for focal bird species, and proximity to bird source populations. It originates from the East Gulf Coastal Plain Joint Venture's prioritization of areas for open pine ecosystem restoration.
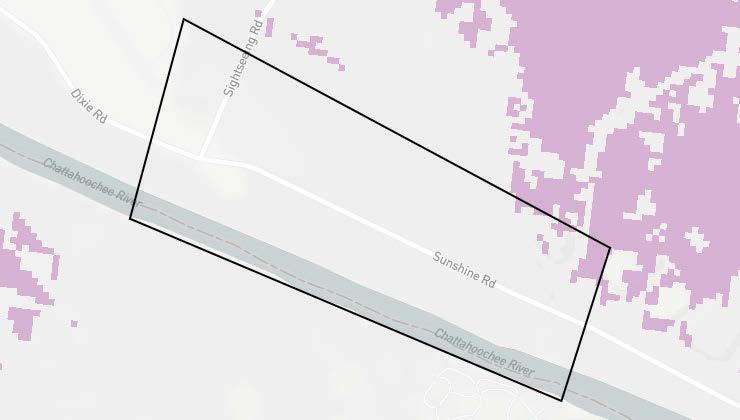
Priority for open pine conservation for focal bird species
High priority (score >80-100)
Medium-high priority (score >60-80)
Medium priority (score >40-60)
Medium-low priority (score >20-40)
Low priority (score 0-20)
Not a priority (not identified as upland pine)
PAGE 113 APPENDIX H: SECAS BLUEPRINT REPORT | LAUNDRY CREEK STREAM RESTORATION
Basemap credits: © Mapbox © OpenStreetMap Improve this basemap 0.9 miles
N 0.220.45 Southeast Conservation Blueprint Summary for Laundry Creek Restoration Area
https://blueprint.geoplatform.gov/southeast Page 9 of 34
Created 03/19/2024 using
Southeast Conservation Blueprint Summary for Laundry Creek Restoration Area
Table 5: Indicator values for east coastal plain open pine birds within Laundry Creek Restoration Area. A good condition threshold is not yet defined for this indicator.
Indicator Values: Priority for open pine conservation for focal bird species
To learn more and explore the GIS data, view this indicator in the SECAS Atlas
PAGE 114 APPENDIX H: SECAS BLUEPRINT REPORT | LAUNDRY CREEK STREAM RESTORATION
Acres Percent of Area ↑ High High priority (score >80-100) 0 0% Medium-high priority (score >60-80) 0 0% Medium priority (score >40-60) 0 0% Medium-low priority (score >20-40) 8.5 1.8% Low priority (score 0-20) 0 0% ↓ Low Not a priority (not identified as upland pine) 466 98.2% Total area474 100%
Created 03/19/2024 using https://blueprint.geoplatform.gov/southeast Page 10 of 34
Terrestrial Fire frequency
This indicator uses remote sensing to estimate the number of times an area has been burned from 2013 to 2021. Many Southeastern ecosystems rely on regular, low-intensity fires to maintain habitat, encourage native plant growth, and reduce wildfire risk. This indicator combines burned area layers from U.S. Geological Survey Landsat data and the inter-agency Monitoring Trends in Burn Severity program. Landsat-based fire predictions within the range of longleaf pine are also available through Southeast FireMap
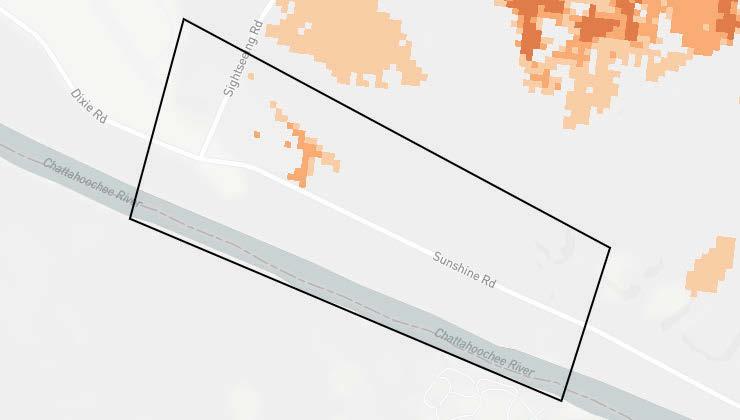
Burned 3+ times from 2013-2021
Burned 2 times from 2013-2021
Burned 1 time from 2013-2021
Not burned from 2013-2021 or row crop
PAGE 115 APPENDIX H: SECAS BLUEPRINT REPORT | LAUNDRY CREEK STREAM RESTORATION
Basemap credits: © Mapbox © OpenStreetMap Improve this basemap
0.9 miles
N
0.220.45
of 34
Southeast Conservation Blueprint Summary for Laundry Creek Restoration Area Created 03/19/2024 using https://blueprint.geoplatform.gov/southeast Page 11
Southeast Conservation Blueprint Summary for Laundry Creek Restoration Area
Table 6: Indicator values for fire frequency within Laundry Creek Restoration Area. Good condition thresholds reflect the range of indicator values that occur in healthy, functioning ecosystems.
To learn more and explore the GIS data, view this indicator in the SECAS Atlas
PAGE 116 APPENDIX H: SECAS BLUEPRINT REPORT | LAUNDRY CREEK STREAM RESTORATION
Indicator Values Acres Percent of Area ↑ High Burned 3+ times from 2013-2021 0 0% ↑ In good condition Burned 2 times from 2013-2021 4.4 0.9% Burned 1 time from 2013-2021 4 0.8% ↓ Not in good condition ↓ Low Not burned from 2013-2021 or row crop 466 98.2% Total area474 100%
Created 03/19/2024 using https://blueprint.geoplatform.gov/southeast Page 12 of 34
Terrestrial Intact habitat cores
This indicator represents the size of large, unfragmented patches of natural habitat. It identifies minimally disturbed natural areas at least 100 acres in size and greater than 200 meters wide. Large areas of intact natural habitat are important for many wildlife species, including reptiles and amphibians, birds, and large mammals. This indicator originates from Esri's green infrastructure data.
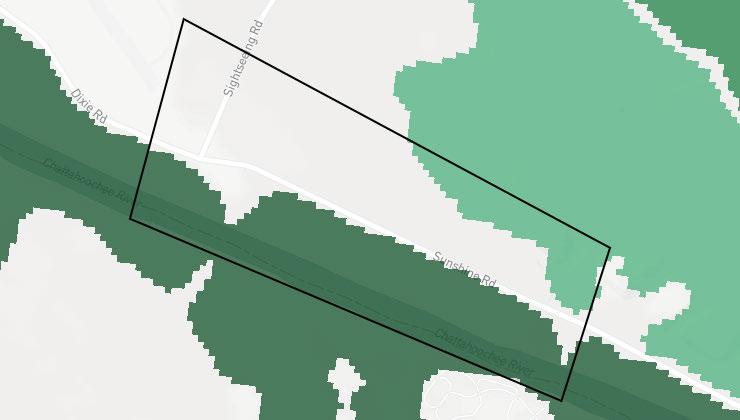
Large core (>10,000 acres)
Medium core (>1,000-10,000 acres)
Small core (>100-1,000 acres)
Not a core
PAGE 117 APPENDIX H: SECAS BLUEPRINT REPORT | LAUNDRY CREEK STREAM RESTORATION
Basemap credits: © Mapbox © OpenStreetMap Improve this basemap 0.9 miles
N 0.220.45 Southeast Conservation Blueprint Summary for Laundry Creek Restoration Area
https://blueprint.geoplatform.gov/southeast Page 13 of 34
Created 03/19/2024 using
Southeast Conservation Blueprint Summary for Laundry Creek Restoration Area Created
Table 7: Indicator values for intact habitat cores within Laundry Creek Restoration Area. Good condition thresholds reflect the range of indicator values that occur in healthy, functioning ecosystems.
To learn more and explore the GIS data, view this indicator in the SECAS Atlas
PAGE 118 APPENDIX H: SECAS BLUEPRINT REPORT | LAUNDRY CREEK STREAM RESTORATION
Acres Percent of Area ↑ High Large core (>10,000 acres) 190 40.0% ↑ In good condition Medium core (>1,000-10,000 acres) 0 0% Small core (>100-1,000 acres) 49 10.4% ↓ Low Not a core 236 49.6% ↓ Not in good condition Total area474 100%
Indicator Values
03/19/2024 using https://blueprint.geoplatform.gov/southeast Page 14 of 34
Terrestrial Resilient terrestrial sites
This indicator depicts an area's capacity to maintain species diversity and ecosystem function in the face of climate change. It measures two factors that influence resilience. The first, landscape diversity, reflects the number of microhabitats and climatic gradients created by topography, elevation, and hydrology. The second, local connectedness, reflects the degree of habitat fragmentation and strength of barriers to species movement. Highly resilient sites contain many different habitat niches that support biodiversity, and allow species to move freely through the landscape to find suitable microclimates as the climate changes. This indicator originates from The Nature Conservancy's Resilient Land data.
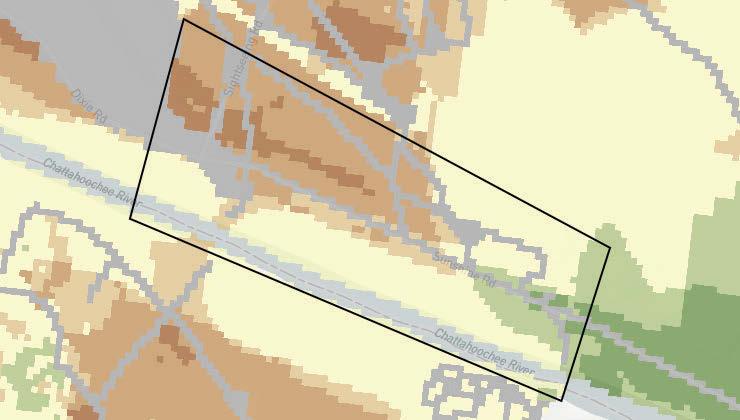
Most resilient
More resilient
Slightly more resilient
Average/median resilience
Slightly less resilient
Less resilient
Least resilient
PAGE 119 APPENDIX H: SECAS BLUEPRINT REPORT | LAUNDRY CREEK STREAM RESTORATION
0.9
Basemap credits: © Mapbox © OpenStreetMap Improve this basemap
miles
Developed N 0.220.45 Southeast Conservation Blueprint Summary for Laundry Creek Restoration Area
03/19/2024 using https://blueprint.geoplatform.gov/southeast Page 15 of 34
Created
Southeast Conservation Blueprint Summary for Laundry Creek Restoration Area
Table 8: Indicator values for resilient terrestrial sites within Laundry Creek Restoration Area. A good condition threshold is not yet defined for this indicator. Indicator
To learn more and explore the GIS data, view this indicator in the SECAS Atlas.
Created 03/19/2024 using https://blueprint.geoplatform.gov/southeast Page 16 of 34
PAGE 120 APPENDIX H: SECAS BLUEPRINT REPORT | LAUNDRY CREEK STREAM RESTORATION
Acres Percent of Area ↑ High Most resilient 0 0% More resilient 4.4 0.9% Slightly more resilient 29 6.1% Average/median resilience 162 34.2% Slightly less resilient 25 5.3% Less resilient 93 19.6% Least resilient 28 5.8% ↓ Low Developed 84 17.8% Area not evaluated for this indicator 49 10.3% Total area474 100%
Values
Terrestrial South Atlantic forest birds
This indicator is an index of habitat suitability for twelve upland hardwood and forested wetland bird species (wood thrush, whip-poor-will, American woodcock, red-headed woodpecker, Chuck-will's widow, hooded warbler, Kentucky warbler, Acadian flycatcher, Northern parula, black-throated green warbler, prothonotary warbler, Swainson's warbler) based on patch size and other ecosystem characteristics such as proximity to water and proximity to forest and ecotone edge. The needs of these species are increasingly restrictive at higher index values, reflecting better quality habitat. It originates from Southeast Gap Analysis Program and Designing Sustainable Landscapes bird habitat models.
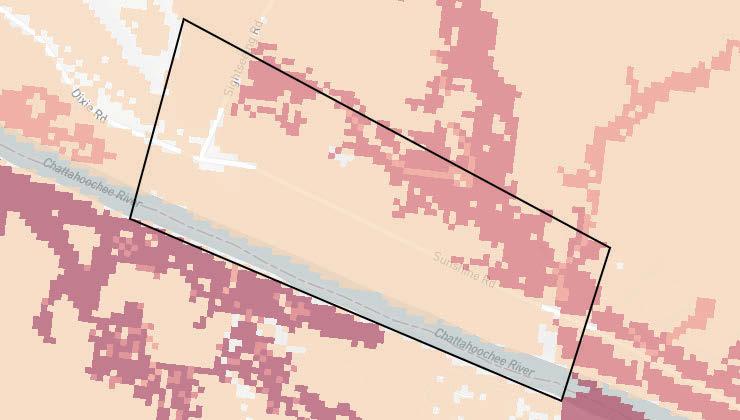
Very large patches near water (potential for presence of Swainson's warbler)
Large patches often near water (potential for presence of Northern parula, black-throated green warbler, or prothonotary warbler)
Medium patches (potential for presence of Acadian flycatcher)
Small patches often near water (potential for presence of hooded warbler or Kentucky warbler)
Very small patches or near open areas (potential for presence of wood thrush, whip-poor-will, red-headed woodpecker, Chuck-will's widow, or American woodcock)
Less potential for presence of forest bird index species
PAGE 121 APPENDIX H: SECAS BLUEPRINT REPORT | LAUNDRY CREEK STREAM RESTORATION
Basemap credits: © Mapbox © OpenStreetMap Improve this basemap
0.9 miles
N 0.220.45 Southeast Conservation Blueprint Summary for Laundry Creek Restoration Area Created 03/19/2024 using https://blueprint.geoplatform.gov/southeast Page 17 of 34
To learn more and explore the GIS data, view this indicator in the SECAS Atlas Southeast Conservation Blueprint Summary for Laundry Creek Restoration Area Created
Table 9: Indicator values for South Atlantic forest birds within Laundry Creek Restoration Area. Good condition thresholds reflect the range of indicator values that occur in healthy, functioning ecosystems.
PAGE 122 APPENDIX H: SECAS BLUEPRINT REPORT | LAUNDRY CREEK STREAM RESTORATION
Indicator Values Acres Percent of Area ↑ High Very large patches near water (potential for presence of Swainson's warbler) 0 0% ↑ In good condition Large patches often near water (potential for presence of Northern parula, black-throated green warbler, or prothonotary warbler) 0.22 <0.1% Medium patches (potential for presence of Acadian flycatcher) 91 19.2% Small patches often near water (potential for presence of hooded warbler or Kentucky warbler) 7.6 1.6% Very small patches or near open areas (potential for presence of wood thrush, whippoor-will, red-headed woodpecker, Chuckwill's widow, or American woodcock) 294 62.1% ↓ Not in good condition ↓ Low Less potential for presence of forest bird index species 81 17.1% Total area474 100%
https://blueprint.geoplatform.gov/southeast Page 18 of 34
03/19/2024 using
Freshwater Imperiled aquatic species
This indicator measures the number of aquatic animal Species of Greatest Conservation Need (SGCN) observed within each 12-digit HUC subwatershed, including fish, mussels, snails, crayfish, and amphibians. SGCN are identified in State Wildlife Action Plans as most in need of conservation action. This indicator captures patterns of rare and endemic aquatic species diversity. It originates from state Natural Heritage Program data collected by the Southeast Aquatic Resources Partnership and applies to the Environmental Protection Agency's estimated floodplain, which spatially defines areas estimated to be inundated by a 100-year flood (also known as the 1% annual chance flood).
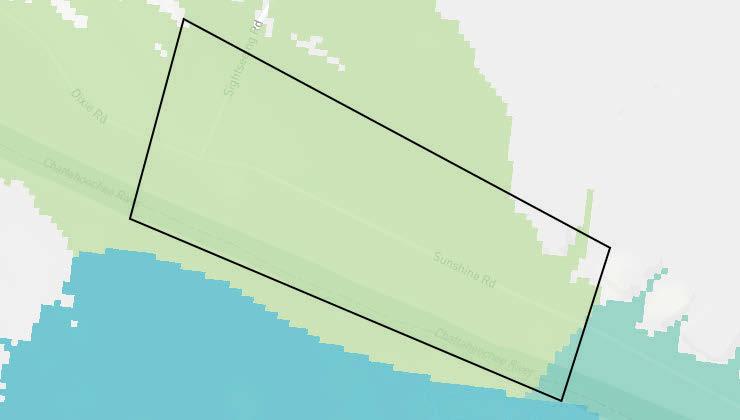
PAGE 123 APPENDIX H: SECAS BLUEPRINT REPORT | LAUNDRY CREEK STREAM RESTORATION
0.9
Number of aquatic animal Species of Greatest Conservation Need observed 8+ species 7 species 6 species 5 species 4 species 3 species 2 species 1 species 0 species Not identified as a floodplain (excluding West Virginia) N 0.220.45
03/19/2024 using https://blueprint.geoplatform.gov/southeast Page 19 of 34
Basemap credits: © Mapbox © OpenStreetMap Improve this basemap
miles
Southeast Conservation Blueprint Summary for Laundry Creek Restoration Area Created
Southeast Conservation Blueprint Summary for Laundry Creek Restoration Area
Table 10: Indicator values for imperiled aquatic species within Laundry Creek Restoration Area. A good condition threshold is not yet defined for this indicator.
Indicator
To learn more and explore the GIS data, view this indicator in the SECAS Atlas.
Created 03/19/2024 using https://blueprint.geoplatform.gov/southeast Page 20 of 34
PAGE 124 APPENDIX H:
BLUEPRINT REPORT | LAUNDRY CREEK STREAM RESTORATION
SECAS
Number of aquatic animal Species of Greatest Conservation Need observed Acres Percent of Area ↑ High 8+ species 0 0% 7 species 0 0% 6 species 0 0% 5 species 0 0% 4 species 0 0% 3 species 7.6 1.6% 2 species 452 95.3% 1 species 0 0% 0 species 0 0% ↓ Low Not identified as a floodplain (excluding West Virginia) 15 3.1% Total area474 100%
Values:
Freshwater Natural landcover in floodplains
This indicator measures the amount of natural landcover in the estimated floodplain of rivers and streams within each catchment. It assesses the stream channel and its surrounding riparian buffer, measuring the percent of unaltered habitat like forests, wetlands, or open water (rather than agriculture or development). Intact vegetated buffers within the floodplain of rivers and streams provide aquatic habitat, improve water quality, reduce erosion and flooding, recharge groundwater, and more. This indicator originates from the National Land Cover Database and applies to the Environmental Protection Agency's estimated floodplain, which spatially defines areas estimated to be inundated by a 100-year flood (also known as the 1% annual chance flood).

PAGE 125 APPENDIX H: SECAS BLUEPRINT REPORT | LAUNDRY CREEK STREAM RESTORATION
0.9
Percent natural landcover within the estimated floodplain, by catchment >90% natural landcover >80-90% natural landcover >70-80% natural landcover >60-70% natural landcover ≤60% natural landcover Not identified as a floodplain N 0.220.45 Southeast
Created 03/19/2024 using https://blueprint.geoplatform.gov/southeast Page 21 of 34
Basemap credits: © Mapbox © OpenStreetMap Improve this basemap
miles
Conservation Blueprint Summary for Laundry Creek Restoration Area
Southeast Conservation Blueprint Summary for Laundry Creek Restoration Area
Table 11: Indicator values for natural landcover in floodplains within Laundry Creek Restoration Area. Good condition thresholds reflect the range of indicator values that occur in healthy, functioning ecosystems.
To learn more and explore the GIS data, view this indicator in the SECAS Atlas.
PAGE 126 APPENDIX H: SECAS BLUEPRINT REPORT | LAUNDRY CREEK STREAM RESTORATION
Indicator Values: Percent natural landcover within the estimated floodplain, by catchment Acres Percent of Area ↑ High >90% natural landcover 40 8.4% ↑ In good condition >80-90% natural landcover 231 48.6% >70-80% natural landcover 165 34.7% ↓ Not in good condition >60-70% natural landcover 0 0% ≤60% natural landcover 24 5.1% ↓ Low Not identified as a floodplain 15 3.1% Total area474 100%
Created 03/19/2024 using https://blueprint.geoplatform.gov/southeast Page 22 of 34
Freshwater Network complexity
This indicator depicts the number of connected stream size classes in a river network between dams or waterfalls. River networks with a variety of connected stream classes help retain aquatic biodiversity in a changing climate by allowing species to access climate refugia and move between habitats. This indicator originates from the Southeast Aquatic Resources Partnership and applies to the Environmental Protection Agency's estimated floodplain, which spatially defines areas estimated to be inundated by a 100-year flood (also known as the 1% annual chance flood).
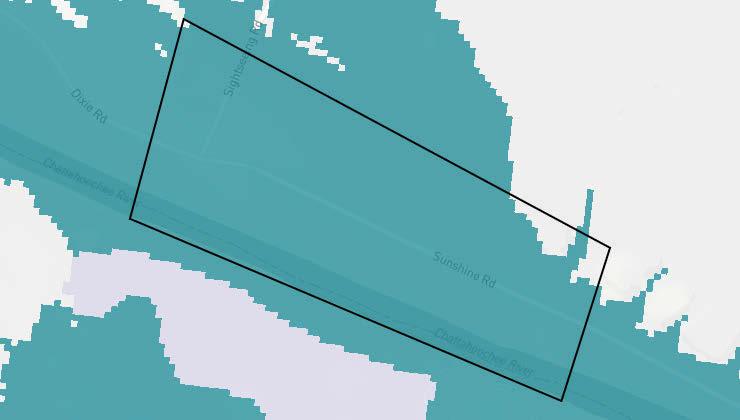
PAGE 127 APPENDIX H: SECAS BLUEPRINT REPORT | LAUNDRY CREEK STREAM RESTORATION
0.9
Number of connected stream size classes 7 size classes 6 size classes 5 size classes 4 size classes 3 size classes 2 size classes 1 size class Not identified as a floodplain N 0.220.45 Southeast Conservation Blueprint Summary for Laundry Creek Restoration Area
23 of 34
Basemap credits: © Mapbox © OpenStreetMap Improve this basemap
miles
Created 03/19/2024 using https://blueprint.geoplatform.gov/southeast Page
Southeast Conservation Blueprint Summary for Laundry Creek Restoration Area
Table 12: Indicator values for network complexity within Laundry Creek Restoration Area. Good condition thresholds reflect the range of indicator values that occur in healthy, functioning ecosystems.
To learn more and explore the GIS data, view this indicator in the SECAS Atlas.
PAGE 128 APPENDIX H: SECAS BLUEPRINT REPORT | LAUNDRY CREEK STREAM RESTORATION
Indicator Values: Number of connected stream size classes Acres Percent of Area ↑ High 7 size classes 0 0% ↑ In good condition 6 size classes 0 0% 5 size classes 459 96.9% 4 size classes 0 0% 3 size classes 0 0% ↓ Not in good condition 2 size classes 0 0% 1 size class 0 0% ↓ Low Not identified as a floodplain 15 3.1% Total area474 100%
Created 03/19/2024 using https://blueprint.geoplatform.gov/southeast Page 24 of 34
Freshwater Permeable surface
This indicator measures the average percent of non-impervious cover within each catchment. High levels of impervious surface degrade water quality and alter freshwater flow, impacting both aquatic species communities and ecosystem services for people, like the availability of clean drinking water. This indicator originates from the National Land Cover Database.

Percent of catchment permeable
>95% permeable (likely high water quality and supporting most sensitive aquatic species)
>90-95% permeable (likely declining water quality and supporting most aquatic species)
>70-90% permeable (likely degraded water quality and not supporting many aquatic species)
≤70% permeable (likely degraded instream flow, water quality, and aquatic species communities)
PAGE 129 APPENDIX H: SECAS BLUEPRINT REPORT | LAUNDRY CREEK STREAM RESTORATION
Improve
0.9 miles
Basemap credits: © Mapbox © OpenStreetMap
this basemap
N 0.220.45 Southeast Conservation Blueprint Summary for Laundry Creek Restoration Area
25 of 34
Created 03/19/2024 using https://blueprint.geoplatform.gov/southeast Page
Table 13: Indicator values for permeable surface within Laundry Creek Restoration Area. Good condition thresholds reflect the range of indicator values that occur in healthy, functioning ecosystems.
To learn more and explore the GIS data, view this indicator in the SECAS Atlas
PAGE 130 APPENDIX H: SECAS BLUEPRINT REPORT | LAUNDRY CREEK STREAM RESTORATION
Indicator Values: Percent of catchment permeable Acres Percent of Area ↑ High >95% permeable (likely high water quality and supporting most sensitive aquatic species) 443 93.4% ↑ In good condition >90-95% permeable (likely declining water quality and supporting most aquatic species) 0 0% ↓ Not in good condition >70-90% permeable (likely degraded water quality and not supporting many aquatic species) 31 6.6% ↓ Low ≤70% permeable (likely degraded instream flow, water quality, and aquatic species communities) 0 0% Total area474 100%
03/19/2024 using https://blueprint.geoplatform.gov/southeast Page 26 of 34
Southeast Conservation Blueprint Summary for Laundry Creek Restoration Area Created
Threats
Sea-level rise
Sea-level rise unlikely to be a threat (inland counties). Southeast Conservation Blueprint Summary for Laundry Creek Restoration Area Created
PAGE 131 APPENDIX H: SECAS BLUEPRINT REPORT | LAUNDRY CREEK STREAM RESTORATION
03/19/2024 using https://blueprint.geoplatform.gov/southeast Page 27 of 34
Urban growth
The FUTURES urban growth model predicts the likelihood that an area will urbanize at every decade from 2020 to 2100. Developed areas from the 2021 National Landcover Database serve as the baseline for current urban areas. The model simulates landscape change based on trends in population growth, local development suitability factors, and an urban patch-growing algorithm. It considers environmental drivers like distance to floodplain, slope, and available infrastructure, and even socio-economic status. The probability of urbanization for each area reflects how many times it urbanized out of 50 model runs.
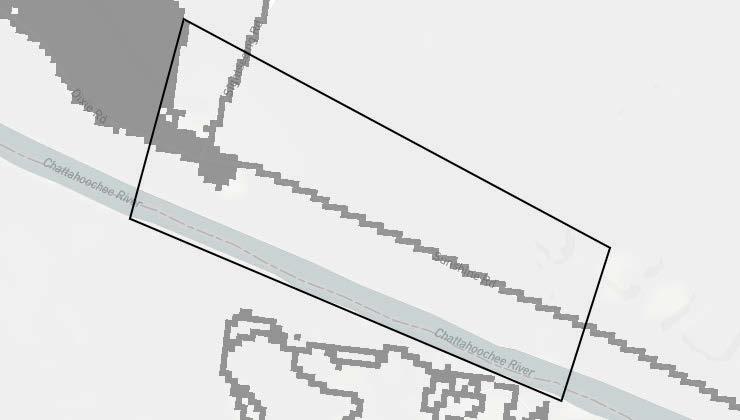
Probability of urbanization by 2060
Urban in 2021
Very high likelihood of urbanization (>50% probability)
High likelihood of urbanization (25 - 50% probability)
Moderate likelihood of urbanization (2 - 25% probability)
Not likely to urbanize 8.9% of this area is already urban in 2021, and an additional 0% has at least a moderate probability of urbanizing by 2060.
PAGE 132 APPENDIX H: SECAS BLUEPRINT REPORT | LAUNDRY CREEK STREAM RESTORATION
Basemap credits: © Mapbox © OpenStreetMap Improve this basemap
0.9 miles
N 0.220.45 Southeast Conservation Blueprint Summary for Laundry Creek Restoration Area
Created 03/19/2024 using https://blueprint.geoplatform.gov/southeast Page 28 of 34
Table 14: Extent of projected urbanization by decade within Laundry Creek Restoration Area. Values from FUTURES model projections for the contiguous United States developed by the Center for Geospatial Analytics, NC State University. 2060 corresponds to the SECAS goal: a 10% or greater improvement in the health, function, and connectivity of Southeastern ecosystems by 2060.
PAGE 133 APPENDIX H: SECAS BLUEPRINT REPORT | LAUNDRY CREEK STREAM RESTORATION
Decade Acres Percent of Area Urban in 2021 42 8.9% 2030 projected extent 42 8.9% 2040 projected extent 42 8.9% 2050 projected extent 42 8.9% 2060 projected extent 42 8.9% 2070 projected extent 42 8.9% 2080 projected extent 42 8.9% 2090 projected extent 42 8.9% 2100 projected extent 42 8.9% Not projected to urbanize by 2100 432 91.1% Total area474 100%
Page 29 of 34
Southeast Conservation Blueprint Summary for Laundry Creek Restoration Area
Created 03/19/2024 using https://blueprint.geoplatform.gov/southeast
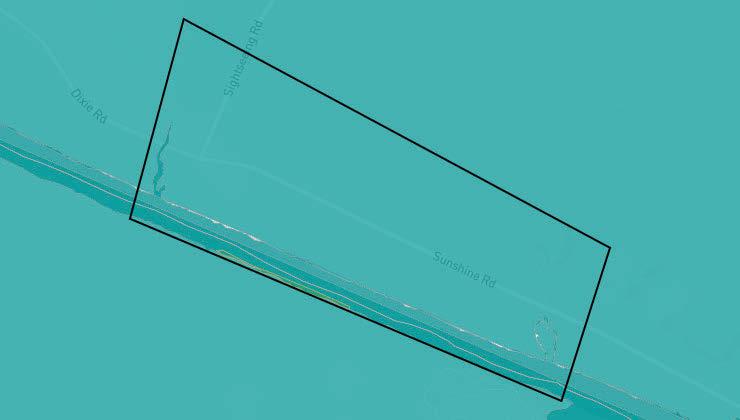
PAGE 134 APPENDIX H: SECAS BLUEPRINT REPORT | LAUNDRY CREEK STREAM RESTORATION
State/province
Local
Private non-profit
Designation Ownership
Ownership and Partners Conserved lands ownership Federal
Territorial Regional
Joint
conserved lands Private conservation land Tribal
unknown
Improve this
0.9 miles 0.220.45 Southeast Conservation Blueprint Summary for Laundry Creek Restoration Area Created 03/19/2024 using https://blueprint.geoplatform.gov/southeast Page 30 of 34
Basemap credits: © Mapbox © OpenStreetMap
basemap
Southeast Conservation Blueprint Summary for Laundry Creek Restoration Area Created
Table 15: Extent of ownership class within Laundry Creek Restoration Area. Protected areas are derived from the Protected Areas Database of the United States (PAD-US v3.0) and include Fee, Designation, Easement, Marine, and Proclamation (Dept. of Defense lands only) boundaries. Note: areas are based on the polygon boundary of this area compared to protected area polygons, rather than pixel-level analyses used elsewhere in this report. Also note: PAD-US v3.0 includes protected areas that may overlap within a given area; this may cause the area within and between the following categories to be greater than the actual ground area.
PAGE 135 APPENDIX H: SECAS BLUEPRINT REPORT | LAUNDRY CREEK STREAM RESTORATION
Ownership Acres Percent of Area State/province 2.4 0.5% Designation 520 100.0%
31 of 34
03/19/2024 using https://blueprint.geoplatform.gov/southeast Page
Land protection status
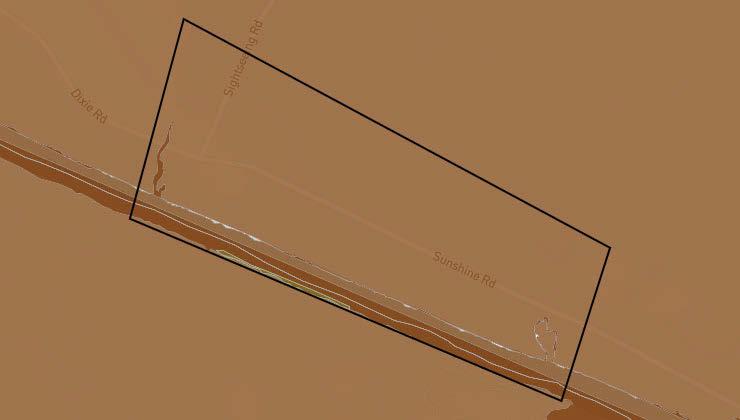
Managed for biodiversity (disturbance events proceed or are mimicked)
Managed for biodiversity (disturbance events suppressed)
Managed for multiple uses (subject to extractive uses such as mining or logging, or OHV use)
No known mandate for biodiversity protection
PAGE 136 APPENDIX H: SECAS BLUEPRINT REPORT | LAUNDRY CREEK STREAM RESTORATION
0.9
0.220.45 Southeast Conservation Blueprint Summary for Laundry Creek Restoration Area
https://blueprint.geoplatform.gov/southeast Page 32 of 34
Basemap credits: © Mapbox © OpenStreetMap Improve this basemap
miles
Created 03/19/2024 using
• Southeast Conservation Blueprint Summary for Laundry Creek Restoration Area Created
Table 16: Extent of land protection status within Laundry Creek Restoration Area. Protected areas are derived from the Protected Areas Database of the United States (PAD-US v3.0) and include Fee, Designation, Easement, Marine, and Proclamation (Dept. of Defense lands only) boundaries. Note: areas are based on the polygon boundary of this area compared to protected area polygons, rather than pixel-level analyses used elsewhere in this report. Also note: PAD-US v3.0 includes protected areas that may overlap within a given area; this may cause the area within and between the following categories to be greater than the actual ground area.
Protected Areas
•
Fort Benning (445 acres)
•
Walter F. George Lake (75 acres)
State-owned Submerged Lands (State of Alabama; 2 acres)
Nearby land trusts
Click here to search for land trusts within 25 miles of this area on the Land Trust Alliance website.
PAGE 137 APPENDIX H: SECAS BLUEPRINT REPORT | LAUNDRY CREEK STREAM RESTORATION
Land Protection Status Acres Percent of Area Managed for multiple uses (subject to extractive uses such as mining or logging, or OHV use) 2.4 0.5% No known mandate for biodiversity protection 520 100.0%
using https://blueprint.geoplatform.gov/southeast Page 33 of 34
03/19/2024
Southeast Conservation Blueprint Summary for Laundry Creek Restoration Area
Credits
This report was generated by the Southeast Conservation Blueprint Explorer, which was developed by Astute Spruce, LLC in partnership with the U.S. Fish and Wildlife Service under the Southeast Conservation Adaptation Strategy
Data credits
Land ownership and conservation status is derived from the Protected Areas Database of the United States (PAD-US v3.0).
Future urban growth estimates derived from FUTURES model projections for the contiguous United States developed by the Center for Geospatial Analytics, NC State University.
Sea level rise data are derived from the National Oceanic and Atmospheric Administration's Sea Level Rise Inundation Depth Data and the 2022 Sea Level Rise Technical Report
PAGE 138 APPENDIX H: SECAS BLUEPRINT REPORT | LAUNDRY CREEK STREAM RESTORATION
Created 03/19/2024 using https://blueprint.geoplatform.gov/southeast Page 34 of 34
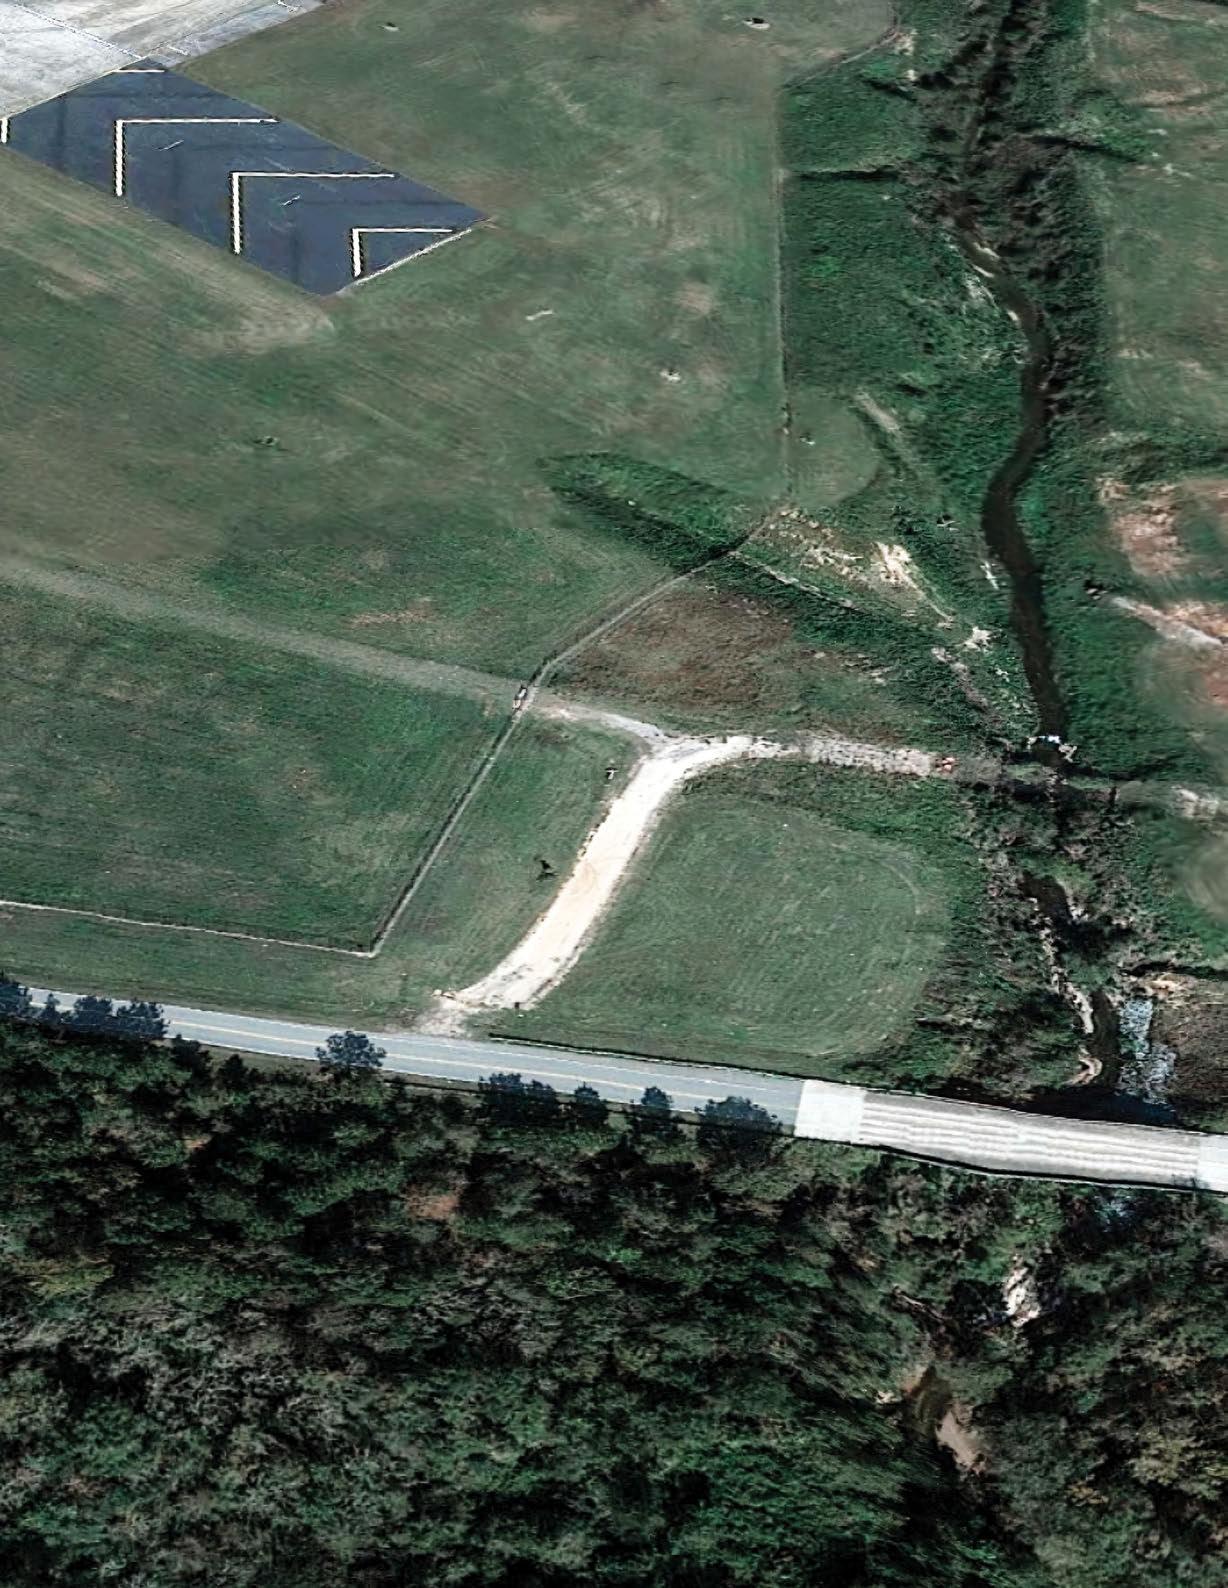
Scan the QR Code to download a digital version of this document.
Carl Vinson Institute of Government Institute for Resilient Infrastructure Systems College of Engineering College of Environment + Design Warnell School of Forestry & Natural Resources
Carl Vinson Institute of Government Institute for Resilient Infrastructure Systems College of Engineering College of Environment + Design Warnell School of Forestry & Natural Resources
