Soy Conversion Factors
Technical supporting document
This report was commissioned by Round Table on Responsible Soy Association (RTRS) (“RTRS”) to 3Keel LLP, and shall not be copied, displayed, distributed, printed, licensed, modified, published, reproduced, sold, transmitted, used to create a derivative work, or otherwise used for public or commercial purposes without the prior written consent of RTRS.
ROUND TABLE ON RESPONSIBLE SOY ASSOCIATION (RTRS) — 2
ROUND TABLE ON RESPONSIBLE SOY ASSOCIATION (RTRS) — 3 Contents Introduction ............................................................................................................. Selecting soy conversion factors ............................................................................. 6 Calculating soybean equivalent ............................................................................... References ............................................................................................................... Appendix I: Universidad Austral Study ................................................................... Appendix II: Publicly available sources of conversion factors ............................... 4 8 10 12 57
Introduction
As awareness of the environmental and social impacts of soy production has risen amongst the general population, organisations are taking a more active interest in ensuring that the soy used in their supply chains is sourced sustainably.
However, unlike other commodities, such as timber and palm oil, soy is often not visible in the final product or used directly in the product manufacturing process, making usage more difficult to quantify. Downstream users of soy often have limited understanding of the volume of soy used in their products as they are far removed from the primary producers and traders that handle soy. Instead, they often buy different soy products, or composite products that either are pre-mixed with soy (e.g. feed) or have embodied soymeal in their livestock production (e.g. meat, eggs, milk). Even direct users of soy often purchase soy products (e.g. oil, meal, hull) which have undergone processing and may not be aware of how many soybeans are produced in order to meet their needs.
The RTRS Conversion Factor System exists as a tool to increase understanding of soy usage and can be used by actors in the soy sector and the interested public. A set of conversion factors are used, based on academic research into soybean processing into multiple products and livestock supply chains for an average soybean equivalent footprint regardless of where it is produced. These conversion factors specify how many units of soybean equivalent have been used as an input in the production of one unit of a product. Conversion factors are available for different soy products, livestock feed or food.
In calculating the soy conversion factor for a product, two separate challenges exist:
1. How much soy is used in the production of soy products (e.g. soy oil, soy meal), livestock feed or food?
2. How can this requirement be reflected at an organisation level when production occurs in multiple supply chains around the world?
To address the first challenge RTRS commissioned research from Universidad Austral, in Argentina, assessing the soybean requirements and uses for different soy products. For the second challenge, RTRS commissioned research into existing publicly available studies that could best reflect the average use of soy for various products and livestock products.
This paper provides the technical details regarding the selection of the factors presented in the RTRS Conversion Factor System and put it in a tool, the Soy Footprint Calculator. It addresses the main decisions and sources reviewed in compiling the dataset to improve transparency regarding this important step in increasing the understanding of how many soybeans are required to satisfy market demand. Two conversion factors are presented based on the way in which soybean demand can be understood to occur:
Economic Allocation – Under this method it is recognised that there are multiple uses of soybeans and any one use will have associated byproducts that will be applied in other sectors (e.g. lecithin production will result in soy oil, meal and hulls in addition to the lecithin). The allocation method therefore occurs by aligning the demand to value of the various outputs to fairly represent how soybean demand is not always driven by one particular output.
Demand Allocation – Under this method the physical volume of soybeans needed to supply enough materials for the product is presented. This does not account for the use of any by/sub-products from the manufacturing process (e.g. to have a tonne of soy lecithin a certain volume of soybeans are needed).
ROUND TABLE ON RESPONSIBLE SOY ASSOCIATION (RTRS) — 4
Type Product
Soy product
Soymeal (high-pro)
Soymeal (low-pro)
Soy crude oil (with gums)
Soy hull
Soy crude oil (degummed)
Soy lecithin
Biodiesel
Glycerol
Refined oil
Livestock feed
Cattle (Beef)
Cattle (Dairy)
Farmed fish
Poultry (laying)
Poultry (meat)
Livestock product (carcass weight)
Livestock product (retail weight)
Pork Beef Pork Chicken Farmed fish Beef Pork Chicken Farmed fish Eggs Milk Butter Cheese Chocolate Yoghurt Cream
Tonnes soy per tonne of product
Soybean equivalent (economic) 0.727 0.727 2.274 0.334 2.293 1.656 2.697 1.264 2.602 0.064 0.095 0.246 0.105 0.210 0.074 0.245 0.303 0.595 0.473 0.379 0.446 0.675 0.537 0.462 0.031 0.204 0.154 0.052 0.034 0.091
Soybean equivalent (demand) Primary source
1.389 1.274 5.000 15.385 5.155 166.667 6.369 58.824 5.848 0.403 0.979 0.471 0.199 0.391 0.364 1.546 1.536 1.108 0.903 2.377 2.257 1.257 1.025 0.881 0.311 2.034 1.532 1.123 0.335 0.909
Universidad Austral Universidad Austral Universidad Austral Universidad Austral Universidad Austral Universidad Austral Universidad Austral Universidad Austral Universidad Austral
Hoste (WUR) Hoste (WUR)
Profundo
Hoste (WUR) Hoste (WUR) Hoste (WUR)
Profundo Profundo Hoste (WUR & IDH) Profundo Profundo Profundo Hoste (WUR & IDH) Profundo Profundo Profundo Profundo Profundo Profundo Profundo Profundo
ROUND TABLE ON RESPONSIBLE SOY ASSOCIATION (RTRS) — 5
Selecting soy conversion factors
There are a number of studies identifying conversion factors for soy, but the factors given vary significantly. RTRS commissioned 3Keel LLP – a specialist sustainability consultancy – to conduct a structured literature review process - including the RTRS commissioned soybean product study undertaken by Universidad Austral - to identify the most appropriate factors existing publicly available factors for RTRS based on the need to have a single set of global factors applicable to all actors of the soy value chain. This five-step process is described in greater detail in this section.
Identifying sources
Searches were conducted using a range of academic and public search engines (e.g. Academic Search Complete) using relevant key words in various combinations, such as “soy conversion”, “footprint”, “feed mix”. Each source was reviewed and a judgement was made as to whether that source was relevant and could contain an appropriate soy conversion factor for use by RTRS. References in the bibliography were also assessed so that additional relevant sources could be included.
Selecting sources for assessment
Papers which did not include novel data or sources (i.e. they only referenced another literature source for the factors presented), or which had later been replaced by more updated versions, were deselected from the review process.
Assessing sources
A scoring method was created in order to provide an objective method for assessing the suitability of each source. Scores, on a scale of 1-4 were given for the following indicators in light of the requirements for the RTRS Soy Footprint Calculator:
ROUND TABLE ON RESPONSIBLE SOY ASSOCIATION (RTRS) — 6
Identify Suitable Sources Select Appropriate Studies Assess
Quality
Select
Factors from Studies
Calculate
Additional Factors
Indicator
Transparency of method
Reliability of method
Reliability of sources
Geographical applicability
Frequency of use
Range of proteins studied
Description
Are the method and significant assumptions explained?
Are data and calculations used conducive to accurate factors?
Are sources used conducive to accurate factors?
Does data used cover a wide range of countries?
How often are factors cited by other sources?
How many factors does the source provide for RTRS Soy Footprint Calculator use?
A summary of each source reviewed and the accompanying scoring is provided in the Appendix.
Selecting factors for use in RTRS calculator
Two approaches were applied in selecting sources once they have been scored:
1) Limited factor availability - Where there is only one existing conversion factor for a protein type, this has been used.
2) Multiple factor availability - The two sources which score most highly in the quality review process were compared for similarities and differences and a decision made on the basis of this. Although an objective process was applied to short list these factors, a subjective judgement was applied in some scenarios where expert judgement indicated that one value may be more appropriate than another.
In general, there is not an existing widely available dataset that is comparable or a single representative factor for the various products being reviewed. The variability of production systems, feed rations, and species types all contribute to not being able to be fully captured in having just one factor for the world. However, in the interests of the users and the availability of information that users are likely to have on these matters themselves, the selected factors are considered fit for purpose. Organisations are encouraged to engage their supply chains to understand their specific soy footprints as part of their wider engagement approaches for supporting sustainable soybean production.
Calculating additional factors
For some products, no factors could be selected from the existing research available. This was either because factors did not exist (e.g. chocolate) or because the existing research used assumptions when calculating the conversion factor for a dairy product (e.g. cheese, butter) which were deemed to be not representative of actual production practices.
In the first case, a conversion factor was found using the average volume of livestock and soy ingredients within a unit of the product, based on product specifications of different chocolate varieties. This information was then combined with existing conversion factors (i.e. for milk) in order to find a conversion factor for chocolate.
In the latter case, guidelines from Dairy UK, DairyCo and the Carbon Trust (2010) were used for allocating impacts to different dairy products. This allocation is based on the dry mass percentage of each dairy product, which correlates with economic value. Under this method, dairy products with a high dry mass percentage have a higher soy footprint compared to those with a low dry mass percentage.
ROUND TABLE ON RESPONSIBLE SOY ASSOCIATION (RTRS) — 7
Calculating soybean equivalent
Conversion factors found from the existing literature showed that most livestock feed used multiple soy products in their production. Soy meal, hull, oil and whole soybean were most commonly used. Each has their own specific qualities and uses, so whilst existing research into conversion factors regards each equally (with the exception of hull, which is often discounted as being a byproduct itself), the factors in the RTRS Soy Footprint Calculator go beyond this to reflect the differences between each soy product.
To address the matter of what is a byproduct – and thus a driver of soybean production –two different footprints are provided.
Demand allocation
The demand model for allocation of soy products is useful for understanding demand when a soy product makes up only a small proportion of the output of the processing of soybeans, but a large amount of soy is used. This approach shows the actual soybean demand and is helpful in illustrating the actual volume of soybeans needed to be produced to create a product.
Figure 1. Soy products derived from processing (high-pro process). Reproduced from ‘Soybean conversion factors’ by Austral University.
To inform the soybean equivalent for different soy products, a model on the volumes of soy product produced per 1 tonne soybean was commissioned by RTRS to Austral University. The outputs from this model were used to calculate soybean equivalent for each soy product by dividing 1 by the volume of each soy product which can be obtained after processing one unit of soybeans. Values are mostly used from the high-pro process rather than low-pro process, as this includes hull. These values are shown in Figure 1.
ROUND TABLE ON RESPONSIBLE SOY ASSOCIATION (RTRS) — 8
Crude Oil Crude Oil
Biodiesel
Lecithin
Glycerol Refined
Oil
Soymeal (high pro) Hull pellets 0.200 tonnes 0.194 tonnes 0.157 tonnes 0.006 tonnes 0.017 tonnes 0.171 tonnes OR 0.720 tonnes 1 tonne soybeans 0.065 tonnes
Soy product
High-pro soybean meal
Low-pro soybean meal
Soy crude oil (with gums)
Hull
Soy lecithin
Soy crude oil (without gums)
Soy refined oil
Biodiesel
Glycerol
Tonnes soy product per tonne soybean 1.39 1.27 5.00 15.38 166.67 5.15 5.85 6.37 58.82
Tonnes soybean equivalent per tonne soy product
0.72 0.79 0.20 0.07 0.01 0.19 0.17 0.16 0.02
A user of the calculator may wish to use this model because it is transparent and shows a clear link to how many soybeans are needed to produce a soy product. However, this model may be seen to show a disproportionately large demand requirement for both low value products (e.g. hulls) or those that produce very little product on a per soybean basis (e.g. lecithin). It also ignores the value of other parts of the soybean which can be used after processing.
Economic allocation
Two principles sit behind the economic model of allocation of soy products:
1. Soybean production is driven by the soy products which have the highest share of the value of production outputs from one tonne of soybeans.
2. The soybean equivalent of all the products derived from one tonne of soybean should sum up to one tonne of soybean equivalent.
To inform the model, information on how much of each soy product can be produced per tonne of soybean was used from the Austral University model. A number of different sources were used to provide an economic value for each product, as shown in the table below, and these allocations will vary from time to time as the market fluctuates.
The method for calculating economic soybean equivalent is shown below using the equation below. The value of outputs after processing of one tonne soybeans varies depending on the soy product because the outputs may vary depending on the production process used, as shown in Figure 1.
Soybean equivalent pf soy product = Tonnes soybean required to produce 1 tonne of soy product
% value of total outputs from processing linked to that soy product
ROUND TABLE ON RESPONSIBLE SOY ASSOCIATION (RTRS) — 9
Soy product Source
$ / t soy coproduct $ soy product/ t soybeans after processing
$ all outputs/ t soybeans after processing
t soybean equivalent per t coproduct
Soy crude oil (with gums)
Soybean meal
Soy hull Soy lecithin Crude oil (degummed)
Biodiesel
Glycerol
Refined oil
IMF Commodity Index IMF Commodity Index USDA EU Merger Procedure Indexmundi Neste Oleoline Investing.com
A user of the calculator may wish to use this model because it recognizes the value of different soy products used. However, there is the possibility that this model could lead to misleading demand requirements for soy when high value outputs are not demand drivers.
Price update methodology
A number of different sources were used to provide an economic value for each soy product, as shown in the table below. These values are updated annually to reflect market fluctuations, and this is the first update to the economic values for soy since the calculator was first launched in 2020. Whilst there may be fluctuations between the date of annual price updates, an overall increase or decrease to the price of soy or corn products will not affect the economic allocation – this is only affected by a change in the cost of soy or corn products in relation to each other. Therefore, in each update, efforts are made to ensure that the prices used are as close as possible in date to one another.
Commodity prices are sourced using one of the following, in order of preference. If, for example, no source is found from the IMF Commodity Index, the next available source in the order is used.
1. IMF Commodity Index
2. Official government source (e.g. USDA)
3. Indexmundi or similar commodity market price platform
4. Other sources identified with internet searches using key words In updating the prices, there were 2 steps to the process:
1. Searches are used to identify if a preferable source is available for the price of that product.
2. If no preferable source is identified, the source used previously is reviewed for any updates.
The most recent price update relates to 2021. Therefore, where possible, an annual average for 2021 is used. This is either given in the source or calculated using an average of prices for each month of the year. When it is not possible to give an annual range for 2021, the most recent available date is used. This is ideally within 2021 but in some cases may be earlier.
Once the price value is identified, this is used to calculate the whole soybean equivalent for that product and other products included in the soy and corn calculator. The method for this is explained in the supporting technical documents for soy and corn, subject to one small change for soy oil derivatives with more than one step of processing, which has been refined to better account for loss of materials in processing. The formula for soybean equivalent of derivatives can therefore be expressed as follows:
ROUND TABLE ON RESPONSIBLE SOY ASSOCIATION (RTRS) — 10
1292 413 190 1.000 1385 1688 791 1703 258 297 12 6 269 265 13 291 568 568 568 584 584 594 594 607 2.274 0.727 0.334 1.656 2.293 2.697 1.264 2.602
Soybean equivalent pf soy product = Tonnes soybean required to produce 1 tonne of soy product
% value of total outputs from processing linked to that soy product
Where there is only one step of processing, please note that this can be simplified to the formula:
Soybean equivalent pf soy product = Value of one t soy product Combined value of outputs after processsing one t
Where there is more than one step of processing (i.e. for refined oil):
Soy product Source
$ / t soy coproduct
$ soy product/ t soybeans after processing
$ all outputs/ t soybeans after processing
Soy crude oil (with gums) Soybean meal Soy hull Soy lecithin Crude oil (degummed)
Biodiesel Glycerol Refined oil
References
IMF Commodity Index IMF Commodity Index USDA EU Merger Procedure Indexmundi Neste Oleoline Investing.com
190 1.000
t soybean equivalent per t coproduct
2.274 0.727 0.334 1.656 2.293 2.697 1.264 2.602
Austral University (2019) Soybean conversion factors.
CGF (2016) Calculation guidelines for the measurement of embedded soy usage in consumer goods businesses. Available at: https://www.theconsumergoodsforum.com/wp-content/uploads/2017/10/201605CGF-and-KPMG-Soy-Measurement-Guidance-Final-1.pdf.
Commission of the European Communities (2006) REGULATION (EC) No 139/2004
MERGER PROCEDURE. Available at: https://ec.europa.eu/competition/mergers/cases/decisions/ m3975_20060329_20682_en.pdf.
Dairy UK, DairyCo and Carbon Trust (2010) Guidelines for the Carbon Footprinting of Dairy Products in the UK. Available at: https://dairy.ahdb.org.uk/resources-library/research-development/environment/carbonfootprinting-dairy-products-in-the-uk/#.Xt4jwmhKjZs.
ECVC and Eco Ruralis (2018) The trouble with soy. Available at: https://www.eurovia.org/wp-content/ uploads/2018/08/Report-The-trouble-with-soy-2018-compressed.pdf.
Efeca (2018) UK Roundtable on Sustainable Soya: Baseline study 2018. Available at: http://www.efeca.com/ wp-content/uploads/2018/11/UK-RT-on-Sustainable-Soya-baseline-report-Oct-2018.pdf.
FAO (2006) Livestock’s long shadow. Available at: http://www.fao.org/3/a-a0701e.pdf.
ROUND TABLE ON RESPONSIBLE SOY ASSOCIATION (RTRS) — 11
1292 413
1385 1688 791 1703 258 297 12 6 269 265 13 291 568 568 568 584 584 594 594 607
Friends of the Earth (2008) What’s feeding our food? Available at: https://friendsoftheearth.uk/sites/default/ files/downloads/livestock_impacts.pdf.
Hoste (Waginengen Economic Research & IDH) (2016) Soy footprint of animal products in Europe. Available at: https://edepot.wur.nl/391055.
Hoste (Waginengen Economic Research) (2014) Sojarverbruik in de Nederlandse diervoederindustrie 20112013. Available at: https://edepot.wur.nl/316027.
Hoste and Bulhuis (Waginengen Economic Research) (2010) Sojaverbruik in Nederland. Available at: http:// edepot.wur.nl/157676.
IDH (2019) European Soy Monitor. Available at: https://www.idhsustainabletrade.com/uploaded/2019/04/ European-Soy-Monitor.pdf.
IMF (2021) Commodity Prices. Available at: https://www.imf.org/en/Research/commodity-prices.
Indexmundi (2021) Commodity price indices. Available at: https://www.indexmundi.com/ Investing.com (2021) Refined soy oil. Available at: https://www.investing.com/commodities/ncdex-soyoil-futures-technicalcommodities/?commodity=soybean-oil"https://www.indexmundi.com/commodities/ Jennings, Sheane and McCosker (3Keel) (2017) Deforestation and social risks in the UK’s commodity supply chains. Available at: https://www.wwf.org.uk/sites/default/files/2017-10/Risky%20Business%20-%20 October%202017.pdf.
Kroes and Kuepper (Profundo) (2015) Mapping the soy supply chain in Europe. Available at: https://wwfeu. awsassets.panda.org/downloads/mapping_soy_supply_chain_europe_wwf_2015.pdf
Neste (2021) Biodiesel prices (SME & FAME). Available at: https://www.neste.com/corporate-info/investors/ market-data/biodiesel-prices-sme-fame.
Oleoline (2020) Glycerine market report. Available at: http://www.hbint.com/datas/ media/590204fd077a6e381ef1a252/sample-quarterly-glycerine.pdf.
Schreiber, Villa Garcia & Allen (3Keel) (2019) Moving to deforestation free animal feed. Available at: https:// www.3keel.com/wp-content/uploads/2019/10/3keel_soy_report_2019.pdf
Sustainable Food Trust (2017) Are dairy cows and livestock behind the growth of soy in South America? Available at: https://sustainablefoodtrust.org/articles/dairy-cows-livestock-behind-growth-soya-southamerica/.
Van Gelder, Kuepper & Vrins (Profundo) (2014) Soy barometer 2014: A research report for the Dutch Soy Coalition. Available at: https://www.bothends.org/uploaded_files/inlineitem/1Background_research_ report_Soy_Barometer_2014.pdf.
WWF (2014) The Growth of Soy. Available at: http://awsassets.wwfdk.panda.org/downloads/wwf_soy_ report_final_jan_19.pdf.
ROUND TABLE ON RESPONSIBLE SOY ASSOCIATION (RTRS) — 12
Soybean conversion factors
ROUND TABLE ON RESPONSIBLE SOY ASSOCIATION (RTRS) — 13 Appendix I Austral University Study
Professors Roberto Feeney and Sergio Grossman April 4, 2019
This document is an exclusive property of Round Table on Responsible Soy Association (RTRS) “(RTRS).”
The information and materials contained in the document shall not be copied, displayed, distributed, printed, otherwise licensed, modified, published, reproduced, sold, transmitted, used to create a derivative work, or otherwise used for public or commercial purposes. Any reproduction, copy, alteration, modification or undue use of the information and material contained herein without prior written consent of RTRS is forbidden and constitutes a criminal offence. All charts, tables, graphs, information, materials, contents, pictures, texts included or displayed or related to this document are duly registered and the exclusive property of RTRS. Total or partial reproduction by any means is, therefore, forbidden.
RTRS’s exclusive property on this document is protected by Copyright Law No. 11,723. Total or partial alteration or distortion, reproduction or public display of this work without the express written consent of RTRS constitutes a criminal offence as typified by the legislation in force, as well as by international Copyright conventions and treaties.
ROUND TABLE ON RESPONSIBLE SOY ASSOCIATION (RTRS) — 14
Table of contents
Introduction and objectives
Chapter I: key elements in soybean conversion
The Soybean Soy Composition
Soy Industrial Quality
Key Elements in Soybean Conversion
Chapter II: soybean processing
First Soybean Processing Reception
Preparation
Extraction
Second Soybean Processing Neutralization
Transesterication
Chapter III: Conversion Factors
Measurement of the Conversion Factors Keys of the Conversion Factors Process Losses 27 Yield Drivers
Chapter IV: Soybean by-products and their uses in the food, cosmetic, pharmaceutical and energy industries
Crude Oil
Soybean Meal Soybean Hull Pellet
Soy Lecithin
Biodiesel Glycerol
Refined Soybean Oil
Summary
Annexes
ANNEX 1: About Universidad Austral
ANNEX 2 : About the Authors
Glossary
Sources of Information
References
Other Sources of Information
ROUND TABLE ON RESPONSIBLE SOY ASSOCIATION (RTRS) — 15
15 17 17 19 20 25 23 25 25 30 33 34 34 34 36 36 36 37 37 40 40 40 41 41 42 43 44 45 47 47 49 51 52 52 56
Introduction and Objectives
Soybean has become one of the most important and profitable world crops, ranking fourth based on planted area and production¹ (FAOSTAT, 2019).
Soybeans are a significant and cheap source of protein, oil and metabolizable energy. Oil and soybean meal are the two main economical components of soybean (Patil et al., 2017). Its value lies in the fact that it is a raw material for balanced feed fed to poultry, pigs, and bovines. Besides, it is also an ingredient of food products and a raw material for the production of biofuels and oils (USDA, December 2018).
World soy production has increased significantly in the past ten years, from 212 million tons produced in 2008 to 360 million in 2018. Soybean is grown in approximately 125 million hectares worldwide. Production increase results from soybean primary uses as a good protein-content and low-price component of animal diets. Besides, soybean is a raw material for the production of biofuels and oils (USDA, December 2018).
The US is the largest producer of soybeans, accounting for, approximately 35% of the total production (120 million tons a year, on average). Meanwhile, Mercosur, the Southern Common Market established by Brazil, Argentina, Paraguay, Bolivia, and Uruguay produces almost 55% of the total world production.
Brazil is the leading producer, with almost 115 million tons, followed by Argentina with 55 M, Paraguay with 10 M, Uruguay with 5 M, and Bolivia with 2.7 M (USDA, December 2018).
Most of the world’s soybeans are crushed (soybean crushing) to produce, in this first processing, soy oil and soybean meal². China, the US, Brazil, and Argentina are the world leaders in soy oil and soy meal production. China ranks fourth as a soy producer with 16 M tons and, in 2019, crushed about 90 M tons. It means that China is the number one buyer and importer of soybeans for crushing.
The first stage of the soybean crushing results in the extraction of crude oil, meal, hull pellet, and lecithin. Biodiesel, glycerol or refined oil are the products of the second industrial processing. Lecithin and glycerol are used as ingredients in over 1,000 food products. These by-products also have industrial and pharmaceutical uses.
This report researches and analyses the soybean conversion factors in the different by-products, that is, the different yields of industrial soybean processing, expressed as percentages.
Each stage of the production processes (Chapter II) was analyzed, and the conversion factors (Chapter III) were estimated. This report ends by summarizing the main characteristics and uses of the different by-products of soybean (Chapter IV).
Maize, wheat and rice production volumes are larger than soybean volumes.
We are using oil and meal as generic terms. The report further explains the di$erent technical characterizations of oil and meal.
ROUND TABLE ON RESPONSIBLE SOY ASSOCIATION (RTRS) — 16
¹
²
The methodology included collecting information from different sources, consultations with industry experts and professors offering diverse views and located in various geographical points, mainly Argentina, Brazil, the US, and some European countries. Interviews were held with technical experts specialized in seed quality and soybean crushing facilities, as well as in biofuels refining and extraction.
The analysis was completed with a thorough review of the literature on seed quality, oil extraction and processing technologies, and uses of soybean by-products.
Finally, data obtained by crossing information from the literature review and the empirical knowledge gathered in the interviews with industry experts were duly validated.
This report concludes strongly sustained by five fundamental pillars: the references, the academia, the experts, the crushing industry and the intermediate institutions3 that supplied the information required to make a rigorous and representative estimation of each soybean conversion factor.
As this report clearly explains, soybean processing is standardized worldwide, and the crushing facilities are equipped with similar equipment.
However, it was necessary to consider the impact of geographical diversity, since it affects soybean industrial quality and yield of the different by-products. Conclusive data are, therefore, average and representative values that summarize the results obtained in di$erent regions of the planet.
ROUND TABLE ON RESPONSIBLE SOY ASSOCIATION (RTRS) — 17
3See in Information Sources/Other sources consulted.
Key elements in Soybean Conversion
The Soybean
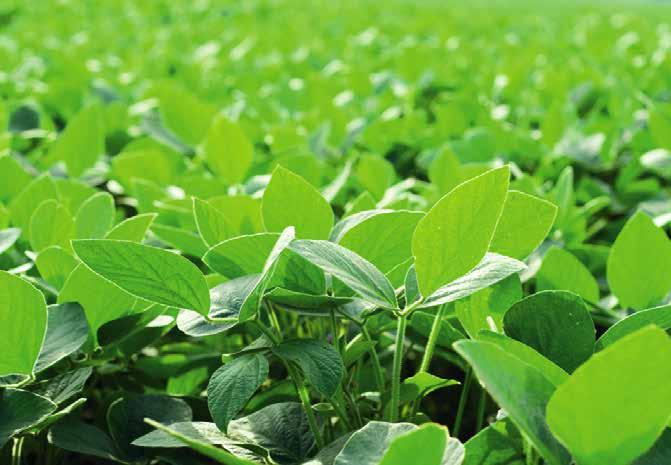
Soybean is a plant of the pea family, which is in turn formed by a large number of species characterized by their pod-type fruits, where the seeds (or beans) are located. When mature, the pod opens up longitudinally into two valves to allow for the dispersal of seeds. Legumes, which attract the nitrogen present in the air (thus aiding in plant growth) are soil-enrichening crops. Best known legumes are peas, chickpeas, lentils, peanuts, and soybeans. The soybean is rich in proteins, essential amino acids, oil, and metabolizable energy, so it is considered a unique legume (Bureau of Plant Industry).
The plant develops over 80-150 days between sowing and harvest (depending on the seed variety), to a height of approximately 1 m. Harvesting takes place when the right conditions are in place, and the plant has reached maturity, which is evident by the color of pods, that changes from green to brownish-gray. This variation occurs gradually, from the lower to the top pods, over just a few days. When ripening starts, leaves start to turn yellow and fall o$ the plant, and only the pods remain. During the ripening process, beans stop growing and their moisture content drops from 60% to approximately 13-15%, which is the appropriate level to start with harvesting operations (Biblioteca de la Agricultura, 1997).
ROUND TABLE ON RESPONSIBLE SOY ASSOCIATION (RTRS) — 18 Chapter I
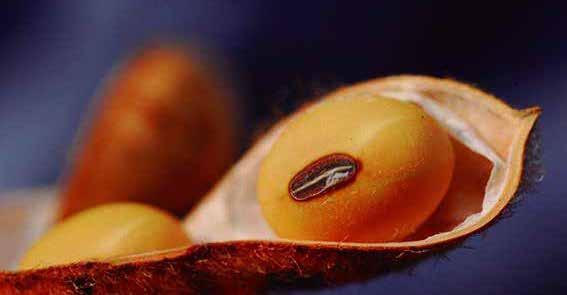
The seeds are round and feature a small brown scar or hilum, a mark that remains after they have been released from the pod. They weigh approximately 120-180mg and are 5-11mm in size. The bean consists of the hull and the nucleus. Hull weight accounts for 7-8% of total seed weight. The nucleus includes the storage tissues, consisting of cells that are predominantly filled with oil and protein (Bair, 1979).
ROUND TABLE ON RESPONSIBLE SOY ASSOCIATION (RTRS) — 19
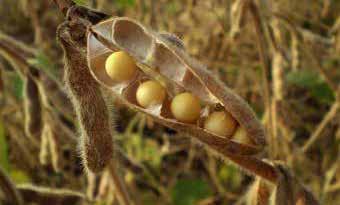
The pod (fruit) is wide, flat and hairy, 6-10 cm long, with its color going from yellow to brown when wholly ripe and dry. The pod contains 1 to 5 seeds, while the most common varieties include 2 to 3. Seed colors may be yellow, black or green (Bureau of Plant Industry).
The Soybean Pod
The Soybean
Soy Composition
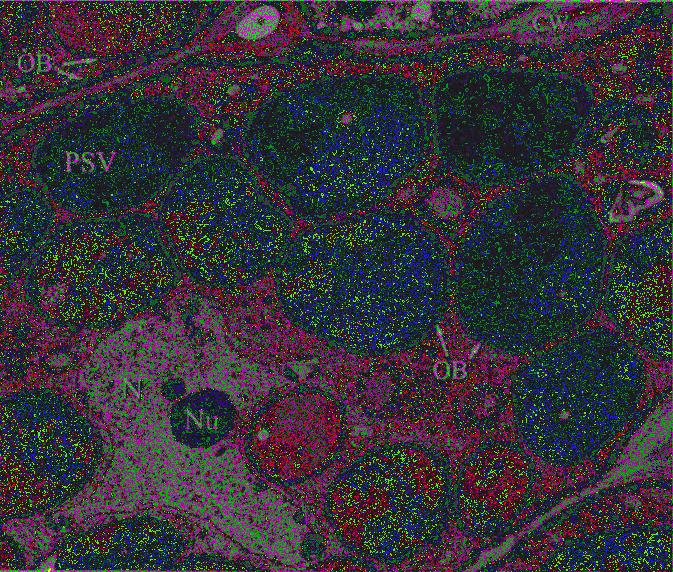
soybean consists of 20% oil, and 40% protein. Most of the oil and protein content is stored in organelles called protein storage vacuoles and oil bodies (Campbell, 2011). The oil inside a soybean contains thousands of small oil bodies located in the cell wall and outside the protein storage vacuoles. These are relatively large (2 to 10 microns in diameter), roundish in shape, while oil bodies are far smaller (with a diameter of approximately 0.2 - 0.5 microns) (Bair, 1979).
ROUND TABLE ON RESPONSIBLE SOY ASSOCIATION (RTRS) — 20
The
Cell Wall Protein Storage Vacuoles Carbohydrates, Ashes Oil Bodies CW: Cell Wall PSV: Protein Storage Vacuoles OB: Oil Bodies N: Nucleus UN: Nucleolus *: Intercellular Spaces Structure of a soybean (kemper, 2005) 1 1 2 2 2 3 3 4 4
Soy Industrial Quality
The industrial grade of soybean is defined by the oil and protein content measured as a percentage of total weight (Francioni, 2010).
The protein content bears a negative correlation to soybean yield (this is positive in the case of the oil content). Thus, there generally is an inverse relationship between oil and protein content, which makes it difficult to develop beans that are both oil- and protein-rich (Rotundo, 2009; Da Silva Rodrígues et al., 2014; Dhungana et al., 2017). In summary, the higher the yield, the lower the protein content and the higher the oil content (inversely, the lower the yield, the higher the protein content and the lower the oil content).
Oil and protein concentrations are the result of different variables affecting the plant during the crop cycle. Soybean production is governed by environmental, genetic and crop management factors; the latter is the only one that is likely to be modified or controlled by the farmer (Bellaloui, 2011).
Environmental Factors
Temperature mostly affects oil (rather than protein content). As temperature rises, this is expected to translate into an increase in oil content during grain filling (i.e., the last stages in plant growth), with the ideal being 25-28° C.
The protein percentage also decreases when temperatures drop below 20° C, and increases during the grain filling stage as temperature rises (Francioni, 2010; Thuzar et al., 2010; Dardanelli et al., 2006; Cuniberti et al.2004).
Water stress bears a negative impact on both yield and the amount of protein and oil found inside the bean. A plant affected by water stress has a more abundant protein content, with oil content being not as plenty (Rotundo, 2009; United Soybean Board, 2018).
Latitude is another environmental factor. The lower the latitude, the higher the oil and protein content, as compared to the percentages found in plants grown at higher latitudes.
Light also bears a positive impact on the amount of oil accumulated inside the bean during maturation.
Nitrogen availability is a critical factor for the amount of protein to be stored in the protein storage vacuoles during grain filling. Nitrogen uptake takes place through a process whereby the plant captures the nitrogen found in air through a symbiotic association between plant roots and the bacteria present in the soil (Rotundo & Westgate, 2009).
Genetic Factors
The varieties grown in many countries are the result of plant breeding programs that, rather than aiming at improving oil and protein content, are intended to increase the yield per hectare and develop resistance to pests. Improved yields have therefore translated into a substantial decrease in protein content.
ROUND TABLE ON RESPONSIBLE SOY ASSOCIATION (RTRS) — 21
Crop Management Factors
The sowing date is particularly relevant among soybean crop management factors. As sowing is delayed (November to January in the Southern Hemisphere; April to June in the Northern Hemisphere), positive correlations in the protein content have been identified, but negative correlations as far as oil content is concerned.
Another infuential factor is the soybean maturity group, this being understood as the length of the crop cycle (from planting to physiological maturity). Maturity groups usually range from II-III to the upper ranges (VIII-IX). The lower groups grow earlier, while crops in the upper range have a longer growth cycle. The choice of the maturity group is a function of the latitude at which the crop is sown, the planting date, and the potential of the surrounding environment. Generally speaking, the longer maturity groups yield more protein and less oil (Dardanelli et al., 2006).
These three factors (genetics, environment, crop management) combined cause the protein and oil content in the bean to vary depending on the geographical location of crops, with genetics being the most important factor. By way of example, studies that perform a comparative analysis of soybean quality among soy producing countries show that the US soybean and soybean meal feature a lower protein percentage compared to those from Brazil, but higher than Argentina’s (Thaku et al., 2010; Karr-Lilienthal et al., 2004).
According to data from the United Soybean Board (2018) in US soybean from 2008-2017, protein accounted for 34.56% of the bean (with a 13% moisture content), while oil concentration amounted to 18.87%, on average. As for the quality of Argentine soybean in the period 2008-2018, the average oil and protein content was 22.98% and 32.58%, respectively (with a 13% moisture content in the case of protein) (Cuniberti, 2018). Average values in Brazil for the years 2012/13 and 2016/17 were 37.10% protein and 20.12% oil. The table below presents these comparative values.
Soybean Quality - Comparative Figures
Crop Year
2008 (2008/09)
2009 (2009/10)
2010 (2010/11)
2011 (2011/12)
2012 (2012/13)
2013 (2013/14)
2014 (2014/5)
2015 (2015/16)
2016 (2016/2017)
2017 (2017/18)
Average for the past 5 years
Average for the past 10 years
Argentina
Protein
34,28 33,58 34,02 32,32 32,28 32,36 32,45 32,53 31,84 30,10 31,86 32,58
US Brazil*
22,00 22,90 23,30 22,70 22,20 21,70 23,90 24,40 23,30 23,40 23,34 22,98
Protein Oil 34,10 35,30 35,00 34,90 34,30 34,70 34,40 34,30 34,50 34,10 34,40 34,56
19,10 18,60 18,60 18,10 18,50 19,00 18,60 19,80 19,30 19,10 19,16 18,87
38,00 37,50 37,00 36,50 36,50
ProteinOil Oil 38,00 37,50 37,00 36,50 36,50 37, 10 20, 12
ROUND TABLE ON RESPONSIBLE SOY ASSOCIATION (RTRS) — 22
*Approximate values, based on Braga et al., APROSOJA (2017) (Moisture content: 13%) Sources: Based on Braga (2017), Cuniberti (2018), and USCC (2018)
Key Elements in Soybean Conversion
The amount of soybean meal, oil, hull pellets, and lecithin resulting from the first processing in the crushing plant is affected by several factors, which are summarized below.
The three most important elements affecting the soybean conversion factors are: 1) the industrial process; 2) the operations management; 3) the amount of seed planted and, consequently, the quality of the raw material (bean) for processing.
The first variable (the industrial process) is a function of the technology used and of the environment, as well as of the market quality requirements for the different by-products. Technology breakthroughs, process automation, and the use of equipment and specific machinery have led to significant developments in this industry, which in turn affect the reliability and standardization of processes and end products. These parameters bear a direct impact on the end quality of the industrial products obtained (Bailey, 1996).
The second high-impact factor is the way operations are managed. The implementation of decisions taken by plant management about equipment maintenance and processes is, of course, the most influential element. In this connection, quality management departments must also see to safety certificates, to remove any physical, chemical and biological risks (metals, contaminants, and salmonella (mainly introduced by doves), respectively). They are also responsible for complying with the customer’s commercial standards, namely moisture and protein content, amino acid profile, fiber content, and carbohydrate composition, among others. Quality Assurance Departments must also observe the standards established by the Grain and Feed Trade Association (GAFTA) (in the case of meals), and the Federation of Oils, Seeds and Fats Associations (FOSFA) (oils).
The last variable - seed quality - is dependent upon the decisions made by the grower at the time of planting. The selected seed genetics is of the essence for the final content of basic by-products such as meal and oil.
ROUND TABLE ON RESPONSIBLE SOY ASSOCIATION (RTRS) — 23
Soybean Processing
Soybean processing includes two main stages: The products from the first processing or
are oil,
hull
and lecithin. The second processing produces biodiesel as the main by-product and glycerol or refined oil as secondary by-products.
ROUND TABLE ON RESPONSIBLE SOY ASSOCIATION (RTRS) — 24 Chapter II
crushing
meals,
pellets,
Crude
Oil Degumming SECOND PROCESSING
Lecithin
Meal Hull pellet Reception Preparation Extraction High Pro Biodiesel Low Pro Glyserol Refined Oil or or Preparation (Neutralization)
Soybean
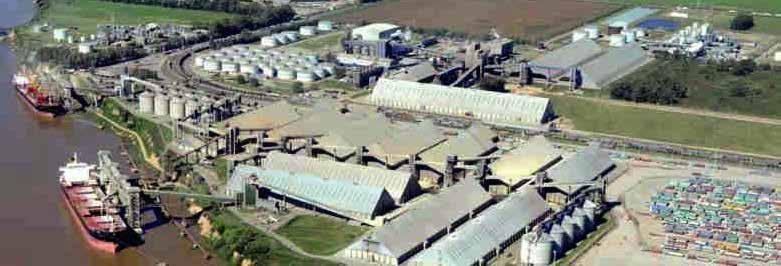
Crushing Facility - Terminal 6 FIRST PROCESSING
ROUND TABLE ON RESPONSIBLE SOY ASSOCIATION (RTRS) — 25 Extrusion* First Storage Pre-Cleaning Drying Crushing Preparation Extraction Preparation (Neutralization) Breaking and Aspiration Evaporation Dissolventizing and Toasting Conditioning Aspiration Hull Pelleting Breaking Miscella** Solid Material Flaking Degumming Drying Weighing and unloading First Storage Pre-Cleaning Reception Soybean Delivery and Sampling Second Storage In Buffer Bin Degummed Crude oil Lecithin*** Meal Hull Pellet High Pro Transesterification Biodiesel Glycerol Low Pro Bleaching Deodorization Refined oil or FIRST PROCESSING * Extrusion and expansion are alternative processes, not required steps. They increase the efficiency of the extraction process. ** Miscella is a mix of oil and hexane (solvent). *** Lecithin is an optional product. SECOND PROCESSING
First Soybean Processing
Crushing involves three steps: reception, preparation and extraction.
Reception
Reception is the process of receiving the soybean at the crushing facility. Reception includes delivery, sampling, weighing and unloading the grain, first storage, and pre-cleaning followed by a second storage in a buffer bin (Bailey, 1996).
Delivery and Sampling
Soybean reception starts when the person responsible for transporting the grain completes the delivery administrative steps. Required documents are submitted, and the grain quality is controlled. Sampling the trucks, railcars, barges or vessels is a requirement to monitor the quality of the soybeans. The number of samples is important since the final results will be applied to the total volume of grain delivered. The result of tests performed on samples is the basis to determine the economic value of the lot. The grain is sampled with a grain probe, that is, a probe sampler is introduced in the truck, railcar, barge or vessel to collect a representative sample, that is, a sample that has the same quality characteristics as the lot. By resorting to tables and standard calculation methods, the test results are applied to the lot and, when appropriate, discounts are applied.
Sampling is a fundamental practice in the post-harvest since, unless the grain quality is well established, crushing results more difficult (Abadía, 2012).
Every country has soybean trading standards that set slight variations in terms of impurities percentages but keep the same quality monitoring tests at reception. Trade value is based on test weight, foreign matter content, black grains, broken grains, damaged grains, green grains, fruits or leaves from foreign plants (chamico) and live insects or spiders (Abadía, 2012; Rosario Board of Trade, 2008; Guinn, 2002).
One of the most critical parameters monitored at grain delivery is moisture content, estimated as the ratio between water mass and grain mass (Abadía, 2012). Natural moisture content of soybeans ranges from 12 to 15% (Dorsa, 2008). Soybeans are usually delivered at 13 to 13.5% moisture content (Rosario Board of Trade, 2008) though this percentage slightly varies depending on the trading standard set by each country. Losses at the end of the process largely depend on the moisture content of soybeans at reception; that is why strict compliance with standards is a must. Grain drying before delivery to the crushing facilities is an additional cost for farmers. However, excessive moisture leads to significant discounts. Therefore, farmers have to find a delicate balance between costs and quality.
A grading expert verifies compliance with the standards, following a pre-established sampling protocol.
ROUND TABLE ON RESPONSIBLE SOY ASSOCIATION (RTRS) — 26
Weighing and Unloading
These two steps are required to determine the exact number of tons of soybeans received. The weighing and unloading process depends upon the transport mode that brings the soybeans to the facility and upon the reception infrastructure. There could be from traditional scales to continuous flow weighing systems. Traditional scales are static, and the systems are dynamic; grains can be weighed while being unloaded.
When soybeans arrive at the facility by truck, unloading is by gravity. Conveyor belts convey the grain from and to the bins and processing units. River or ocean carriers are unloaded with aspiration systems or ship unloaders that mechanically capture the grain and take it to the unloading hopper. The hopper is connected to conveyor belts that take the raw material to storage bins.
First Storage
There are two types of storage: vertical bins and flat warehouses. There are also some temporary solutions such as silo bunkers and silo bags. Flat warehouses look like a warehouse and, depending on their design, they can have underground storage.
Soy can be stored in flat warehouses. Carriers bring the soybean to the facility; belts convey it to the flat warehouses where the filling equipment build the piles.
When soy arrives with a high moisture content due to rains or high relative humidity at harvest, before storage, it should be kept in bins for some time to allow moisture to migrate to the surface and stabilize. It is common practice to dry the grain to get the right moisture level before storage (Dorsa, 2008).
Pre-cleaning
Before processing, all foreign matter including sand, dust, stones, sticks and others should be removed to avoid damaging the facility equipment. Potential pollutants, such as grass seeds, are removed to avoid a negative impact on the final quality of any by-product (Dorsa, 2008). There are different engineering solution for pre-cleaning: densimetric screens that sieve by weight differences or classiffiers that sieve by size.
Second Storage in a Buffer Bin
Before extraction, soy is stored in a buffer bin where aeration systems air the grain by creating an airflow inside the bin. The goal is to keep soy temperature low, preferably under 17 °C, to avoid the development of any kind of insects. Before extraction, it is also essential to remove the heat caused by grain and microorganisms breathing and keep the temperature consistent (Carpaneto, 2010; Abadía, et al, 2012). Below, the graph illustrates the different steps involved in reception.
ROUND TABLE ON RESPONSIBLE SOY ASSOCIATION (RTRS) — 27
First Soybean Processing Reception
Reception
Soybean Grain
Delivery and Sampling
Weighing and unloading
First Storage
Pre-Cleaning
Second Storage In Buffer Bin
Preparation
At preparation, soy is prepared to extract oil and obtain meal (Bailey, 1996). Preparation for extraction may vary depending on the raw material characteristics (Dorsa, 2008. To better understand this process, it is appropriate to separate it in four steps: Soybean conditioning, cracking and aspiration, flaking, and extrusion The broken material (grain core) goes into flaking and extrusion, but the aspired material (the hull) is processed in parallel to obtain hull pellet.
Conditioning
In any preparation process, soybeans are conditioned to take their moisture content to optimum levels. The conditioning step should take moisture content from 13/13.5% (storage temperature) down to 10.5%, which is appropriate for processing (Bailey, 1996). 10.5% is a standard for the global oil crushing industry4 .
Cracking and Aspiration
The goal is to separate the core of the seed, that contains the oil, the proteins, and the hull, that is rich in fiber. Soybeans are cracked by passing through roller mills. The beans are cracked into 2, then 4, and finally into 6 or 8 pieces. The cracked beans are conveyed together with the removed hull to heating and cleaning. The soybean hulls are separated from the cracked beans. A flow of hot air heats the cracked soybeans to 60 °C, before flaking and oil extraction (Dorsa, 2008).
The beans go through a multi-aspirator that removes the dust. A cyclonic separator separates the hull by aspiration; part of the hot air is recovered and re-introduced to the heating sector to increase beans temperature with no additional energy consumption.
The cracked bean is flaked, and the hull goes into the pelleting process.
ROUND TABLE ON RESPONSIBLE SOY ASSOCIATION (RTRS) — 28
4 Data from interviews with industry experts.
Hull Pelleting
After aspiration, the material goes to pelleting where it is pressed and passed through small cavities that shape it into small, long cylinders that, while they do not affect the characteristics of the material, significantly improve its handling and transport because they essentially prevent pollution.
Pelleting soybean hulls requires a critical control point, since the pellet quality may vary in certain parameters, including increased temperature, moisture, etc. (Behnke, 2001). The pellets are dried and cooled of. Then, they are conveyed to the storing bins or shipped, as appropriate.
Hull pellets are, on average, 6.5% of the total volume of soybean received and processed.
Flaking
Flaking follows cracking and aspiration. The goal is to increase the specific contact surface exponentially, to provide the grain a larger volume by optimizing flake thickness. A flake of approximately .38 mm is ideal for oil extraction and meal production (Dorsa, 2008). Soybeans go through rollers that distort their cell wall, making it easier to extract the oil and separate it from the solid material that will give the meal (Bailey, 1996).
ROUND TABLE ON RESPONSIBLE SOY ASSOCIATION (RTRS) — 29
Hull Pellet
Soybean Flake
Cellular structure of the soybean
mm diameter
Approx. Thickness, 18 cells0,38 mm
mm
Extrusion
Soybean flakes are passed through an extruder-like device known as an expander. Expansion facilitates extracting the oil from flakes with solvent. This is not a required step in the process, but it is commonly found in the industry, depending the equipment and operation set by the different facilities.
Flakes are pressed with water and steam injected into the product that is pressed against a die that compacts the mass. An auger turning at a certain speed helps the product through the die (Valls Porta, 1993). At ambient temperature and pressure, the product that comes out of the die expands into a very porous, spongy structure that breaks the cellular walls and allows easier access to the oil (Dorsa, 2008). During soybean extrusion, temperature reaches 140 and 170 º C, in short periods that do not exceed 90 seconds.
The result is a mas with an apparent higher density and higher solvent percolation, which clearly increases the extractor capacity and efficiency. The product is dried and cooled off, bringing temperature down to 58 and 60 °C (Dorsa, 2008).
The next step in soybean processing is oil extraction and meal production. Below, the different steps involved in preparation.
ROUND TABLE ON RESPONSIBLE SOY ASSOCIATION (RTRS) — 30 12
0,38
First Soybean Processing Preparation
Preparation
Conditioning Breaking and aspiration
Flaking
Extrusion*
Aspiration Hull Pelleting
Breaking
Hull Pellet
Extraction
Extraction separates the oil from the meal and minimizes the amount of oil remaining in the meal at the end of the process. This step is critical for the success of the conversion factors.
During extraction, the flaked/extruded material is processed to obtain a solid and a liquid matter that will finally transform into meal and oil, respectively.
Crude Oil
Miscella
Solvent (hexane) is used to extract the oil. The solvent-extraction process separates the liquid from the solid material. The solvent is colorless, easily flammable and with the characteristic smell of a dissolvent.
Hexane is poured in a counter-current on the solid material in the extractor. Percolation allows the hexane to penetrate and extract the oil kept in the expanded material. At the end of this step, the expanded material becomes partly in a white meal with a low content of oil, below 1% (Dorsa, 2008) and partly in an oil-rich extract called miscella (Paraiso et al., 2003).
The oil-rich miscella (25 to 30% oil) is distilled and solvent is recovered (Bailey, 1996).
*Extrusion and expansion are alternative processes, not required steps. They increase the efficiency of the extraction process.
ROUND TABLE ON RESPONSIBLE SOY ASSOCIATION (RTRS) — 31
Evaporation
The oil-rich miscella goes to the evaporation unit where oil and hexane are separated (Dorsa, 2008). The distillation of miscella allows recovering almost all the solvent, that is recycled into the process. The oil will be removed in two consecutive stages.
First, miscella is heated at 45-55 °C allowing oil to increase concentration from 25% up to 80% or more. Second, miscella is heated at 95-105 °C. Heat transfer increases oil concentration to 95 to 98%. Only 2 to 5% of the solvent remains (Bailey, 1996).
So far, solvent recovery was achieved by heat transfer. Oil cannot be heated up again to remove more oil without affecting quality. Therefore, stripping is used to remove residual solvent without overheating the oil. Stripping produces crude oil, a mix of oil and phospholipids, also called gums that should be removed in a later step, called degumming.
The crude oil (with gums) represents, on average, 20% of the total volume of soybean received and processed.
Degummed Crude Oil
Degumming
The purpose of degumming is removing the phospholipids5 from the oil. Dry phospholipids, or lecithin, are an emulsifying agent that damages the oil quality and makes the second processing more difficult (Dorsa, 2008). However, lecithin has other uses that will be explained later in this report.
2% of hot water is added to the crude oil coming from the extractor to hydrate the phospholipids. A watery gum is therefore obtained. Water degumming is effective only with phospholipids soluble in water, as is the case in soybean (Bailey, 1996).
After hydration, the oil and gums are separated with a centrifuge. All the phospholipids are removed from the gum. The degummed oil is dried in a flash-type drier at controlled temperature and pressure. After drying, the oil is cooled before storage or transport (Bailey, 1996).
The degummed soybean oil presents, on average, the following characteristics: 1% acidity, expressed as oleic acid; .1% moisture, 200 ppm of phosphorus and .05% of insoluble impurities (meals) that can be stored in tanks to be shipped or treated to obtain other by-products (Bailey, 1996).
The commercial use of the degummed oil may be biodiesel and glycerol production or further refining to produce edible oil (refined oil). The degummed oil can also be traded as such, though it is not common.
The degummed crude oil represents, on average, 19.4% of the total volume of soybean received and processed.
ROUND TABLE ON RESPONSIBLE SOY ASSOCIATION (RTRS) — 32
Lecithin
Centrifugation produces a wet gum that, after drying, results in lecithin. Lecithin that comes out of the extractor is not suitable for human consumption. It needs to be filltered off and become suitable by temperature exchange, during drying.
This is how dry phospholipids, or lecithin, are obtained.
Lecithin represents, on average, 0.6% of the total volume of the soybean received and processed.
Meal Solids
After extracting the oil, the solids that remain should be processed to become meal, either High Pro or Low Pro meal.
Dissolventizing and Toasting
The meal that comes out of the extractor is a white product not suitable for the food industry because it still contains undrained solvent that has to be removed. Meals require dissolventizing.
Besides, meals contain proteins, a series of difficult-to-digest antinutrients for many animal species. Considering that the balanced feed industry is the main market for meals, such antinutrients must be eliminated.
The meal is heated, cooked and toasted to improve digestibility.
Drying
After dissolventizing and toasting, the meal goes to drying and cooling. Moisture is stabilized at approximately 12%; meal is ready for the final grinding where waste will be removed by magnetization (Dorsa, 2008).
Grinding
The dry meal is ground and screened. The final product is soybean meal. Soybean meal is stored in flat warehouses or vertical bins. Temperature and humidity must be controlled. The meal international market currently requires a moisture content below 12.5%.
Grinding final product is two di$erent quality meals, depending on the protein content of the raw material: a low-protein content meal or Low-Pro or a high-protein content meal or High-Pro6.
High-Pro meals represent, on average, 72% of the total volume of the soybean received and processed. Low-Pro meal may represent 78.5%, after adding the previously removed hull. In Low-Pro meals, hull pellet will be 0%.
ROUND TABLE ON RESPONSIBLE SOY ASSOCIATION (RTRS) — 33
*5 Phospholipids are a class of lipids that contain phosphoric acid. They consist of an alcohol molecule (glycerol), two fatty acids and a phosphate group (Devlin, 2004).
So far, this reports has detailed the by-products from the first soybean processing. First, crude oil with gums (20%), meals (High-Pro, 72% and Low Pro, 78.5%) and soybean hull pellet (6.5%). Crude oil with gums is the source of degummed crude oil (19.4%) and lecithin (6%).
Meals production ends here. Meals should now be transported to their different commercial destinations.
Degummed crude oil goes to the second processing to become suitable for the requirements of the oil market. Two options are available, further processing to obtain edible oils (refined) or biodiesel and glycerol.
Below, the different steps involved in extraction.
First Soybean Processing Extraction
ROUND TABLE ON RESPONSIBLE SOY ASSOCIATION (RTRS) — 34
Miscella is a mix of oil and hexane (solvent). *** Lecithin is an optional product.
Degumming Drying Drying Crushing Extraction Miscella** Solid Material Evaporation Dissolventizing and Toasting Degummed Crude Oil Meal Hull PelletLecithin*** High Pro Low Proor
Second Soybean Processing
It comes after crushing.
The degummed crude oil will now become either refined oil, biodiesel or glycerol.
The first step is neutralization, where oil is prepared. This is a common step for both refined oil, biodiesel and glycerol production.
Neutralization
Free fatty acids that are responsible for oil acidity are neutralized by an alkaline separation and subsequent centrifugation of the insoluble material. The fatty acids are physically removed. No chemical reactions happen and a neuter oil is obtained.
The product of this step is a neutralized degummed oil. Neutralization produces a loss of about 2%. If 100 kg are degummed, only 98 kg will remain after neutralization7.
Extracting refined Soybean Oil
Processing should remove the components of edible oils that may have negative effects, such as bad color and odor. Bleaching adsorb coloring components and deodorizing removes those that produce smell. Bleaching resorts to activated minerals to remove color and other impurities. Deodorizing resorts to distillation at high temperature to eliminate the rancid smell of soybean oil. These processes do not modify the chemical characteristics of the oil.
This step accounts for a .3% of the losses that, added to the loss of the neutralizing step, results in a total loss of 2.3%.
Refined oil represents, on average, 17.1% of the total volume of the soybean received and processed.
Transesterification
Obtaining biodiesel and glycerol
The transesterification is the process behind biodiesel. The oil reacts with an alcohol and separates glycerol from the fatty acids that combine back with another alcohol (methanol). The new chemical structure is a methyl ester called biodiesel. Glycerol is widely used in other industries (Kouzo. 2012; Busic et al., 2018).
There are no losses (unwanted or unused material) in biodiesel production: a ton of degummed oil produces .90 ton of biodiesel and .10 ton of glycerol.
On average, biodiesel accounts for 15.7% and glycerol, 1.7% of the total volume of the soybean received and processed.
So far, this report has described the processes involved in the second soybean processing and their byproducts: refined oil, biodiesel and glycerol. The following figure illustrates the processes:
ROUND TABLE ON RESPONSIBLE SOY ASSOCIATION (RTRS) — 35
7Data from interviews with industry experts
Second Soybean Processing
ROUND TABLE ON RESPONSIBLE SOY ASSOCIATION (RTRS) — 36 SECOND PROCESSING Crude Oil Degumming Lecithin Meal Hull Pellet Reception Preparation Extraction High Pro Low Proor
Preparation (Neutralization) Transesterification Biodiesel Glycerol Bleaching Deodorization Refined oil FIRST PROCESSING
Convertion Factors
Measurement of the Conversion Factors
Conversion factors are defined as the amount of byproducts obtained during the first and second industrialization stage (oil, meal, hull pellets, and lecithin on the one than; refined oil, or biodiesel , on the other) from a given amount of soy beans.
The outcome of these conversion factors is mainly a result of the composition of soybean - the content of moisture, protein, fat, carbohydrates and other elements - as well as the physical and chemical processes used to transform the oilseed. The vegetable oil processing industry adequately call the conversion factors determination “mass balance studies” (a more suitable term than “conversion factor determination studies” to refer to the chemical analysis). All industrial calculations, and chemical operations carried out to determine yield in an oilseed crushing plant are included in such studies.
The mass balance may be defined as the accounting of material entering and leaving a given industrial process or part of it. Mass balance calculations are practically always a prerequisite for the financial viability of a soybean crushing plant (Deiana, 2018).
Brumm & Hurburgh (1990), and Wagner (2017) have published papers on the mass balance in soybean processing. The Brumm & Hurburgh model (1990) was developed to determine the estimated economic value of products obtained during the solvent extraction of oil and meal, based on the commercial rules applicable to these products. Wagner (2017) expanded the above model to include various nutrition compositions of soybean and their potential impact on the economic value of byproducts.
Also worth mentioning is the paper published by Chenga (2017), which determines the financial viability of a soybean crushing plant producing crude oil, soybean meal and hull pellets as end byproducts.
This paper presents the wet weight conversion factor values (i.e., the moisture content in the beans sold by the grower)8. The wet weight is what determines the commercial value of the beans, and the factor that both farmers and the food industry are most interested in. These values result from engaging in consultation with industry experts, equipment manufacturers, consultants in industrial associations, the pertinent literature, and exchanges with university professors in Argentina and abroad.
Keys of the Conversion Factors
Summarizing the information provided so far, the three main factors in the soybean transformation process that determine yields are the effciency of the industrial process, proper operations management, and the industrial grade of soybeans.
Industrial processes are global and standardized, so they are similar in different countries. Proper management of operations is also similar among crushing companies throughout the world. The industrial grade of beans is, however, a key factor that differentiates soybean crushing plants performance across different geographies.
usually deliver soybean with
moisture content that ranges from between 13 to 13.5%.
ROUND TABLE ON RESPONSIBLE SOY ASSOCIATION (RTRS) — 37 Chapter III
8 As explained in chapter II, farmers
a
As regards quality, different studies have determined that Chinese and Brazilian soybean protein content is higher than the concentration found in soybean grown in the US. Protein concentration of US soy is consistently higher than protein levels of soybeans produced in Argentina, characterized by their low protein content. Having said that, the soybean produced in China has a lower oil content than that from other regions (Brumm & Hurburgh, 1990; Wilson, 2004; Medic, 2014).
Process Losses
The material entering a processing plant generally contains 2% of foreign matter. Part of it will be fed into the process, while the remainder will constitute a loss (Wagner, 2017).
Losses means the loss of raw material during the production process, consisting mainly in foreign matter and water (moisture) that remains. They include improper elements such as plastics, wood, dust, etc., which may damage the equipment and must, therefore, be removed. Metal is generally the first foreign matter being removed using magnetic force (Kemper, 2005).
Water is a major source of loss. The industry receives the raw material with a moisture content on the order of 13%. The bean must be dried to reduce this value to 10% to remove the hull and obtain protein-rich meals, improve the effectiveness of operations in subsequent processes, and minimize degradation during storage (Kemper, 2005).
Once foreign material (e.g. plastics, stones, wood) has been removed, other impurities such as pods, sticks, (that do not constitute a loss in and for itself) may be crushed and processed.
In this paper, we have considered that total losses during the first processing may amount to 1.5% (including moisture and foreign matter being removed).
Yield Drivers
The conversion factors for each of the by-products resulting from the soybean transformation process are used to determine yields.
Crude oil (both degummed and not degummed), High Pro and Low Pro meals, hull pellets, and lecithin are analyzed during the first processing.
Crude Oil (with gums): A fat-rich raw material will define the yield of the crude oil produced during the transformation process. The higher the fat content in the bean, the more oil will be produced. Still, it is also necessary to consider that fatty matter may be lost both in the meal and in the hull pellets. Generally speaking, this loss is very low (less than 1%). Considering oil production in different regions, we may conclude that the average yield is 20% of crude oil, including the phospholipids or gums (crude oil, not degummed). Once gums have been separated and dried, they become lecithin, so the degummed oil content is reduced to 19.4%.
Degummed Crude Oil: After gums and phospholipids have been separated and dried, they become lecithin, so the degummed oil content is reduced to 19.4% of the oil received and processed.
Meal: The calculation of meal yield is more complex than that used for oil, since consideration must be given to other parameters (such as protein, fiber, and moisture content as per GAFTA standards governing the commercialization of High Pro y Low Pro meals). Depending on the regions where soybeans are grown, the yields may range from 74% to 75% in countries like Paraguay and Brazil, and 70%-71% in Argentina. As a general average, and based on consultations with industry experts, the yields for High Pro and Low Pro (including hulls) soybean meals has been set at 72% and 78.5%, respectively, as an international standard. As discussed in Chapter IV, the varying composition of meals makes then suitable to feed different animal species.
ROUND TABLE ON RESPONSIBLE SOY ASSOCIATION (RTRS) — 38
Hull Pellets: According to industry estimates and to literature (Medic et. al., 2014; Liu & Li, 2017; Barbosa et al. 2008), hulls account for 7-8 % of bean weight. The majority of that percentage may be removed, while a remaining 1% is left, so as not to damage the nucleus, which concentrates most of the protein content. In other words, 6-7% of the hull may be removed, while 1% remains attached to the nucleus. 6.5% would be the reference yield value of hull pellets.
This may be sold on the market as a by-product, or (as noted in the preceding Chapter), be used for the production of Low Pro meal.
Lecithin: Lecithin is another secondary product obtained after degumming the crude soybean oil, via centrifugal separation. The result of this process is gums (wet lecithin) that may be dehydrated to obtain food-grade dry lecithin.
If 20% of the crude oil is degummed, we have a lecithin yield of 0.6% of the total bean weight.

As explained above under “Process Losses”, total losses during this first processing may amount to 1.5% (including moisture and foreign matter being removed).
The second processing results in refined oil, biodiesel and glycerol.
Refined Oil: It is obtained from degummed oil which is subject to neutralization, bleaching and deodorization. The total loss is 2.3% of the degummed oil entering the refining process. The amount of refined oil obtained from the 19.4% of degummed oil fed into the process totals 17.1%.
Alternatively, biodiesel and glycerol may be obtained by processing degummed raw oil.
Biodiesel: Transesterification makes it is possible to obtain biodiesel and glycerol (90% and 10%, respectively). It is worth noting that a 2% loss is generated during the neutralization phase, while no additional losses are generated by the transesterification process. Some 17.4% of biodiesel and glycerol are obtained from the 19.4% degummed oil received, with biodiesel amounting to 15.7% of the total soybean received at the plant.
Glycerol: This is a by-product of biodiesel production used in the food and pharmaceutical industries. A 10% of glycerol is obtained from degummed oil that accounts for 1.7% of the total soybean received at the plant.
The chart below shows the conversion values for all by-products obtained during the first and second processing.
By products obtained during the first and second processing: with high pro meal and soybean hull pellet
ROUND TABLE ON RESPONSIBLE SOY ASSOCIATION (RTRS) — 39
Crude Oil (With gums) Crude Oil (Degummed) Biodiesel Glycerol Refined Oil High Pro Meal Hull pellets Loss 2,0% Loss 1,5% Loss 2,3% Lecithin FIRST PROCESSING SECOND PROCESSING 20% Soy Bean 100% 19,4% 15,7% 17,1% 1,7% 72% 0,6% 6,5% OR
By products obtained during the
and Without soybean hull pellet
These conversion values may be also expressed as the soybean tonnage required to obtain one ton of any of the by-products.
Soybean tonnage required to obtain one ton of any of the by-products.
(as a
Soybean Tonnage (in t)
Crude oil With Gums
High Pro Meal
Pro Meal
ROUND TABLE ON RESPONSIBLE SOY ASSOCIATION (RTRS) — 40
first and second processing: with low pro meal
Crude Oil (With gums) Crude Oil (Degummed) Biodiesel Glycerol Refined Oil Hull pellets Loss 2,0% Loss 1,5% Loss 2,3% Lecithin FIRST PROCESSING SECOND PROCESSING 20% Soy Bean 100% 19,4% 15,7% 17,1% 1,7% 0,6% 6,5% OR 20,00% 19,40% 5,00 5,15
Degumming
Low
Hull Pellets Lecithin Biodiesel Glycerol Refined Oil 72,00% 78,50% 6,50% 0,60% 15,70% 1,70% 17,10% 1,39 1,27 15,38 166,67 6,37 58,82 5,85 Yield
%)
Soybean By-Products and their uses in the food, Cosmetic, pharmaceutical and Energy Industries
Market globalization and the growing level of environmental awareness have caused some primary by-products of soybean processing to undergo a longer process to match the food and environmental requirements of the world demand. Refined oil and biodiesel are the by-products of soybean second processing. Other by-products are glycerol and crude glycerin that leads to the production of refined glycerin. Figure 1 shows the different soybean by-products.
By-products from the first and second soybean processing
Crude Oil
Soybeans contain 20 % of oil that is extracted and separated from the meal with organic solvents, such a hexane. The oil fraction is called crude oil. To use crude oil as a raw material in industrial processes, it is degummed (gums and phospholipids are removed) and then treated with alkaline substances to reduce its acidity. In very few markets, degummed crude oil is used for human consumption.
Soybean Meal
Extraction produces a crude oil with a high content of solid particles that, after further processing, result in soybean meal. Soybean meal is mainly used in animal feeds thanks to its high digestibility (the fitness for digestion). It is a source of protein in diets (Thoenes, 2006; Karr-Lilienthal, 2004).
Soybean meal nutritional value is based on its nutritional quality, measured in amino acid content. Animal growth and performance depend on proteins with the ideal proportion of essential amino acids. The US Soybean Export Council . defines essential amino acids as those animals cannot produce in sufficient amounts to match their metabolic needs. Essential amino acids deficiencies lead to biological inefficiency and disease (Paige, 2017).
ROUND TABLE ON RESPONSIBLE SOY ASSOCIATION (RTRS) — 41 Chapter IV
Crude Oil (With gums)
Crude Oil (Degummed)
Biodiesel
Glycerol Refined Oil
High Pro Meal
Hull pellets
Lecithin
FIRST PROCESSING
SECOND PROCESSING
Soy Bean OR
Low Pro meals have a low protein content and high fiber content. Fiber comes from adding hulls previously separated at cracking and aspiration. NOPA standard specifications for Low Pro meals are a minimum of 44% of protein, a maximum of 7% of fiber and a maximum of 12% moisture. High Pro meals have a high protein content and low fiber content. Standard specifications are a minimum of 47.5-49% of protein, a maximum of 3.5% of fiber and a maximum of 12% moisture (El-Shemy, 2011).
High Pro meal is frequently used to feed monogastric animals such as poultry and pigs to produce meat and eggs because High Pro meals do not degrade the fiber contained in the soybean hull. This meal is highly digestible due to its lack of fiber and the characteristics of amino acids in the proteins. It is challenging to think of cattle farming monogastric animals without the proteins of soybean meal.
Low Pro meal, on the other hand, is more appropriate to feed ruminants, such as bovines, that can digest fiber more efficiently (El-Shemy, 2011).
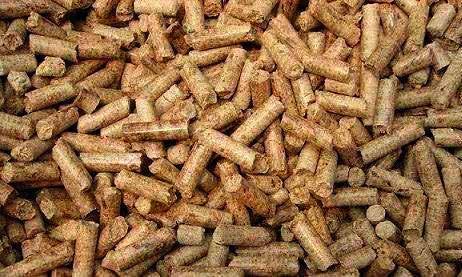
Soybean Hull Pellet
Soybean hull is the skin that covers the soybean. It is removed during oil extraction. Hulls are usually heat treated to remove unwanted enzyme activity and milled to the desired size (Lackey, 2011).
Hull pellets are a by-product of soybean hulls. Pellets reduce transport volumes and costs. Pellets are the physical presentation of the soybean hull (compressed pellet) used for animal feeds. The purpose of pelleting is taking finely ground foods, sometimes dusty, unpleasant and hard to handle and turn them into larger and homogeneous particles. These larger particles are easier to handle and, generally, perform better when compared to unprocessed feeds (Blasi et al., 2000).
Hull pellets nutrients are highly digestible, rich in fiber, low in proteins, very unpleasant but cattle find them extremely tasty. The low lignin content of soybean hull allows a wide range of uses. Soybean pellets are used to manufacture feeds. They are also an excellent source of energy for ruminants as a replacement for corn. Several studies show the benefits of including soybean hull pellets in the diets of horses, sheep, and goats. However, monogastric species such as pigs and poultry have problems converting the protein content of this by-product (Liu & Li, 2017; Blasi et al., 2000).
Soy Lecithin
Lecithin is a fatty substance occurring in the soybean tissue. It is removed together with the solvent when extracting the oil. Lecithins are a mixture of different chemical structures called phospholipids (they contain phosphorus). The physical and chemical properties of lecithins make them suitable as emulsifiers, nutritional ingredient and for different technical applications (SOPA, 2011).
Lecithin is an excellent emulsifier since it attracts both fatty substances and water in any mix of ingredients. Feed formulations can, therefore, be adequately integrated and remain mixed over time. Phospholipids such as lecithin perform important functions in human and animal tissues: they are part of the cell membrane structure. Lecithin helps the cell membrane stay fluid and allow the passage of nutrients into the cells (OECD, 2012).
Feed and food industry take advantage of this quality to manufacture good quality products. Bakeries add lecithin to bread to control moisture content and improve the dough, monitor the added fat, volume, symmetry and shelf life. When added to cakes, puddings, energy bars, crackers and cookies, lecithin improves the texture, the addition of fat and facilitates separation from molds (Knightly, 1989).
Mayonnaise, seasonings, salad dressings, non-dairy creams, and margarine are fatty foods that include lecithin as an emulsifier. Lecithin also has antioxidant properties; in the presence of air, it protects food color and prevents the darkening of products (Fellows, 1994).
ROUND TABLE ON RESPONSIBLE SOY ASSOCIATION (RTRS) — 42
Powders to prepare juices, soups, powdered milk or cocoa formulated with fibers and reconstituted with water include lecithin. Lecithin channels the additives that give aroma and favor to mixtures (Sander, 1989).
Lecithin is used in confectionery as an emulsifer to integrate the diferent ingredients and prevent stickiness in candies, chewing gums, jellies, and marshmallows (Appl, 1989). Chocolates and bonbons manufacturing uses lecithin to modify viscosity and improve the characteristics of the product (Böt y Floter, 2013).
The dairy industry uses soybean lecithin to emulsify processed cheese, cheese, and powdered creams and to prevent serum separation in yogurts and spread cheese with high moisture content (Bernardes, 2010).
Fish, shrimps and lobster aquaculture production has largely increased in recent years. Feed is the most significant cost for fisheries. New formulations with better performance is, therefore, a must. Soybean lecithin is an ingredient in the diets of shrimps and lobsters (Tacon, 2008).
Besides the known uses in the food and feed industries, the emulsifying properties of lecithin are used in other technical applications. In yeast fermentation that produces alcohol and gaseous carbon dioxide, lecithin controls the foam produced by the gas. In oil-based or latex paints, lecithin spreads and stabilizes pigments, facilitates brushing applications and improves coverage. Something similar happens with printing inks. Lecithin is an active ingredient in insecticide formulations to control mosquitoes. Lecithin forms a layer on the water surface that prevents pupas from breathing. In pesticides, lecithin increases adhesion and penetration.
Lecithin is also used by paper mills; in gums production, it has plasticizing properties that facilitate the handling of the material and improves vulcanization (the process in which the rubber is heated with sulfur to make it harder and weather resistant). The spreading and moisturizing properties of lecithin are very significant for the cosmetic industry, in the manufacturing of skin oils and lipsticks. Proteins and fats are added to these cosmetic products to keep the skin soft; lecithin spreads the fats and the ingredients responsible for the smell and color of these personal care products (SOPA, 2011).
Biodiesel
Biodiesel is a diesel fuel derived from renewable raw materials, such as vegetable oils and animal fats. Vegetable sources may be edible and non-edible plants. Soybean, canola, sunflower, palm, and peanut oil are suitable vegetable sources for biodiesel production. Also, jatropha, dates and wild mustard seeds. Biodiesel from these raw materials is used for diesel engines (Knothe, et al. 2004; Patel et al., 2015).
Biodiesel is sold in different markets where a series of specifications apply, mainly, acid value, moisture content, monoglyceride, diglyceride and triglyceride content, total free glycerin and methanol. These parameters are measured and control at the biodiesel plant and mark the conversion process9 Biodiesel quality specification in Europe are detailed in EN 1421410 whereas in the US ASTM 675111; in Argentina Resolution 828/2010 issued by the Federal Secretary of Energy12, and in Brazil Resolution No. 45/2014 and resolution No. 30/2016 issued by the ANP13 (National Petroleum Agency).
9 Data from interviews with industry experts.
10 Refer to https://www.transportpolicy.net/standard/eu-fuels-biofuel-specifications.
11 Refer to https://www.astm.org/Standards/D6751.htmf.
12 Refer to http://servicios.infoleg.gob.ar/infolegInternet/anexos/170000-174999/171944/norma.htm.
13 Refer to http://www.lex.com.br/legis_25883261_RESOLUCAO_N_45_DE_25_DE_AGOSTO_DE_2014.aspx http://www.lex.com.br/legis_27160107_RESOLUCAO_N_30_DE_23_DE_JUNHO_DE_2016.aspx
14 Medida de calidad de ignición del motor, cuanto mayor es el número, más fácil arrancar el motor del vehículo.
15 See a comprehensive study on gases emissions of vehicles running on biodiesel in EPA. https://archive.epa.gov/ncea/biofuels/web/pdf/p02001.pdf.
ROUND TABLE ON RESPONSIBLE SOY ASSOCIATION (RTRS) — 43
Biodiesel is an oxygenated fuel. It contains a significant amount of oxygen, is low in aromatics and has a higher volume of ketones14 compared to a traditional diesel motor. Therefore, biodiesel hydrocarbons and carbon monoxide emissions are lower than those of any traditional diesel motor. An engine running 100% on biodiesel would emit 4.5% fewer greenhouse gases than any engine running on gasoline and three times less than an engine running on diesel. Besides, it is less flammable than diesel, therefore, very useful in mining operations. Diesel engines do not require any modification to run on this fuel15 (Busic, 2018).
While engines can run 100% on biodiesel, most other applications are B5, B10, and B20, that is they run on a 5%, 10% and 20% blend. World production of biodiesel is expected to reach 39 billion liters in the period 2024-2027, while bioethanol production will be 131 billion liters in the same period. The European Union is expected to continue being the major biodiesel producer at 12.9 M liters by 2027. The biodiesel produced in the European Union represents 70% of the total fuel sold for transport in member countries. The European Union is followed by the US, Brazil, Argentina, Indonesia, and Thailand, with 85% of the worldwide production (OECD-FAO, 2018).
It is essential to mention that biodiesel cost is currently 30% higher than conventional diesel. Estimates are that 60 to 80% of the biodiesel production cost result from the price of its raw material. This fuel meets veryimportant goals: environmental benefits, development of new markets for agricultural products, creation of different economic circuits and new jobs (Busic, 2018).
Glycerol
Glycerol, also called glycerin, when purified, is a colorless, odorless, sweet-tasting alcohol (The Soap and Detergent Association, 1990).
Potential uses of crude glycerol are under study. It is used in animal balanced feed formulations because it is a good source of energy and its absorption speed is high. As a pure fuel, it produces little heat. Mixtures of biodiesel and crude glycerol are being tested in fruit growing areas for frost protection since it can increase ambient temperature. Another promising use for crude glycerol are genetically modiFIed bacteria that may transform glycerol into high economic value molecules. Bioplastics synthesis is just one example. These compounds, unlike most petroleum-based plastics, are biodegradable. Tests are being carried out on the use of bacteria for biogas production (methane and other gases) from a mix of crude glycerol and organic waste. Such biogas contains less sulfur and pollutes less.
Purified glycerol is a biodegradable and renewable compound that currently has 2,000 uses in the food, pharmaceutical and chemical industries (Tan, 2013). Crude glycerol purification results in glycerin of different quality grades. Glycerin can be liquid or powdered, depending on their future use. It is chemically stable under normal conditions of use and storage and does not change color, odor or taste over time.
USP-grade glycerin16 is a safe, no taste substance with no unpleasant odor, suitable for consumption. It is used in food formulations to keep candies, cigarettes, baked products, sausage casings and cheeses moist and soft. Glycerin is a useful solvent for aromatizers and dyes, and is used as filler in commercially prepared low-fat foods; synthetic glycerin is a natural food emulsifier.
Pharmaceutical products, personal care products, and health products benefit from glycerin moisturizing and plasticizing properties that keep products smooth, lubricated and extend their shelf-life.
Pharmaceutical uses of glycerin include cough pills, toothpaste, excipients, medical coatings, otic, topic and parenteral solutions, capsules, and suppositories. Since glycerin does not irritate the skin, it is an ingredient in creams, deodorants, lotions, and shampoos.
ROUND TABLE ON RESPONSIBLE SOY ASSOCIATION (RTRS) — 44
Glycerin is used in a large number of industrial compounds. The first use of glycerin was in nitroglycerin, a compound of gunpowder. Glycerin is currently an ingredient in formulations of dissolvents, cellophane, corks, adhesives, printing inks, alcohols, paints, antifreeze agents, polyurethane foams, and plastics (Rodrigues et al., 2017).
Refined Soybean Oil
Refined soybean oil is used in foods for its excellent nutritional quality. It is a source of natural antioxidants and an adequate raw material for by-products such as margarine and spreads. Refined soybean oil is ideal for frying because of its high smoke point.
Other oils do not have the high content of essential substances that the human body cannot synthesize and should be included in diets, that is, linoleic and linolenic acids.
Soybean oil neutral odor and taste allow many food applications: mixed oils, frying oils and fats, mayonnaise, seasonings and salad dressings, artificial and fake creams, pastries, and pastry products.
Refined soybean oil is also used in pharmaceutical product formulations, as a component of anticorrosive and antistatic agents, electric insulators, plasticizers, fillers, lubricants, printing inks, green fuels, disinfectants, linoleum floors, paints, rubber, fungicides and pesticides, soaps, shampoos, and detergents.
ROUND TABLE ON RESPONSIBLE SOY ASSOCIATION (RTRS) — 45
16 USP-grade glycerin glycerol content is 99.7%.
Summary
Soybean is the most important source of low-cost, high-quality vegetable protein for animal feed manufacturing. Soybeans have value due to their high-quality oil. Food world demand is expected to increase in the coming decades. Soybeans can supply the global demand for proteins worldwide.
Besides their essential role as raw material for livestock feeding, soybean by-products have multiple applications as ingredients in food products. Other applications include industrial, pharmaceutical and energy uses. Although not as meaningful in volume, soybeans can also be consumed by humans as beans or sprouts.
This report explains that soybean processing can be split into two. First processing results in crude oil, meal, hull pellet, and lecithin. Second processing results in refined oil for human consumption or in biodiesel and glycerol.
The report points out three main factors that determine the performance of soybean processing for industrial uses: the industrial process, operations management, and soybean quality. While the two first factors are similar in most countries, soybean quality is a differential factor that varies from one world region to the next.
All sources consulted in various countries agreed to the fact that soybean processing is standardized worldwide. Industrial equipment suppliers sell their products globally; the same technologies are used everywhere with some implementation differences. The scale and size of operations, as well as the focus on operation costs, have been the only significant changes implemented in recent years. Operational efficiency shows no differences while management is slightly different from one company to the next. It is an entirely different situation when it comes to soybeans quality. On average, soybean protein content is 40%, and the oil content is 20%. Soybeans oil and protein content define by-products such as edible oil, meals, hull pellets, lecithin, biodiesel, and glycerin. It is worth mentioning that protein and oil content may signifficantly vary according to the industrial quality of beans in every country.
Soybean oil and protein content depend on environmental, genetic and crop management factors. The environmental factors that impact the most are temperature, latitude, nitrogen availability and water stress. Planting date and maturity group are crop management decisions of high relevance. The goal of seed breeding programs is finding a variety with a higher yield, less protein and more tolerant to diseases or at breeding a seed with higher protein and oil content.
Therefore, Argentine, Brazilian, Chinese or US soybeans do not feature the same oil and protein content, which affect the by-products resulting from the industrial processing.
The results of conversion factors detailed in this report are international average values, following the different oil and protein percentages in different regions/countries. Crude oil values are directly proportional to the oil content of soybeans. Based on a yield average from various regions, before removing phospholipids and gums, standard crude oil extraction (with gums) is 20% of the soybean delivered and processed.
High Pro meal yield is 74-75% in Paraguay and Brazil, 70-71% in Argentina and in-between values in the US . Industry experts interviewed set a 72% High Pro yield as an international parameter, and 78.5% for Low Pro meal.
ROUND TABLE ON RESPONSIBLE SOY ASSOCIATION (RTRS) — 46
Current yields in soybean hull pellet are 6.5%, with slight differences across industrial facilities and countries. Crude oil values are directly proportional to the oil content of soybeans. Based on a yield average in very different regions, before removing phospholipids and gums, standard crude oil extraction (with gums ) is 20% of the soybean delivered and processed.
After degumming (phospholipids removal), .6% of lecithin is obtained, so, the final yield of degummed crude oil is 19.4%. Here ends the first soybean processing.
Crude oil degumming results in the by-products of the second processing: refined oil, biodiesel, and glycerol. Neutralization comes before oil preparation, with a loss that may range 2.0%. Once the oil is neutralized, transesterification results in biodiesel and a by-product called glycerol. Considering the 2% loss mentioned in the preparation of degummed crude oil, 17.4% of biodiesel and glycerol may be obtained: 15.7% biodiesel and 1.7% glycerol.
Oil for human consumption, after neutralization (with a 2% loss) is refined by deodorization and bleaching, with an additional loss of .3%. Refined oil yield can be defined at 17.1% with a total loss that can reach 2.3%.
These are reference values estimated after a large number of consultations with academic experts, industrial chambers, crushing facilities managers and equipment suppliers. These estimates are consistent with those in the international literature.
Conversion factors for soybean by-products are global average values that vary across countries or regions.
ROUND TABLE ON RESPONSIBLE SOY ASSOCIATION (RTRS) — 47
Annexes
Annex 1: About Universidad Austral
As a higher education institution, Universidad Austral intends to serve society by seeking the truth in all its dimensions, advancing and disseminating knowledge with a universal outlook.
Universidad Austral’s mission focuses on the individual as the center of all its teaching, research, transfer, medical assistance, and university extension undertakings.
Universidad Austral ranks among Argentina´s top two universities and leads the Argentine ranking among private universities at the QS World University Rankings. Other outstanding rankings include:
• No. 1 in Latin America under 50 years (QS Top 50 Under 50)
• No. 1 in Argentina in terms of graduate employability (QS Graduate Employability Rankings)
• No. 11 university in Latin America
The university has three Campuses (Pilar, Buenos Aires, and Rosario).

The Rosario Campus houses the Centro de Agronegocios y Alimentos (CEAg, Agribusiness and Food Center), an expert institution with a high academic level. From there, and through research and applied training, it seeks to promote the strengthening of agrifood value chains

ROUND TABLE ON RESPONSIBLE SOY ASSOCIATION (RTRS) — 48
In furtherance of this objective, the CEAg works along four lines of action:
• An MBA course in Agribusiness ranked amongst the top three in the world and No. 1 in Latin America according to the most prestigious Eduniversal ranking.
• An area dedicated to Agribusiness and Foods Studies that promotes applied research projects and provides a forum for thought and analysis of the major challenges the agribusiness sector is facing.
• Executive training programs, seminars and courses on the most relevant agribusiness topics.
• Outreach activities for Senior Management development, targeted at SMEs in the agribusiness sector.
Thus, the Center contributes to capacity-building in the food and agribusiness sectors, allowing them to develop and lead opportunities and trends, from Argentina to the rest of the region and the world at large.
Why a Food and Agribusiness Center in Rosario?
Thanks to its strategic location and regional projection, Rosario stands out as one of the key decisionmaking centers in Argentina. Some reasons underlying this statement are:
• Grain, oilseed, oil and other exports leaving the ports in the Greater Rosario and Parana River areas amount to 75% of total exports.
• The so-called Central Region (encompassing the provinces of Cordoba, Entre Rios and Santa Fe) concentrates 20% of Argentina’s population and represents 19% of the country’s GDP.
• The Rosafe area accounts for 70% of the agricultural products and by-products being produced and exported by Argentina.
• This region also has the largest share in meat and dairy exports, as it is the location of the most important milk producing area in Latin America.
ROUND TABLE ON RESPONSIBLE SOY ASSOCIATION (RTRS) — 49
Annex 2: About the Authors
Roberto J. Feeney

Roberto holds a graduate degree in Economics (equivalent to a BA) (UBA, 1985), an MBA (IAE, 1989), and a PhD in Business Administration (specialized in innovation management) (UQUAM, Montreal, Canada 2004). He is currently a professor and director of applied research at the CEAg of Universidad Austral. His research work mainly focuses on Innovation Management, Strategic Innovation, Innovation, and Natural Resources. He leads the “Encuesta Nacional de las Necesidades del Productor Agropecuario” (Survey of Argentine Farmers’ Needs) conducted by the Universidad Austral in partnership with Purdue University (USA). Mr. Feeney has led a research effort titled “Comer saludable y exportar seguridad alimentaria al mundo: Aportes para una Política Nacional de Seguridad Alimentaria y Nutricional.” (Eating Healthy and Exporting Food Safety to the World. Contributions to a National Policy on Food and Nutritional Safety). He has also authored numerous academic research papers, including the following: “Analyzing Value Chains In Agribusiness: A Literature Review” Mac Clay-Feeney, IFAMR, January 2019. “Food Security in Argentina: A Production or a Distribution Problem?” International Food and Agribusiness Management Review Journal, (2016), Volume 19, Issue 2., “Seed Market Segmentation in Argentina: How Do Farmers Buy Their Expendable Inputs?,” IFAMA Journal, Vol. 16, Issue 1, 2013, “Agricultural Capital Equipment Segmentation in Argentina,” IAMA conference 2012, Shanghai, China, “Agricultural Financial Market Segments in Argentina”, IAMA conference 2012, Shanghai, China. He is also the author of several business cases. Worth noting are the following: “Bioceres, Ag Biotechnology from Argentina”. As part of his career path, he has acted in the following capacities: Director of the project called “Necesidades del productor agropecuario argentino” (Needs of the Argentine Cattle and Crop Farmer) (2009-2018), Academic Director of the Centro de Agronegocios Universidad Austral, CEAg (20042009), Vice-chair of the Facultad de Ciencias Empresariales (Business School) at Universidad Austral (2004-2006), Co-Director of the MBA Program
– Universidad Austral (2004-2006), Innovation Management Professor –Universidad Austral (2004-2009), Visiting Professor IEEM Business School-Montevideo, Uruguay (2004-2006), Director of the Business Administration Course (1990-1998), Professor of Economics – Universidad Austral (1990-1998), Professor of Economics -Universidad de Buenos Aires (1985-1990).
ROUND TABLE ON RESPONSIBLE SOY ASSOCIATION (RTRS) — 50 Annexes
Sergio Grossman

A graduate Civil Engineer (Universidad Nacional de Rosario (1990), Sergio also holds an MBA from the IAE Business School at Universidad Austral (2007), and a PhD in Public Administration from AIU (USA – 2014). He also holds a postgraduate degree in Environmental Management from the Engineering School of Universidad Austral (2004).
Mr. Grossman is also a regular professor of Economics and Organization and Legal Engineering at the National University of Rosario. He also teaches at the Postgraduate Course in Structural Engineering at said School. At Universidad Austral, he is responsible for the course on Agroindustrial Operations (Levels I and II) which is a part of the curriculum for the Degree in Agribusiness. He is also a professor in the Masters Degree in Agribusiness (Business Case Analysis, and Entrepreneurship in Agribusiness). In 2017 he led the Diploma in Sustainable Fruit Production Management for growers offered by the ARCOR Group.
His professional career path includes the following capacities: Director General of Public Works at the Municipality of Rosario, Operations Manager at Aguas Provinciales (Sta. Fe Province Water Utility Company), and Production, Quality and Environment Manager at Aguas Santafesinas S.A. He has also been Director for Operations at Ondeo Service America Latina, a company of the Suez Environment Group, where he led several projects carried out in Chile, Bolivia, Mexico, and Argentina. Today, he works as a consultant for companies in the agribusiness sector, specialized in processes, corporate management, and quality.
ROUND TABLE ON RESPONSIBLE SOY ASSOCIATION (RTRS) — 51
Glossary
Crude oil: oil extracted from soybeans crushing that contains phospholipids or gums.
Degummed crude oil: oil resulting from crushing after removing phospholipids or gums. Soybean refined oil: oil resulting from neutralization, deodorization and decoloring of the degummed crude oil to make it suitable for human consumption.
Soybean refined oil: oil resulting from neutralization, deodorization and decoloring of the degummed crude oil to make it suitable for human consumption.
Biodiesel: Fuel derived from renewable fatty raw materials, either animal fats or vegetable oils. Canola, sunflower, palm, peanut and soybean oils are suitable vegetable sources for biodiesel production. Soybeanbased biodiesel derives from the degummed crude oil and results from a process called transesterification.
Glycerol: Also called glycerin or glycerin for commercial purposes; when purified, it is a colorless, odorless, sweet-tasting alcohol.
Soybean: Soybean fruit when used as a raw material for subsequent transformation in food, industrial, and pharmaceutical products.
High Pro Meal: A type of meal with high protein content and low fiber content. 47.5 - 49% of protein content, a maximum of 3.5% of fiber and 12% moisture, following National Oilseed Processors Association (NOPA) specifications. Meals used for monogastric animals feeding diets, such as chicken and pigs.
Low Pro Meal: A type of meal with low protein content and high fiber content. 44% of protein content, a maximum of 7% of fiber and 12% moisture, following National Oilseed Processors Association (NOPA) specifications. Low Pro meals are mainly used to feed bovine cattle.
Lecithin: a lipid that contains phosphorus (phospholipid) Extracted together with crude oil and removed at degumming. It is an emulsifier used in the food industry. It attracts both fatty substances and water in any mix of ingredients.
Miscella: a mix of oil and solvent (hexane) that results from oil extraction and meal production. Soybean crushing: Industrial process where soybean is crushed to produce crude oil, meals, hull pellets, and lecithin.
Neutralization: A process that removes the free fatty acids responsible for oil acidity, before the second soybean processing.
Soybean hull pellets: Small cylindrical portions of agglomerated soybean hull, used for livestock feeding, due to their high fiber content.
Soybean: the fruit of the soy when cropped to produce new soy plants. Transesterification: chemical process to produce biodiesel and glycerol, during the second soybean processing.
ROUND TABLE ON RESPONSIBLE SOY ASSOCIATION (RTRS) — 52
Sources of Information
References
Abadía, B. & Bartosik, R. 2012. Manual de Buenas Prácticas en Post-cosecha de Granos (Grain Post-harvest Good Practices Manual). INTA, Argentina. Available at: inta.gob.ar/sites/default/files/inta_manual_de_buenas_practicas_en_poscosecha_de_granos_ reglon_48-2.pdf. Recovered December 20, 2018.
Appl, R. C. 1989. “Lecithin in confection applications”. En Szuhaj, B. (Ed.). Lecithins Sources, manufacture & uses. Illinois, United States of America: American Oil Chemists’ Society Champaign.
ASTAM, “Standard Specification for Biodiesel Fuel Blend Stock (B100) for Middle Distillate Fuels”. Available at: https://www.astm.org/Standards/D6751.htm. Recovered Thursday, December 13, 2018.
Bailey, A.1996. Bayley´s Industrial Oil & Fat Products. Fifth Edition. United State of America. Y. H. Hui (editor). A Wiley-Interscience Publication, ISBN-13: 978-0471594246.
Bair, C. W. 1979. “Microscopy of soybean seeds: cellular and subcellular structure during germination, development and processing with emphasis on lipid bodies”. Doctoral Thesis Dissertation, Iowa State University.
Barbosa F F.; Tokach, M.; De Rouchey, J.; Goodband, R. 2008. “Variation in chemical composition of soybean hulls”. Kansas Agricultural Experiment Station Research Reports: Vol. 0: Issue 10. https://doi.org/ 10.4148/2378-5977.700.
Bernardes, P. R. 2010. “Lecitina de soja: el emulsionante versátil” (Soybean lecithin: the versatile emulsifier). Énfasis Alimentación. (Focus: Foods) Available at: http://www.alimentacion.enfasis.com/articulos/16222-lecitina-soja-el-emulsionante-versatil.
Behnke, K. 2001. “Processing Factors influencing pellet quality”. AFMA Forum 2001, February 2001, South Africa. Published in FeedTech 2001 Vol. 5 No. 4.
Bellaloui, N.; Reddy, K.; Bruns, H; Gillen, A.; Mengistu, A; Zobiole, L.; Fisher, D.; Abbas, H.; Zablotowicz, R & Kremer, R. 2011. “Soybean Seed Composition and Quality: Interactions of Environment, Genotype, and Management Practices” In: Soybeans: Cultivation, Uses and Nutrition ISBN: 978-1-61761-762-1 Editor: Jason E. Maxwell.
Biblioteca de la Agricultura (Agriculture Library), 1997. Técnicas Agrícolas en Cultivos Extensivos (Agricultural Techniques for Extensive Crops). La soja. (The soybean) Editorial Idea Books.
Blair, R. 2008. Nutrition and Feeding of Organic Poultry. Oxfordshire, England: CAB International. Blasi, D.A.; Brouk, M. J.; Drouillard, J.; Paisley, S.; Titgemeyer, E. C. 2000. “Soybean Hulls: Composition and Feeding Value for Beef and Dairy Cattle”. Kansas State University. Available at: https://www.bookstore.ksre.ksu.edu/ pubs/MF2438.pdf. Recovered Thursday, December 13, 2018.
Bolsa de Comercio de Rosario (Rosario Board of Trade) 2008. Normas de comercialización para el mercado internacional de granos. (Trading Standards for Grain International Market) Resolution N° 158 – 2008
ROUND TABLE ON RESPONSIBLE SOY ASSOCIATION (RTRS) — 53
Bot, A., Flöter, E. 2013. Application of Edible Oils. In W. Hamm, R. J. Hamilton, Calliauw, G. (Ed.). Edible Oil Processing (242-245). John Wiley & Sons, Ltd. Available at: https://zodml.org/sites/default/files/Edible_Oil_Processing %2C_2nd_Edition.pdf.
Braga Caneppele, M. A.; Caneppele, C; Andrade, P.; Carneiro Guimarães, S; dos Santos, K; Barboza da Silva, G. 2017. “Avaliação da qualidade nutricional e comercial de soja em Mato Grosso” (Evaluation of the Nutritional and Commercial Soybean Quality in Matto Grosso). CUIABÁ/MT, APROSOJA.
DECEMBER 2017
Brumm, T.J., Hurburgh, C.R., 1990. “Estimating the processed value of soybeans”. Journal of the American Oil Chemists’ Society. Vol. 67, Pages 302-307.
Bureau of Plant Industry, Available at: http://bpi.da.gov.ph/bpi/images/Production_guide/pdf/SOYBEAN. pdf. Recovered Sunday, January 21, 2018.
Bušic, A., Kundas, S., Morzak, G., Belskaya, H., Marðetko, N., Šantek, M. I., Šantek, B. 2018. “Recent trends in biodiesel and biogas production”. Food Technology and Biotechnology, Vol. 56, Issue 2, Pages 152-173.
Campbell, K. A.; Glatz, C. E.; L. A. Johnson; S. Jung; J. M. N. de Moura; V. Kapchie; Murphy, P. 2011. “Advances in Aqueous Extraction Processing of Soybeans”. Journal of the American Oil Chemists’ Society, Vol. 88: Pages 449-465.
Carpaneto, B. 2010. “Caracterización y manejo integrado de plagas en granos almacenados” (Characterization and Comprehensive Pests Management of Stored Grains). Final paper to be granted the degree of Vegetable Production Expert. School of Farming Sciences, National University of Mar del Plata.
Chenga, M. and Rosentrater, K. 2017. “Economic feasibility analysis of soybean oil production byhexane extraction”. Industrial Crops & Product Vol. 108: Pages 775-785.
Cuniberti, M. y Herrero, R. 2018. “Problemática de la baja proteína de la soja.” (Issues Relative to Low Protein Content in Soybean). INTA, Soja 2018 Informe de Actualización Técnico en línea, número 12Septiembre 2018 (Technical Update Report, online, number 12, September 2018).
Cuniberti, M., R. Rossi, R. Herrero, and B. Ferrari. 2004. “Industrial quality of soybean in Argentina”. Pages 961–970 In Proc. of the VII World Soybean Res. Conf., IV Int. Soybean Processing and Utilization Conf. y III Congreso Mundial de Soja, Foz de Iguazu´ - Brasil. 1–5 March. 2004. Embrapa Londrina PR Brazil. Dardanelli, J.L., M. Balzarini, M.J. Martinez, M. Cuniberti, S. Resnik, S.F. Ramunda, R. Herrero, and H. Baigorri. 2006. “Soybean maturity groups, environments, and their interaction define mega-environments for seed composition in Argentina”. Crop Science. Issue 46, Pages 1939–1947.
Da Silva Rodrigues, J. I.; Klever, M. A.; Cruz, C.D.; Piovesan, N. D.; Gonçalves de Barros, E & Alves Moreira, M. 2014.
“Biometric analysis of protein and oil contents of soybean genotypes in di$erent environments”, Pesquisa Agropecuária Brasileira, Vol. 49, Issue 6, Page 475.
Delvin, T. 2004. Bioquímica (Biochemistry) Libro de texto con aplicaciones clínicas, 4ª Edición, Editorial Reverté S.A. (Textbook with Clinical Applications, 4th edition).
Dhungana, S. K.; Kulkarni, K.; Kim, M.; Bo-Keun Ha; Sungtaeg Kang, Jong Tae Song, Dong-Hyun Shin, Jeong-Dong Lee12017. “Environmental Stability and Correlation of Soybean Seed Starch with Protein and Oil Contents”. Plant Breed. Biotech. 2017 (December), Issue 5, Vol. 4, Pages 293-303.
Deiana, A. C.; Granado, D. L.; Sardella, M. F. 2018. Balance de Masa (Mass Balance). Departamento de Ingeniería Química – FI – UNSJ. (Chemical Engineering Department) Introducción a la Ingeniería (Introduction to Engineering). Study Courses: Chemical Eng. - Food Eng.
ROUND TABLE ON RESPONSIBLE SOY ASSOCIATION (RTRS) — 54
Dorsa, R. 2008. Tecnología de los Aceites Vegetales (Vegetable Oils Technology). Riberao Preto: Maxicolor. El-Shemy, H. (Ed.). 2011. Soybean and nutrition. Janeza, Croatia: Available at www.intechopen.com Recuperado el 10 de diciembre de 2018.
EPA. 2002. “A Comprehensive Analysis of Biodiesel Impacts on Exhaust Emissions”. Draft Technical Report. Assessment and Standards Division O&ce of Transportation and Air Quality U.S. Environmental Protection Agency. Available at: https://archive.epa.gov/ncea/biofuels/web/pdf/p02001.pdf. Recovered December 20, 2018.
FAOSTAT 2019. FOA. Available at: http://www.fao.org/faostat/en/#data/QC. Recovered Monday, January 21, 2019.
Fellows, P. 1994. Tecnología del procesado de los alimentos (Food Processing Technology). Principios y prácticas (Principles and Practices). Zaragoza, Spain: Acribia S. A.
Food and Drug Administration FDA. 2016. Qualified Health Claim Petition – Soybean Oil and Reduced Risk of Coronary Heart Disease. Docket No. FDA-2016-Q-0995.
FOSFA. The federation of oils and fats associations. Available at: https://www.fosfa.org/contracts. Recovered Monday, December 10, 2018.
Fox, D. J. 2012. “Industrias aceiteras procesadoras del grano de soja en la República Argentina” (Soybean Crushing Oil Industries in the Argentine Republic). Final paper of Farming Production Engineering Course. School of Farming Sciences. Universidad Católica Argentina. Available at: http://bibliotecadigital.uca.edu.ar/repositorio/tesis/industrias-aceiteras-procesadoras-grano-soja.pdf. Recovered December 20, 2018.
Francioni, C. 2010. “Harina de Soja: El Desafío de Producir Cantidad y “Calidad” (Soybean Meal. The Challenge of Producing Quantity and Quality), Agribusiness Master Degree Thesis, Universidad Austral, Argentina. GAFTA. The grain and feed trade association. Available at: www.gafta.com. Recovered Monday, December 10, 2018.
Guinn J. 2002. “State for Soybean Council. Domestic Quality Standards and Trading Rules and Recommended Export Contract Specifications for U.S. Soybeans and Products”. United State for Soybean Council.
Karr-Lilienthal, L. K., Grieshop, C. M., Merchen, N. R., Mahan, D. C., & Fahey, G. C. 2004. “Chemical Composition and Protein Quality Comparisons of Soybeans and Soybean Meals from Five Leading Soybean-Producing Countries”. Journal of Agricultural and Food Chemistry, 52(20), Pages 6193-6199.
Kemper, T. G. 2005. “Oil Extraction”. Chapter 2. Bailey’s Industrial Oil and Fat Products, Sixth Edition, Six Volume Set.
Edited by Fereidoon Shahidi. John Wiley & Sons, Inc.
Knightly, W. H. 1989.” Lecithin in baking applications”. En Szuhaj, B. (Ed.). Lecithins Sources, manufacture & uses.
Illinois, United States of America: American Oil Chemists’ Society Champaign.
Knothe, G, Van Gerpen J, Krahl j. Ed. et.2004. The biodiesel handbook. Illinois, UDSA: AOCS Press.
Kouzu; Masato; Jyu-suke Hidaka. 2012. “Transesterification of vegetable oil into biodiesel catalyzed by CaO: A review”. Fuel. Volume 93, March 2012, Pages 1-12.
Lackey, Ron.2011. Ministry of agriculture, food and rural a$airs of Ontario, Canada. OMAFRA. Available at: http://www.omafra.gov.on.ca/english/livestock/beef/news/vbn1111a2.htm. Recovered Monday, December 17, 2018.
ROUND TABLE ON RESPONSIBLE SOY ASSOCIATION (RTRS) — 55
Liu, H. & Li, H. 2017. “Application and Conversion of Soybean Hulls”. DOI: 10.5772/66744. Intechopen. Available at: https://www.intechopen.com/books/soybean-the-basis-of-yield-biomass-and-productivity/ application -and-conversion-of-soybean-hulls Recuperado el 23 de diciembre de 2018.
Medic, J.; Atkinson, C.; Hurburgh Yr., Ch. 2014. “Current Knowledge in Soybean Composition”. Journal of the American Oil Chemists’ Society. Vol. 91, Pages 363-38.
NOPA. National Oilseed Processors Association. www.nopa.org. Recovered Friday, December 21, 2018. OECD-FAO, 2018. OECD-FAO Agricultural Outlook 2018. http://www.fao.org/docrep/i9166e/i9166e_ Chapter9_Biofuels.pdf. Recovered Thursday, December 13, 2018.
OECD. 2012. Organization for Economic Co-operation and Development OECD. “Revised Consensus Document on Compositional Considerations for New Varieties of SOYBEAN [Glycine max (L.) Merr]: Key Food and Feed Nutrients, Anti-nutrients, Toxicants and Allergens”. Series on the Safety of Novel Foods and Feeds (25). Paris, Francia. Available at: http://www.oecd.org/o&cialdocuments/ publicdisplaydocumentpdf/?cote=env/jm/mono(2012)24&doclanguage=en. Recovered Saturday, December 15, 2018.
Paige, K. 2017. “A mass balance-based model to evaluate the impact of amino acid profiles on the feeding and processed value of soybeans”. Graduate Thesis Dissertation. Iowa State University.
Paraíso P.; Andrade C.; Zemp R. 2003. “Destilação da Micela I: modelagem e simulação da evaporação do hexano” (Miscella Distillation: Modelling and Simulation of Hexane Evaporation). Ciênc. Tecnol. Aliment. vol.23 no.3 Campinas Sept./Dec. 2003 Food Science and Technology Print version ISSN 0101-2061On-line version ISSN 1678-457X.
Patel, N. & Shailesh S. 2015. “Food Energy and Water”. Science Direct. Available at: http://dx.doi. org/10.1016/B978-0-12-800211-7.00011-9. Recovered Tuesday, December 11, 2018.
Patil, G.; Mian, R.; Vuong, T.; Pantalone, V.; Song, Q.; Chen, P. Nguyen, H. T. 2017. “Molecular mapping and genomics of soybean seed protein: A review and perspective for the future”. Theoretical and Applied Genetics, 130 (10), 1975-1991. doi:http://dx.doi.org/10.1007/s00122-017-2955-8.
Rodrigues, A.; Bordado, J. C.; Galhano dos Santos, R. 2017. “Upgrading the Glycerol from Biodiesel Production as a Source of Energy Carriers and Chemicals—A Technological Review for Three Chemical Pathways”. Energies Vol. 10, Page 1817. doi:10.3390/en10111817.
Rotundo, J. L. 2009. “Physiological bases of environmental and genotypic effects on soybean seed composition”. Graduate Theses and Dissertations. Iowa State University. Paper 12113.
Rotundo, J. L. & Westgate, M. E. 2009. Meta-analysis of environmental effects on soybean seed composition. Field Crop Research, Volume 110, Pages 147-156.
Knightly, W. H. 1989. “Lecithin in beverage applications”. En Szuhaj, B. (Ed.). Lecithins. Argentina Secretary of Enery. 2010. COMBUSTIBLES Resolución 828/2010 Especificaciones de calidad del biodiésel. (FUELS. Resolution 828/2010. Biodiesel Quality Specifications) Modificase la Resolución N° 6/10. (Modifies Resolution No. 6/ 10). Available at: http://servicios.infoleg.gob.ar/infolegInternet/anexos/170000-174999/ 171944/norma.htm. Recovered Monday, December 10, 2018.
SOPA. The Soybean Processors Association of India. 2011. “La soja y sus múltiples usos” (Soybean and its Multiple Uses) (Yanina M., Trad.). Rosario, Argentina: Asociación Argentina de Grasas y Aceites (ASAGA).
Tacon, A. G. J. 2008. “Nutrición y alimentación de peces y camarones cultivados manual de capacitación” (Cultured Fish and Shrimps Nutrition and Feeding Training Manual). Italy: FAO. Available at: http://www.fao.org/docrep/field/003/AB492S/AB492S02.htm#ch3.3. Recovered Sunday, December 9, 2018.
ROUND TABLE ON RESPONSIBLE SOY ASSOCIATION (RTRS) — 56
Tan, H. W., Abdul Aziz, A. R., Aroua, M. K. 2013. “Glycerol production and its applications as a raw material: A review”. Renewable and Sustainable Energy Reviews 27, 118–127. http://dx.doi.org/10.1016/j. rser.2013.06.035. The Soap and Detergent Association, Glycerine & Oleochemical Division (Ed.). 1990. Glycerine: an overview. New York.
Thoenes, P. 2006. “Soybean International Commodity Profile”. Background paper for the Competitive Commercial Agriculture in Sub–Saharan Africa (CCAA) Study, World Bank.
Thuzar, M; Puteh, A. B.; Abdullah, N. A. P.; Mohd. Lassim, M. B.; Kamaruzaman J. 2010. “The Effects of Temperature Stress on the Quality and Yield of Soya Bean”; Journal of Agricultural Science, Vol. 2, No. 2.
Transport Policy Net. “Collaboration between the International Council on Clean Transportation and DieselNet”. Available at: www.transportpolicy.net/standard/eu-fuels-biofuel-specifications. Recovered December 14, 2018.
United Soybean Board, 2018. “Could weather a$ect your soybean quality?” Available at: https://unitedsoybean.org/article/could-weather-affect-your-soybean-quality, Recuperado el 7 de diciembre de 2018.
USDA 2018. “World Agriculture Production”. United States Department of Agriculture, Foreign Agricultural Service. December 2018. Available at: https://apps.fas.usda.gov/psdonline/circulars/production.pdf. Recovered Monday, January 21, 2019.
USCC. Ed. 2018.U.S. Soybean Export Council. Available at: https://ussec.org.
Valls Porta, A. 1993. IX Curso de Especialización FEDNA (IX FEDA Specialization Course), Barcelona, España. Wagner, K. 2017.” A mass balance-based model to evaluate the impact of amino acid profiles on the feeding and processed value of soybeans”. Graduate Thesis Dissertation. Iowa State University.
Wilson, R. F. 2004. Seed composition. In: Soybeans: Improvement, production, and uses. 3rd edition, H. R. Boerma, & J. E. Specht, (Eds.), 621-669. ASA Monogr. 16. ASA, Madison, WI.
Other sources of information
- ACSOJA (Asociación Civil de la Cadena de la Soja) http://www.acsoja.org.ar
APROBIO (Asociación de Productores de Biodiésel de Brasil) https://aprobio.com.br
ASA (Asociación de Semilleros Argentinos) www.asa.org.ar
- ASAGA (Asociación Argentina de Grasas y Aceites) www.asaga.org.ar/index.php
- Bolsa de Comercio de Rosario www.bolsarosario.com
- Departamentos de Bioingeniería Agrícola Principales Universidades USA y Europa (Purdue, Illinois, Iowa, Texas A&M, Ohio, North Dakota, Lasalle)
- INTA (Instituto Nacional de Tecnología Agropecuaria) https://www.argentina.gob.ar/inta
- The American Oil Chemists´ Society www.aocs.org
- U.S. Soybean Export Council https://ussec.org/
ROUND TABLE ON RESPONSIBLE SOY ASSOCIATION (RTRS) — 57
Public available sources of conversion factors
ROUND TABLE ON RESPONSIBLE SOY ASSOCIATION (RTRS) — 58 Appendix II
Hoste (IDH & WUR)
Uses supply chain data?
✓
Source name: Author(s):
Year published:
Geographical coverage:
Soy footprint of animal products in Europe
Robert Hoste (WUR)
Sustainable Trade Initiative Netherlands (IDH) Wageningen University website
2016
Uses data from 10 European countries
Uses peer review?
Indicator
Transparency of method
Reliability of method
Reliability of sources
Geographical applicability
Frequency of use
of proteins studied
Overview
What was the purpose and scope of the data source?
The research is not intended to be comprehensive and refers to itself as a ‘quick scan’ to give a countryspecific estimate of the soy footprint of four different protein types. The results of the study are intended to inform retailers of the soy footprint of the animal protein products they are selling. However, the information can also be used to raise awareness among individual consumers, as a per capita estimate of soy footprint is given by country. Ten different European countries are included in the study: Holland, Sweden, Denmark, Germany, UK, Ireland, Belgium, France, Spain and Italy.
Method
How were these factors reached?
Country-specific conversion factors were reached by using Netherlands-specific data from Hoste 2014 and adjusting this to account for differences in feed conversion factors and feed efficiency by country. A list of resources used to calculate these adjustments is given, including correspondence with industry and datasets from Eurostat and FEFAC. It is not clearly explained how these are used to calculate the countryspecific conversion factors, or which resources are used to calculate a conversion factor for a specific country. However, it is stated that the calculations are based on data from 2012-2014 for total soy use, eggs and poultry meat, and 2013-2015 otherwise.
Results kg of soy used per unit of product
Product
(pork)
(meat
(laying
(dairy cattle)
ROUND TABLE ON RESPONSIBLE SOY ASSOCIATION (RTRS) — 59
Funder(s): Published:
Range
Score (1-4) 2 3 3 2 1 3
□ Unit kg kg kg kg kg kg kg kg
Feed
Feed
poultry) Feed
poultry) Feed
Pork Chicken Egg Milk kg soy/unit* 0.094 0.260 0.154 0.154 0.440 0.822 0.394 0.036 *These figures have been calculated by 3Keel as a non-weighted average of the figures for the 10 European countries studied by Hoste. The same method is used by IDH to summarise the data in the European Soy Monitor report.
Application to RTRS
Are the results useful, valid and reliable?
The conversion factors are calculated for soy as one product, rather than being separated into soybeans, soybean meal and soy oil. Soy hulls are not accounted for.
Soy hull used in feed is excluded from calculations, as its ‘role as a commodity is negligible’.
Data specific to ten European countries is found. This may be of relevance if RTRS wishes to design a feature in the calculator whereby a footprint can be made specific to individual countries. However, this is not of use to any businesses whose production is based outside of these 10 countries. The method for adjusting Netherlands-specific data is not made clear by the author.
A relatively small selection of animal proteins are studied (4 of the 10 requested by RTRS), but conversion factors for other dairy products can be easily calculated using the conversion factor for milk. This is also the only study giving conversion factors for animal feed which are not specific to the Netherlands or the UK.
The conversion factors calculated are referenced in the European Soy Monitor
Hoste (WUR)
Uses supply chain data?
Source name:
Author(s):
Funder(s):
Published: Year published:
Geographical coverage:
Sojaverbruik in de Nederlandse diervoederindustrie 2011-2013
Robert Hoste (WUR)
Stichting Ketentransitie Verantwoorde Soja Wageningen University website 2014
Uses supply chain data from the Netherlands
Uses peer review?
Indicator
Transparency of method Reliability of method Reliability of sources Geographical applicability
Frequency of use Range of proteins studied
4
(1-4)
Overview
What was the purpose and scope of the data source?
The purpose of the research is to determine how much soy is used by the Dutch animal feed industry from 2011-2013. It is intended as an update from earlier research conducted by Hoste & Bulhuis (WUR), replacing data from 2008-2010 with more recent data and collecting data from a larger number of animal feed companies. Only data from the Netherlands is used.
Method
How were these factors reached?
10 major feed manufacturers, covering 65% of Dutch feed production, (plus some additional feed manufacturers for specific animals) in the Netherlands were contacted and asked for information on the animal feed produced. The reported soy content of compound animal feeds was then averaged out to find a conversion factor for animal feed by animal type.
Data from the feed industry association (Nevedi) was used to calculate the amount of compound feed produced in the Netherlands by animal type. This was combined with the conversion factors for animal feed (specified above) to find the volume of soy present in compound feed produced in the Netherlands by animal type. This data was adjusted to account for export of compound feed, which is estimated to be around 5% of domestic production in the absence of statistical information. Data from the LEI Business Information Network was also used to calculate the amount of simple soy product fed to animals by animal
ROUND TABLE ON RESPONSIBLE SOY ASSOCIATION (RTRS) — 60
✓
Score
3 3 3 1
4
□
• • • • • •
type. Hoste does not explicitly explain how the conversion factors are reached, but it can be assumed that a conversion factor for each animal protein has been created by calculating a sum of soy consumed as compound feed for that protein (soy in compound food production multiplied by 0.95) and soy consumed as simple feed for that protein, then dividing this by the total amount of the animal protein produced in the Netherlands.
Results kg of soy used per unit of product
Product
Feed (dairy cattle)
Feed (meat cattle)
Feed (pork)
Feed (laying poulttry)
Feed (meat poulttry)
Feed (other)
Milk Beef and veal
Pork Eggs
Poultry meat
Unit kg kg kg kg kg kg kg kg kg kg kg
kg soy/unit 0.101 0.077 0.082 0.137 0.256 0.065 0.026 0.295 0.276 0.321 0.665
Application to RTRS
Are the results useful, valid and reliable?
The conversion factors are calculated for soybeans, soybean meal, soy oil and soy hull. The conversion factors for soy product (excluding hull) are deemed to be most applicable, although values for soybean equivalent are given in some instances. No detailed explanation is given for this.
Conversion factors are calculated for carcass weight. If retail weight is more useful for users of the calculator, further calculations will be necessary to convert the factors from carcass to retail weight. Data is specific to the Netherlands and so findings may not be applicable elsewhere.
A relatively small selection of animal proteins are studied (5 of the 10 requested by RTRS), but conversion factors for other dairy products can be easily calculated using the conversion factor for milk. Other papers, including Kross & Kuepper (Profundo) and Hoste (WUR and IDH) use these feed conversion factors as a baseline for their conversion factors.
The earlier version of this paper is well cited, so this has been considered in the score for ‘Frequency of use’. The conversion factors have been referenced by Jennings, Sheane & McCosker (3Keel), WWF and CGF in addition to the two papers above.
ROUND TABLE ON RESPONSIBLE SOY ASSOCIATION (RTRS) — 61
• • • • • •
Kroes & Kuepper
Uses supply chain data? ✓
Source name:
Author(s):
Funder(s):
Published: Year published: Geographical coverage:
Mapping the soy supply chain in Europe
Hassel Kroes and Barbara Kuepper WWF (Netherlands) WWF (Netherlands) website 2015
Uses data for the EU-28
Uses peer review?
Transparency of method
Reliability of method
Reliability of sources
Geographical applicability
of use Range of proteins studied
Overview
What was the purpose and scope of the data source?
This research was commissioned by WWF (Netherlands) in order to inform a WWF infographic showing the soy footprint of the average EU consumer. This infographic was intended to raise awareness of how much soy is embedded within the products which are consumed by consumers and companies. Data is provided on soy production and trade worldwide, and soy use within the EU-28. This includes soy production data by country, land area used for soy production globally, soy export data by country and soy import data by country.
Method
How were these factors reached?
Data from Hoste (WUR) was used as an estimate for soy conversion factors for different animal feeds. Hoste did not provide an estimate for soy content in farmed fish feed, so an estimate was formed based on data from the Norwegian branch of a global aquafeed company, Skretting.
In order to calculate the soy content in different animal proteins, three different sets of data were used:
- The animal feed conversion factors based on the workings above.
- Data from FEFAC on the volume of soybean meal used as a simple feedstuff in the EU-28.
- Data on the volume of compound livestock feed produced (by type) in the EU-28 in 2013 (based on data from FEFAC).
- A multiplication factor. When the authors compared the sum of compound feed and simple feed produced (based on FEFAC data) with trade data from Eurostat on soy consumed in the EU-28, they find that the FEFAC data shows significantly less soy produced than would be expected, and have therefore calculated a multiplication factor of 1.73 to correct for this.
- Data on the volume of livestock product produced in the EU-28 in 2013 (from Eurostat)
The volume of compound livestock feed produced (volumes of compound feed produced according to FEFAC multiplied by the multiplication factor) is multiplied by the feed conversion factor in order to find the volume of soy used in livestock feed for each protein type. The volume of soymeal used as simple feed is then added to this, and the sum is divided by the volume of livestock product in order to calculate the conversion factors for protein type. This gives a conversion factor based on carcass weight which is then converted into a factor based on retail weight using information from Meat Suite and the USDA foreign agriculture service. For dairy products, a conversion factor for kg milk per kg of dairy product is used to calculate the soy conversion factors. It is not clear what the source of these dairy conversion factors is.
ROUND TABLE ON RESPONSIBLE SOY ASSOCIATION (RTRS) — 62
Indicator
Frequency
Score (1-4) 3 3 3 3 3 3
□
Results
kg of soy used per unit of product
Product Beef Pork Chicken
Other meat Eggs Milk Cheese Butter
Condensed milk
Milk powder
Other dairy Farmed fish
Farmed fish feed
Unit kg kg kg kg units kg kg kg kg kg kg kg kg
kg soy/unit 0.456 0.508 1.089 1.436 0.035 0.033 0.246 0.040 0.073 0.311 0.033 0.738 0.339
Application to RTRS
Are the results useful, valid and reliable?
The conversion factors are calculated separately for soybeans, soybean meal and soy oil. This creates the potential for a calculator which differentiates between these products.
Soy hull used in feed is excluded from calculations, as its ‘role as a commodity is negligible’.
The conversion factor for farmed fish feed (and by consequence also farmed fish) is stated by the author to be ‘not generally applicable’ due to differences in feed content for different breeds of fish, and the specific nature of the data used.
Data specific to the Netherlands is used to estimate conversion factors for animal feed. These conversion factors may not apply across the rest of the EU-28, and it is acknowledged that this is the case by the authors, who explain that there is a lack of detailed figures on the average soy content in feed across the EU-28.
All data used is specifically from the EU-28, so may not be applicable outside of Europe.
These cover most products for which conversion factors have been requested by RTRS, with the exception of lamb, salmon, yoghurt, crème fraiche, cream and chocolate. It would be possible for CFs to be calculated for dairy based on the CF for milk, but chocolate would be more complicated as soy lecithin could not be accounted for based on this data.
It is not explained how the factors used for converting milk into dairy products are found. They therefore may not be valid.
Although conversion factors are given by a sum of soy products rather than soybean equivalent, a method for calculating soybean equivalents is given in Appendix 2, which includes soy hulls. This is based on both crushing ratio and market value.
ROUND TABLE ON RESPONSIBLE SOY ASSOCIATION (RTRS) — 63
• • • • • • • •
Schreiber, Villa Garcia, Allen (3Keel)
Uses supply chain data? ✓
Source name:
Author(s):
Funder(s): Published: Year published: Geographical coverage:
Moving to deforestation free animal feed: 2018 Retail Soy Initiative
Schreiber, Villa Garcia and Allen (3Keel) Seven major UK retailers 3Keel website 2019
Uses data specifically for products sold in the UK
Uses peer review?
of method
of method
of sources
applicability
of use
of proteins studied
Overview
What was the purpose and scope of the data source?
This report is intended to provide an overview of soy usage in UK retail livestock supply chains. It seeks to:
1. Quantify the amount of soymeal present in animal feed used in 2018
2. Identify where the soy was reduced
3. Determine what share of soymeal used carried a recognised deforestation free production certification
Whilst conversion factors from other studies were used where primary data on soy use was not available, information was also collected on how much soy was contained in animal feed. This information has been used to provide the soy conversion factors for feed given below.
Method
How were these factors reached?
Feed data was obtained from producers, covering 59% of the soy included in this study. Given that the retailers in the study account for approximately 78% of the UK food retail market, this feed data therefore covers around 46% of the soy sold by retailers in the UK.
No calculations were carried out with this data, and a range is given using the minimum soy content in feed given by a supplier as well as the maximum.
Results
kg of soy used per unit of product
Product
Feed (beef)
Feed (dairy)
Feed (laying poultry)
Feed (pork)
Feed (meat poultry)
ROUND TABLE ON RESPONSIBLE SOY ASSOCIATION (RTRS) — 64
Indicator Transparency
Reliability
Reliability
Geographical
Frequency
Range
Score (1-4) 3 3 4 1 1 3
□
Unit kg kg kg kg kg
kg soy/unit* 0 – 0.18 0 – 0.23 0.10 – 0.21 0.05 – 0.18 0.15 – 0.26
Application to RTRS
Are the results useful, valid and reliable?
The ranges given for soy content in feed are very wide, so even using a mid-range estimate for this could mean that the soy conversion factor calculated from this is inaccurate.
Conversion factors given include soymeal, soy oil, soybean and soy hull content.
Conversion factors given are specific to food sold in the UK, although some may have been produced in other countries. This means that they cannot necessarily be applied to other countries.
The conversion factors are based on data from a large range of protein producers across the UK. They may therefore be more accurate (in the UK context) than conversion factors that are based on data from a more limited range of producers.
Findings show that soy has been removed from the diets of beef cattle in some British and Irish supply chains, which means that the conversion factor for beef produced in the UK may be lower than for other countries.
Young (SFT)
Uses supply chain data?
Source name:
Author(s): Funder(s): Published: Year published: Geographical coverage:
Are dairy cows and livestock behind the growth of soya In South America?
Richard Young (SFT)
SFT (Sustainable Food trust)
SFT website
Uses UK specific data
Uses peer review?
Indicator
Transparency of method Reliability of method Reliability of sources Geographical applicability Frequency of use Range of proteins studied
Score (1-4) 4 2 1 1 1 1
Overview
What was the purpose and scope of the data source?
This article was produced by SFT after another SFT article entitled ‘Milk: The Sustainability Issue’ raised questions from readers around soy usage in milk, which was not fully addressed in the original article. Questions raised and addressed are:
1. How much soya is used in producing milk and other dairy products and what proportion of total soya use is this?
2. Does producing soya milk use less soya beans than producing milk from cows?
3. Is soya in livestock production a major driver of soya production, as we’ve been led to believe? The focus is on soy usage in the UK. It is stated that soy milk production uses more soy per litre than dairy milk production, and that demand for soy oil rather than soybean meal determines how much land is used to grow soybeans.
ROUND TABLE ON RESPONSIBLE SOY ASSOCIATION (RTRS) — 65
• • • • •
✓
2017
□
Method
How were these factors reached?
Three different sets of information were used to calculate the conversion factor for milk:
- A figure from DEFRA giving the total volume of soymeal used in livestock feed in 2016
- An estimate for what share of this is used in dairy cow feed, given via an email from Defra’s statistics department. This is given as a range from 8-15%
- An estimate for how many litres of milk was produced in the UK in 2016 (based on an unknown source for liquid milk sold, data from AHDB Dairy on the amount of cheese produced and a factor for calculating how much milk is required to produce 1 kg of cheese)
The total volume of soymeal used in dairy production is calculated by multiplying the volume of soy used in livestock feed by the percentage used in dairy cow feed (using both the highest and lowest figures in the range). This is then divided by the estimate for litres of milk produced in order to find a conversion factor for litres of milk produced/kg soy used.
Results kg of soy used per unit of product
Unit Litre
Product Milk kg soy/unit* 0.0128
*This is based on the conversion factor given by Richard Young as litres milk/kg soy. Two conversion factors have been given by Richard Young (a high estimate and a low estimate), so these have both been divided by 1 to give a conversion factor for kg soy/litres milk. An average has then been taken to give a mid-range estimate.
Application to RTRS
Are the results useful, valid and reliable?
The statistics given for the use of soy meal in the UK, stating that 35% of total soy imports and 48.7% soy meal is fed to animals, appears to be inconsistent with other research based on soy usage (e.g. Jennings, Sheane & McCosker (3Keel) state that approximately 90% of soy in Europe and 70% soy in the world is used in animal feed production and it is generally assumed that almost all soymeal is used to produce animal feed). The figures given by SFT figures are attributed to data from DEFRA
The email from DEFRA giving an estimate of 8-15% for share of soymeal in animal feed being used for dairy cattle feed leaves a large margin for error, so even using a mid-range estimate for this could mean that the soy conversion factor calculated from this is inaccurate.
Only data on soymeal is used for this calculation, ignoring soy oil, soybean and soy hull content. Many of the links given to data sources do not work, and so the statistics used are not traceable. All data used is specific to the UK (which the author acknowledges may use less soy in dairy production due to the suitability of the UK and Ireland to grass production).
A conversion factor is given for only one product, although a conversion factor could easily also be calculated for cheese based on the estimate given that approximately 10 litres of milk are used to produce 1kg of cheese. Further dairy conversion factors from external sources could also be used to estimate soy conversion factors for additional dairy products.
ROUND TABLE ON RESPONSIBLE SOY ASSOCIATION (RTRS) — 66
• • • • • •
Van Gelder, Kuepper & Vrins (Profundo)
Uses supply chain data? ✓
Source name:
Author(s):
Funder(s): Published: Year published:
Geographical coverage:
Soy Barometer 2014: A research report for the Dutch Soy Coalition
van Gelder, Kuepper & Vrins (Profundo) Dutch Soy Coalition Both Ends website 2014
Uses supply chain data from the Netherlands
peer review?
of method
of method
of sources
of use
of proteins studied
Overview
What was the purpose and scope of the data source?
The report is created for the Dutch Soy Coalition, a collaboration of NGOs in the Netherlands, including Both Ends, OxfamNovib and WWF-Netherlands. The Dutch Soy Coalition aims to encourage stakeholders in the supply chain to produce soy responsibly and replace soy in animal feed with other proteins, and the report has been created with these goals in mind. It covers global production of soy, soy use in the Netherlands and sustainability standards.
Method
How were these factors reached?
In order to calculate the soy content in different animal proteins, four different sets of data were used:
The animal feed conversion factors based on conversion factors calculated by Hoste (WUR). The method for this is explained separately.
Data from FEFAC on the volume of soybean meal used as a simple feedstuff in the Netherlands. Data on the volume of compound livestock feed produced (by type) in the Netherlands in 2013 (based on FEFAC statistics).
A multiplication factor. When the authors compared the sum of compound feed and simple feed produced (based on FEFAC data) with trade data from Eurostat on soy consumed in the Netherlands, they find that the FEFAC data shows significantly less soy produced than would be expected, and have therefore calculated a multiplication factor of 1.27 to correct for this.
Data on the volume of protein product produced in the Netherlands (data was used from Product Boards, from 2013 for poultry and dairy production, and from 2012 for other livestock sectors with adjustments made based on 2013 data from the Dutch Statistical Office).
The volume of compound livestock feed produced (volumes of compound feed produced according to FEFAC statistics multiplied by the multiplication factor) is multiplied by the feed conversion factor in order to find the volume of soy used in livestock feed for each protein type. The volume of soymeal used as simple feed is then added to this, and the sum is divided by the volume of livestock product in order to calculate the conversion factors for protein type. This gives a conversion factor for meat proteins based on carcass weight. For dairy products, a conversion factor for kg milk per kg of dairy product is used to calculate the soy conversion factors. It is not clear what the source of these dairy conversion factors is.
ROUND TABLE ON RESPONSIBLE SOY ASSOCIATION (RTRS) — 67
Indicator Transparency
Reliability
Reliability
Geographical applicability Frequency
Range
Score (1-4) 3 3 3 1 2 3 Uses
□
• • • • •
Results
Product Feed Pork Chicken
Other meat Eggs Milk
Milk products (e.g. yoghurt)
Cheese Butter Condensed milk Milk Powder
Other dairy
kg of soy used per unit of product Unit kg kg kg kg kg Units kg kg kg kg kg kg kg kg
kg soy/unit* 0.400 0.336 0.605 0.261 0.036 0.034 0.023 0.301 0.034 0.073 0.286 0.034
Application to RTRS
Are the results useful, valid and reliable?
The conversion factors are calculated separately for soybeans, soybean meal and soy oil. This creates the potential for a calculator which differentiates between these products.
Soy hull used in feed is excluded from calculations, as its ‘role as a commodity is negligible’.
Data specific to the Netherlands is used throughout and the research is intended for use primarily by stakeholders in the soy supply chain in the Netherlands. The factors therefore may not be widely applicable to those seeking to calculate the soy footprint of animal proteins produced elsewhere.
These cover most products for which conversion factors have been requested by RTRS, with the exception of lamb, farmed fish, salmon, yoghurt, cream and chocolate. It would be possible for CFs to be calculated for dairy based on the CF for milk, but chocolate would be more complicated as soy lecithin could not be accounted for based on this data.
It is not explained how the factors used for converting milk into dairy products are found. They therefore may not be valid.
Conversion factors are given for carcass weight. However, estimates from Meat Suite are offered for conversion to retail weight as desired.
Although conversion factors are given by a sum of soy products rather than soybean equivalent, a method for calculating soybean equivalents is given in Appendix 2, which includes soy hulls. This is based on both crushing ratio and market value.
The conversion factors are referenced by Both Ends and the UKRT.
ROUND TABLE ON RESPONSIBLE SOY ASSOCIATION (RTRS) — 68
• • • • • • • •
UTOQUAI 29/31 | 8008 ZURICH, SWITZERLAND info@responsiblesoy.org responsiblesoy.org
