

of Science volume 120 number 5/6 DNA barcoding for insect diversity data Green technology for people and environment Value creation from food-related health claims
South African Journal
EDITOR-IN-CHIEF
Leslie Swartz
Academy of Science of South Africa
MANAGING EDITOR
Linda Fick Academy of Science of South Africa
ONLINE PUBLISHING SYSTEMS ADMINISTRATOR
Nadia Grobler Academy of Science of South Africa
SCHOLARLY PUBLISHING INTERN
Phumlani Mncwango Academy of Science of South Africa
MARKETING & COMMUNICATION
Henriette Wagener Academy of Science of South Africa
ASSOCIATE EDITORS
Pascal Bessong
HIV/AIDS & Global Health Research Programme, University of Venda, South Africa
Floretta Boonzaier
Department of Psychology, University of Cape Town, South Africa
Chrissie Boughey Centre for Postgraduate Studies, Rhodes University, South Africa
Teresa Coutinho
Department of Microbiology and Plant Pathology, University of Pretoria, South Africa
Jemma Finch
School of Agricultural, Earth and Environmental Sciences, University of KwaZulu-Natal, South Africa
Jennifer Fitchett
School of Geography, Archaeology and Environmental Studies, University of the Witwatersrand, South Africa
Michael Inggs Department of Electrical Engineering, University of Cape Town, South Africa
Philani Mashazi
Department of Chemistry, Rhodes University, South Africa
Thebe Medupe Department of Natural and Agricultural Sciences, North-West University, South Africa
Sydney Moyo Department of Biology, Rhodes College, Memphis, TN, USA
ASSOCIATE EDITOR
MENTEES
Thywill Dzogbewu Department of Mechanical and Mechatronics Engineering, Central University of Technology, South Africa
Tim Forssman
School of Social Sciences, University of Mpumalanga, South Africa
Nkosinathi Madondo
Academic Literacy and Language Unit, Mangosuthu University of Technology, South Africa
Lindah Muzangwa Agricultural Sciences, Royal
Leader
South African Journal of Science 120 years
eISSN: 1996-7489
Invited Commentary
Commentary
Peer
vs Publish all – Navigating the changing landscape of scientific publication
Advancing
Olivia P. Matshabane, Anna Hartford, Cornelius O. Ewuoso, Andrea C. Palk, Laura M. Koehly, Dan J.
Agricultural
UK May/June 2024 Number 5/6 Volume 120
University,
Yesterday, today and tomorrow: A snapshot of our journal Leslie Swartz .......................................................................................................................... 1 Book Review Animals are our history Dan Wylie 3 On proceedings too terrible (but necessary) to relate: Land restitution and violence in South Africa Peace Kiguwa 5 Contesting the long leash of evolved genomes Wieland Gevers ....................................................................................................................... 7 Perspective Indigenous knowledge systems and science education Margaret A.L. Blackie 9 Large language models through the lens of ubuntu for health research in sub-Saharan Africa Adetayo E. Obasa 13
Making green technology work for people and the environment Andrew Thatcher 17
Mariette Pretorius 21
researchers should
Sarojini Nadar, Dorsamy
Pillay 25
review
Why
focus on the triple bottom line: Excellence, ethics and empathy
(Gansen)
Africa
neuroethics in
28
Stein, Jantina de Vries
Shane Redelinghuys
National Institute for Communicable Diseases, South Africa
EDITORIAL ADVISORY BOARD
Stephanie Burton
Professor of Biochemistry and Professor at Future Africa, University of Pretoria, South Africa
Felix Dakora Department of Chemistry, Tshwane University of Technology, South Africa
Saul Dubow
Smuts Professor of Commonwealth History, University of Cambridge, UK
Pumla Gobodo-Madikizela Trauma Studies in Historical Trauma and Transformation, Stellenbosch University, South Africa
David Lokhat Discipline of Chemical Engineering, University of KwaZulu-Natal, South Africa
Robert Morrell School of Education, University of Cape Town, South Africa
Pilate Moyo Department of Civil Engineering, University of Cape Town, South Africa
Catherine Ngila
Deputy Vice Chancellor – Academic Affairs, Riara University, Nairobi, Kenya
Daya Reddy
South African Research Chair –Computational Mechanics, University of Cape Town, South Africa
Brigitte Senut
Natural History Museum, Paris, France
Benjamin Smith Centre for Rock Art Research and Management, University of Western Australia, Perth, Australia
Himla Soodyall
Academy of Science of South Africa, South Africa
Lyn Wadley School of Geography, Archaeology and Environmental Studies, University of the Witwatersrand, South Africa
Published by the Academy of Science of South Africa (www.assaf.org.za) with financial assistance from the Department of Science & Innovation.
Design and layout diacriTech Technologies
Correspondence and enquiries sajs@assaf.org.za
Copyright All articles are published under a Creative Commons Attribution Licence. Copyright is retained by the authors.
Disclaimer
The publisher and editors accept no responsibility for statements made by the authors.
Review Article
A review of the environments, biota, and methods used in microplastics research in South Africa
Heinrich T.J. Dahms, Richard Greenfield
Unveiling South African insect diversity: DNA barcoding’s contribution to biodiversity data
Ross D. Stewart, Michelle van der Bank, T. Jonathan Davies
The regulation of alien species in South Africa
John R.U. Wilson, Sabrina Kumschick
Research Article
The end of the beginning: Establishing isiZulu names for all bird species recorded in South Africa
Eckhart Buchmann, Junior Gabela, Adrian Koopman, Sakhamuzi Mhlongo, Themba Mthembu, Roger Porter, Nandi Thobela, Noleen S. Turner
Viability of investing in ecological infrastructure in South Africa’s water supply areas
Kayla M.E. Webster, Jane K. Turpie, Gwyneth K. Letley
Use of biochar to improve sewage sludge quality in Maluti-A-Phofung Municipality, South Africa
Nomasonto P. Dlamini, Patricks V. Otomo
Multi-stakeholder value creation and appropriation from food-related health claims
Melvi Todd, Jako Volschenk, Elizabeth Joubert 88
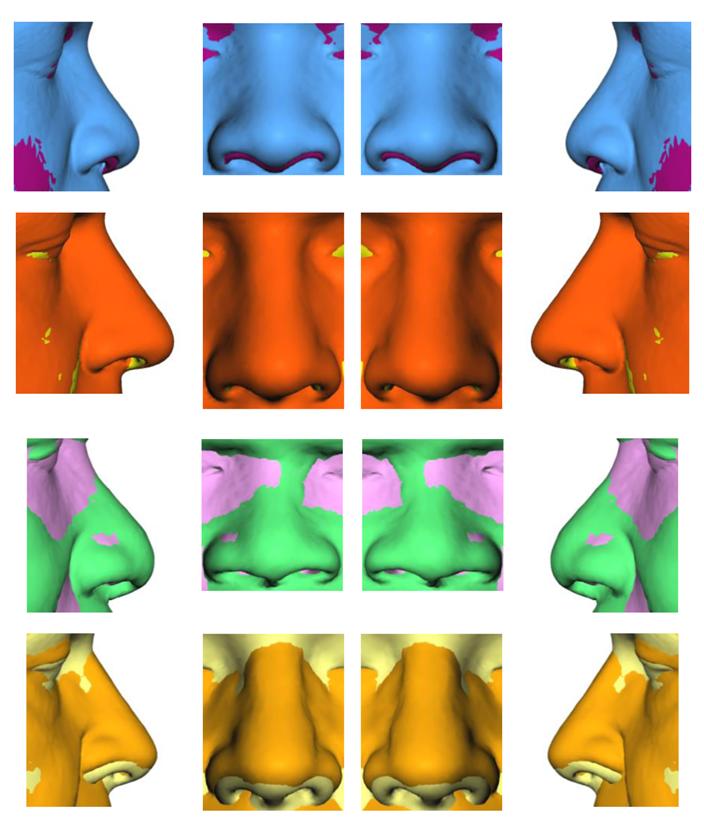
Shape analysis of the nasal complex among South African groups from CBCT scans
Alison F. Ridel, Fabrice Demeter, Ericka N. L’Abbé, Dirk Vandermeulen, Anna C. Oettlé
Submissions
Submissions should be made at www.sajs.co.za
Cover caption
In an article on page 95, Ridel and colleagues show that ancestry, sex and age influence the biological variability of both soft and hard tissues of the nose in modern South Africans. Their findings emphasise the importance of considering biological parameters in generating identification guidelines for facial reconstruction of unidentified persons.
Image: Ridel et al.
31
40
49
63
...........................................
71
80
95


Yesterday, today and tomorrow: A snapshot of our journal
2024 is a landmark year for South Africa, South African science, and for our journal. South Africa is now 30 years into our democracy, and this marks an important opportunity for reflection on the achievements and the disappointments of the past 30 years. As far as science is concerned, there is little doubt that there is greater visibility of South African science than there was 30 years ago, with some of the leadership associated with research related to COVID-19, built on the infrastructure of existing HIV-related research and expertise.
It is also true that among our generation of emerging researchers, many are now ‘born frees’, born into a hopeful and complex democracy and now tasked with taking research forward into South Africa’s future and into that of our continent and planet. This is a time for reflection on how far we have come in the transformation of science and the application of science to think about and solve pressing problems. We South Africans are publishing more, but are we doing better science? There are many initiatives looking critically at schemes to incentivise higher publication and many people are concerned with this question. And the strong need we held for a larger and more diverse pipeline of very well qualified young people entering universities also needs, and is gaining, attention, as huge inequities in our education system persist and appear to widen. What went right, and what went wrong?
We hope that readers of our journal will submit for possible publication their reflections on the achievements and challenges of the past 30 years. Later this year, in addition, we will be publishing a special issue to reflect on the 120-year history of the South African Journal of Science. Against the backdrop of this 120-year history, it is important and instructive to reflect on the extent to which there are continuities and discontinuities in our long history. What do we have to build on and to celebrate, and what, given the wisdom of hindsight, would we, and should we, have done differently?
It is in the nature of good scientific practice to take stock of research traditions and to make an assessment of how we as a scientific community are faring. Given that part of the vision of our journal is to “inform policymakers and the public”, it is also important that we encourage debate on contemporary issues. Challenges with service delivery have been described as ‘crises’ since the early days of our democracy, and are certainly in the news currently in this election year. For this reason, we have opened a call for commentaries for a discussion series on service delivery, and we hope to feature analyses and proposed solutions to a range of challenges from a range of disciplines and interdisciplinary teams and groups. We hope that the discussion
series will be of use and interest not just to researchers, but also to those tasked with taking very practical and pressing challenges forward.
In the spirit of looking back, and looking forward, it is noteworthy that a new opportunity and challenge for our journal, for all journals, and for the academic community as a whole, is the challenge posed by developments in artificial intelligence (AI) and large language models (LLMs). We ran what we have found to be a very helpful commentary on this topic in a recent issue, and after a period of consultation, we have recently published our AI and LLM policy. We anticipate (and, indeed, we hope) that there will be some contestation and discussion about this policy. As with all our policies, this policy will be subject to change and refinement. Nobody can precisely predict the future of academic publishing in the environment of rapid changes with AI and LLMs, and we want to work together with our readers and contributors to do the best we can to keep up. Please continue to help us.
On the topic of how well we are doing, since 2022, we have been reporting briefly on some of the trends we have observed in the life of the journal year by year. In 2023, a total of 420 original research and review articles were submitted to the journal – 38% of these submissions were from South Africa, and 23% were from elsewhere on the continent. We published 57 peer-reviewed articles across the six issues published in 2023. About 61% of the published authors were from South Africa, with 23% from the rest of Africa – an increase on last year’s 15%. Although the focus of our journal has historically been on South Africa, we now take a more broadly continental view as we are an inextricable part of Africa. This said, we state clearly in our mission statement that we will consider submissions from other African countries only if they show relevance or application beyond a single country to broader issues facing the continent. Our very high desk rejection rate (81%) is to an extent fuelled by submissions from other African countries but of relevance only to those countries (many excellent but very locally focused African papers form part of the 26% of desk rejected papers which are submitted from other African countries). Distressingly, almost half of our desk rejections (46%) are for submissions of varying quality from authors outside of Africa and on topics which do not have an African focus, with these authors effectively wasting their own time and resources in submitting to our journal. At the same time, this high figure of 46% of desk rejections should encourage African and South African authors, as the desk rejection rate falls by almost half when only African and South African authors are considered.
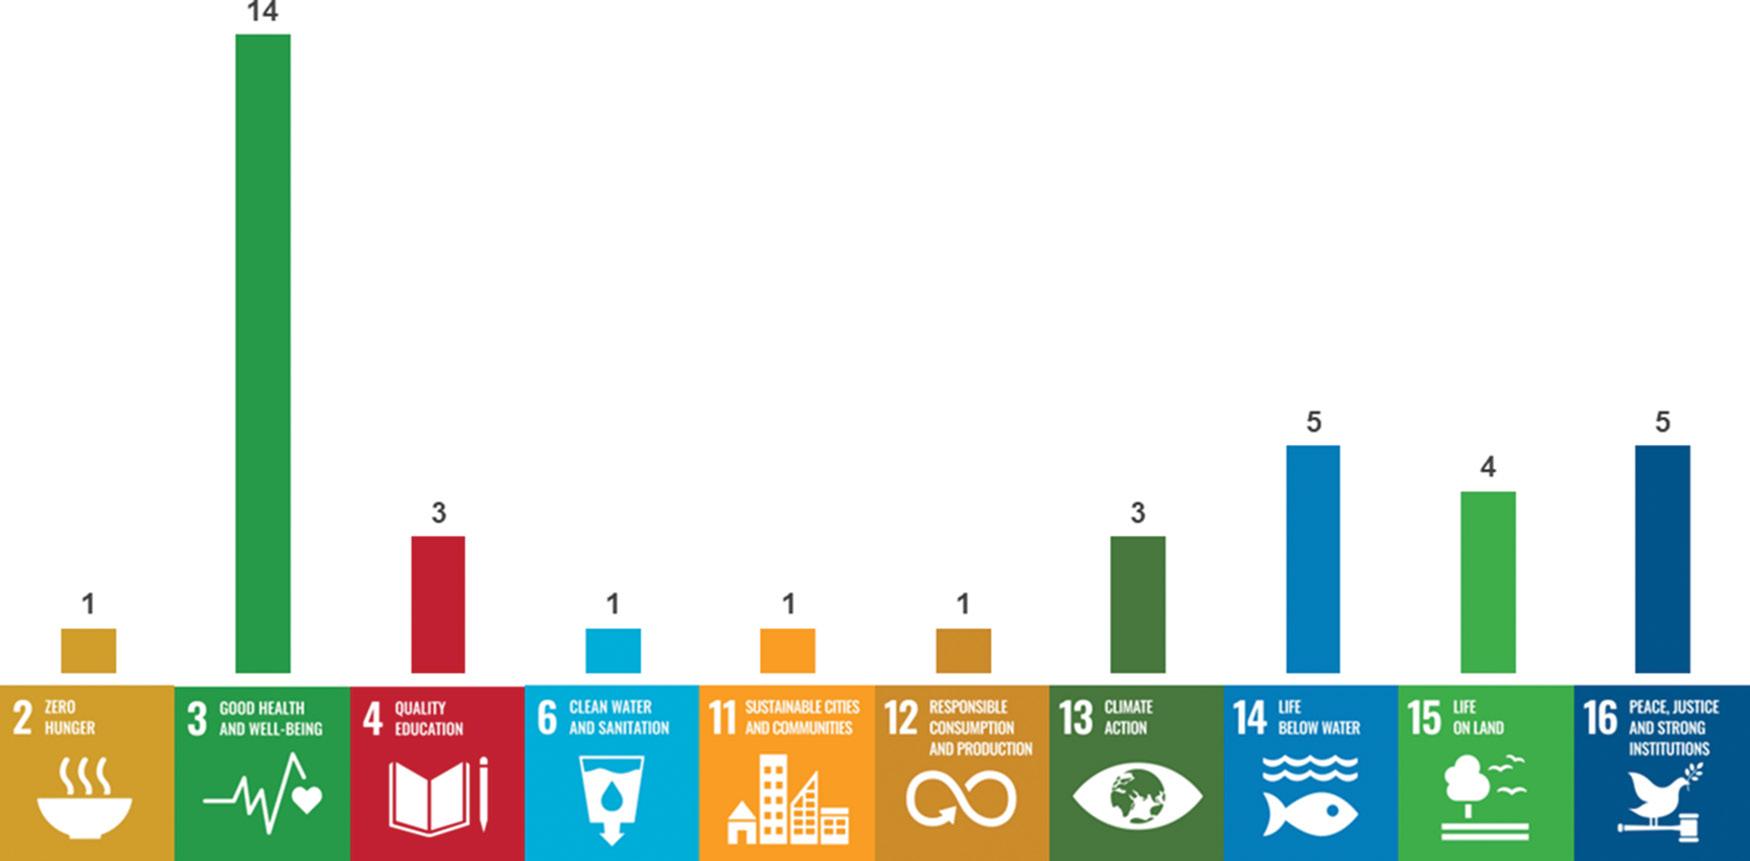
Our commitment to multidisciplinarity and to research relevant to contemporary African questions is reflected in Figure 1. The articles
1 Volume 120| Number 5/6 May/June 2024 https://doi.org/10.17159/sajs.2024/18458 Leader
Figure 1: Number of articles published in 2023 that contribute to each of the 17 Sustainable Development Goals.
Source: Digital Science Dimensions
published in 2023 fall within 22 research categories, as classified by Dimensions, and contributed to 10 of the 17 Sustainable Development Goals.
In terms of the reach of the journal, we have a small but growing social media presence, which is focused on promoting published content and increasing its visibility and reach across a wider readership. We encourage readers to follow us on X [Twitter], Facebook, LinkedIn and Instagram and to engage with us through these platforms. Media reports on articles published in the journal can be viewed on our website here. In 2023, there were 92 media mentions of published articles, with a global online reach of 3.5 million. We are acutely aware of the need to balance the accessibility and reach of the journal with rigour and scientific quality, and our rigorous peer review and expert reader processes assist us in this regard. It remains the case, though, with our journal and anecdotally with what we believe to be the majority of other academic journals, that speedy, high-quality, peer review is a challenge.
In 2023, it took on average 10 months from submission of a manuscript to final decision (this excludes revision rounds). In common with our authors, we would wish this time were much shorter – the time
HOW TO CITE:
delays are a source of frustration to all. In 2023, in order to find two reviewers for each submitted article, we had to approach on average seven reviewers. In 2023, we approached 736 reviewers, of whom 201 completed a peer review and 5 completed two or more peer reviews. The average time to accept a review invitation was 17 days. A large number of reviewers do not respond, and a proportion of those who do agree to review do not complete their reviews. Our journal is certainly not alone in experiencing frustration and difficulties around peer review, and this makes us all the more grateful to those who do complete reviews, or, if unable to review, tell us so promptly and suggest alternatives. Our associate editors with their mentees, and our peer reviewers, are absolutely central to the vitality and health of our journal, and we thank them all (a list of those who reviewed for us in 2023 can be found here; current associate editors and mentees are listed at https://sajs.co.za/ab out/editorialTeam).
At the South African Journal of Science, we work as a close team, and any success of the journal owes a great deal to teamwork and to the support of the Academy of Science of South Africa. As always, we want to do better as a journal, and we welcome constructive and helpful feedback.
Swartz L. Yesterday, today and tomorrow: A snapshot of our journal. S Afr J Sci. 2024;120(5/6), Art. #18458. https://doi.org/10.17159/sajs.2024/18458
Volume 120| Number 5/6 May/June 2024 2 https://doi.org/10.17159/sajs.2024/18458 Leader Yesterday, today and tomorrow: A snapshot of our journal Page 2 of 2
BOOK TITLE: The lion’s historian: Africa’s animal past
AuThOr: Sandra Swart
ISBN: 9781431433957 (paperback, 376 pp)
PuBLIShEr: Jacana, Johannesburg, South Africa; ZAR320
PuBLIShEd: 2023
rEVIEWEr: Dan Wylie1
AFFILIATION:
1Department of Literary Studies in English, Rhodes University, Makhanda, South Africa
EMAIL: d.wylie@ru.ac.za
hOW TO CITE:
Wylie D. Animals are our history. S Afr J Sci. 2024;120(5/6), Art. #18218. https://doi.org/10.17159/sa js.2024/18218
ArTICLE INCLudES:
☐ Peer review
☐ Supplementary material
PuBLIShEd: 28 May 2023
Animals are our history
© 2024. The Author(s). Published under a Creative Commons Attribution Licence.
Book Review
Sandra Swart, Professor of History at Stellenbosch University, has been steadily building a reputation as the ‘animals’ historian’, pre-eminently in her previous book, Riding High: Horses, Humans and History in South Africa (Wits University Press; 2010). In Riding High she showed how the horse was absolutely key to the conduct of colonisation, centuries of warfare, the symbolisation of power, and entertainment. In The Lion’s Historian, Swart examines the intricate effects of several other animal presences, wild and domestic, feral and alien, largely absent from conventional historiography.
With vivacious boldness, Swart goes further than merely chronicling human use of or contact with animals, or ‘giving a voice to the voiceless’. Broadly, she argues, human–animal interactions are not marginal to history as we anthropocentric writers conceive of it, but actively constitutive of it. Other animals have frequently co-evolved with human societies, co-operatively learning from as well as conflicting with them, injecting their own languages, habits and agency. In this, Swart joins a burgeoning stream of thought, largely aimed at de-centring self-satisfied human prominence in global environmental narratives. This stance emphasises web-like and co-operative networks and multispecies symbioses, as opposed to Chain-of-Being or bowdlerised Darwinian hierarchies of conflictual dominance, and attributes forms of consciousness and even agency to non-human entities as diverse as fungi and wolves. Whilst – as Swart acknowledges – a writer of history is ineluctably locked into ‘the prison-house of [human] language’, a radically different, more imaginative and inclusive mode of environmental history cries out to be written.
To this end, Swart offers eight illuminating case studies in African humans’ interactions with other animals. She expands her South African emphasis further north, notably in the first chapter on lions, since East African herder–lion relations are a particularly well-documented and ongoing issue. Here, as elsewhere, Swart is concerned to exhume non-Western, non-industrialised perspectives, from Maasai to San, which evince a gamut of possible relationships radically different from the monetised horror show of ‘canned’ lion hunting.
In the South African context, animal/human (‘humanimal’, in some formulations) history is inevitably bound up with the impact and development of European incursion and colonisation. The book’s second chapter accordingly examines the articulations of animals and power in Jan van Riebeeck’s 17th-century Cape settlement. Relations between Dutch and Khoikhoin transhumance herders centred almost exclusively on negotiations over the procurement of meat, spawning conflict over grazing for their respective cattle and sheep. There was predation by wild animals, from porcupines to lions, to cope with too – a prelude to their rapid extirpation, with incalculable environmental ramifications. The point: early Cape history makes no sense at all without the animal element.
In the third chapter, Swart reassesses the role of the horse in indigenous resistance to white imperial incursion. Horses were only one animal species crucial to the interlocked “politics of species and race.” Cattle – and the pasturage they required – of course were the constant casus belli of the century-long war on the Eastern Cape frontier; in turn, animals were the primary sufferers in human conflict. Swart then examines in detail the pernicious effects of the 1913 Land Act, as refracted through the writing of Sol Plaatje. Plaatje might seem an unlikely activist against animal cruelty – a persistent issue, in fact, that intersects complexly with using animal epithets to hurt others, especially the powerful denigrating the allegedly ‘lesser races’. Such rhetorics resurface repeatedly, not only in South Africa, while attitudes of kindness or otherwise towards animals can remain iconic of racial divisions. (Swart cites Jacob Zuma’s infamous statement in 2012 regarding white people’s affection for dogs.)
Dogs are also the focus of a chapter on the evolution, training and societal impact of police dogs as an increasingly feared weapon of apartheid control. At a different scale altogether, but with strangely congruent dimensions, Swart explores the race-identity politics behind Eugene Marais’ celebrated book The Soul of the White Ant. Ideological blinkeredness aside, she acknowledges, Marais did stimulate enhanced empathy with both ants and baboons through his poetic insights into their almost-human societies – a goal close to Swart’s own project.
As environmental historian William Beinart has explored, colonisation included the increasing application of Western science. Swart examines one scientific by-way – the efforts to somehow reproduce or resurrect the quagga, which the early colonists had sportively shot to extinction. Shades of reconstituting, via frozen DNA, the woolly mammoth, of course. Whether hapless or hubristic, such enterprise (Swart calls it ‘zombie zoology’, a term she wistfully complains somehow has not caught on) has particular importance and poignancy in our present era of multiple extinctions.
Finally, Swart unpacks one of South Africa’s most newsworthy and emotive animal issues: the interface of humans and baboons in the Cape Peninsula. In many ways this nexus encapsulates centuries of our humanimal histories, the troubled interdependencies of ‘civilisation’ and ‘wilderness’, of the fears and condemnations that comprise the definition of ‘humanity’ itself. Here she summarises key aims: to “push back into deep history, drawing on cognate disciplines like palaeontology, palaeoecology, archaeology and the study of rock art”; to question “static and stagnant representations of human-animal relations”; and to take “vernacular knowledge, oral tradition and traditional ecological knowledge seriously.” Swart accordingly concludes that such deep histories reveal that human–animal relations have always been malleable; hence, we need not be trapped in our present ecological predicament. To comprehend the history is to hope.
https://doi.org/10.17159/sajs.2024/18218
3
Volume 120| Number 5/6 May/June 2024
The Lion’s Historian is both thoroughly researched and passionately engaged, its lively style an implicit protest against the starchy blandness of much professional historiography. It is further leavened with personal anecdotes, punning subtitles (Swart is frequently laugh-out-loud funny), resonant phrases, and a scattering of photographs. None of this
diminishes the book’s seriousness or persuasiveness. While multispecies studies in the environmental humanities flourish (including among Swart’s own postgraduate students), much vital work beckons. With characteristic theatricality, Swart closes this scintillating book with a non-human utterance, a baboon word (meaning, roughly, ‘Alert: human!’): Wahoo!
Volume 120| Number 5/6 May/June 2024 4 https://doi.org/10.17159/sajs.2024/18218 Book Review
Animals are our history Page 2 of 2
BOOK TITLE: These potatoes look like humans: The contested future of land, home and death in South Africa
AuThOr: uMbuso weNkosi
ISBN:
9781776148400 (paperback, 186 pp)
PuBLIShEr:
Wits University Press, Johannesburg, South Africa; ZAR300
PuBLIShEd: 2023
rEVIEWEr: Peace Kiguwa1
AFFILIATION:
1Department of Psychology, University of the Witwatersrand, Johannesburg, South Africa
EMAIL:
Peace.Kiguwa@wits.ac.za
hOW TO CITE:
Kiguwa P. On proceedings too terrible (but necessary) to relate: Land restitution and violence in South Africa. S Afr J Sci. 2024;120(5/6), Art. #18219. https://doi.org/10.1715 9/sajs.2024/18219
ArTICLE INCLudES:
☐ Peer review
☐ Supplementary material
PuBLIShEd: 28 May 2024
On proceedings too terrible (but necessary) to relate: Land restitution and violence in South Africa
© 2024. The Author(s). Published under a Creative Commons Attribution Licence.
Book Review
In her recovery of American slave memoirs, the novelist Toni Morrison1 draws attention to a recurring motif in these slave narratives that seek to protect an imagined reader from the abject horrors of slavery. In describing and confessing their experiences of torture and dehumanisation within the slave system, the authors of these memoirs often pull the narrative up short with the recurring phrase: “But let us drop a veil over these proceedings too terrible to relate” (p.91). In their careful choice of what to narrate about their lives, these authors, former and current slaves at the time of their writing, aimed to cushion the horrors of slavery for an audience far removed from, and yet connected to, such horror. This strategic narrative deployment was in large part an acknowledgement that an audience with the potential power to become allies against slavery – and thus alleviate their suffering and status as slaves – must also be protected from proceedings too terrible to relate for fear that they inadvertently turn away from these horrors through denial. Writing in a much different time and context, Sol Plaatje’s (1876–1932) petition to the British government similarly narrates stories of loss, despair, and suffering brought on by state-sanctioned land dispossession in apartheid South Africa. Plaatje’s classic book is a biting condemnation of the Land Act that would see a majority black population bereft of land, material goods, family, community, spiritual and psychic nurturance.
Against the backdrop of an opening evocative prologue, uMbuso weNkosi’s These Potatoes Look Like Humans: The Contested Future of Land, Home and Death in South Africa similarly excavates a history too terrible to relate –the dispossession and violence experienced by black South African farm labourers, ripping open a veil on a period in history that remains insidious in its interwoven afterlives today. weNkosi’s audience requires no protection from these proceedings but an invitation to be courageous in remembering. With beautifully visceral language, weNkosi takes up the mantle to rip the veil, recognising that it is in the courage to do so that we may finally begin to confront the afterlives of violence and trauma in the present. The book commences with an opening scene of a farmland in the region of the Eastern Transvaal (now Mpumalanga), South Africa, in the small rural town of Bethal. The 1959 potato boycott in South Africa sets the frame for an insightful analysis of the conditions of farmworkers, the violence of white supremacy, the affective economy (especially white anxiety) that is part of this violence, the resilience of farmworkers, and the continued violence in the agriculture sector in South Africa today. Spanning seven chapters that take us on a journey of methodological originality, positing the eye as method that not only sees, records, and excavates history via registers imbued with political and affective influence. The chapters also engage violence in its multifaceted forms and effects, showing the specificity of violence in the context of Bethal and its interwoven connections to state violence more broadly, such as those embodied in the apartheid pass laws that restricted movement and employment. In dissecting the influence of affective formations of violence (primarily through registers of white fear and anxiety), the book further demonstrates how racialised violence may be rationalised as acceptable and even necessary under state law. But weNkosi does not limit his biting analysis to the past, with Chapters 5–7 offering critical insight into Bethal today and questions of land ownership more broadly. The three-tiered logics of identity, education, and state and how these informed dispossessions in the past come to the fore here; the spiritual meaning of land beyond current understandings of violence; the role of the past in current claims to land today; and a dissection of how current debates on land ownership and its conception is fraught with anxiety that is always connected to an unknown future.
These Potatoes Look Like Humans is an archaeological endeavour of sorts: the articulate map it offers of alternative research methodology that is available when we allow ourselves to think out of the traditional methodological and epistemological boxes of our disciplines; the poignant case studies and interview extracts that lend urgent human voice to theory, and the book’s own loyalty to the history and context it painstakingly seeks to make visible to us. Current discourse on the relationship to land is consistently relegated to discussions on the material and economic consequences of land ownership. Like Plaatje, weNkosi is at pains to challenge this narrow, individualistic, and market-oriented orientation rooted in Western, white, and imperialistic frames of reference. In These Potatoes, what we find is a wider picture of what the land means to black South Africans in terms of its material, social, spiritual, and psychic aspects. We see a powerful dynamic that connects all these elements, which in turn further allows us to see that the loss of land is more than material loss but also akin to social, spiritual, and psychic death. It is also about the loss of ancestors buried on the land.
Christina Sharpe’s2 metaphor of ‘in the wake’ to describe what she calls the afterlives of histories of harm and oppression in the present is worth repeating here:
Wakes are processes; through them we think about the dead and about our relations to them; they are rituals through which to enact grief and memory. Wakes allow those among the living to mourn the passing of the dead through ritual […] wakes are also “the track left on the water’s surface by a ship; the disturbance caused by a body swimming, or one that is moved, in water; the air currents behind a body in flight; a region of disturbed flow; in the line of sight of (an observed object); and (something) in the line of recoil of (a gun).”2(p.60)
Part of weNkosi’s wake-work is to trace relationships – whether it is the connections between loss and materiality, lost and present ancestors, or past and present violence. In so doing, he skilfully opens a veil to show us how loss
https://doi.org/10.17159/sajs.2024/18219
5
Volume 120| Number 5/6 May/June 2024
materialises through objects, relationships, interactions, broader social organization of life, and a (pervasively silent) psychic economy of white anxiety and paternalism that influences debates on land restitution in post-apartheid South Africa.
A second part of wake-work evident in the text is via a narrative methodological tool that links past, present, and future temporalities. In tandem with Sharpe’s enunciation of living in the wake, weNkosi’s sharp, poignant, and yet hopeful text bridges these temporalities:
[…] finally, wake also means being awake and, most importantly, consciousness. Living in the wake as people of African descent means living […] the afterlife of slavery—skewed life chances, limited access to health and education, premature death, incarceration, and impoverishment [my emphasis].2(p.60)
In his empirical documentation of what it means to be awake to history and its absent-present today, weNkosi undertakes a form of historical witnessing that attests to the ethical meaning of doing research in the present. In his multi-layered description of the different seeing eyes of
history – “the eye as heuristic model” – the figure of the Human Potato, much like the dockworker’s figure of the River in the classic Ol’ Man River showtune, is a call to witness the historical and continued denunciation of black humanity. Ol’ Man River is a 1927 show tune from the musical Show Boat that is sung by the black dockworker, narrating the suffering of African Americans through hard labour while the uncaring flow of the Mississippi River serves as a silent witness to this suffering. The eye as method – in the figure of the Human Potato – is another kind of witness that sees and refuses the silence of history. weNkosi offers us what he describes as an “eschatological eye” – a call to see with a spiritual eye, a call to write with the Other in mind, the call to write the archive in terms of its spiritual and visceral logics. These Potatoes Look Like Humans is a critical sociological reading of dispossession and violence. But it is also more than that.
references
1. Morrison T. The site of memory. In: Zinsser W, editor. Inventing the truth: The art and craft of memoir. 2nd ed. Boston, MA: Houghton Mifflin; 1995. p. 83–102.
2. Sharpe C. Black studies: In the wake. Black Sch. 2014;44(2):59–69. https:// doi.org/10.1080/00064246.2014.11413688
Volume 120| Number 5/6 May/June 2024 6 https://doi.org/10.17159/sajs.2024/18219 Book Review Land restitution and violence in South Africa Page 2 of 2
BOOK TITLE: How life works
AuThOr: Philip Ball
ISBN: 9781529095999 (paperback, 560 pp)
PuBLIShEr: Picador/Pan Macmillan, London, UK; ZAR399
PuBLIShEd: 2023
rEVIEWEr: Wieland Gevers1
AFFILIATION:
1Emeritus Professor of Medical Biochemistry, University of Cape Town, Cape Town, South Africa
EMAIL: wieland.gevers@uct.ac.za
hOW TO CITE:
Gevers W. Contesting the long leash of evolved genomes. S Afr J Sci. 2024;120(5/6), Art. #18302. https:// doi.org/10.17159/sajs.2024/18302
ArTICLE INCLudES:
☐ Peer review
☐ Supplementary material
PuBLIShEd: 28 May 2024
Contesting the long leash of evolved genomes
Philip Ball, the author of How Life Works, is a polymathic and highly distinguished British science writer and communicator. Originally educated as a chemist and physicist, he has written books on topics as widely separated as music and the history of China, but his main focus has been on the public understanding of physics, chemistry and biology. An editor at Nature for 20 years, he has won many awards for his work, one of the most recent being the 2022 Wilkins-Bernal-Medawar Medal of the Royal Society for “excellence in a subject relating to the history of science, philosophy of science or the social function of science.” He is a science writer at the top of his game, so to speak, and this is perhaps his most ambitious book.
How Life Works had its genesis in the author’s feeling over the years that the main narratives in the life sciences seemed still to be mired in outdated metaphors and conceptual frameworks. This was in the face of unprecedented progress in analytical and experimental technologies and an exponential expansion of ‘items of information’ (multiple complete genomes of different species or of members of the same species, the vast arrays of ‘-omics’ of various kinds, thousands of solved protein structures, etc.). The immediate catalyst was a three-month stay amongst Harvard faculty working at the cutting edge of many aspects of the biological sciences, talking, reading, analysing and synthesising. When he thought he had most of it right, he wrote How Life Works
The result is a readable but very challenging book, one that demands to be taken seriously. I recommend it strongly to anyone who is interested in the question implied in the title, and that should obviously be a lot of people across many disciplines. The content of the book is clearly well informed (there are many direct quotes, for example, and a huge list of references) by close contact with the best-available expertise and well-considered opinion. The most basic of these positions (which I will be contesting up to a point below) are that ‘the genes’ collectively (as genomes) are not a ‘blueprint’ but merely essential contributors to the overall development of organisms and their ongoing life; every level of organisation, from organelle to cell to tissue to organism, has its own playbook and causal agents; life works because it ‘has a point’, meaning that unlike the sad physicist who said that the “universe was the more pointless the more he understood it,” the most basic characteristic of living things is that they ‘have a point’, i.e. that they recognise meaning in their environment and engage purposefully with it to survive and live.
Ball lists and weaves into his narrative the key features that he thinks enable life to work: redundancy and complexity; modularity; canalisation of functions; multi-level, multi-directional and hierarchical organisation; combinatorial logic; agency and purpose; and distributed causal power. Each of these features is adumbrated more or less continuously throughout the text. He pungently captures their combined essence in the statement “It’s cognition all the way down,” from bacteria-sensing chemical gradients or over-crowding, and fighting off virus attacks, to humans embedded in societies, individually and collectively planning to make their environments more liveable, establishing amongst others healthcare systems of great complexity and scope, and, yes, wars and crime as well as art, music and literature. Thus non-deterministic meaning and purpose are key to how life works, and we can be grateful to Philip Ball for providing a clearly articulated argument for considering this to be the case.
Ball brings forth a number of insights that have a real ‘aha!’ quality to them. For example, the genetic regulatory mechanisms involved in recognising environments and responding appropriately to them are simpler and more robust in unicellular organisms (where the proteins concerned have more stable and defined structures) than is the general case in multicellular organisms, where signalling networks integrate information from many quarters. This happens through the presence of huge numbers of RNA transcripts of different (eventual) sizes that do not code for proteins but have complex and highly interactive regulatory roles, both at the primary transcriptional level and in determining the fate of already transcribed messenger RNA molecules. There are also a large number of regulatory proteins (transcription factors) with many unstructured regions of their polypeptide chains that facilitate multi-component ‘soft’ interactions and help to regulate the formation of messenger RNA molecules. Then there is the huge complication of preprogrammed epigenetic regulation of protein-coding and other genes. [Ball is silent on the second genomic entity in cells, the circular DNA molecules of the mitochondria, with their own interesting mutational playbook. He also does not mention the additional complexity of differential intracellular protein turnover rates, or the question of how active individual protein molecules are allowed to be by their interactions with small-molecule effectors. The truism in metabolic control that control of fluxes in pathways is generally shared between participating enzymes, with consequences for genotypes and phenotypes, is not touched on. But these omissions do not disrupt his main arguments for regarding different levels of organisation as having their own emergent playbooks for functioning.]
Ball sees the bewildering complexity of multicellular organisms as being ‘simplified’ by the presence of highly conserved genes that perform generic ‘patterning’ functions in development, networks of interactions between gene products that function (a little nebulously) as ‘attractors’, but especially by ‘causal power’ emerging through integration of physical and chemical forces with genetic signalling. He takes us step-by-step through the lives of cells, in principle autonomous but ‘forced’ to associate with other cells to form tissues and organs, and then bodies. It is always a story of responding to an environment with a repertoire of appropriate responses that draw on genetic information and exploit physicochemical forces in an integrated way. Difficult stuff, but he writes well and persuasively about it, making his espoused case for at least some genome-independent causal chains at every level.
© 2024. The Author(s). Published under a Creative Commons Attribution Licence.
Book Review
Thus Ball, in this book, sets out to overturn, in a very forceful and sometimes combative manner, the ‘gene-centric’ and ‘blueprint-dominated’ way he believes most people have thought that living multicellular organisms develop from the moment of fertilisation to full autonomous existence and reproduction in their environments. I believe, however, that he is actually mostly over-interpreting newer knowledge into an apparently very different way of thinking about how life works. While his book is an engaging, refreshingly articulate and up-to-date description
https://doi.org/10.17159/sajs.2024/18302
7
Volume 120| Number 5/6 May/June 2024
of the way in which he thinks the full development of a multi-cellular, multi-tissue, multi-organ body must of necessity involve some forces and mechanisms that are not initiated and controlled by genomes, he has minimised exploration of the ‘deep’ ways that highly evolved genomes ensure that every newly reproduced body conforms to the essential features of the anatomy and physiology (the reproductively capable phenotype) of the species concerned. What I call the ‘long leash of the highly evolved genome’ can, after all, legitimately be called a ‘blueprint’ provided this term is used to indicate a design that specifies both the number and nature of required components as well as instructions for how to put them together and make them work in a given settled geobiological environment. This would extend to include instructions for many kinds of repairs, immune defences against a host of invasive micro-organisms (the adaptive ones even including forms of rapid evolution in particular cells through multiple mutations and selection), and provisions for dealing with a wide range of environmental stressors in homeostatic ways. Clearly, there are limits to the reach of this genomic leash, witnessed in premature death and much in the way of disease pre-disposition or subtle kinds of diversity (gender, neuro-, etc.) or obvious abnormal development – but in the great majority of cases the products of the species-specific genomic specification will be near-identical versions (albeit usually as two dimorphic sexes) of animals and plants, and will work well in the ‘reproductive prime’ their genomes have been selected for. One can cite the fact that mono-zygotic (identical) twins almost always look anatomically identical, or take in the vast mammal herds on African grasslands, to be convinced that the rollout of the genomic ‘blueprints’ (as defined above) of different observed species is not exactly a fuzzy affair that can go every whichway through emergent causal chains. The playbooks Ball describes at different levels of organisation are nearly all built into, and subservient to, the long and highly evolved ‘genomic leash’.
In the case of a large group of macroscopically identical organisms such as the massive herds of African mammals referred to above, the genomic ‘blueprints’ vary in the population, some of which may be expressed as phenotypic variation on closer inspection and some not, arising from a whole variety of causes ranging from within-species genotypic differences, environmentally caused differences in epigenetic controls,
random post-zygotic somatic mutations during different stages of development, the effects of harmful agents, senescence-related changes not subject to natural selection, etc.
The only real problem with Ball’s fine book is thus the repeatedly stated view that ‘the genes’ contribute but by no means determine the outcome of organismal development. It is true that the genome constitutes information, while the organism is material. But Ball fully agrees that the notion of “the genes” must be extended from their original formulation as “genomic sequences coding for proteins” to all parts of the genome that supply information (‘coding’) for cellular, tissue and organismal functioning. He also resists the temptation to claim any kind of as yet unsubstantiated Lamarckist ‘top-down’ mechanism in mutation-based natural selection. He sticks to random gene mutations (in the broad sense of altered germ-line genomes) being what organisms can inherit, but justifiably believes that mutated genes, if selected for, increase in frequency together with clusters of other genes with which they cooperate in network fashion to produce the favoured phenotype concerned. He especially emphasises (as I am doing) the extensive ‘evolutionary memory’ embedded in the genome of a species, of successful adaptations achieved in past evolutionary stages, not needing to be solved anew in every speciation process. At the end of the day, these are sound conceptions according to presently available evidence, and they support the idea of a genomic determination of form and function through an evolved design that not only specifies very precisely what materials and where living bodies will contain but how they are to be put together and kept functional over time, while obeying applicable physical and chemical laws, and permitting some emerging functionalities (like consciousness and free will) to assist in the overall task of remaining alive and reproducing within uncertain environments.
All in all, readers of this book will enjoy a veritable tour de force of first-class biological science writing and a truly wonderful introduction to much that is new in the understanding of how life works, with the reservation that the extraordinarily well-elaborated (evolved) role of genomes is systematically under-estimated and under-appreciated. Bearing this important fact in mind, they will certainly acquire a deeper understanding of what it means to say life has a purpose and/or meaning, the answer to the most important question(s) most of us can ever ask.
Volume 120| Number 5/6 May/June 2024 8 https://doi.org/10.17159/sajs.2024/18302 Book Review Contesting the long leash of evolved genomes Page 2 of 2
Author: Margaret A.L. Blackie1
AFFILIAtIoN:
1Centre for Higher Education Research, Teaching and Learning, Rhodes University, Makhanda, South Africa
CorrESPoNDENCE to: Margaret Blackie
EMAIL: mags.blackie@ru.ac.za
hoW to CItE:
Blackie MAL. Indigenous knowledge systems and science education. S Afr J Sci. 2024;120(5/6), Art. #16860. https://doi.org/10.17159/sajs.202 4/16860
ArtICLE INCLuDES:
☐ Peer review
☐ Supplementary material
KEYWorDS: indigenous knowledge systems, science education, critical realism
PubLIShED:
28 May 2024
Indigenous knowledge systems and science education
Significance:
The inclusion of indigenous knowledge into the curricula of natural science courses remains contentious. In this paper I use critical realism to show the relationship between these two forms of knowledge. An engagement with both knowledge structures could afford better pedagogy and assessment. In addition, the engagement with indigenous knowledge allows for the development of ‘knower awareness’ in the practice of science. Meaningful engagement with indigenous knowledge could therefore enhance science education, whilst making visible the socio-cultural relevance to students.
Introduction
For nearly 20 years South Africa has had a formal indigenous knowledge policy.1,2 Prior to the call for decolonisation of higher education institutions that accompanied the #MustFall protests of 2015/2016, natural science curricula at all levels remained almost impervious to indigenous knowledge systems (IKS). The decolonisation project has broad scope. One aspect of decolonisation is the interrogation of the curriculum content. It is at this level of curriculum content that the inclusion of indigenous knowledge systems intersects with the decolonisation project. The focus of this paper is limited to the incorporation of IKS into the natural sciences.
Most academics in the natural sciences presumed the call of decolonisation to be irrelevant to their disciplines until the #ScienceMustFall video went viral.3 This video was a short clip from a debate which took place at the University of Cape Town during the #MustFall protests. In this video a student called for the replacement of Newton’s Laws by indigenous knowledge. In the wake of that incident, natural scientists took heed and entered the decolonisation conversation. The knee-jerk responses by academic scientists fell into two broad camps. The first was to argue that science was objective and therefore decolonisation was not an issue. The second was a scramble to include South African examples into existing courses.4 Both responses are inadequate, but the inadequacy is only made visible if we understand knowledge in the natural sciences.
I begin then with an exploration of knowledge and curricula, drawing on the work of Basil Bernstein. Bernstein’s work on pedagogy and curricula has been used extensively in academic development work across South African universities.5 In this paper, I argue that the link between IKS and science can and should be explored across all three fields identified in Bernstein’s pedagogic device6: the field of production (where knowledge is created, e.g.theresearchenvironment),thefieldofrecontextualisation(wheretheknowledgeispackagedforcommunication, e.g. the development of the curriculum), the field of reproduction (where new knowers are exposed to the packaged knowledge, e.g. the lecture theatre). Work is being done across all of these fields, as is illustrated herein. However, the major focus of this paper is the field of reproduction. In the field of reproduction, I argue that it is necessary to be very clear about the relationship between IKS and Western science in order to communicate well.
Approaches
In the intervening period, there have been multiple attempts to respond to the call for decolonisation by recognising South African knowledge in different ways. Some efforts are focused on widening what Bernstein terms the ‘field of production’.6 The field of production is the space in which knowledge is produced. The call for decolonisation is understood in a variety of ways, but all include a decentring of Western knowledge. But to de-centre Western knowledge requires the introduction of other knowledges. To achieve this end, some researchers are looking at indigenous knowledge practices and bringing these into public view through the vehicle of peer review publication. Examples of this include Manyevere et al.7 who focused their attention on soil classification amongst Xhosaspeaking people in the Eastern Cape.
A second approach is to facilitate communication and knowledge transfer between academic scientists and local communities. This approach falls under transdisciplinary research approaches. “Transdisciplinary research seeks to integrate diverse knowledge from academic and non-academic actors to co-produce knowledge or solution options while reconciling values and preferences, and creating ownership for problems as well as solutions.”8 For example, Cockburn et al.9 focused their attention on isiZulu names for insects found in KwaZulu-Natal in order to facilitate communication between entomologists and the local community. In Bernsteinian6 terms, such efforts would be located in the ‘field of recontextualisation’ where the knowledge is packaged in ways which can be digested by people in different contexts.
A third approach is to incorporate indigenous knowledge directly into the curriculum. This sits in Bernstein’s ‘field of reproduction’.6 There are more examples of these interventions in primary and secondary levels. For example, Metaus and Ngcoza10 report on the incorporation of clay pot making by the Ovawambo people into a secondary school science curriculum in Namibia.
What is the imperative?
The intention of the inclusion of IKS into science curricula is to valourise these traditional ways of knowing and thereby foreground the wisdom held in the indigenous peoples of South Africa.11 Onwu and Mufundira12 point to the “increase of socio-cultural relevance of science education” (p.230). Naidoo and Vithal, drawing on other studies, note that
9 https://doi.org/10.17159/sajs.2024/16860 Volume 120| Number 5/6 May/June 2024 © 2024. The Author(s). Published under a Creative Commons Attribution Licence. Perspective
the inclusion of IKS into the curriculum can provide “motivation and selfesteem; cultural responsiveness and relevance; increased peer interaction, and positive learning experiences” (p.254).11 There certainly is a need to ensure that the classic image of the scientist as a white, heterosexual, cisgendered male no longer prevails. There is also a need to disrupt the notion that science is a body of work produced by dead Europeans.13 It is important that the ‘field of production’ of science is not falsely constrained to the research product of our higher education institutions. To this end, transdisciplinary research is an important innovation.
However, the inclusion of IKS into a science curriculum must be done with some care. One needs to recognise that the knowledge structures of IKS and Western science are not necessarily the same. Incorporating ethnobotany such as a module on wild edible plants in a botany course14 can be used to show a different kind of classification in a module on plant taxonomy. Nonetheless, it is important to make visible to students the power of the classification system. To fail to point to the distinctions and relative power of different classification systems is a missed opportunity of teaching the way in which botanical knowledge is built. In a similar fashion, the brewing of traditional beer, umqombothi, is a chemical process, but the molecular understanding is not a part of the indigenous knowledge and this needs to be actively connected to chemistry if it is to be incorporated into a science curriculum.15
In order to ensure that IKS is appropriately incorporated into a science curriculum, one must consider the different kinds of knowledge. Carefully thinking this through allows for two important points: (1) We see that IKS and Western science are interrelated but are not the same thing. Careful observation and clear communication are essential to both. (2) We see that Western science in its quest for objectivity and reproducibility has failed to give sufficient attention to the particularity of the person who first develops an experiment to investigate a particular phenomenon.
Critical realism offers a useful perspective
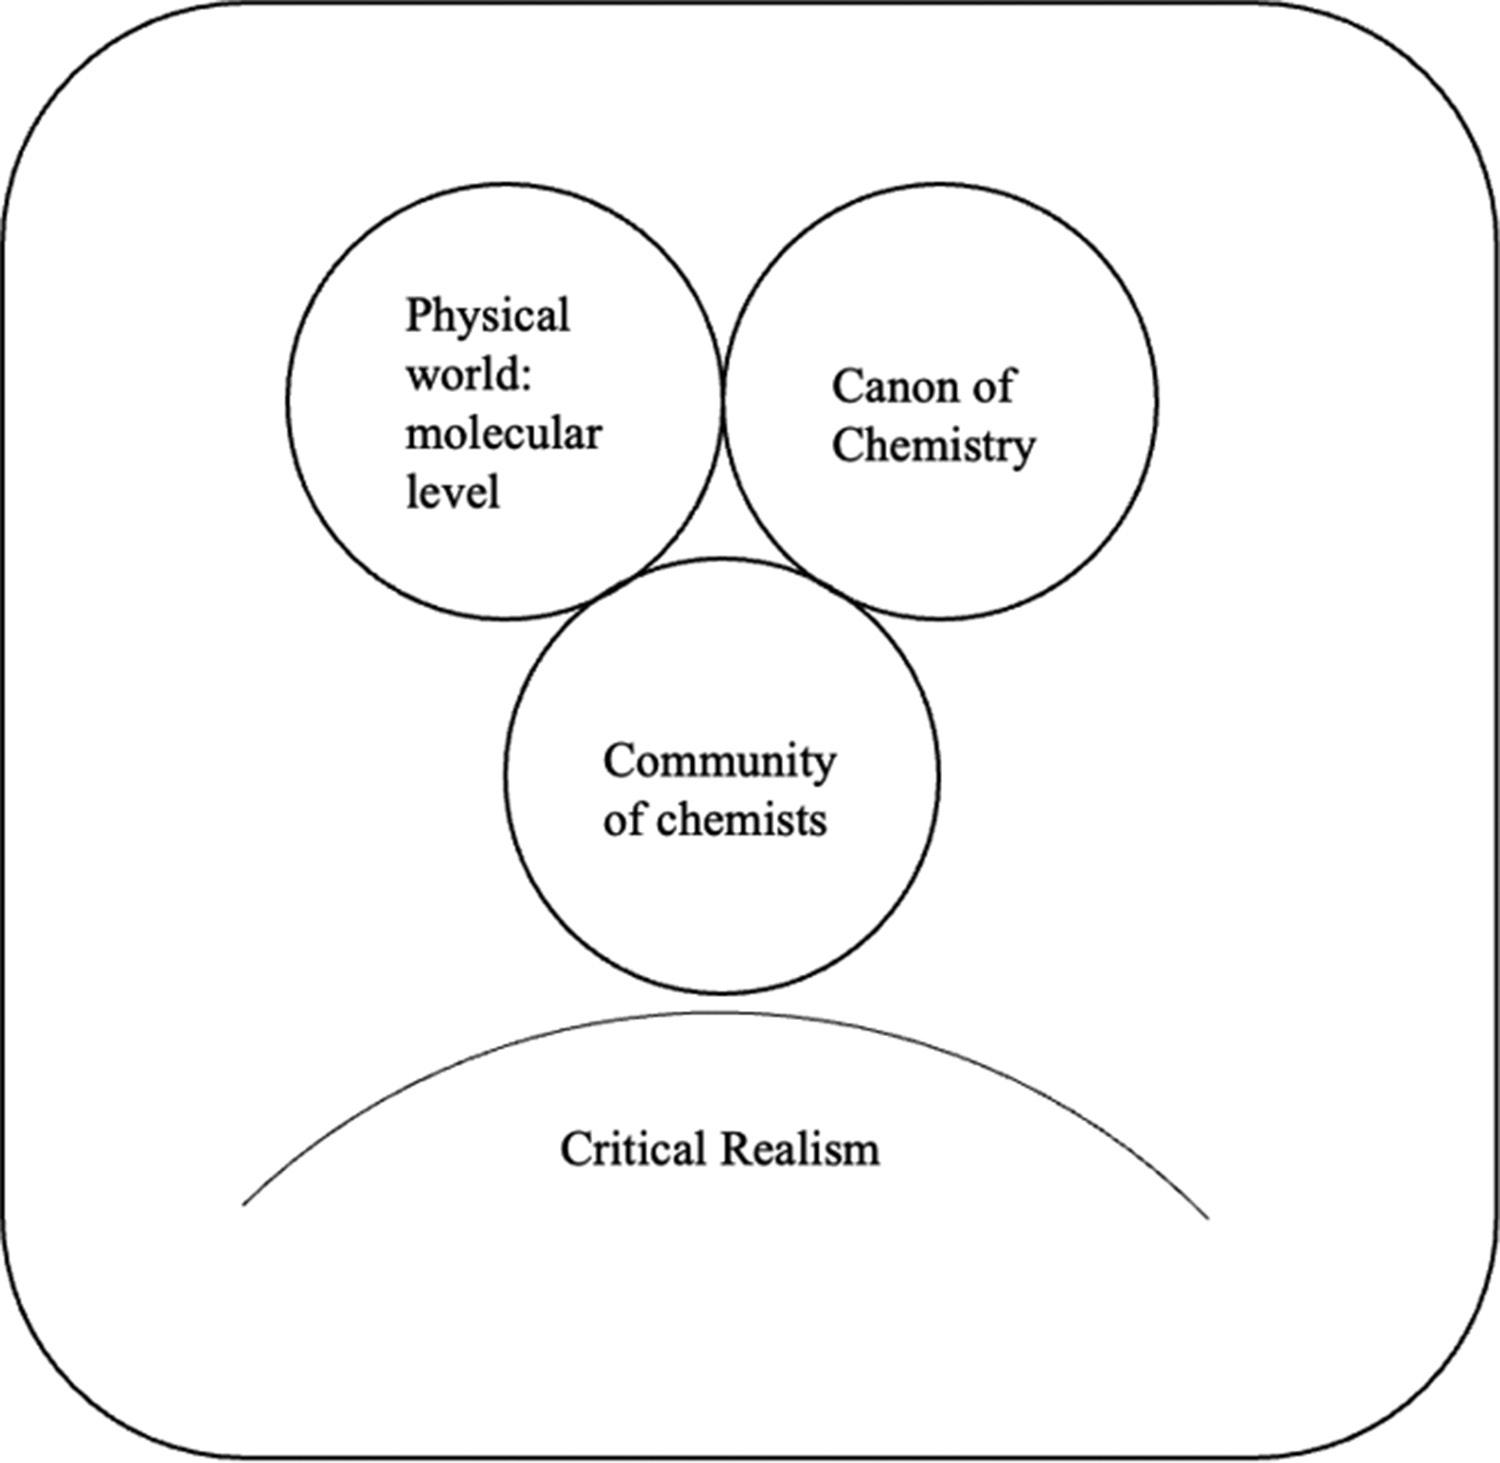
Critical realism offers a way to explore the relationship between Western science and traditional knowledge systems. Blackie16, drawing on Bhaskar17, argues that the practice of science is the intersection of three domains, illustrating this with the field of chemistry (Figure 1). The first domain is the physical world at the level of the molecular. The second is the ‘canon of chemistry’ – the knowledge field, that we know as the subject of chemistry, provides conceptual understanding to explain the real mechanisms and entities which give rise to changes at a molecular level. The third is the community of chemists. Because the science offers a conceptual explanation of real mechanisms which exist in the physical world, the fact that the concepts are socially constructed is frequently overlooked. In the physical sciences, the interrogation of the system to establish the causal mechanism takes place by closing the system. In chemistry, this closure is achieved through the use of specialist glassware. The scientist is not the passive observer of the system, rather they are an active agent in the design of the experiment, such that a single mechanism or sequence of mechanisms is isolated.16
Blackie16 argues that there are two distinct ways in which science advances illustrated by the practice of chemistry. The first is ‘chemistry as science’ – where the theory is under scrutiny. The physical world is taken to be fixed and the conceptual world (the canon of chemistry) is under scrutiny. The second is ‘chemistry as technology’ – where the theory is taken as fixed and used to manipulate the physical world in new ways, e.g. known reactions are used to create new kinds of molecules. The focus in this paper is on ‘chemistry as science’. ‘Chemistry as science’ is further subdivided into two levels. Level 1 is that of careful, accurate observation. A particular reaction or system is repeated over and over again and slowly refined. This level of careful description
Volume 120| Number 5/6 May/June 2024 10 https://doi.org/10.17159/sajs.2024/16860 Perspective IKS and science education Page 2 of 4
Figure 1: The practice of chemistry is the interaction between the three domains of the physical world: the molecular level, the canon of chemistry and community of chemists.
and observation is common to both Western science and IKS. Once the reaction can be reliably reproduced, the person can communicate the procedure to a second person. Because the underlying causal mechanism is real and is ‘intransitive’17, a second person following exactly the same procedure can reproduce the same result. In Western science, the established process of communication is through peerreviewed journal articles. In indigenous knowledge systems, oral traditions are more common, and the knowledge is often passed on to specific individuals. At Level 1, there is no meaningful distinction to be made between Western science and IKS. Western science may incorporate the use of more accurate instruments whereas indigenous knowledge may use more sensory information, but these differences can be understood as the use of different ‘tools’ and so different kinds of description are used. Nonetheless, the fundamental process at work is essentially the same.
However, Level 2 of ‘chemistry as science’16 affords the power of Western science. At Level 2, an explanation for the observed empirical process is sought. Here it is not sufficient to know how to do a particular reaction, one must have a conceptual explanation for why the reaction is happening. Level 2 is built from combining and probing various Level 1 activities. For example, across the globe we have evidence of indigenous cultures having the technology to isolate the metal we know as iron from iron ore using a process of applying heat in a clay furnace. That is a Level 1 activity. It is only with the development of the science of chemistry that we can say that what is happening at a molecular level is the reduction of iron oxide using carbon from burning wood. The heat combined with restricted supplies of oxygen means that the oxygen is removed from the iron oxide to form carbon dioxide and iron. The development of the periodic table and the discovery of oxygen as a component of air was required before the explanation was possible. The discovery of oxygen was only possible once the substantially more accurate spring balance was invented and the art of glass blowing was refined. These two technologies were necessary to make possible the kinds of experiments needed to discover the nature of what previously had been described as ‘phlogiston’. The accuracy of measurement of mass and isolation of gases could have been achieved through the creation of other technologies. Nonetheless, to our knowledge, there is no evidence of any indigenous culture creating equivalent technologies and so there is no indigenous molecular explanation.
It is on this foundation that I argue that indigenous knowledge and Western science are related but not interchangeable. In some sciences there may be a Level 2 equivalent in the indigenous knowledge system; it depends on the nature of the science and the dependence of the science on accurate measurement. Thus, when one is trying to combine IKS and Western science, one must be clear about what the Level 2 part of the science is and determine whether there is an IKS equivalent. Similarly, in some sciences, there may be large parts of the science that are still at Level 1. In such instances, IKS can be used alongside Western science. If the call for decolonisation is to decentre Western science, then one might argue that foregrounding the IKS when the science is primarily at Level 1 is the correct approach. However, when one is teaching chemistry, which is primarily at Level 2, to foreground IKS as equivalent to chemistry is inaccurate and misleading.
Making the knower visible
As has been stated earlier, one of the arguments against considering decolonisation of tertiary science higher has been the notion that ‘science is objective’.3 However, this position conflates the objectivity of scientific knowledge with the objectivity of scientists. The fact that a particular chemical reaction can be reliably reproduced by a second person is not a magic quality of either person, nor is it the genius of the training. The reproducibility lies in the causal mechanism which exists independently of the particular person. Two different people can perform the same reaction and get the same result. This reproducibility can result in ‘knower blindness’ in science.18 This knower blindness can also lead to the rejection of indigenous knowledge, because in order to have the increase in socio-cultural relevance and other positive impacts pointed to by various scholars10-12, it is necessary to locate the indigenous knowledge in a particular people. For example, Mateus and Ngcoza10
point to clay pot making by the Ovawambo people. This particularity of knowledge seems foreign to the universal claims made by science. The reproducibility afforded by the causal mechanism is conflated with an idea that scientists are interchangeable. However, there is always a particular person bringing together a particular set of ideas to interrogate a particular phenomenon. Blackie and Adendorff18 use the example of the attempts to determine the age of the earth by Kelvin and Joly. Each scientist brought their own skill set and understanding to bear on the problem. Kelvin turned to thermodynamics and Joly to the determination of the concentration of salts in aqueous solution. Science is in fact a profoundly creative endeavour.19 Each scientist is shaped by their training, the language they speak, the environment in which they grew up and the sum of their life experience. All this influences the field of study and the particular focus of their attention. This is why Blackie and Adendorff18 call for the importance of ‘knower awareness’ in the practice of science. Here, science can learn from IKS. The development of knowledge always emerges with a particular person in a particular place at a particular time. This allows for a major corrective of the Western tradition. We are not ‘brains on sticks’ –we are embodied beings and the fact of our embodiment matters.19
Conclusion
There is a huge opportunity to develop resources which adequately honour indigenous ways of knowing and being. Nonetheless, bringing indigenous knowledge into a science course needs careful thought. The person teaching must pay careful attention to the knowledge structure of their field and of the particular section of work being taught and the knowledge structure of the indigenous knowledge they intend to incorporate. The indigenous knowledge must be connected at the appropriate level. Because of this requirement, the pedagogy of science could well be improved by engagement with IKS in two ways. Firstly, the need to focus on the knowledge structures could facilitate more meaningful assessment.20 Understanding the knowledge structure affords the possibility of making knowledge building more visible to the students. Secondly, the significance of including local knowledge in terms of student engagement is important. This will help to facilitate the erosion of the image of the quintessential scientist as a white man.
It is also profoundly useful that an unexpected asset can be brought to science in the form of developing knower awareness. Knower awareness is an essential first step to the recognition that scientific knowledge can be used to different ends. Not all of these ends will be ethical and not all exploration of scientific questions is appropriate. Bringing to light the motivations of the person of the scientist is important. I believe that our practice of science can be enriched by intentional and careful incorporation of IKS into the knowledge project at all levels. This does not mean that IKS should be incorporated into every course.
Competing interests
I have no competing interests to declare.
references
1. Green L. Beyond South Africa’s ‘indigenous knowledge – science’ wars. S Afr J Sci. 2012;108(7/8), Art. #631. https://doi.org/10.4102/sajs.v108i7/8.631
2. Masoga M. South African research in indigenous knowledge systems and challenges of change. Indilinga Afr J Indig Knowl Syst. 2005;4(1):15–30.
3. Adendorff H, Blackie MAL. Decolonizing the science curriculum. In: Winberg C, McKenna S, Wilmot K, editors. Building knowledge in higher education: Enhancing teaching and learning with Legitimation Code Theory. London: Routledge; 2020. p. 237–254.
4. Blackie MAL. Implications of a critical realism approach to chemistry research and education. Nat Chem. 2023;15(8):1047–1050. https://doi.org/10.1038 /s41557-023-01274-2
5. Luckett K, Blackie MAL. Beyond epistemology: The challenge of reconceptualising knowledge in higher education. Teach High Educ. 2022; 27(8):1018–1026. https://doi.org/10.1080/13562517.2022.2111206
6. Bernstein B. Pedagogy, symbolic control and identity: Theory, research and critique. London & New York: Taylor & Francis; 1996.
Volume 120| Number 5/6 May/June 2024 11 https://doi.org/10.17159/sajs.2024/16860 Perspective IKS and science education Page 3 of 4
7. Manyevere A, Mnkeni PNS, Laker MC, Muchaonyerwa P. The use of indigenous knowledge systems in soil classification, appraisal and soil productivity rating for maize cropping: A case of the Xhosa speaking people in Raymond Mhlaba Municipality, South Africa. Indilinga Afr J Indig Knowl Syst. 2020;19(1):96–109.
8. Sellberg MM, Cockburn J, Holden PB, Lam DPM. Towards a caring transdisciplinary research practice: Navigating science, society and self. Ecosyst People. 2021;17(1):292–305. https://doi.org/10.1080/26395916. 2021.1931452
9. Cockburn JJ, Khumalo-Seegelken B, Villet MH. IziNambuzane: IsiZulu names for insects. S Afr J Sci. 2014;110(9/10), Art. #2013-0292. https://.doi.org/ 10.1590/sajs.2014/20130292
10. Mateus V, Ngcoza KM. The making of clay pots and its relevance to school science: Reclaiming knowledge in the cultural practice of Ovawambo people in Namibia. Indilinga Afr J Indig Knowl Syst. 2019;18(1):64–77.
11. Naidoo PD, Vithal R. Teacher approaches to introducing indigenous knowledge in school science classrooms. Afr J Res Math Sci Technol Educ. 2014;18(3):253–263. https://doi.org/10.1080/10288457.2014.956407
12. Onwu GOM, Mufundirwa C. A two-eyed seeing context-based approach for incorporating indigenous knowledge into school science teaching. Afr J Res Math Sci Technol Educ. 2020;24(2):229–240. https://doi.org/10.1080/1811 7295.2020.1816700
13. Blackie MAL. Diversity is an asset to science not a threat. Int J Crit Divers Stud. 2021;4(2):96–113. https://doi.org/10.13169/intecritdivestud.4.2.0096
14. Cimi PV, Ngcoza K, Dold T. The role of ethnobotany in integrating indigenous knowledge in the discipline of science education: A study by the Herbarium of the Albany Museum in South Africa. S Afr Mus Assoc Bull. 2020;42(1):1–8.
15. Mutanho C. Exploring indiginising the university’s science curriculum through bottom-up decolonisation: Affordances and hindrances [PhD thesis]. Makhanda: Rhodes University; 2021.
16. Blackie MAL. An examination of the practice of chemistry through the lens of critical realism. J Crit Realism. 2022;21(4):401–415. https://doi.org/10.108 0.14767430.2022.2069333
17. Bhaskar R. A realist theory of science. London: Routledge; 1978.
18. Blackie MAL, Adendorff H. A decolonial science education: How do we move forward? In: Hlatshwayo MN, Adendorff H, Blackie MAL, Fataar A, Maluleka P, editors. Decolonising knowledge and knowers: Struggles for university transformation in South Africa. London: Routledge; 2022. p. 103–120. https ://doi.org/10.4324/9781003106968
19. McGilchrist I. The matter with things: Our brains, our delusions, and the unmaking of the world. London: Perspectiva Press; 2021.
20. Blackie MAL. Knowledge building in chemistry education. Found Chem. 2022; 24(1):97–111. https://doi.org/10.1007/s10698-022-09419-w
Volume 120| Number 5/6 May/June 2024 12 https://doi.org/10.17159/sajs.2024/16860 Perspective IKS and science education Page 4 of 4
Author: Adetayo E. Obasa1
AFFILIAtIoN:
1Registrar Research Support Office, Research and Internationalisation, Development and Support Division, Faculty of Medicine and Health Sciences, Stellenbosch University, Cape Town, South Africa
CorrESPoNDENCE to: Adetayo Obasa
EMAIL: obasa@sun.ac.za
hoW to CItE:
Obasa AE. Large language models through the lens of ubuntu for health research in sub-Saharan Africa. S Afr J Sci. 2024;120(5/6), Art. #16814. https://doi.org/10.17159/sajs.202 4/16814
ArtICLE INCLuDES:
☐ Peer review
☐ Supplementary material
KEYWorDS:
ubuntu, large language models, artificial intelligence, sub-Saharan Africa
PubLIShED: 28 May 2024
Large language models through the lens of ubuntu for health research in sub-Saharan Africa
Significance:
The introduction of large language models has transformed text generation and accessibility across the globe. Ubuntu provides a distinct philosophy that could be useful in addressing the cultural and geographical nuances within the context of sub-Saharan Africa. Existing guidelines help offer a framework to foster and nurture consistency across diverse regions and cultures. These guidelines alone may not be sufficient to address past inequalities and disparities. An inclusive approach that adopts the guidelines in tandem with ubuntu philosophy could help promote equitable development and sustainability of these models across the sub-Saharan region.
Ubuntu provides a distinct philosophy that could be useful in addressing the cultural and geographical nuances within sub-Saharan Africa. This philosophy offers a unique framework that could prove valuable in navigating these nuances in the sub-Saharan region. At its core, ubuntu emphasises interconnectedness, community-driven engagement, and sustainability. This perspective underscores the need for culturally sensitive technology solutions that honour and safeguard local traditions while promoting individual liberties and communal welfare. Ubuntu’s approach offers an intriguing balance between the individual and the collective. Marginalised groups must be included in a comprehensive approach. Bias in sub-Saharan Africa has deep roots in historical injustice and is further reinforced by cultural norms, religious beliefs, and practices. In this article, I elaborate on ethical concerns in the context of sub-Saharan Africa.
Introduction
The utilisation of large language models (LLMs) in deep learning has recently experienced a substantial rise. These models are extensively trained using vast amounts of textual data to create responses that mimic human speech.1 Medical professionals and academics have also begun exploring potential applications of LLMs in their respective fields, given that a considerable portion of medical practice and research involves tasks heavily reliant on textbased materials, such as presentations, publications, and reporting.2
Several LLMs are presently being developed by major corporations such as ChatGPT by OpenAI, Med-PaLM-2 by Google DeepMind, BioGPT by MIT, LaMDA by Google, Sparrow by DeepMind AI, Pangu Alpha by Huawei, OPT-IML by Meta, and Megataron Turing MLG by Nvidia.3,4 BioGPT is designed explicitly for biomedical text generation and mining and can potentially revolutionise medicine and medical research.5 AI-powered LLM chatbots and virtual assistants can enhance patient engagement and support. Besides conducting research, these tools can offer customised health information, respond to patient enquiries, and aid in the self-management of long-term medical conditions.
Biomedical ethics is a systematic approach that considers fundamental beliefs, principles, and values to make informed decisions that benefit all parties involved. The decision-making process is guided by established theories and principles that aim to maximise the overall well-being of individuals, such as the utilitarian approach, which seeks to promote net benefits; the rights approach, which is focused on respecting people’s rights and freedoms; the justice approach, which is aimed at enhancing equity; the common good approach which emphasises service to the majority; and the virtue approach which involves treating others as we would want to be treated.6 Although Western philosophy and ethical approaches have long been dominant, there is growing interest in exploring other frameworks, such as ubuntu and indigenous wisdom systems, because they offer the potential for an advanced cultural understanding of ethics.7
Ubuntu, as a philosophy, emphasises the importance of recognising our shared humanity with others. It aligns with the universal principle of treating others as we would like to be treated ourselves, which is present in many cultures worldwide. Ubuntu, a southern African philosophy often translated as ‘I am because we are’, emphasises the importance of recognising our shared humanity with others.8 Additionally, adopting values from sub-Saharan Africa, a region facing significant economic challenges, could have practical and symbolic advantages towards greater inclusivity and progress. Furthermore, ubuntu’s relational approach, which emphasises communitarianism, has practical and symbolic advantages for fostering greater inclusion of sub-Saharan Africa in artificial intelligence (AI) ethics discussions and for reaping both economic and social benefits from AI. This approach is not exclusive to Africa, but its widespread influence on numerous African subcultures and its significant role in sub-Saharan African philosophy and ethics make it particularly relevant.9,10
This approach offers collective decision-making (a cultural context and local engagement), humanity over machines (biasandfairness)andcommunitytrust(dataprivacy,security,andsovereignty).Thefourcorebioethicsprinciples–autonomy, beneficence, non-maleficence, and justice6 – can inform and guide the nuanced areas of cultural context, technology–human dynamics, and trust in the digital and data-driven era.
Assessing the ethical implications of novel sub-Saharan technologies while prioritising their moral and beneficial uses, which contribute to societal well-being, requires the utmost attention.11 LLMs have promising uses in subSaharan Africa; however, ethical concerns around cultural context, local engagement, bias, data security, and
13 https://doi.org/10.17159/sajs.2024/16814 Volume 120| Number 5/6 May/June 2024 © 2024. The Author(s). Published under a Creative Commons Attribution Licence. Perspective
sovereignty through the lens of ubuntu must be addressed. In this article, I elaborate on these ethical concerns in the context of subSaharan Africa.
Cultural context and local engagement
Sub-Saharan Africa is a diverse region with various cultural and social factors that can significantly impact the adoption and success of AI applications in health care.12 While it is challenging to consider all these factors, it is crucial not to ignore the existing diversity. When considering this perspective, there are two sides to the debate on ethical guidelines. Universal guidelines prioritise autonomy, individual rights, and structured engagement, promoting equal treatment and opposing impartiality. From a Western viewpoint, the individual tends to be at the centre of attention; for example, upholding the principle of autonomy involves respecting an individual’s decision-making abilities without undue influence or coercion.13
Although these guidelines are well grounded, AI ethics face challenges in resolving disparities stemming from historical disadvantage, value misalignment, and global exclusion felt by developing countries, where AI reflects Western values, agendas, and motives.14 Most of these guidelines and recommendations are developed by stakeholders from economically developed, primarily Western regions such as the USA and the European Union.14,15 It is essential to consider cultural context when considering generic principles, especially in post-colonial Africa, given its history of imposed external values.16
The power of universal principles in guiding human behaviour towards a sustainable and just future cannot be overstated. However, excluding certain groups can result in a lack of representation and failure to acknowledge diverse perspectives and experiences. By ensuring that everyone has a seat at the table, we can establish a more inclusive and equitable system that reflects the needs and aspirations of all. This approach fosters trust, understanding, and collaboration between communities and lays the foundation for a better future for everyone.17 A one-size-fits-all approach may not adequately address these challenges; hence the importance of community participation in context-specific guidelines considering cultural values and religious practices.18
In the context of AI development, integrating ubuntu philosophy would prioritise cultural context and local community engagement. This means involving community members in the decision-making processes to ensure that AI technologies align with the values and needs of the community. Integrating ubuntu philosophy and Western principles in ethical frameworks, particularly in AI, can lead to a more balanced, inclusive, and culturally sensitive approach. This combination can strengthen ethical guidelines by respecting individual autonomy and community impact, promoting inclusivity by representing diverse values, and facilitating mutual learning across cultures. The Western principles provide a foundation in rights, justice, and equality, while ubuntu contributes a community-oriented perspective emphasising interconnectedness and communal well-being. By considering these principles, we can create an ethical framework that strengthens the implementation of AI ethics, fostering trust and support from a broader range of stakeholders while upholding individual and communal values.12
For instance, mental health resources in Africa are overburdened and overwhelmed.19 With an ubuntu-centred approach, integrating these models could assist a wide range of tasks and alleviate the mental healthcare burden, as it offers the unique potential to complement human qualities of empathy and interpret and predict behavioural patterns.20 This strategy could narrow the care gap without compromising the essential human touch – however, the digital gap remains a threat in Africa and this could widen inequalities in areas with limited connectivity. The recent Internet outage experienced in Africa is a stark reminder of the digital gap.21 Public–private partnerships, including non-governmental, are crucial to ensuring that mental health resources and technologies are accessible and affordable for everyone. With sufficient regulatory, ethical, and privacy safeguards, these models serve as supplementary rolestosupportclinicallyorientedtasks.Theseinitiativesshouldprioritise inclusive design practices and align with ubuntu’s community, dignity,
and holistic well-being values. By emphasising these concepts, these models can bridge care gaps while honouring the principles of empathy, mutual support, and ubuntu’s community values of interconnectedness and mutual care. This approach could ensure that mental health care remains compassionate, inclusive, and practical, and reflects the core of ubuntu philosophy22 in mental health and technological advancement.
bias and fairness
Bias and fairness are critical global considerations for harms associated with LLMs in medicine and health research.23 These models often reflect the training data which can amplify existing social inequalities. In the sub-Saharan region, colonialism has left indelible marks on its societies – this historical backdrop has implications for modern-day biases. These biases are expressed when external entities approach the region with preconceived notions and attempt to apply global standards without local context. The sub-Saharan region is home to diverse cultures, traditions, and languages; amid globalisation, the region has maintained its cultural identities. Although this rich diversity can lead to intergroup biases within the region, it also serves as a testament to the resilience and adaptability of the region.24 Vulnerable populations, including those in low- and middle-income countries (LMICs), are susceptible to various biases due to existing social bias against minority groups, lack of technical capacity, and digital divide.25 When addressing bias, the goal is not to achieve perfect unbiasedness – an arguably unattainable ideal – but to strive for fairness and equity in algorithmic decisions, continuously improving and adapting systems as our understanding of bias evolves. This pursuit of fairness and equity necessitates constantly improving and adapting systems as our understanding of bias evolves. Simply adding more data to data sets is not enough to eliminate algorithmic bias. We must address fundamental issues such as historical inequalities in data, biased algorithm creation and implementation, biased interpretation of results, and feedback loops that reinforce bias. A comprehensive strategy is necessary to mitigate these biases, including a thorough evaluation of data sources, inclusive and transparent algorithm development, conscientious application of algorithmic recommendations, and ongoing oversight to adapt, correct biases, and blend technical, ethical, and equitable approaches.26 To this end, the developers of these models need to consider a collaborative approach with stakeholders from diverse backgrounds, – including policymakers, technologists, social activists, community leaders and/or members – to harness the strength and minimise potential unintended harms.
These models need to be trained with representative data that captures the richness and diversity of this region’s linguistic and cultural landscape. LLMs can produce unbiased and equitable outputs which accurately reflect contemporary cultures. One such example of this would be the ability of LLMs to translate valuable information into local dialects, ensuring that even those in linguistically marginalised communities can access and benefit from it. Specific local dialects, particularly those lacking standardised orthographies or limited online representation, can be complex for these models to process accurately. There is a need to work in tandem with regional linguistic and cultural specialists, and collaborative efforts can refine and adjust LLMs to better account for these subtleties. To enhance their visibility, promoting the digital representation and documentation of these languages is crucial.
Using LLMs in this region should go beyond mere task completion. Hence, emphasising the ubuntu philosophy of holistic well-being, LLMs canserveasplatformstocelebrateanddisseminatelocaltraditions,tales, and languages. These models can also bridge generational gaps, helping the youth connect with age-old traditions and histories. In addition, it is crucial to note that fairness can vary depending on cultural, social, and historical contexts. Therefore, by adopting a more comprehensive approach, AI systems can better navigate the complexities of fairness and avoid unintended consequences that reinforce existing biases.27 This approach would involve incorporating a broader range of factors and perspectives into the design and evaluation of AI systems, ensuring that they are sensitive to the diverse needs and values of the communities they serve.
Volume 120| Number 5/6 May/June 2024 14 https://doi.org/10.17159/sajs.2024/16814 Perspective LLMs through the lens of ubuntu Page 2 of 4
Data privacy, security, sovereignty, and sustainability
The development and deployment of technology, specifically LLMs and other AI systems, require the consideration of four interconnected pillars: data privacy, security, sovereignty, and sustainability. These pillars are crucial in ensuring responsible and ethical practices are maintained in the technical domain. The sub-Saharan African region encounters distinct data privacy and security challenges stemming from limited resources and inadequate infrastructure.28 A key component of data sovereignty and ownership is maintaining control over data generated within sub-Saharan African nations and their citizens’ data. This level of security requires abiding by data protection laws that prioritise protecting individual privacy and outline the responsibilities of those in charge of data. Careful management of cross-border data transfers is also necessary to balance the benefits of data sharing with privacy concerns. It is imperative to balance data sharing and privacy to ensure responsible use and safeguard citizens’ privacy.
The primary goals of data sovereignty and ownership are to maintain control over data, protect citizens’ privacy, and responsibly harness the benefits of data and AI technologies for the region’s development. Achieving these objectives requires striking a balance between protecting national interests, promoting local innovation, and fostering global cooperation in data governance.
Ensuring data privacy, security, and sovereignty of information is of the utmost importance in the digital age – because these models rely on large amounts of data, it is an imperative to maintain trust and protect individual rights by safeguarding this information. However, beyond these points, reducing the carbon footprints and investing in renewable energy sources would help mitigate the environmental impact of these tools, as sustainability of the environment is crucial.24 Integrating ubuntu and universal principles provides a critical balance for developers and users to foster socially and environmentally responsible technologies. Developers should think beyond these models and develop technologies that are sustainable and efficient while at the same time enhance privacy and security. Furthermore, these interconnected pillars should be central to regulatory and government agencies when developing regulatory frameworks.
In conclusion, to ensure the ethical and responsible development and deployment of AI technologies in health care in sub-Saharan Africa, it is important to adopt a flexible approach that combines universal ethical principles25 with the region’s specific cultural and social context. While a universal guideline can prevent biases and discrimination26, there is a need for empirical research to address ethical nuances in LLMs across all disciplines. Considering these unique challenges among countries and communities in the region would be critical. An inclusive approach that promotes ubuntu core values is crucial to promote equitable development and sustainability of AI systems and to ensure that the region unlocks AI’s full potential while respecting and preserving its diverse cultural heritage.
Competing interests
I have no competing interests to declare.
references
1. Li H, Moon JT, Purkayastha S, Celi LA, Trivedi H, Gichoya JW. Ethics of large language models in medicine and medical research. Lancet Digit Health. 2023;5(6):e333–e335. https://doi.org/10.1016/S2589-7500(23)00083-3
2. Topol EJ. High-performance medicine: The convergence of human and artificial intelligence. Nat Med. 2019;25(1):44–56. https://doi.org/10.1038/ s41591-018-0300-7
3. Topol EJ. As artificial intelligence goes multimodal, medical applications multiply. Science. 2023;381(6663), eadk6139. https://doi.org/10.1126/sci ence.adk6139
4. Cacciamani GE, Eppler MB, Ganjavi C, Pekan A, Biedermann B, Collins GS, et al. Development of the ChatGPT, generative artificial intelligence and natural large language models for accountable reporting and use (CANGARU) guidelines [preprint]. arXiv. 2023;arXiv:2307.08974v1. https:// doi.org/10.48550/arXiv.2307.08974
5. Luo R, Sun L, Xia Y, Qin T, Zhang S, Poon H, et al. BioGPT: Generative pretrained transformer for biomedical text generation and mining. Brief Bioinform. 2022;23(6), bbac409. https://doi.org/10.1093/bib/bbac409
6. Beauchamp JF, Childress TL. Principles of biomedical ethics. 8th ed. New York: Oxford University Press; 2019.
7. Kholopa C. The Interplay of ubuntu and hospitality as defining tenets in African and South African ethics: A Christian ethics reflection. Glob J Hum Soc Sci. 2022;22(C2):23–33. Available from: https://socialscienceresearch.org/index .php/GJHSS/article/view/4021
8. Teffo LJ. The concept of Ubuntu as a coherent moral value. Pretoria: Ubuntu School of Philosophy; 1994.
9. Eze MO. What is African communitarianism? Against consensus as a regulative ideal. S Afr J Philos. 2008;27(4):386–399. https://doi.org/10.43 14/sajpem.v27i4.31526
10. Gade CBN. What is ubuntu? Different interpretations among South Africans of African descent. S Afr J Philos. 2012;31(3):484–503. https://doi.org/10.1 080/02580136.2012.10751789
11. Dave T, Athaluri SA, Singh S. ChatGPT in medicine: An overview of its applications, advantages, limitations, future prospects, and ethical considerations. Front Artif Intell. 2023;6. https://doi.org/10.3389/frai.2023. 1169595
12. Owoyemi A, Owoyemi J, Osiyemi A, Boyd A. Artificial intelligence for healthcare in Africa. Front Digit Health. 2020;2. https://doi.org/10.3389/fdg th.2020.00006
13. Genuis QIT. A genealogy of autonomy: Freedom, paternalism, and the future of the doctor-patient relationship. J Med Philos. 2021;46(3):330–349. https: //doi.org/10.1093/jmp/jhab004
14. Roche C, Wall PJ, Lewis D. Ethics and diversity in artificial intelligence policies, strategies and initiatives. AI Ethics. 2023;3(4):1095–1115. https:/ /doi.org/10.1007/s43681-022-00218-9
15. Corrêa NK, Galvão C, Santos JW, Del Pino C, Pinto EP, Barbosa C, et al. Worldwide AI ethics: A review of 200 guidelines and recommendations for AI governance. Patterns. 2023;4(10), Art. #100857. https://doi.org/10.10 16/j.patter.2023.100857
16. Carman M, Rosman B. Applying a principle of explicability to AI research in Africa: Should we do it? Ethics Inf Technol. 2021;23(2):107–117. https://doi .org/10.1007/s10676-020-09534-2
17. Dempsey N, Bramley G, Power S, Brown C. The social dimension of sustainable development: Defining urban social sustainability. Sustain Dev. 2011;19(5):289–300. https://doi.org/10.1002/sd.417
18. Upadhyay N, Upadhyay S, Dwivedi YK. Theorizing artificial intelligence acceptance and digital entrepreneurship model. Int J Entrep Behav Res. 2022;28(5):1138–1166. https://doi.org/10.1108/IJEBR-01-2021-0052
19. Baker N, Naidu K. The challenges faced by mental health care users in a primary care setting: A qualitative study. Community Ment Health J. 2021;57(2):285–293. https://doi.org/10.1007/s10597-020-00647-y
20. Bila N. UP expert opinion: Ubuntu as a solution to mental illness challenges [webpage on the Internet]. c2024 [cited 2024 Mar 04]. Available from: http s://www.up.ac.za/news/post_3210600-op-ed-ubuntu-as-a-solution-to-men tal-illness-challenges
21. Auerbach Jahajeeah J. Undersea cables for Africa’s internet retrace history and leave digital gaps as they connect continents. The Conversation Africa. 2024 March 15. Available from: https://theconversation.com/undersea-cab les-for-africas-internet-retrace-history-and-leave-digital-gaps-as-they-conne ct-continents-225912
22. Edwards S, Makunga N, Ngcobo S, Dhlomo M. Ubuntu: A cultural method of mental health promotion. Int J Ment Health Promot. 2004;6(4):17–22. https:// doi.org/10.1080/14623730.2004.9721940
23. Obasa AE, Palk AC. Responsible application of artificial intelligence in health care. S Afr J Sci. 2023;119(5/6), Art. #14889. https://doi.org/10.17159/s ajs.2023/14889
24. Matemba Y. Decolonising religious education in sub-Saharan Africa through the prism of anticolonialism: A conceptual proposition. Br J Relig Educ. 2021;43(1):33–45. https://doi.org/10.1080/01416200.2020.1816529
Volume 120| Number 5/6 May/June 2024 15 https://doi.org/10.17159/sajs.2024/16814 Perspective LLMs through the lens of ubuntu Page 3 of 4
25. Tiffin N, George A, LeFevre AE. How to use relevant data for maximal benefit with minimal risk: Digital health data governance to protect vulnerable populations in low-income and middle-income countries. BMJ Glob Health. 2019;4(2), e001395. https://doi.org/10.1136/bmjgh-2019-001395
26. Chen P, Wu L, Wang L. AI fairness in data management and analytics: A review on challenges, methodologies and applications. Appl Sci. 2023;13(18), Art. #10258. https://doi.org/10.3390/app131810258
27. Mikalef P, Conboy K, Lundström JE, Popovič A. Thinking responsibly about responsible AI and ‘the dark side’ of AI. Eur J Inform Syst. 2022;31(3):257–268. https://doi.org/10.1080/0960085X.2022.2026621
28. Kuteyi D, Winkler H. Logistics challenges in sub-Saharan Africa and opportunities for digitalization. Sustainability. 2022;14(4), Art. #2399. https://doi.org/10.3390/su14042399
Volume 120| Number 5/6 May/June 2024 16 https://doi.org/10.17159/sajs.2024/16814 Perspective LLMs through the lens of ubuntu Page 4 of 4
AutHor: Andrew Thatcher1
AFFILIAtIoN:
1Department of Psychology, University of the Witwatersrand, Johannesburg, South Africa
CorrESPoNDENCE to: Andrew Thatcher
EMAIL: Andrew.Thatcher@wits.ac.za
HoW to CItE:
Thatcher A. Making green technology work for people and the environment.
S Afr J Sci. 2024;120(5/6), Art. #18187. https://doi.org/10.17159/sa js.2024/18187
ArtICLE INCLuDES:
☐ Peer review
☐ Supplementary material
KEYWorDS: human factors and ergonomics, systems-of-systems, human–technology interaction, constructed wetlands, resilience
PubLISHED: 28 May 2024
Making green technology work for people and the environment
Professor Andrew Thatcher is the recipient of the 2022/2023 NSTF-South32 Green Economy award in recognition of his work on extending our understanding of human factors and ergonomics to consider the entire Earth system, which included theoretical investigations, empirical investigations, and systematic reviews of the impact of these activities leading to mutually supportive human–natural environment systems.
Significance:
While many technologies exist to address the wide variety of sustainability challenges facing humanity, many technologies are not adopted at sufficient scale or are used incorrectly, negating the positive impacts. This commentary introduces the discipline of human factors and ergonomics, demonstrating four features that facilitate the effective design and implementation of eco-socio-technical systems for sustainability. An example of the URBWAT research project, which implemented a nature-based solution in an informal settlement to collect and treat greywater, is given to illustrate how these four features operate in practice.
Introduction
It is widely recognised that humanity’s current activities are leading us on an unsustainable path.1 Not only are we facing a human-induced climate crisis, but human activities are also contributing to significant biodiversity loss, unsustainable consumption of natural resources, degradation of land and ecosystems, rapid urbanisation without sufficient supportive infrastructure, and massive social and economic inequalities2, and we face the threat of pandemics that can severely disrupt our global economic, health, and social systems3. We are not a world in equilibrium, but a world in denial about our negative impact on our life-supporting systems. South Africa’s sustainability issues match these global trends with a particular emphasis on high susceptibility to climate change such as drought, heat, and localised weather events such as flooding.4 For South Africa, climate change also creates risks for biodiversity loss, health issues from the spread of infectious diseases, and reduced food security.5 However, South Africa, like many other vulnerable Global South countries, also faces an ‘adaptation deficit’ with regard to sustainability challenges because we have many other socio-economic development needs that require attention.6
Sustainability is fundamentally a human problem. Certainly, humans have contributed to biodiversity and ecosystem loss and biophysical disruptions2, but the underlying issue of sustainability refers to whether humans can live tolerable, healthy, and dignified lives in synergy with natural systems that provide the life-sustaining resources for our survival (including air, food, water, shelter, and materials). Few would argue that there are millions (if not billions) of people living in informal settlements, cities, war zones, and in environments with degraded access to nature who would not meet these criteria. However, we must also bear in mind that while natural systems and the planet will carry on in some form even in the absence of humans, the opposite is not true. This is essentially what we mean by sustainability.
Of course, there are many technological solutions that have been developed (and will continue to be developed) to address these sustainability issues. One problem is that many of these technological solutions are seldom adopted7, are adopted at a low level, or are used incorrectly (e.g. electric vehicles8). A reason for this slow rate of adoption or poor use is not only because of availability, financial, or political reasons (although these are pertinent drivers of success or failure), but because their integration with human users is poor or ineffective.9 The discipline that considers the interaction between humans and technology within the context of their environment is known as human factors and ergonomics (HFE). The International Ergonomics Association10 defines HFE as:
the scientific discipline concerned with the understanding of interactions among humans and other elements of a system, and the profession that applies theory, principles, data, and methods to design in order to optimise human well-being and overall system performance.
One of HFE’s roots is in sociotechnical systems, originally developed by the Tavistock Institute11, as a means of understanding the interactions between the social system (the humans), the technology, and the manufacturing system (the interactions between humans and technology). However, finding solutions that address sustainability concerns requires more than the consideration of sociotechnical systems. To move forward, it is necessary to recognise the importance of understanding the human–environment–technology interactions. In HFE terms, this means moving beyond sociotechnical systems to look at ‘ecosociotechnical’ systems. But what can HFE bring to our understanding of workable interventions, technologies, and solutions for a sustainable future?
HFE principles that help achieve sustainability in design
HFE’s general approach is to apply human-centred systems-thinking to enable resilient systems. When considered in the context of sustainability, this encapsulates what the European Commission12 refers to as Industry 5.0: work that is sustainable, human-centred, and resilient. For HFE, this sustainable future is achieved through the core features of the discipline being human-centred, transdisciplinary, resilient, and adopting a systems approach.
17 https://doi.org/10.17159/sajs.2024/18187 Volume 120| Number 5/6 May/June 2024 © 2024. The Author(s). Published under a Creative Commons Attribution Licence. Invited Commentary
Human-centred
By definition10, HFE puts humans at the centre of the design and intervention process. HFE traditionally considers the physiological, anatomical, and psychological attributes and capabilities of humans in their interactions with other elements of the system. Historically, from a physical perspective, this has included aspects such as whether the human could effectively and efficiently see, hear, touch, fit into, reach, or manipulate other physical elements of the system under the expected variety of environmental conditions (e.g. lighting, ambient temperature, and vibratory conditions). With the development of psychological cognitive models in the 1960s, this was expanded to include issues such as being able to recognise, understand, make decisions, and problem solve under conditions of ambiguity and uncertainty. More importantly though, the HFE approach has always been about first trying to understand human needs, interests, and motivations in order to design systems that improve human efficiency, effectiveness, and safety.
Transdisciplinary
Asshouldbeevidentfromitsdefinition10,HFEhasstrongmultidisciplinary roots drawing theory and methods liberally from anatomy, physiology, biokinetics, cognitive psychology, organisational psychology, as well as applications from numerous engineering and design disciplines. HFE does not just borrow from these disciplines, but actively contributes to the development of new theory, novel methods of analysis, while also making additional contributions to design from a human-centred perspective. HFE can therefore be considered as transdisciplinary, embracing the type of transdisciplinary work that regularly includes users of technologies and systems as well as other community actors that Lang et al.13 argue are necessary for effective sustainability work. HFE calls this approach ‘participatory design’, which is well embedded in the field generally and strongly endorsed for work involved in resolving societal problems typical of sustainability.14 Participatory design adheres to the principle that the users’ lived experiences make them ideal partners in the design process as they have direct experience with the surrounding systems (e.g. the environment, the work, and the social structures) and they have to live with the consequences of any design interventions.15
Resilience
For decades within HFE, humans (and sometimes other biological entities) were considered to be the sole components of systems that enabled system resilience. However, a central component of HFE design for complex technological systems over the last two decades has been the concept of resilience engineering, popularised by Hollnagel et al.16 The resilience engineering design approach recognises that complex systems need to be adaptive to uncertain, sometimes chaotic, environments in order to persist and that resilience must also be embedded in non-biological agents, including technology. For HFE, there are two important components for resilience engineering: adaptive capacity17 (i.e. the potential to adapt to future challenges) and graceful extensiblity17 (i.e. being able to continue having adaptive capacity). In HFE, resilience engineering has typically been applied to the design of complex engineered systems like nuclear power plants and spacecraft, but, more recently, applications can be seen in the design of infrastructure (e.g. electricity grids) and cybersecurity.18 Applying the concepts to address sustainability issues is an easy step to make, one that has already been made by Thatcher and Yeow19 in their sustainable systems-of-systems framework described under the systems approach.
Systems approach
HFE considers itself a systems discipline10,20, usually viewing humans as integrated physiological, psychological, and anatomical systems that interact within a context (i.e. an environment or organisation) that includes other systems. Wilson20 went so far as to suggest that HFE approaches that do not take a systems view cannot be considered HFE at all. Moray21 encapsulates this thinking as a nested set of systems that include physical, psychological, and technological considerations at the centre, with increasingly complex systemic factors surrounding these central systems, from team and organisational factors through legal and regulatory frameworks to societal and cultural pressures. The
HFE systems approach embraces all these external and internal factors as contributory towards whether a technological system is adopted (or not). Building from this systemic understanding, HFE has developed numeroussystemsanalysistoolstohelpunpackcomplexscenariossuch as accidents and nuclear power plant design in order to identify possible places to intervene and improve design.22 However, these existing HFE complex systems analysis tools lack important attributes (such as coping with emergence, adaptations, and transitions) making them ineffective in handling sustainability problems.22 In contrast, Thatcher and Yeow’s19 sustainable systems-of-systems (SSoS) framework might help HFE conceptualise the relevant factors for the design of sustainable systems that include humans and technology.
The SSoS framework merges HFE design thinking with ecological models of systems: SSoS adopts the concept of natural nested hierarchies of complexecologicalsystemsfromCostanzaandPatten’s23 andGunderson and Holling’s24 concepts of complex adaptive cycles and panarchies. Natural systems can be represented as a nested hierarchy of increasing complexity and size23 (e.g. an individual, a family, a community, and society). Complex adaptive cycles demonstrate how ecological systems naturally pass through predictable phases during their life cycle, while panarchies show how complex adaptive systems interact to inhibit or enable change across adjacent levels of a nested hierarchy of systems.24
The SSoS framework19 uses Wilson’s20 nomenclature of target system (the system of interest to the intervenors), sibling systems (at the same level in the nested hierarchy), child systems (at smaller, less complex levels in the nested hierarchy), and parent systems (at larger, more complex levels in the nested hierarchy) to define the related systems that might influence the design intervention. Recent applications of the SSoS framework have been applied to identify design solutions for several sustainability problems including designing post-pandemic work-fromhome strategies after COVID-1925, enabling organic farming methods to permeate through France26, designing a nature-based sanitation solution in South Africa27, and identifying decarbonisation strategies in China28
To demonstrate how these different HFE features can contribute to producing improved, sustainable solutions, a summary of the design and implementation of a nature-based sanitation solution for dealing with greywater collection and treatment in an informal settlement27,29 is given as an example.
urbWAt as an example of HFE design thinking
The URBWAT research project was an interdisciplinary research initiative that looked at finding solutions to greywater collection and treatment in an urban informal settlement. The study site was Setswetla, an urban informal settlement in Johannesburg, South Africa, on the northern edge of Alexandra township, wedged between Marlboro Gardens Cemetery to the west, the Jukskei River to the east, and Marlboro Drive to the north. The URBWAT project worked in a small section of Setswetla called Silvertown. The original inhabitants of Silvertown were settled there in early 2006 by the local government which provided zincsheet accommodation (hence the name ‘Silvertown’). In this context, local government provided potable water available from community standpipes, a limited number of chemical toilets, limited electricity connections, and solid waste removal from a single skip bin which was removed once a month. However, in Silvertown (as is the case elsewhere in Setswetla and in many other South African informal settlements) there is nowhere to dispose of wastewater from cooking, cleaning, and bathing activities. Instead, residents have created informal channels and ad hoc disposal points for this wastewater which then travels through the community and into the Jukskei River without any treatment.
The URBWAT research project’s aim was to work with the community to find nature-based solutions for the collection and treatment of this wastewater before it contaminated the community and the river. The nature-based solution that was chosen by the community was small, sub-surface horizontal constructed wetlands. In nature, wetlands serve as important cleaning mechanisms for surface water, among other ecological benefits. More details of the URBWAT research project can be found in Thatcher et al.27 and Davy et al.29 By applying the core features of human-centred, participatory, resilient, and systemic approaches, it is possible to show how HFE was involved in applying this thinking to the
Volume 120| Number 5/6 May/June 2024 18 https://doi.org/10.17159/sajs.2024/18187 Invited
2022/2023 NSTF-South32 Green Economy award Page 2 of 4
Commentary
design and implementation of these constructed wetlands so that they would be used effectively by the community.
Human-centred design
A key component of any successful design intervention is to understand the needs of the people who will be impacted. In the URBWAT research project, this involved establishing the needs of various stakeholders, including local government representatives, community leaders, the URBWAT project team, and community residents themselves. The needs analysis was conducted before any design solutions were developed and was revisited multiple times during the project to identify possibilities in which multiple needs might be met simultaneously. For example, at the start of the project, it was evident that while greywater contamination of the community was a relevant issue requiring attention, there were other needs that were perceived as more important, such as job creation, stormwater and floodwater protection, sanitation solutions, and reducing violent crimes. During the URBWAT research project, the HFE team worked to establish if any of these other needs could also be met. By the end of the URBWAT research project, we had partially succeeded in creating temporary jobs during the construction and design planning stages and had designed the constructed wetlands so that they provided protection from stormwater and sewerage spills.
Other needs were emergent and were only identified when earlier design issues of the constructed wetlands had been addressed. An example of an emergent need was the exaggerated stooping posture adopted by community residents when engaging in water collection and washing activities. The stooping resulted in acute (and chronic) back pain during a variety of washing and water collection tasks. The community residents did not initially identify this as an important need due to the relative importance of other needs. However, during observational user evaluations of the early design iterations, it became evident that excessive stooping during these activities was contributing to physical pain and (in the case of women, children, and the elderly) prevented them from carrying out many water-based tasks effectively. Integrating a raised washing area into the design of the constructed wetlands, not only improved the intake of wastewater into the constructed wetlands but also reduced the physical demands (and therefore back pain) while performing these tasks.
Participatory design
A key component in the early design thinking for URBWAT was to involve end-users (community residents) in developing possible solutions. This was achieved through six design workshops and an iterative design process that enabled community residents to define the initial design and then to participate in identifying refinements and extensions to earlier design iterations. In this way, community residents were not only the initiators of design ideas, but through regular interviews and feedback sessions, they were also primary contributors throughout the research project, identifying design flaws, suggesting improvements, and showing how the interventions could integrate with existing behavioural habits and infrastructure. A second way in which community residents were involved in the design was through being employed as construction workers and project managers. Their local knowledge was invaluable in fine-tuning the designs, bearing in mind the local availability and costs of materials and skills, the physical layout of available space, and the power dynamics between various community residents.
Systems-thinking in design
To help understand the project and how the constructed wetlands were integrating into the community, to identify stumbling blocks in the implementation processes, and to identify possible opportunities for improving the design, we applied the SSoS framework.19 This involved creating a nested hierarchy diagram of the relevant systems, stakeholder goal analysis, and more detailed systems diagrams of the parent, sibling, and child systems. Mapping how these systems evolved over time also enabled the HFE members of the URBWAT project team to identify the stages in the complex adaptive cycles within the panarchy of adaptive cycles. From this analysis, it was evident that a number of parent systems were cycling through their natural stages at a faster rate
than expected, creating disruptions in their respective child systems, including the target system (i.e. the constructed wetlands) and some of the important sibling systems to the constructed wetlands. For example, the community residency parent system had a relatively short lifespan, with many residents leaving (and new residents arriving) on an almost constant basis. This meant that there were always new residents that were not involved in the design of the constructed wetlands and did not understand what the constructed wetlands were or how to use them properly. Similarly, ward councillors were expected to be in their positions for at least 5 years, but over 2 years, the ward councillor changed three times, each time shifting priorities with regard to the residents’ needs and their willingness to support the research project.
These faster-than-expected life cycles of the parent systems forced the sibling systems (and their respective child systems) to adapt faster. For example, rapidly changing residency systems resulted in dwellings being built closer to the constructed wetlands (in one instance, even incorporating the walls of a constructed wetland into their own dwelling). Building new dwellings also created disruptions to related systems, such as taps without sufficient water pressure. This meant that residents had to find another communal tap and their cleaning activities took place at a different location, which either overburdened the constructed wetland (if the working tap had a constructed wetland) or meant that the constructed wetland was not receiving wastewater for treatment. Similarly, building new dwellings meant new ad hoc electricity connections being installed over, around, or even under the constructed wetlands. Some of these issues could be addressed during the iterative design process. For example, a mural was painted by a community resident on the wall of a dwelling adjacent to one of the constructed wetlands to depict the purpose of the constructed wetlands and how to use them properly in order to address the issue of the fast turnover of community residency.
Resilience in design
What does it mean to design a system that is resilient to these changes? It is important to note that resilience in this context does not mean that we can design a system that can maintain its shape and form despite these chaotic external perturbations. The key in a context such as this was to make iterative design a fundamental part of the design thinking. An iterative approach to the design allows one to keep innovating with the way in which the system, people, and the environment interact while still maintaining the underlying mechanisms (in this case, greywater collection and treatment). Adopting a nature-based solution was essential to maintaining a resilient interface by incorporating the natural adaptive qualities of biological entities. In this instance, constructed wetlands needed to be seeded with a variety of wetland plants so that they could adapt to the different effluent and water loads. Humans could also act as agents of resilience by imbuing sufficient scope in the basic design of the constructed wetlands for the human users to customise the design to fit different physical spaces, different treatment loads, and different water collection and washing behaviours. Finally, resilience in design meant ensuring the efficient integration of the constructed wetlands with related sibling systems, as system interconnectedness facilitates resilience. For example, the constructed wetlands were designed with elevated walls. This design protected dwellings from stormwater and sewerage spills. The raised walls also provided elevated walkways, so people did not have to walk in sewerage or mud.
Conclusion
Throughout the discussion on how HFE can be used to facilitate better integration of interventions aimed at sustainability, it is important to note that HFE is not doing this alone. HFE acts as a support to the biochemists, physicists, engineers, architects, climate scientists, ecologists, botanists, zoologists, and other specialists who use their own scientific knowledge to develop solutions. However, HFE is an important conduit between the scientific development of solutions and how they will integrate with the people who will use them. Of course, there are many other disciplines that can also provide their own disciplinary perspectives, including anthropology, psychology, sociology, political science, ethics, and philosophy. However, it is the HFE discipline whose specific expertise lies in tying technological development with human
Volume 120| Number 5/6 May/June 2024 19 https://doi.org/10.17159/sajs.2024/18187 Invited Commentary 2022/2023 NSTF-South32 Green Economy award Page 3 of 4
use. It is important to note that nothing lasts forever, particularly in a highly dynamic environment such as the URBWAT example. Instead, we should be designing systems and implementation strategies that can rapidly change depending on the environmental influences, including those of other humans. For example, even though the initial URBWAT research project has ended, it is evident that further iterations are still required. What is important to emphasise is that understanding the systemic influences on a particular technological artefact within a given context is important to ensure the effectiveness, efficiency, and sustainability of an intervention.19
Acknowledgements
This paper was made possible by the author receiving the 2022/2023 NSTF-South 32 Green Economy award.
Competing interests
I have no competing interests to declare.
references
1. PörtnerH-O,RobertsDC,PoloczanskaES,MintenbeckK,TignorM,AlegríaA, et al. editors. Summary for policymakers. In: Contribution of Working Group II to the Sixth Assessment Report of the Intergovernmental Panel on Climate Change. Cambridge, UK and New York, USA: Cambridge University Press; 2022. p. 37. Available from: https://www.ipcc.ch/report/ar6/wg2/download s/report/IPCC_AR6_WGII_SummaryForPolicymakers.pdf
2. Richardson K, Steffen W, Luch W, Bendtsen J, Cornell SE, Donges JF, et al. Earth beyond six of nine planetary boundaries. Sci Adv. 2023;9(37), eadh2458. https://doi.org/10.1126/sciadv.adh2458
3. World Economic Forum. The global risks report 2023. Geneva: World Economic Forum; 2023. Available from: https://www3.weforum.org/docs/W EF_Global_Risks_Report_2023.pdf
4. Scholes R, Engelbrecht F. Climate impacts in southern Africa during the 21st century. Report for Earthjustice and the Centre for Environmental Rights. Johannesburg: Global Change Institute, University of the Witwatersrand; 2021. Available from: https://cer.org.za/wp-content/uploads/2021/09/Clima te-impacts-in-South-Africa_Final_September_2021.FINAL_.pdf
5. Ziervogel G, Lennard C, Midgley G, New M, Simpson NP, Trisos CH, et al. Climate change in South Africa: Risks and opportunities for climate-resilient development in the IPCC Sixth Assessment WGII report. S Afr J Sci. 2022;118(9–10), Art. #14492. https://dx.doi.org/10.17159/sajs.2022/14492
6. Ziervogel G, New M, Archer van Garderen E, Midgley G, Taylor A, Hamann R, et al. Climate change impacts and adaptation in South Africa. WIREs Clim Change. 2014;5(5):605–620. https://doi.org/10.1002/wcc.295
7. HötteK.Howtoaccelerategreentechnologydiffusion?Directedtechnological change in the presence of coevolving absorptive capacity. Energy Econ. 2020;85, Art. #104565. https://doi.org/10.1016/j.eneco.2019.104565
8. Karanam V, Davis A, Sugihara C, Sutton K, Tal G. From shifting gears to changing modes: The impact of driver inputs on plug-in hybrid electric vehicle energy use & emissions. Transp Res Interdiscip Perspect. 2022;14, Art. #100597. https://doi.org/10.1016/j.trip.2022.100597
9. Green L. Communication, technology and society. London: Sage Publications; 2002.
10. Dul J, Bruder R, Buckle P, Carayon P, Falzon P, Marras WS, et al. A strategy for human factors/ergonomics: Developing the discipline and profession. Ergonomics. 2012;55(4):377–395. https://doi.org/10.1080/00140139.201 2.661087
11. Cooper R, Foster M. Sociotechnical systems. Am Psychol. 1971;26(5):467–474. https://doi.org/10.1037/h0031539
12. European Commission. Industry 5.0: Towards a sustainable, human-centric and resilient European industry. Luxembourg: Publications Office of the European Union; 2021. https://data.europa.eu/doi/10.2777/308407
13. Lang DJ, Wiek A, Bergmann M, Stauffacher M, Martens P, Moll P, et al. Transdisciplinary research in sustainability science: Practice, principles, and challenges. Sustain Sci. 2012;7:25–43. https://doi.org/10.1007/s11625-01 1-0149-x
14. Thatcher A, Waterson P, Todd A, Moray N. State of science: Ergonomics and global issues. Ergonomics. 2018;61(2):197–213. https://doi.org/10.1080/0 0140139.2017.1398845
15. Imada AS. The rationale of participatory ergonomics. In: Noro K, Imada AS, editors. Participatory ergonomics. London: Taylor & Francis; 1991. p. 30–49.
16. Hollnagel E, Woods DD, Leveson N, editors. Resilience engineering: Concepts and precepts. Aldershot: Ashgate; 2006.
17. Woods DD. The theory of graceful extensibility: Basic rules that govern adaptive systems. Environ Syst Decis. 2018;38(4):433–457. https://doi.or g/10.1007/s10669-018-9708-3
18. Ross R, Pillitteri V, Graubart R, Bodeau D, McQuaid R. Developing cyber resilient systems: A systems security engineering approach. NIST Special Publication (SP) 800-160 Vol. 2 (Draft). Gaithersburg, MD: National Institute of Standards and Technology, US Department of Commerce; 2019. https://d oi.org/10.6028/NIST.SP.800-160v2
19. Thatcher A, Yeow PH. A sustainable system of systems approach: A new HFE paradigm. Ergonomics. 2016;59(2):167–178. https://doi.org/10.1080/ 00140139.2015.1066876
20. Wilson JR. Fundamentals of systems ergonomics/human factors. Appl Ergon. 2014;45(1):5–13. https://doi.org/10.1016/j.apergo.2013.03.021
21. Moray N. Culture, politics and ergonomics. Ergonomics. 2000;43(7):858–868. https://doi.org/10.1080/001401300409062
22. Thatcher A, Nayak R, Waterson P. Human factors and ergonomics systemsbased tools for understanding and addressing global problems of the twentyfirst century. Ergonomics. 2020;63(3):367–387. https://doi.org/10.1080/00 140139.2019.1646925
23. Costanza R, Patten BC. Defining and predicting sustainability. Ecol Econ. 1995;15(3):193–196. https://doi.org/10.1016/0921-8009(95)00048-8
24. Gunderson LH, Holling CS. Panarchy: Understanding transformation in human and natural systems. Washington DC: Island Press; 2002.
25. Sigahi TF, Yeow PH, Thatcher A. Advancing sustainability in the future of work through the design of post-pandemic work-from-home systems. Sustainability. 2023;15(21), Art. #15367. https://doi.org/10.3390/su1521 15367
26. Chizallet M, Barcellini F, Prost L. Sustainable system of systems at work: Unravelling (some of) the complexity of farmers’ transition to sustainability. Ergonomics. 2024;67(4):467–481. https://doi.org/10.1080/00140139.2022 .2163687
27. Thatcher A, Metson GS, Sepeng M. Applying the sustainable system-ofsystems framework: Wastewater(s) in a rapidly urbanising South African settlement. Ergonomics. 2024;67(4):450–466. https://doi.org/10.1080/001 40139.2022.2068647
28. Yap TL, Vu NT, Yeow PH. Application of the sustainable system-of-systems approach and econometric analysis to address China’s decarbonization problem. Ergonomics. 2024;67(4):482–497. https://doi.org/10.1080/0014 0139.2023.2216413
29. Davy J, Todd A, Metson GS, Thatcher A. Designing a greywater treatment system in a highly adaptive urban environment: An ergonomics and human factors observational analysis. Urban Water J. 2023;20(5):624–637. https:// doi.org/10.1080/1573062X.2023.2207099
Volume 120| Number 5/6 May/June 2024 20
Invited Commentary 2022/2023 NSTF-South32 Green Economy award Page 4 of 4
https://doi.org/10.17159/sajs.2024/18187
AuThoR: Mariette Pretorius1
AFFILIATIoN:
1Science Communication Officer,
GENUS: DSI-NRF Centre of Excellence in Palaeosciences, University of the Witwatersrand, Johannesburg, South Africa
CoRRESPoNDENCE To: Mariette Pretorius
EMAIL: mariette.vdw93@gmail.com
hoW To CITE:
Pretorius M. Peer review vs Publish all – Navigating the changing landscape of scientific publication.
S Afr J Sci. 2024;120(5/6), Art. #17103. https://doi.org/10.17159/sa js.2024/17103
ARTICLE INCLuDES:
☐ Peer review
☐ Supplementary material
KEYWoRDS: open science, peer review, preprints, publish all, scientific publishing
FuNDING:
GENUS: DSI-NRF Centre of Excellence in Palaeosciences
PubLIShED:
28 May 2024
Peer review vs Publish all – Navigating the changing landscape of scientific publication
Significance:
© 2024. The Author(s). Published under a Creative Commons Attribution Licence.
This article delves into the critical juncture at which scientific publishing finds itself, examining traditional pre-publication peer review, the emerging ‘publish all’ model, and the role of preprints. As the scientific community grapples with the need for rapid dissemination of research alongside maintaining rigorous quality controls, the article offers a comprehensive analysis of the pros and cons of each model. It serves as an essential read for researchers, academics, and policymakers, providing insights into how these evolving models impact the quality, credibility, and accessibility of scientific research. It aims to guide informed choices in the ever-changing landscape of scientific publishing.
Being a scientist means conducting research and publishing that research in an accredited journal. At the heart of this practice is the scientific method – a rigorous process designed to produce research that is both repeatable and credible. When your work is published, it is essential that other researchers can replicate your study based on the methodology that you have described. This ensures that both the scientific community and the public can trust your findings, which have undergone a stringent peer-review process in which seasoned experts have evaluated the merits of your research.
Although it is time-consuming and sometimes frustrating, the peer-review process is a crucial gatekeeper. It ensures that your research is not published until it has reached its highest possible quality, making it both reliable and worthy of citation. However, a recent controversial paper about the deliberate burial of the dead by Homo naledi1 published in eLife, an open-access, post-publication peer-review journal, sparked widespread scientific debate2 about current publishing models. Neither accepted nor rejected, the headline-grabbing research now occupies a ‘grey’ zone created by the collision of sensationalised science with changing publishing and peer-review models. So which is superior: traditional peer review or the emerging ‘publish all’ model? Should scientists continue to rely on the time-tested but perhaps archaic peer-review system, or should they adopt the quicker, all-inclusive approach to publishing? What implications do these choices have for the quality of published science, and how do we cite future research? In this Commentary, I explore the evolving landscape of scientific publishing by critically examining traditional pre-publication peer review, the emerging ‘publish all’ model, and the role of preprints, aiming to assess their impact on the quality, credibility, and accessibility of scientific research.
Traditional peer review: Review, then publish
The traditional scientific publication process is a rigorously structured pathway3 designed to validate and share research (Figure 1). Researchers submit their completed studies in the form of a written manuscript to a scientific journal of their choice. Here, an editor initially assesses if it fits into the scope of the journal and meets format and language standards. If it passes this first stage, it goes through several more rounds of internal review. It is then finally forwarded to independent experts (usually two or three) in the field for peer review. This framework is known as pre-publication peer review4 and has been around for centuries. There are two main categories of peer review – open and closed, the latter of which is more common and further divided into two subcategories: singleand double-anonymous.5 In a single-anonymous review model, the identities of the reviewers are hidden from the author, but the reviewers are aware of the authors’ identities.5 This is the most common method used in many academic and scientific journals but is subject to various disadvantages (Table 1).
The reviewers scrutinise the research for its validity, significance, quality, and ease of reading and understanding, offering (mostly) constructive feedback and recommendations for acceptance, revision, or rejection. Authors may then revise their work based on this feedback and resubmit the manuscript, after which the editor makes the final decision on its suitability for publication. This framework is known as pre-publication peer review.6 Ultimately, it ensures the credibility and quality of scientific literature, acting as a gatekeeper against the dissemination of flawed or untrustworthy findings. Research that has been peer reviewed before publication carries a stamp of approval from experts, lending it credibility and trustworthiness.6 This is crucial in fields like science, medicine and engineering, where the stakes are high, and unreliable information could have serious consequences. This process also holds authors accountable for their research and conclusions. Knowing that their work will be rigorously examined encourages researchers to adhere to high standards of scholarship, from the design and execution of their studies to the reporting of results.3
While the peer review process is a cornerstone of academic integrity, it comes with its own set of challenges7 that cannot be overlooked. One of the most significant drawbacks is the time-consuming nature of the process. The timeline from submission to publication can stretch from weeks to years, posing a problem for time-sensitive research and career advancement. This delay is further exacerbated by the potential for bias within the review process. Personal or ideological biases5 can influence a reviewer’s judgement, sometimes favouring established researchers, prestigious institutions, or even particular races or genders. Authors are also less likely to report negative results because reviewers are not receptive to them.6 Additionally, the limited accessibility of many peerreviewed articles, often locked behind costly journal paywalls, restricts the dissemination of valuable knowledge. This creates inequities in who can access and participate in the sharing of scientific information and is particularly detrimental for young researchers from emerging countries like South Africa.8 The process is also subject to inconsistency and subjectivity, as different reviewers can offer divergent opinions on the same paper. Overall,
21 https://doi.org/10.17159/sajs.2024/17103 Volume 120| Number 5/6 May/June 2024 Commentary
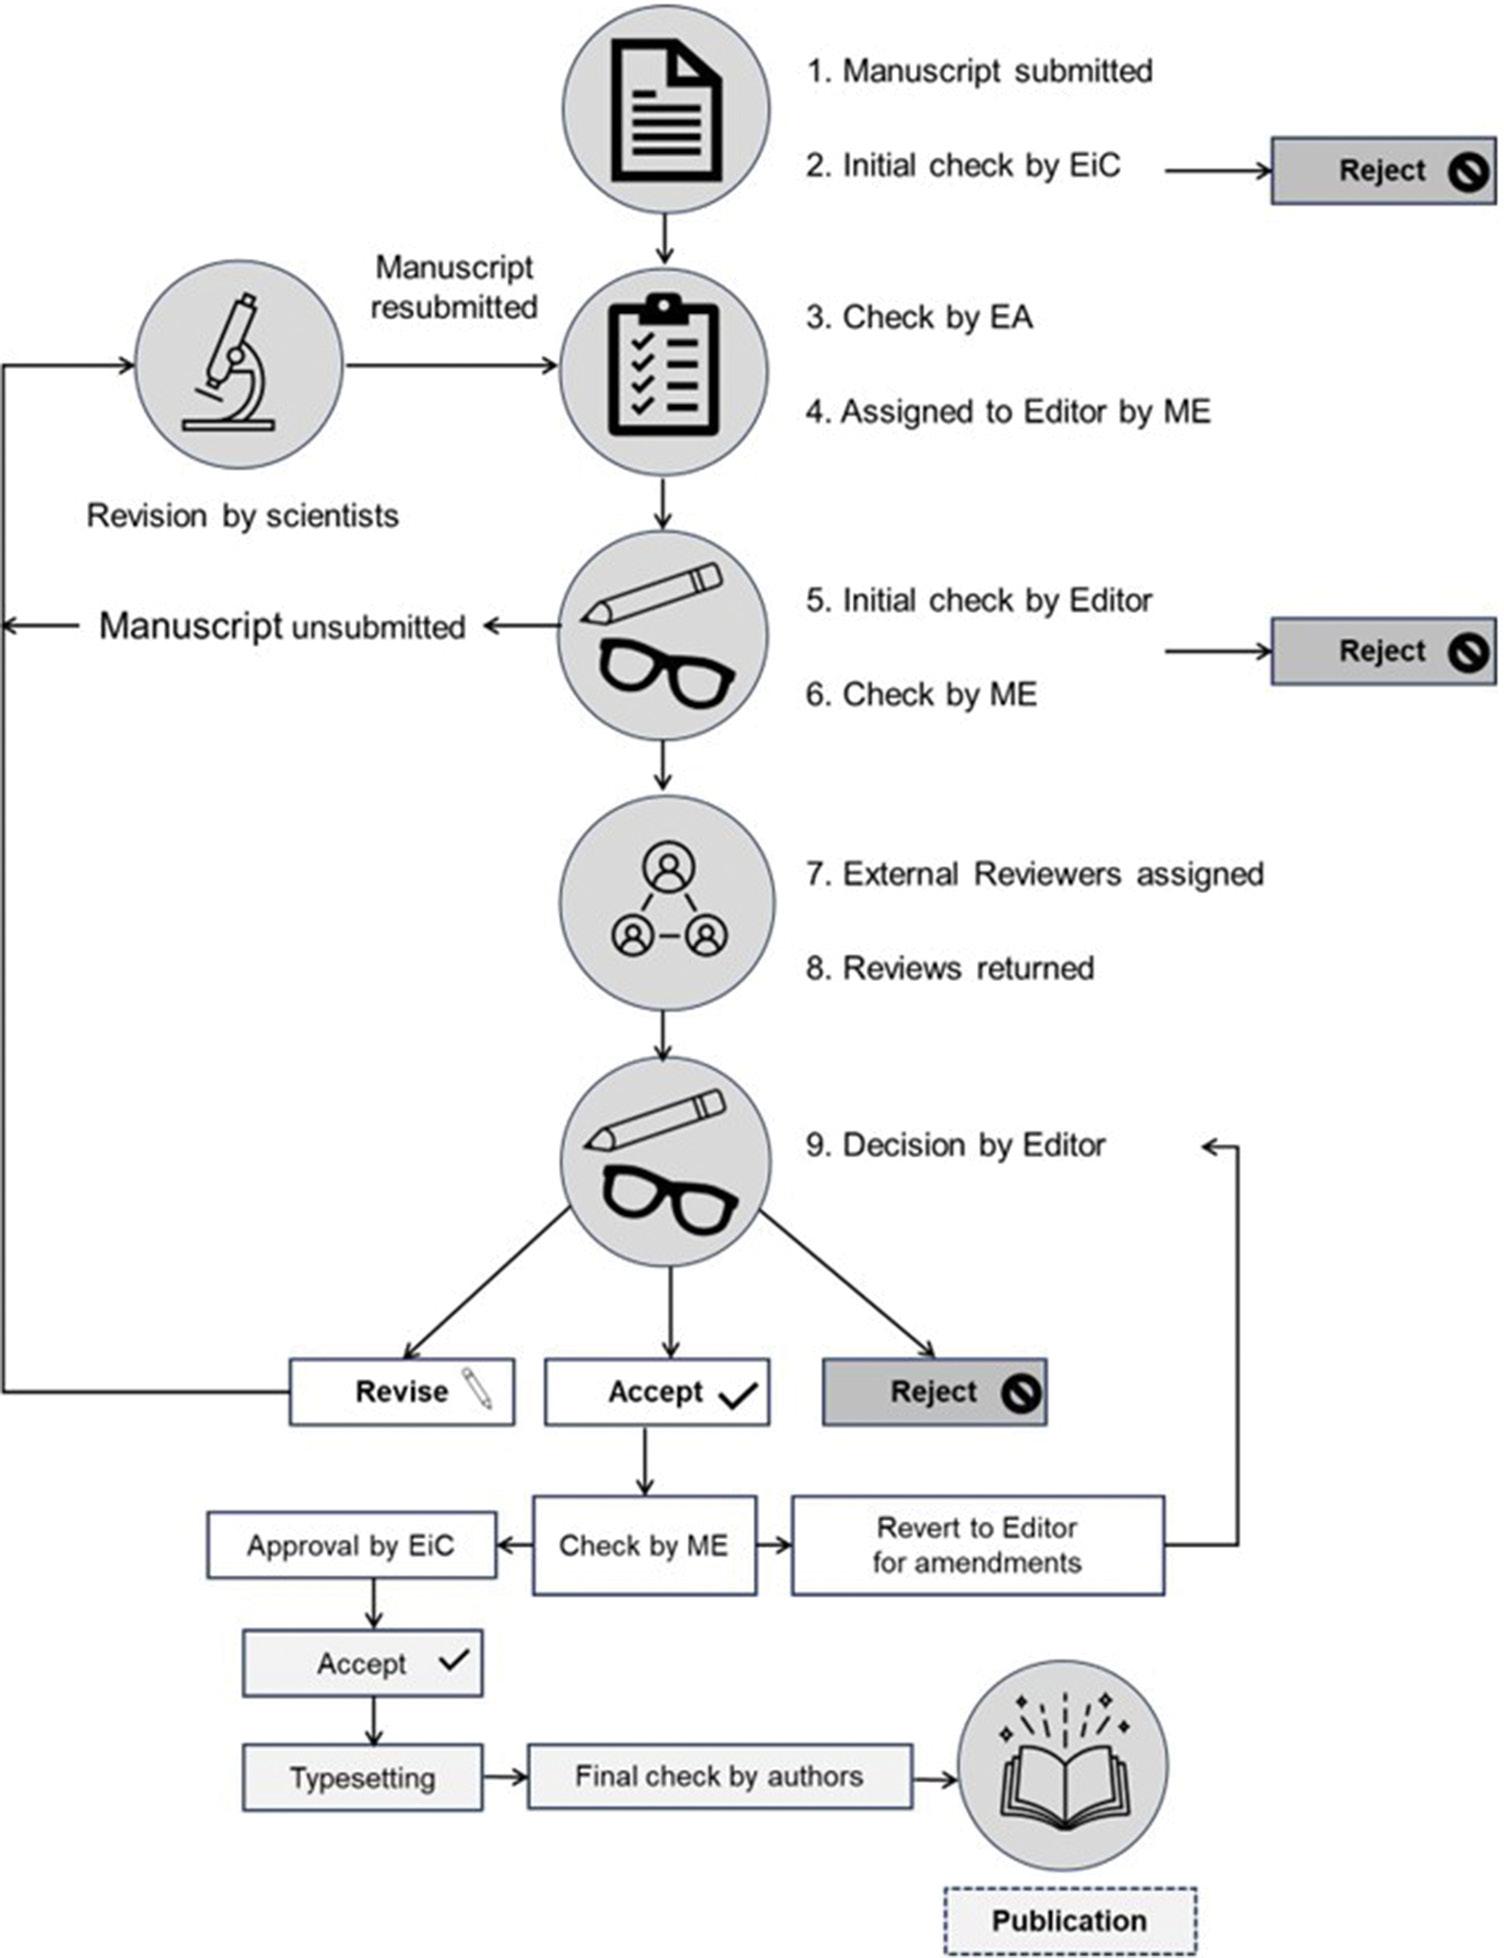
Source: Adapted from Ali and Watson3 (under CC-BY-4.0 licence)
while peer review has its merits, these limitations highlight the need for ongoing scrutiny and potential reform of the system.
Post-publication peer review: Publish first, ask questions later
In contrast to the traditional model, a novel form of scientific publication arrived on the scene in October 20229, when the life sciences journal eLife changed its editorial practice10, opting to publish every paper sent out for peer review. This post-publication peer review method allows research to be published quickly and then critiqued publicly. Reviewers’ reports are published alongside the research, providing valuable context, and allowing readers to make their own judgements about the work’s quality.11
This openness comes with several advantages9: enhancing transparency, enlightening those interested in the scientific process, and democratising the dissemination of research by removing some barriers faced by early-career researchers or those from less prestigious institutions.
Additionally, authors retain more agency in the publication process, as they can choose whether to implement reviewers’ suggestions.11
Meanwhile, preprints have been around for at least 30 years and probably paved the way for the rise of the ‘publish all’ model. In this approach, researchers upload their manuscripts to preprint servers (like ResearchGate or ScienceOpen) before they undergo traditional peer review. These platforms make the research publicly available almost immediately, allowing other scientists to comment, critique, and even build upon the work. This gives the authors time to incorporate feedback before the paper is submitted to a journal for official peer review. Think of a preprint as a draft version of the research that is publicly shared before it has been officially reviewed.
One of the key advantages of preprints is their speed.12 Researchers can upload their findings immediately, thereby accelerating the pace of scientific discovery. This speed is particularly crucial for rapidly disseminating crucial health information, as witnessed during the COVID-19 pandemic.13 This model fosters a more inclusive scientific
Volume 120| Number 5/6 May/June 2024 22 https://doi.org/10.17159/sajs.2024/17103 Commentary Peer Review vs Publish All Page 2 of 4
Figure 1: The traditional article publishing process, including peer review. Key players in the decision-making process are the editor-in-chief (EiC), editorial assistant (EA), and managing editor (ME).
Table 1: Characteristics of various peer-review methods
CharacteristicsAdvantages
Single-anonymous: Reviewers aware of the author’s identity and affiliation
Double-anonymous: Neither authors nor reviewers are aware of the other’s identity or affiliation
open: Authors and reviewers are aware of the other’s identity and affiliation
Closed peer review
• Reviewer anonymity ensures honest feedback
• No risk of intimidation from authors
• Manuscript judged on quality and content
• No risk of intimidation from authors
open peer review
• More tactful and constructive feedback
• More rigorous review as the reviewer’s name appears in the published article
dialogue, as more people can access, read, and comment on the research and it particularly benefits early-career researchers14, who rely heavily on the timely publication of their work to gain recognition for their efforts. Furthermore, preprints are often assigned a Digital Object Identifier (DOI), making them citable, should researchers wish to do so. However, the ‘publish all’ model is not without its drawbacks, the most glaringofwhichisthepotentialcompromiseonresearchquality.11 Without the traditional gatekeeping role of peer review, there is a heightened risk of publishing flawed or even misleading research, which could have farreaching implications. Even fundamentally flawed, potentially harmful, or unethical science that faces heavy criticism from reviewers15 will now forever exist online as a citable resource. This absence of a quality filter can affect the credibility of research, as papers published under this model may not be viewed with the same level of trust as those that have undergone rigorous peer review. For this reason, many top-tier journals do not allow authors to cite preprints. Additionally, these publication models place an increased burden on readers to assess the quality of research, rather than relying on the scientific community’s judgement. Consequently, researchers may be hesitant to submit their articles to journals that follow this method.
The future of citations?
In academic and scientific writing, citations serve a purpose: they give credit where it is due and offer readers a pathway to find the original source for further reading or verification. Crucially, they form the basis of tried and trusted evidence to support new research. Considering the emerging ‘publish all’ method, how can researchers cite studies presented in this way? Citing papers that have not undergone traditional peer review presents a unique set of challenges and considerations.
In the traditional peer-review model, citing is straightforward because the research has undergone rigorous scrutiny and has been published in a reputable journal. Researchers can cite these papers with confidence, knowing that the work has been vetted by experts in the field. In the publish-all model, like the one adopted by eLife, papers are published alongside reviewer comments, but they may not necessarily have been revised based on those comments. Researchers who cite such articles may inadvertently propagate unverified or flawed findings, thereby affecting the quality of their work and potentially leading to the spread of misinformation. Researchers should exercise caution and critically evaluate the paper’s quality and relevance to their work. The citation should ideally include a note indicating that the paper has not undergone traditional peer review, like is done for preprints. Various influential journals (Nature, Science, The Lancet, and the BMJ) now explicitly state that although they allow the citation of preprints, there are specific guidelines about how these materials should be cited.16 Perhaps, with the rise of the publish-all model, citations should follow the same style as
Disadvantages
• Reviewers may give harsh comments
• Reviewers may delay feedback to delay publication if interested in the same topic
• Reviewers may have a prejudice against the authors
• Reviewers may give harsh comments
• Reviewers may still identify the author in specialist areas
• May make the reviewer fearful, leading to a less honest and less critical review
• Reviewers can be intimidated or threatened
that for preprints, but researchers should be aware that this publication model is more open to opportunistic abuse and perhaps more prone to give credence to bad science.
Conclusion
As the academic publishing environment evolves, there is room to revamp andrestructurepeer-reviewsystemsandframeworks.Theriseofpreprints, particularly during the COVID-19 crisis, demonstrates the advantages of disseminating scientific findings quickly before undergoing conventional peer review. Additionally, the era of open science demands innovative platforms that can facilitate dynamic and thorough debates, contributing to scientific advancement while also promoting fairness and transparency. However, the publication of flawed science using the publish-all model raises serious and valid concerns within the scientific community.
The long-term sustainability of the current peer-review system is increasingly coming into question, even though it is unclear what will take its place, how it will transform or even who will manage this transformation. The era of open science is pushing us toward more transparent, inclusive, and rapid forms of communication. However, this should not come at the expense of quality and rigour. As we move forward, it is crucial to develop frameworks that facilitate quicker publication whilst still being able to uphold the integrity and credibility of scientific research.
Acknowledgements
The support of the GENUS DSI-NRF Centre of Excellence in Palaeosciences at the University of the Witwatersrand is gratefully acknowledged. I thank Dr Christine Steininger for sharing her insights and useful suggestions regarding the article.
Competing interests
I have no competing interests to declare.
References
1. Berger LR, Makhubela T, Molopyane K, Kruger A, Randolph-Quinney P, Elliott M, et al. Evidence for deliberate burial of the dead by Homo naledi [reviewed preprint]. eLife. 2023;12, RP89106. https://doi.org/10.7554/eLife.89106.1
2. Callaway E. Criticism of controversial ancient-human claims tests eLife’s peer-review model. Nature. 2023;620:13–14. https://doi.org/10.1038/d415 86-023-02415-w
3. Ali PA, Watson R. Peer review and the publication process. Nurs Open. 2016;3(4):193–202. https://doi.org/10.1002/nop2.51
4. Elsevier. Publishing guidelines: Peer review [webpage on the Internet]. c2014 [cited 2023 Oct 04]. Available from: http://www.elsevier.com/about/publishi ng-guidelines/peer-review
Volume 120| Number 5/6 May/June 2024 23 https://doi.org/10.17159/sajs.2024/17103 Commentary Peer Review vs Publish All Page 3 of 4
5. Santos A, Morris DS, Rattan R, Zakrison T. Double-blinded manuscript review: Avoiding peer review bias. J Trauma Acute Care Surg. 2021;91(1):e39–e42. https://doi.org/10.1097/TA.0000000000003260
6. Teixeira da Silva JA, Dobránszki J. Problems with traditional science publishing and finding a wider niche for post-publication peer review. Account Res. 2015;22(1):22–40. https://doi.org/10.1080/08989621.2014.899909
7. Tennant JP, Ross-Hellauer T. The limitations to our understanding of peer review. Res Integr Peer Rev. 2020;5(1):6. https://doi.org/10.1186/s41073-0 20-00092-1
8. Pretorius M. Breaking barriers or breaking the bank? The academic publishing system is extorting emerging researchers. Daily Maverick. 2023 September 04 [cited 2023 Oct 04]. Available from: https://www.dailymaverick.co.za/o pinionista/2023-09-04-breaking-barriers-or-breaking-the-bank-the-academi c-publishing-system-is-extorting-emerging-researchers/
9. Kelly J, Sadeghieh T, Adeli K. Peer review in scientific publications: Benefits, critiques, & a survival guide. Ejifcc. 2014;25(3):227.
10. Abbott A. Strife at eLife: Inside a journal’s quest to upend science publishing. Nature. 2023;615:780–781. https://doi.org/10.1038/d41586-023-00831-6
11. O’Sullivan L, Ma L, Doran P. An overview of post-publication peer review. Sch Assess Rep. 2021;3(1):1–11. https://doi.org/10.29024/sar.26
12. Fraser N, Brierley L, Dey G, Polka JK, Pálfy M, Nanni F, et al. The evolving role of preprints in the dissemination of COVID-19 research and their impact on the science communication landscape. PLoS Biol. 2021;19(4), e3000959. https://doi.org/10.1371/journal.pbio.3000959
13. Guterman EL, Braunstein LZ. Preprints during the COVID-19 pandemic: Public health emergencies and medical literature. J Hosp Med. 2020;15(10):634. https://doi.org/10.12788/jhm.3491
14. Sarabipour S, Debat HJ, Emmott E, Burgess SJ, Schwessinger B, Hensel Z. On the value of preprints: An early career researcher perspective. PLoS Biol. 2019;17(2), e3000151. https://doi.org/10.1371/journal.pbio.3000151
15. Callaway E. Sharp criticism of controversial ancient-human claims tests eLife’s revamped peer-review model. Nature. 2023;620:13–14. https://doi. org/10.1038/d41586-023-02415-w
16. Berg JM, Bhalla N, Bourne PE, Chalfie M, Drubin DG, Fraser JS, et al. Preprints for the life sciences. Science. 2016;352(6288):899–901. https://doi.org/10 .1126/science.aaf9133
Volume 120| Number 5/6 May/June 2024 24 https://doi.org/10.17159/sajs.2024/17103 Commentary Peer Review vs Publish All Page 4 of 4
AuthorS: Sarojini Nadar1 Dorsamy (Gansen) Pillay2
AFFILIAtIoNS:
1Desmond Tutu South African Research Chair (SARChI) in Religion and Social Justice, University of the Western Cape, Cape Town, South Africa
2Honorary Scholar of the International Institute for Applied Systems Analysis (IIASA), Laxenburg, Austria
CorrESPoNDENCE to: Sarojini Nadar
EMAIL: snadar@uwc.ac.za
hoW to CItE: Nadar S, Pillay D. Why researchers should focus on the triple bottom line: Excellence, ethics and empathy. S Afr J Sci. 2024;120(5/6), Art. #18267. https://doi.org/10.17159/sajs.202 4/18267
ArtICLE INCLuDES: ☐ Peer review ☐ Supplementary material
KEYWorDS: research incentives, knowledge commodification, excellence, ethics, empathy
PubLIShED: 28 May 2024
© 2024. The Author(s). Published under a Creative Commons Attribution Licence.
Why researchers should focus on the triple bottom line: Excellence, ethics and empathy
Significance:
The global demands of a fast-paced, ‘publish or perish’ culture at higher education and research institutions pose several challenges for researchers, especially early-career scholars. In South Africa, the incentivisation of the ‘publish or perish’ paradigm, in a context of historical funding inequities, presents both possibilities and perils. Prioritising integrity within such a system requires a reclaiming of moral agency that subscribes to a high code of ethical conduct, which includes the values of excellence and empathy. We propose an EEE (excellence, ethics and empathy) framework for balancing productivity with integrity, thereby resisting the logics of the research marketplace.
What brings two academics – one from the humanities and social sciences and the other from the health and natural sciences; one involved daily in research undertakings that foster an intellectual hub for social justice transdisciplinary research, and the other who has enjoyed a long and productive career in research management and support – together to write a commentary? The answer is our common commitment to what we have termed the triple bottom line for research. The three markers of this bottom line are excellence, ethics, and empathy, what we call an EEE framework for research within an increasingly corporate and neo-liberal research context that ostensibly values quantity over quality, that counts, rather than weighs.
Notwithstanding our aversion to the commodification of knowledge and higher education, we drew inspiration for the idea of a triple bottom line for research from the business concept of the triple bottom line that focuses on three aspects: people, planet and profit. Writing for the online publication, Harvard Business Insights in 2020, Kelsey Miller observed: “The world is full of uncertainty. Monumental challenges—including climate change, poverty, and inequality—are at the forefront of daily life and seemingly becoming ever more urgent.”1
To respond to these challenges, Miller proposed the ‘triple bottom line’ concept, first proposed by John Elkington2 While businesses have generally and almost exclusively focused on profit as the ultimate bottom line, the triple bottom line, Miller explains, is about getting firms to move beyond generating profit as the standard ‘bottom line’ to also considering social and environmental concerns. The idea is not new, but the need to measure financial success in both social and environmental terms was amplified and made most visible during the COVID pandemic, prompting many social activists to point out the importance of a hierarchy in these values: people and planet before profit.
While taking lessons from business models for higher education may not be ideal, and indeed some might argue may even be inappropriate, there is a great deal of literature that has emerged in the last decades which argues that higher education institutions are increasingly running like businesses. Scholars such as Sioux McKenna have offered valuable critiques of the corporatisation of higher education, and have argued that the university has become [c]onceptualised as an institution focused on producing skills and goods for the market, rather than as a public good focused on knowledge creation and the nurturing of critical citizens who are well placed to address environmental degradation and social injustice 3
Producing “goods for the market” is directly related to the idea of a ‘knowledge economy’, where the notion of economy is taken literally, rather than figuratively.
Maresi Nerad critically notes:
Theories of the ‘knowledge economy’ view knowledge, and particularly new knowledge, as a critical resource to enhance a nation’s economic growth....Eagerly seeking to stimulate economic growth, national capacity building and international cooperation as well as competition, governments are allocating substantial funds to increase the research and development capacities of their countries.4
South Africa is no different. Since the Academy of Science of South Africa (ASSAf)’s publication of the 2010 consensus report which made the inextricable link between economic growth and development with an increase in high-quality PhDs (and by extension high-quality research), South Africa has seen an unprecedented growth in the number of research articles and PhD graduates.5 While one might be tempted to think that this growth and expansion in PhD graduates and research outputs were because of altruistic commitments to growing the knowledge economy, unfortunately there may have been other factors at play. It is hard to ignore contentions that the exponential increase in output was linked to incentive systems provided by South Africa’s Department of Higher Education and Training (DHET) via subsidies to institutions to ‘reward’ research growth and expansion.
Keyan Tomaselli has scathingly referred to this incentive system as ‘perverse’, arguing that it has had “unintended and sometimes undesirable” outcomes “that contravenes the intention of the incentive’s designers, in this case the state’s policymakers”6
We have a joint concern regarding what Tomaselli has termed “the perverse incentives of the Department of Higher Education in South Africa”. The research output subsidy system, a noble idea, was designed as both a transformative and research excellence imperative – to align research with the country’s goals of economic
25 https://doi.org/10.17159/sajs.2024/18267 Volume 120| Number 5/6 May/June 2024 Commentary
and social advancement, as well as to raise the standard of research outputs by rewarding research productivity that benchmarks with the global academic landscape.
However, the August 2023 DHET communique to university deputy vice-chancellors and senior directors for research tells a different story. Contained within this communique is an acknowledgement of how the subsidy system may have unintentionally enabled unethical practices that ultimately sacrifice excellence and integrity on the altars of productivity:
...despite the significant growth in the volume and quantum of output, various studies over the past ten years have unfortunately also revealed that the policy instrument has produced several unintended negative consequences. Studies conducted by the Centre for Research on Evaluation, Science and Technology (CREST) at Stellenbosch University, on behalf of the Academy of Science of South Africa (ASSAf) and the Department, have illustrated how a minority of academics have begun to game the system through publications in predatory journals, listing of ghost affiliations and engaging in salami slicing to maximize the number of submissions and the like.7
Emerging researchers, by virtue of their arguably vulnerable positions within an increasingly neo-liberal and corporate higher education system, are particularly susceptible to ‘gaming the system’. This is not to deny that more senior scholars have also been ‘cashing in’ on the system. In fact, many provide the means and the platforms for such ‘gaming’ to occur, as they offer journals and publishing houses that encourage what Tomaselli calls “rent-seeking behaviour”. However, the challenges for early-career academics are unique because they are forced through the pressures of the system to hanker after academic success, and many who are first-generation graduates who do not have the luxury of generational wealth, and are exceptional ‘firsts’ in their families, need to exercise an even greater moral agency.
Challenges facing researchers
There are at least three major challenges that face researchers, especially early-career researchers, in the research landscape in South Africa. Firstly, good research requires funding, and one of the biggest challenges faced by researchers is securing adequate funding for their work. Grants can be highly competitive, and the process of applying can be time-consuming and complex. Secondly, the scholarly process is often slow and iterative, and progress sometimes can only be measured in small increments over many months or years. For scholars in the natural, physical and health sciences, research takes time to execute, and oftentimes the findings and results are uncertain. For humanities and social science scholars, research is not just a mechanistic methodological endeavour, but a creative one, which also requires time and space that nurtures the imagination. Thirdly, publishing research in reputable peer-reviewed journals and recognised academic presses is a challenge. Researchers have to learn to navigate the peer-review process, respond to feedback, meet strict formatting and style guidelines, and develop strong academic writing and editing skills.
These three challenges (there are of course many more), are further complicated by the systemic barriers that women and people of colour experience in an academy that was not designed for them. Given the above challenges, the fast-paced ‘publish or perish’ framework that is built into the DHET research outputs incentive policy, puts an enormous amount of pressure on researchers to increase the quantity and frequency of their publications in order to be ‘successful’ in their academic settings.
The question that we seek to address in this Commentary is: How can researchers strive towards excellence, ethics and empathy in their research endeavours within this market-based knowledge economy? While the temptation may be to lean towards non-participation in the system, we would argue that this is a luxury that many women and people of colour cannot afford. Hence, embracing a set of values for ethical functioning within this system may be helpful.
Excellence
Excellence in research has conventionally been defined by rigorous theoretical frameworks and methodologies; original, creative and innovative approaches; and the generation of valuable insights that provide new directions for thinking about real-world problems. It is marked by critical research questions, clear research objectives, robust methodological design and sound ethical conduct, and the resulting insights ought to contribute meaningfully to the field. Excellence is borne out by rigorous peer review and well-argued and substantiated conclusions that advance knowledge in the field. Basic expectations for excellence are that the research is presented in well-organised, systematic and clear ways to facilitate understanding.
It is regrettable, given the need to transform and redress the racial and gender imbalances of the past, that excellence and equity are often pitched to be mutuallyexclusivevalues.Theyarenot.Whilethecurrentasymmetricalracial and gender imbalances within research need to be addressed, to suggest that shortcuts need to be taken on any of the above standards of excellence in order to meet equity and transformation goals, feeds into colonial and patriarchal tropes about intellectual and scholarly capacity, which must be resisted. We must maintain excellence through strategic commitments to develop rigorous and robust standards, rather than compromising rigour for the sake of ‘levelling the playing field’. Levelling the research playing field is not a luxury – it is a necessity in a country that bears the shameful scars of its racialised past. However, what is imperative is that the foundation on which we level the field must be rock solid. Otherwise, the little cracks that are allowed to develop will eventually lead to collapse. It is unfortunate that the cracks are already starting to show, as the DHET communique referred to above reveals. We will need to take quick action to mend the cracks and build a firmer foundation. Apart from rigour and robustness, excellence in research also encompasses two other values: ethics and empathy.
Ethics
Inspired by the ‘do no harm’ approach, almost all universities have implemented research ethics policies. This means that one cannot embark on research, especially with human and other animal subjects, without first obtaining such clearance. Despite research obtaining research ethical clearance, and presumably passing peer review, there have been contested cases of compromised research ethics that have recently come to the fore about the race implications, for example, of research that was published.8,9
The concerns raised about these publications were about the integrity of the scholarly inquiry, which unfortunately is often outsourced to ethical clearance committees that tend to reduce research ethics to a legislative, policy-based, tick-box exercise, without recognising the need for an approach that takes seriously the structural and systemic issues that have entrenched unequal power relationships in research. Embracing an ethical approach requires not only the mandatory statement of one’s social location, but a genuine commitment to understanding how particular types of research reinforce racial and gender stereotypes that emerge out of systems of injustice. This means that researchers have to consider shifting their understanding beyond institutional compliance with ethics policies, to a personal commitment to a code of research ethics, what Lahman et al.10 call “aspirational ethics”:
Aspirational ethics are the highest stance the researcher tries to attain in ethics beyond minimum requirements (Southern et al. 2005). Researchers’ aspirational ethical stances may differ depending on culture, values, and morals, and are judged and processed internally with no mandated checks. Examples of aspirational stances include relational ethics (Ellis 2007), feminist ethics (Olsen 2005), virtue ethics (Israel and Hay 2006; Southern et al. 2005), narrative ethics (Schwandt 2007), covenantal ethics (May 1980; Schwandt 2007), ethics in practice (Guillemin and Gilliam 2004), caring ethics (Gilligan 1982/1983; Noddings 1984), and an understanding of situational ethics (Guillemin and Gilliam 2004).10
Volume 120| Number 5/6 May/June 2024 26 https://doi.org/10.17159/sajs.2024/18267 Commentary Research excellence, ethics and empathy Page 2 of 3
They combine these forms of aspirational research ethics into a framework called ‘Culturally Responsive Relational Reflexive Ethics’. The widespread critique of Nicoli Natrass’s Commentary in 2020 concerning why black students are less likely to study biological sciences11 , arguably required such a culturally responsive, relational, reflexive, ethical framework. As Eureta Rosenberg and Lesley le Grange note in their critique of Natrass’s Commentary:
As researchers, we need to pay closer attention to the methodology we use, its power to either transform the contexts about which we care, versus inherent methodological biases. The South African Journal of Science needs to publish research in which the scientists of the future and the present will recognise themselves, which means it needs to be based on well-executed research, and a choice of question and method that are both ethically and conceptually appropriate.12
Ethically and conceptually appropriate frameworks for research require an empathetic approach, which is the final point to which we turn.
Empathy
An empathetic approach to scholarly research endeavours and subsequent publications requires that we consider the social and moral impact of both the process and the products of our research. In his book, The Soul of a University: Why Excellence is not Enough13, Chris Brink urges us to consider not just what universities are good at (producing rigorous knowledge), but what universities are good for (the university as a public good). The latter approach is needed to understand the perspectives of those who are impacted by research. For example, the recent blockbuster hit film Oppenheimer about J. Robert Oppenheimer, the scientist who was at the forefront of the development of the atom bomb in World War II, brought up for scrutiny the ethical dilemmas involved in creating such a powerful weapon. It did so, however, from the perspective of Oppenheimer, not from the indigenous communities whose sacred ancestral land was used for the nuclear testing and research that led to health impairments and environmental destruction which continue to this day.
How our need to advance knowledge and its effects on communities that are impacted by quests for such ‘progress’, requires empathy as well as respect for such communities. The indigenous communities on whose land the atom bomb testing was conducted, suffer to this day from the cancerous effects of those experiments. Ethical clearance committees may not have been formalised at the time, but even if they were, considering the power wielded by the US government, the project was likely to receive ethical clearance because “no direct harm was predicted”. In cases such as this, the moral agency of researchers must be to operate not just within legal parameters for research, but also within ethical ones. Had the researchers adopted an empathetic approach rather than a legal one, the perspectives of the people who considered this space as ancestral sacred land, would have been foregrounded. Moreover, the devastation that the experiments unleashed on these communities, as well as on those who were bombed, would have been at the forefront of their concerns. As critiques of the film demonstrate, even the filmmakers themselves do little to address this.
Conclusion
Our concern in this Commentary has centred around how to foster a research culture that is robust and rigorous, while simultaneously operating within research systems that focus on the bottom line of productivity and profit. Our goal was to provide a moment for pause and critical reflection on the systems of research and rewards within South African higher education institutions, and how they may promote
less than ethical behaviour. Our proposal for a triple bottom line of research – excellence, ethics, empathy – must be taken up with a great deal of circumspection and caution, and we must guard against these values being appropriated and packaged into neat boxes that the ‘university-as-business’ model can simply leverage. We have to guard against what has become known as ‘CSR-washing’ (corporate social responsibility washing) in which businesses ‘greenwash’ (which means to hold fake environmental commitments through clever marketing strategies) or ‘pinkwash’ (to fake a commitment to social justice concerns). Universities run the risk too of ‘ethics’ washing. It is possible, we contend, for researchers (especially those at the early stages of their careers) to navigate the murky waters of reward and recognition, through embracing an EEE framework for research – a commitment to being genuinely ethical, excellent and empathetic.
Competing interests
We have no competing interests to declare.
references
1. Miller K. The triple bottom line: What it is and why it’s important. Harvard Business School Online. 2020 December 08 [updated 2023 Aug 16; cited 2023 Dec 06]. Available from: https://online.hbs.edu/blog/post/what-is-the-t riple-bottom-line
2. ElkingtonJ.Cannibalswithforks–Triplebottomlineof21stcenturybusiness. Stoney Creek, CT: New Society Publishers; 1997. https://doi.org/10.1002/tqe m.3310080106
3. McKenna S. The rise of the executive dean and the slide into managerialism. Educ Res Soc Change. 2020;9:76–89. https://doi.org/10.17159/2221-407 0/2020/v9i0a6
4. Nerad M. Increase in PhD production and reform of doctoral education worldwide. Higashihiroshima: Research Institute for Higher Education, Hiroshima University; 2010. Volume 7. p. 69–84. Available from: https://w ww.education.uw.edu/cirge/increase-in-phd-production-and-reform-in-doct oral-education-worldwide/
5. Academy of Science of South Africa (ASSAf). The PhD study: An evidencebased study on how to meet the demands for high-level skills in an emerging economy. Pretoria: ASSAf; 2010. http://dx.doi.org/10.17159/ass af.2016/0026
6. Tomaselli KG. Perverse incentives and the political economy of South African academic journal publishing. S Afr J Sci. 2018;114(11–12), Art. #4341. https://doi.org/10.17159/sajs.2018/4341
7. SouthAfricanDepartmentofHigherEducationandTraining.Researchoutputs communique 1 of 2023. 2023 August 14 [cited 2024 Feb 23]. Available from: https://www.dhet.gov.za/Policy%20and%20Development%20Support/Com munique%201%20of%202023%20Research%20Outputs.pdf
8. Msimang P. Lessons in our faults: Fault lines on race and research ethics. S Afr J Sci. 2020;116(9–10), Art. #8449. https://doi.org/10.17159/sajs.2 020/8449
9. Le Grange L. A comment on critiques of the article: Age- and educationrelated effects on cognitive functioning in Colored South African women. S Afr J High Educ. 2019;33(4):9–19. https://doi.org/10.20853/33-4-3715
10. Lahman MK, Geist MR, Rodriguez KL, Graglia P, DeRoche KK. Culturally responsive relational reflexive ethics in research: The three Rs. Qual Quant. 2011;45:1397–1414. https://doi.org/10.1007/s11135-010-9347-3
11. Nattrass N. Why are black South African students less likely to consider studying biological sciences? S Afr J Sci. 2020;116(5–6), Art. #7864. https ://doi.org/10.17159/sajs.2020/7864
12. Rosenberg E, Le Grange L. Attitudinal difference surveys perpetuate harmful tropes: A comment on Nattrass, S. Afr. J. Sci. S Afr J Sci. 2020;116(special issue), Art. #8469. https://doi.org/10.17159/sajs.2020/8469
13. Brink C. The soul of a university: Why excellence is not enough. Bristol: Bristol University Press; 2004.
Volume 120| Number 5/6 May/June 2024 27 https://doi.org/10.17159/sajs.2024/18267 Commentary Research excellence, ethics and empathy Page 3 of 3
AuthorS:
Olivia P. Matshabane1*‡
Anna Hartford2‡
Cornelius O. Ewuoso3
Andrea C. Palk4
Laura M. Koehly1
Dan J. Stein2,5
Jantina de Vries6 ‡Contributed equally as first authors
AFFILIAtIoNS:
1Social and Behavioral Research Branch, National Human Genome Research Institute, National Institutes of Health, Bethesda, Maryland, USA
2Brain-Behaviour Unit, Neuroscience Institute, University of Cape Town, Cape Town, South Africa
3Steve Biko Centre for Bioethics, University of the Witwatersrand, Johannesburg, South Africa
4Unit for Bioethics, Department of Philosophy, Stellenbosch University, Stellenbosch, South Africa
5SA MRC Unit on Risk & Resilience in Mental Disorders, Department of Psychiatry & Neuroscience Institute, University of Cape Town, Cape Town, South Africa
6Ethics Lab, Department of Medicine, UCT Centre for Clinical Research and Neuroscience Institute, University of Cape Town, Cape Town, South Africa
*Current: SA MRC Genomics of Brain Disorders Unit, Department of Psychiatry, Stellenbosch University, Cape Town, South Africa
CorrESPoNDENCE to:
Olivia Matshabane
EMAIL: preciousmatshabane@gmail.com
hoW to CItE:
Matshabane OP, Hartford A, Ewuoso CO, Palk AC, Koehly LM, Stein DJ, et al. Advancing neuroethics in Africa.
S Afr J Sci. 2024;120(5/6), Art. #18180. https://doi.org/10.17159/sa js.2024/18180
ArtICLE INCLuDES:
☐ Peer review
☐ Supplementary material
KEYWorDS: neuroscience, neurotechnology, neuroethics, Africa
PubLIShED: 28 May 2024
Advancing neuroethics in Africa
Significance:
Neuroscientific technologies to assess, monitor and influence brain activity offer tremendous potential in the prevention and treatment of neurological and mental illnesses. However, these innovations, and their pursuit, also raise serious ethical questions. Neuroethics is a field that explores the ethical, legal, societal, philosophical, and cultural implications of neuroscience and related neurotechnologies. Many of these considerations have distinct cultural and contextual dimensions. Along with the advancement of neuroscience research in Africa, it is therefore critical to advance neuroethics as an integral component of neuroscience research on the continent.
Across the world, there is great excitement about the myriad discoveries and new technologies that increase our understanding of the brain and its functions. Large international brain initiatives promise to accelerate the development of neuroscience and neurotechnology.1 Whilst offering tremendous potential in the prevention, management and treatment of neurological and mental illnesses, these innovations raise a host of ethical challenges. Neuroethics considers the ethical implications of neuroscience and neurotechnologies, as well as how neuroscience may shed light on moral decision-making. It aims to recognise and anticipate the ways in which neuroscientific advances affect our self-understanding, our communities, and our interactions with the world.2 Neuroethics includes both normative and empirical approaches; normative neuroethics focuses on the conceptual and ethical debates that arise with advances in neuroscience and neurotechnologies, while empirical neuroethics explores perceptions and interpretations of data from emerging neuroscientific studies and neurotechnological interventions in different contexts.
A central discussion within neuroethics concerns regulation of emerging neurotechnologies. For example, in 2019, following engagements with interdisciplinary leaders, the Organisation for Economic Co-operation and Development (OECD) released recommendations on responsible innovation in neurotechnology.3 In 2021, the International Bioethics Committee of UNESCO (IBC) published a report on the ethical issues of neurotechnology.4 In 2023, UNESCO expanded on the report and published a document on the risks and challenges of neurotechnologies5 for human rights. In 2024, UNESCO convened a group of 24 experts from different geographical regions to develop the first global framework on the ethics of neurotechnology. These documents contain contributions from a range of neuroethics scholars from around the globe. Despite neuroethics being embedded in global debates to support efforts to establish worldwide standards concerning neuroscience and neurotechnology, the participation and perspectives of African researchers on neuroethics has thus far been limited.6-9 We recognise, however, the recent UNESCO efforts to change that, through the involvement of African scientists in the development of a globally relevant recommendation on the ethics of neurotechnology.
Here we emphasise the need for, and unique contributions of, neuroethics research concerning and emerging from Africa. Distinct values, concerns and priorities within different African socio-cultural contexts are likely to generate distinct neuroethical considerations. These considerations may stand to impact: (1) philosophical questions generated by research in neuroscience – such as what it means to be human or how different neurotechnologies may impact personal identity, (2) African contextual and cultural perceptions on the acceptability and applicability of specific neuroscientific interventions, (3) empirical research on practical issues such as informed consent, stigma, and return of incidental / individual results, as well as context-specific research concerning how social attitudes are affected by neurotechnological interventions (including artificial intelligence informed neurotechnologies), (4) ethical considerations related to the use of neurotechnologies among African children who may be exposed to highly prevalent environmental factors that impact brain development as well as mental health, and (5) policies based on ethical neuroscientific developments and brain data governance.
We elaborate on these five areas to demonstrate the unique concerns, as well as the unique contributions, that arise with the advancement of neuroethics and neurotechnology in Africa.
African-oriented philosophical and psychological frameworks can offer unique contributions to prominent philosophical debates within neuroethics, including those regarding personal identity, agency, personhood, autonomy, moral status, cognitive and moral enhancement, moral responsibility, mental privacy, and cognitive liberty. For instance, relational conceptions of moral status might reach very different conclusions on key neuroethical disputes (e.g. the status of brainsurrogates)fromindividualcapacity-basedconceptions.10 ThecommunitarianemphasisofprominentAfricanethics frameworksalsogeneratesdistinctethicalperspectivesandinsightswithregardtoprominentdebatesinneuroethics,such as those concerning moral bioenhancement.11 Similarly, while experimental philosophy has rich application to questions in neuroethics, it has scarcely been applied in African contexts. We should expect prominent judgements and intuitions to differ in different cultural and geographical contexts, given the influence of prevailing belief systems. Such divergences are oftheoreticalinterest,buttheymayalsohavepracticalsignificance.Thisisbecausekeyresearchquestionsinneuroethics are often culturally and socially informed and therefore require exploration by research teams with cultural awareness.12 Experimental philosophy can potentially inform culturally and contextually sensitive policies and approaches that emerge in response to advances in neuroscience and neurotechnology. Research conducted elsewhere might be more or less relevant to the beliefs, judgements, intuitions, and concerns that arise in local contexts. In turn, international research might misinform the ethical and policy debates that such findings are ultimately intended to support.
© 2024. The Author(s). Published under a Creative Commons Attribution Licence.
Neuroethicists within Africa are in a unique position to focus their attention on how African values and priorities can inform the development of contextually appropriate interventions. One example is the emphasis on health equity and social justice that would suggest investigators should focus on affordable, accessible, and more
28 https://doi.org/10.17159/sajs.2024/18180 Volume 120| Number 5/6 May/June 2024 Commentary
long-term effective neurotechnological interventions – for example, encouraging more research on cost-efficient treatments of common mental disorders, rather than on difficult-to-access and high-cost invasive interventions such as deep brain stimulation.13 In addition, unique factors and considerations arise in different African contexts and communities which require context-specific insight and sensitivity. For instance, the intracultural diverse experiences of members of different groups, such as people who identify as part of the LGBTQI+ community, also need to be considered.14 This is particularly important given the continued unjust treatment and lack of adequate consideration of the views and experiences of people from the LGBTQI+ community in many countries on the continent. Local researchers who are aware of these sensitivities are more likely to be in a position to anticipate any concerns specific to their contexts. It is thus local researchers who should design and lead neuroscience and neuroethics research studies that aim to benefit African people and communities. In cases of global collaborative projects, it is also imperative that African scientists play a central role in the intellectual leadership of the project.15
Empirical research on practical issues – such as informed consent and return of incidental / individual results – is also important for neuroethics in Africa. The ethical dimensions of these concerns will be influenced by contextual considerations. Questions about ethical participation in neuroscience research, and what may be required to ensure that processes of recruitment and consent are valid, are critical to the ethical advancement of neuroscience within Africa.16 The return of results and secondary findings is another important consideration for ethical research practices, which is impacted by contextual considerations. For example, in the event that neuroscience data point to a likely genetic origin of a neuropsychiatric condition, key considerations are needed to ensure that the genetic reference data are representative for African populations. Additionally, considerations ought to be made on how to communicate such findings to individuals and families in ways that are culturally sensitive and appropriate. This needs to be done in consideration of both the limitations of resources in the context (e.g. the lack of genetic counsellors in Africa to convey results likely means that results will be returned by other health workers) and with sensitivity to local mental health causal belief systems and associated stigma and discrimination that is sometimes experienced by individuals with a neuropsychiatric condition.17,18
It is also important to consider the ethical implications of involving children in neuroscience and neurotechnological empirical research in Africa (paediatric neuroethics)19, particularly as it is critical to study the risks and protective factors regarding child brain development in Africa, given that many African children are particularly vulnerable to disruptions in healthy brain development due to increased exposure to risk factors such as poverty, trauma, alcohol, and HIV20. Developing assessments which are culturally informed and contextually sensitive is therefore an important ethical consideration.21 These factors also tie in with the growing area of environmentalneuroethics,whichconsidersspecificenvironmentalrisksfor neurological and psychiatric disorders.22 Relatedly, African neuroscientists have emphasised the importance of considering environmental features such as the diverse flora, fauna and ecosystems in Africa, for neuroscience research in addition to climate change and other environmental risks prevalent in some African countries.23
Finally, in addition to developing global standards and policies on ethical brain science and brain data governance, specific policies are required concerning research in Africa. This is crucial for protecting the data of research participants and for ensuring that all contributors (including African research participants, communities, and researchers) benefit from advancements emanating from their data in the near and longterm future. What types of benefit-sharing principles should be in place? And how should these principles be developed? These questions are crucial given the historical exploitation of various groups of people on the continent.24 The increasing commercialisation of neurotechnological innovations and related neuro-data, and their use for non-medical purposes, also adds urgency to the need to establish good brain data governance frameworks for Africa.
In conclusion, it is critical to advance the neuroethics agenda for neuroscience and neurotechnological innovations in and for Africa. Conducting neuroscience research that is regionally relevant but that has global impact may ultimately improve our understanding of brain and mental health as well as contribute to the development of neurointerventions that substantially reduce the disease burden in Africa and elsewhere. This would in turn contribute to the realisation of the United Nations Sustainable Development Goals (SDGs)25 to “promote good health and well-being” (SDG3), “reduce inequalities” (SDG10), and “promote peace, justice and strong institutions” (SDG16). Early inclusion of African people and scientists in African institutions in neuroethics discourses may contribute to a more robust and nuanced debate on neuroethical questions globally.
Acknowledgements
This research did not receive any specific grant from funding agencies in the public, commercial, or not-for-profit sectors. However, at the time that the paper was developed, O.P.M. was supported in part by the intramural research programme of the US National Human Genome Research Institute (NHGRI) (ZIAHG200335). Currently, O.P.M. is funded by the African Academy of Science, Bill and Melinda Gates Foundation and the US National Institutes of Health through the African Postdoctoral Training Initiative (APTI) as well as the South African Medical Research Council (SAMRC) through the SAMRC Genomics of Brain Disorders Unit. C.O.E.’s work is supported by the Wellcome Trust (224780/A/21/Z part of grant number PLM24053). L.M.K. is supported by the intramural research programme of NHGRI (ZIAHG200335 LMK). D.J.S. is supported by the SAMRC. J.d.V. is supported by a Research Development Award from the Wellcome Trust (WT222784/Z/21/Z) entitled “Incompleteness and the ethics of new and emerging health technologies: Fostering African conversations on relational ontology, epistemic justice and academic activism”.
Competing interests
D.J.S. has received consultancy honoraria from Discovery Vitality, Johnson & Johnson, Kanna, L’Oreal, Lundbeck, Orion, Sanofi, Servier, Takeda and Vistagen. All other authors have no competing interests to declare.
references
1. Amadio J, Bi G-Q, Boshears PF, Carter A, Devor A, Doya K, et al. Neuroethics questions to guide ethical research in the international brain initiatives. J Neuron. 2018;100(1):19–36. https://doi.org/10.1016/j.neuron.2018.09.0 21
2. Goering S, Klein E, Specker Sullivan L, Wexler A, Agüera y Arcas B, Bi G, et al. Recommendations for responsible development and application of neurotechnologies. Neuroethics. 2021;14(3):365–386. https://doi.org/10.1 007/s12152-021-09468-6
3. BrainmindGlobalAdvisoryMeeting:NeuroethicsImplementationinthePrivate Sector [webpage on the Internet]. c2022 [cited 2024 Mar 18]. Available from: http://brainmind.org/neuroethics-paris
4. International Bioethics Committee. Report of the International Bioethics Committee of UNESCO (IBC) on the Ethical Issues of Neurotechnology [document on the Internet]. c2021 [cited 2023 Jul 04]. Available from: https ://unesdoc.unesco.org/ark:/48223/pf0000378724
5. UNESCO, University of Milan-Bicocca (Italy), State University of New York (SUNY) Downstate Health Sciences University. The risks and challenges of neurotechnologies for human rights. Paris / Milan / Brooklyn, NY: UNESCO / University of Milan-Bicocca / SUNY Downstate; 2023. https://doi.org/10.5 4678/POGS7778
6. Akinyemi RO, Jenkins C, Nichols M, Singh A, Wahab K, Akpalu A, et al. Unraveling the ethical, legal, and social implications of neurobiobanking and stroke genomic research in Africa: A study protocol of the African neurobiobank for precision stroke medicine ELSI project. Int J Qual Methods. 2020;19:1–13. https://doi.org/10.1177/1609406920923194
7. Stein DJ, Giordano J. Global mental health and neuroethics. BMC Med. 2015;13(1):1–6. https://doi.org/10.1186/s12916-015-0274-y
Volume 120| Number 5/6 May/June 2024 29 https://doi.org/10.17159/sajs.2024/18180 Commentary Neuroethics in Africa Page 2 of 3
8. Stein DJ, Singh I, editors. Global mental health and neuroethics. Cambridge, MA: Academic Press; 2020. https://library.oapen.org/handle/20.500.12657 /47360
9. Palk A. Towards a more globally inclusive and relevant neuroethics. In: Jones C, Kruger M, van den Heever J, van Niekerk A, editors. Challenges in medical ethics: The South African context. Stellenbosch: African Sun Media; 2022. p. 157–182. https://doi.org/10.52779/9781991201959/09
10. Cordeiro-Rodrigues L, Ewuoso CJN. An Afro-communitarian relational approach to brain surrogates research. Neuroethics. 2021;14:561–574. https://doi.org/10.1007/s12152-021-09475-7
11. Ewuoso C, Fayemi AK. Transhumanism and African humanism: How to pursue the transhumanist vision without jeopardizing humanity. Bioethics. 2021;35(7):634–645. https://doi.org/10.1111/bioe.12902
12. MatshabaneOP,Mgweba-BewanaL,AtuireCA,deVriesJ,KoehlyLM.Cultural diversity is crucial for African neuroethics. Nat Hum Behav. 2022;6(9):1185–1187. https://doi.org/10.1038/s41562-022-01436-1
13. Matshabane OP. Promoting diversity and inclusion in neuroscience and neuroethics. EBioMedicine. 2021;67, Art. #103359. https://doi.org/10.101 6/j.ebiom.2021.103359
14. Cordeiro Rodrigues L, Izugbara C, Carman M, van Dyk GA, Umar EJNHB. Cultural competence must not leave anyone behind. Nat Hum Behav. 2023;7:2040–2041. https://doi.org/10.1038/s41562-023-01739-x
15. Palk A, Illes J, Thompson PM, Stein DJ. Ethical issues in global neuroimaging genetics collaborations. Neuroimage. 2020;221, Art. #117208. https://doi.o rg/10.1016/j.neuroimage.2020.117208
16. de Vries J. The ethics of neurogenetics research in Africa: Considerations and guidelines. In: Stein DJ, Singh I, editors. Global mental health and neuroethics. Cambridge, MA: Academic Press; 2020. p. 81–94. https://doi.org/10.1016/B 978-0-12-815063-4.00006-X
17. Matshabane OP, Campbell MM, Faure MC, Marshall PA, Mayosi BM, Stein DJ, et al. Exploring how a genetic attribution to disease relates to stigma experiences of Xhosa patients with schizophrenia in South Africa. Soc Psychiatry Psychiatr Epidemiol. 2020;55:1679–1686. https://doi.org/10.10 07/s00127-020-01875-z
18. Akinyemi RO, Owolabi MO, Adebayo PB, Akinyemi JO, Otubogun FM, Uvere E, et al. Task-shifting training improves stroke knowledge among Nigerian non-neurologist health workers. J Neurol Sci. 2015;359(1–2):112–116. http s://doi.org/10.1016/j.jns.2015.10.019
19. Illes J, Raffin TA, editors. No child left without a brain scan? Toward a pediatric neuroethics. Cerebrum. 2005;7(3):33–46.
20. Donald KA, Wedderburn CJ, Barnett W, Nhapi RT, Rehman AM, Stadler JA, et al. Risk and protective factors for child development: An observational South African birth cohort. PLoS Med. 2019;16(9), e1002920. https://doi.or g/10.1371/journal.pmed.1002920
21. Abubakar A, Van De Vijver FJ. How to adapt tests for sub-Saharan Africa. In: Abubakar A, van de Vijver F, editors. Handbook of applied developmental science in sub-Saharan Africa. New York: Springer; 2017. p. 197–212. https ://doi.org/10.1007/978-1-4939-7328-6_11
22. Cabrera LY, Tesluk J, Chakraborti M, Matthews R, Illes JJEH. Brain matters: From environmental ethics to environmental neuroethics. Environ Health. 2016;15:20. https://doi.org/10.1186/s12940-016-0114-3
23. Donald KA, Maina M, Patel N, Nguemeni C, Mohammed W, Abubakar A, et al. What is next in African neuroscience? eLife. 2022;11, e80488. https://doi.o rg/10.7554/eLife.80488
24. Chennells R, Steenkamp A. International genomics research involving the San people. In: Schroeder D, Cook J, Hirsch F, Fenet S, Muthuswamy V, editors. Ethics dumping. SpringerBriefs in Research and Innovation Governance. Cham: Springer; 2018. p. 15–22. https://doi.org/10.1007/978-3-319-64731-9_3
25. United Nations. The 17 goals [webpage on the Internet]. c2015 [cited 2023 Jul 04]. Available from: https://sdgs.un.org/goals
Volume 120| Number 5/6 May/June 2024 30 https://doi.org/10.17159/sajs.2024/18180 Commentary Neuroethics in Africa Page 3 of 3
AuthorS: Heinrich T.J. Dahms1 Richard Greenfield1
AFFILIAtIoN:
1Department of Zoology, University of Johannesburg, Johannesburg, South Africa
CorrESPoNDENCE to: Richard Greenfield
EMAIL: rgreenfield@uj.ac.za
DAtES:
received: 14 Aug. 2023
revised: 04 Mar. 2024
Accepted: 05 Mar. 2024
Published: 28 May 2024
hoW to CItE:
Dahms HTJ, Greenfield R. A review of the environments, biota, and methods used in microplastics research in South Africa. S Afr J Sci. 2024;120(5/6), Art. #16669. https:// doi.org/10.17159/sajs.2024/16669
ArtICLE INCLuDES:
☒ Peer review
☐ Supplementary material
DAtA AVAILABILItY:
☐ Open data set
☐ All data included
☐ On request from author(s)
☐ Not available
☒ Not applicable
EDItor: Jennifer Fitchett
KEYWorDS: fresh water, marine, biota, Africa, plastics pollution
FuNDING:
South African National Research Foundation (MND200505519919, 37999)
A review of the environments, biota, and methods used in microplastics research in South Africa
Microplastics are small plastic materials often defined as those between 5 mm and 0.05 mm in size. Microplastics can have toxicological impacts on various biota, from gut blockages to the transport or leaching of toxicants used in their production or absorbed from the surrounding environment. Although microplastic research has increased significantly, microplastic research in Africa lags behind that of developed countries. South Africa is the African nation with the highest number of microplastic publications. We aimed to determine the current state of microplastic research in South Africa. A total of 46 publications on microplastics in South Africa have been produced. However, many of these publications use methods that might not be accurate in determining holistic descriptions of microplastics in the aquatic environment. Similarly, many ecologically relevant environments and species have not been investigated for microplastics in the country, including any atmospheric or terrestrial environment. We conclude that, although the research being produced in South Africa can be considered adequate, a singular standard method for sampling and assessing microplastics in South African environments is required. The production of such a standard method would be critical to use as a monitoring tool to determine and compare microplastic abundances across the country and globally.
Significance:
• More than 40 publications on microplastics have been produced in South Africa.
• Microplastics have been discovered in multiple aquatic environments in South Africa, but have not been investigated in atmospheric or terrestrial environments.
• Polymer analysis was limited in published research.
• A standard method is required for comparing between studies.
• Terrestrial and atmospheric microplastic studies are required.
Introduction
Plastics are polymers that consist of monomers chained together to produce products with unique characteristics.1 These products could easily be moulded into any shape required for the product to be used. This ability has allowed for an explosion of plastic products, reaching over 322 million tonnes produced globally.2 These plastics are heavily resistant to degradation, which has allowed plastic to accumulate in the environment.3 These plastics are impacted in the environment by abiotic factors such as UV rays, temperature changes, and abrasion from wind, waves, and biota, which can degrade them and break them into smaller microscopic particles.2,3 These microscopic plastics have been detected globally, with one of the first discoveries made by Gregory4 around the coastline of New Zealand. Gregory4 discovered tiny beads on the beaches and surrounding coastline in 1977, but only later in the 21st century had environmental scientists begun to investigate these small plastic particles.5 These particles were then classified as microplastics (usually within the size range of 0.05–5 mm; however, this definition is still being debated currently).6
Microplastics have since been collected, described, and characterised globally in marine and freshwater environments, soil, biota, and the atmosphere.7 Microplastics have further been classified as either primary or secondary microplastics.2 Primary microplastics are plastics already produced in the size range of microplastics, whereas secondary microplastics are plastics that break down from larger plastic products.3 The classification system was produced to understand from where microplastics originate to determine their pathways into the environment.2
After discovering microplastics, their toxicity and potential impact on biota were investigated. Microplastics can have toxicological impacts on biota through three separate pathways. First, the physical nature of microplastics can lead to gut obstructions or reduce the ability of organisms to move or reproduce.2 Second, microplastics can also leach chemicals that are used as additives to increase their lifespan and function; this would include additives such as flame retardants, bisphenols, and other endocrine-disrupting chemicals.2,3 The third toxicological impact of microplastics is their ability to act as vectors for toxicants.3 Toxicants such as metals and persistent organic pollutants have been discovered on the surface of microplastics in concentrations significantly higher than those in the surrounding environments.3 Microplastics’ physical and chemical impacts allow for the increased bioaccumulation of a toxicant and can prevent species from regulating these toxicants out of their circulatory systems.8 Other notable toxicological studies have discovered that microplastics can lead to coral bleaching9 and can reduce the ability of phytoplankton to photosynthesise10. It is, therefore, understandable that microplastic pollution impacts 12 of the 17 United Nations Sustainable Development Goals, such as Life Below Water, Life on Land, Clean Water and Sanitation, and Good Health and Well-Being.11 In this review, we aimed to determine the state of microplastic research in South Africa. The review focuses on the environments and biota investigated, the concentrations of microplastics found, the overall methods used within the country, the current trends, and shortfalls of the research in South Africa, and where more research is required.
31 https://doi.org/10.17159/sajs.2024/16669 Volume 120| Number 5/6 May/June 2024 © 2024.
Published under a Creative Commons Attribution Licence. Review
The Author(s).
Article
Method
Data collection
Data were collected using the primary academic search engines ScienceDirect, SpringerLink, Google Scholar and the research network ResearchGate. The primary keywords used for the search of papers were “South Africa” and “Microplastics”. The papers were then screened by relevance (whether conducted in South Africa) and ordered chronologically from 2023 to 1990. The information recorded from the papers included the authors, title, year of publication, where in South Africa the study was conducted, whether it was conducted in freshwater, marine or terrestrial environments, whether biota were included in the study, which matrices were investigated (water, sediment, biota), the extraction methods used, the identification method, mean concentrations and whether quality control was performed in the study. Modelling and review papers were also included; no published studies that were conducted in South Africa were omitted. Documents that did not undergo peer review, such as dissertations, theses, preprints and reports, were not included. Microsoft Excel was used to produce graphs and tables. A map of the research conducted within South Africa was created on QGIS v3.26.2 to visualise and highlight areas where more research might be required.
Microplastic research in Africa
Microplastic research within Africa has primarily focused more on the marine environment than freshwater environments – a global trend also found in developed nations.5,12 Microplastic research in Africa has increased over the last decade; however, three recent reviews of microplastic research in Africa have found that African nations are still trailing behind developed countries.12 13 This is concerning considering the large scale of plastic pollution on the African continent.12 The reviews found that microplastics have been discovered in multiple African environments in over 11 African countries, including the Nile River, where microplastics were found in two fish species.12,14 Other environments include the Niger Delta, Lake Victoria, the southern Mediterranean Sea, and along the western coast of Africa.14 These studies not only found microplastics in the water and sediment, but also in biota, such as snails, multiple freshwater and marine fish species, and birds.14 The review by Alimi et al.14 further highlights that microplastic research in Africa was primarily divided between freshwater (22) and marine (37) environments, which included studies that discovered microplastics in surface water (15), sediment (22), and in biota (22). Central Africa remains under-researched, with almost no microplastic research being conducted there, including any terrestrial animals on the continent.14 The reviews on microplastics in Africa concluded that microplastics detected in Africa have been attributed to waste mismanagement, a rapid increase in the populations in African countries, and the import of plastic and e-waste from developed countries.12 Changes in policy regarding the import of plastic and more sustainable plastic use in Africa were suggested by Alimi et al.14 to curb plastic pollution. Lastly, although research in Africa has increased, critical environments, such as pristine natural environments and wetlands within Africa, atmospheric deposition, and terrestrial environments, have not been researched, with awareness of microplastic pollution across Africa being limited in the general population.13 The reviews of microplastics in Africa further elaborate that many studies did not include experimental controls, that they lack polymer analysis, and that there was limited information on the interactions between microplastics and metals in the African environment.12-14
Microplastics in South African environments
Alimi et al.14 found that South Africa was the leading African nation in microplastic research, followed by Nigeria and Tunisia. As of August 2023, 46 publications on microplastics in South Africa had been published (Table 1). Microplastic research in South Africa began in 1990 when Ryan15 investigated temporal trends and abundance of plastic litter on Cape Town beaches and defined plastic between 2 mm and 20 mm as microplastic. As of August 2023, 20 publications are on aspects of the marine environment, and 17 publications are on the freshwater environment (Figure 1). It is important to acknowledge that
of all 46 publications, only 12 have investigated microplastics’ presence or impacts on biota. No studies have investigated the presence or deposition of microplastics from the atmosphere. Similarly, no research has been done on microplastics in the terrestrial environment, including on any terrestrial organisms. This indicates a large gap in microplastic research within South Africa.
Microplastics in the marine environment
In 1990, Ryan15 discovered small plastic particles within the size range of 20 mm and smaller on beaches around Cape Town; this finding could be considered the first evidence of microplastics in South Africa. However, only in 2015 were microplastics – as defined today (5–0.05 mm) – researched in South Africa.16,17 Since the first study by Ryan15 , researchers have discovered, quantified, and characterised microplastics collected on beaches along the coastline18, estuaries, within coastal water19,20, and within major harbours along the South African coastline (Figure 2).
From 1990 to August 2023, a total of 20 publications were produced on microplastics in marine environments, excluding reviews and coastal modelling studies. The primary matrices investigated in South African marine environments were sediment, water, and biota, although no studies had investigated all three matrices within a single study. Estuaries can be regarded as the most under-researched marine environment, with only four publications quantifying their microplastic pollution. These studies have determined the microplastic concentrations in water and sediment21, their presence in biota such as estuarine fish species22, and the deposition of microplastics among estuarine seagrass23. Estuaries are important environments which link microplastics that may be transported downstream from inland rivers into the ocean. The results of these initial studies could indicate that these environments, which are nurseries for multiple organisms, could be at risk of microplastic pollution.16,22,23 No study has critically evaluated how many microplastics are expelled through river mouths into the surrounding oceans, although Weideman et al.24 found little to no microplastics being expelled during two sampling excursions to the Orange River mouth.
The other studies were primarily focused on quantifying microplastics on beaches and coastlines to determine the type of pollutant and how the microplastics may be distributed. Ryan et al.20 discovered consistent patterns of plastic debris on South African beaches, and de Villiers25 discovered significant levels of microfibres on beaches. The authors stated that microplastics became deposited along the coastline from the oceans.20,25 Similarly, Ryan et al.26 investigated polyethylene pellets collected along the coastline and characterised the organic pollutants bound to the plastic, which can increase the microplastics’ toxicity.
When the concentration and distribution of microplastics in water along the coastline were investigated, researchers found two opposing trends in the distribution. Naidoo and Glassom27 discovered higher concentrations of microplastics along larger urban areas, and differences between seasonal sampling were discovered, which were attributed only to changes in wind direction and tides during sampling days. During the same year, Collins and Hermes28 conducted a modelling study to determine how floating microplastics accumulate and are transported along the South African coastline. The model indicated that microplastics are released from the five major industrial zones along the South African coastline, depositing and accumulating on beaches.28 The model also indicated that a third of the microplastics released into the ocean move to the South Atlantic and South Indian oceans, and can then be transported worldwide.28 These results correlate to the findings made by Naidoo and Glassom27
However, harbours around the coastline of South Africa were found to be areas where microplastics could increase in abundance and then be released. The first study to investigate South African harbours was conducted by Nel et al.29 who investigated whether population demographics reflect microplastic loads. Nel et al.29 discovered that harbours were a significant source of microplastic pollution. However, no significant spatial differences were discovered between populations, indicating that microplastics can rapidly be distributed by ocean currents and wind29, contrary to the study conducted by Collins and Hermes28,29
Volume 120| Number 5/6 May/June 2024 32 https://doi.org/10.17159/sajs.2024/16669
A review of microplastic research in South Africa Page 2 of 9
Review Article
AuthorsYearWhere
Environment investigated Biota included Matrices investigated Extraction method Identification method
Ryan15 1990Western Cape beachesMarineSedimentSievingVisual
Ryan et al.16 2012South African coastlineMarineSedimentSievingVisual
Nel and Froneman17 2015 South-eastern coastline Marine
Naidoo et al.16 2015 KwaZulu-Natal estuaries Marine
Sediment and water Density separation, NaCl and filtering Visual
Sediment and water Density separation, NaCl and plankton net Visual and FT-IR
Verster39 2017ReviewReviewN/AN/AN/A
Nel et al.29 2017South African coastlineMarine
Ryan et al.20 2018South African beachesMarine
Sediment and water Density separation, NaCl and filtering Visual
Sediment and water Density separation, NaCl Visual
Reynolds and Ryan40 2018 Western Cape and North-West wetlands Fresh waterBirdsBiotaSievingVisual
Nel et al.41 2018 Eastern Cape Bloukrans River Fresh waterMacroinvertebrates
Sediment and biota Density separation, NaCl and digestion Visual
De Villiers25 2018South African coastlineMarineSediment Density separation, NaCl Visual
Naidoo and Glassom27 2019 KwaZulu-Natal coastline MarineWaterSteel manta trawlVisual
Dalu et al.50 2019 Limpopo Province reservoir Fresh waterSedimentSurvey Visual without microscope
Weideman et al.24 2019 Orange-Vaal River (multiple provinces) Fresh waterWater Neuston net and bulk water Visual
Collins and Hermes28 2019 South African coastline model MarineN/AN/AN/A
Govender et al.21 2020 KwaZulu-Natal estuaries Marine
Sediment and water Density separation, NaCl; plankton net Visual and FT-IR
Pereao et al.62 2020ReviewReviewN/AN/AN/A
Vilakati et al.59 2020 Western Cape seashore MarineWaterPlankton net GC-MS, Visual, SEM-EDS, FTIR
Vetrimurugan et al.18 2020 KwaZulu-Natal coastline MarineSediment Density separation, ZnCl2 SEM-EDS
McGregor and Strydom33 2020Eastern Cape coastlineMarineFishBiotaDigestionVisual
Naidoo et al.22 2020 KwaZulu-Natal coastline MarineFishBiotaDigestionVisual and FT-IR
Sparks and Immelman34 2020AgulhasMarineFishBiotaDigestionVisual
Dahms et al.7 2020 Gauteng (Braamfontein Spruit) Fresh waterMacroinvertebrates
Sediment, water, and biota
Weideman et al.24 2020 Orange-Vaal River (multiple provinces) Fresh waterWater
Density separation, NaCl and digestion Visual
Density separation NaCl, Bulk water, Neuston Net Visual
Sparks35 2020 Western Cape coastline MarineMusselsBiotaDigestionVisual
Ryan20 2020 Adjacent oceans review ReviewN/AN/AN/A
table 1: Summary of publications on microplastics research in South Africa ...table 1 continues on next page
Volume 120| Number 5/6 May/June 2024 33 https://doi.org/10.17159/sajs.2024/16669
A review of microplastic research in South Africa Page 3 of 9
Review Article
AuthorsYearWhere
Environment investigated Biota included Matrices investigated Extraction method Identification method
Iroegbu et al.53 2020ReviewReviewN/AN/AN/A
Arabi et al.37 2020ReviewReviewN/AN/AN/A
Godfrey63 2020Short noteShort noteN/AN/AN/A
Verster et al.52 2020ReviewReviewN/AN/AN/A
Mehlhorn et al.31 2021 KwaZulu-Natal harbours MarineSedimentHandpickingVisual and FT-IR
Vilakati et al.54 2021Gauteng (WWTP)Fresh waterWaterNet GC-MS, Visual, SEM-EDS, FTIR
Preston-Whyte et al.32 2021DurbanMarine
Sediment and water Sieving and density separation, NaCl Visual and FT-IR
Sparks et al.36 2021 Western Cape (retail mussels) MarineMusselsBiotaDigestionVisual and FT-IR
Dalu et al.51 2021 Limpopo WWTP (Mvudi river) Fresh waterSedimentSievingVisual
Bulannga and Schmidt56 2022KwaZulu-NatalFresh waterSingle cellular organismBiotaN/ASEM
Saad et al.44 2022 Vaal River (Gauteng, Free State) Fresh waterSediment
Ramaremisa et al.45 2022 Vaal River (Gauteng, Free State) Fresh water
Sediment and water
Density separation, NaI Visual, SEM, Raman
Density separation, NaI and plankton net Visual, SEM, Raman
Saad et al.42 2022 Vaal River (Gauteng, Free State) Fresh waterFishBiotaDigestionVisual, Raman
Dahms et al.43 2022 Vaal River (Gauteng, Free State) Fresh waterFish
Sediment, Water, and biota
Density separation, NaCl and bulk water Visual
Dalu et al.47 2023 Limpopo Province (Crocodile River) Fresh waterFishBiotaDigestionVisual, Nile Red
Boshoff et al.23 2023 Western Cape (estuaries) MarineGrass
Julius et al.19 2023 Western Cape coastline Marine
Sediment and biota Density separation, ZnCl2 Visual
Sediment and water Density separation, NaCl and bulk water Visual and FT-IR
Mutshekwa et al.49 2023 Limpopo Province (reservoirs) Fresh waterSediment Density separation, NaCl Visual and FT-IR
Nkosi et al.46 2023 Limpopo Province (Crocodile River) Fresh water
Apetogbor et al.48 2023 Western Cape (Plankenburg river) Fresh water
Sediment and water Density separation, ZnCl2 Visual, Nile Red
Sediment and water Density separation, NaCl Visual and FT-IR
Owowenu et al.57 2023ReviewReviewN/AN/AN/A
In a multinational study, Matsuguma et al.30 collected a singular core sample from Durban harbour, which had more microplastics than Tokyo Bay, which could indicate that microplastics may highly pollute South African harbours.30 It is, however, critical to report that due to the various methods used across studies, it is impossible to compare microplastic concentrations between studies accurately.
Further studies by Mehlhorn et al.31 and Preston-Whyte et al.32 investigating the abundance and distribution of microplastics in harbour environments were conducted on the retention of microplastics in South African harbours. The results indicated that South African harbours are areas where microplastics can accumulate due to the input from rivers and stormwater drains, be deposited on the sediment in the slow-moving water, and then be released into the ocean during increased flow.31,32 These studies are essential to determine where more significant plastic pollution prevention is required to reduce microplastic pollution along the South African coastline. Whether biota that are found within and in the surrounding area of harbours are impacted by the microplastics is unknown, as biota have not been sampled and investigated in harbours. Research on the impact or presence of microplastics on marine biota is limited in South Africa. Only five publications have determined the presence of microplastics in marine animals. Fish have been the predominant focus, with three of the studies determining the presence
Review Article
Volume 120| Number 5/6 May/June 2024 34 https://doi.org/10.17159/sajs.2024/16669
A review of microplastic research in South Africa Page 4 of 9
table
1 continued...
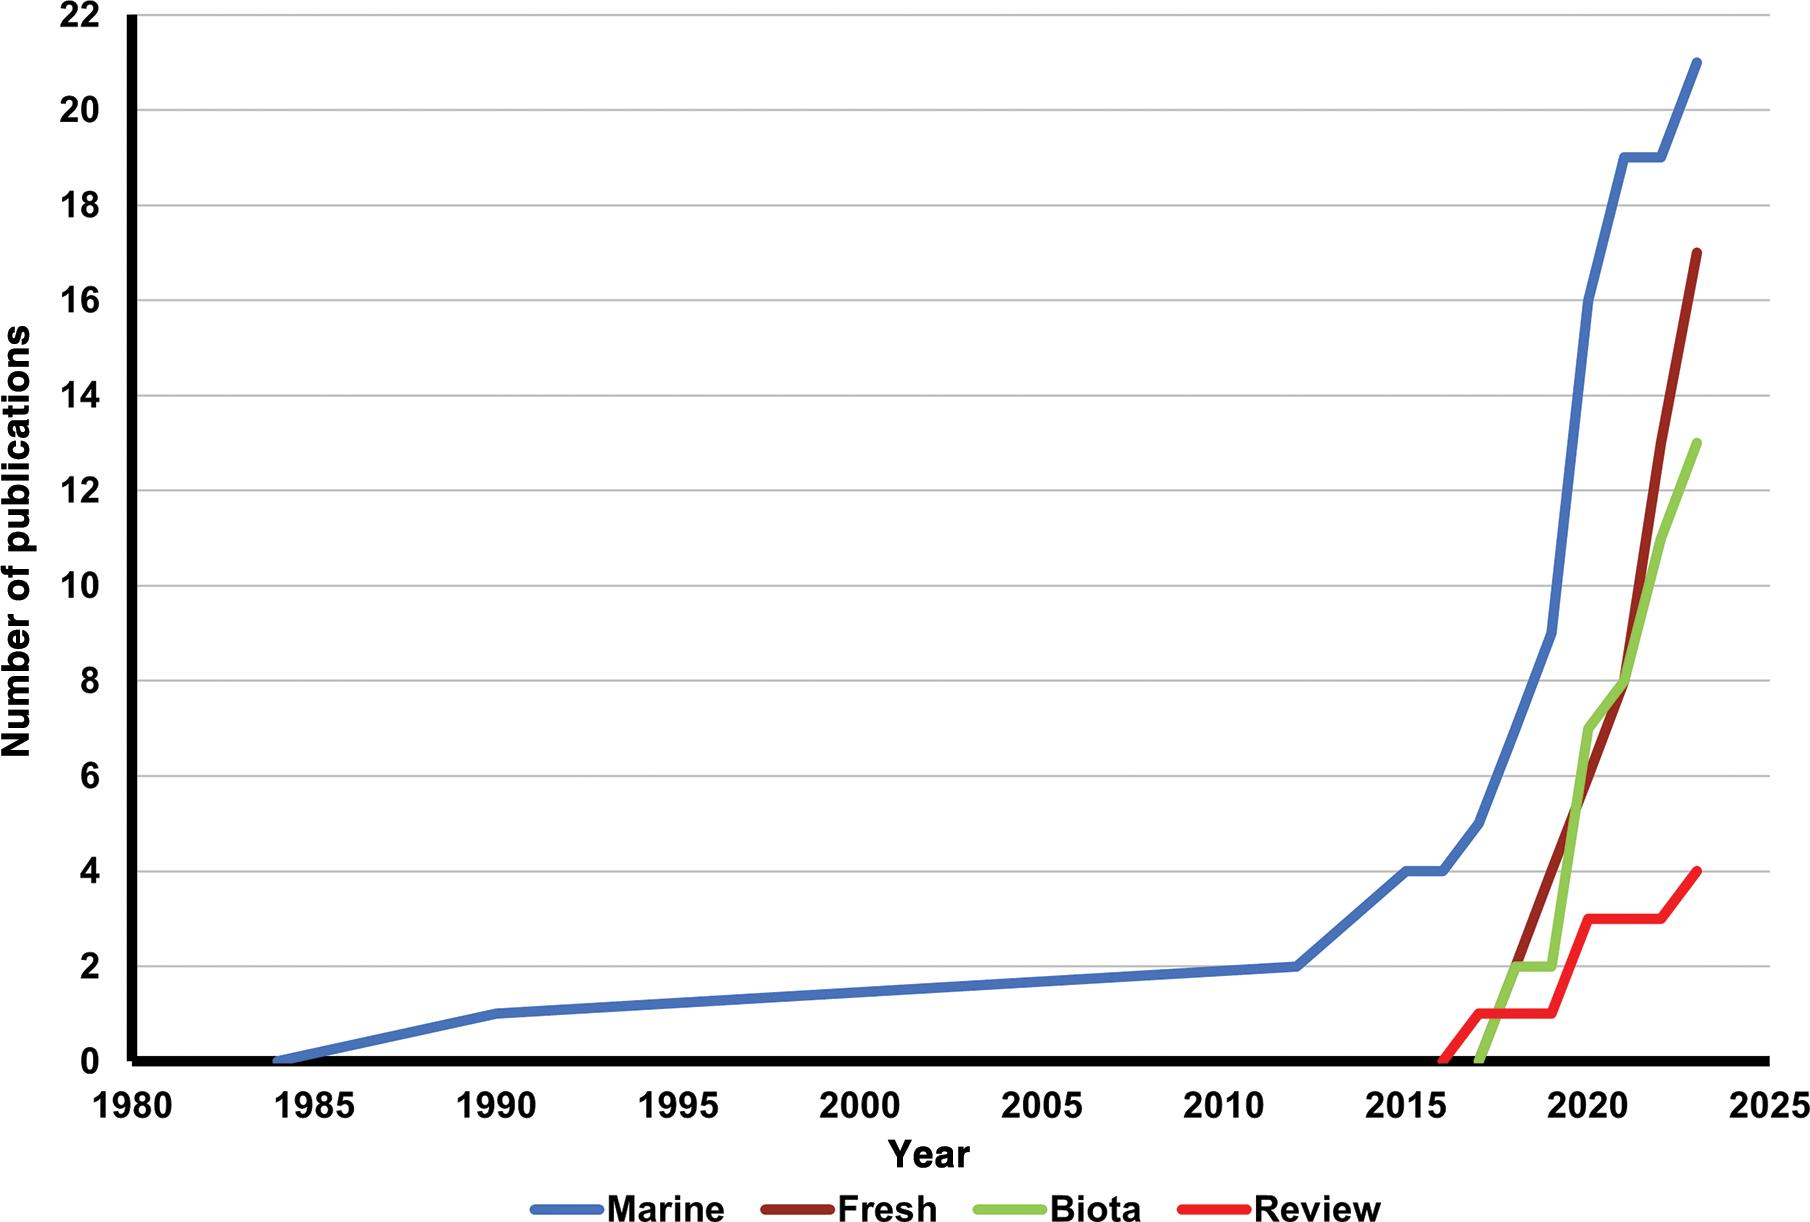
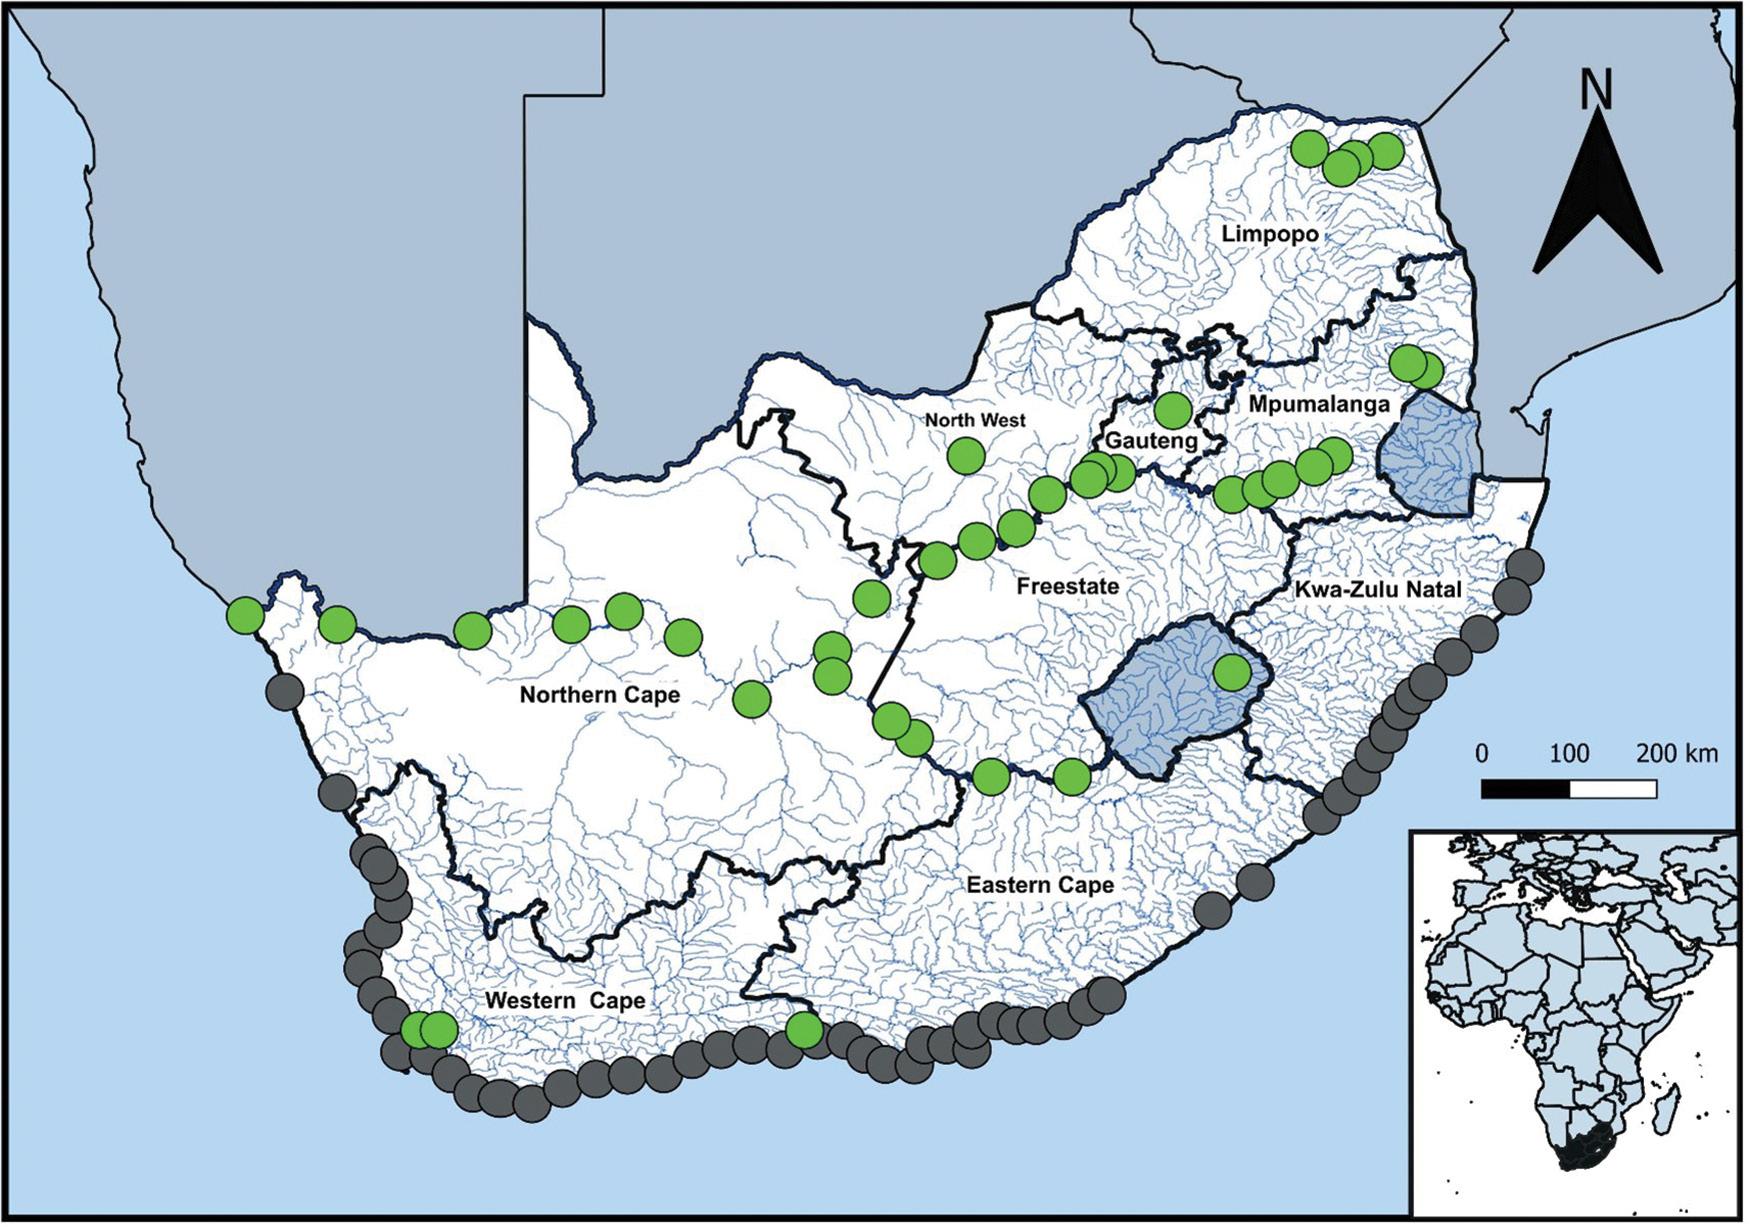
of microplastics in marine and estuarine fish.33,34 The only other biota that have been researched was when Sparks35 found microplastics in mussels along the coast of Cape Town, with means of 2.33±0.2 particles/g and 0.27±0.5 particles/organism. A secondary study by Sparks et al.36 investigated retail mussels and discovered a mean
Review Article
of 3.83±0.2 (SE) particles per mussel. These findings indicated that people eating retail mussels were in danger of consuming microplastics. Although microplastics had been discovered in wild mussels and fish, this was the first significant identification that the South African population was ingesting microplastics.36
Volume 120| Number 5/6 May/June 2024 35 https://doi.org/10.17159/sajs.2024/16669
A review of microplastic research in South Africa Page 5 of 9
Figure 2: A map of areas where microplastics have been detected in South African marine (grey) and freshwater (green) environments.
Figure 1: Line graphs of the total number of publications on microplastics in South Africa, from 1980 to July 2023.
It is recommended that microplastic research in the marine environment must accurately determine the distribution of specific polymers along coastlines, beaches, and biota.37 It is also recommended that more species related to human consumption be investigated to determine whether local fishing villages and larger towns could ingest these organisms and their associated microplastics.2,3 Questionnaire-based qualitative research could be used to determine the scale to which communities encounter or ingest microplastics by eating biota that are polluted with them. Aspects such as how the organisms are consumed, by whom, and how frequently could shed light on how populations might be impacted by microplastics. Critically, larger marine organisms such as sharks, birds and mammals must also be investigated to determine the presence of microplastics in marine ecosystems across the South African coastline. Finally, the impacts of microplastics on South African coral, zooplankton and phytoplankton must be investigated to understand their impact on these critical organisms.
Microplastics in the freshwater environment
In parallel with the global trend in microplastic research, freshwater environments in South Africa were investigated for microplastics only decades after the first publication on microplastics from marine environments.5 The first discovery of microplastics in the ocean and research bias have been described as reasons for the dramatic difference in research between the two environments.38 In a review, Verster et al.39 highlighted the gap in microplastic research in freshwater environments, whichwasthenfollowedbyasignificantincreaseinmicroplasticresearch in freshwater environments (Figure 2). The first research was published when Reynolds and Ryan40 and Nel et al.41 discovered microplastics in birds from contaminated wetlands40 and in benthic macroinvertebrates in the Bloukrans River System, respectively41. Reynolds and Ryan40 detected mean microplastic concentrations of 1.53±0.64 particles per faecal sample from birds. Similarly, in the Bloukrans River, Nel et al.41 detected microplastics in the larvae of chironomid species, with means of 0.37±0.44 and 1.12±1.19 particles/mg ww for high and low flow. These results indicate that microplastics are within the environment and in animals from lower to higher orders of the trophic system. Nel et al.41 also detected microplastics within the sediment of the same river system. They found that microplastic abundance in invertebrates and sediment could be correlated over different seasons, indicating that the species could be used as an indicator for microplastic pollution within the sediment of a river system.41
This research was followed by the first evidence of microplastics in the Orange-Vaal River system.24 Weideman et al.24 investigated the most extensive and important river system in South Africa and discovered that the dams within it were not trapping floating microplastics. A mean concentration of 0.21±0.27 particles/L was detected using a 300-µm mesh plankton net, which prevented microplastics smaller than 300 µm from being collected. However, they did not investigate any biota or sediment from the dams or try to determine how the microplastics were distributed through the system. Weideman et al.24 continued their research in the Orange-Vaal River system in 2020 and found limited long-distance transfer of microplastics in the system, with more microplastics in the upper sections of the river than downstream. They detected means of 2.3±7.2 microfibres/L in the wet season and 1.4±2.6 microfibres/L in the dry season. The authors did not investigate other matrices or aspects of the environment to understand why the transfer of microplastics was so limited. The importance of research in this system was so significant that four other studies of microplastics in the Vaal River were conducted.42 Dahms et al.43 investigated the water, sediment, and fish species Clarias gariepinus for microplastics, detecting them in all three matrices. Similarly, Saad et al.44 investigated another fish species, Cyprinus carpio and detected microplastics in the fish. Clarias gariepinus and Cyprinus carpio are important fish species economically and are a food source for subsistence fishers in the country, indicating that the microplastics ingested by these fishes might be ingested by humans.43,44 Further studies by Ramaremi et al.45 and Saad et al.44 also detected microplastics in the sediment of the Vaal River, which were then compared to the water microplastics concentrations detected by Ramaremi et al.45 These publications pose the question of whether it is acceptable to investigate single components
of a river system, such as those done by Weideman et al.24, Ramaremi et al.45 and Saad et al.42,44, or whether more holistic approaches must be considered to determine the entire distribution of microplastics in an ecosystem, such as studies conducted by Nel et al.41, Dahms et al.7,43 and Boshoff et al.23
The only other major rivers in South Africa that have been investigated for microplastic pollution are the Crocodile River and Plankenberg River. The Crocodile River was investigated when Nkosi et al.46 determined the diversity of microplastics in water and sediment, and Dalu et al.47 discovered microplastics in freshwater fishes living near wastewater treatment plants (WWTPs). Dalu et al.47 determined that fish ingested greater amounts of microplastics in the wet season (10–119 particles per fish taxon) than in the dry season (11–34 particles per fish taxon), indicating more microplastics may be resuspended and ingested in the wet season. The first river in the Western Cape Province was investigated when microplastics were discovered in the Plankenberg River.48 Seasonal variations of microplastics were found, with mean microplastic abundance in water higher in the spring (5.13±6.62 particles/L) than in the autumn (1.52±2.54 particles/L).48 The results of this study should form a baseline for monitoring and future research on microplastics in the system.48
Only one urban stream has been investigated. Dahms et al.7 detected the first microplastics within the Braamfontein Spruit in Johannesburg, the largest city in South Africa. Dahms et al.7 detected microplastics within all three matrices of the environment (water, sediment, biota) to provide a more holistic view of microplastics in the system. They7 found an influence of environmental characteristics, such as increased water velocity leading to increased microplastics in water, and finer sediment grain sizes having higher microplastic abundances than larger grain sizes.7 These results indicate that only determining microplastics within a single component of a river system with irregular sampling could give a false reading of the extent of microplastics in a system.7 Dahms et al.7 attributed sewage run-off as the leading cause of the increased microplastics in some areas in the system.
Aquatic environments that have rarely been investigated are pans, reservoirs, or isolated water bodies, with the only publications being those of Mutshekwa et al.49 and Dalu et al.50 who conducted a survey in which microplastics and other plastic debris were identified on the shoreline of a reservoir in the Limpopo Province. Microplastics in the reservoir were regarded as having a direct negative health impact on people dependent on the reservoir, highlighting how microplastics could be in isolated water bodies.
With microplastics in rivers being attributed to WWTPs, multiple studies have investigated their contribution to microplastics in South Africa. It was previously highlighted that Dalu et al.47 discovered that fish near a WWTP were ingesting microplastics. Other studies that have investigated microplastics include that of Dalu et al.51 who investigated the impacts of urbanisation and WWTPs on microplastic loads in the Mvudi River system in the Limpopo Province. The authors found no relationship between microplastics and the WWTP; however, they detected differences in microplastic types across seasons and determined the sources of microplastic pollution to be from atmospheric deposition, direct pollution or possibly broken drainage pipes, outside of WWTPs.51 This result is contrary to those of other studies worldwide, which have noted that WWTPs can expel billions of microplastics every day.2,52 53 The other WWTPs investigated were in the Gauteng Province; Vilakati et al.54 attempted to characterise microplastics through pyrolysisgas chromatography-mass spectrometry (GC-MS). Vilakati et al.54 discovered four primary plastic polymers, with polyvinyl chloride (PVC) being the most abundant polymer found, representing 47.8% of the polymers found. The authors also characterised residues on the microplastics such as calcium, aluminium, and others related to additives used in the production of the plastic or from the surrounding environment. This characterisation is critical to understand how toxic microplastics are in the South African environment and how they can be related to toxicological testing. Currently, microplastic studies use concentrations and combinations of plastic polymers that cannot be
Volume 120| Number 5/6 May/June 2024 36 https://doi.org/10.17159/sajs.2024/16669
A review of microplastic research in South Africa Page 6 of 9
Review Article
regarded as environmentally representative, not accurately reflecting what has been found in various environments, and therefore more research on the make-up of microplastic polymers is required.55
Of the microplastics studies in freshwater environments, seven included a biological component as either a bioindicator or to assess whether microplastics were entering aquatic food chains. Fish have primarily been the most popular organisms studied and were investigated in three of the studies, followed by benthic macroinvertebrates in two studies, with birds and ciliates being the only other organisms investigated.56
Although there has been a significant increase in microplastic research in freshwater systems, many publications have primarily determined and reported the microplastic abundance in only one or two ecosystem components. Only 13 studies have attempted to determine the microplastic abundance in two or more components of the environment, with only 2 studies investigating all components of the ecosystem to determine how the distribution is impacted. A review paper by Owowenu et al.57 similarly highlighted how aspects such as flow, depth, sediment grain size, river width and discharge could impact the distribution of microplastics. Few papers have tried to determine how polymers were distributed across a river system; without accurate representation or understanding of how microplastics distribute, microplastic toxicological research cannot use environmentally relevant concentrations in toxicological studies.
From the review of all the literature presented here, it is recommended that microplastic studies in freshwater environments must incorporate all aspects of the system to determine accurately how microplastics are distributed.2,7,40 Freshwater environments remain under-researched in South Africa, with many critical environments, such as large wetlands and river systems, not having been investigated at all (Figure 2).13,39,40 Heritage sites and sites of international importance that have not been investigated include Lake Saint Lucia, the Nylsvley wetland area, the Limpopo River system, the Kruger National Park, and the various caves and groundwater which are critical to the country. It is also recommended that the great watershed along the Drakensberg Escarpment is investigated, to determine whether atmospheric deposition pollutes the country’s rivers at their origins.2
Methods used in South Africa
Field sampling methods
Water and sediment have been the primary components of the environment that have been investigated in South Africa. Sampling methods have been similar to those used in other countries.2 Sediment has been sampled the most consistently across studies with bulk sediment samples collected using spades, shovels, corers or other sediment sampling instruments, and then analysed. These methods are consistently used; however, for monitoring purposes, a standardised amount of sediment from various sampling points in the river, collected using a standard tool, would yield better results to compare between sites and studies. Microplastics are then extracted from the sediment through density separation methods. The primary solution used in density separation methods across the reviewed studies was NaCl at a density of 1.2 g.cm3 which was used in 12 of the reviewed publications (Table 1). The other studies used slightly denser solutions, such as NaI or ZnCl2, which can have densities of over 1.5 g.cm3, allowing for collection of denser microplastic polymers.58 Although using a less dense medium such as NaCl is a much more environmentally friendly and cost-effective method, using it to collect microplastics from sediment may not be the most accurate method to determine microplastic profiles in sediment, as it would not allow for heavier polymers to be extracted.58 Due to various densities of plastics, the question of whether a singular standard solution density must be prescribed for microplastic analysis, has yet to be determined.58
Collection of water samples varied across studies; however, the most common method was sampling bulk water, filtered at the site, or using nets such as manta trawls, neuston, and plankton nets of various mesh sizes that might not collect all the sizes of microplastics present. Care must be taken when nets or containers made from plastic are used,
which could potentially contaminate the sample with microplastics. Contamination also needs to be considered when biota are sampled to ensure that nets used to catch and keep biota do not contaminate the samples. Finally, the most important aspect of sampling from environments is to contextualise the site from where the sample was collected. The season, flow, depth, sediment grain size, and discharge could all impact the distribution of the microplastics. If the site data cannot be contextualised, the results could provide a false indication of the total plastics sampled, regardless of the method used.7,57 The contextualisation of the environment and a standardised method would similarly allow for a singular reporting unit of microplastics, compared to the various units seen in the studies reported in this review paper. Consideration must be given to contamination control in microplastic studies. In the review, eight of the studies failed to include information on the contamination control steps taken during the study. A singular contamination control guide could be produced for microplastics research during field and laboratory components of a study; however, input from all research groups would be required to find the most accurate system to use across studies.
Microplastic identification
IdentifyingmicroplasticpolymersinSouthAfricaseemslimitedcompared to that in developed countries. Only a limited number of publications had some form of polymer identification. Of those that had determined the polymer of plastic, the most available method seemed to be Fourier transform infrared (FT-IR) analysis conducted in 9 of the publications produced, with 21 papers not conducting any form of polymer analysis. This was followed by Raman spectroscopy, used in three publications, and pyrolysis-GC-MS59, conducted in two publications. Although recent publications by De Frond et al.60 and Kotar et al.61 have noted that visual identification can be an accurate method to determine larger sizes of microplastics (particles >0.02 mm), identifying how polymers distribute in the environment is crucial to determining the overall toxicological impact of microplastics in the environment. Similarly, polymer analysis has become a required aspect of microplastics research as a method to determine the accuracy of the visual identification of microplastics.60,61
recommendations for future research
Microplastics research should be conducted in more environments and biota in South Africa. Aquatic environments are crucial in a waterscarce country such as South Africa, and the impact of microplastics on freshwater environments has scarcely been investigated. There is also the need for a prescribed method for the sampling and analysis of microplastics in South African environments. For a standard monitoring tool, a standard method that is both cost- and time-effective but accessible and accurate in its analysis could be easily adopted by the various research institutes in the country.62,63 Standardisation is crucial to compare microplastic concentrations across the country, as using different methods prevents researchers from comparing microplastic concentrations between studies. This review has found that half of the publications in the country lack polymer analysis, which could significantly impact the validity of the results.60 This shortcoming could be due to a lack of resources, such as instruments or funding that can be used for polymer analysis. Making FT-IR analysis, the most conducted method of polymer analysis in South Africa, the prescribed and required tool for polymer analysis could enable a more accurate standard monitoring protocol in the country, although all instruments used in polymer identification have shortcomings.60,61 A fast, accurate, and cost-effective method needs to be established so that reliable analysis can be adopted as a standard method at all research institutions across the country. A prescribed organism for microplastic levels in sediment and water must be identified; however, this has not yet been determined internationally. Most importantly, methods to sample microplastics accurately and consistently across studies must be determined. Investigating one or two components over a season could give a false microplastic abundance. Similarly, the lack of research on the wetlands in South Africa is concerning, as wetlands could be a hotspot for microplastic accumulation. The other environments that require research include terrestrial environments and atmospheric deposition in South Africa and globally.12-14
Volume 120| Number 5/6 May/June 2024 37 https://doi.org/10.17159/sajs.2024/16669
A review of microplastic research in South Africa Page 7 of 9
Review Article
Acknowledgements
We acknowledge the South African National Research Foundation for funding this research [grant number: 612 MND200505519919; grant number: 137999]. We also thank the anonymous reviewers for their contribution to the review.
Competing interests
We have no competing interests to declare.
Authors’ contributions
H.T.J.D.: Conceptualisation; data collection; methodology; data collection;dataanalysis;writing–theinitialdraft.R.G.:Conceptualisation; methodology; validation; writing – revision; student supervision; funding acquisition.
references
1. Jansen JA. Plastics - It’s all about molecular structure. Plastics Engineering. 2016 September. Available from: https://read.nxtbook.com/wiley/plasticseng ineering/september2016/consultantscorner_plastics.html
2. Li J, Liu H, Paul Chen J. Microplastics in freshwater systems: A review on occurrence, environmental effects, and methods for microplastics detection. Water Res. 2018;137:362–374. https://doi.org/10.1016/j.watre s.2017.12.056
3. Guo X, Wang J. The chemical behaviors of microplastics in marine environment: A review. Mar Pollut Bull. 2019;142:1–14. https://doi.org/10. 1016/j.marpolbul.2019.03.019
4. Gregory MR. Plastic pellets on New Zealand beaches. Mar Pollut Bull. 1977;8:82–84. https://doi.org/10.1016/0025-326X(77)90193-X
5. Eerkes-MedranoD,ThompsonR.Occurrence,fate,andeffectofmicroplastics in freshwater systems. In: Zeng EY, editor. Microplastic contamination in aquatic environments. Amsterdam: Elsevier; 2018. p. 95–132. https://doi.or g/10.1016/B978-0-12-813747-5.00004-7
6. Arthur C, Baker J, Bamford H. International research workshop on the occurrence, effects, and fate of microplastic marine debris. In: Conference Proceedings of the International Research Workshop on the Occurrence, Effects, and Fate of Microplastic Marine Debris; 2008 September 9–11; Tacoma, WA, USA. NOAA Technical Memorandum NOS-OR&R-30. Silver Spring, MD: NOAA Marine Debris Division; 2009.
7. Dahms HTJ, van Rensburg GJ, Greenfield R. The microplastic profile of an urban African stream. Sci Total Environ. 2020;731, Art. #138893. https://do i.org/10.1016/j.scitotenv.2020.138893
8. Barboza LGA, Vieira LR, Branco V, Carvalho C, Guilhermino L. Microplastics increase mercury bioconcentration in gills and bioaccumulation in the liver, and cause oxidative stress and damage in Dicentrarchus labrax juveniles. Sci Rep. 2018;8:1–9. https://doi.org/10.1038/s41598-018-34125-z
9. Syakti AD, Jaya JV, Rahman A, Hidayati NV, Raza’i TS, Idris F, et al. Bleaching and necrosis of staghorn coral (Acropora formosa) in laboratory assays: Immediate impact of LDPE microplastics. Chemosphere. 2019;228:528–535. https://doi.org/10.1016/j.chemosphere.2019.04.156
10. Wang W, Gao H, Jin S, Li R, Na G. The ecotoxicological effects of microplastics on aquatic food web, from primary producer to human: A review. Ecotoxicol Environ Saf. 2019;173:110–117. https://doi.org/10.1016/j.ecoenv.2019.01.113
11. Walker TR. (Micro)plastics and the UN Sustainable Development Goals. Curr Opin Green Sustain Chem. 2021;30, Art. #100497. https://doi.org/10.1016 /j.cogsc.2021.100497
12. Okeke ES, Olagbaju OA, Okoye CO, Addey CI, Chukwudozie KI, Okoro JO, et al. Microplastic burden in Africa: A review of occurrence, impacts, and sustainability potential of bioplastics. Chem Eng J Adv. 2022;12, Art. #100402. https://doi.org/10.1016/j.ceja.2022.100402
13. Aragawa TA. Microplastic pollution in African countries’ water systems: A review on findings, applied methods, characteristics, impacts, and managements. SN Appl Sci. 2021;3:629. https://doi.org/10.1007/s42452-0 21-04619-z
14. Alimi OS, Fadare OO, Okoffo ED. Microplastics in African ecosystems: Current knowledge, abundance, associated contaminants, techniques, and research needs. Sci Total Environ. 2021;755, Art. #142422. https://doi.org/10.1016/ j.scitotenv.2020.142422
15. Ryan PG. Plastic and other artefacts on South African beaches: Temporal trends in abundance and composition. S Afr J Sci. 1990;86:450–452.
16. Naidoo T, Glassom D, Smit AJ. Plastic pollution in five urban estuaries of KwaZulu-Natal, South Africa. Mar Pollut Bull. 2015;101(1):473–480. https:// doi.org/10.1016/j.marpolbul.2015.09.044
17. Nel HA, Froneman PW. A quantitative analysis of microplastic pollution along thesouth-easterncoastlineofSouthAfrica.MarPollutBull.2015;101(1):274–279. https://doi.org/10.1016/j.marpolbul.2015.09.043
18. Vetrimurugan E, Jonathan MP, Sarkar SK, Rodríguez-González F, Roy PD, Velumani S, et al. Occurrence, distribution and provenance of micro plastics: A large scale quantitative analysis of beach sediments from southeastern coast of South Africa. Sci Total Environ. 2020;746, Art. #141103. https://do i.org/10.1016/j.scitotenv.2020.141103
19. Julius D, Awe A, Sparks C. Environmental concentrations, characteristics and risk assessment of microplastics in water and sediment along the Western Cape coastline, South Africa. Heliyon. 2023;9(8), E18559. https://doi.org/10 .1016/j.heliyon.2023.e18559
20. Ryan PG, Perold V, Osborne A, Moloney CL. Consistent patterns of debris on South African beaches indicate that industrial pellets and other mesoplastic items mostly derive from local sources. Environ Pollut. 2018;238:1008–1016. https://doi.org/10.1016/j.envpol.2018.02.017
21. Govender J, Naidoo T, Rajkaran A, Cebekhulu S, Bhugeloo A, Sershen. Towards characterising microplastic abundance, typology and retention in mangrove-dominated estuaries. Water. 2020;12(10), Art. #2802. https://d oi.org/10.3390/w12102802
22. Naidoo T, Sershen, Thompson RC, Rajkaran A. Quantification and characterisation of microplastics ingested by selected juvenile fish species associated with mangroves in KwaZulu-Natal, South Africa. Environ Pollut. 2020;257, Art. #113635. https://doi.org/10.1016/j.envpol.2019.113635
23. Boshoff BJ, Robinson TB, von der Heyden S. The role of seagrass meadows in the accumulation of microplastics: Insights from a South African estuary. Mar Pollut Bull. 2023;186, Art. #114403. https://doi.org/10.1016/j.marpolb ul.2022.114403
24. Weideman EA, Perold V, Ryan PG. Little evidence that dams in the OrangeVaal River system trap floating microplastics or microfibres. Mar Pollut Bull. 2019;149, Art. #110664. https://doi.org/10.1016/j.marpolbul.2019.110664
25. de Villiers S. Quantification of microfibre levels in South Africa’s beach sediments, and evaluation of spatial and temporal variability from 2016 to 2017. Mar Pollut Bull. 2018;135:481–489. https://doi.org/10.1016/j.marpo lbul.2018.07.058
26. Ryan PG, Bouwman H, Moloney CL, Yuyama M, Takada H. Long-term decreases in persistent organic pollutants in South African coastal waters detected from beached polyethylene pellets. Mar Pollut Bull. 2012;64 (12):2756–2760. https://doi.org/10.1016/j.marpolbul.2012.09.013
27. Naidoo T, Glassom D. Sea-surface microplastic concentrations along the coastal shelf of KwaZulu-Natal, South Africa. Mar Pollut Bull. 2019;149, Art. #110514. https://doi.org/10.1016/j.marpolbul.2019.110514
28. Collins C, Hermes JC. Modelling the accumulation and transport of floating marine micro-plastics around South Africa. Mar Pollut Bull. 2019;139:46–58. https://doi.org/10.1016/j.marpolbul.2018.12.028
29. Nel HA, Hean JW, Noundou XS, Froneman PW. Do microplastic loads reflect the population demographics along the southern African coastline? Mar Pollut Bull. 2017;115(1–2):115–119. https://doi.org/10.1016/j.marpolbul.2016.11 .056
30. Matsuguma Y, Takada H, Kumata H, Kanke H, Sakurai S, Suzuki T, et al. Microplastics in sediment cores from Asia and Africa as indicators of temporal trends in plastic pollution. Env Cont Toxicol. 2017;73:230–239. https://doi.org/10.1007/s00244-017-0414-9
31. Mehlhorn P, Viehberg F, Kirsten K, Newman B, Frenzel P, Gildeeva O, et al. Spatial distribution and consequences of contaminants in harbour sediments – A case study from Richards Bay Harbour, South Africa. Mar Pollut Bull. 2021;172, Art. #112764. https://doi.org/10.1016/j.marpol bul.2021.112764
32. Preston-Whyte F, Silburn B, Meakins B, Bakir A, Pillay K, Worship M, et al. Meso- and microplastics monitoring in harbour environments: A case study for the Port of Durban, South Africa. Mar Pollut Bull. 2021;163, Art. #111948. https://doi.org/10.1016/j.marpolbul.2020.111948
Volume 120| Number 5/6 May/June 2024 38
Review
A review of microplastic research in South Africa Page 8 of 9
https://doi.org/10.17159/sajs.2024/16669
Article
33. McGregor S, Strydom NA. Feeding ecology and microplastic ingestion in Chelon richardsonii (Mugilidae) associated with surf diatom Anaulus australis accumulations in a warm temperate South African surf zone. Mar Pollut Bull. 2020;158, Art. #111430. https://doi.org/10.1016/j.marpolbul.2020.111430
34. Sparks C, Immelman S. Microplastics in offshore fish from the Agulhas Bank, South Africa. Mar Pollut Bull. 2020;156, Art. #111216. https://doi.org/10.10 16/j.marpolbul.2020.111216
35. Sparks C. Microplastics in mussels along the coast of Cape Town, South Africa. Bull Environ Contam Toxicol. 2020;104(4):423–431. https://doi.org/1 0.1007/s00128-020-02809-w
36. SparksC,AweA,ManeveldJ.Abundanceandcharacteristicsofmicroplastics in retail mussels from Cape Town, South Africa. Mar Pollut Bull. 2021;166, Art. #112186. https://doi.org/10.1016/j.marpolbul.2021.112186
37. Arabi S, Nahman A. Impacts of marine plastic on ecosystem services and economy: State of South African research. S Afr J Sci. 2020;116(5/6), Art. #7695. https://doi.org/10.17159/sajs.2020/7695
38. Blettler MCM, Abrial E, Khan FR, Sivri N, Espinola LA. Freshwater plastic pollution: Recognizing research biases and identifying knowledge gaps. Water Res. 2018;143:416–424. https://doi.org/10.1016/j.watres.2018.06. 015
39. Verster C, Minnaar K, Bouwman H. Marine and freshwater microplastic research in South Africa. IEAM. 2017;13:533–535. https://doi.org/10.1002 /ieam.1900
40. Reynolds C, Ryan PG. Micro-plastic ingestion by waterbirds from contaminated wetlands in South Africa. Mar Pollut Bull. 2018;126:330–333. https://doi.org/10.1016/j.marpolbul.2017.11.021
41. Nel HA, Dalu T, Wasserman RJ. Sinks and sources: Assessing microplastic abundance in river sediment and deposit feeders in an Austral temperate urban river system. Sci Total Environ. 2018;612:950–956. https://doi.org/10 .1016/j.scitotenv.2017.08.298
42. Saad D, Ndlovu M, Ramaremisa G, Tutu H. Microplastics in freshwater environment: The first evaluation in sediment of the Vaal River, South Africa. Heliyon. 2022;8(10), e11118. https://doi.org/10.1016/j.heliyon.202 2.e11118
43. Dahms HTJ, Tweddle GP, Greenfield R. Gastric microplastics in Clarias gariepinus of the Upper Vaal River, South Africa. Front Environ Sci. 2022;10, Art. #931073. https://doi.org/10.3389/fenvs.2022.931073
44. Saad D, Chauke P, Cukrowska E, Richards H, Nikiema J, Chimuka L, et al. First biomonitoring of microplastic pollution in the Vaal River using Carp fish (Cyprinus carpio) “as a bio-indicator.” Sci Total Environ. 2022;836, Art. #155623. https://doi.org/10.1016/j.scitotenv.2022.155623
45. Ramaremisa G, Ndlovu M, Saad D. Comparative assessment of microplastics in surface waters and sediments of the Vaal River, South Africa: Abundance, composition, and sources. Environ Toxicol Chem. 2022;41(12):3029–3040. https://doi.org/10.1002/etc.5482
46. Nkosi MS, Cuthbert RN, Wu N, Shikwambana P, Dalu T. Microplastic abundance, distribution, and diversity in water and sediments along a subtropical river system. Environ Sci Pollut Res. 2023;30:91440–91452. https://doi.org/10.1007/s11356-023-28842-w
47. Dalu T, Themba NN, Dondofema F, Cuthbert RN. Nowhere to go! Microplastic abundances in freshwater fishes living near wastewater plants. Environ Toxicol Pharmacol. 2023;101, Art. #104210. https://doi.org/10.1016/j.eta p.2023.104210
48. Apetogbor K, Pereao O, Sparks C, Opeolu B. Spatio-temporal distribution of microplastics in water and sediment samples of the Plankenburg River, Western Cape, South Africa. Environ Pollut. 2023;15:323. https://doi.org/10. 1016/j.envpol.2023.121303
49. Mutshekwa T, Munyai LF, Mugwedi L, Cuthbert RN, Dondofema F, Dalu T. Seasonal occurrence of microplastics in sediment of two South African recreational reservoirs. Water Biol Secur. 2023;2(3), Art. #100185. https://d oi.org/10.1016/j.watbs.2023.100185
50. Dalu T, Malesa B, Cuthbert RN. Assessing factors driving the distribution and characteristics of shoreline macroplastics in a subtropical reservoir. Sci Total Environ. 2019;696, Art. #133992. https://doi.org/10.1016/j.scitotenv.2019 .133992
51. Dalu T, Banda T, Mutshekwa T, Munyai LF, Cuthbert RN. Effects of urbanisation andawastewatertreatmentplantonmicroplasticdensitiesalongasubtropical river system. Environ Sci Pollut Res. 2021;28:36102–36111. https://doi.org/ 10.1007/s11356-021-13185-1
52. Verster C, Bouwman H. Landbased sources and pathways of marine plastics in a South African context. S Afr J Sci. 2020;116(5/6), Art. #7700. https://d oi.org/10.17159/sajs.2020/7700
53. Iroegbu AOC, Sadiku RE, Ray SS, Hamam Y. Plastics in municipal drinking water and wastewater treatment plant effluents: Challenges and opportunities for South Africa-a review. Environ Sci Pollut Res Int. 2020;27(12):12953–12966. https://doi.org/10.1007/s11356-020-08194-5
54. Vilakati B, Sivasankar V, Nyoni H, Mamba BB, Omine K, Msagati TAM. The Py-GC-TOF-MS analysis and characterization of microplastics (MPs) in a wastewater treatment plant in Gauteng Province, South Africa. Ecotoxicol Environ Saf. 2021;222, Art. #112478. https://doi.org/10.1016/j.ecoenv.20 21.112478
55. Weis JA. Aquatic microplastic research – a critique and suggestions for the future. Water. 2020;12, Art. #1475. https://doi.org/10.3390/w12051475
56. Bulannga RB, Schmidt S. Uptake and accumulation of microplastic particles by two freshwater ciliates isolated from a local river in South Africa. Environ Res. 2022;204, Art. #112123. https://doi.org/10.1016/j.envres.20 21.112123
57. Owowenu E, Nnadozie C, Akamagwuna FC, Noundou XS, Uku JE, Odume ON. A critical review of environmental factors influencing the transport dynamics of microplastics in riverine systems: Implications for ecological studies. Aquat Ecol. 2023;57:557–570. https://doi.org/10.1007/s10452-023-10029-7
58. Coppock RL, Cole M, Lindeque PK, Queirós AM, Galloway TS. A small-scale, portable method for extracting microplastics from marine sediments. Environ Pollut. 2017;230:829–837. https://doi.org/10.1016/j.envpol.2017.07.017
59. Vilakati B, Sivasankar V, Mamba BB, Omine K, Msagati TAM. Characterization of plastic micro particles in the Atlantic Ocean seashore of Cape Town, South Africa and mass spectrometry analysis of pyrolyzate products. Environ Pollut. 2020;265, Art. #114859. https://doi.org/10.1016/j.envpol.2020.114859
60. De Frond H, Hampton LT, Kotar S, Gesulga K, Matuch C, Lao W, et al. Monitoring microplastics in drinking water: An interlaboratory study to inform effective methods for quantifying and characterizing microplastics. Chemosphere. 2022;298, Art. #134282. https://doi.org/10.1016/j.chemos phere.2022.134282
61. Kotar S, McNeish R, Murphy-Hagan C, Renick V, Lee CT, Steele C, et al. Quantitative assessment of visual microscopy as a tool for microplastic research: Recommendations for improving methods and reporting. Chemosphere. 2022;308, Art. #136449. https://doi.org/10.1016/j.chemos phere.2022.136449
62. Pereao O, Opeolu B, Fatoki O. Microplastics in aquatic environment: Characterization, ecotoxicological effect, implications for ecosystems and developments in South Africa. Environ Sci Pollut Res. 2020;27:22271–22291. https://doi.org/10.1007/s11356-020-08688-2
63. Godfrey L. Are there gaps in our understanding of marine plastic pollution? S Afr J Sci. 2020;116(5/6), Art. #8170. https://doi.org/10.17159/sajs.202 0/8170
Volume 120| Number 5/6 May/June 2024 39
A review of microplastic research in South Africa Page 9 of 9
https://doi.org/10.17159/sajs.2024/16669 Review Article
AuthorS:
Ross D. Stewart1*
Michelle van der Bank1
T. Jonathan Davies1,2
AFFILIAtIoNS:
1African Centre for DNA Barcoding (ACDB), Department of Botany and Plant Biotechnology, University of Johannesburg, Johannesburg, South Africa
2Biodiversity Research Centre, University of British Columbia, Vancouver, British Columbia, Canada
*Current: Department of Biological and Agricultural Sciences, Sol Plaatje University, Kimberley, South Africa
CorrESPoNDENCE to:
Ross Stewart
EMAIL: ross.d.stewart@gmail.com
DAtES:
received: 08 July 2023
revised: 06 Mar. 2024
Accepted: 06 Mar. 2024
Published: 28 May 2024
hoW to CItE:
Stewart RD, van der Bank M, Davies TJ. Unveiling South African insect diversity: DNA barcoding’s contribution to biodiversity data. S Afr J Sci. 2024;120(5/6), Art. #16448. https://doi.org/10.17159/sajs.202 4/16448
ArtICLE INCLuDES:
☒ Peer review
☐ Supplementary material
DAtA AVAILABILItY:
☐ Open data set
☐ All data included
☐ On request from author(s)
☐ Not available
☒ Not applicable
EDItor: Sydney Moyo
KEYWorDS:
DNA barcoding, biodiversity, insect, South Africa, conservation
Unveiling South African insect diversity: DNA barcoding’s contribution to biodiversity data
Insects are one of the most species-rich groups on Earth. They comprise much of animal diversity and play vital roles in ecosystems, including pollination, pest control, and decomposition. However, only a fraction of this diversity has been formally described. South Africa is recognised as one of the most biologically diverse countries globally, with an estimated 44 000 insect species. Many crops rely on insect pollinators, including canola, apples, oranges, and sunflowers. A shortage of wild pollinators currently threatens crop yields, yet our knowledge of insect diversity within South Africa is sparse. There are few taxonomic specialists relative to South Africa’s biodiversity, and the methods used for insect identification can be time-consuming and expensive. DNA barcoding provides an important research tool to accelerate insect biodiversity research. In this review, we queried the public DNA barcoding BOLD (Barcode of Life Data System) database for records of “Insecta” within South Africa, and 416 211 published records assigned to 28 239 unique BINs (Barcode Index Numbers) were returned. We identified five taxonomic orders with more BINs than known species in southern Africa (Hymenoptera, Diptera, Thysanoptera, Plecoptera, and Strepsiptera). Most of the barcoded records were derived from Malaise trap sampling in Gauteng, Mpumalanga and Limpopo, while the rest of South Africa remains poorly sampled. We suggest that there is a need for a comprehensive national sampling effort alongside increased investment in taxonomic expertise to generate critical baseline data on insect biodiversity before species are lost to extinction.
Significance:
Insects provide critical ecosystem services, but our knowledge of insect biodiversity is limited. DNA barcoding can help fill biodiversity knowledge gaps; however, within South Africa, sampling has been uneven. Well-sampled provinces include Gauteng, Mpumalanga and Limpopo, while the Eastern Cape, Free State, KwaZulu-Natal, Northern Cape, North-West and Western Cape remain under-sampled. We argue for a broad national Malaise trapping effort to generate crucial baseline data on insect biodiversity. Without urgent investment in taxonomic expertise and biomonitoring, we risk losing much of our biodiversity before it is even described.
Introduction
Insects comprise around 70% of animal diversity1, with over 1 million species described and a lower estimate of 5 million more to be discovered2. The most species-diverse orders are Coleoptera (~387 000 currently described species), Lepidoptera (~157 000), Diptera (~155 000), and Hymenoptera (~117 000).2 Insects play vital roles in ecosystems, including in pollination, pest control, decomposition of organic materials, and nutrient cycling.3 They deliver many of nature’s contributions to people, including pollination by bees of agricultural crops4,5 such as sunflowers, tomatoes, canola, cowpeas, and coffee. Crop yields are currently threatened by a shortage of wild pollinators6 as agricultural landscapes become isolated from the natural and semi-natural habitats that support pollinating insects7. Smith et al.8 linked pollination decline to half a million premature human deaths annually due to a shortage of affordable, nutritious foods such as nuts, legumes, fruits, and vegetables.
Insect predators and parasitoids can help control pests and insect vector abundance. Spiders, beetles, ants, and specific true bugs are considered to be the main groups of invertebrate predators9,10, and some pests are also suppressed by parasitoids. Natural biological control can thus help limit the population size and reduce the impact of pests in agricultural settings.11 Insect scavengers, detritivores, or filter-feeders on microbes also contribute importantly to decomposition.12 Thus many insects additionally help with nutrient cycling and transformation of living biomass into frass, cycling the carbon and nitrogen back into the soil.13 This process of breaking down the dead organic matter accounts for about 29% of forest deadwood decomposition.14
While the benefits of insect diversity are now becoming more widely appreciated, some insects can have negative impacts. Millions of lives are lost annually to human diseases carried by insect vectors15, and insect crop pests can significantly reduce agricultural yield16. African sleeping sickness (African trypanosomiasis) and malaria (Plasmodium falciparum), for example, are carried by the tsetse fly (Glossina sp.) and the female Anopheles mosquito, respectively, which infect their human hosts through blood feeding. It has been suggested that malariaendemic countries have lower economic growth because of the negative impact that the disease has on worker productivity and population growth.17 Non-native pests can be particularly damaging to crops, wild plants, and our natural environment; this is because they may escape the natural predators from their native ranges, which would normally limit their abundance.18 These non-native insect pests can have significant economic impacts.19
South Africa is recognised as being one of the most biologically diverse countries in the world. However, there is currently no comprehensive modern classification of higher insect taxa available for South Africa.20 Records for southern Africa suggest there are about 44 000 insect species, encompassing 7750 genera, 569 families, and 25 orders21, but these numbers are now more than 35 years old and have shown to be underestimates22-24 For example, new barcoding efforts with hoverflies have identified species that were not previously included on countrywide checklists.25
40 https://doi.org/10.17159/sajs.2024/16448 Volume 120| Number 5/6 May/June 2024 © 2024. The
Published under a Creative Commons Attribution Licence. Review
Author(s).
Article
DNA barcoding is a molecular method that has gained popularity over the last 20 years; it uses short, standardised genomic sequences to facilitate species identification and discovery.26 In animals, the DNA barcode is a 658 base-pair segment in the gene encoding the mitochondrial cytochrome c oxidase subunit 1 (COI); this region has proven effective for species identification in animals.27,28 Barcode sequences are uploaded and stored on the Barcode of Life Data (BOLD) System29, which allows for the analysis and sharing of DNA barcode records. Sequences are clustered using the Barcode Index Number (BIN) system.30 This system uses a well-established algorithm that assigns collections of related sequences to an OTU (operational taxonomic unit) that closely corresponds to a species-level identification.
Here, we review the contribution of DNA barcoding to documenting South Africa’s rich insect diversity. We queried the public database BOLD for insect records in South Africa and explored their current coverage. Finally, we discuss how national barcoding efforts could be further extended.
Insect decline
Insects are particularly sensitive to environmental change31, and thus provide useful bioindicators of ecosystem health32-34. However, their sensitivity to environmental disruption also increases their vulnerability. Recent work has suggested that we may already be experiencing dramatic declines of insects in some regions.35 Hallmann et al.35 reported that the abundance of terrestrial arthropods in Europe has declined by more than 75% over the past three decades, leading to headlines declaring an “insect apocalypse”.36 Given the projected rates of decline, it is possible that some species may go extinct before they can be formally classified.37 However, it is unclear whether such trends generalise more widely, and more data are required to assess large-scale insect trends and determine the causes behind these fluctuations.38 The IUCN RedList (2023) has only evaluated ~1.2% (12 441) of described insects, and of those 25.9% (3222) are “data deficient”. South Africa currently lacks baseline data to evaluate whether our insect diversity is following global trends; there is incidental evidence that some species and insect faunas may be in decline. For example, a survey of South African beekeepers suggested a loss of managed honey-bee colonies39, and the extent of natural vegetation in the Renosterveld ecosystem, a recognised biodiversity hotspot supporting a rich diversity of butterflies40, is just about 5% of what it once was. There are, therefore, increasingly urgent calls to better describe and monitor insect diversity globally and regionally.38
the taxonomic impediment, DNA barcoding and dark taxa
The taxonomic impediment refers to the limitations and deficiencies in the resources allocated to the field of taxonomy.41 This impediment has hindered efforts to generate baseline insect data for conservation and biodiversity monitoring.42,43 Currently, there are only a few specialist insect taxonomists relative to the vast amount of biodiversity within South Africa (just 23 insect taxonomists were recognised in 201324).
An analysis by Hamer24 showed that, over a 31-year period, the average (animal) taxonomist in South Africa described less than one new species per year; it would, therefore, take 355 years to describe the remaining undescribed insect species (estimated to number around 80 000).24 The magnitude of the task relative to the capacity of available expertise is such that it is improbable that we will be able to address the challenge using traditional taxonomic methods alone. To describe and identify this wealth of diversity, we will need to develop faster, more high-throughput methods for collecting and studying species diversity; one approach that has proved highly efficient is DNA barcoding.44
Importantly, DNA barcoding is not a substitute for good taxonomy but a tool that allows researchers to match samples to previously described barcoded specimens. DNA barcoding has proven its effectiveness in cataloguing Earth’s diversity45 and can supplement traditional taxonomic approaches where morphological characters are less reliable for delineating species barriers46. Globally, barcoding has helped reveal phenotypic plasticity, and identify cryptic, sexually dimorphic, and multiple life-stage species. Importantly, barcoding is still effective when
vouchers are damaged or lack identifying morphological features.47-52 For example, Sethusa et al.52 demonstrated how DNA barcoding could reliably and rapidly identify economically important scale insects without requiring specialist taxonomic expertise. Kamdem et al.25 similarly showed how DNA barcoding could accurately discriminate between species of Afrotropical hoverflies, although results varied by species delimitation model.
In 2017, Bezeng et al.53 described the accelerating DNA barcoding effort in South Africa. These authors noted that further progress would require addressing several key challenges, including educating the next generation of taxonomists and expanding present efforts to poorly understood taxonomic groupings such as beetles, flies, disease-causing organisms, and pest species.
Here, we describe how DNA barcoding provides a valuable tool for generating baseline data on insect diversity to inform nationwide biomonitoring efforts for assessing future global change.22,54 Currently, however, DNA barcodes are being generated faster than species are being described, giving rise to a growing list of ‘dark taxa’ — species with barcode sequence data but lacking formal taxonomic classification.55 Barcoding allows us to cluster samples by sequence similarity, essentially discriminating between OTUs without detailed taxonomic knowledge. However, this lack of taxonomic information limits the insight that might be gained into their ecological functions, and there is not always a one-to-one match between barcode BINs species recognised by trained taxonomists.30,56,57 Further developing South Africa’s reference libraries would allow unknown sequences to cluster with identified specimens and thus reduce the number of ‘dark taxa’, although the lack of expert taxonomists to identify reference taxa presents a major challenge.2
Progress on insect barcoding in South Africa
Here, we review current progress in barcoding insects of South Africa. In June 2023, we queried the BOLD public database for insect records (“Insecta”) within “South Africa” and downloaded the specimen data. We identified 416 211 published records encompassing 3785 genera and 491 families. These records were assigned to 28 239 unique BINs. This is a massive sevenfold increase in numbers reported by Myburgh et al.32 (56 392 records), who published on South Africa’s contribution of insect records in BOLD. However, within the same year, the study by Myburgh et al. became outdated, with D’Souza et al.22 adding 339 193 insect records to BOLD from a deployment of 25 Malaise traps across the Kruger National Park – the Kruger Malaise Programme. South Africa is now ranked 4th in the number of insect records on BOLD, which at the time of query had 7 497 794 publicly available insect records.
The number of unique BINs in BOLD for South Africa is equivalent to 65% (28 239) of the insect fauna estimated (43 565) by Scholtz and Chown58. However, we identified five taxonomic orders where the number of BINs from South Africa exceeds the known species count for southern Africa (Hymenoptera = 9259 vs. 5273, Diptera = 7611 vs. 6243, Thysanoptera = 263 vs. 228, Plecoptera = 32 vs. 22, and Strepsiptera = 7 vs. 6; Figure 1). Our analysis thus suggests that the diversity in these species-rich groups may be greatly underestimated. The underestimation of Hymenoptera diversity is notable. South Africa is a centre of bee diversity59, and bees are among the best-studied insect groups. Currently, BOLD records capture six of the seven families that should be present in South Africa.60 Thus, we still lack representative DNA barcode coverage, even for some of the most well-known groups.
In contrast to results for Hymenoptera, the number of BINs for Coleoptera and Psocoptera is much lower than their estimated number of species. Coleoptera is generally considered the most species-rich order globally and accounts for roughly 25% (about 400 000 species) of all described animal species61, but we documented only 2983 unique BINs for the group. The current BIN count for Hymenoptera (9259, representing an estimated 5273 species), which includes several poorly known parasitic wasps which are very diverse, is over triple that of Coleoptera. Forbes et al.62 proposed that Hymenoptera was possibly 2.5–3.2 times (estimated 1 152 127 species) more diverse than Coleoptera. Although
Volume 120| Number 5/6 May/June 2024 41 https://doi.org/10.17159/sajs.2024/16448
DNA barcoding unveils South African insect diversity Page 2 of 9
Review Article
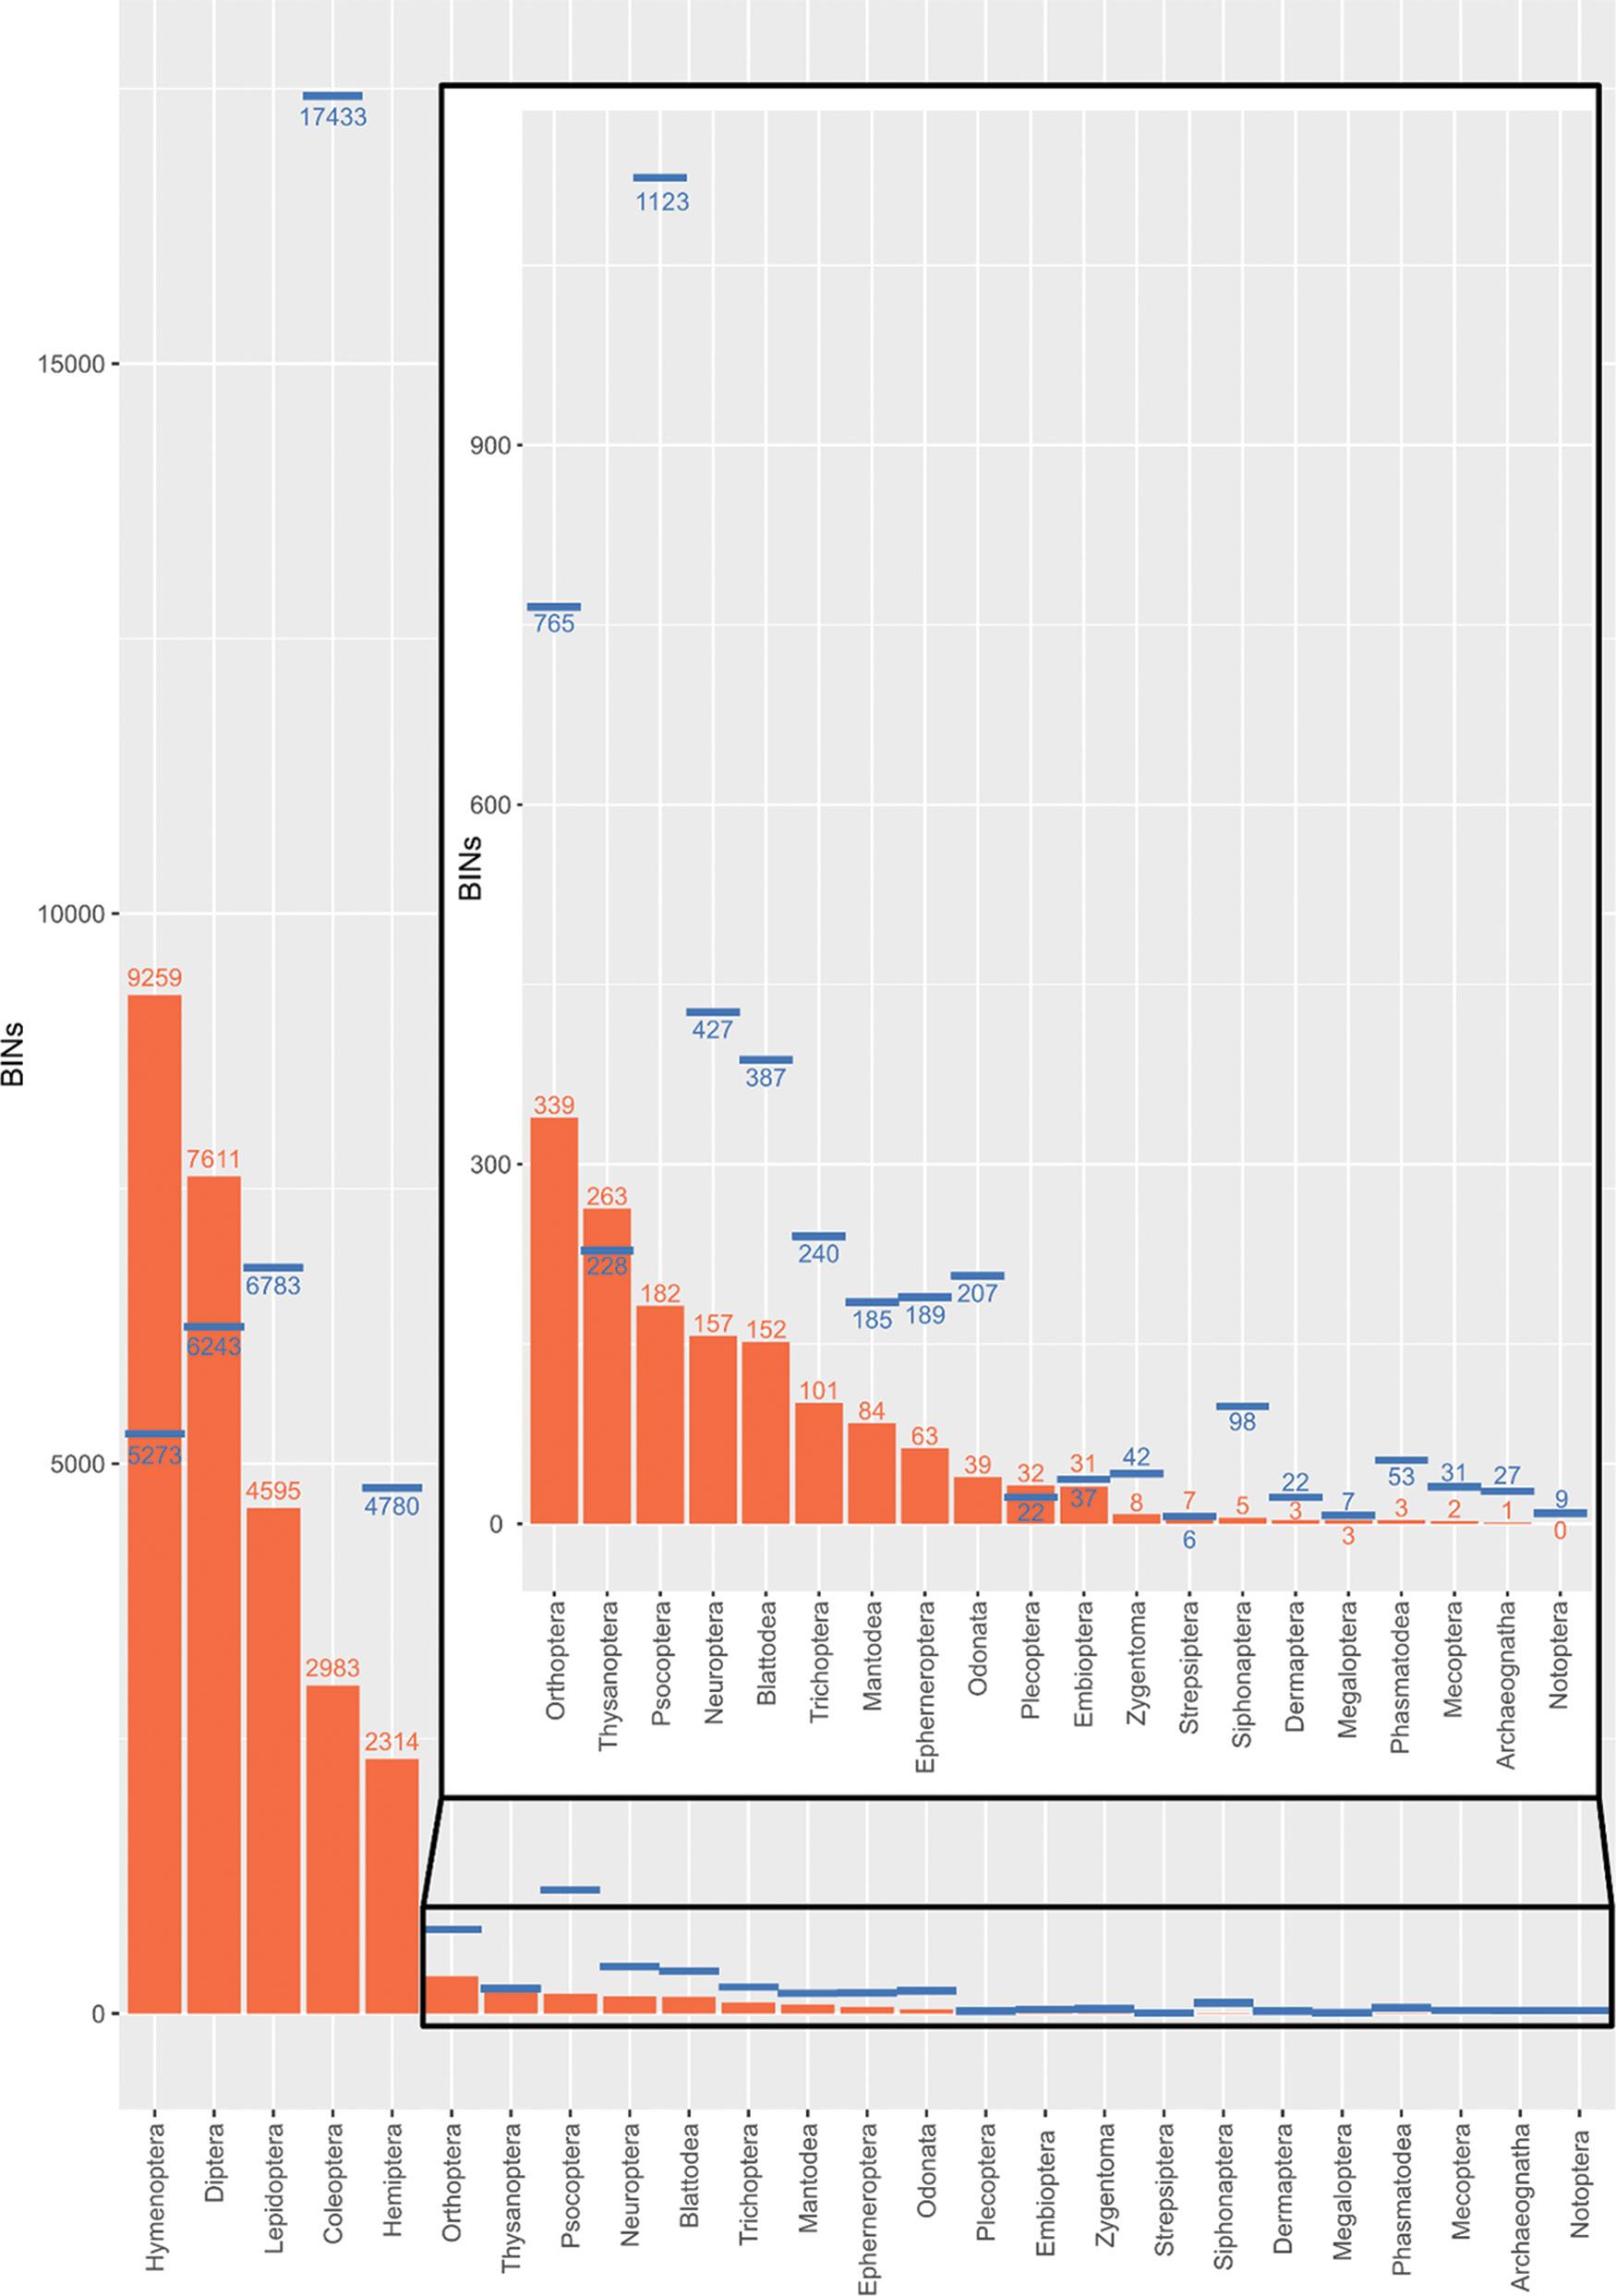
Figure 1: Number of Barcode Index Numbers (BINs) from South Africa on the Barcode of Life Data (BOLD) system (orange) across taxonomic orders and the estimated number of southern Africa species in each order from Scholtz and Chown58 (blue). The graph is sorted from most to least number of BINs. The data were collected on 22 June 2023 from BOLD systems (http://www.boldsystems.org/).
the BOLD records for South Africa provide only a biased snapshot of the true diversity in both groups, they provide some support for Forbes et al.62 Thus, we still cannot answer fundamental questions on insect biodiversity, such as which taxonomic group is more diverse in South Africa, highlighting the significant gaps in our biodiversity knowledge.
Diptera contributes 49% (121 513 records) of the records that have been identified to family level (248 845), and, based on the number of BINs, it is the second most diverse insect group. Scholtz20 noted that within Diptera there are approximately 150 families found in southern Africa; of these we could find only 77. Therefore, despite its good representation
Volume 120| Number 5/6 May/June 2024 42 https://doi.org/10.17159/sajs.2024/16448
DNA barcoding unveils South African insect diversity Page 3 of 9
Review Article
on BOLD, Diptera remains considerably undersampled, although the true number of families in South Africa is unclear. Of all the orders, Plecoptera has the most records identified to genus and species level –88% (113 records out of 129 total Plecoptera records) – due to a recent phylogenetic analysis of the African stoneflies.63 This group is not one of the most taxonomically diverse (around 3500 species globally64), and its well-resolved representation in BOLD indicates the value of targeted sampling to fill taxonomic data gaps, but such approaches require skilled taxonomic experts.
To date, most of the South African records on BOLD (343 166) have been collected in the northeast (Ehlanzeni, Mopani, and Vhembe) –where the Kruger National Park is located (Figure 2). South Africa’s most significant contribution in a single submission to BOLD was the 339 193 specimens and about 260 000 sequences generated from a single project, the Kruger Malaise Programme.22 The majority of sequences represented Diptera (130 628), Hymenoptera (57 212), Hemiptera (28 060), Lepidoptera (22 534), and Coleoptera (14 750). Remarkably, the number of contributed BINs for Hymenoptera (6867) exceeded the known species count for southern Africa (5273).58 The second and third most notable contributions were the ca. 29 400 and 15 884 specimens collected using Malaise traps in the West Rand district and the City of Johannesburg, respectively (H. Staude in 2012 and R. Stewart in 2017).
It is notable that winter rainfall areas, such as the Cape Floristic region and Succulent Karoo hot spots (Western Cape and Northern Cape), have a rich bee diversity59, but Hymenoptera within these two provinces remain poorly sampled (926 and 556 specimens, respectively)
compared to regions that have been sampled with Malaise traps (Figure 3; Table 1). It is likely that many Hymenoptera within these areas have not been described or barcoded.59,65 Other areas that remain undersampled include the Free State and North-West Province, which have a total of only 137 and 156 specimens sampled, respectively (Figure 3; Table 1). Recent collecting efforts using Malaise traps have thus provided much of the gains in barcode data for insects over the last few years. Malaise traps offer a passive sampling technique that requires little work from the collection team, but they are efficient at gathering a variety of insects, including both flying and ground-dwelling species. Combined with DNA barcoding, this technique can provide a comprehensive overview of the insect community in an area.66 Such data allow us to study population changes over time, compare diversity gradients among regions, and assess the impact of human activities on insect populations.
Malaise trapping contributed to at least 92% (384 523 records) of South African records on BOLD, with collection methods for the remaining 8% not specified on BOLD. However, out of the total 416 266 published records on BOLD, only 7.7% (31 855) have species names; the remainder represent ‘dark taxa’, at least at finer taxonomic levels. Our analysis shows that 59.8% (248 845) of records have been identified to family level, 21.8% (90 645) have been identified to order, and 10.8% (44 866) have been identified to genus (Figure 4). This lack of detailed taxonomic information limits the inference we can draw from such data; for example, species level classifications are required to document and understand drivers of taxonomic turnover and species loss.67 Advances in DNA barcoding must, therefore, be accompanied by increased investment in alpha
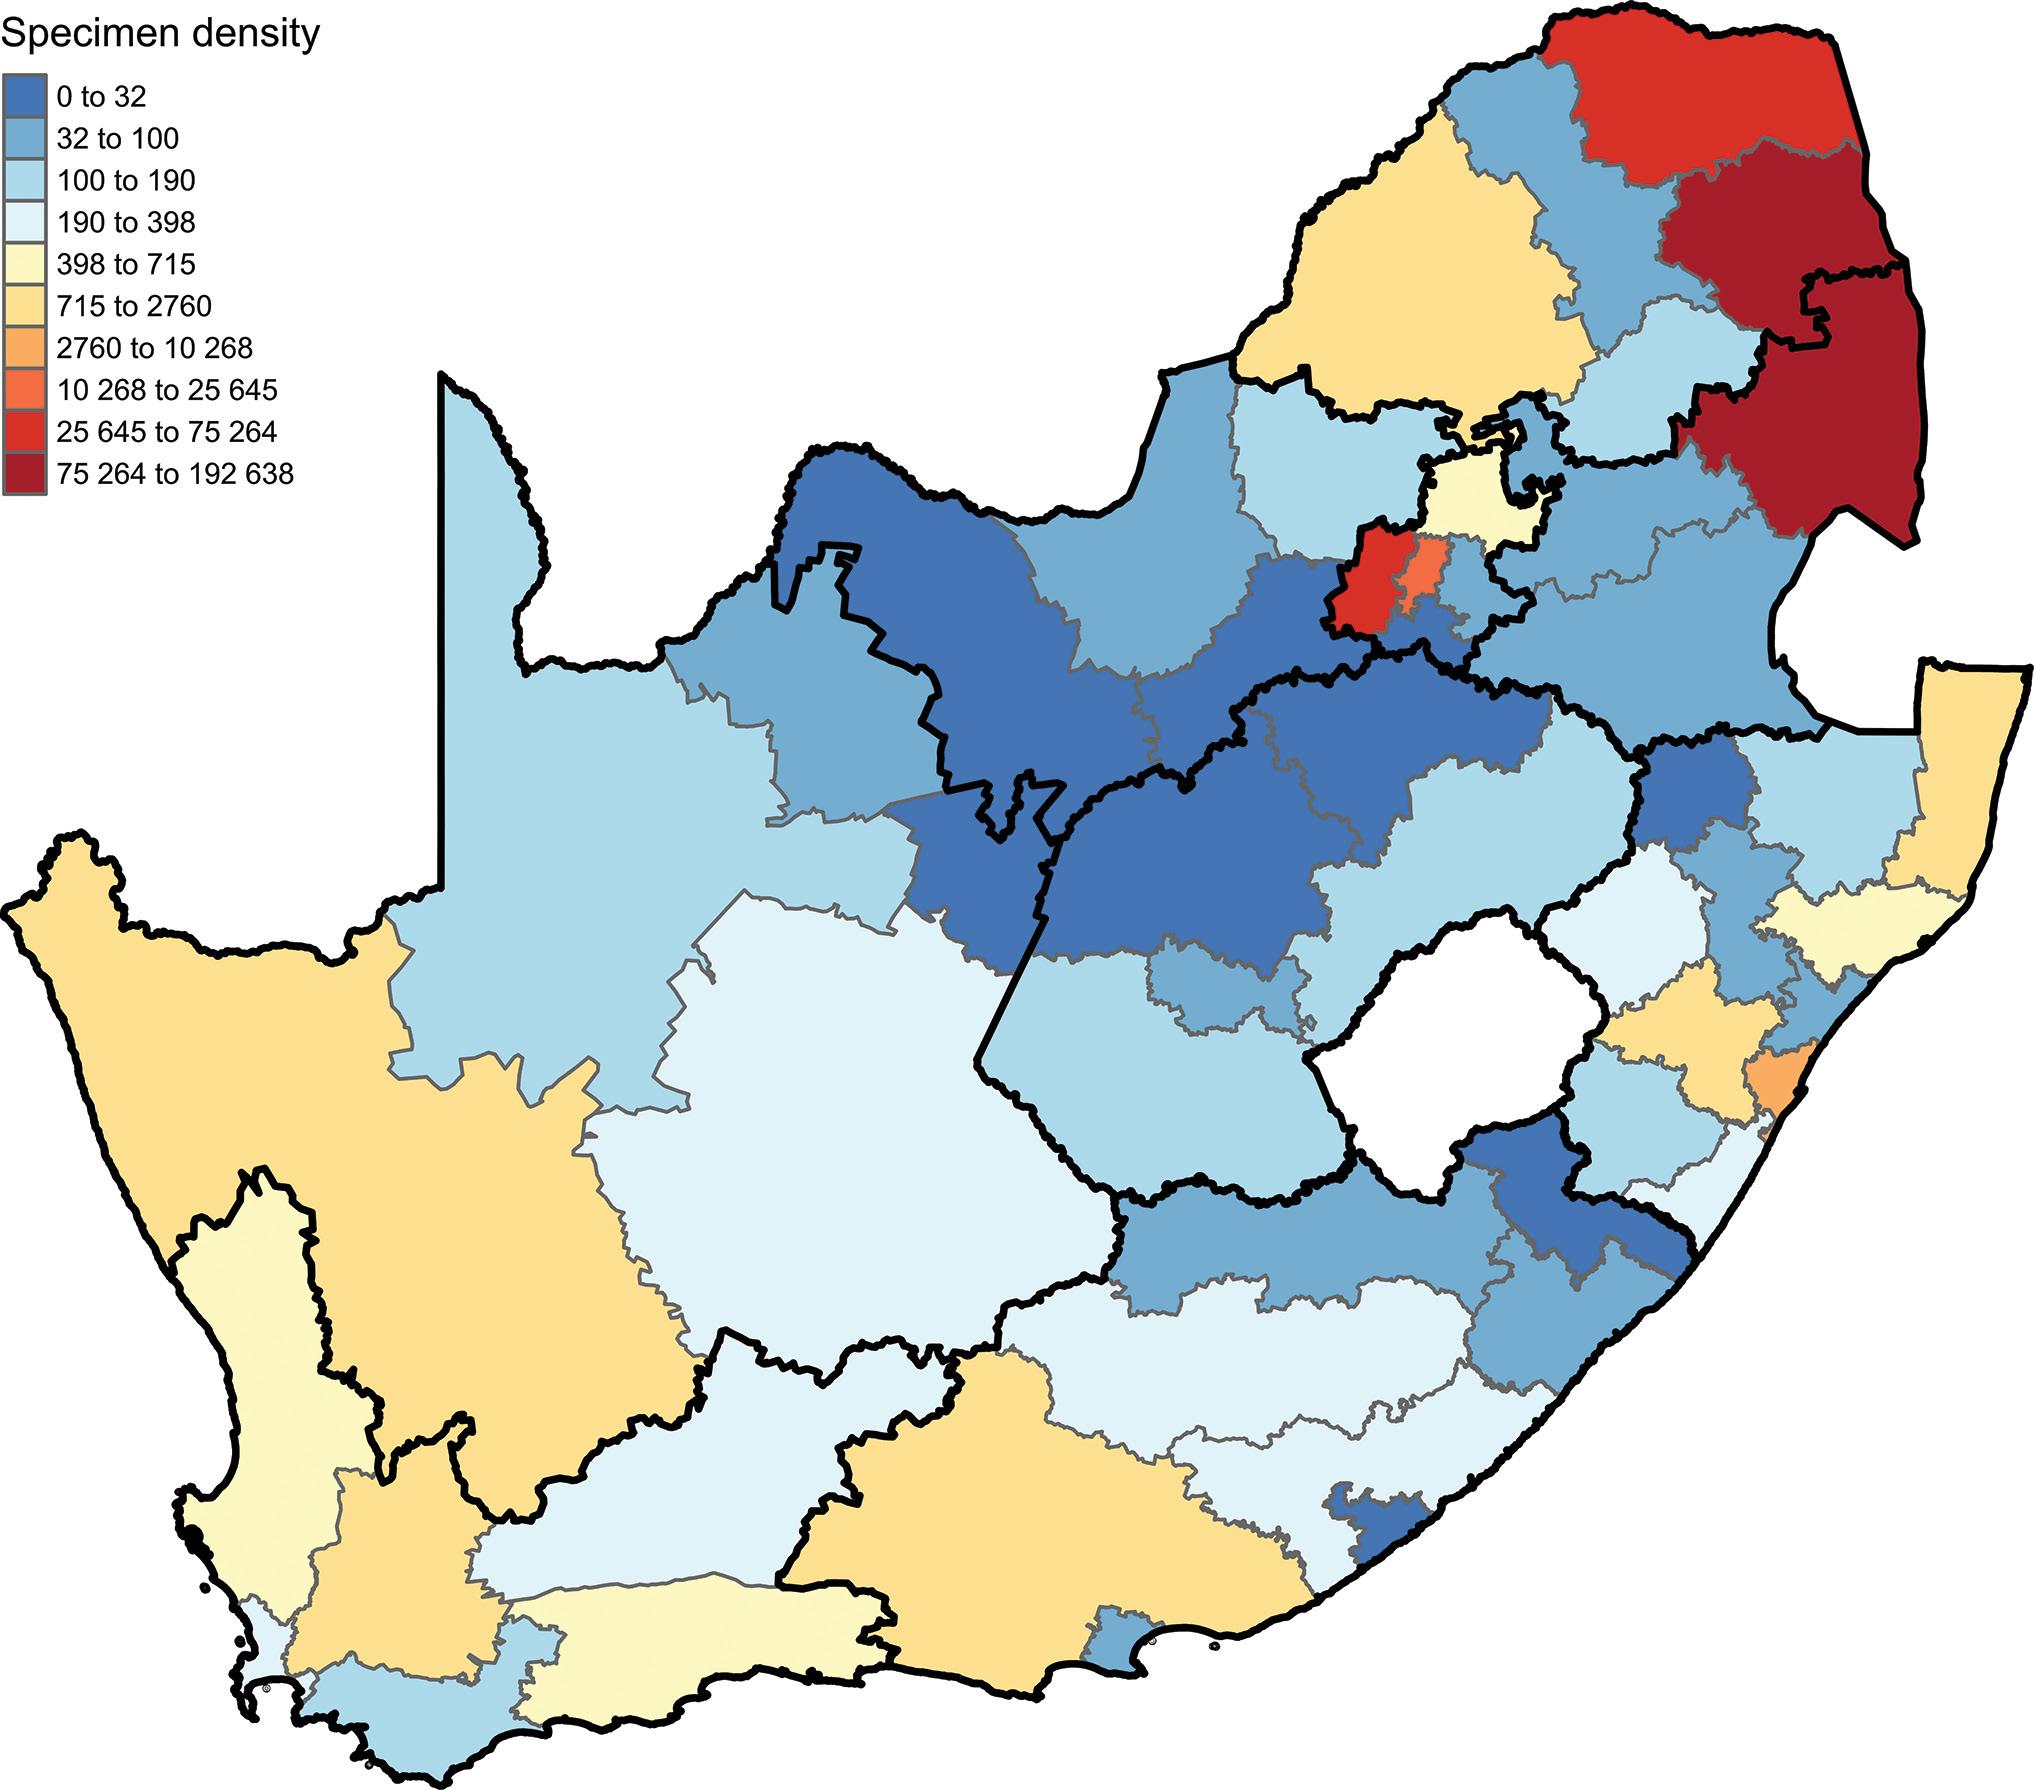
found within their boundaries. The data were collected on 22 June 2023 from BOLD systems (http://www.boldsystems.org/).
Volume 120| Number 5/6 May/June 2024 43 https://doi.org/10.17159/sajs.2024/16448 Review Article DNA barcoding unveils South African insect diversity Page 4 of 9
Figure 2: South African district municipalities and the number of South African insect records from the Barcode of Life Data (BOLD) system. The colour of the district municipalities is scaled by the number of BOLD records
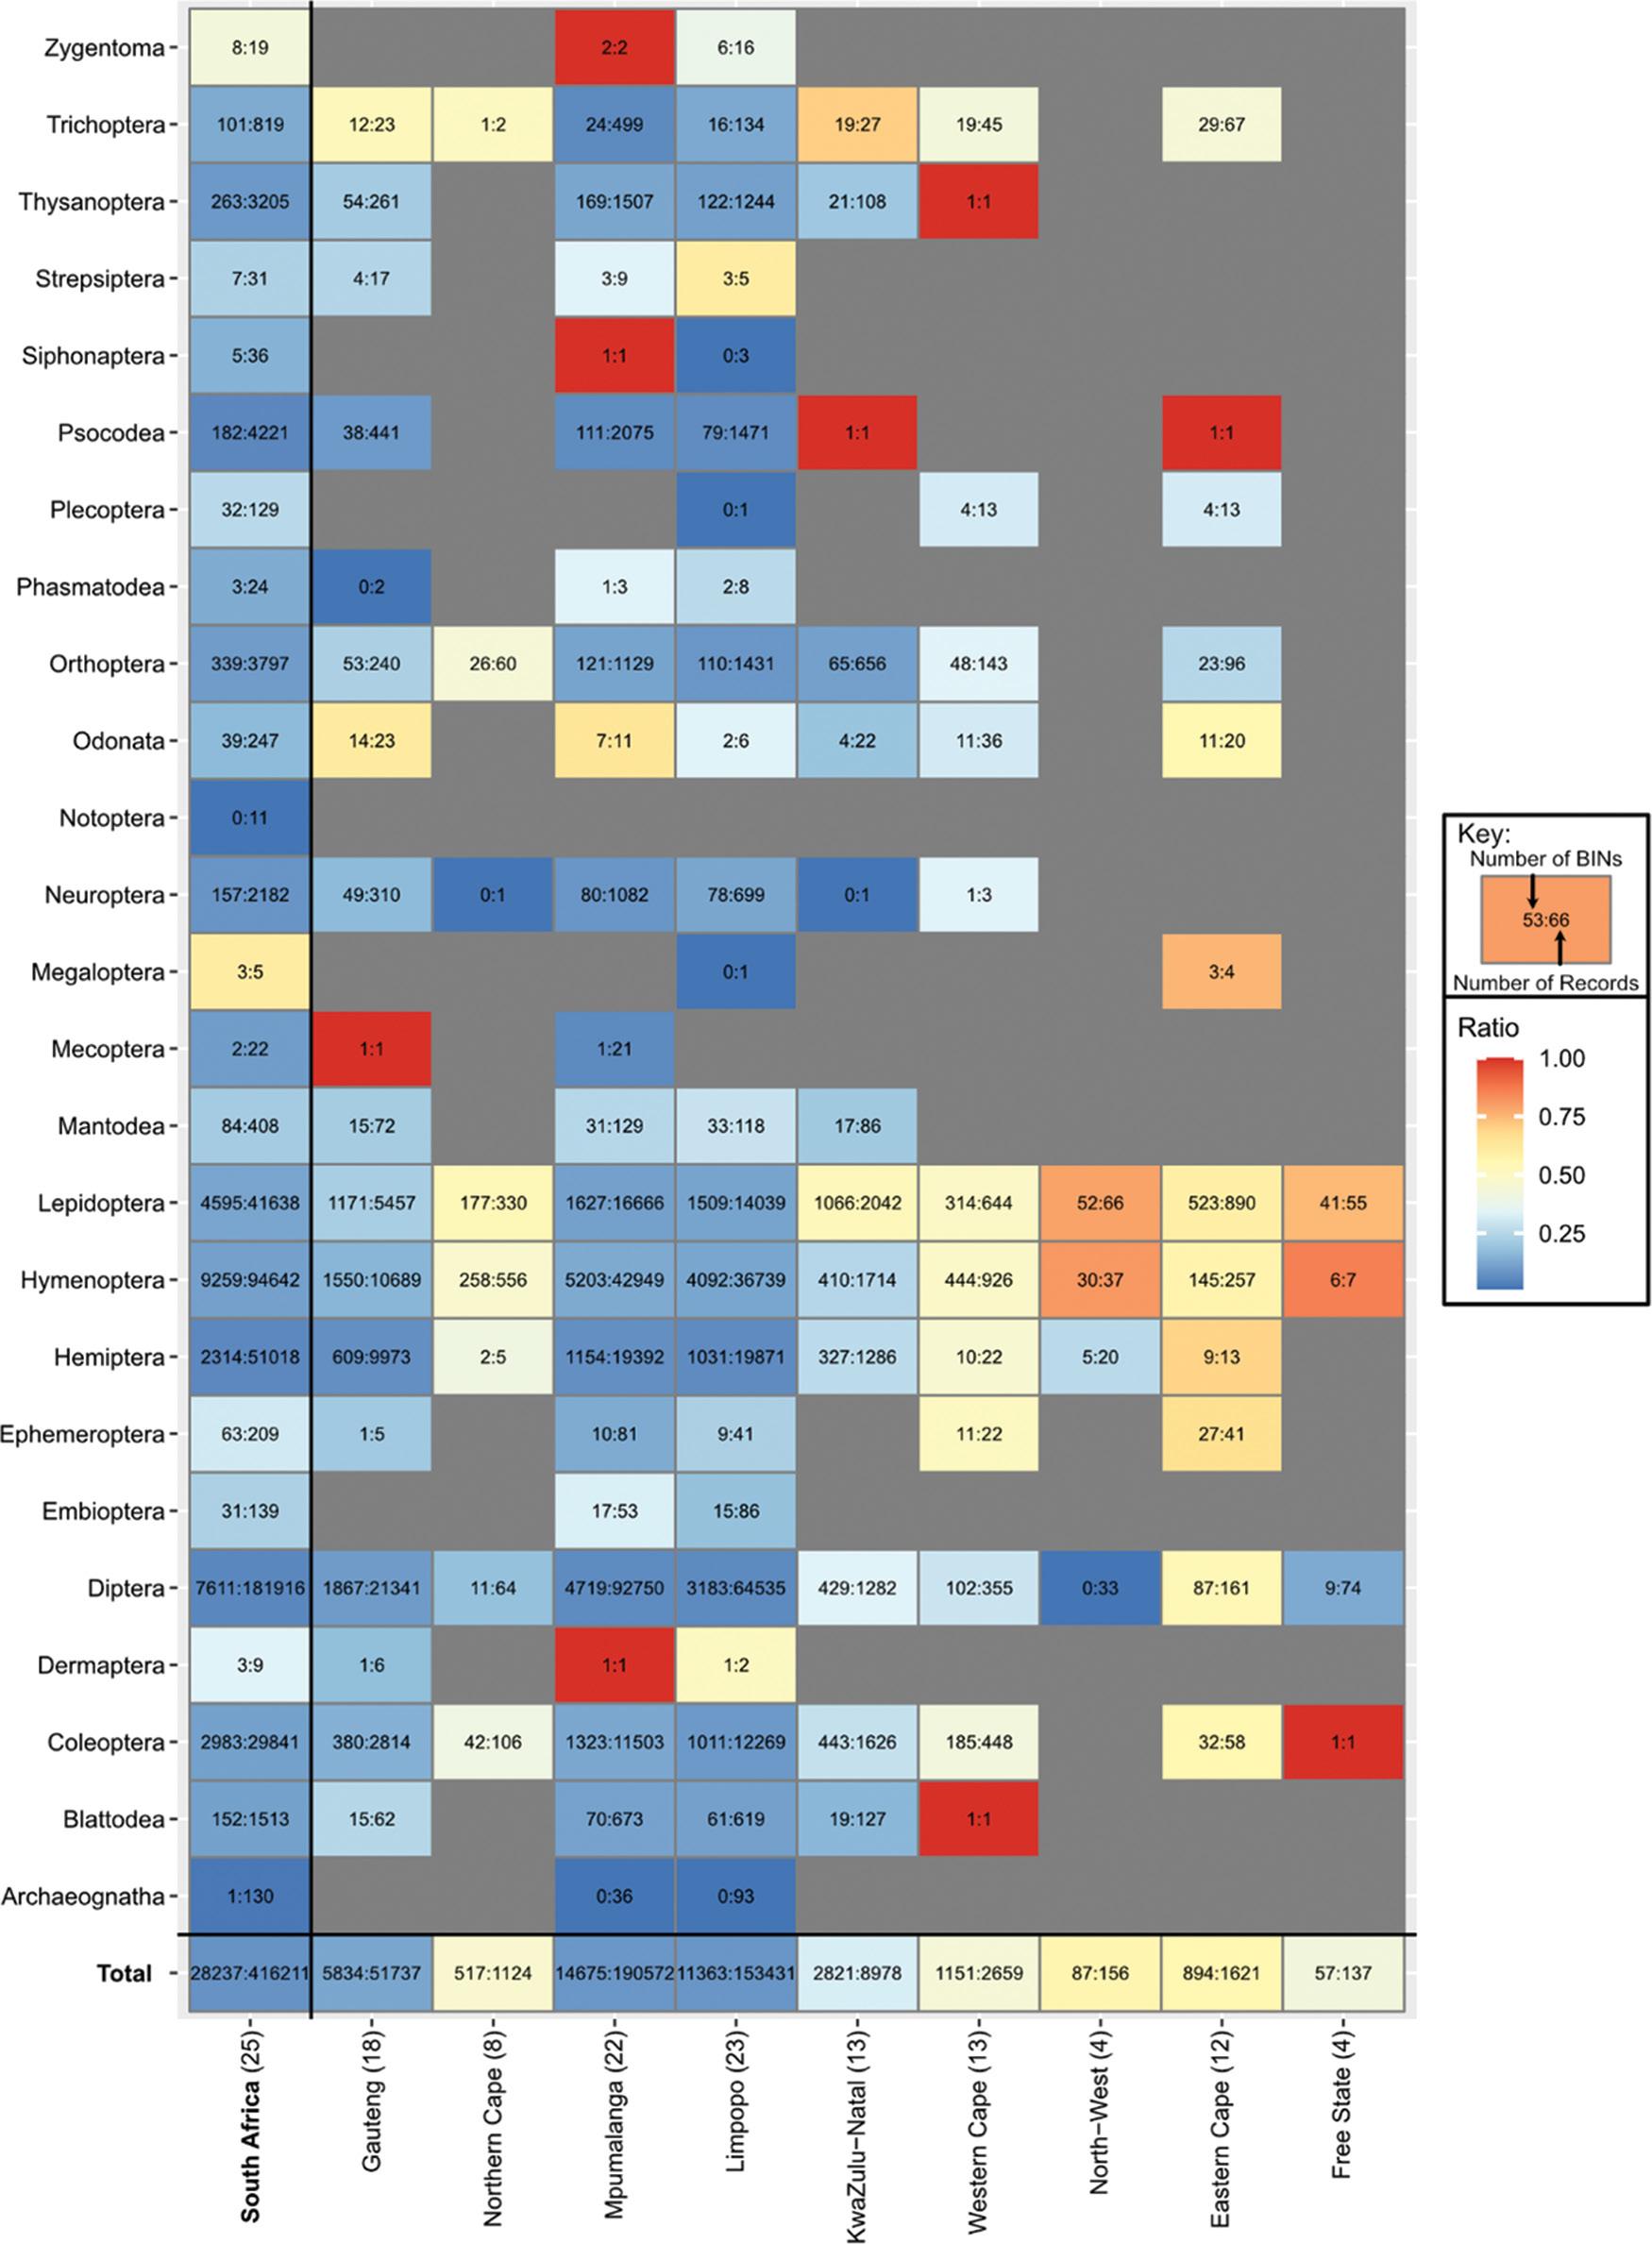
Figure 3: The ratios between the number of Barcode Index Numbers (BINs) and the number of records for a given order and for each South African province. The values within each tile refer to the number of BINs and then the number of records, separated by a colon. The colour of each tile is scaled by the number of BINs divided by the number of records. The data were collected on 22 June 2023 from the Barcode of Life Data (BOLD) systems (http://www.boldsystems.org/).
taxonomy and biodiversity science if we are to make sense of the rapidly accumulating barcode data. A first step is to construct robust and comprehensive DNA barcode reference libraries.
Several countries, including Ireland, Germany and Canada, have already invested in large-scale DNA barcode reference libraries for insects.68-70 Such investment has facilitated important research and high-profile
Review Article
studiesthathaveinformedourunderstanding ofglobalinsectbiodiversity. For example, a survey using DNA barcoding on wild urban bees in France used a robust reference library of 2931 specimens covering 157 bee species and identified 36 bee species in urban environments.44 In a separate study71, a reference library of mosquitoes in Thailand was used to understand the diversity and distribution of these important disease vectors. Similar efforts are needed for South Africa.
Volume 120| Number 5/6 May/June 2024 44 https://doi.org/10.17159/sajs.2024/16448
DNA barcoding unveils South African insect diversity Page
9
5 of
table 1: Comparison of the number of insect specimens for each order and the South African provinces in which they occur
South AfricaGautengNorthern CapeMpumalangaLimpopoKwaZulu-NatalWestern CapeNorth-WestEastern CapeFree State orders (n=25) 25178212313134124
Archaeognatha 13000369300000
Blattodea 15136206736191271000
Coleoptera 29 841281410611 50312 26916264480581
Dermaptera 9601200000
Diptera 181 91621 3416492 75064 53512823553316174
Embioptera 13900538600000
Ephemeroptera 2095081410220410
hemiptera 51 0189973519 39219 87112862220130
hymenoptera 94 64210 68955642 94936 7391714926372577
Lepidoptera 41 638545733016 66614 03920426446689055
Mantodea 408720129118860000
Mecoptera 22000000000
Megaloptera 5000100040
Neuroptera 21823101108269913000
Notoptera 11000000000 odonata 24723011622360200
orthoptera 379724060112914316561430960
Phasmatodea 24203800000
Plecoptera 12900010130130
Psocodea 422144102075147110010
Siphonaptera 36001300000
Strepsiptera 311709500000
thysanoptera 32052610150712441081000
trichoptera 81923249913427450670
Zygentoma 190021600000
total 416 21151 7361124190 551153 431897826591561621137
Biomonitoring in South Africa using DNA barcoding
Biomonitoring involves using organisms sensitive to pollutants, toxins, or other substances to assess environmental conditions. As anthropogenic impacts on the environment are accelerating, there is an urgent need to index these changes and how biodiversity responds to them. DNA barcoding is a powerful tool for biomonitoring as it can rapidly identify and classify organisms (including from partial or degraded samples) without the need for a taxonomic expert. When used in conjunction with mass-sample processing, such as Malaise trapping, barcoding techniques can additionally characterise the full community of organisms in a sample.72 For example, by using barcoding to document the diversity of organisms in an area, it is possible to track changes in the environment and identify potential drivers of biodiversity change, such as pollution, climate change and other environmental stressors. D’Souza22 showed insect diversity and abundance in South Africa correlated with rainfall – likely a critical environmental axis that will be impacted by climate change
with consequences for the country’s water resources, food security, ecosystem services and, ultimately, biodiversity.73 74
DNA barcoding has already been used to assess environmentally sensitive insect orders (Ephemeroptera, Plecoptera, and Trichoptera) in aquatic environments.75 In South Africa, BOLD records for these groups are relatively limited (1157 records with 196 unique BINs, falling within 19 different families), and only 206 of these records are identified to species level. Most of these specimens are from Mpumalanga, with 667 (58%) contributed from the study by D’Souza et al.22 Generating a matching barcode reference library for South Africa that also includes regionally specific taxa would be a valuable tool for rapid environmental assessments and evaluation of aquatic ecosystem restoration efforts.74 A next step would be to develop equivalent reference libraries for other habitats of concern.
Conclusion
This review has shown how DNA barcoding has significantly increased the overall data on insect diversity within South Africa, emphasising
Volume 120| Number 5/6 May/June 2024 45 https://doi.org/10.17159/sajs.2024/16448 Review
DNA barcoding unveils South African insect diversity Page 6 of 9
Article
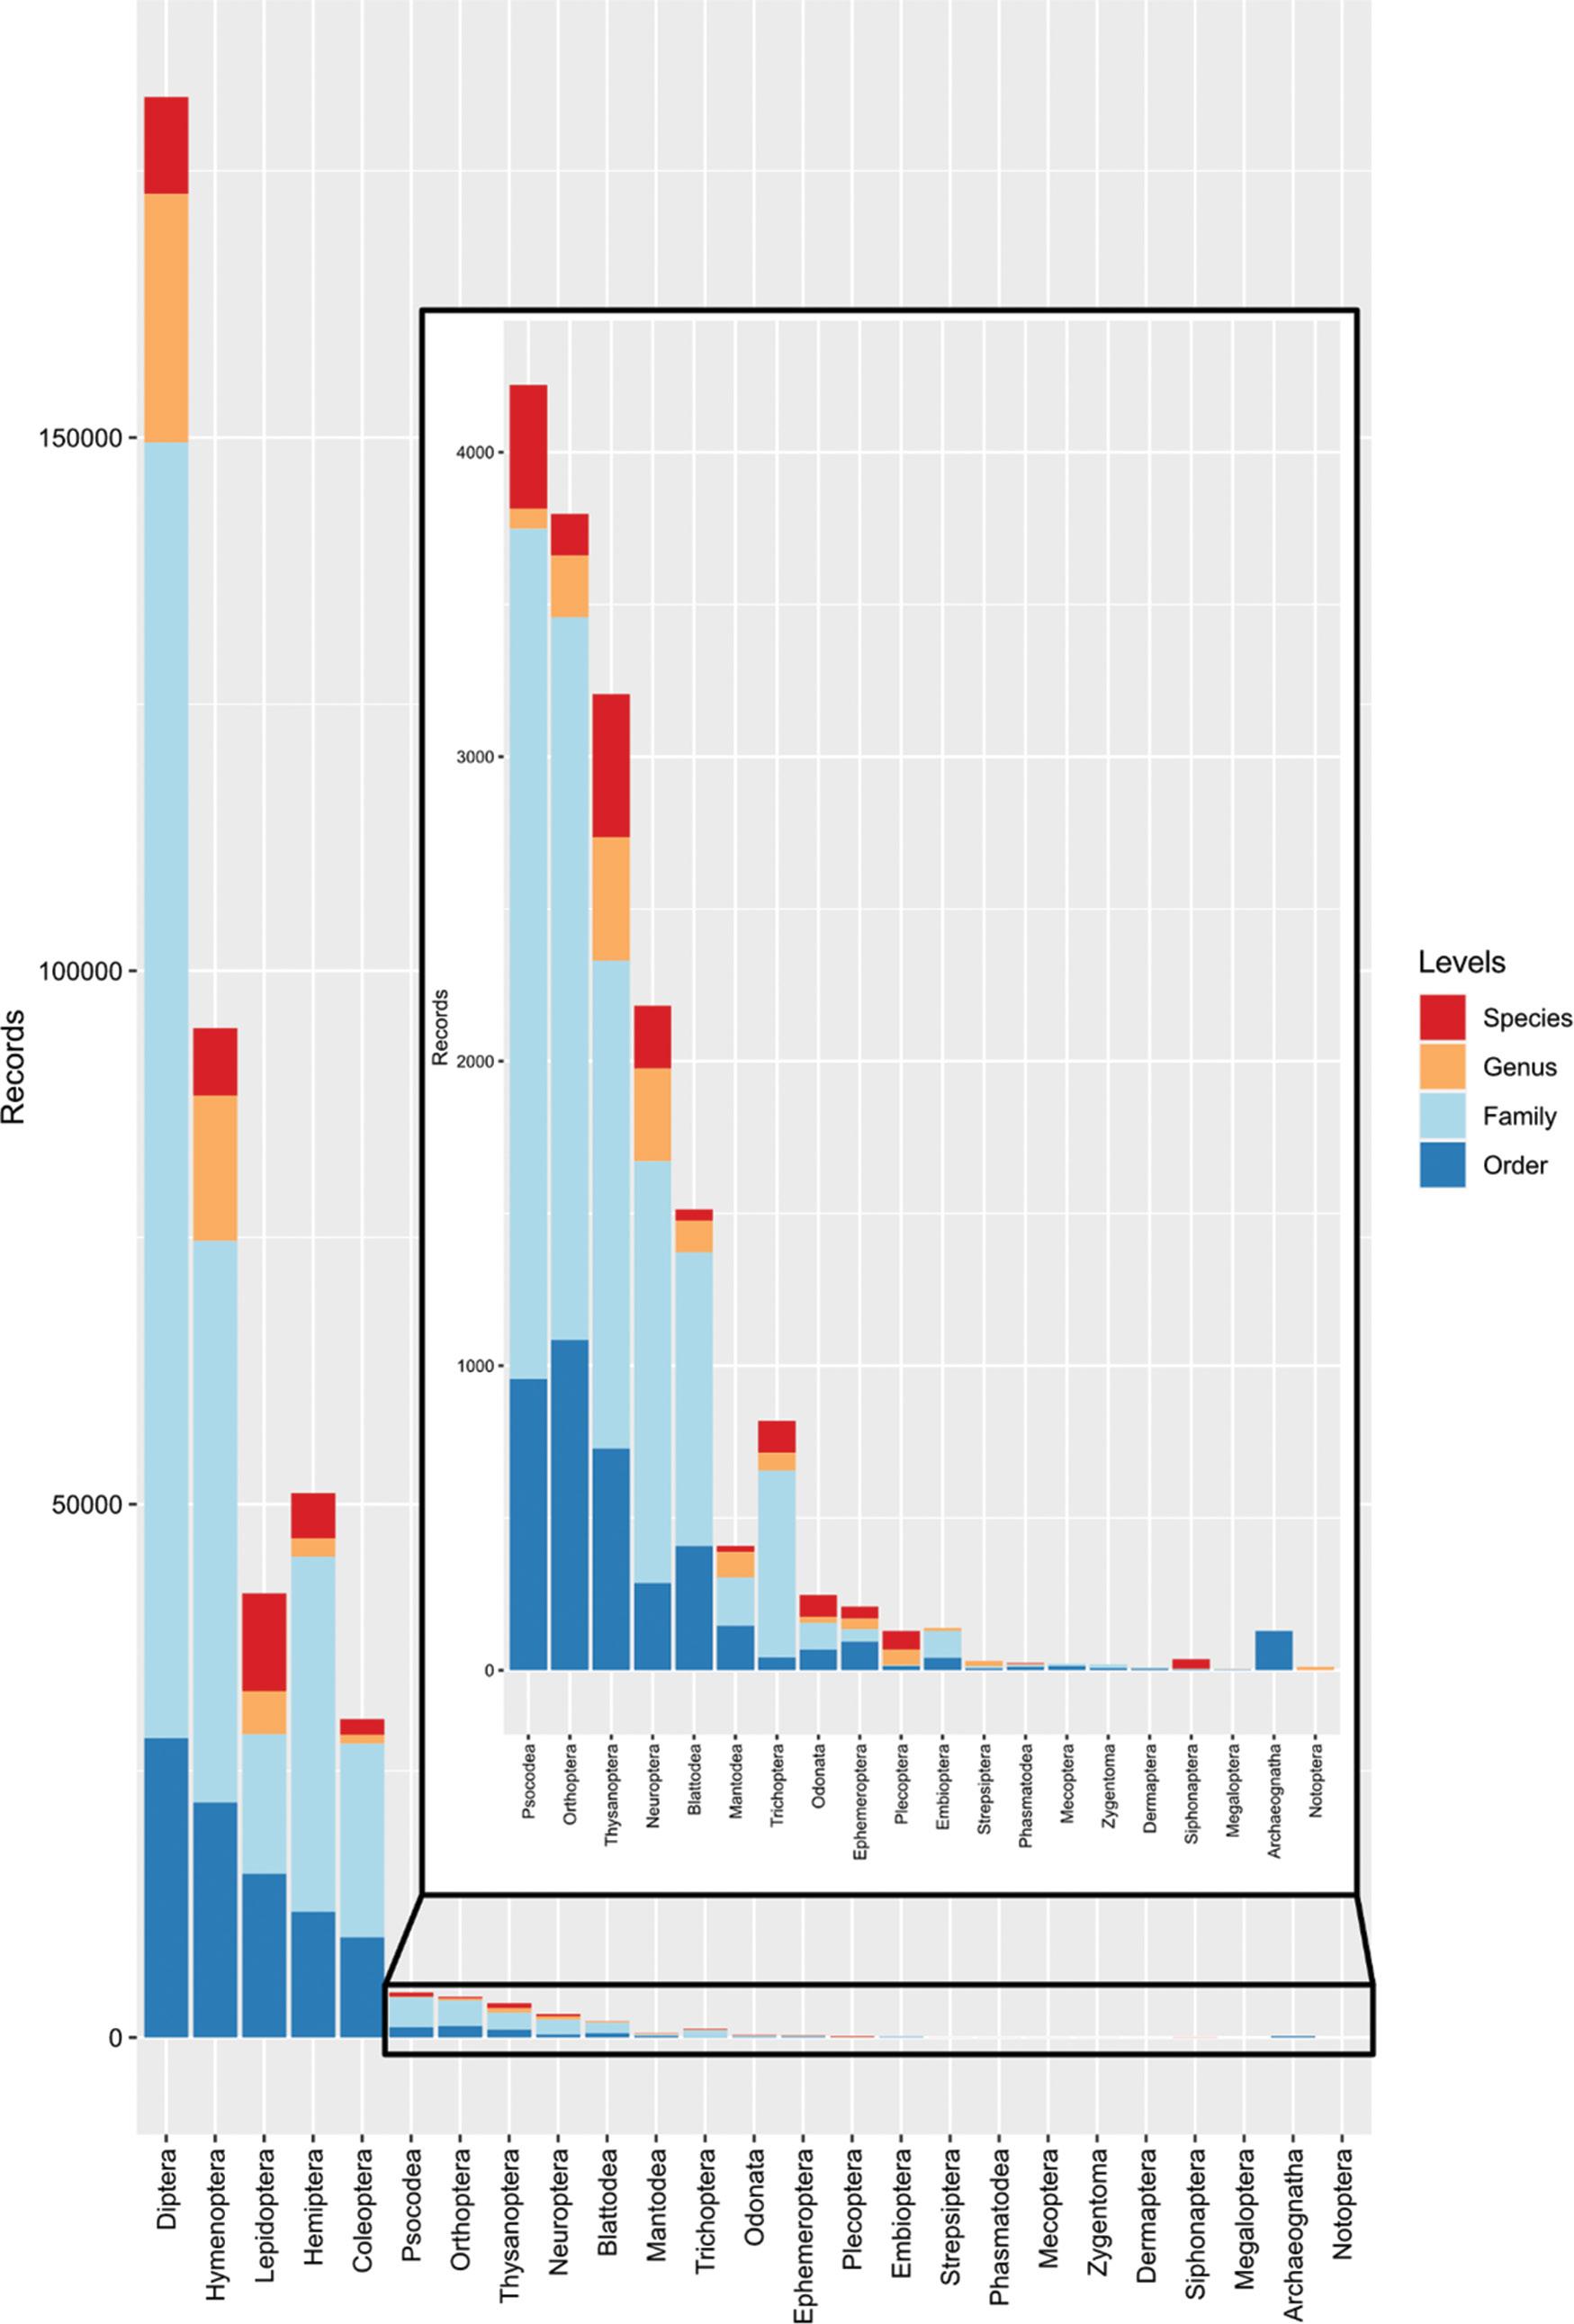
Figure 4: The number of records for each taxonomic level for all 25 South African orders found on the Barcode of Life Data (BOLD) system. The colours within the segmented bars represent the taxonomic level at which the records have been identified. The data were collected on 22 June 2023 from BOLD systems (http://www.boldsystems.org/).
underestimates of current taxonomic diversity, and has highlighted barcoding knowledge gaps within provinces and taxonomic orders. The provinces of Gauteng, Mpumalanga and Limpopo have been the best sampled, but some gaps still remain within them, and, in comparison, the rest of South Africa will require a much greater sampling effort. We therefore suggest that there is a need for a comprehensive national
Malaise trapping effort to generate critical baseline data on insect biodiversity. A better knowledge of both the taxonomic and geographic distribution of insect diversity within South Africa would allow for more targeted conservation action to maintain the important ecological functions they provide. Combining DNA barcoding and Malaise trapping would also allow for improved monitoring of agricultural pests
Volume 120| Number 5/6 May/June 2024 46 https://doi.org/10.17159/sajs.2024/16448
DNA barcoding unveils South African insect diversity Page 7 of 9
Review Article
and pollinators, thus supporting food security. However, this effort must be accompanied by an investment in taxonomic expertise and biodiversity science.
Competing interests
We have no competing interests to declare.
Authors’ contributions
R.D.S.: Data analysis, writing – the initial draft, writing – revisions.
M.v.d.B.: Conceptualisation, writing – the initial draft, writing – revisions.
T.J.D.: Conceptualisation, writing – the initial draft, writing – revisions.
references
1. Titley MA, Snaddon JL, Turner EC. Scientific research on animal biodiversity is systematically biased towards vertebrates and temperate regions. PLoS One. 2017;12(2), e0189577. https://doi.org/10.1371/journal.pone.0189577
2. Stork NE. How many species of insects and other terrestrial arthropods are there on earth? Annu Rev Entomol. 2018;63(1):31–45. https://doi.org/10.11 46/annurev-ento-020117-043348
3. Jolls CL, Inkster JN, Scholtens BG, Vitt P, Havens K. An endemic plant and the plant-insect visitor network of a dune ecosystem. Glob Ecol Conserv. 2019;18, e00603. https://doi.org/10.1016/j.gecco.2019.e00603
4. Gous A, Willows-Munro S, Dirk ZH. Pollination: Impact, role-players, interactions and study – A South African perspective. S Afr J Sci. 2017;119(9/10), Art. #2016-0303. https://doi.org/10.17159/sajs.2017/20 160303
5. Cane JH, Klein A-M, Vaissie BE, Steffan-Dewenter I, Cunningham SA, Kremen C, et al. Importance of pollinators in changing landscapes for world crops. Proc R Soc B. 2007;274:303–313. https://doi.org/10.1098/rspb.2006.3721
6. Reilly JR, Artz DR, Biddinger D, Bobiwash K, Boyle NK, Brittain C, et al. Crop production in the USA is frequently limited by a lack of pollinators. Proc Biol Sci. 2020;287(1931):2–9. https://doi.org/10.1098/rspb.2020.0922
7. Garibaldi LA, Aizen MA, Klein AM, Cunningham SA, Harder LD. Global growth and stability of agricultural yield decrease with pollinator dependence. Proc Natl Acad Sci USA. 2011;108(14):5909–5914. https://doi.org/10.1073/pna s.1012431108
8. Smith MR, Mueller ND, Springmann M, Sulser TB, Garibaldi LA, Gerber J, et al. Pollinator deficits, food consumption, and consequences for human health: A modeling study. Environ Health Perspect. 2022;130(12):1–12. http s://doi.org/10.1289/EHP10947
9. Brust GE, Wakil W, Qayyum MA. Chpater 8: Minor pests. In: Sustainable management of arthropod pests of tomato. Amsterdam: Elsevier; 2017. p. 183–214. https://doi.org/10.1016/B978-0-12-802441-6.00008-5
10. Bonning BC. Biotechnology and insects. In: Encyclopedia of insects. 2nd ed. Amsterdam: Elsevier; 2009. p. 105–108. https://doi.org/10.1016/B978-0-1 2-374144-8.00035-7
11. Wegensteiner R, Wermelinger B, Herrmann M. Chapter 7 – Natural enemies of bark beetles: Predators, parasitoids, pathogens, and nematodes. In: Vega FE, Hofstetter RWBTBB, editors. San Diego, CA: Academic Press; 2015. p. 247–304. https://doi.org/10.1016/B978-0-12-417156-5.00007-1
12. Kamdem MM, Otomo PV. Developmental performance of Eristalis tenax larvae (Diptera: Syrphidae): Influence of growth media and yeast addition during captive rearing. J Exp Zool Part A Ecol Integr Physiol. 2023;339(5):503–513. https://doi.org/10.1002/jez.2696
13. Yang LH, Gratton C. Insects as drivers of ecosystem processes. Curr Opin Insect Sci. 2014;2:26–32. https://doi.org/10.1016/j.cois.2014.06.004
14. Seibold S, Rammer W, Hothorn T, Seidl R, Ulyshen MD, Lorz J, et al. The contribution of insects to global forest deadwood decomposition. Nature. 2021;597(7874):77–81. https://doi.org/10.1038/s41586-021-03740-8
15. Tobias NJ. Insect vectors of disease : Untapped reservoirs for new antimicrobials? Front Micobiol. 2016;7:1–5. https://doi.org/10.3389/fmicb. 2016.02085
16. Tudi M, Ruan HD, Wang L, Lyu J, Sadler R, Connell D, et al. Agriculture development, pesticide application and its impact on the environment. Int J Environ Res Public Health. 2021;18(1112):1–23. https://doi.org/10.3390 /ijerph18031112
17. Sachs J, Malaney P. The economic and social burden of malaria. Nature. 2002;415:680–685. https://doi.org/10.1038/415680a
18. Lucero JE, Arab NM, Meyer ST, Pal RW, Fletcher RA, Nagy DU, et al. Escape from natural enemies depends on the enemies, the invader, and competition. Ecol Evol. 2020;10(19):10818–10828. https://doi.org/10.1002/ece3.6737
19. Wingfield MJ, Brockerhoff EG, Wingfield BD, Slippers B. Planted forest health: The need for a global strategy. Science. 2015;349(6250):832–836. https://do i.org/10.1126/science.aac6674
20. Scholtz CH. The higher classification of southern African insects. Afr Entomol. 2016;24(2):545–555. https://doi.org/10.4001/003.024.0545
21. Scholtz CH, Holm E. Insects of southern Africa. Durban: Butterworths; 1985. p. 502.
22. D’Souza ML, van der Bank M, Shongwe Z, Rattray RD, Stewart R, van Rooyen J, et al. Biodiversity baselines: Tracking insects in Kruger National Park with DNA barcodes. Biol Conserv. 2021;256, Art. #109034. https://doi.org/10.1 016/j.biocon.2021.109034
23. McGeoch MA. Insect conservation in South Africa: An overview. Afr Entomol. 2002;10(1):1–10.
24. Hamer PM. A national strategy for zoological taxonomy (2013-2020). Pretoria: South African National Biodiversity Institute; 2013.
25. Kamdem MM, Ramoejane M, Otomo PV. Local-scale DNA barcoding of afrotropical hoverflies (Diptera: Syrphidae): A case study of the eastern free state of South Africa. Insect. 2023;14(8):692. https://doi.org/10.3390/inse cts14080692
26. Hebert PDN, Cywinska A, Ball SL, deWaard JR. Biological identifications through DNA barcodes. Proc Biol Sci. 2003;270(1512):313–321. https://d oi.org/10.1098/rspb.2002.2218
27. Shearer TL, Van Oppen MJH, Romano SL, Wörheide G. Slow mitochondrial DNAsequenceevolutionintheAnthozoa(Cnidaria).MolEcol.2002;11:2475–2487. https://doi.org/10.1046/j.1365-294x.2002.01652.x
28. HebertPDN,RatnasinghamS,deWaardJR.Barcodinganimallife:Cytochrome c oxidase subunit 1 divergences among closely related species. Proc Biol Sci. 2003;270(Suppl 1):S96–S99. https://doi.org/10.1098/rsbl.2003.0025
29. Ratnasingham S, Hebert PDN. Bold: The Barcode of Life Data system. Mol Ecol Notes. 2007;7:355–364. https://doi.org/10.1111/j.1471-8286.2007.01 678.x
30. Ratnasingham S, Hebert PDN. A DNA-based registry for all animal species: The Barcode Index Number (BIN) system. PLoS One. 2013;8(7), e66213. https://doi.org/10.1371/journal.pone.0066213
31. Harvey JA. Climate change-mediated temperature extremes and insects: From outbreaks to breakdowns. Glob Chang Biol. 2020;26(12):6685–6701. https://doi.org/10.1111/gcb.15377
32. MyburghMMM,ThabangMadishaM,CoetzerWG.SouthAfrica’scontribution of insect records on the BOLD system. Mol Biol Rep. 2021;48(12):8211–8220. https://doi.org/10.1007/s11033-021-06822-y
33. Gerlach J, Samways M, Pryke J. Terrestrial invertebrates as bioindicators: An overview of available taxonomic groups. J Insect Conserv. 2013;17(4):831–850. https://doi.org/10.1007/s10841-013-9565-9
34. Samways MJ. Insects in biodiversity conservation: Some perspectives and directives. Biodivers Conserv. 1993;2(3):258–282. https://doi.org/10.1007/ BF00056672
35. Hallmann CA, Sorg M, Jongejans E, Siepel H, Hofland N, Schwan H, et al. More than 75 percent decline over 27 years in total flying insect biomass in protected areas. PLoS One. 2017;12(10), e0185809. https://doi.org/10.137 1/journal.pone.0185809
36. Montgomery GA, Dunn RR, Fox R, Jongejans E, Leather SR, Saunders ME, et al. Is the insect apocalypse upon us? How to find out. Biol Conserv. 2020;241. https://doi.org/10.1016/j.biocon.2019.108327
37. Costello MJ, Costello MJ, May RM, Stork NE. Can we name earth’s species before they go extinct? Science. 2013;339(6118):413–416. https://doi.org/ 10.1126/science.1230318
38. Wagner DL, Grames EM, Forister ML, Berenbaum MR, Stopak D. Insect decline in the Anthropocene: Death by a thousand cuts. Proc Natl Acad Sci USA. 2021;118(2), e2023989118. https://doi.org/10.1073/pnas.20239 89118
Volume 120| Number 5/6 May/June 2024 47
Review
DNA barcoding unveils South African insect diversity Page 8 of 9
https://doi.org/10.17159/sajs.2024/16448
Article
39. Pirk CWW, Human H, Crewe RM, Van Engelsdorp D. A survey of managed honey bee colony losses in the Republic of South Africa – 2009 to 2011. J Apic Res. 2014;53(1):35–42. https://doi.org/10.3896/IBRA.1.53.1.03
40. Topp EN, Loos J. Local and landscape level variables influence butterfly diversity in critically endangered South African renosterveld. J Insect Conserv. 2019;23(2):225–237. https://doi.org/10.1007/s10841-018-0104-6
41. Engel MS, Ceríaco LMP, Daniel GM, Dellapé PM, Löbl I, Marinov M, et al. The taxonomic impediment: A shortage of taxonomists, not the lack of technical approaches. Zool J Linn Soc. 2021;193(2):381–387. https://doi.org/10.109 3/zoolinnean/zlab072
42. McGeoch MA, Sithole H, Samways MJ, Simaika JP, Pryke JS, Picker M, et al. Conservation and monitoring of invertebrates in terrestrial protected areas. Koedoe. 2011;53(2), Art. #a1000. https://doi.org/10.4102/koedoe.v53i2.1 000
43. Ward DF, Larivière MC. Terrestrial invertebrate surveys and rapid biodiversity assessment in New Zealand: Lessons from Australia. New Zeal J Ecol. 2004;28(1):151–159.
44. Villalta I, Ledet R, Baude M, Genoud D, Bouget C, Cornillon M, et al. A DNA barcode-based survey of wild urban bees in the Loire Valley, France. Sci Rep. 2021;11(1), Art. #4770. https://doi.org/10.1038/s41598-021-83631-0
45. Gostel MR, Kress WJ. The expanding role of DNA barcodes: Indispensable tools for ecology, evolution, and conservation. Diversity. 2022;14(3):1–23. https://doi.org/10.3390/d14030213
46. Silva JMD, Willows-Munro S. A review of over a decade of DNA barcoding in South Africa: A faunal perspective. Afr Zool. 2016;51(1):1–12. https://doi.or g/10.1080/15627020.2016.1151377
47. Hebert PDN, Penton EH, Burns JM, Janzen DH, Hallwachs W. Ten species in one:DNAbarcodingrevealscrypticspeciesintheneotropicalskipperbutterfly Astraptes fulgerator. Proc Natl Acad Sci USA. 2004;101(41):14812–14817. https://doi.org/10.1073/pnas.0406166101
48. Przybyłowicz Ł, Tarcz S. Strong sexual dimorphism unraveled by DNA analysis – towards a better understanding of Pseudothyretes classification (Lepidoptera: Erebidae: Arctiinae). Zool J Linn Soc. 2015;173(1):22–54. http s://doi.org/10.1111/zoj.12198
49. Méheust E, Alfonsi E, Le Ménec P, Hassani S, Jung JL. DNA barcoding for the identification of soft remains of prey in the stomach contents of grey seals (Halichoerus grypus) and harbour porpoises (Phocoena phocoena). Mar Biol Res. 2015;11(4):385–395. https://doi.org/10.1080/17451000.201 4.943240
50. Pramual P, Wongpakam K. Association of black fly (Diptera: Simuliidae) life stages using DNA barcode. J Asia Pac Entomol. 2014;17(3):549–554. https ://doi.org/10.1016/j.aspen.2014.05.006
51. Sheerin E, Marie A, Daniel P, David O, Esther H, Leigh A, et al. Evidence of phenotypic plasticity in Alloteuthis media (Linnaeus, 1758) from morphological analyses on North Sea specimens and DNA barcoding of the genus Alloteuthis Wülker, 1920 across its latitudinal range. Mar Biol. 2023;170(3), Art. #35. https://doi.org/10.1007/s00227-023-04178-4
52. Sethusa MT, Millar IM, Yessoufou K, Jacobs A, Van der Bank M, Van der Bank H. DNA barcode efficacy for the identification of economically important scale insects (Hemiptera: Coccoidea) in South Africa. Afr Entomol. 2014;22(2):257–266. https://doi.org/10.4001/003.022.0218
53. Bezeng BS, Davies TJ, Daru BH, Kabongo RM, Maurin O, Yessoufou K, et al. Ten years of barcoding at the African Centre for DNA barcoding. Genome. 2017;60(17):629–638. https://doi.org/10.1139/gen-2016-0198
54. Wagner DL. Insect declines in the anthropocene. Annu Rev Entomol. 2020;65:457–480. https://doi.org/10.1146/annurev-ento-011019-025151
55. Page RDM. DNA barcoding and taxonomy: Dark taxa and dark texts. Philos Trans R Soc B. 2016;371, Art. #20150334. http://dx.doi.org/10.1098/rstb. 2015.0334
56. Gibbs J. DNA barcoding a nightmare taxon: Assessing barcode index numbers and barcode gaps for sweat bees. Genome. 2018;61(1):21–31. https://doi.org/10.1139/gen-2017-0096
57. Antil S, Abraham JS, Sripoorna S, Maurya S, Dagar J, Makhija S, et al. DNA barcoding, an effective tool for species identification: A review. Mol Biol Rep. 2023;50(1):761–775. https://doi.org/10.1007/s11033-022-08015-7
58. Scholtz CR, Chown SL. Insects in southern Africa: How many species are there? S Af J Sci. 1995;91:124–126.
59. KuhlmannM.Patternsofdiversity,endemismanddistributionofbees(Insecta: Hymenoptera: Anthophila) in southern Africa. S Afr J Bot. 2009;75(4):726–738. https://doi.org/10.1016/j.sajb.2009.06.016
60. Michener CD. The bees of the world second edition. Baltimore, MD: Johns Hopkins University Press; 2007. p. 1–953.
61. Stork NE, McBroom J, Gely C, Hamilton AJ. New approaches narrow global species estimates for beetles, insects, and terrestrial arthropods. Proc Natl Acad Sci USA. 2015;112(24):7519–7523. https://doi.org/10.1073/pnas.15 02408112
62. Forbes AA, Bagley RK, Beer MA, Hippee AC, Widmayer HA. Quantifying the unquantifiable: Why hHmenoptera, not Coleoptera, is the most speciose animal order. BMC Ecol. 2018;18(1), Art. #21. https://doi.org/10.1186/s1 2898-018-0176-x
63. Stevens DM, Bishop J, Picker MD. Phylogenetic analysis reveals high local endemism and clear biogeographic breaks in southern African stoneflies (Notonemouridae, Plecoptera). Zootaxa. 2018;4483(3):428–454. https://do i.org/10.11646/zootaxa.4483.3.2
64. Fochetti R, de Figueroa JMT. Global diversity of stoneflies (Plecoptera; Insecta) in freshwater. Hydrobiologia. 2008;595:365–377. https://doi.org/1 0.1007/s10750-007-9031-3
65. Melin A, Colville JF. A review of 250 years of South African bee taxonomy and exploration (Hymenoptera: Apoidea: Anthophila). Trans R Soc S Afr. 2019;74(1):86–96. https://doi.org/10.1080/0035919X.2019.1572670
66. Perez KHJ, Sones JE, DeWaard JR, Hebert PDN. The Global Malaise Program: Assessing global biodiversity using mass sampling and DNA barcoding. In: Scientific abstracts from the 6th International Barcode of Life Conference. Genome. 2015;58(5):266. https://doi.org/10.1139/gen-2015-0087
67. Bevilacqua S, Anderson MJ, Ugland KI, Somerfield PJ, Terlizzi A. The use of taxonomic relationships among species in applied ecological research: Baseline, steps forward and future challenges. Austral Ecol. 2021;46(6):950–964. https://doi.org/10.1111/aec.13061
68. Magnacca KN, Brown MJF. DNA barcoding a regional fauna: Irish solitary bees. Mol Ecol Resour. 2012;12(6):990–998. https://doi.org/10.1111/175 5-0998.12001
69. Schmidt S, Schmid-Egger C, Morinière J, Haszprunar G, Hebert PDN. DNA barcoding largely supports 250 years of classical taxonomy: Identifications for Central European bees (Hymenoptera, Apoidea partim). Mol Ecol Resour. 2015;15(4):985–1000. https://doi.org/10.1111/1755-0998.12363
70. deWaard JR, Ratnasingham S, Zakharov EV, Borisenko AV, Steinke D, Telfer AC, et al. A reference library for Canadian invertebrates with 1.5 million barcodes, voucher specimens, and DNA samples. Sci Data. 2019;6(1):1–12. https://doi.org/10.1038/s41597-019-0320-2
71. Chaiphongpachara T, Changbunjong T, Laojun S, Nutepsu T, Suwandittakul N, Kuntawong K, et al. Mitochondrial DNA barcoding of mosquito species (Diptera: Culicidae) in Thailand. PLoS One. 2022;17:1–27. https://doi.org/10 .1371/journal.pone.0275090
72. Elías-Gutiérrez M, Valdez-Moreno M. Relevance of DNA barcodes for biomonitoring of freshwater animals. Front Environ Sci. 2023;11:1–8. https:/ /doi.org/10.3389/fenvs.2023.1057653
73. Ziervogel G, New M, Archer van Garderen E, Midgley G, Taylor A, Hamann R, et al. Climate change impacts and adaptation in South Africa. WIREs Clim Chang. 2014;5(5):605–620. https://doi.org/10.1002/wcc.295
74. Jumaat AH, Hamid SA. Biological water quality indices performance based on aquatic insects in recreational rivers. Trop Life Sci Res. 2021;32(1):89–103. https://doi.org/10.21315/tlsr2021.32.1.6
75. Pilgrim EM, Jackson SA, Swenson S, Turcsanyi I, Friedman E, Weigt L, et al. Incorporation of DNA barcoding into a large-scale biomonitoring program: Opportunities and pitfalls. J North Am Benthol Soc. 2011;30(1):217–231. https://doi.org/10.1899/10-012.1
Volume 120| Number 5/6 May/June 2024 48
DNA barcoding unveils South African insect diversity Page 9 of 9
https://doi.org/10.17159/sajs.2024/16448 Review Article
AuthorS: John R.U. Wilson1, 2
Sabrina Kumschick1, 2
AFFILIAtIoNS:
1South African National Biodiversity Institute, Kirstenbosch Research Centre, Cape Town, South Africa
2Centre for Invasion Biology, Department of Botany and Zoology, Stellenbosch University, Stellenbosch, South Africa
CorrESPoNDENCE to:
John Wilson
EMAIL:
john.wilson2@gmail.com
DAtES:
received: 07 Nov. 2023
revised: 26 Mar. 2024
Accepted: 26 Mar. 2024
Published: 28 May 2024
hoW to CItE: Wilson JRU, Kumschick S. The regulation of alien species in South Africa. S Afr J Sci. 2024;120(5/6), Art. #17002. https://doi.org/10.1715 9/sajs.2024/17002
ArtICLE INCLuDES:
☒ Peer review
☒ Supplementary material
DAtA AVAILABILItY:
☒ Open data set
☐ All data included
☐ On request from author(s)
☐ Not available
☐ Not applicable
EDItor: Jennifer Fitchett
KEYWorDS: biological invasions, biosecurity, invasive alien species, global change, regulatory lists
FuNDING:
South African Department of Forestry, Fisheries and the Environment

The regulation of alien species in South Africa
A key global change challenge is to significantly reduce the risks of alien taxa causing harmful impacts without compromising the rights of citizens. As part of efforts to address this challenge, South Africa promulgated comprehensive regulations and lists of alien taxa in 2014. In this paper, we review how the lists developed, changed over time, and how they have been implemented. As of March 2021, 560 taxa were listed under four broad regulatory categories, and between 2014 and 2020, almost 3000 permits were issued to regulate the continued use of listed taxa. The full lists of regulated taxa, permits issued, and corresponding regulations are available in the Supplementary material. A proposed standardised, transparent, and science-informed process to revise the regulatory lists is also presented – as of 30 April 2024, risk analyses have been developed for 140 taxa using the Risk Analysis for Alien Taxa (RAAT) framework and reviewed by an independent scientific body [the Alien Species Risk Analysis Review Panel (ASRARP)] with input from taxon-specific experts. These recommendations are being considered by an interdepartmental governmental decision-making body established in March 2023 [the Risk Analysis Review Committee (RARC)]. Finally, key issues with the listing of alien taxa in South Africa that remain to be resolved are presented. As South Africa’s regulatory framework continues to develop, the process of listing and regulating alien taxa will, we believe, become more transparent, consistent, and acceptable to stakeholders, and ultimately facilitate efforts to reduce the harmful impacts of alien taxa.
Significance:
The regulation of alien species is a major part of how South Africa addresses biological invasions. For this process to be effective, relevant stakeholders need to be engaged and involved. This paper outlines how species have been regulated in the past, provides regulatory lists in accessible formats, and analyses how the lists have changed over time. A transparent, science-informed process to update the regulatory lists is presented and progress to date reviewed. This process aims to engage interested and affected parties in efforts to preserve the benefits of alien species while reducing the harmful impacts of invasions.
Introduction
Biological invasions are a leading driver of global change.1 There is increasing evidence that the scale, scope, and cost of problems caused by invasions will increase in the coming years.2-4 In response to this threat, regulatory frameworks and management need to focus on the pathways of introduction and spread, the sites that are or might be invaded, and on the taxa that form invasive populations.5 In 2010, through the Convention on Biological Diversity (CBD), the Aichi Biodiversity Target 9 specified that: “By 2020, invasive alien species…are identified and prioritized, priority species are controlled or eradicated…”6. To address this aspect of the target, many countries have developed checklists of alien taxa.7 The need for such lists is reinforced in Target 6 of the Kunming-Montreal Global Biodiversity Framework (GBF) that was agreed under the CBD in December 2022. The GBF tasks parties with “…preventing the introduction and establishment of priority invasive alien species, reducing the rates of introduction and establishment of other known or potential invasive alien species by at least 50 per cent, by 2030, eradicating or controlling invasive alien species…”8 Lists of alien taxa are thus considered fundamental to how biological invasions are managed.9,10 Moreover, the World Trade Organisation (WTO) Agreement of 1995 recognised that restrictions on trade are warranted to ensure food safety and to protect the health of animals and plants. The WTO Agreement recommended that such restrictions “…should be based as far as possible on the analysis and assessment of objective and accurate scientific data”11 The justification for restrictions, as codified in the Application of Sanitary and Phytosanitary Measures, typically takes the form of a risk analysis, which consists of an assessment of the likelihood and consequence of an invasion (risk assessment), an evaluation of what measure can be taken to manage the risk (risk management), and efforts to clearly outline and communicate what the concerns are (risk communication) (Supplementary figure 1).
South Africa, by virtue of its biogeographical and socio-economic history, has been both a global hotspot of biological invasions12 and a pioneer in the science and management of biological invasions13. South Africa’s history of regulating alien taxa dates back to the 19th century, with at least 50 pieces of legislation passed since the Xanthium Spinosum Act of 1861 14 Initially, the impetus behind such legislation was to protect economic interests, but an increasing focus on reducing environmental degradation and limiting harmful impacts on biodiversity emerged in the late 20th century. In particular, the Conservation of Agricultural Resources Act (CARA) of 1983 included several environmental weeds, guiding the management of invasive plants for over 30 years. South Africa is negatively impacted by invasive plants (and especially invasive trees)15, but also by invasive microbes, fungi, and animals (especially invasive freshwater fishes16)17. The promulgation of the National Environmental Management: Biodiversity Act in 2004 (hereafter the NEM:BA) provided the framework for the first comprehensive regulatory lists of alien taxa – the Alien and Invasive Species Regulations and Lists of 2014 (hereafter the NEM:BA A&IS Regulations and Lists).
The NEM:BA A&IS Regulations and Lists were a milestone in how South Africa addresses biological invasions. However, in the decade since they were promulgated, several issues have emerged. “Legislative and government efforts to manage IAPs [invasive alien plants] have faltered because of the difficulty of engaging private landowners,
49 https://doi.org/10.17159/sajs.2024/17002 Volume 120| Number 5/6 May/June 2024 © 2024. The Author(s). Published under a Creative Commons Attribution Licence. Review Article
competition [sic] local viewpoints and limited support for technical interventions by scientists and managers.”18 An evaluation of the overall quality of the current regulatory framework in South Africa, based on the indicators proposed by Wilson et al.19, categorised South Africa’s current regulations as “partial” noting that “ a process to evaluate the scientific evidence underpinning the lists of regulated alien species has been established…,” with the overall outlook that the “…process of listing should become more dynamic and responsive to recommendations”20 It is this process of listing that we review in this paper. Specifically, we: (1) review the development of the NEM:BA A&IS Lists (Figure 1); (2) consolidate information on the lists21, the regulations22, and the processes used to develop the lists (Tables 1 and 2; Figures 1 and 3); (3) briefly evaluate the implementation of the lists (Table 2; Figure 2); (4) outline processes to provide scientific evidence to underpin changes to the lists (Figure 4); and (5) identify issues that need to be resolved (Box 1, Table 3).
the development of the NEM:BA A&IS regulations and Lists
The NEM:BA of 2004 envisaged that lists would be produced by 1 April 2007. However, the process took much longer. The then Department of Environmental Affairs and Tourism (DEAT) consulted various stakeholders and, based on expert opinion as informed by various global databases and sources, published the first draft lists in September 2007. It is not clear why these lists were considered insufficient (though cf. Supplementary table 1), but, from 2 April 2008 until 27 January 2009, the South African National Biodiversity Institute (SANBI), on behalf of the DEAT, chaired a task team to revise the lists. Experts in various taxonomic groups were consulted, workshops and meetings were held, and the nomenclature was checked. Revised draft lists published on 3 April 2009 are largely similar to the lists eventually promulgated in 2014. Nonetheless, the process was not finalised and a series of taxon-specific working groups was established with relevant experts. Separate meetings were held on freshwater fishes, mammals, plants, and reptiles, and additional meetings were held specifically to discuss trout invasions. However, the different working groups interpreted the
proposed regulatory categories slightly differently (in particular category 3, see Table 1). After further draft lists were published in 2013 and 2014, the first regulations and lists were promulgated on 1 October 2014. Since then, revised lists were published that took effect on 27 September 2016, and revised regulations and lists (without the prohibited list) were published on 18 and 25 September 2020, respectively. Following submissions from stakeholders regarding the listing of two invasive trout taxa, the promulgation of the latter lists was deferred to 1 March 2021, with the trout temporarily removed. In all, between 2007 and 2021, 15 documents pertaining to the NEM:BA A&IS Regulations and Lists were published in South Africa’s Government Gazette (See Figure 1 and Supplementary table 1 for details, with the documents themselves collated online22). A major remaining issue, as we discuss later, is that the evidence used to arrive at (and change) the lists was not clearly set out.
Categories and exemptions under the NEM:BA A&IS Lists
The two principles that underlie the NEM:BA A&IS Lists are that: (1) all harmful invasive or potentially harmful invasive taxa are to be listed; and (2) provision, where appropriate, can be made to utilise taxa that are both beneficial and harmful. In practice, this means that: (1) taxa that pose a high likelihood of causing significant harmful impacts (based on a risk assessment) are to be listed; and (2) the choice of listing category is based on the most suitable option for regulation (based on an evaluation of risk management options).
In the 2020 NEM:BA A&IS Lists there are four categories of listing (Table 1). Category 1 is for taxa which require management: this category is sub-divided into 1a (nationwide eradication targets) and 1b (requiring compulsory control). Category 2 is for taxa which have benefits and can be allowed under specific permit conditions (outside of which Category 2 listed taxa are treated as Category 1b). Category 3 is similar to Category 1b except that keeping existing individuals is exempt (i.e. allowed without a permit). However, the interpretation of Category 3 varies somewhat across taxonomic groups. Existing
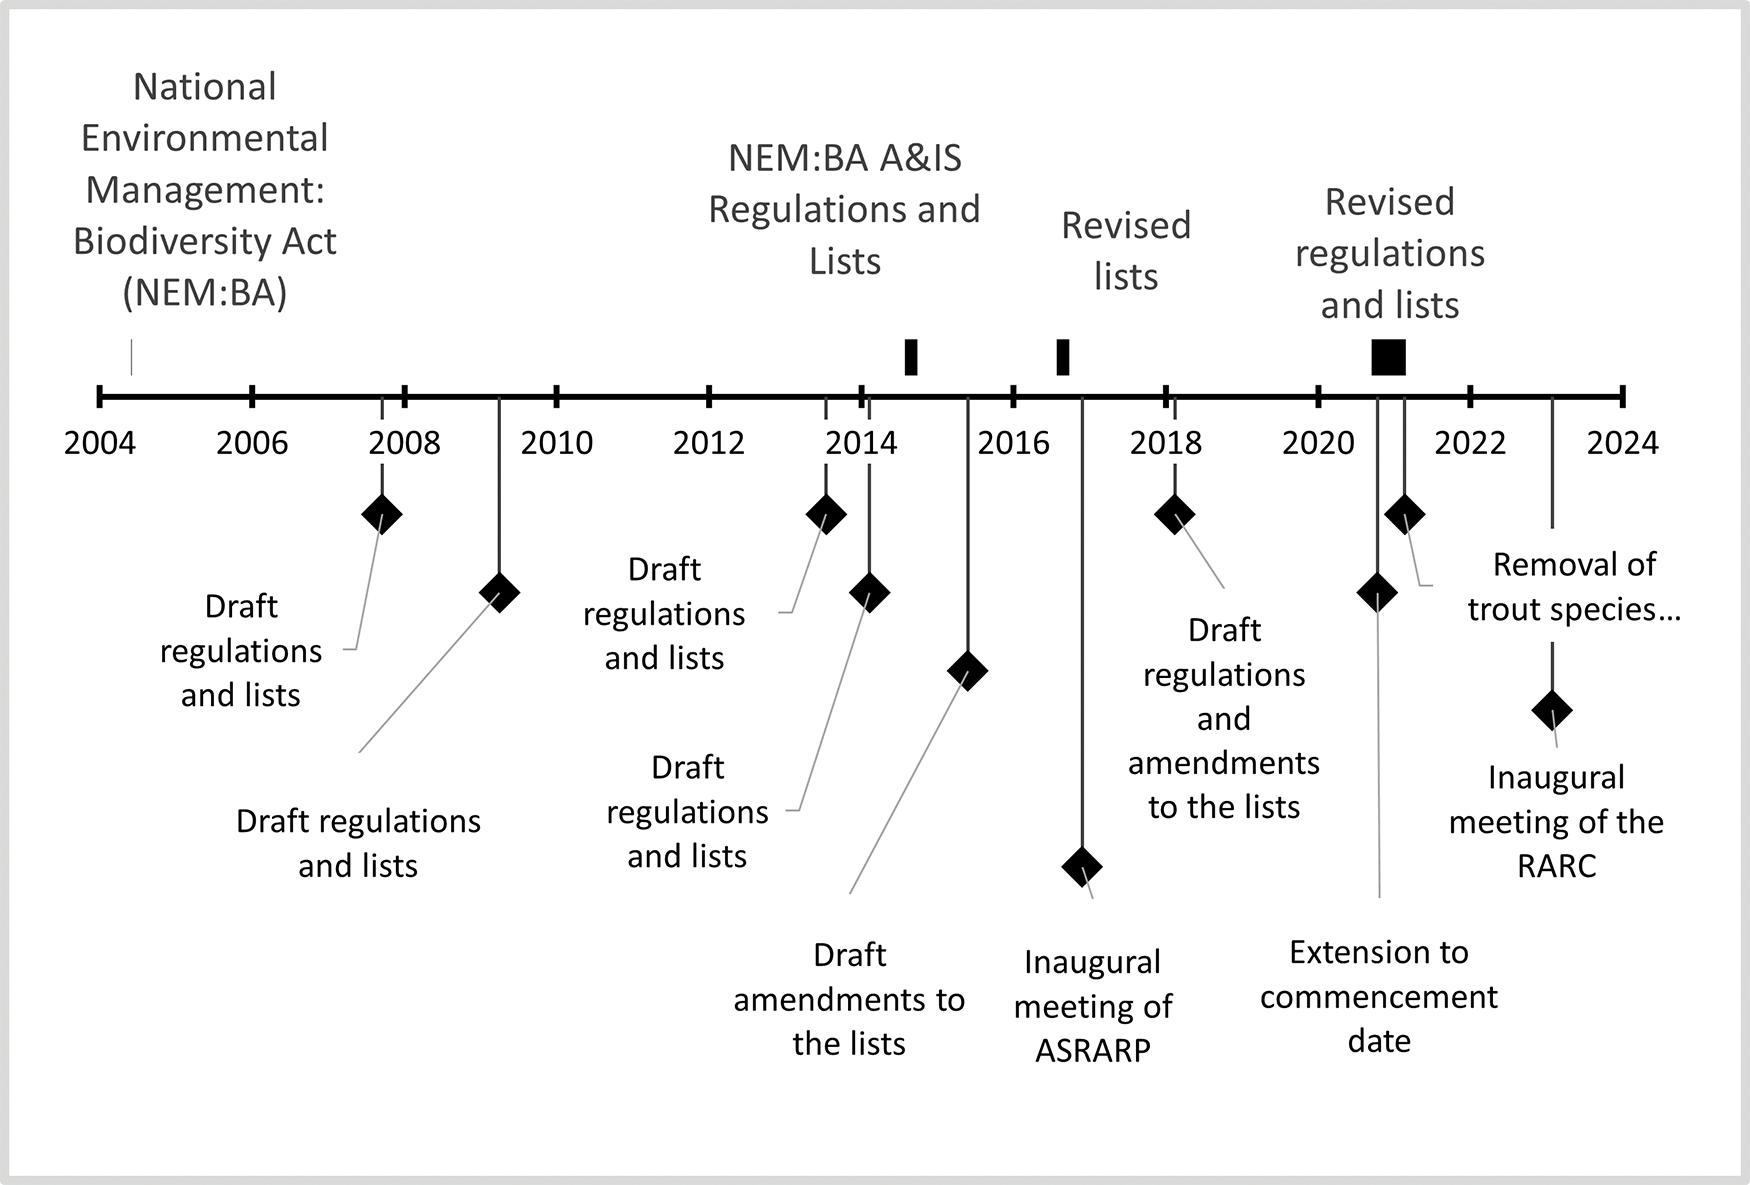
Figure 1: Timeline of the development of the Alien and Invasive Species Regulations under the National Environmental Management: Biodiversity Act (NEM:BA A&IS Regulations). Full details of the lists and regulations are in Supplementary table 1. ASRARP is the Alien Species Risk Analysis Review Panel (an independent body) and the RARC is the Risk Analysis Review Committee (a governmental decision-making body). For related processes concerning the development of risk analyses see Figure 4. This figure was produced using a template from the programme Vertex42.
Volume 120| Number 5/6 May/June 2024 50 https://doi.org/10.17159/sajs.2024/17002 Review Article The regulation of alien species in South Africa Page 2 of 14
table 1: The regulatory categories of the National Environmental Management: Biodiversity Act (NEM:BA) Alien and Invasive Species (A&IS) Regulations and Lists of 2020. The regulatory definitions are précised, with the omitted sections referring to particular actions that must be undertaken. The proposed criteria for the different categories are based on the authors’ experience developing the Risk Analysis for Alien Taxa (RAAT) framework and discussions at the Alien Species Risk Analysis Review Panel (ASRARP), noting that these proposed criteria would in some cases require a revision to the regulations and or the Act. A total of 560 valid taxa are considered here (see Supplementary table 2 for more details noting that the generic listings for all hybrids between native and alien species of amphibians, birds, mammals, and reptiles are not counted here).
• Present in the country as an alien taxon; AND
1a53
1b259
Category 1a species must be combatted or eradicated. A person in control of a 1a species must immediately take steps to combat or eradicate the species and allow authorised officials to inspect a property and to monitor, assist with or implement the combatting or eradication (in accordance with an Invasive Species Management Programme if one is in place).
• poses a high risk; AND
• any benefits provided can be provided by other taxa or such benefits cannot be maintained with an acceptably low risk of invasion; AND
• nationwide eradication is deemed desirable and feasible based on a costed evaluation(e.g. 23,24); AND
• a national eradication plan has been developed and is being implemented.
• Present in the country as an alien taxon; AND
• poses a high risk; AND
Category 1b species must be controlled. A person in control of a 1b species must control the species (in accordance with an Invasive Species Management Programme if one is in place), and allow authorised officials to inspect a property and to monitor, assist with or implement the control.
• any benefits provided can be provided by other taxa or such benefits cannot be maintained with an acceptably low risk of invasion; AND
• it is not desirable or feasible to attempt nationwide eradication, although the extirpation of some populations might be warranted; AND
Category 2 species are treated as 1b species except in cases where a permit has been issued.
• Present in the country as an alien taxon; AND
• poses a high risk; AND
• a taxon-specific national management plan has been developed and is being implemented (in certain cases, such a plan might simply indicate that control is not cost-effective at present). 275
Permits may be issued to persons to carry out restricted activities within a specified area (specified either in the regulations or in the issued permit), with permit holders required to ensure they adhere to the permit conditions, often with the goal that there is no spread to areas outside the specified area.
Category 3 species are regarded and managed as 1b species except that specimens may be kept without a permit providing there is no further propagation, movement, or trade, and Category 3 plant species may not be kept in riparian areas.
• has significant socio-economic benefits which cannot be supplied by other taxa (either native taxa or alien taxa which pose acceptably low risks); AND
• permit conditions have been established that have been shown to reduce the risk of invasion to an acceptably low level and that can be readily implemented and monitored. Effective remedial control measures are available if there are any escapes with such measures specified in permits.
Category 3 to be removed. Taxa listed as Category 3 to be relisted as 1b with exempted activities (e.g. possession) to be explicitly specified in the regulatory lists. This is because Category 3 has been interpreted in several different ways and so it would be preferable to make the exemptions and prohibitions explicit in the listing itself.
Prohibited0NA (cf. the 2014 and 2016 regulations and lists)See Box 1
Context-specific122
This is not a formal definition but arises as the regulations list some taxa in multiple categories (e.g. 1b in one province and not listed in other provinces). Moreover, specific exemptions may be indicated (e.g. existing plantations of some forestry species are exempt, noting that the listed taxon may not spread outside the existing plantation). The 13 taxa listed only on the Prince Edward Islands (PEIs) are included in this category.
No taxon is to be listed in multiple categories. Details of sites to be prioritised for control should be outlined in taxon-specific national management plans rather than specifying different listing categories for different sites in the NEM:BA A&IS Lists themselves. Regulation at the sub-national level is also needed to address taxa which are native to one part of South Africa but pose a high risk as an invasive taxon in another part of the country (cf. Table 3).
A separate list to be created and maintained for the PEIs as the risk and management options differ from the mainland. Such a list should include all alien taxa present on the PEIs, with management goals specified in the PEIs Management Plan.25
Volume 120| Number 5/6 May/June 2024 51 https://doi.org/10.17159/sajs.2024/17002 Review Article The regulation of alien species in South Africa Page 3 of 14 Category Number of taxa regulatory definition (précised)Proposed criteria / approach
351
Category 3 plants in people’s gardens are allowed to remain, but not be replaced (i.e. breeding and trading are restricted); therefore, over time, such taxa are being phased out and will essentially end up being Category 1b. Category 3 birds, by contrast, are often highly abundant and widespread taxa which might be difficult to control due to their sheer numbers.
Notably, Category 1a taxa are not more invasive than Category 1b taxa, and Category 1a and 1b taxa are not more invasive than Category 2 or Category 3 taxa [on average, Category 2 plant taxa are the most widespread (see Figure 3 in Henderson and Wilson26)]. Moreover, the NEM:BA A&IS Lists are not comprehensive lists of all invasive taxa in South Africa [there are more invasive plant taxa that are not listed than are listed; 435 vs. 338 plant taxa15].
Some general exemptions apply to all listed taxa. Dead specimens, plants used as biomass (i.e. firewood), and specimens moved for disposal (e.g. after control) are exempt. Authorised officials do not need a permit to perform their duties in terms of the NEM:BA or the National Environmental Management Act. Unless otherwise listed, species legally imported for agricultural purposes before the NEM:BA came into force (i.e. 2004) are exempt, as well as species legally imported before the NEM:BA A&IS Regulations came into effect (i.e. 2014 or later depending on which version of the regulations was applicable). Alien freshwater fish are also exempted in some situations (including catch and release in artificial dams and catching to eat).
For Category 2 listed taxa, permits can be applied to: import, possess, breed, convey, trade, spread (or allow to spread), release, move freshwater taxa between water bodies, discharge water, catch and release freshwater fishes or freshwater invertebrates, release freshwater fishes or freshwater invertebrate species into discrete water bodies in which they already occur, and introduce a species to an offshore island. Some restrictions, however, remain, e.g. no permits will be issued for Category 2 alien plants within riparian areas. Permits can also be issued for any listed taxa for research (including biological control) by a scientific institution, display by a zoological or botanical institution, and during a state inter-basin water transfer scheme.
Finally, the NEM:BA provide provision for a list of alien taxa that are not present in the country and that should be prevented from entry (termed a prohibited list). Prohibited lists were gazetted in 2014 and 2016, but removed in 2020, arguably as the evidence for the inclusion or exclusion of taxa was not clearly set out (Box 1).
the NEM:BA A&IS Lists and changes over time
In the 2020 NEM:BA A&IS Lists, 560 taxa are listed as well as all hybrids between native and alien species of amphibians, birds, mammals, and reptiles (see Supplementary table 1 for details of how this number was calculated). Of these, 13 taxa are only listed on the Prince Edward Islands. Of the remaining 547 taxa, 1 is an order (Phasmida), 2 are families (Dendrobatidae and Salviniaceae), 15 are genera, 1 taxon is a species aggregation (Rubus fruticosus L. agg.), 506 are species, 12 are listed at the sub-specific level, and 10 at the variety level; and, regardless
of the level at which the listing is, hybrids are explicitly mentioned in the listings of 18 taxa.21
As part of this paper, the name of each regulated taxon was aligned manually to a national or international database of accepted scientific names (i.e. a taxonomic backbone). Notably, almost half the listed regulated names (255 out of 560) do not correspond exactly to the name found in the relevant taxonomic backbone. In about a hundred cases, this is because the regulatory name includes one or more synonyms (cf. Table 3), and in many other cases it is due to a slight difference in the formatting of species authorities or an update in the nomenclature [e.g. the Global Biodiversity Information Facility refers to the addax as ‘Addax nasomaculatus (Blainville, 1816)’, but the NEM:BA A&IS Lists of 2020 refers to the addax as ‘Addax nasomaculatus (de Blainville, 1816)’]. A full list of proposed changes to the nomenclature of the regulatory lists is provided online.21
There have been few changes to the regulatory lists over time (Supplementary table 2). Excluding the removal of the prohibited list, the category under which 85 taxa are listed has changed since 2014 [including 20 taxa that are no longer listed and 11 taxa that were at one point not listed that are now listed]. There were also some notable changes between the draft lists and the promulgated lists. In the February 2014 draft lists, the whole family Cactaceae was listed, but, based on evidence of invasiveness in the country, only 37 cactus taxa were on the final promulgated list. Research suggests this decision was proportionate – globally invasive cacti come from only 13 of 130 genera, and crucially from only 5 of 12 cactus growth forms30, i.e. spiny cacti that spread rapidly via clonal fragmentation31. Banning the whole family, including Mammillaria spp. that are popular in horticulture and none of which are invasive (as they are globose), is not warranted.32
Permitting
Therehasbeenasteadystreamofpermitsissuedforrestrictedactivitieson listed alien taxa over time, with 2906 permits issued as of December 2022 (Figure 2a).33 Permits have been issued for 268 different taxa; however, over half of all permits have been issued on five taxa – in decreasing order, Kobus leche subsp. leche (red lechwe), Oreochromis niloticus (tilapia), Ctenopharyngodon idella (grass carp), Dama dama (fallow deer), and Psittacula krameri (rose-ringed parakeet) – and half of the taxa have only had one permit issued for them (Figure 2b). No permits have been issued for 26 of the 124 taxa (i.e. ~20%) that have at some point been listed as Category 2 (Supplementary table 3), which raises the question: If there is no demand for permits should a taxon be listed as Category 2?
There have also been 10–20 permits issued to import taxa each year, around a quarter of which have been for research. Import permits have been issued for three taxa not recorded as legally in the country previously: Acipenser baerii (Siberian sturgeon); Meriones unguiculatus (Mongolian gerbil); and Salmo salar (Atlantic salmon). There have been other requests to import taxa (particularly reptiles), but these were rejected, often as the risk analyses were inconclusive or incomplete (cf. the process outlined in Figure 3). A separate process is in place for importing agricultural commodities and the inspection of plant products.34,35
Box 1: Potential lists of taxa not present in South Africa
One of the most effective ways to address biological invasions is to prevent introductions.1 This can be done in various ways, e.g. prohibiting the import of taxa; identifying risks and putting specific surveillance in place; and developing contingency plans so any incursions detected can be eradicated. For each of these, a list of taxa can be developed; noting the merit of such a list should be defined by its utility.
Prohibited list: taxa that are not allowed to be introduced (deliberately or accidentally). No import or other permits will be granted for these taxa. Watch list: taxa that are likely to arrive and pose an unacceptable threat. Active surveillance can improve how quickly incursions are detected, and a watch list can therefore provide priorities for setting up surveillance efforts. Various methods have been used to develop such lists.27,28
Emergency response plan list: taxa identified as likely to be introduced, that pose an unacceptable threat, and that are a high priority for control. Contingency plans should be developed in advance so any incursions can be controlled immediately upon detection.
Finally, given the number of potential new introductions, it is often impractical to manage taxon by taxon. Instead, it is preferable to look at the risks posed by particular pathways and implement pathway-specific regulations and control measures.29
Volume 120| Number 5/6 May/June 2024 52 https://doi.org/10.17159/sajs.2024/17002 Review Article The regulation of alien species in South Africa Page 4 of 14
Figure 2: Permits issued for taxa listed under the National Environmental Management: Biodiversity Act, Alien and Invasive Species Regulations 2014–2022. a)The number of permits issued has not varied much over time, except for an initial slow start and a dip during the South African national lockdowns in response to COVID-19 in 2020. b) Most taxa have had only a few permits issued, with permits issued predominately on a handful of taxa. Information on permits declined was not collated here as it can be misleading (e.g. permits can be declined based on how the application is submitted, and such declined permits can be issued subsequently once applicants comply with the requirements). These figures are based on information provided by the South African Department of Forestry, Fisheries and the Environment (DFFE) to the South African National Biodiversity Institute (SANBI), as part of the national status report.17,33
Proposed improvements to the process
The changes to the 2014 lists made in 2016 and 2020 were based on either a risk assessment or expert opinion, but the basis for specific changes was not made public, likely, in part, as the NEM:BA A&IS Regulations do not require the publication of the rationale for changes made to the lists. To improve transparency and the link to scientific evidence, a new process has been developed (summarised in Figure 3 and discussed in detail in Supplementary material 1).36 The new process:
• has a clear evidence base – through the use of the Risk Analysis for Alien Taxa (RAAT) framework37;
•engages with the scientific community – risk analyses produced usingtheRAATframeworkarepeerreviewedandsubjecttoscrutiny by the Alien Species Risk Analysis Review Panel (ASRARP); and
•facilitates integrated governance – an inter-governmental Risk Analysis Review Committee (RARC) was established to assist the Minister of the Department of Forestry, Fisheries and the
Environment (DFFE) with the evaluation of proposals to change the NEM:BA A&IS Lists. The RARC’s first meeting was on 1 March 2023.
We discuss the first two of these points below, noting it is too early to review the performance of the RARC.
the risk Analysis for Alien taxa framework
The RAAT is centred on three questions that address the key aspects required of a risk analysis and that link to a mechanistic understanding of invasions (Supplementary figure 1)39:
• What is the likelihood that the taxon will become invasive in South Africa?
•What are the likely negative environmental and socio-economic consequences if the taxon were to become invasive?
•What options are available to manage the taxon to ensure that any benefits derived can be sustainably retained?
Volume 120| Number 5/6 May/June 2024 53 https://doi.org/10.17159/sajs.2024/17002 Review Article The regulation of alien species in South Africa Page 5 of 14
0 20 40 60 80 100 research, biocontrol, etc.. category 2 Jan 2015 a) b) 201720182019202020212022 Month Number of permits issued 12 5102050 100200500 0 10 20 30 40 50 60 Number of permits issued Number of taxa
Additional information or revisions required
Address public comments (DFFE)
Additional information or revisions required
Risk analysis conducted as per the RAAT framework (Assessor)
Assess if risk analysis should be considered (DFFE)
Quality control and review of risk analysis (SANBI)
Consider risk analysis and other sources of information (RARC)
Publish proposed amendments to A&IS Lists for public comment (DFFE)
• Revised A&IS Lists published
• Risk analysis published
Request to import a taxon with accompanying report (Importer)
Assess if import application valid (DFFE)
Review the import application (Interested and affected government departments)
Consultation with an independent expert panel and peer-review (ASRARP)
No change to A&IS Lists
• Risk analysis published
Report on risk of the import (SACNASP Registered Professional Scientist)
Review the import application (SANBI)
Make decision on import application (DFFE)
• Import approved When brought in, list of species legally in the country updated Consider for inclusion on A&IS Lists
•
Reject application
Consultation with an independent expert panel and peer-review (ASRARP)
• Import rejected
• Consider for inclusion on A&IS Lists as a ‘prohibited’ taxon
Figure 3: How decisions are made with regard to: a) evaluating and potentially changing the listing of a taxon; and b) requesting an import permit. Please note these diagrams are the authors’ interpretation of the situation and have no legal basis. The NEM:BA A&IS Lists are the Alien and Invasive Species Lists published under the National Environmental Management: Biodiversity Act of 2004; ASRARP is the Alien Species Risk Analysis Review Panel; DFFE is the Department of Forestry, Fisheries and the Environment; RAAT is the Risk Analysis for Alien Taxa framework; RARC is the Risk Analysis Review Committee; and SANBI is the South African National Biodiversity Institute. For full details of these processes and the separate process to import biological control agents based on information38 see Supplementary material 1.
We believe the RAAT framework represents an important advance. Of 14 minimal standards for risk assessments for alien taxa40, the RAAT framework fully addresses 12. The framework does not currently assess the effects of future climate change (the intention is for risk analyses to be valid for around a decade or so), and only indirectly considers the status (threatened or protected) of taxa or habitats under threat. In addition to the minimum standards40, the RAAT framework also considers environmental and socio-economic benefits of the taxon under assessment and evaluates risk management options (i.e. results in a risk analysis rather than simply a risk assessment, Supplementary figure 1). The process is also transparent. Assessors are required to ensure there is robust evidence that listed taxa are present in the country, and to systematically collate and present evidence of impact or threat to justify listing. This means stakeholders and decision-makers can see how recommendations were influenced by the available evidence. Finally, there is a formal review process to ensure consistency and quality, and to engage with relevant experts (see the section on ASRARP below).
The RAAT framework has not, as yet, been evaluated in terms of the accuracy of its classification of risk into low, medium, and high. This is mostly because analyses have, to date, focussed on invasive and high-risk taxa. We feel the RAAT approach is nonetheless preferable as it sets out the arguments as to why a taxon should be (or does not need to be) listed, and therefore provides a clear basis for which someone can contest a listing.
the Alien Species risk Analysis review Panel
The ASRARP was initiated by the DFFE and SANBI in 2016 as an independent scientific advisory panel to review documents pertaining to the risk of alien taxa, specifically with reference to potential imports and listings (see Figure 3 for the outline and Supplementary material 1 for more details).41 ASRARP also assists in reviewing guidelines for risk analyses and changes made to the A&IS Regulations (see Supplementary material 2 for the current terms of reference).
ASRARP (since July 2018) has been composed of ex officio SANBI members and independent members. Independent members are experienced academics, researchers or those involved in relevant
Volume 120| Number 5/6 May/June 2024 54 https://doi.org/10.17159/sajs.2024/17002 Review Article The regulation of alien species in South Africa Page 6 of 14
a
b
industries from across the country, who serve on ASRARP in their personal capacities and can be remunerated for their time. In accordance with the NEM:BA A&IS Regulations on risk assessment practitioners, independent members must be registered as professional scientists with the South African Council for Natural Scientific Professions (SACNASP). Panelmembershandlethereviewofriskanalyses,andforeachriskanalysis solicit at least two external reviews (including ideally one international review) that focus on errors and omissions. Risk analyses and reviews are then presented in at least one ASRARP meeting, with recommendations passed back to the assessors for revision. Conflicts of interest are declared, and it is understood that ASRARP members are not individually liable for the recommendations if such were made in good faith.
There have been 29 meetings of ASRARP as of April 2024, with the inaugural meeting held on 29 November 2016 (Figure 1). ASRARP has gone through essentially five terms (including the current one) in line with DFFE funding cycles. Prior to 2018, various government and provincial officials attended ASRARP meetings in ex officio capacity, but by the fourth meeting, a decision was taken to clearly separate the scientific advisory panel from decision-makers. The second term was short, Jan 2018–March 2018; the third term ran from 16 July 2018 to 31 March 2020; the fourth term from 18 May 2020 to 31 March 2022; and the current fifth term began on 3 June 2022 and is due to run until 31 March 2025 (the hiatuses between terms were due to delays in finalising funding agreements between DFFE and SANBI and inefficiencies in advertising and reconstituting the panel). Meetings
are now held quarterly. Initially, meetings were in person, but since the COVID-19 pandemic they have been online. Since July 2018, 39 people (excluding guests) have attended ASRARP meetings: 29 independent members, 5 as ex officio SANBI staff, and 9 as part of the secretariat, with some people serving in different roles at different times (see Supplementary table 4).
Progress to date and issues to resolve
As of 30 April 2024, risk analyses approved by ASRARP have been completed for 140 taxa (Supplementary table 5) – 17 on taxa not listed at the time of approval, and 123 on regulated taxa. Almost half of the risk analyses on regulated taxa recommended a substantive change to the listing (54 of 123, cf. Table 2). This is because taxa were prioritised for risk analyses if it was felt a change to the listing was likely warranted or the listing was contentious. As risk analyses are completed on less controversial taxa, there are likely to be fewer cases of the recommendations differing from the current listing.
For example, Sasaella ramosa (dwarf bamboo) is currently listed as Category 3 under the synonym Sasa ramosa. However, the taxon is not formally recorded as present in the country, and the risk of invasion was scored low. The recommendation was to delist. By contrast, Phyllostachys aurea (fishpole bamboo) is not currently listed but is recorded to have naturalised in South Africa, is invasive in other parts of the world, and requires costly management, especially in forested areas. The recommendation was to list Phyllostachys aurea as Category
Progression of risk analyses through ASRARP review
Approved Still under review Risk analyses submitted to DFFE ASRARP Meetings (sub−group meetings) Import aplications reviewed v1.0v1.1v1.2v2.0
201620172018201920202021202220232024
Risk Analysis of Alien Taxa Framework Training courses held (refresher courses in grey)
4: Progress developing risk analyses on alien taxa and activities of the Alien Species Risk Analysis Review Panel (ASRARP) as of 30 April 2024. Each horizontal line represents a risk analysis that has been developed for a specific taxon, with the length of the line indicating the time the risk analysis had been under review with ASRARP.
Volume 120| Number 5/6 May/June 2024 55 https://doi.org/10.17159/sajs.2024/17002 Review Article The regulation of alien species in South Africa Page 7 of 14
Figure
1b.42 Iris pseudacorus (yellow flag iris) was listed as a national eradication target (Category 1a). However, naturalised populations have been recorded at 24 localities across four provinces; plants are present in many people’s gardens; and individual populations are very hard to control.43 Therefore, the recommendation was for the species to be listed as Category 1b and options for biological control explored. Kobus ellipsiprymnus subsp. defassa (Defassa waterbuck) is currently listed as Category 2 (i.e. can be kept under permit). Given the potential for hybridisation with the native K. e. subsp. ellipsiprymnus (common waterbuck), it was recommended that K. e. subsp. defassa should no longer be kept in South Africa and the taxon relisted as Category 1a.
Importantly, these recommendations are provisional and need to be discussed within government (through the RARC) with interested and affected stakeholders (e.g. the horticultural and game industries), and through wider public consultation (e.g. through publishing the lists for comment).
As with similar processes (e.g. submission of manuscripts to peer-reviewed journals), the review process takes time (Figure 4, Supplementary figure 2). As of 30 April 2024, most submitted risk analyses were reviewed, revised, and approved by ASRARP within 6 months, but ~20% took longer than a year. The longest delays were
when either the assessor or the ASRARP handling member became unavailable during the process; in such cases, risk analyses needed to be reassigned before they could be finalised.
A risk analysis training course was developed in 2018 to help assessors complete risk analyses. As of 30 April 2024, 19 courses have been run, 2 of which were refresher courses developed upon revision of the risk analysis framework to v1.2 in 2020. As of 30 April 2024, 52 course participants have received a course certificate, which requires – in addition to attending the course – that a risk analysis is developed using the RAAT, reviewed and accepted by ASRARP, and ultimately submitted to the DFFE.
During the implementation of the regulatory lists and following discussion at ASRARP, several issues have come to light that still need to be resolved. These are summarised in Table 3. One of the most difficult issues is how to draw in all stakeholders. The need for consultation is intended to be integral throughout the development, revision, and implementation of the NEM:BA A&IS Regulations and Lists (cf. Supplementary material 1). A framework to help with such engagement has been developed44; however, conflicts often arise45, and, in some cases, a formal process to reach an agreement, e.g. a scientific assessment46, might be needed.
table 2: Recommendations of the Alien Species Risk Analysis Review Panel (ASRARP) based on 140 risk analyses conducted as of 30 April 2024. The listings (on date of approval by ASRARP) are shown in the rows and the recommendations are shown in columns. Taxa for which the recommendation was to retain the listing are therefore in the main diagonal (e.g. 27 taxa were listed as 1b and are recommended to be kept as 1b). Details of changes to the nomenclature are in Wilson21. In 26 cases there was a recommendation to re-evaluate taxa (usually within 5 years) as the evidence was equivocal or there was specific research or monitoring that should be carried out to inform the recommendation. Of the six taxa flagged for delisting, one was found not to be a valid taxon, one was native to a part of South Africa, one is a hybrid for which both parental taxa are already listed (and so the listing is not needed), and three were found to pose a low invasion risk. See Supplementary table 5 for further details.
table 3: Issues identified during discussion around the regulation of the alien taxa in South Africa with proposed solutions. These issues are largely based on discussions held at the Alien Species Risk Analysis Review Panel (ASRARP) or while the authors have been developing and implementing the Risk Analysis for Alien Taxa (RAAT) framework.
IssueDescriptionProposalExamplesKey
Taxa which have both alien and native populations within the Republic of South Africa
The regulations define nativity in terms of the whole of South Africa. However, there can be species which are native to one part of the country that form alien populations in another part of the country, i.e. “...populations that result from the human-mediated dispersal of individuals of a species beyond a biogeographical barrier to a point beyond that species’ native range, but that is still within the same political entity as parts of the species’ native range”
Taxa which are native to some parts of the country but alien in others (i.e. have native-alien populations) should only be regulated in the provinces where they are not native; and so should not be included in the NEM:BA A&IS Lists which are at a national level. The term “native-alien populations” is to be preferred to alternative terms (e.g. “extra-limital”, “domestic exotic”, “intracountry established alien species” and “home-grown exotic”) for consistency.
132 such populations from 77 native species have been formally categorised in the country. Three of these taxa are currently listed under the NEM:BA A&IS Regulations: Clarias gariepinus (African sharptooth catfish), Hyperolius marmoratus (painted reed frog), and Sclerophrys gutturalis (guttural toad).
reference(s)
...table 3 continues on next page
Volume 120| Number 5/6 May/June 2024 56 https://doi.org/10.17159/sajs.2024/17002 Review Article The regulation of alien species in South Africa Page 8 of 14
recommendation
listing 1a1b2Context-specificProhibitDo not list Listing under NEM:BA A&IS lists (on date of approval) 1a 1650011 1b 0270000 2 41125012 3 020001 Context-specific 01111302 Not listed 384011
for
Nelufule et al.47
Listing of taxa at geographical levels other than national (e.g. provincial)
Certain alien taxa are not a threat to the whole country and therefore only warrant listing in certain regions of the country, for example, provinces. However, there are no border controls between provinces, and therefore control of movement and enforcement is more difficult.
Details of sites to be prioritised for control should be outlined in taxonspecific national management plans rather than specifying different listing categories for different sites. There is provision in the NEM:BA for provincial lists (70.1b, 70.2). Local ordinances could also be used to handle such cases. Moreover, regulation at the sub-national level is needed to address taxa which are native to one part of South Africa but pose a high risk as an invasive taxon in another part of the country (see above).
Metrosideros excelsa (New Zealand Christmas tree) is currently only listed in the Overstrand District of the Western Cape
Spread between South Africa and other countries
Biological invasions are inherently an international issue and taxa that are introduced to South Africa need to consider the risks of invasions to neighbouring countries and vice versa.
Declaring taxa as absent
Some taxa were added to the list but are subsequently believed to be absent from the country. This can be because a taxon was present but there is strong evidence that it is no longer present either because it was deliberately eradicated from South Africa or the population was lost. The taxon might also have been initially misidentified.
Evaluating positive impacts
The evaluation of positive impacts and benefits in risk analyses is important as it gives an indication of the uses of the taxa and potential conflicts of interest. However, there has often been discussion as to what constitutes a “significant” benefit, and stakeholders might differ in their perceptions of benefits.
No list of alien taxa legally in the country
Assessors and decision-makers should consider threats to neighbouring countries when considering applications to allow taxa to be introduced.
Biological control releases evaluated by the National Biological Control Release Application Review Committee routinely consider the threat biocontrol agents could pose to the flora and fauna of other Africa countries.
A protocol for declaring taxa absent is under development and would provide a rationale for removing taxa from the lists.
International frameworks have recently been developed to assess positive impacts on the environment, and similar frameworks for socio-economic benefits are in development. These should be incorporated into the risk analysis process once they are more established.
Tetrapygus niger (the Chilean black urchin) was found in aquaculture dams used for oyster production on the West Coast of South Africa. Oyster production was stopped at the dams and surveys of the dams and the neighbouring coast found no evidence of the urchins remaining.
Classical biological control agents have arguably had ‘major’ positive impacts on biodiversity in South Africa.
50
How to respond to new detections
Listing of taxa at levels other than the species level
Many of the exemptions to the regulations depend on knowledge of which taxa are legally present in the country and which are present but were introduced illegally. However, no such list has been systematically curated and made publicly available (please note, many taxa regulated under the NEM:BA A&IS Lists will have originally been legally and deliberately introduced).
Taxa can, of course, be accidentally or illegally introduced. The NEM:BA A&IS Regulations do not specify what should happen to such taxa on detection – they are not automatically listed or earmarked for control.
Some taxa are listed at levels above (e.g. genus or family) or below (e.g. sub-species and variety) the species level. Risks and impacts can vary across taxa but most information in the literature is available at the species level.
A list of alien taxa legally in the country needs to be compiled and curated. This will require digitisation of historical import records; an assessment of whether a taxon for which an import permit was issued was actually imported; and an assessment of whether a taxon is still present in the country.
A detection should ideally rapidly trigger an incursion response, including the activation of an emergency response plan, and a process (supported by a risk analysis) to consider listing.
Listing should generally be done at the species level. Exceptions could be if the whole taxonomic entity is alien to the country and considered high risk. If entities below the species level are to be listed, it is important that entities can be distinguished in practice.
Many agricultural and forestry taxa were introduced over a century ago for various uses and are still widely used. These taxa might have been introduced in compliance with any regulations that applied at the time.
Over the period 2013–2022, 32 new alien taxa were either illegally or accidentally introduced (or at least detected for the first time).
The order Phasmida (stick insects) is listed, despite some taxa being native to the country, and that many taxa likely pose a low risk.
See Box 1
Volume 120| Number 5/6 May/June 2024 57 https://doi.org/10.17159/sajs.2024/17002 Review
The regulation of alien species in South Africa Page 9 of 14
reference(s)
Article
IssueDescriptionProposalExamplesKey
Wilson21
Ivey et al.38 , Faulkner et al.48
Mabin et al.49 , Matthys
Vimercati et al.51,52 , Paterson et al.53
Wilson et al.23 , Faulkner et al.54
table 3 continued...
Datta et al.55
IssueDescriptionProposalExamplesKey reference(s)
Co-invasionsMultiple taxa can be introduced together, and in some cases only the combination of the taxa makes them high risk.
A decision needs to be made on whether all involved taxa are listed, and if they are to be listed separately or as a complex.
Taxa that are too widespread for effective control
Some alien taxa, specifically certain small mammals and birds, are distributed across South Africa. In such cases, effective control might not be possible.
Suitability of risk analysis framework for microorganisms / diseases
Dealing with agricultural vs. environmental vs. health issues
The RAAT framework, as many frameworks in invasion science, was not specifically designed to be applied to microorganisms, and there might be unique issues when assessing such organisms.
NEM:BA focuses on biodiversity, but the impacts of many invasive taxa cut across multiple domains. It is not clear if all alien pests, pathogens, and weeds should be included on the NEM:BA A&IS Lists; or only taxa that have negative impacts on biodiversity. There is a need to harmonise relevant legislation.
Listing such taxa is still important to avoid further introductions. In certain cases, simple bans on imports could be instituted without the mandate to control the taxa actively otherwise.
A separate process is in place for human health and animal diseases which could possibly be implemented, but such protocols do not necessarily reflect or cover threats to biodiversity at large.
The cross-sectoral and interdepartmental RARC should be able to address some of the issues, but the impact of agricultural pests and weeds on biodiversity is understudied. The One Biosecurity approach is potentially useful.
Euwallacea fornicatus (the polyphagous shot-hole borer) and a symbiotic fungus, Fusarium euwallaceae, were introduced together. Both the fungus and the beetle are required for an invasion to occur and for trees to be killed.
There are several notable invasive rats in South Africa, including Rattus norvegicus, R. rattus, and R. tanezumi – these are only currently listed on off-shore islands, but are a pest on the mainland as well.
Rinderpest was detected for the first time in South Africa in 1896, and killed an estimated 2.5 million domestic cattle in southern Africa and an unknown number of game.
The import of plants is variously addressed under NEM:BA, the Agricultural Pests Act of 1983, and the Plant Improvement Act of 1976
Paap et al.56
Regulation after successful biological control
Taxa that are under permanent biological control might warrant a change in listing as no other control measures are required to prevent harmful impacts and so arguably their risk is no longer high.
A protocol is needed to determine how biocontrol and other successful control efforts should affect the listing of alien taxa.
At least 17 taxa are considered to have been brought under permanent control by the release of classical biological control agents.
Inclusion of synonyms in regulatory listings
Inclusion of regulatory groupings
Winzer et al.25 table 3 continued...
In ~100 cases, the listed taxon includes a synonym. Presumably this was based on the desire to reduce confusion due to changes in the nomenclature. However, the choice of which taxa to include synonyms for and which synonyms to include was not clear.
The regulations are split into several lists based on either a quasi-taxonomic grouping or on a combination of the quasi-taxonomic grouping and the realm in which the organism is found. Several taxa, however, are found in more than one realm.
The same process is used for the Prince Edward Islands (PEIs) as for mainland South Africa Currently the NEM:BA A&IS Lists do not have a separate list or regulatory processes for the PEIs. However, the risks and management options are substantially different from the mainland. Management in practice will be defined by the PEIs Management Plan.
Keep the regulatory name verbatim as the taxonomic backbone and add a separate column to the regulations that specifies common synonyms. This would ensure the lists are ‘tidy’ (sensu63), easier to work with, and retain links to previously used names.
A single ‘tidy’ list would allow for greater interoperability in the listing. Information on groupings could be retained as a different column that could allow for sorting and for multiple values to be incorporated.
Taxa to be managed on the PEIs should be listed in a separate process to that of the NEM:BA A&IS Regulations. For each alien taxon present on the PEIs, a decision should be taken to: (1) implement management with the goal of eradication; (2) implement maintenance management with the goal of reducing harmful impacts; or (3) not manage the alien population if it is not cost-effective to do so. Any new alien taxon found should be exterminated and a sample taken for identification purposes.
Acacia paradoxa DC. (= A. armata R.Br.) could be simply listed as Acacia paradoxa DC.
Wilson21
Amphibian | Bird | Freshwater fish | Marine fish | Freshwater invertebrates | Marine invertebrates | Terrestrial invertebrates | Mammal | Microbe | Marine plants | Terrestrial and freshwater plants | Reptile
Of the 13 taxa present in the PEIs listed under the NEM:BA A&IS Regulations, 9 have been subjected to some form of management. An additional two taxa which are not listed have been subject to management.
Department of Environment, Forestry and Fisheries64
...table 3 continues on next page
Volume 120| Number 5/6 May/June 2024 58 https://doi.org/10.17159/sajs.2024/17002 Review
The regulation of alien species in South Africa Page 10 of 14
Article
Bastos et al.57
Van Helden et al.58
Rambauli et al.59 , Hulme60
Prinsloo and Uys61 , Zachariades62
Fernández
table 3 continued...
Issue Description
Demonstrating the effectiveness of the regulations
It is not always clear if the regulations are being adhered to, and ultimately whether adhering to permit conditions is sufficient to keep invasions in check.
Proposal
An increased focus on targeted monitoring and evaluation of interventions will allow the regulations to become more adaptive and responsive.
Examples Key reference(s)
Various studies have evaluated the awareness of the regulations and how the lists have guided action. While there has been significant uptake and engagement with the permitting system (Figure 2), information is needed on the degree to which those who need permits are applying for permits or simply ignoring the regulations.
et al.65 , Shackleton and Shackleton66, Keet et al.67
The preeminence of common names over scientific names
Table 1 in the NEM:BA A&IS Lists specifies “Where the scientific name of any listed species changes or there is a spelling error in the scientific name, the common name of the species takes precedence and determines whether a particular species is listed or not.” However, common names are highly variable and very often not unique.
Discussion and conclusions
The scientific name takes legal precedence. The scientific names are checked against appropriate national and international taxonomic databases and updated periodically. If the nomenclature has changed, the scientific name is taken to be that of the revised nomenclature. If taxa are split or merged, the new taxa inherit the highest level of risk assigned to any corresponding taxa before the revision until such time as risk analyses specifically for the new taxa can be conducted.
Electric eels are listed as a single species, but in 2019 the group was split into three species. There is no evidence yet that the lineages differ in potential invasiveness.
The species Sus scrofa includes both domestic pigs and wild boar. Given the potential for the domesticated form to revert, the common names can be misleading.
Patterson et al.68, de Santana et al.69
The regulation of alien taxa in South Africa can be described as a gradual move from focusing on weeds, to broader efforts to limit damage to people and nature caused by alien plants, to a comprehensive and innovative regulatory framework that seeks to limit the harmful impacts of all alien taxa without unduly reducing benefits to South Africans. The current NEM:BA A&IS Lists thus provide a foundation needed for South Africa to meet its commitment to Target 6 of the GBF by 2030. We believe that the proposed process will make the system more proportionate, accountable, consistent, transparent, and targeted.70 The process also aims to make the regulation of alien taxa in South Africa credible, legitimate, and acceptable.
•Proportionate: the NEM:BA A&IS Regulations and Lists recognise that many alien taxa provide benefits, and exemptions are provided for. There is an attempt to balance a precautionary approach (e.g. on imports where prevention is desirable) against a pragmatic or in some cases ethical one (e.g. phasing taxa out). Provisions allow for research on biological invasions to continue and so ongoing projects have not been jeopardised (cf. Pietrzyk-Kaszyńska et al.71). The cost of the regulation (both to the government and to society) has not, however, been estimated.
•Accountable: all lists are subject to review by different government entities and published for public scrutiny before promulgation. With the development of the RAAT framework and use of the risk analyses, the evidence that informs decisions is clear. The permitting, complaints, and appeals processes are set out in the regulations, and the criteria for judging the performance of regulators and enforcers is partly set out (e.g. response times).
•Consistent: by working across taxa and realms, the ASRARP helps ensure risk analyses are consistent. Moreover, the RARC is intended to ensure governmental work is ‘joined-up’. As the process and timelines for making changes become clearer, affected stakeholders (e.g. the horticultural industry) will have greater certainty as to what might happen and when.
• Transparent: the lists are available to all, and, with the development of the RAAT framework, the process to derive the lists will be clearer. The risk analyses also ensure information is in a usable and accessible form, although the DFFE has requested that risk
analyses not be placed in the public domain until the RARC has had a chance to consider them. The names of the assessors who completed risk analyses are, however, redacted (in part as the product is the result of the work of both the assessors and ASRARP).
•Targeted: the NEM:BA A&IS Regulations and Lists have been modified over time based on experience17, although more information on monitoring the effectiveness of the regulations appears warranted.
•Credible: the original lists were developed with many of the top academics working on biological invasions in the country in consultation with affected stakeholders. The RAAT framework incorporates existing schemes for impact assessment72,73 – the first of which has been adopted by the UN following COP decision 15/27 on Invasive Alien Species (Annexes I to VI), and the pathway classification used by the CBD74. Risk analyses are routinely reviewed by national and international experts as well as working groups at the science–policy–management interface of biological invasions.75,76
• Legitimate: the development of the regulations is mandated in South African legislation, i.e. NEM:BA. More broadly, the regulations address both national imperatives and international obligations on biodiversity conservation (CBD) and trade (WTO). Neither the RAAT framework, ASRARP nor the RARC are explicitly mentioned in the regulations, although they could be in future. Training courses are not yet registered with SACNASP, but this is likely to be desirable in future.
•Acceptable: measures have been put in place to try to preserve the benefits of alien species while reducing the harmful impacts of invasions. Any regulation of biodiversity is inimical to some ethical perspectives77, but a clear distinction should be made between the rationale for regulation and evaluating the ethics of particular management interventions75
In summary, we believe that, while many issues still need to be resolved (Table 3), the regulation of alien species in South Africa has many desirable features. The challenge, as with many conservation issues, will continue to be to equitably balance the rights of the current
Volume 120| Number 5/6 May/June 2024 59 https://doi.org/10.17159/sajs.2024/17002 Review Article The regulation of alien species in South Africa Page 11 of 14
Cronin
generation with the rights of future generations. This will, we believe, require continued discussions, partnerships, and collaborations between scientists, policymakers, implementers, and those affected by the regulations.
Acknowledgements
The South African Department of Forestry, Fisheries and the Environment (DFFE) is thanked for funding, noting that this publication does not necessarily represent the views or opinions of DFFE or its employees. All past and current members of ASRARP are thanked for their input (see Supplementary table 4), as well as all external reviewers and assessors for assisting with the process. Ashlyn Padayachee, Barney Kgope, Carina Malherbe, Katelyn Faulkner, Khathutshelo Nelukalo, Livhuwani Nnzeru, Marthán Theart, Mlungele Nsikani, Philip Ivey, Tatenda Dalu, and two anonymous reviewers are thanked for comments and constructive discussions on earlier versions of the manuscript. Kim Daniels helped compile the lists of regulations and consolidate risk analysis reports. Pieter Winter assisted with nomenclatural queries. Ingrid Nänni provided valuable input on the history of the development of the lists. Finally, we thank our DFFE colleagues both for input on this manuscript and for being an integral part of developing the processes outlined here. We do not always agree, but it is a pleasure to work with them.
Competing interests
Both authors, through their roles with the South African National Biodiversity Institute (SANBI), were involved in setting up and running many of the processes outlined in the manuscript, specifically the Alien Species Risk Analysis Review Panel and the Risk Analysis of Alien Taxa framework. J.R.U.W. primarily, and S.K. to a lesser degree, have been involved in the analysis of this process as part of the report ‘The status of biological invasions and their management in South Africa in 2022’17
Authors’ contributions
J.R.U.W.: Conceptualisation, methodology, validation, data collection, sample analysis, data analysis, and led the writing. S.K.: Conceptualisation, methodology, validation, assisted with writing.
references
1. IPBES. Summary for policymakers of the thematic assessment report on invasive alien species and their control of the Intergovernmental SciencePolicy Platform on Biodiversity and Ecosystem Services. In: Roy HE, Pauchard A, Stoett P, Renard Truong T, Bacher S, Galil BS, et al. editors. Bonn: IPBES Secretariat; 2023. p. 41. https://doi.org/10.5281/zenodo.7430692
2. Seebens H, Blackburn TM, Dyer EE, Genovesi P, Hulme PE, Jeschke JM, et al. No saturation in the accumulation of alien species worldwide. Nat Commun. 2017;8, Art. #14435. https://doi.org/10.1038/ncomms14435
3. Diagne C, Leroy B, Gozlan RE, Vaissière A-C, Assailly C, Nuninger L, et al. High and rising economic costs of biological invasions worldwide. Nature. 2020;7, Art. #277. https://doi.org/10.1038/s41597-020-00586-z
4. Seebens H, Bacher S, Blackburn TM, Capinha C, Dawson W, Dullinger S, et al. Projecting the continental accumulation of alien species through to 2050. Glob Chang Biol. 2021;27(5):970–982. https://doi.org/10.1111/gcb.15333
5. McGeoch MA, Genovesi P, Bellingham PJ, Costello MJ, McGrannachan C, Sheppard A. Prioritizing species, pathways, and sites to achieve conservation targets for biological invasion. Biol Invasions. 2016;18(2):299–314. https://d oi.org/10.1007/s10530-015-1013-1
6. Convention on Biological Diversity. Aichi biodiversity targets [webpage on the Internet]. c2020 [cited 2024 Apr 09]. Available from: https://www.cbd. int/sp/targets/
7. Pagad S, Genovesi P, Carnevali L, Schigel D, McGeoch MA. Introducing the Global Register of introduced and invasive species. Sci Data. 2018;5, Art. #170202. https://doi.org/10.1038/sdata.2017.202
8. Convention on Biological Diversity. COP15: Final text of Kunming-Montreal global biodiversity framework [webpage on the Internet]. c2022 [cited 2024 Apr 09]. Available from: https://www.cbd.int/article/cop15-final-text-kunmin g-montreal-gbf-221222
9. Essl F, Latombe G, Lenzner B, Pagad S, Seebens H, Smith K, et al. The Convention on Biological Diversity (CBD)’s Post-2020 target on invasive alien species – what should it include and how should it be monitored? In: Wilson JR, Bacher S, Daehler CC, Groom QJ, Kumschick S, Lockwood JL, et al. editors. Frameworks used in invasion science. NeoBiota. 2020;62:99–121. https://doi.org/10.3897/neobiota.62.53972
10. García-de-Lomas J, Vilà M. Lists of harmful alien organisms: Are the national regulations adapted to the global world? Biol Invasions. 2015;17(11):3081–3091. https://doi.org/10.1007/s10530-015-0939-7
11. World Trade Organization. Understanding the WTO Agreement on sanitary and phytosanitary measures [webpage on the Internet]. c1998 [cited 2024 Apr 09]. Available from: https://www.wto.org/english/tratop_e/sps_e/spsun d_e.htm
12. Van Wilgen BW, Measey J, Richardson DM, Wilson JR, Zengeya TA. Biological invasions in South Africa: An overview. In: Van Wilgen BW, Measey J, Richardson DM, Wilson JR, Zengeya TA, editors. Biological invasions in South Africa. Invading Nature-Springer Series in Invasion Ecology. Vol. 14. Cham: Springer; 2020. p. 3–31. https://doi.org/10.1007/978-3-030-32394-3_1
13. Van Wilgen BW, Measey J, Richardson DM, Wilson JR, Zengeya TA. Biological invasions in South Africa. In: Simberloff D, editor. Invading Nature-Springer Series in Invasion Ecology. vol. 14. Cham: Springer; 2020. https://doi.org/10 .1007/978-3-030-32394-3
14. Lukey P, Hall J. Biological invasion policy and legislation development and implementation in South Africa. In: Van Wilgen BW, Measey J, Richardson DM, Wilson JR, Zengeya TA, editors. Biological invasions in South Africa. Invading Nature-Springer Series in Invasion Ecology. Vol. 14. Cham: Springer; 2020. p. 515–551. https://doi.org/10.1007/978-3-030-32394-3_18
15. Richardson DM, Foxcroft LC, Latombe G, Le Maitre DC, Rouget M, Wilson JR. The biogeography of South African terrestrial plant invasions. In: Van Wilgen BW, Measey J, Richardson DM, Wilson JR, Zengeya TA, editors. Biological invasions in South Africa. Invading Nature-Springer Series in Invasion Ecology. Vol. 14. Cham: Springer; 2020. p. 67–96. https://doi.org/10.1007/ 978-3-030-32394-3_3
16. Weyl OLF, Ellender BR, Wassermann RJ, Truter M, Dalu T, Zengeya TA, et al. Alien freshwater fauna in South Africa. In: Van Wilgen BW, Measey J, Richardson DM, Wilson JR, Zengeya TA, editors. Biological invasions in South Africa. Invading Nature-Springer Series in Invasion Ecology. Vol. 14. Cham: Springer; 2020. p. 153–183. https://doi.org/10.1007/978-3-030-32394-3_6
17. Zengeya TA, Wilson JR, editors. The status of biological invasions and their management in South Africa in 2022. Stellenbosch: South African National Biodiversity Institute, Kirstenbosch and DSI-NRF Centre of Excellence for Invasion Biology; 2023. https://doi.org/10.5281/zenodo.8217182
18. Bennett BM, van Sittert L. Historicising perceptions and the national management framework for invasive alien plants in South Africa. J Environ Manag. 2019;229:174–181. https://doi.org/10.1016/j.jenvman.2018.07.029
19. Wilson JRU, Faulkner KT, Rahlao SJ, Richardson DM, Zengeya TA, van Wilgen BW. Indicators for monitoring biological invasions at a national level. J Appl Ecol. 2018;55:2612–2620. https://doi.org/10.1111/1365-2664.13251
20. Zengeya TA, Wilson JR. The status of biological invasions and their management in South Africa in 2019. Stellenbosch: South African National Biodiversity Institute, Kirstenbosch and DSI-NRF Centre of Excellence for Invasion Biology; 2020. https://doi.org/10.5281/zenodo.3947613
21. Wilson JR. A list of taxa currently and historically regulated under South Africa’s National Environmental Management: Biodiversity Act, Alien & Invasive Species Regulations [data set]. Version v1.0(20240331). c2024 [cited 2024 Apr 09]. https://doi.org/10.5281/zenodo.10809766
22. South African National Biodiversity Institute (SANBI). Notices in the South Africa Government Gazette relevant to the NEM:BA A&IS regulations and lists. Version 1.1. 2023 July 18 [cited 2024 Apr 09]. https://dx.doi.org/10.5281/ zenodo.8176920
23. Wilson JRU, Ivey P, Manyama P, Nänni I. A new national unit for invasive species detection, assessment and eradication planning. S Afr J Sci. 2013;109(5/6), Art. #2012-0111. https://doi.org/10.1590/sajs.2013/2012 0111
24. Wilson JR, Panetta FD, Lindgren C. Detecting and responding to alien plant incursions. In: Usher MB, editor. Ecology, biodiversity and conservation. Cambridge: Cambridge University Press; 2017. p. 286. https://doi.org/10.10 17/CBO9781316155318
Volume 120| Number 5/6 May/June 2024 60 https://doi.org/10.17159/sajs.2024/17002 Review Article The regulation of alien species in South Africa Page 12 of 14
25. Fernández Winzer L, Greve M, le Roux PC, Faulkner KT, Wilson JR. Chapter 6: The status of biological invasions and their management in the Prince Edward Islands. In: Zengeya TA, Wilson JR, editors. The status of biological invasions and their management in South Africa in 2022. Stellenbosch: South African National Biodiversity Institute, Kirstenbosch and DSI-NRF Centre of Excellence for Invasion Biology; 2023. p. 75–100.
26. Henderson L, Wilson JRU. Changes in the composition and distribution of alien plants in South Africa: An update from the Southern African Plant Invaders Atlas (SAPIA). Bothalia: Afr Biodivers Conserv. 2017;47, Art. #a2142. https://doi.org/10.4102/abc.v47i2.2172
27. Faulkner KT, Robertson MP, Rouget M, Wilson JRU. A simple, rapid methodology for developing invasive species watch lists. Biol Conserv. 2014;179:25–32. https://doi.org/10.1016/j.biocon.2014.08.014
28. Roy HE, Bacher S, Essl F, Adriaens T, Aldridge DC, Bishop JDD, et al. Developing a list of invasive alien species likely to threaten biodiversity and ecosystems in the European Union. Glob Chang Biol. 2019;25(3):1032–1048. https://doi.org/10.1111/gcb.14527
29. WoodfordDJ,RichardsonDM,MacIsaacHJ,MandrakNE,vanWilgenBW,Wilson JRU, et al. Confronting the wicked problem of managing biological invasions. NeoBiota. 2016;31:63–86. https://doi.org/10.3897/neobiota.31.10038
30. Novoa A, Le Roux JJ, Robertson MP, Wilson JRU, Richardson DM. Introduced and invasive cactus species – a global review. Aob Plants. 2015;7, Art. #plu078. https://doi.org/10.1093/aobpla/plu078
31. Novoa A, Richardson DM, Pyšek P, Meyerson LA, Bacher S, Canavan S, et al. Invasionsyndromes:Asystematicapproachforpredictingbiologicalinvasions and facilitating effective management. Biol Invasions. 2020;22:1801–1820. https://doi.org/10.1007/s10530-020-02220-w
32. Novoa A, Kaplan H, Kumschick S, Wilson JRU, Richardson DM. Soft touch or heavy hand? Legislative approaches for preventing invasions: Insights from Cactaceae in South Africa. Invasive Plant Sci Manag. 2015;8(3):307–316. https://doi.org/10.1614/IPSM-D-14-00073.1
33. Soouth African National Biodiversity Institute (SANBI). Permits issued in respect of South Africa’s National Environmental Management: Biodiversity Act’s alien and invasive species regulations over the period October 2014 –December 2022. Version 20230809. [cited 2024 Apr 09]. https://doi.org/10 .5281/zenodo.8229321
34. Saccaggi DL, Karsten M, Robertson MP, Kumschick S, Somers MJ, Wilson JRU, et al. Methods and approaches for the management of arthropod border incursions. Biol Invasions. 2016;18(4):1057–1075. https://doi.org/10.1007 /s10530-016-1085-6
35. SaccaggiDL,ArendseM,WilsonJRU,TerblancheJS.Contaminantorganisms recorded on plant product imports to South Africa 1994–2019. Sci Data. 2021;8(83):11. https://doi.org/10.1038/s41597-021-00869-z
36. Kumschick S, Foxcroft LC, Wilson JR. Analysing the risks posed by biological invasions to South Africa. In: Van Wilgen BW, Measey J, Richardson DM, Wilson JR, Zengeya TA, editors. Biological invasions in South Africa. Invading Nature-Springer Series in Invasion Ecology. Vol 14. Cham: Springer; 2020. p. 573–595. https://doi.org/10.1007/978-3-030-32394-3_20
37. Kumschick S, Wilson JRU, Foxcroft LC. A framework to support alien species regulation: The Risk Analysis for Alien Taxa (RAAT). In: Wilson JR, Bacher S, Daehler CC, Groom QJ, Kumschick S, Lockwood JL, et al. editors. Frameworks used in invasion science.NeoBiota. 2020;62:213–239. https://d oi.org/10.3897/neobiota.62.51031
38. Ivey PJ, Hill MP, Zachariades C. Advances in the regulation of weed biological control in South Africa. Afr Entomol. 2021;29(3):1060–1076. https://doi.org /10.4001/003.029.1060
39. Keller RP, Kumschick S. Promise and challenges of risk assessment as an approach for preventing the arrival of harmful alien species. Bothalia: Afr Biodivers Conserv. 2017;47(2), Art. #a2136. https://doi.org/10.4102/abc. v47i2.2136
40. Roy HE, Rabitsch W, Scalera R, Stewart A, Gallardo B, Genovesi P, et al. Developing a framework of minimum standards for the risk assessment of alien species. J Appl Ecol. 2018;55(2):526–538. https://doi.org/10.1111/1 365-2664.13025
41. South African National Biodiversity Institute (SANBI). The Alien Species Risk Analysis Review Panel (ASRARP) [webpage on the Internet]. No date [cited 2024 Apr 09]. Available from: https://www.sanbi.org/biodiversity/building-k nowledge/biodiversity-monitoring-assessment/biological-invasions/the-alie n-species-risk-analysis-review-panel-asrarp/
https://doi.org/10.17159/sajs.2024/17002 Review Article
42. Canavan S, Richardson DM, Le Roux JJ, Kelchner SA, Wilson JRU. The status of alien bamboos in South Africa. S Afr J Bot. 2021;138(May):33–40. https:// doi.org/10.1016/j.sajb.2020.11.027
43. Jaca T, Mkhize V. Distribution of Iris pseudacorus (Linnaeus, 1753) in South Africa. BioInvasions Rec. 2015;4(4):249–253. https://doi.org/10.3391/bir.2 015.4.4.03
44. Novoa A, Shackleton R, Canavan S, Cybèle C, Davies SJ, Dehnen-Schmutz K, et al. A framework for engaging stakeholders on the management of alien species. J Environ Manag. 2018;205(1):286–297. https://doi.org/10.1016/j .jenvman.2017.09.059
45. Zengeya T, Ivey P, Woodford DJ, Weyl O, Novoa A, Shackleton R, et al. Managing conflict-generating invasive species in South Africa: Challenges and trade-offs. Bothalia: Afr Biodivers Conserv. 2017;47(2), Art. #a2160. https://doi.org/10.4102/abc.v47i2.2160
46. Scholes RJ, Schreiner GO, Snyman-Van der Walt L. Scientific assessments: Matching the process to the problem. Bothalia: Afr Biodivers Conserv. 2017;47(2), Art. #a2144. https://doi.org/10.4102/abc.v47i2.2144
47. Nelufule T, Robertson MP, Wilson JRU, Faulkner KT. An inventory of nativealien populations in South Africa. Sci Data. 2023;10(1), Art. #213. https://d oi.org/10.1038/s41597-023-02119-w
48. Faulkner KT, Robertson MP, Wilson JRU. Stronger regional biosecurity is essential to prevent hundreds of harmful biological invasions. Glob Chang Biol. 2020;26(4):2449–2462. https://doi.org/10.1111/gcb.15006
49. Mabin CA, Wilson JRU, Robinson TB. The Chilean black urchin, Tetrapygus niger (Molina, 1782) in South Africa: Gone but not forgotten. BioInvasions Rec. 2015;4(4):261–264. https://doi.org/10.3391/bir.2015.4.4.05
50. Matthys CK. The development of a protocol for declaring alien species absent from South Africa [M Cons Sci thesis]. Cape Town: Cape Peninsula University of Technology; 2024.
51. Vimercati G, Kumschick S, Probert AF, Volery L, Bacher S. The importance of assessing positive and beneficial impacts of alien species. In: Wilson JR, Bacher S, Daehler CC, Groom QJ, Kumschick S, Lockwood JL, et al. editors. Frameworks used in invasion science. NeoBiota. 2020;62:525–545. https://doi.org/10.3897/neobiota.62.52793
52. Vimercati G, Probert AF, Volery L, Bernardo-Madrid R, Bertolino S, Céspedes V, et al. The EICAT+ framework enables classification of positive impacts of alien taxa on native biodiversity. PLoS Biol. 2022;20(8), e3001729. https://d oi.org/10.1371/journal.pbio.3001729
53. Paterson ID, Breeÿen AD, Martin GD, Olckers T. An introduction to the fourth decadal review of biological control of invasive alien plants in South Africa (2011–2020). Afr Entomol. 2021;29(3):685–692. https://doi.org/10.4001/0 03.029.0685
54. Faulkner K. Chapter 1: Pathways. In: Zengeya TA, Wilson JR, editors. The status of biological invasions and their management in South Africa in 2022. Stellenbosch: South African National Biodiversity Institute, Kirstenbosch and DSI-NRF Centre of Excellence for Invasion Biology; 2023. p. 15–26. http://dx .doi.org/10.5281/zenodo.8217182
55. Datta A, Kumschick S, Geerts S, Wilson JRU. Identifying safe cultivars of invasive plants: Six questions for risk assessment, management, and communication. In: Wilson JR, Bacher S, Daehler CC, Groom QJ, Kumschick S, Lockwood JL, et al. editors. Frameworks used in invasion science. NeoBiota. 2020;62:81–97. https://doi.org/10.3897/neobiota.62.51635
56. Paap T, de Beer ZW, Migliorini D, Nel WJ, Wingfield MJ. The polyphagous shot hole borer (PSHB) and its fungal symbiont Fusarium euwallaceae: A new invasion in South Africa. Australas Plant Pathol. 2018;47(2):231–237. https:/ /doi.org/10.1007/s13313-018-0545-0
57. Bastos AD, Nair D, Taylor PJ, Brettschneider H, Kirsten F, Mostert E, et al. Genetic monitoring detects an overlooked cryptic species and reveals the diversity and distribution of three invasive Rattus congeners in south Africa. BMC Genet. 2011;12(1), Art. #26. https://doi.org/10.1186/1471-2156-12-26
58. Van Helden L, van Helden PD, Meiring C. Pathogens of vertebrate animals as invasive species: Insights from South Africa. In: Van Wilgen BW, Measey J, Richardson DM, Wilson JR, Zengeya TA, editors. Biological invasions in South Africa. Nature - Springer Series in Invasion Ecology. Vol. 14. Cham: Springer; 2020. p. 249–274. https://doi.org/10.1007/978-3-030-32394-3_10
59. Rambauli M, Antwi A, Mudau F. Investigating the strength of linkages of plant health institutional and legislative framework in South Africa. S Afr J Agric Ext. 2021;49(1):13–29. https://doi.org/10.17159/2413-3221/2021/v49n1a10774
Volume 120| Number 5/6 May/June 2024 61
The regulation of alien species in South Africa Page 13 of 14
60. Hulme PE. One Biosecurity: A unified concept to integrate human, animal, plant, and environmental health. Emerg Top Life Sci. 2020;4(5):539–549. htt ps://doi.org/10.1042/ETLS20200067
61. Prinsloo GL, Uys VM, editors. Insects of cultivated plants and natural pastures in southern Africa. Pretoria: Entomological Society of Southern Africa; 2015.
62. Zachariades C. A catalogue of natural enemies of invasive alien plants in South Africa: Classical biological control agents considered, released and established, exotic natural enemies present in the field, and bioherbicides. Afr Entomol. 2021;29(3):1077–1142. https://doi.org/10.4001/003.029.1077
63. Wickham H. Tidy Data. J Stat Softw. 2014;59(10):1–23. https://doi.org/10. 18637/jss.v059.i10
64. South African Department of Environment, Forestry and Fisheries. National Environmental Management: Biodiversity Act (Act No. 10 of 2004) Alien and Invasive Species Lists, 2020. Notice 1003 of 2020, no. 43726, 18 September 2020. Pretoria: Government Gazette; 2020. p. 31–77.
65. Cronin K, Kaplan H, Gaertner M, Irlich U, Hoffman MT. Aliens in the nursery: Assessing the attitudes of nursery managers to invasive species regulations. Biol Invasions. 2017;19(3):925–937. https://doi.org/10.1007/s10530-016-1 363-3
66. Shackleton CM, Shackleton RT. Knowledge, perceptions and willingness to control designated invasive tree species in urban household gardens in South Africa. Biol Invasions. 2016;18(6):1599–1609. https://doi.org/10.1007/s10 530-016-1104-7
67. Keet J-H, Datta A, Foxcroft LC, Kumschick S, Nichols GR, Richardson DM, et al. Assessing the level of compliance with alien plant regulations in a large African protected area. Biol Invasions. 2022;24(12):3831–3844. https://doi. org/10.1007/s10530-022-02883-7
68. Patterson DJ, Cooper J, Kirk PM, Pyle RL, Remsen DP. Names are key to the big new biology. Trends Ecol Evol. 2010;25(12):686–691. https://doi.org/10 .1016/j.tree.2010.09.004
69. De Santana CD, Crampton WGR, Dillman CB, Frederico RG, Sabaj MH, Covain R, et al. Unexpected species diversity in electric eels with a description of the strongest living bioelectricity generator. Nat Commun. 2019;10, Art. #4000. https://doi.org/10.1038/s41467-019-11690-z
70. Better Regulation Task Force. Annex B of Regulation – less is more, reducing burdens, improving outcomes. London: Cabinet Office Publications & Publicity Team; 2005. p. 68.
71. Pietrzyk-Kaszyńska A, Olszańska A, Najberek K, Maciaszek R, Solarz W. What starts with laughter ends in tears: Invasive alien species regulations should not hinder scientific research. Conserv Lett. 2024;1, e12986. https:// doi.org/10.1111/conl.12986
72. Blackburn TM, Essl F, Evans T, Hulme PE, Jeschke JM, Kühn I, et al. A unified classification of alien species based on the magnitude of their environmental impacts. PLoS Biol. 2014;12(5), e1001850. https://doi.org/10.1371/journa l.pbio.1001850
73. Bacher S, Blackburn TM, Essl F, Genovesi P, Heikkilä J, Jeschke JM, et al. Socio-economic impact classification of alien taxa (SEICAT). Methods Ecol Evol. 2018;9(Jan):159–168. https://doi.org/10.1111/2041-210X.12844
74. Harrower CA, Scalera R, Pagad S, Schönrogge K, Roy HE. Guidance for interpretation of CBD categories on introduction pathways. Technical note prepared by IUCN. Brussels: European Commission; 2017. p. 100. https:/ /www.cbd.int/doc/c/9d85/3bc5/d640f059d03acd717602cd76/sbstta-22-in f-09-en.pdf
75. Davies SJ, Bell JA, Impson D, Mabin C, Meyer M, Rhoda C, et al. Coordinating invasive alien species management in a biodiversity hotspot: The CAPE Invasive Alien Animals Working Group. Bothalia: Afr Biodivers Conserv. 2020;50(1), Art. #a10. https://doi.org/10.38201/btha.abc.v50.i1.10
76. Foxcroft LC, van Wilgen BW, Abrahams B, Esler KJ, Wannenburgh A. Knowing-doing continuum or knowing-doing gap? Information flow between researchers and managers of biological invasions in South Africa. In: Van Wilgen BW, Measey J, Richardson DM, Wilson JR, Zengeya TA, editors. Biological invasions in South Africa. Nature - Springer Series in Invasion Ecology. Vol. 14. Cham: Springer; 2020. p. 831–853. https://doi.org/10.100 7/978-3-030-32394-3_28
77. Latombe G, Lenzner B, Schertler A, Dullinger S, Glaser M, Jarić I, et al. What is valued in conservation? A framework to compare ethical perspectives. NeoBiota. 2022;72:45–80. https://doi.org/10.3897/neobiota.72.79070
Volume 120| Number 5/6 May/June 2024 62 https://doi.org/10.17159/sajs.2024/17002
The regulation of alien species in South Africa Page 14 of 14
Review Article
AuthorS: Eckhart Buchmann1 Junior Gabela2 Adrian Koopman3 Sakhamuzi Mhlongo4 Themba Mthembu5 Roger Porter6 Nandi Thobela7 Noleen S. Turner8
AFFILIAtIoNS:
1School of Clinical Medicine, University of the Witwatersrand, Johannesburg, South Africa
2Self-employed community bird guide, KwaDukuza, South Africa
3School of Arts, College of Humanities, University of KwazuluNatal, Pietermaritzburg, South Africa
4Self-employed community bird guide, Eshowe, South Africa
5Self-employed community bird guide, St Lucia, South Africa
6Retired from Ezemvelo KZN Wildlife, Pietermaritzburg, South Africa
7BirdLife South Africa, Johannesburg, South Africa
8School of Arts, College of Humanities, University of KwaZuluNatal, Durban, South Africa
CorrESPoNDENCE to: Eckhart Buchmann
EMAIL:
Eckhart.Buchmann@wits.ac.za
DAtES:
received: 22 May 2023
revised: 18 Mar. 2024
Accepted: 25 Mar. 2024
Published: 28 May 2024
hoW to CItE:
Buchmann E, Gabela J, Koopman A, Mhlongo S, Mthembu T, Porter R, et al. The end of the beginning: Establishing isiZulu names for all bird species recorded in South Africa.
S Afr J Sci. 2024;120(5/6), Art. #16184. https://doi.org/10.17159/sa js.2024/16184
ArtICLE INCLuDES:
☒ Peer review
☐ Supplementary material
DAtA AVAILABILItY:
☐ Open data set
☐ All data included
☒ On request from author(s)
☐ Not available
☐ Not applicable
EDItorS: Chrissie Boughey
Nkosinathi Madondo
KEYWorDS:
bird names, indigenous African languages, South African birds, terminology development, isiZulu nomenclature
FuNDING:
BirdLife South Africa
The end of the beginning: Establishing isiZulu names for all bird species recorded in South Africa
Terminology development is needed for effective science communication, planning, teaching, and learning in indigenous African languages. This need includes species-specific names in indigenous languages for wild birds, which are key indicators of biodiversity and the state of the environment. We report here the successful allocation of isiZulu names to all South African bird species, focusing on the final phase of naming species that are unknown or rare in KwaZulu-Natal Province (traditional home of the Zulu people) and thus have no indigenous naming history. We applied principles and procedures used previously for naming species known in KwaZulu-Natal: (1) reference to early bird books, dictionaries and other literature; (2) in-person workshops that included isiZulu language academics, professional Zulu bird guides, and birders; and (3) linguistic strategies to apply Zulu folk taxonomy to scientific ordering of species. At a three-day in-person workshop, we named 327 species unknown or vagrant in KwaZulu-Natal. Much time was spent on allocating cluster names to locally unfamiliar bird groupings such as tropicbirds, gadfly petrels, sandgrouse, and wheatears. The most frequent linguistic strategy was coinage by extension, where previously established isiZulu cluster names, for example ujolwane for ‘sparrow’, were extended by species qualifiers, as in ujolwanomkhulu (sparrow that is great) for Great Sparrow (Passer motitensis) True coinage was also used, as in unothingo (‘rainbow’) for African Pitta (Pitta angolensis). The resulting catalogue of isiZulu names for all 876 South African species completes the terminology development phase to facilitate engagement of isiZulu in science and conservation involving birds.
Significance:
• In an inclusive, stepwise and evaluative process, isiZulu names have been allocated to all wild bird species occurring in South Africa.
•A template is provided for naming bird species in southern African indigenous languages, using established indigenous names and coined names.
•Matters of biodiversity conservation involving birds can now be better communicated in isiZulu, with benefit to the environment and human communities.
Introduction
The Zulu language (isiZulu) has for long recognised the familiar Cape Sparrow (Passer melanurus) as undlunkulu.1 Yet, until recently, three other sparrow species known in the KwaZulu-Natal Province (KZN) did not have unique, or species-specific, names. The House Sparrow (Passer domesticus), Southern Grey-headed Sparrow (Passer diffusus) and Yellow-throated Petronia (Gymnoris superciliaris) were known generically, or lumped, as ujolwane, and even as the English-derived transliterated isipero 2 Maclean, in the introduction to the fifth edition of Roberts’ Birds of Southern Africa writes3:
Bird names in the African languages present far more problems than in the Europeanderived languages. Many of them are generic (i.e. all species of sparrow may have the same name), others are regionally limited in application, one name may be applied to two or more different birds, some well-known birds may have more than one name in a single language, and so on. Most bird species have no African names at all.
In folk taxonomy, as opposed to scientific Linnaean taxonomy, species as a unit do not necessarily matter and most are not uniquely named. It is sufficient to call a bird simply a ‘sparrow’ in English folk taxonomy, or ujolwane in Zulu folk taxonomy. But in scientific discourse and in pursuits in which particular birds are subjects of interest, species do matter. Changes in the abundance and distribution of birds are important indicators of biodiversity loss4, the latter highlighted in the United Nations’ Sustainable Development Goal 155. With the recent exceptions of Kiswahili in Tanzania6 and Sesotho in Lesotho7,8, indigenous sub-Saharan African languages do not have comprehensive terminologies or naming systems to distinguish bird species. It is difficult to report research or issues on biodiversity in languages that lack naming systems translatable from English, which then retains its colonial hegemony in scientific communication. There is a growing call to elevate indigenous African languages, and particularly isiZulu, to become languages of teaching and learning in sciences and humanities at universities.9,10 This requires “terminology creation and … a broadening of the African voice in disciplines where teaching and learning previously took place only through the medium of English”11. African languages can develop and adapt scientific terminologies, with the potential to increase acceptance of science in African communities.12 This would apply in isiZulu as the mother tongue of many millions of South Africans, not only in KZN, but also in Gauteng Province. An output of terminology creation for non-avian animals is the Zululand Frog Guide13, in which 58 species of frogs received isiZulu names, many from a base of indigenous folk taxonomy14. This extension of decolonised methodologies into language planning shows that it is possible to develop life sciences materials in African
63 https://doi.org/10.17159/sajs.2024/16184 Volume 120| Number 5/6 May/June 2024 © 2024. The
Published under a Creative Commons Attribution Licence. Research
Author(s).
Article
languages. Conservation efforts and community awareness may thus be enhanced, contributing positively to avoiding or minimising threats to biodiversity conservation.14 A study in high schools in KZN showed that code switching (alternating) between English and isiZulu during biology classes improved attitudes of students to biology, “an important subject towards understanding environmental and conservation issues”15
In line with the imperatives described above, we set out to establish isiZulu names for all species of wild birds found in South Africa, as listed in BirdLife South Africa’s 2022 Checklist.16 This was an extension of earlier work by our group that produced a comprehensive set of names for all species found in KZN.17,18 Here we describe our methodology and outputs, including necessary summaries of the onomastic foundations and our group’s earlier work.
Foundations: Bird names based on Zulu oral traditions of bird knowledge
Over centuries, Zulu people and their forebears interacted with wild birds, as food, as pests, but also as objects of beauty, and as sources of feathers and plumes for status and ceremonial regalia. Birds feature as metaphors in praises, proverbs and riddles, in charms and as symbols of portent.19 The most substantial early published contributions on isiZulu names for species of birds appear in two sources. The first is the English book Natal Birds, published by the Woodward brothers in 189920, which gives isiZulu names for 107 of 386 species described. The other is Bryant’s Zulu-English Dictionary21, which lists 211 bird names, some of which are for species, such as uthekwane (Hamerkop Scopus umbretta) and others for bird groupings or clusters, like idada (duck) and inkonjane (swallow). A half-century later, the dictionary of Doke and Vilakazi listed 388 names for birds.22 Austin Roberts, in a lecture prior to publishing The Birds of South Africa in 1940, expressed his concern that indigenous African bird names were being lost. His reason for including bird names of the various southern African communities in the book was to encourage efforts to “record them more completely” by birders and language scholars.23 However, the Roberts Birds of Southern Africa series contributed significantly to isiZulu names only in the fifth edition in 1985, where the author Maclean enlisted the help of African language consultants and included 258 species names in isiZulu.3 These and other sources are extensively discussed elsewhere.24,25
Table 1 lists examples of species with established indigenous isiZulu names. Most can be recognised, some with different spelling, from Natal Birds or Bryant’s dictionary. Names for clusters of birds that share certain characteristics are well known in English – ducks, eagles, owls, and so on. IsiZulu is no different (Table 2). Clearly, the long relationship of Zulu people with birds gave rise to robust names that identify some birds at what we now know to be species level, but more at cluster level. The result is a database of established names founded on indigenous knowledge, as obtained from early bird books and dictionaries. This database laid the foundations upon which isiZulu names could be established for all bird species in KZN, and then in South Africa.
Local knowledge: isiZulu names for all species in KwaZulu-Natal
In 2011, BirdLife South Africa (BLSA) approached one of the authors (N.S.T.) regarding the need for a comprehensive list of isiZulu names for all species of birds in KZN. The aim was to address Maclean’s concern that there were many names for one bird, one name for many birds, and many birds with no name.3 The process that unfolded is described in detail elsewhere.17-19 Here we provide a necessary summary of the procedures and principles resulting in isiZulu names for all species found in KZN, in five phases.
Phase 1: Review of literature
Authors A.K. and N.S.T. searched the literature to establish, as extensively as possible, all published isiZulu bird names in bird guides, dictionaries, and other sources. Important sources were Natal Birds20, the fifth edition of Roberts’ Birds of Southern Africa3, and the dictionaries of Bryant21 and Doke and Vilakazi22
table 1: Examples of bird species with established isiZulu names
IsiZulu nameEnglish nameScientific name
ilanda Western Cattle Egret Bubulcus ibis
inkwazi African Fish Eagle Haliaeetus vocifer uphalane Egyptian Vulture Neophron percnopterus intinginono Secretarybird Sagittarius serpentarius
isiphungumangathi Long-crested Eagle Lophaetus occipitalis iseme Denham’s Bustard Neotis denhami
indwe Blue Crane Grus paradisea unohemu Grey Crowned Crane Balearica regulorum
ufukwe Burchell’s Coucal Centropus burchellii uphezukomkhono Red-chested Cuckoo Cuculus solitarius insingizi Southern Ground-hornbill Bucorvus leadbeateri
inhlekabafazi Green Wood-hoopoe Phoeniculus purpureus
iqola Southern Fiscal Lanius collaris
iphothwe Dark-capped Bulbul Pycnonotus tricolor isomi Red-winged Starling Onychognathus morio
table 2: Examples of groupings (clusters) of birds with established isiZulu names
IsiZulu cluster nameEnglish cluster name idada duck iseme bustard inqe vulture ukhozi eagle isikhova owl isigqobhamithi woodpecker inkonjane swallow umunswi thrush incwincwi sunbird
ujolwane sparrow
Phase 2: First series of workshops with Zulu bird guides
A three-day workshop was held at Phinda Private Game Reserve in 2013, attended by authors N.S.T., A.K. and 12 professional Zulu bird guides from various parts of KZN. The guides were considered knowledgeable on isiZulu bird names, with most coming from rural backgrounds, raised in herding and hunting traditions with time spent in the presence of elders. N.S.T. and A.K. were at the time active professors and lecturers in linguistics and onomastics in the Zulu Department at the University of KwaZulu-Natal, with N.S.T. also an enthusiastic birder. The workshop involved sequential presentation of clusters of species using projected images and videos, and playback of recorded vocalisations. The birds’ habits, diet and other salient features were discussed. Author A.K. assisted with information on published isiZulu bird names. For some species, well-known isiZulu names already existed, and were confirmed. Where none existed, names had to be coined. By the end of the workshop, almost one-third of KZN’s bird species had received
Volume 120| Number 5/6 May/June 2024 64 https://doi.org/10.17159/sajs.2024/16184 Research
bird names for South Africa Page
8
Article Establishing isiZulu
2 of
provisional isiZulu names. Two further workshops were held in 2014 and 2015 with a reduced but engaged core of five Zulu bird guides. All 549 species occurring in KZN received names. The 549 species received a total of 610 isiZulu names, of which 164 (27%) had previously appeared in bird books, and 373 (61%) were coined. The linguistic strategies are outlined in Table 3. Most coinages were by extension (n = 210) or adaptation (n = 142). Sixty coined names originated from dictionary entries or the workshop participants’ personal knowledge.18 Each hour of work produced an average of eight to nine isiZulu bird names; of critical importance was the use of linguistic strategies, depending on whether established isiZulu names existed for the species under discussion. Where an established name existed, this was confirmed, extended, or adapted. With no established species or cluster name, coinage was required.17 The morphology of names with associated grammatical devices follows ‘linguistic underpinning’ detailed elsewhere.26
Phase 3: Interrogation of information obtained after the workshops
A further mini-workshop was held, with two Zulu bird guides attending, to discuss problems that arose during analysis of notes taken during the first series of workshops. A refined proceedings document was then passed to author R.P. (retired wildlife ecologist and birder), who identified omissions, errors, inconsistencies, and unsuitable names, which would all need correction and further discussion.
Phase 4: Second series of workshops for correction and finalisation
The corrections identified in Phase 3 were raised and resolved at three workshops, two in 2017 and one in 2018. Discussions were at times lengthy, with challenging examples being appropriate cluster names for different hawks and falcons, and a rearrangement of kingfisher names, as described in detail elsewhere.19 By the end of these workshops, a total of 18 professional Zulu bird guides had contributed since 2013 to naming birds known from KZN.
Phase 5: Compilation and publication
Combining all information from the two sets of workshops, a master database of isiZulu bird names for KZN was compiled with linguistic
table 3: Linguistic strategies to allocate isiZulu names to bird species
IsiZulu bird name statusLinguistic
Established isiZulu bird name or names exist for a species or species cluster
No known established isiZulu name for a cluster, species, or species in a related cluster: requires coinage
notes, semantic backgrounds, and historical and cultural references. The project output appears in two peer-reviewed articles17,26, a scholarly book Amagama Ezinyoni: Zulu Names of Birds18, and an illustrated field guide Roberts Birds of KwaZulu-Natal and their Zulu Names1
the end of the beginning: isiZulu names for all South African birds
In 2021, a group of language academics and BLSA ornithologists set up a collaboration for assigning names to bird species in seven indigenous official languages. This became known first as INSAB (Indigenous Names for South African Birds), now SANSAB (South African Names for South African Birds). The group recognised the advanced state of progress on isiZulu names in KZN and suggested that isiZulu names could relatively easily be allocated to all South African bird species. Consequently, BLSA secured funding, and three professional Zulu bird guides who had been strong members of the 2013–2018 isiZulu bird name workshops (authors J.G., S.M. and T.M.) agreed to assist.
We scheduled a three-day workshop for August 2022 in Umhlanga near Durban, with the aim of allocating isiZulu names to all 327 species of South African birds unknown or vagrant in KZN, and thus not discussed in the 2013–2018 workshops. In addition to the three bird guides, our group included A.K., N.S.T., R.P., also N.Th. (BLSA’s Empowering People Programme Manager, ensuring community focus) and E.B. (medical scientist and birder with knowledge of isiZulu).
Preparatory meetings to propose isiZulu bird names for approval
A spreadsheet of 327 South African bird species requiring isiZulu names was prepared and arranged in clusters along with the birds from KZN already named. At two preparatory meetings in Pietermaritzburg, A.K., R.P. and E.B. identified species for which isiZulu names could be provisionally coined, for approval by the bird guides at the workshop. The aim was strategic to ensure completion of the task at the workshop within the available time and funding. Of the 327 species listed, 165 were considered suitable for provisional naming. An example is the Great Sparrow, proposed as ujolwanomkhulu (‘sparrow that is great’). A creative proposal was usoqhawe (‘the brave warrior’) for the
Confirmation: accept as from source.Accept intinginono for Secretarybird Sagittarius serpentarius.
Selection and relegation: if two or more names are available, accept one or two, relegate others.
Redirection: Use relegated name from one species and allocate to a similar or related species that has no speciesspecific name.
Assignment: Use dictionary name for a suitable unidentified bird and allocate to a species that has no species-specific name.
Coinage by adaptation: Slightly alter an existing bird name (cluster or species), or other isiZulu word often using -no-, -ma-, -so- or -sa-.
Coinage by extension: Extend known name for a species cluster with a descriptive qualifier.
True coinage: make up a completely new name where no cluster or species-specific name exists.
Coinage by transliteration: Adopt a name from, for example, English, taking on phonological characteristics in isiZulu, as in ushizi for ‘cheese’.
Accept ingqungqulu, relegate indlamadoda, for Bateleur Terathopius ecaudatus.
Redirect lesser known and relegated name unowanga for White Stork Ciconia ciconia to become name for Black Stork Ciconia nigra.
Assign unoxhongo (‘species of heron’22) to Purple Heron Ardea purpurea.
Adapt cluster name for ‘thrush’ umunswi to umunswili for Olive Thrush Turdus olivaceus and to inswinswi for Orange Ground Thrush Geokichla gurneyi.
Extend cluster name for ‘sparrow’ ujolwane to ujolwane wekhaya (‘sparrow of home’) for House Sparrow Passer domesticus.
Coin insukakude (‘come from far away’) for long-distance migrant Arctic Tern Sterna paradisaea.
This strategy was deliberately avoided in the workshops. No species or cluster names were coined using transliteration.a
aEstablished transliterated isiZulu words were considered acceptable, for example, the name inkonjane yaseYurobhu (‘swallow from Europe’) was coined for Barn Swallow, Hirundo rustica.
Volume 120| Number 5/6 May/June 2024 65 https://doi.org/10.17159/sajs.2024/16184 Research Article
South
8
Establishing isiZulu bird names for
Africa Page 3 of
strategyExample
White-browed Sparrow-weaver (Plocepasser mahali). The specific epithet mahali, a misspelling of the Setswana mohali (‘great warrior’), appears in Dr Andrew Smith’s original scientific species description from 1836. Eight hours of discussion at the preparatory meetings resulted in 147 proposals for isiZulu bird names, with no consensus on names for 18 species. The remaining 162 species (making up the total of 327) included clusters of birds that had no isiZulu names, for example skimmers and sandgrouse, and pelagic birds such as phalaropes, tropicbirds, jaegers, mollymawks, boobies and frigatebirds. Also not suitable for name proposals were albatrosses, petrels, storm petrels, shearwaters and prions (together 51 species), to which only cluster names had been given at the 2013–2018 workshops. Another difficult
Establishing isiZulu bird names for South Africa
Page 4 of 8
group was wading birds, with 22 species including plovers, sandpipers, godwits and stints having no obviously applicable cluster names.
Workshop to allocate isiZulu names to birds not known in KwaZulu-Natal
Using the same methodology and linguistic strategy as the 2013–2018 workshops (Table 3), and working for 18 hours over three days, we allocated isiZulu names to all 327 species. Of the 147 names proposed at the preparatory meeting, 83 (56%) were accepted exactly as proposed. Twenty-six (18%) were accepted after minor changes, for example iseme laseKapa (‘bustard of the Cape’) instead of iseme saseKapa, for
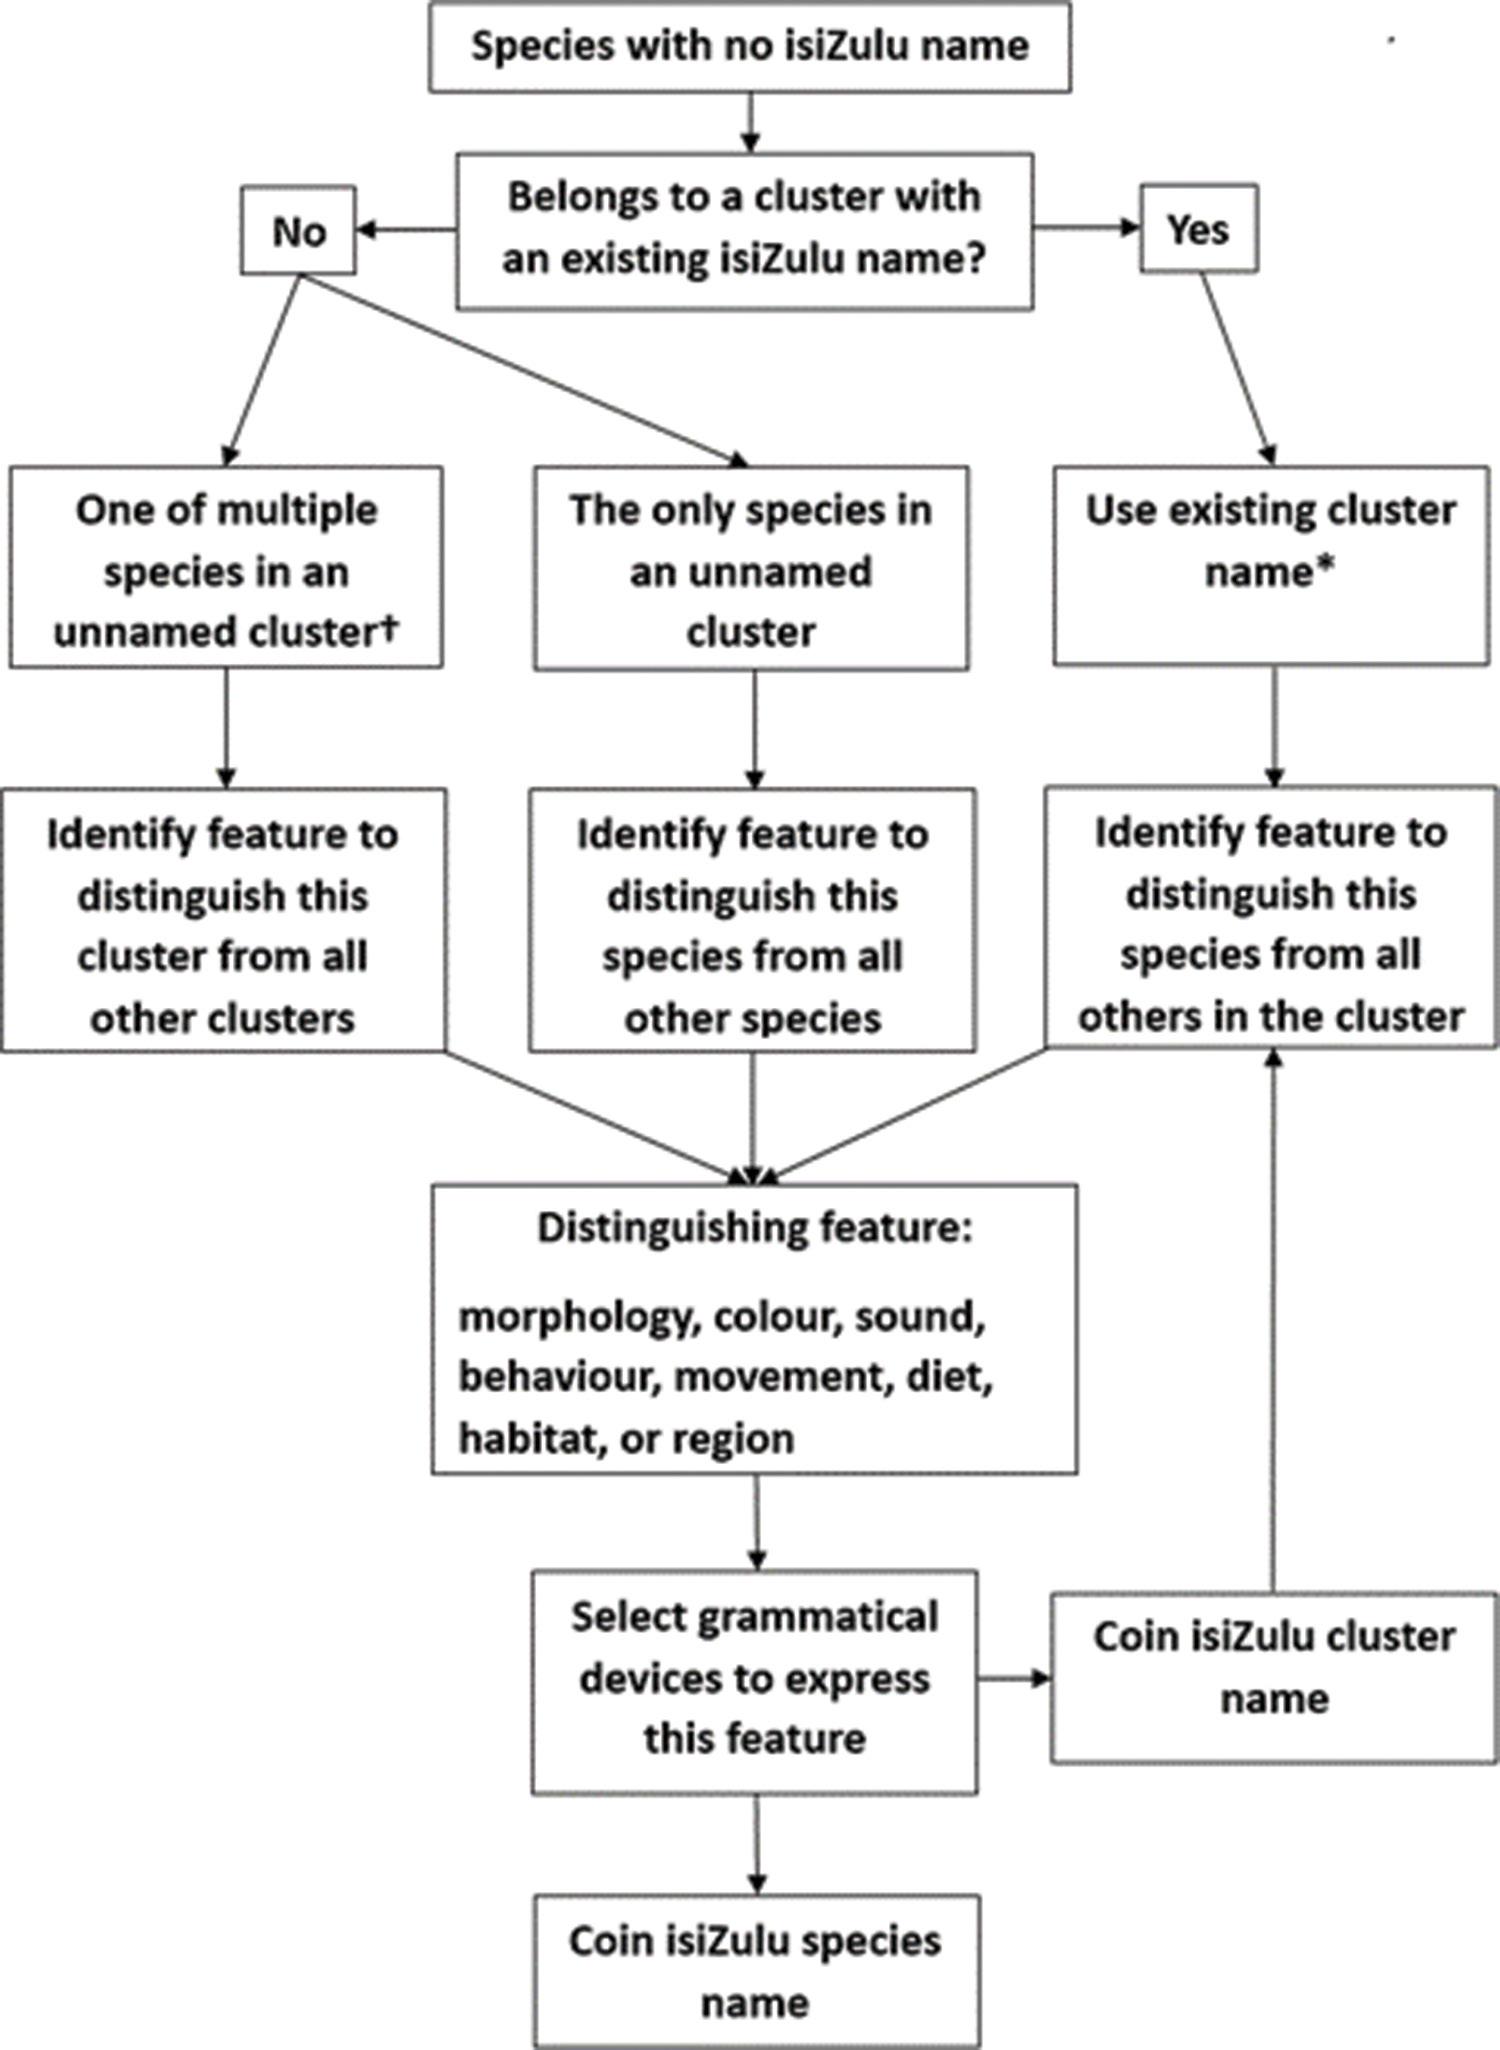
*Example: Ludwig’s Bustard (Neotis ludwigii). Yes, belongs to bustard cluster with existing isiZulu name iseme → feature is arid habitat → use possessive locative → coin name iseme lasehlane (‘bustard of the desert’).
†Example: Red Phalarope (Phalaropus fulicarius). No existing isiZulu cluster name for phalarope → one of multiple species in unnamed cluster → feature is feeding by turning in one spot to agitate water → reduplicate verb jika (‘turn around’) with prefix -no- to affirm as coined cluster name unojikajika → identify species distinguishing feature: red colour → qualify cluster name with adjective -bomvu (‘red’) to coin species name unojikajikobomvu
Volume 120| Number 5/6 May/June 2024 66 https://doi.org/10.17159/sajs.2024/16184 Research Article
Figure 1: Flow chart explaining isiZulu name coining.
the Southern Black Korhaan (Afrotis afra). Thirty-eight proposed names (26%) were rejected, with more suitable replacements suggested by the Zulu bird guides. The two examples mentioned earlier (Great Sparrow and White-browed Sparrow-weaver) were accepted exactly as proposed. The coining process is outlined in Figure 1, with two examples. Typically, for each cluster and species to be named, we identified a salient distinguishing feature and selected an appropriate grammatical device to express this feature: (1) bird morphology and colour, with noun + adjective compound, e.g. amehlabomvu (‘eyes that are red’), as in iphothwelimehlabomvu (‘bulbul with eyes that are red’) for African Red-eyed Bulbul (Pycnonotus nigricans); (2) voice: through onomatopoeia, metaphor or descriptive verb as in the cluster name for chanting goshawks uheshoculayo (‘goshawk that sings’); (3) movement or behaviour, by a suitable verb, as in inkwelamthini (‘climb in a tree’) for African Spotted Creeper (Salpornis salvadori); and (4) habitat or region, with possessive locative, for example wasehlane (‘of the desert’) as in uheshoculayo wasehlane (‘chanting goshawk of the desert’) for Pale Chanting Goshawk (Melierax canorus). The coining process was especially important in this workshop.
We coined cluster names for 17 bird clusters (Table 4). Thirteen were true coinages, with two adapted and two assigned. Unozulananyana (‘small albatross’) was adapted from unozulane (‘albatross’) for the mollymawk cluster, and unontilo (‘lark’) was adapted for three species of lark. We assigned ‘ikhwebula’ (‘species of bird’22) to the frigatebirds thanks to local knowledge of two of the Zulu bird guides. Ungqwashi (‘Rufous-naped lark’22) was assigned to a cluster of five lark species. Creative coinages included isela (‘thief’) for the kleptoparasitic jaegers, and inqeyolwandle (‘vulture of the ocean’) for the scavenging giant petrels.
The 327 species names included 299 coinages by extension (91%), as in the example of the Great Sparrow. One species name was the result of redirection. This was isikhobotho saseSahel (‘Jackal Buzzard of the
Sahel’) for the Red-necked Buzzard (Buteo auguralis). Isikhobotho is used in some parts of KZN for the Jackal Buzzard (Buteo rufofuscus), but at the 2013–2018 workshops the name was relegated in favour of the better known inhlandlokazi. One species name was by assignment. The name uhhuye (‘South African Lark’22) was given to the Fawn-coloured Lark (Calendulauda africanoides). Twenty-three species names (7%) were true coinages (Table 5). Seven of these names also became cluster names for related species, for example umqolomhlophe (‘white rump’) for the Capped Wheatear (Oenanthe pileata), with Northern Wheatear (Oenanthe oenanthe) becoming umqolomhlophe waseYurobhu (‘white rump from Europe’). ‘White rump’ for wheatears is historically appropriate as the English cluster name derives from the Anglo-Saxon hvit earse (‘white arse’). We frequently used directional or geographic qualifiers, with the four cardinal directions featuring in 40 names (12%), as in Northern Rockhopper Penguin (Eudyptes moseleyi) becoming inguzeqamatshe yaseNyakatho (‘penguin hopping on rocks, of the north’). Place, island or continental qualifiers were used in 52 names (16%), such as inkotha yaseMadagascar (‘bee-eater from Madagascar’) for Olive Bee-eater (Merops superciliosus). More creative coinages included unothingo (‘the rainbow’) for the colourful African Pitta (Pitta angolensis), and isanyendle (‘like a cricket’) for Barred Wren-Warbler (Calamonastes fasciolatus), which has a cricket-like call. The difficulty with cluster names for waders was solved in part by assigning unothwayiza (‘of walking with long swinging steps’), the name of the Marsh Sandpiper (Tringa stagnatilis), to nine other sandpipers and stints. An example is unothwayiza waseMelika (‘-of America’) for Baird’s Sandpiper (Calidris bairdii)
Our raw output from the workshop was a spreadsheet of 876 South African bird species, including 8 found on the Prince Edward Islands, but not on the South African mainland. None of the isiZulu names allocated in the 2013–2018 workshops were altered. The list was forwarded to BLSA with an accompanying report and placed on their website for the duration of 2023, for open peer review and public comment. During the year, our group made corrections and added names for several species newly
table 4: New isiZulu names for clusters (groupings of related species) not well known in KwaZulu-Natal
‘like a gannet’booby
to ‘bird’s tail’tropicbird
to ‘rain’Caspian and golden plover3
to ‘sweeping up’skimmer
to ‘brown’noddy
to ‘desert’sandgrouse
to ‘black throat’tit
unontilo to ‘lark’lark
uqolomhlophe ‘white rump’wheatear
usoqhawe to ‘brave warrior’buffalo weaver and sparrow-weaver2
aThe name-forming prefixes -no- and -so- allow reference to salient characteristics to make up a name.
bikhwebula coined for frigatebirds was based on local knowledge of Zulu bird guides at the workshop; in dictionary, listed only as ‘species of bird’ 22
Volume 120| Number 5/6 May/June 2024 67 https://doi.org/10.17159/sajs.2024/16184 Research
names for South Africa Page
8
Article Establishing isiZulu bird
5 of
species unozulanyana
10 inqeyolwandle
petrel 2 unontweza
6 isasicibamanzi
3 unosisila
3 ivuka ‘rising
up’grebe 2 ikhwebula
2
unokhukhula
2 unonsundu
2
3 unogwadule
4
2
5
3
3
IsiZulu cluster namereferencea or translationEnglish cluster name(s)Number of
to ‘small albatross’mollymawk
‘vulture of the ocean’giant
to ‘gliding’ or ‘sailing’gadfly petrel
up, bobbing
unknownb frigatebird
unomvula
isela ‘thief’jaeger
unongilenyama
ungqwashi ‘lark’lark
table 5: True coinages of isiZulu species names for birds not known from KwaZulu-Natal
Coined species namereference or translationa English nameScientific name
igobakazi ‘great bend in neck’Mute Swan Cygnus olor unomaqhwa to ‘snow’Snowy Sheathbill Chionis albus umhloshana ‘whitish one’Lesser Sheathbill Chionis minor
unomvulab to ‘rain’Caspian Plover Charadrius asiaticus
unokhukhulab to ‘sweeping up’African Skimmer Rynchops flavirostris unonsundub to ‘brown’Brown Noddy Anous stolidus unogwaduleb to ‘desert’Namaqua Sandgrouse Pterocles namaqua
unothingo to ‘rainbow’African Pitta Pitta angolensis
unosichongo to ‘chest-band’Black-and-white Flycatcher Bias musicus unomqhelomhlophe to ‘white crown’Southern White-crowned Shrike Eurocephalus anguitimens
unonhlozi to ‘eyebrows’Rudd’s Lark Heteromirafra ruddi
unocingetsheni to ‘search on stone’Sclater’s Lark Spizocorys sclateri inkwelamthini ‘climb in a tree’African Spotted Creeper Salpornis salvadori isanyendle ‘like a cricket’Barred Wren-Warbler Calamonastes fasciolatus umqalamhlopheb ‘white throat’Common Whitethroat Curruca communis unongomabusuku to ‘song at night’Thrush Nightingale Luscinia luscinia uqolomhlophe ‘white rump’Capped Wheatear Oenanthe pileata inhlaletshenekhandalimhlophe ‘lives on rock, with a white head’Short-toed Rock Thrush Monticola brevipes unosidlekekazi to ‘huge nest’Sociable Weaver Philetairus socius usontshetshana to ‘little beard’Scaly-feathered Finch Sporopipes squamifrons unongilonegazi to ‘throat with blood’Cut-throat Finch Amadina fasciata
aThe name-forming prefixes -no- and -so- allow reference to salient characteristics to make up a name.
bThese species names appear also as cluster names in Table 3. As these species were considered the most distinctive, or the ‘default’ in their cluster, their names also became cluster names, with other species in the cluster taking on extensions. For example, with unonsundu the cluster name as well as the species-specific name of the Brown Noddy, the Lesser Noddy (Anous tenuirostris) took on the extended unonsundwana (‘small noddy’) as its species-specific name.
recorded in South Africa. An example is unohhala waseChile (‘storm petrel from Chile’) for Pincoya Storm Petrel (Oceanites pincoyae), a rare vagrant normally found off the coast of Chile. The isiZulu names are now fully recognised by the BLSA List Committee and are available on the BLSA website.27
Discussion
Every species of wild bird in South Africa now has a name in isiZulu. But in the larger process of decolonising scientific study and appreciation of birds, the production of this catalogue is just the beginning. Numerous opportunities beckon. The names are now available for discourse in life sciences at schools and universities where isiZulu is or will be a medium of instruction, even if just through code switching. Local and national isiZulu mass media, when engaging on topics relating to wildlife, will be able to use isiZulu bird names and thus refer to specific species. An example would be discussion on conservation in the Wakkerstroom area of southern Mpumalanga where the critically endangered Rudd’s Lark (Heteromirafra ruddi) has one of its last refuges. We expect that the local communities who speak isiZulu will find it easier to become enthusiastic about and own a species called unonhlozi than one with the distant and colonial-inspired ‘Rudd’s Lark’. Alternatively, the bird’s name would have to be ‘Zulu-ised’ (perhaps to i-Rudd’s Lark or ucilo kaRudd (‘Rudd’s Lark’)) or otherwise adjusted, or even unwittingly misrepresented. We may justifiably speculate that isiZulu-speaking people visiting conservation areas would notice birds more if they had
isiZulu names. The potential benefits for life sciences study, hobbies and biodiversity conservation are obvious, as observed in similar work in Tanzania.6
We have focused in this article on the naming of birds unknown in KZN – the final step in a protracted endeavour (Figure 2). The success of this final exercise, completed in less than a year, was entirely dependent on the process that started in 2013 at the first workshop in Phinda Private Game Reserve in KZN. The five phases of the 2013–2018 workshops project ensured stepwise and evaluative accumulation of information and data. The generation of isiZulu bird names depended on historical literature, scientific taxonomy, input of isiZulu language scholars, and specific linguistic strategies. But perhaps of greatest importance was the knowledge, insight and imagination of the Zulu bird guides, upon whose final approval each bird name rested. We can think of no better conduits for traditional and current oral knowledge of birds, and we consider this aspect of our work to be unique. While none of the birds unknown in KZN had a historical isiZulu name (with the possible exception of ikhwebula, the frigatebirds), we still ensured consistency with the linguistic strategy and traditional oral knowledge applied in the 2013–2018 workshops. We recognise that isiZulu is just one of the Nguni language group, a chain of dialects stretching from the Eastern Cape Province (isiXhosa) to Malawi and Tanzania. In search of Nguni commonalities in bird names, we considered the role of other languages, especially isiXhosa, drawing mainly on the exhaustive work of Godfrey28. Commonalities were few,
Volume 120| Number 5/6 May/June 2024 68 https://doi.org/10.17159/sajs.2024/16184 Research Article
Page
Establishing isiZulu bird names for South Africa
6 of 8
Establishing isiZulu bird names for South Africa Page 7 of 8
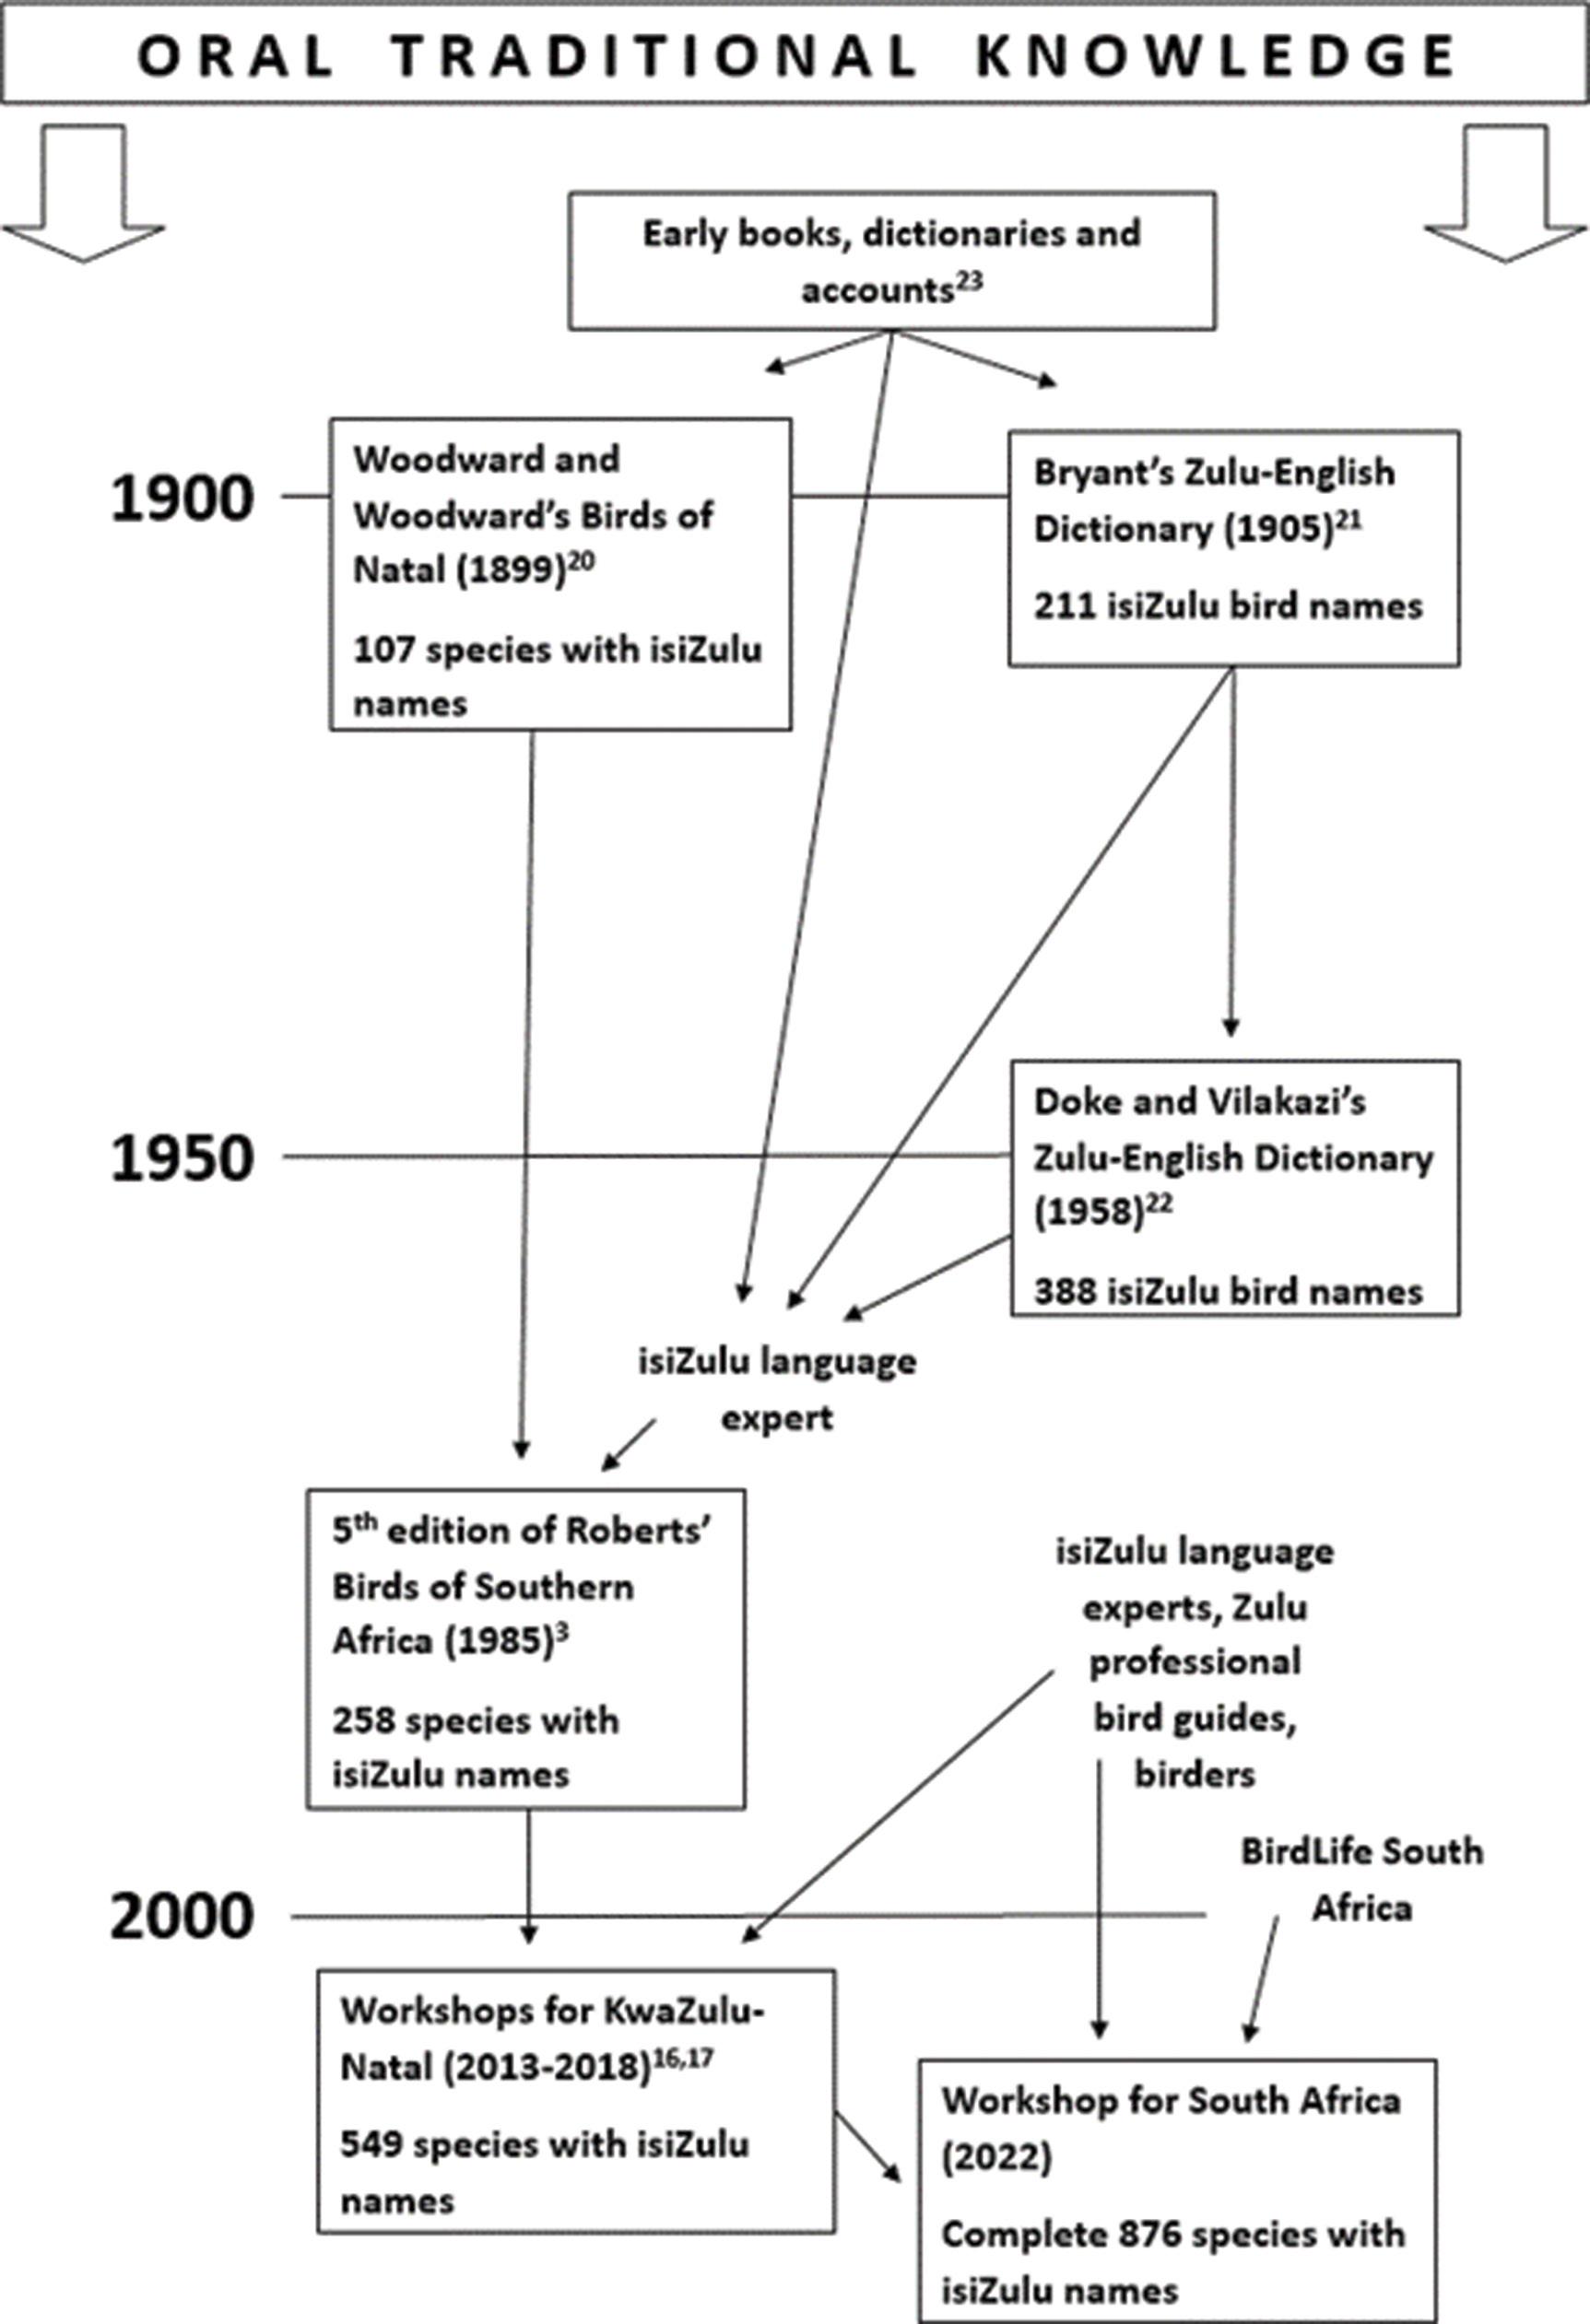
with a paucity of species-specific bird names. Our list of names, derived through diverse sources and methods, stands on its own as one in isiZulu, and we make no claim for the names here to be used in any of the other Nguni languages.
It is likely that not everyone will agree with our choices of names. We have mentioned the relegation of the traditional isikhobotho (Jackal Buzzard), which we redirected to the vagrant Red-necked Buzzard, a bird that hardly anyone will ever identify in South Africa. Some may criticise our selection of experts in the workshops, especially the lack of formal representation from traditional Zulu communities. The ideal composition of this team cannot be known. However, a feature of this process is its transparency and the clear identification of sources of information. This cannot be said
Volume 120| Number 5/6 May/June 2024 69 https://doi.org/10.17159/sajs.2024/16184 Research
Article
Figure 2: Progress towards isiZulu names for all wild bird species in South Africa, from the 19th century to the 2022 workshop.
of the opaque English vernacular naming processes of, for example, Roberts (1940) in The Birds of South Africa 29 And the second edition, in 195730, retained only 71% of the English names Roberts had allocated just 17 years earlier31. Some or many of the names we have proposed will change. We remain active in our collaboration with the List Committee of BLSA in keeping the names updated, appropriate, and scientifically valid.
Conclusion
We suggest that the process of naming bird species in isiZulu as described here offers a template for similar efforts in other languages in southern Africa. Names of birds in other African languages urgently need to be recorded before the heritage of traditional names is lost. Having bird names in all South Africa’s official languages is a fundamental keystone to achieving effective environmental education and awareness. Key to success are language experts with an interest in birds to guide the process, professional bird guides with a deep knowledge of their indigenous language, and experienced ornithologists or birders. Our approach would be restricted to areas where avitourism has resulted in training and employment of indigenous African bird guides. For isiZulu, with a complete set of bird names now available as an essential resource, the first step is now complete. This is the end of the beginning. The next step is the absorption of these names into biodiversity conservation practice, into life science teaching and learning, and into community vocabularies. The rewards will be greater appreciation of ornithology as a science, and priority for conservation of birds and their habitats in isiZulu-speaking parts of South Africa.
Acknowledgements
We are grateful to Johan Meyer, chair of SANSAB, and Andrew de Blocq and Alan Lee of BLSA, for their support and insight at SANSAB virtual meetings.
Competing interests
We have no competing interests to declare.
Authors’ contributions
N.S.T. and A.K. conceived and led the project. All authors contributed to project conceptualisation and to execution of the methodology. Specific roles have been mentioned in the article. E.B. wrote the manuscript and all authors commented towards acceptance and adoption of a final version.
references
1. Koopman A, Porter R, Turner N. Roberts birds of Kwazulu-Natal and their Zulu names. First edition. Cape Town: The John Voelcker Bird Book Fund; 2020.
2. Dent GR, Nyembezi CLS. Scholar’s IsiZulu dictionary. Third edition. Pietermaritzburg: Shuter & Shooter; 1995.
3. Maclean GL. Roberts’ birds of Southern Africa. Fifth edition. Cape Town: Trustees of the John Voelcker Bird Book Fund; 1985.
4. Pereira HM, Cooper HD. Towards the global monitoring of biodiversity change. Trends Ecol Evol. 2006;21(3):123–129. https://doi.org/10.1016/j.t ree.2005.10.015
5. United Nations. Sustainable Development Goals [webpage on the Internet]. No date [cited 2023 Mar 17]. Available from: https://sdgs.un.org/goals
6. Mlingwa COF. Birds of Tanzania: A provisional list of bird names in Kiswahili. Afr Study Monogr. 1997;18:73–120.
7. Ambrose D, Maphisa DH. Guide to the birds of the Roma Campus, National University of Lesotho. Roma: National University of Lesotho Publishing House; 1999.
8. Ambrose D. Section 167: Birds including annotated species checklist. In: Ambrose D, editor. Lesotho annotated bibliography. Second edition. Roma: National University of Lesotho Publishing House; 2005.
9. Kamwendo G, Hlongwa N, Mkhize N. On medium of instruction and African scholarship: The case of IsiZulu at the University of KwaZulu-Natal in South Africa. Curr Issues Lang. 2014;15(1):75–89. https://doi.org/10.1080/14664 208.2013.858014
10. Ndebele H, Zulu NS. The management of isiZulu as a language of teaching and learning at the University of KwaZulu-Natal’s College of Humanities. Lang Educ. 2017;31(6):509–525. https://doi.org/10.1080/09500782.2017.1326503
11. Kaschula RH. In search of the African voice in higher education: The language question. Stellenbosch Pap Linguist. 2016;49:199–214. https://doi.org/10.5 842/49-0-658
12. Kago G, Cissé M. Using African indigenous languages in science engagement to increase science trust. Front Commun. 2022;6, Art. #759069. https://doi .org/10.3389/fcomm.2021.759069
13. Phaka FM, Netherlands EC, Kruger DJD, Du Preez LH. A bilingual field guide to the frogs of Zululand. Pretoria: South African National Biodiversity Institute; 2017.
14. Phaka FM, Ovid D. Life sciences reading material in vernacular: Lessons from developing a bilingual (IsiZulu and English) book on South African frogs. Curr Issues Lang. 2022;23:96–111. https://doi.org/10.1080/14664208.2021.19 36397
15. Olugbara CT. The effect of isiZulu/English code switching as medium of instruction on students’ performance in and attitudes towards biology [Master of Education dissertation]. Empangeni: University of Zululand; 2008.
16. BirdLife South Africa. Checklist of birds in South Africa 2022. Cape Town: BirdLife South Africa; 2022.
17. Turner NS, Koopman A, Terminology development in Zulu avian nomenclature. Nomina Africana. 2018;32(1):11–22. https://doi.org/10.2989/na.2018.32.1 .2.1321
18. Koopman A, Porter R, Turner N. Amagama Ezinyoni Zulu names of birds. Pietermaritzburg: University of KwaZulu-Natal Press; 2020.
19. Koopman A. Zulu bird names and bird lore. Pietermaritzburg: University of KwaZulu-Natal Press; 2019.
20. Woodward RB, Woodward JDS. Natal birds. Pietermaritzburg: P.Davis and Sons; 1899.
21. Bryant AT. Bryant’s Zulu-English dictionary. Pinetown: Mariannhill Mission Press; 1905.
22. Doke CM, Vilakazi BW. Zulu-English dictionary. Johannesburg: Witwatersrand University Press; 1958.
23. Jacobs NJ. Birders of Africa. History of a network. Cape Town: UCT Press; 2018.
24. Koopman A. Zulu bird names: A progression over the decades (I). [Part one: The first hundred years, from Delegorgue to Samuelson]. S Afr J Afr Lang. 2018;38(3):261–267. https://doi.org/10.1080/02572117.2018.1518029
25. Koopman A. Zulu bird names: A progression over the decades (II). [Part two: The second hundred years, with Roberts, and Doke and Vilakazi]. S Afr J Afr Lang. 2019;39(1):9–15. https://doi.org/10.1080/02572117.2019.1572308
26. Koopman A, Turner NS. Morphology of Zulu bird names: Old and new. S Afr J Afr Lang. 2019;39(1):1–8. https://doi.org/10.1080/02572117.2019 .1572309
27. BirdLife South Africa. Bird checklists [webpage on the Internet]. No date [cited 2024 Mar 10]. Available from: https://www.birdlife.org.za/media-and-r esources/bird-checklists/
28. Godfrey R. Bird lore of the Eastern Cape Province. Johannesburg: Witwatersrand University Press; 1941.
29. Roberts A. The birds of South Africa. London: HF & G Witherby Ltd.; 1940.
30. McLachlan GR, Liversidge R. Roberts birds of South Africa. Revised edition. Cape Town: The trustees of the South African Bird Book Fund; 1957.
31. Buchmann EJ, Downs CT. Ostrich, Southern ostrich or common ostrich? The ‘eternal vexed question’ of English bird names and name changes in southern Africa through eight editions of Roberts field guides, 1940-2016. Ostrich. 2018;89(3):205–210. https://doi.org/10.2989/00306525.2018.1460408
Volume 120| Number 5/6 May/June 2024 70 https://doi.org/10.17159/sajs.2024/16184 Research
Establishing isiZulu bird names for South Africa Page 8 of 8
Article
AuthorS:
Kayla M.E. Webster1
Jane K. Turpie2,3
Gwyneth K. Letley2
AFFILIAtIoNS:
1Percy FitzPatrick Institute of African Ornithology, University of Cape Town, Cape Town, South Africa
2Anchor Environmental Consultants, Cape Town, South Africa
3Environmental Policy Research Unit, School of Economics, University of Cape Town, Cape Town, South Africa
CorrESPoNDENCE to: Kayla Webster
EMAIL: kaylamareewebster@gmail.com
DAtES:
received: 30 Nov. 2023
revised: 15 Mar. 2024
Accepted: 15 Mar. 2024
Published: 28 May 2024
hoW to CItE: Webster KME, Turpie JK, Letley GK. Viability of investing in ecological infrastructure in South Africa’s water supply areas. S Afr J Sci. 2024;120(5/6), Art. #17378. https:// doi.org/10.17159/sajs.2024/17378
ArtICLE INCLuDES:
☒ Peer review
☐ Supplementary material
DAtA AVAILABILItY:
☐ Open data set
☐ All data included
☒ On request from author(s)
☐ Not available
☐ Not applicable
EDItor: Jennifer Fitchett
KEYWorDS:
ecological infrastructure, invasive alien plants, water security, ecosystem health, cost-effectiveness analysis
FuNDING: South African Water Research Commission
Viability of investing in ecological infrastructure in South Africa’s water supply areas
Ecological infrastructure (natural ecosystems that provide important services and save on built infrastructure costs) can have an important role in securing water supply, particularly in water-scarce areas, but this importance is not reflected in investment decisions, partly due to a lack of evidence. In South Africa, one of the main threats to water supply is the proliferation of woody invasive alien plants which significantly reduce stream flow and water yields. We used existing spatial data and estimates of the impact of woody invasive plants on flows and water yields and on restoration costs to analyse the viability of investing in ecological infrastructure at the scale of major water supply areas. The analysis involved comparison of the costs and effects on water yields of catchment restoration with those of planned built infrastructure interventions designed to meet increasing water demands in the medium to long term. The cost-effectiveness analysis used the unit reference value as a measure of comparison, which is based on the discounted flows of costs and water supplied over a defined time. Restoration could supply 24% of the combined yield of planned built infrastructure interventions by 2050, and is not only cost-effective but has the added advantage of a range of co-benefits delivered by improving ecosystem health. This finding suggests that investing in ecological infrastructure should be considered ahead of new built-infrastructure projects.
Significance:
• Clearing invasive alien plants from South Africa’s main water catchment areas could increase water yields by 997 million m3 by 2050 relative to a business-as-usual approach, equivalent to a quarter of the yield gains through implementation of built infrastructure interventions planned over the same period.
•Invasive alien plant clearing would be more cost-effective than built infrastructure interventions in all water supply systems, except one, the Orange River System.
•These findings add to the growing body of literature that advocates for ecological infrastructure investments to secure hydrological ecosystem services.
Introduction
Water security is becoming increasingly important globally, especially in regions that already experience water scarcity in relation to increasing human demands due to low or declining rainfall and/or inadequate water supply infrastructure.1 South Africa is a water-scarce country where these problems are exacerbated by the degradation and pollution of its surface water catchment areas. Catchment degradation takes the form of invasion by woody alien plants, indigenous bush encroachment and the loss of vegetative cover (hereafter referred to as desertification), with the first two reducing stream flows and the latter increasing the rates of sedimentation in reservoirs.
As is the case in most parts of the world, water security in South Africa has been addressed almost entirely through the planning and construction of water supply infrastructure, including sophisticated interlinked systems of reservoirs and inter-basin transfer schemes.2 However, there is increasing evidence that it would be more efficient to integrate catchment conservation actions into water sector investment planning. Indeed, a large body of research has shown that reducing the extent of invasive alien plants (IAPs) can have significant impacts on stream flow and reservoir yields in South Africa3-6, and there is growing evidence of the benefits of addressing bush encroachment and desertification7. Many studies have now shown that undertaking restoration and conservation measures in catchment areas not only has a positive return on investment, but can also be cost-effective in meeting water security goals.8-12
This kind of evidence has led to the idea of solving what were traditionally engineering problems using ‘nature-based solutions’, which is gaining traction globally as the exponential trajectory of human impacts on the environment start to reach a critical scale.13 In South Africa, growing realisation of the impacts of catchment degradation on water supply led to the emergence of the Working for Water (WfW) programme and other government-funded land restoration programmes in the 1990s.14,15 This is part of a growing global concern about the impact of ecological degradation, which has led to the declaration of 2021–2030 as the ‘UN Decade on Ecosystem Restoration’ to address the risks to biodiversity, water and food security16 and commitments by signatories to the UNFCCC to achieve Land Degradation Neutrality by 2030 to reverse or offset the degradation that has taken place since 200017 Natural ecosystems that provide important services that reduce the costs of built infrastructure can be referred to as ‘ecological infrastructure’.10,18 In water-supply areas, maintaining these ecosystems helps to maintain the overall quantity and quality of stream flows and reduces the seasonal variability in flows.19-23 This saves on built infrastructure costs, such as water storage, flood mitigation measures and water treatment costs, as well as providing other environmental benefits. Where water security is also threatened by climate change, the restoration and protection of ecological infrastructure can also be regarded as ecosystem-based adaptation.24
There is a growing call for ‘investing in ecological infrastructure’ as a means to ensure the longevity and most efficient use of existing built infrastructure, towards securing a resilient, reliable water supply25, especially in the
71 https://doi.org/10.17159/sajs.2024/17378 Volume 120| Number 5/6 May/June 2024 © 2024. The Author(s). Published under a Creative Commons Attribution Licence. Research
Article
context of rising water demand26,27 and climate change, which threatens the capacity of existing built infrastructure.
The lack of investment in ecological infrastructure is often attributed to a lack of information.18 27 28 Indeed, there is limited information on the extent to which investing in ecological infrastructure for water security is viable, and where such investments should be prioritised in South Africa.28 Decision-makers require sound evidence of the feasibility and likelihood of maximising return-on-investment for an intervention before they are willing to invest. To this end, our study aimed to determine the cost-effectiveness of investing in the clearing and long-term control of IAPs to secure water supply in relation to that of planned built infrastructure.
A viability analysis was carried out for each of South Africa’s main water supply systems (WSSs) that serve the country’s major population centres. WSSs include the surface and underground water source areas, reservoirs, water treatment works and reticulation networks that are managed by water service providers (water service providers), which are semi-autonomous parastatal water boards or metropolitan municipalities. The water service providers sell bulk water to municipalities or directly to water users, and are expected to invest in the management, maintenance and augmentation of these systems with some assistance from the national Department of Water and Sanitation. Our analysis suggests that, for nearly all water supply systems, investments in ecological infrastructure would be comparatively cost-effective and should be introduced ahead of costly engineering projects.
Data and methods
Study area
The analysis was carried out for each of South Africa’s 11 regional WSSs (Figure 1). WSSs are an appropriate unit of analysis because they are the scale at which the Department of Water and Sanitation undertakes its regional water supply infrastructure planning through ‘reconciliation strategy studies’ (Figure 2). These studies estimate the water demand trajectory and lay out plans for a series of (usually built) infrastructure investments to meet demands over time as they grow
with the population. Within each WSS, our focus was on the catchment areas of existing large water supply reservoirs (large dams) as being the ecological infrastructure of interest.
Delineating dam catchment areas
The analysis was carried out for the catchment areas of the existing large bulk water supply dams in each WSS: 64 large dams (wall height 5–15 m; capacity >3 million m3) either owned and managed by the relevant water service providers or owned by the Department of Water and Sanitation but managed by the relevant water service providers, as listed in the ‘South African Register of Large Dams’.30 Their catchment areas were delineated using ArcGIS software’s ‘Watershed’ tool (ArcMap version 10.4.1). This delineation resulted in a combined catchment area of 230 500 km2, equivalent to 18.9% of South Africa’s land area (Figure 1). Finally, the quaternary catchments within the delineated catchments were identified.31
Extent of IAP coverage in catchment areas
The National Invasive Alien Plant Survey (NIAPS) data set32 was used to estimate the extent of IAP coverage in each of the large dam catchment areas. While the NIAPS data set is outdated and has its limitations (see Preston et al.33), it was the best data set available at national scale. This study focused on gums (Eucalyptus spp.), pines (Pinus spp.) and wattles (Acacia spp.) as the three most dominant, thirsty invaders in South Africa.5 NIAPS data were extracted for the selected quaternary catchments and analysed in Microsoft Excel. The 2010 extents were projected to current (2022) and future (2050) extents using a logistic population growth model (Equation 1):
Equation 1
whereby r is the growth rate, P is the population size, t is the relevant time step, and K is the carrying capacity. K was defined as ‘invadable land’, which included all land that was not classified as “built-up”, “cultivated”, “mines and quarries” or “waterbodies” in the South African National
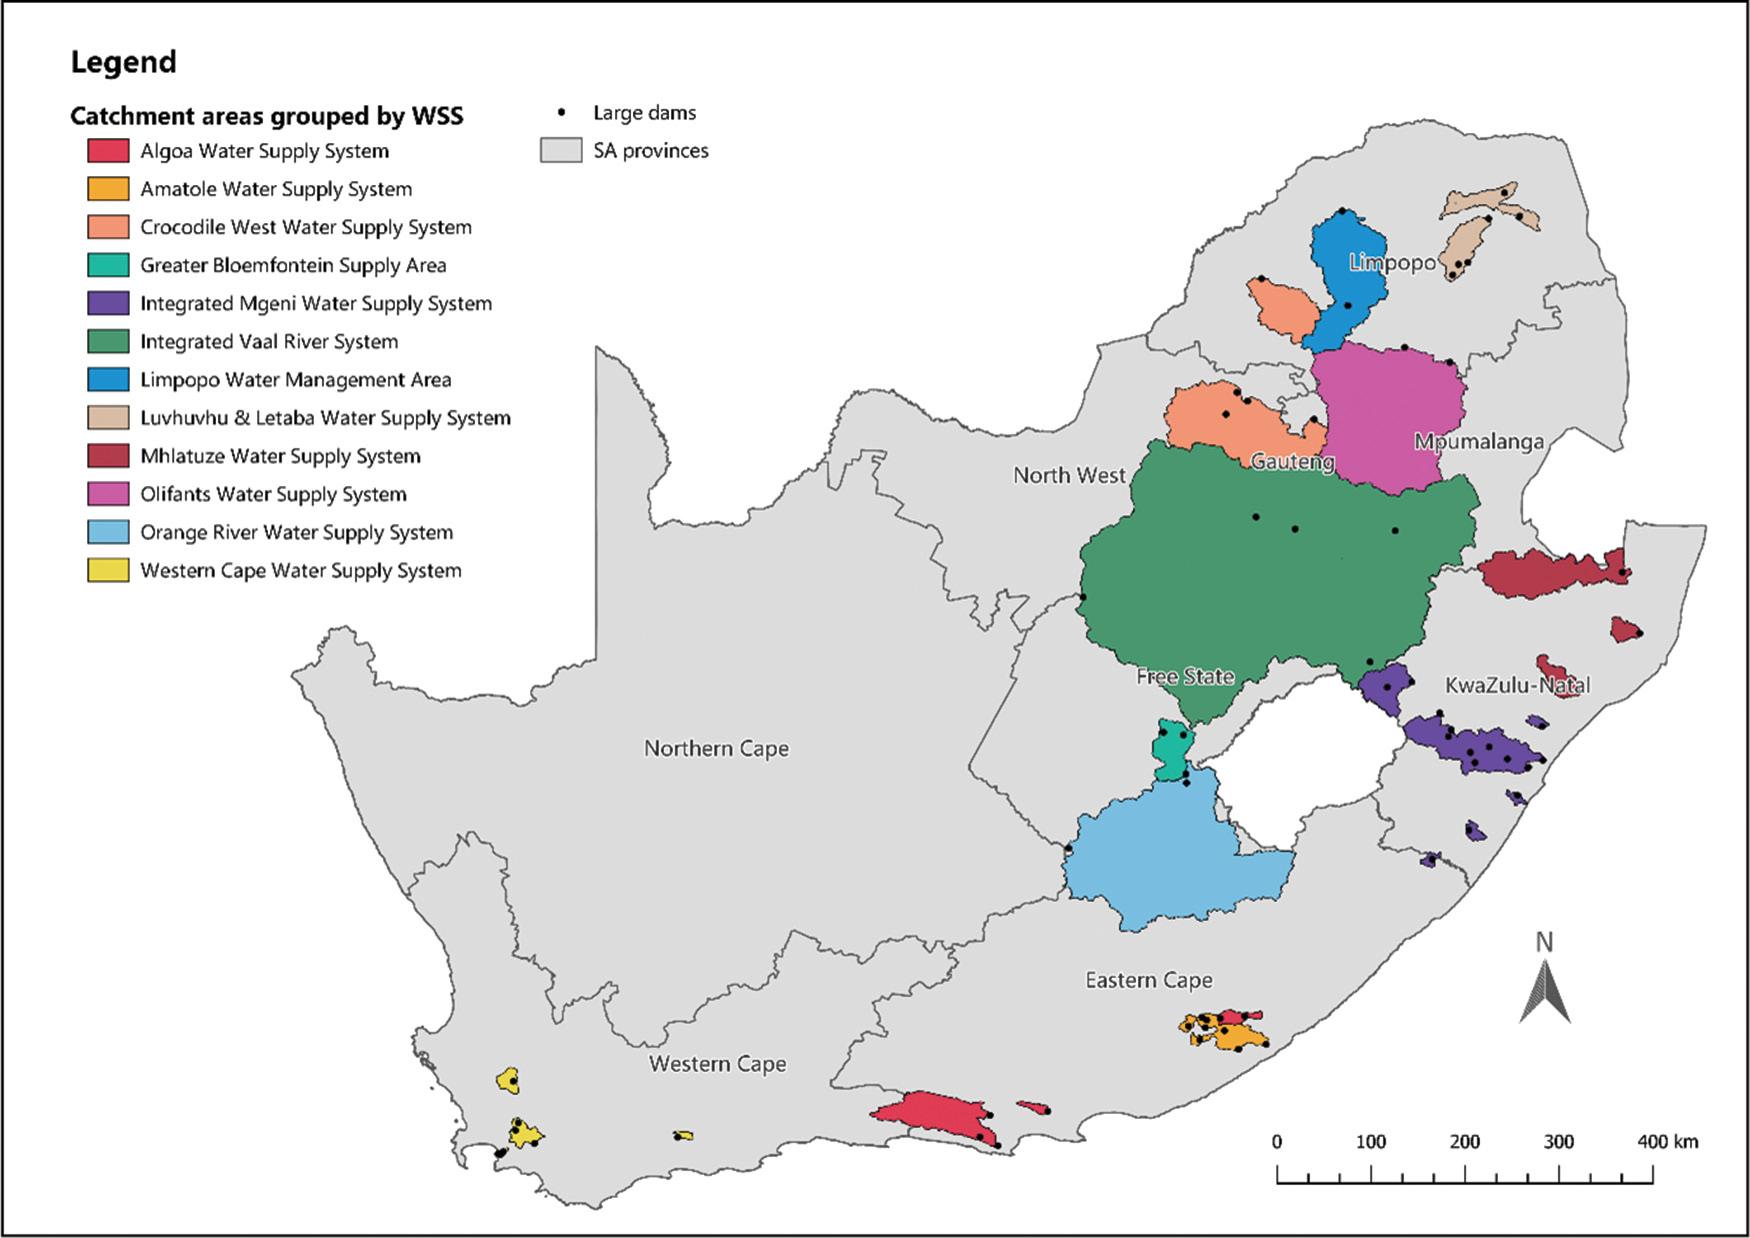
Volume 120| Number 5/6 May/June 2024 72 https://doi.org/10.17159/sajs.2024/17378 Research Article Viability of investing in ecological infrastructure Page 2 of 9
dp dt = rPt 1(1 Pt K )
Figure 1: Spatial distribution of dam catchment areas (coloured by water supply system) included in the analyses.
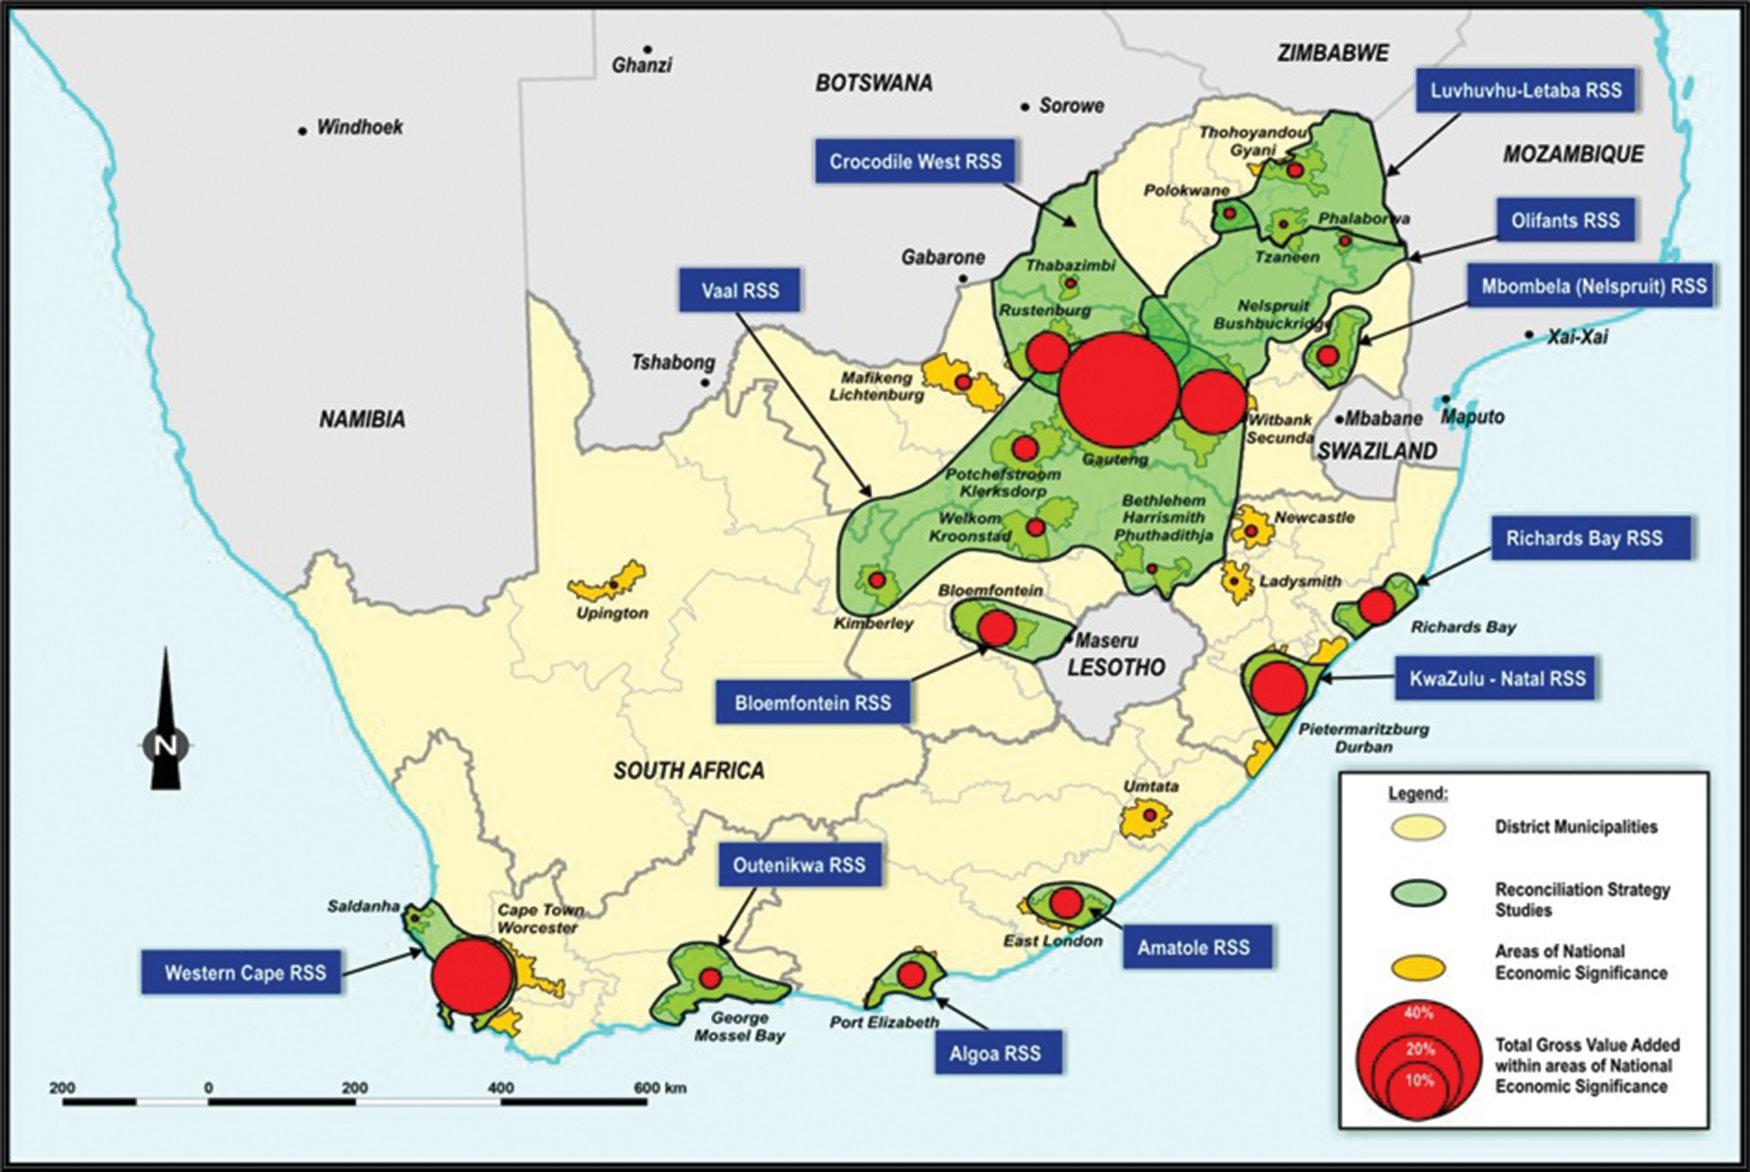
CC-BY-3.0
Land-Cover data set 2020.34 For r, a conservative rate of increase in cover of 7.5% per annum was used for wattles, pines and gums, based on the literature.35,36
Cost-effectiveness analysis
Overview
To derive the costs of interventions for catchment restoration (i.e. IAP clearing), information was gathered from literature that addressed the spread of IAPs5,7,36 and methods of calculating estimates of the cost to clear IAPs per hectare. Similarly, all information pertaining to built infrastructure interventions was retrieved from reports published by the Department of Water and Sanitation, which provides access to reconciliation strategy studies for bulk water supply augmentation options for each WSS in South Africa. These reports included relevant cost and yield information.
Unit reference values (URVs) can be used as a direct measure of the benefits derived from water resource interventions and are commonly used to assess the feasibility of projects in the water supply sector.37 This assessment is done by calculating the cost per cubic meter (ZAR/m3) of water over the lifetime of the project. URVs were used as a measure to compare the financial costs and benefits (additional water gain) derived from ecological infrastructure and built infrastructure interventions in this study. All analyses assumed that interventions would be implemented in 2022 and were evaluated up to 2050, assuming a 28-year project lifespan for IAP clearing and management.
Assessment of planned built infrastructure development
Each of the study focus regions is depicted in Figure 2. To determine the planned sequence of infrastructure development per WSS, each of the relevant reconciliation strategy reports was retrieved from online repositories and was analysed for interventions planned to take place between 2022 and 2050. Yield gains and URVs for each water supply option were then extracted directly from the reconciliation strategy reports, or estimated based on similar types of projects in other water supply systems. The URVs of each intervention were reported in 2022 Rands.
Costs of clearing IAPs
Cost estimates for clearing IAPs in South Africa were based on person-day estimates provided by the Working for Water (WfW) programme. Person-day estimates are derived from data collected over the lifespan of the WfW programme and are based on the costs to clear different groups and age classes of IAPs in riparian and landscape settings using different treatment methods over time.7 Therefore, regression models (Table 1) were used to calculate the person-day estimates required to clear one hectare of gum, pine and wattle. The cost to clear IAPs under the WfW programme was some ZAR500 (in 2022) per condensed hectare (c.ha).36
Based on this, the cost of initial and follow-up clearing events for gums, pines and wattles was calculated for each relevant quaternary catchment. It was assumed that the first two follow-up clearing events would take place in 3-year intervals after the initial clear in 2022 and every 6 years thereafter until 2050. A discount rate of 8% was used to determine the present value of costs over the period. Investment in clearing IAPs is considered inefficient at densities below 5%, so a threshold was applied to the base year (2022) whereby all quaternary catchments with an IAP infestation of less than 5% were excluded from the cost model.
table 1: Regression models used to calculate the number of persondays required to clear one hectare of gum, pine, and wattle species, where Iha is the invadable hectares in the relevant quaternary catchment, and x is the average percentage density per pixel
SpeciesInitial clearingFollow-ups
Gums (Eucalyptus spp.)
Pines (Pinus spp.)
Wattles (Acacia spp.)
Source: Turpie et al.36
Volume 120| Number 5/6 May/June 2024 73 https://doi.org/10.17159/sajs.2024/17378 Research Article Viability of investing in ecological infrastructure Page 3 of 9
Figure 2: The regions and scales of the 12 reconciliation strategy studies (RSS) conducted and published by the South African Department of Water and Sanitation.
Source:
South African Department of Water and Sanitation29
Iha(2.4254
) Iha(1.7074
0.1(0.028
e 0.028x
e
x))
Iha (2.0647 e 0.027x) Iha(1.6161 e 0.1(0.027x))
Iha (2.0057 e 0.028x) Iha(0.2006 e 0.1(0.028x))
Calculating URVs for IAP clearing
The URV for securing water supply through clearing IAPs is derived by dividing the total present value of costs (PVc) by the present value of water supplied (PVw), as shown in Equation 2. The total PV c to clear IAPs from an area is the sum of initial and follow-up PVc costs. The initial PV c is the product of the number of person-days required to clear IAPs in the first year and the cost to clear one condensed hectare of infested land, while the PV c of one follow-up event is the product of the number of person-days required to clear IAPs in a follow-up event and the cost to clear one condensed hectare of infested land.
2
The PV w is based on the quantity of water gained if IAPs are removed from catchment areas by 2050. To determine this, estimates of streamflow reduction as a result of IAPs were extracted at the primary catchment level.5 A factor to represent the amount of water used by IAPs per unit area was calculated for all primary catchments and then applied to each relevant quaternary catchment. The gain in streamflow was then converted into a gain in yield by applying a ratio between water flow and yield based on Cullis et al.38, who estimated changes in yield due to IAPs in all of South Africa’s major water management areas. The relevant stream flow to yield ratio was applied to each quaternary catchment according to the water management area within which it is located. This was calculated for the period between 2022 and 2050 using Equation 3, where Wt is the quantity of water at year t, and r is the discount rate.
results
Extent and spread of IAPs
IAP coverage of all catchment areas combined was estimated to be approximately 623 000 c.ha in 2022, or 2.7% of the total area considered. Without intervention, this would quadruple to an estimated 2.5 million c.ha, or 10.9% of the area, by 2050 (Table 2). The Amatole
WSS had the highest percentage cover of IAPs in both 2022 (22%) and 2050 (58%; Figure 3). Conversely, the Orange River System was estimated to have the lowest level of infestation in both 2022 (0.3%) and 2050 (1.6%) (Table 2).
Overall, gum and wattle were more prolific than pine in most WSSs. Wattle was shown to have the most drastic spread by 2050, having the highest average coverage (9.5%) among all three species. The Amatole WSS’s high percentage of invaded area was dominated by wattle infestation, covering 29.3% of the WSS total catchment area by 2050.
Cost-effectiveness analysis
The Integrated Vaal River System was estimated to have the greatest numberofcondensedhectaresinfestedwithIAPsby2050(approximately 922 000 c.ha; Table 2), resulting in the highest PVc to remove them (ZAR4.7 billion), while the Luvuvhu-Letaba WSS had the lowest number of condensed hectares (approximately 25 000 c.ha), requiring the lowest allocation of investment for IAP removal (ZAR71.8 million).
Across all 11 water supply systems considered, a total of 52 planned water supply projects were specified in the relevant reconciliation strategy studies between 2022 and 2050. Combined, planned built infrastructure interventions would result in yield gains of approximately 4 173 million m3/a. On the other hand, the amount of water that could be gained by removing IAPs from bulk water supply catchment areas would increase exponentially between 2022 and 2050 (because IAP cover, and hence water lost in the absence of clearing, increases exponentially), amounting to a gain in stream flow of about 1 595 million m3 and a gain in yield of about 997 million m3 (Table 2). This is approximately 24% of the amount of water that could be gained through implementation of built infrastructure interventions (such as dam augmentation and desalination projects, and water transfer schemes) in the same time frame. As a reference, the reliable yield of surface water sources in South Africa as at 2019 was 10 200 million m3/a.39
When the URVs and yield gains of IAP clearing are compared with those of planned built infrastructure developments, it becomes clear that IAP clearing is a cost-effective intervention for securing water supply. IAP clearing was the most cost-effective water supply option for all WSSs except for the Orange River System, which showed relatively low water gains for the associated URV (Figure 4). Overall, IAP clearing was the most cost-effective augmentation option.
table 2: The total condensed hectares (c.ha) that would be infested in 2050 if no clearing was pursued, the water gained by 2050 with intervention and the present value (PV) in 2022 Rands of the investment required to clear invasive alien plants in existing bulk water supply infrastructure catchment areas of each relevant water supply system (WSS) between 2022 and 2050
Algoa WSS145 657103.943.9740.80
Amatole WSS92 80487.742.7578.89
Crocodile West WSS235 37766.535.81414.64
WSS24 92911.86.871.80
WSS524 977263.0193.63078.45 Orange River System45 81826.014.3145.45 Richard’s Bay WSS188 057180.489.2889.88
Volume 120| Number 5/6 May/June 2024 74 https://doi.org/10.17159/sajs.2024/17378 Research Article Viability of investing in ecological infrastructure Page 4 of 9
(R
m 3 ) = PV c PV w
URV
/
Equation
PV w = ∑( Wt (1 + r )t)
Equation 3
Area
Increase
(million
3) Increase in yield by 2050 with intervention (million m3) PV of clearing costs (ZAr millions)
WSS
infested by 2050 without intervention (c.ha)
in stream flow by 2050 with intervention
m
Integrated Mgeni WSS227 610303.9148.91231.66 Integrated Vaal River System922 233423.4338.74696.02 Limpopo North61 76422.812.3136.84 Luvuvhu-Letaba
Olifants
Western Cape WSS46 326105.471.0325.93 total 2 515 5541595.4997.113 310

The URVs for built infrastructure ranged from ZAR0.48/m3 for the new Vioolsdrift Dam augmentation project in the Orange River System40 to ZAR44.36/m3 for the Zambezi River transfer scheme in the Crocodile West WSS41, while the URVs for IAP clearing ranged from ZAR0.79/m3 for the Western Cape WSS to ZAR7.18/m3 for the Crocodile West WSS (Table 3). Of all the 11 water supply systems analysed, only IAP clearing in the Orange River System was less cost-effective than planned built infrastructure options. This finding can be explained by the low levels of estimated invasion in this water supply area, so removal of IAPs would not result in a significant gain in additional water when compared to the built alternatives which had significantly higher yields.
Discussion
There is growing awareness of the important role of ecological infrastructure in achieving water security.27,28,42 However, ecosystem degradation is resulting in the loss of valuable hydrological ecosystem services that increase the costs of water supply. Investing in restoration and conservation of catchment areas can effectively support existing built infrastructure and delay the need for more expensive engineered solutions. This not only reduces costs over the long term, but also generates a range of co-benefits.
This study has shown that, from a water supply perspective alone, securing hydrological ecosystem services through catchment restoration is cost-effective and should be considered as a priority action towards achieving water security in South Africa. Broadly, the yield gained (997 million m3) from clearing IAPs from South Africa’s key water supply areas equates to approximately 19% of the capacity of the Gariep Dam, the largest dam in South Africa. IAP clearing was more cost-effective than planned built infrastructure options in all but one of the 11 WSSs analysed, the exception being the Orange River System, where invasion levels are relatively low.
This study’s findings build on a number of smaller-scale studies that have demonstrated restoration measures as being cost-effective in securing hydrological ecosystem services. Clearing IAPs was found to be a cost-effective intervention in a quaternary catchment of the Olifants River with a URV of ZAR1.44/m3, which compared favourably with a URV of ZAR2.93/m3 for the De Hoop Dam.43 In a comparison between the uMngeni and Baviaanskloof-Tsitsikamma catchment areas, uMngeni had more severe levels of degradation, which consequently resulted in a higher URV for restoration of ecological infrastructure (ZAR2.50/m3) than the Baviaanskloof-Tsitsikamma (ZAR1.17/m3).9 In two quaternary catchments in northern KwaZulu-Natal, IAP clearing was more economical than raising the wall of Hazelmere Dam, with a URV of ZAR2.50/m3 compared to ZAR3.67/m3 44
Investing in catchment restoration also becomes increasingly attractive as built augmentation options become progressively more expensive due to (1) the cheaper interventions being implemented first45 and (2) more costly maintenance due to the impacts of catchment degradation which shortens the projected lifespan of reservoirs and related infrastructure9 Furthermore, investing in ecological infrastructure for water supply also delivers co-benefits such as biodiversity conservation, flood risk reduction, reduced sedimentation, carbon sequestration and other ecosystem services.7,10 15 28 44 46 Although the benefits of catchment restoration are undeniable, the associated water supply benefits would not be deliverable to consumers without functional built infrastructure, so we emphasise that ecological infrastructure investment should go hand in hand with the proper maintenance of existing infrastructure.39
To date, the water service providers, which stand to gain significantly from improvements in catchment health through cost savings, have been slow to invest in ecological infrastructure. Indeed, only 1 of the 11 water supply systems has formally acknowledged and actively incorporated catchment restoration as a key intervention in their planning and budgeting for securing water in the long term. IAP clearing is included as a prioritised augmentation option in the Western Cape WSS reconciliation strategy.47 The net URV of ZAR1.20/m3 reported in the reconciliation strategy is slightly higher than that of ZAR0.79/ m3 estimated in this study, but still significantly lower than the range of URVs determined for built infrastructure augmentation options in the WSS (ZAR2.57–18.77/m3).
While some other water reconciliation strategies, namely those of uMgeni and Richard’s Bay48,49, acknowledge the importance of catchment restoration and the maintenance of ecological infrastructure, they do not quantify the yield that could be obtained from removing IAPs and do not account for it in reconciliation scenarios or water balances developed for the WSS. The reason for this, stated in the KZN Coastal Reconciliation Strategy, is due to a “lack of quantifiable data”48. In the Western Cape WSS there has been considerable research undertaken to assess the impact of IAPs on water supply, which has provided the information needed to secure support and funding to undertake restoration activities in important water source areas. An outcome of this research has been the formation of the Greater Cape Town Water Fund (GCTWF), which since 2018, has successfully brought together and linked beneficiaries and stakeholders in pursuit of a common goal of securing water.50 The GCTWF operates at a large scale, focusing restoration efforts, particularly IAP clearing, in the catchments that feed the Western Cape WSS. These restoration efforts have been guided by scientific research that has determined priority areas for IAP clearing based on cost-effectiveness and return on investment.36,50 In developing the Business Case for the
Volume 120| Number 5/6 May/June 2024 75 https://doi.org/10.17159/sajs.2024/17378 Research Article Viability of investing in ecological infrastructure Page 5 of 9
Figure 3: Present (2022) and future (2050) percentage area of invasive alien plants in each water supply system (WSS).
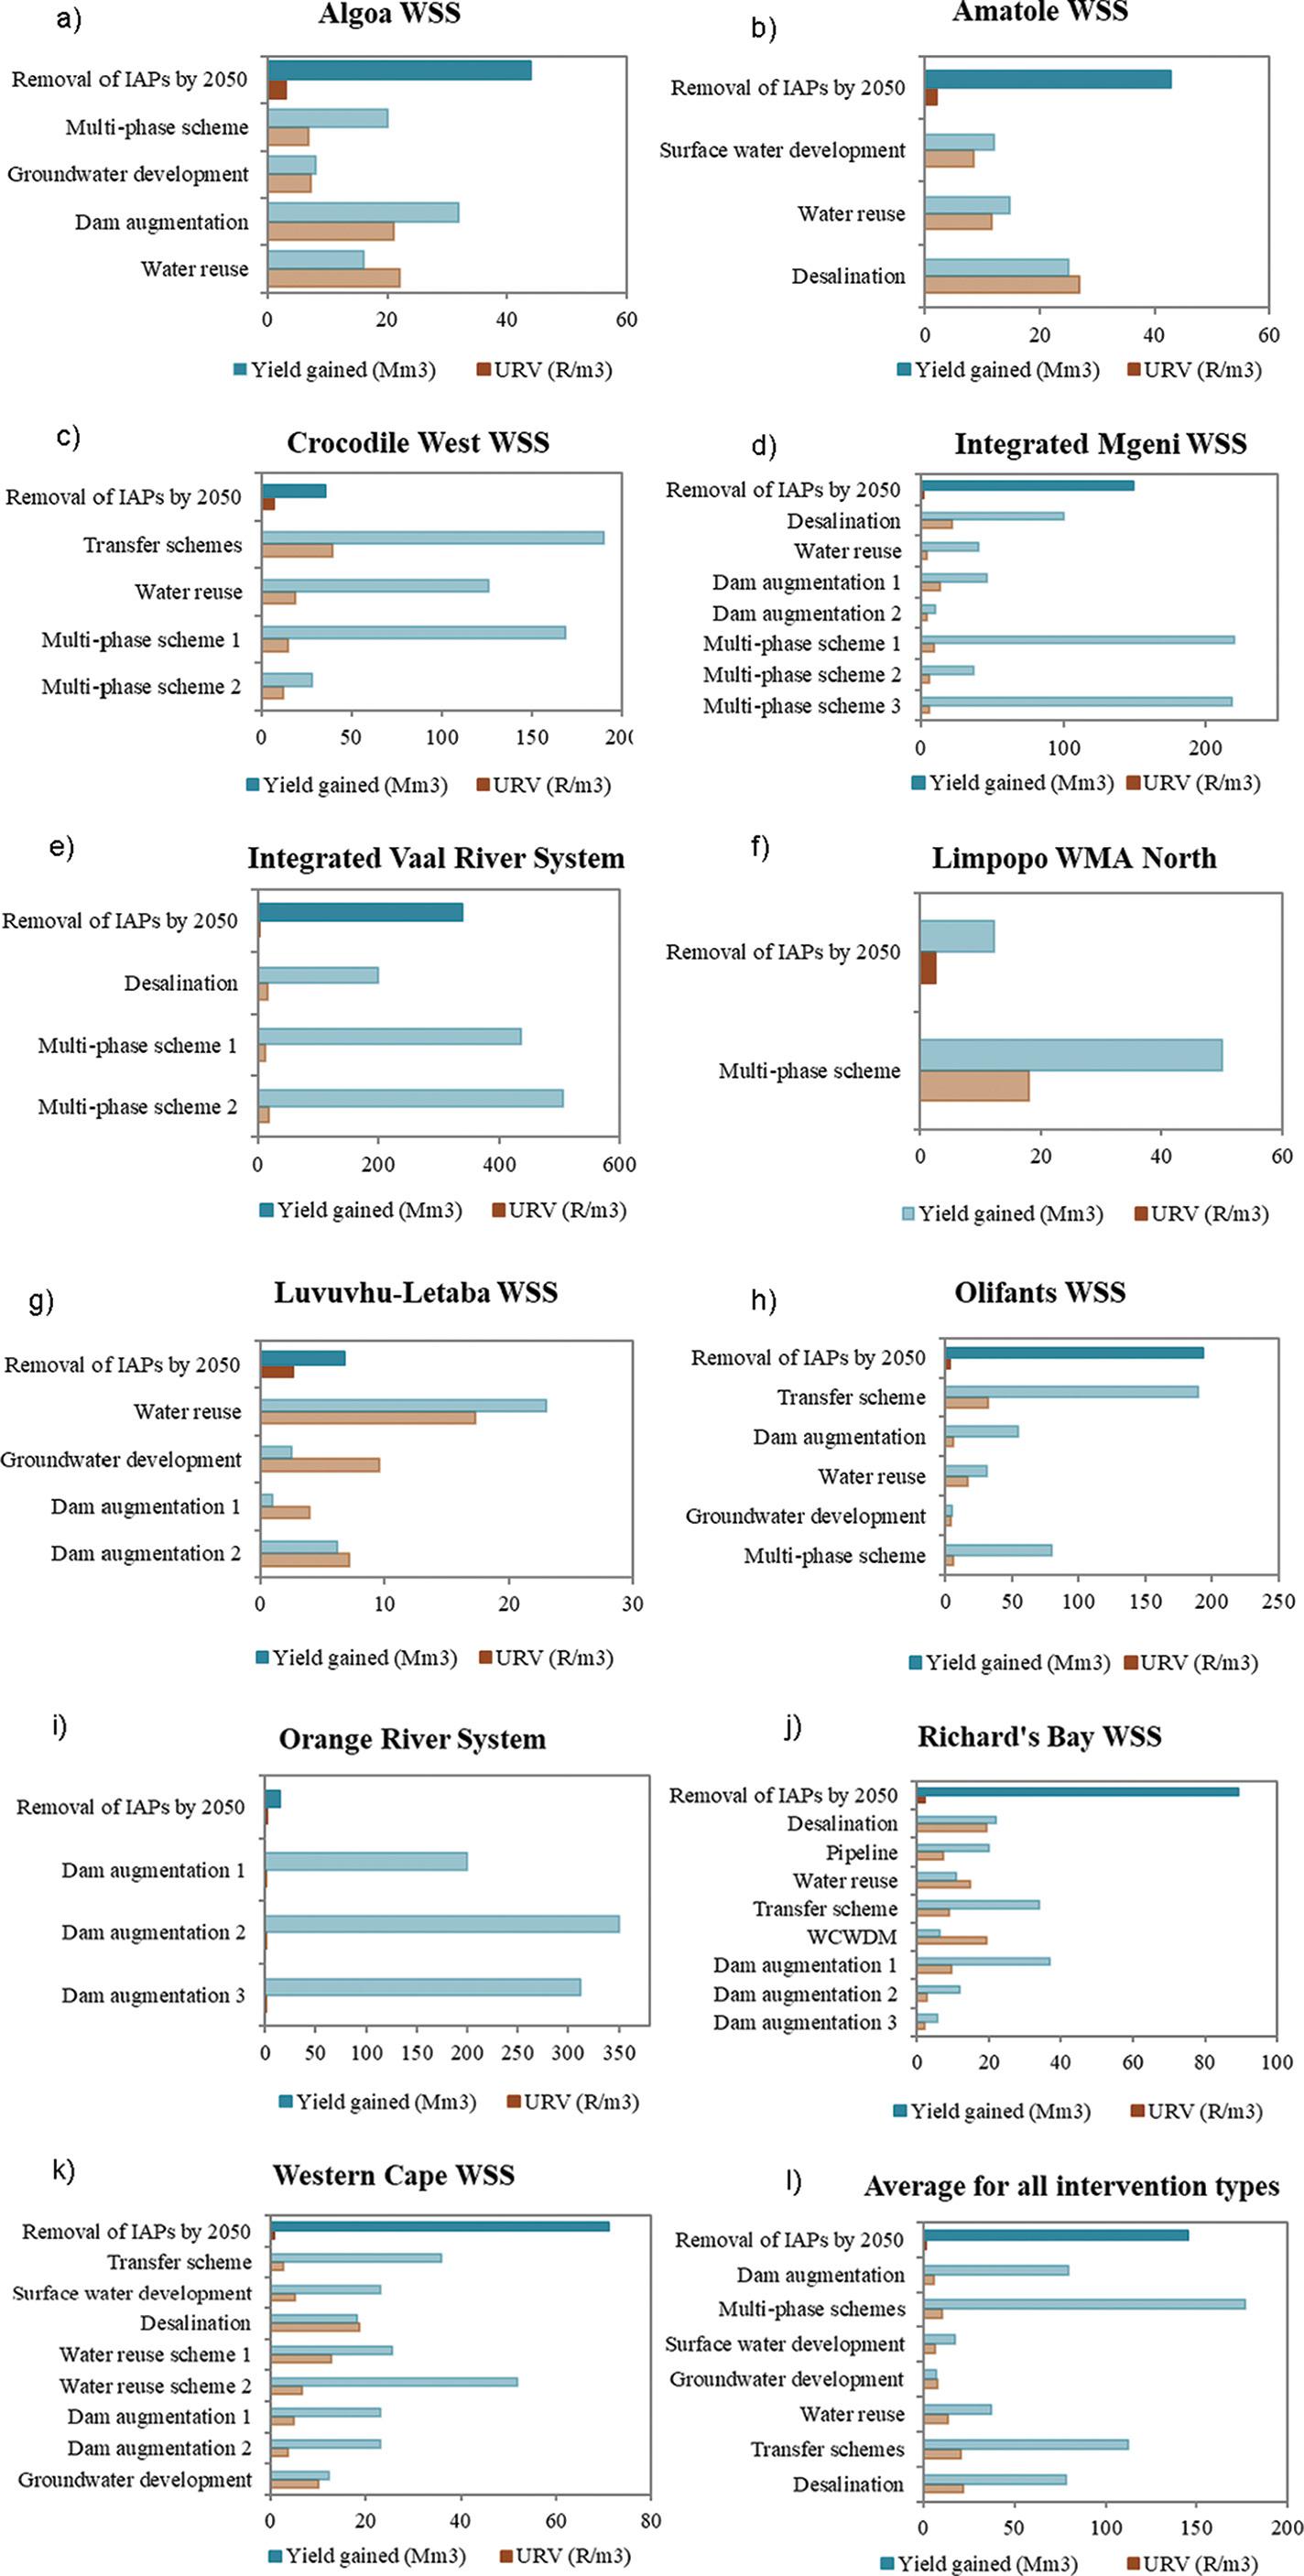
Figure 4: (a–l) Unit reference value (URV; ZAR/m3) and yield gained (million m3) through implementation of interventions for each water supply system (WSS), and (g) the average URV and yield gained per intervention type across all water supply systems.
Volume 120| Number 5/6 May/June 2024 76 https://doi.org/10.17159/sajs.2024/17378 Research Article Viability of investing in ecological infrastructure Page 6 of 9
table 3: A summary of the overall extent of invasive alien plants (% IAP coverage) within each water supply system (WSS) without intervention, as well as the unit reference values (URVs) associated with built infrastructure and IAP clearing. URVs are reported in 2022 Rands.
– 28.661.97
Crocodile West WSS 5.4320.3512.38 – 44.367.18
Integrated Mgeni WSS 9.8435.124.54 – 21.911.43
Integrated Vaal River System3.6116.3011.80 – 17.612.78
Olifants WSS 9.9636.514.50 – 31.922.82
Orange River System 0.271.610.48 – 0.842.45
Richard’s Bay WSS 6.0327.502.22 – 19.362.01
Western Cape WSS 11.9745.492.57 – 18.770.79
aOnly one planned built infrastructure intervention.
bValues based on the average URVs of similar projects due to deficient data.
GCTWF, the URVs to clear IAPs ranged from ZAR0.30/m3 to ZAR0.80/m3 in the top seven priority sub-catchments.36 The URV for clearing IAPs in the Western Cape WSS determined in this study falls at the upper end of this range. The success of the GCTWF hinges on its ability as an independent entity to securely manage funds from multiple sources and undertake restoration activities effectively and efficiently, following best practice guidelines for IAP clearing. Recent research suggests that there is a sufficient consumer surplus and potential to raise domestic water tariffs to cover the estimated costs required to restore catchment areas supplying water to some of these municipalities.51,52
The results from this study provide evidence at scale that investing in ecological infrastructure is a cost-effective and worthwhile long-term option for all of South Africa’s water supply systems. However, given that state budgets remain the primary source of restoration funding in the country and are heavily constrained, catchment partnerships and water funds are most likely needed to succeed in leveraging the investment needed to restore these important catchments.
Conclusions
Acknowledgements
We thank the Water Research Commission (South Africa) for providing the opportunity to conduct this research and for their funding of the project.
Competing interests
We have no competing interests to declare.
Authors’ contributions
K.M.E.W.: Data collection, data analysis, data curation, writing –initial draft, project management. J.K.T.: Student supervision, conceptualisation, project leadership, writing – initial draft, methodology. G.K.L.: Student supervision, project leadership, writing – initial draft, methodology, funding acquisition.
references
We found that investing in IAP clearing is a viable means of addressing growing water demands in 10 of South Africa’s 11 major water supply areas. IAP clearing would lead to a total estimated streamflow gain of 1595 million m3 and a yield gain of 997 million m3 by 2050, equivalent to a quarter of the yield gains through implementation of built infrastructure interventions over the same period. The URVs for built infrastructure rangedfromZAR0.48/m3 toZAR44.36/m3,whiletheURVsforIAPclearing ranged from ZAR0.79/m3 to ZAR7.18/m3. All URVs for IAP clearing were lower than that of built infrastructure interventions, except for just one water supply system, the Orange River System. Therefore, IAP clearing should be considered a formal intervention for securing future water supply alongside built infrastructure options in South Africa’s water supply systems. These findings add to the growing body of literature that advocates for ecological infrastructure investments to secure hydrological ecosystem services by showing that such approaches can be more cost-effective than built infrastructure development options. The findings should be used to leverage and prioritise investments in ecological infrastructure in South Africa and to encourage the initiation of new partnerships and funds for priority catchment areas.
1. Howard G, Calow R, Macdonald A, Bartram J. Climate change and water and sanitation: Likely impacts and emerging trends for action. Annu Rev Environ Resour. 2016;41:253–276. https://doi.org/10.1146/annurev-environ-11061 5-085856
2. South African Department of Water Affairs (DWA). National water resource strategy. 2nd ed. Pretoria: DWA; 2013.
3. Prinsloo FW, Scott DF. Streamflow responses to the clearing of alien invasive trees from riparian zones at three sites in the Western Cape Province. S Afr For J. 1999;185(1):1–7. https://doi.org/10.1080/102959 25.1999.9631220
4. Görgens AHM, Van Wilgen BW. Invasive alien plants and water resources in South Africa: Current understanding, predictive ability and research challenges. S Afr J Sci. 2004;100(1–2):27–33.
5. Le Maitre DC, Forsyth GG, Dzikiti S, Gush MB. Estimates of the impacts of invasive alien plants on water flows in South Africa. Water SA. 2016;42(4):659–672. https://doi.org/10.4314/wsa.v42i4.17
6. Van Wilgen BW, Raghu S, Sheppard AW, Schaffner U. Quantifying the social and economic benefits of the biological control of invasive alien plants in natural ecosystems. Curr Opin Insect Sci. 2020;38:1–5. https://doi.org/10. 1016/j.cois.2019.12.004 WSS % IAPs
Volume 120| Number 5/6 May/June 2024 77 https://doi.org/10.17159/sajs.2024/17378 Research Article Viability of investing in ecological infrastructure Page 7 of 9
range of built infrastructure urVs (ZAr/m3) urV IAP clearing (ZAr/m3) 20222050
WSS 7.2628.686.77 – 25.622.99
Algoa
Amatole WSS 22.0058.228.46
Luvuvhu-Letaba
Limpopo WMA North 1.407.5017.95a 2.53
WSS 1.147.103.98 – 17.32b 2.60
7. Turpie JK, Letley G, Schmidt K, Weiss J, O’Farrell P, Jewitt D. The potential costs and benefits of addressing land degradation in the Thukela catchment, KwaZulu-Natal, South Africa. Pretoria: Natural Capital Accounting and Valuation of Ecosystem Services (NCAVES); 2021.
8. Pringle C, Bredin I, McCosh J, Dini J, Zunckel K, Jewitt G, et al. An investment plan for securing ecological infrastructure to enhance water security in the uMngeni River catchment. Midrand: Green Fund, Development Bank of Southern Africa; 2015.
9. Mander M, Jewitt G, Dini J, Glenday J, Blignaut J, Hughes C, et al. Modelling potential hydrological returns from investing in ecological infrastructure: Case studies from the Baviaanskloof-Tsitsikamma and uMngeni catchments, South Africa. Ecosyst Serv. 2017;27:261–271. https://doi.org/10.1016/j.ecoser.20 17.03.003
10. Hughes CJ, De Winnaar G, Schulze RE, Mander M, Jewitt GPW. Mapping of water-related ecosystem services in the uMngeni catchment using a daily time-step hydrological model for prioritisation of ecological infrastructure investment – part 1: Context and modelling approach. Water SA. 2018;44(4):577–589. https://doi.org/10.4314/wsa.v44i4.07
11. Gokool S, Jewitt GPW. Identifying hotspots for investment in ecological infrastructure within the uMngeni catchment, South Africa. Phys Chem Earth. 2019;114, Art. #102807. https://doi.org/10.1016/j.pce.2019.11.003
12. Jewitt G, Sutherland C, Browne M, Stuart-Hill S, Risko S, Martel P, et al. Enhancing water security through restoration and maintenance of ecological infrastructure: Lessons from the uMngeni River Catchment. Vol I: Final report. WRC report no. TT 815/20. Pretoria: Water Research Commission; 2020.
13. Dasgupta P. The economics of biodiversity: The Dasgupta review. J Polit Ecol. 2021;28.
14. Marais C. An economic evaluation of the invasive alien plant control programmes in the mountain catchment areas of the Western Cape Province, South Africa [PhD dissertation]. Stellenbosch: Stellenbosch University; 1998.
15. Turpie JK, Marais C, Blignaut JN. The working for water programme: Evolution of a payments for ecosystem services mechanism that addresses both poverty and ecosystem service delivery in South Africa. Ecol Econ. 2008;65(4):788–798. https://doi.org/10.1016/j.ecolecon.2007.12.024
16. United Nations Environmenta Assembly (UNEA). Resolution 73/284: United Nations Decade on Ecosystem Restoration (2021–2030) [cited 2021 May 31]. Nairobi: UNEA; 2019. Available from: https://undocs.org/A/RES/73/284
17. International Union for Conservation of Nature. Land degradation neutrality: Implications and opportunities for conservation. Technical Brief. 2015;November:19. Available from: https://portals.iucn.org/library/node/47869
18. Mbopha MS, Marais C, Kleynhans TE, Esler KJ. Unlocking and securing ecological infrastructure investments: The needs and willingness to invest and institutional support mechanisms used. S Afr J Sci. 2021;117(9/10):39–45. https://doi.org/10.17159/sajs.2021/8666
19. Brauman KA, Daily GC, Duarte TK, Mooney HA. The nature and value of ecosystem services: An overview highlighting hydrologic services. Annu Rev Environ Resour. 2007;32:67–98. https://doi.org/10.1146/annurev.energy.32 .031306.102758
20. Postel SL, Thompson BH. Watershed protection: Capturing the benefits of nature’s water supply services. Nat Resour Forum. 2005;29:98–108. https:/ /doi.org/10.1111/j.1477-8947.2005.00119.x
21. Bonnesoeur V, Locatelli B, Guariguata MR, Ochoa-Tocachi BF, Vanacker V, Mao Z, et al. Impacts of forests and forestation on hydrological services in the Andes: A systematic review. For Ecol Manage. 2019;433:569–584. https ://doi.org/10.1016/j.foreco.2018.11.033
22. Carvalho-Santos C, Pradinho J, Hein L. Hydrological services and the role of forests: Conceptualization and indicator-based analysis with an illustration at a regional scale. Ecol Complex. 2014;20:69–80. https://doi.org/10.1016/j.e cocom.2014.09.001
23. Hanna DEL, Raudsepp-Hearne C, Bennett EM. Effects of land use, cover, and protection on stream and riparian ecosystem services and biodiversity. Conserv Biol. 2019;34(1):244–255. https://doi.org/10.1111/cobi.13348
24. Holden PB, Rebelo AJ, Wolski P, Odoulami RC, Lawal KA, Kimutai J, et al. Nature-based solutions in mountain catchments reduce impact of anthropogenic climate change on drought streamflow. Commun Earth Environ. 2022;3(1):1–12. https://doi.org/10.1038/s43247-022-00379-9
25. Maze K, Driver A. Mainstreaming ecological infrastructure in planning and investment. In: Swilling M, Musango J, Wakeford J, editors. Greening the South African Economy: Scoping the issues, challenges and opportunities. Cape Town: UCT Press; 2016. p. 286–302.
26. Wertz-Kanounnikoff S, Locatelli B, Wunder S, Brockhaus M. Ecosystembased adaptation to climate change: What scope for payments for environmental services? Clim Dev. 2011;3(2):143–158. https://doi.org/10. 1080/17565529.2011.582277
27. Vogl AL, Goldstein JH, Daily GC, Vira B, Bremer L, McDonald RI, et al. Mainstreaming investments in watershed services to enhance water security: Barriers and opportunities. Environ Sci Policy. 2017;75:19–27. https://doi.or g/10.1016/j.envsci.2017.05.007
28. Rebelo AJ, Holden PB, Esler K, New MG. Benefits of water-related ecological infrastructure investments to support sustainable land-use: A review of evidence from critically water-stressed catchments in South Africa. R Soc Open Sci. 2021;8, Art. #201402. https://doi.org/10.1098/rsos.201402
29. South African Department of Water and Sanitation (DWS). Current status of published national and provincial reconciliation strategies: Long-term plan for reconciling water supply and demand for most of the catchments in South Africa [PowerPoint presentation]. c2022 [cited 2022 Apr 23]. Available from: https://pmg.org.za/committee-meeting/34637/
30. South African National Committee on Large Dams (SANCOLD). South African register of large dams [data set]. c2018 [cited 2022 Apr 05]. Available from: https://sancold.org.za/sa-register-of-large-dams/
31. South African Department of Water and Sanitation (DWS). Catchments of South Africa – quaternary [data set]. c2011 [cited 2022 Feb 15]. Available from: http://www.sasdi.net/metaview.aspx?uuid=d83ff9c0965b1a2d4a145 7b80677ce1f#
32. Kotzé JDF, Beukes BH, Van den Berg EC, Newby TS. National invasive alien plant survey [data set]. c2010 [cited 2022 Jan 29]. Available from: http://bgi s.sanbi.org/SpatialDataset/Detail/416
33. Preston IR, Le Maitre DC, Blignaut JN, Louw L, Palmer CG. Impact of invasive alien plants on water provision in selected catchments. Water SA. 2018;44(4):719–729. http://dx.doi.org/10.4314/wsa.v44i4.20
34. South African Department of Forests, Fisheries and the Environment (DFFE). South African National Land Cover (SANLC) 2020 [data set]. c2021 [cited 2022 Feb 10]. Available from: https://egis.environment.gov.za/data_egis/da ta_download/current
35. Le Maitre DC, Blignaut JN, Clulow A, Dzikiti S, Everson CS, Görgens AHM, et al. Impacts of plant invasions on terrestrial water flows in South Africa. In: Van Wilgen BW, Measey J, Richardson DM, Wilson JR, Zengeya TA, editors. Biological invasions in South Africa. Berlin: Springer Nature; 2020. p. 431–457.
36. Turpie JK, Forsyth K, Seyler H, Howard G, Letley G. Identification of priority areas for clearing invasive alien plants from Greater Cape Town’s water supply catchment areas. Technical report no: AEC/1762/1. Cape Town: Anchor Environmental; 2019.
37. Van Niekerk PH, Du Plessis JA. Unit reference value: Application in appraising inter-basin water transfer projects. Water SA. 2013;39(4):549–554. https://d oi.org/10.4314/wsa.v39i4.14
38. Cullis JDS, Görgens AHM, Marais C. A strategic study of the impact of invasive alien plants in the high rainfall catchments and riparian zones of South Africa on total surface water yield. Water SA. 2007;33(1):35–42. http s://doi.org/10.4314/wsa.v33i1.47869
39. South African Department of Water and Sanitation (DWS). The national water and sanitation master plan: Ready for the future and ahead of the curve. Pretoria: DWS; 2019.
40. South African Department of Water Affairs (DWA). Development of reconciliation strategies for large bulk water supply systems: Orange River. Pretoriaouth Africa: Department of Water Affairs; 2015.
41. South African Department of Water and Sanitation (DWS). Crocodile (West) River reconciliation strategy 2015. Pretoria: DWS; 2015.
42. Muller M, Biswas A, Martin-Hurtado R, Tortajada C. Built infrastructure is essential. Science. 2015;349(6248):585–586. https://doi.org/10.1126/scie nce.aac7606
Volume 120| Number 5/6 May/June 2024 78 https://doi.org/10.17159/sajs.2024/17378 Research Article Viability of investing in ecological infrastructure Page 8 of 9
43. Morokong T, Blignaut J, Nkambule NP, Mudhavanhu S, Vundla T. Clearing invasive alien plants as a cost-effective strategy for water catchment management: The case of the Olifants River catchment, South Africa. S Afr J Econ Manag Sci. 2016;19(5):774–787. https://doi.org/10.4102/sajems.v 19i5.1594
44. NkambuleNP,BlignautJN,VundlaT,MorokongT,MudavanhuS.Thebenefitsand costs of clearing invasive alien plants in northern Zululand, South Africa. Ecosyst Serv. 2017;27:203–223. http://dx.doi.org/10.1016/j.ecoser.2017.04.011
45. RodriguezDJ,VanDenBergC,McMahonA.Investinginwaterinfraestructure: Capital, operations and maintenance. World Bank Water Papers. 2012;52.
46. Acreman M, Smith A, Charters L, Tickner D, Opperman J, Acreman S, et al. Evidence for the effectiveness of nature-based solutions to water issues in Africa. Environ Res Lett. 2021;16(6), Art. #063007. https://doi.org/10.108 8/1748-9326/ac0210
47. Tlou T, Fisher-Jeffes L, Singh A. The support for the implementation and maintenance of the water reconciliation strategy for the Western Cape Water Supply System. Pretoria: DWS; 2021.
48. South African Department of Water and Sanitation (DWS). Support on the continuation of the reconciliation strategy of the KwaZulu-Natal Coastal metropolitan area: Phase 2. P WMA 04/000/00/3517. Pretoria: DWS; 2017.
49. South African Department of Water and Sanitation (DWS). Implementation and maintenance of the water reconciliation strategy for Richard’s Bay and surrounding towns: Water Reconciliation Strategy. P WMA 04/ W100/00/9218/7. Pretoria: DWS; 2021.
50. The Nature Conservancy. Greater Cape Town Water Fund Business Case. Cape Town: The Nature Conservancy; 2018.
51. Turpie JK, Letley G. Cape Town residents’ willingness to pay for a secure and ‘green’ water supply. Water SA. 2023;49(4):327–337. https://doi.org/10.17 159/wsa/2023.v49.i4.4002
52. Du Plessis NS, Turpie J, Letley G. Feasibility of financing nature-based solutions for water security through water tariffs: Evidence from South Africa. Aqua Water Infrastruct Ecosyst Soc. 2024;73(2):152–166. https://doi.org/1 0.2166/aqua.2024.221
Volume 120| Number 5/6 May/June 2024 79 https://doi.org/10.17159/sajs.2024/17378 Research Article Viability of investing in ecological infrastructure Page 9 of 9
AuthorS:
Nomasonto P. Dlamini1,2
Patricks V. Otomo1,2
AFFILIAtIoNS:
1Department of Zoology and Entomology, University of the Free State, Phuthaditjhaba, South Africa
2Afromontane Research Unit, University of the Free State, Phuthaditjhaba, South Africa
CorrESPoNDENCE to: Nomasonto Dlamini
EMAIL:
2013096462@ufs4life.ac.za
DAtES:
received: 30 Jan. 2023
revised: 30 Jan. 2024
Accepted: 08 Feb. 2024
Published: 28 May 2024
hoW to CItE:
Dlamini NP, Otomo PV. Use of biochar to improve sewage sludge quality in Maluti-A-Phofung Municipality, South Africa. S Afr J Sci. 2024;120(5/6), Art. #15521. https://doi.org/10.1715 9/sajs.2024/15521
ArtICLE INCLuDES:
☒ Peer review
☐ Supplementary material
DAtA AVAILABILItY:
☐ Open data set
☒ All data included
☐ On request from author(s)
☐ Not available
☐ Not applicable
EDItor: Sydney Moyo
KEYWorDS:
sewage sludge, wastewater treatment, biochar, biochar remediation, Eisenia fetida
FuNDING: South African National Research Foundation
Use of biochar to improve sewage sludge quality in Maluti-A-Phofung Municipality, South Africa
Research on wastewater treatment processes in Maluti-a-Phofung Municipality (South Africa) has revealed that substandard wastewater management in this region contributes to terrestrial and aquatic pollution. Because this pollution poses a threat to the environment, there is a pressing need to reduce the environmental impact of poorly managed sewage sludge in the region. Biochar has been regarded as a cost-effective way of reducing chemical toxicity in terrestrial environments. In the present study, we aimed to investigate the effectiveness of biochar in the remediation of the toxicity of sewage sludge using the earthworm Eisenia fetida. Sewage sludge was collected from a local wastewater treatment plant and E. fetida were exposed to 0, 25, 50, and 100% non-amended and 10% biochar-amended sludge. After 28 days, survival, biomass and reproduction were assessed. Separately, in clean artificial soil, E. fetida was exposed to 5, 10 and 15% biochar amendment for 96 hours to determine if biochar amendment alone could be harmful to E. fetida. The results showed no significant differences in all parameters between the worms exposed to non-amended sludge and 10% biochar-amended sludge. Assessment of acetylcholinesterase and catalase activities in the earthworms that were exposed to biochar via clean soil revealed that 10% and 15% biochar amendment rates caused the worms to experience significant levels of neurotoxic and oxidative stress (p < 0.05). These findings reveal that biochar alone is likely to have adverse effects on soil organisms, and amendment rates higher or equal to 10% are not suitable to alleviate the toxic effects of sewage sludge.
Significance:
This study can be used as a reference in the usage of biochar as a toxicity remediator. Different biochar rates (≥ 10%) can have different effects on soil-dwelling organisms. Policymakers can use this study when constructing laws regarding the disposal of sewage sludge by wastewater treatment plants.
Introduction
Sewage sludge is one of the by-products of the wastewater treatment process. It contains high levels of organic matter and nutrients and is valued for agricultural application.1,2 Studies show that the addition of sludge to degraded soils leads to soil restoration and fertilisation which results in increased crop production.1,3 Despite this benefit, sewage sludge is still regarded as waste with a potential for significant risk to the environment4, especially if applied without proper chemical and ecotoxicological consideration4,5
Sewage sludge is usually disposed of via landfilling, incineration, and cropland application.6 Other than its enhancing effect on soil productivity, biochar use in cropland application has gained attention as a means of waste disposal.7 Some of the disadvantages of this method of disposal include odours, aesthetics, the high load of pathogenic microorganisms, and the high concentrations of both metals and organic pollutants.8,9 Research has demonstrated the potential for sewage sludge to induce behavioural abnormalities, increase mortality and inhibit the growth of invertebrates.4 Klee et al.10 observed that sewage sludge can induce genotoxic effects in the earthworm Eisenia andrei. Malińska et al.11 reported that the heavy metals from sewage sludge can bioaccumulate in earthworm tissues, which poses a risk to the food chain because of potential biomagnification.12
Specifications from the existing South African sludge management regulations indicate three categories of sewage sludge: a microbiological class, a stabilisation class, and a pollutant class.13 The pollutant class depends on the concentration of eight potentially toxic metals: arsenic (As), cadmium (Cd), chromium (Cr), copper (Cu), lead (Pb), mercury (Hg), nickel (Ni), and zinc (Zn).13 The concentration of these metals is used to further classify the sludge into three subclasses, which are: pollutant class a (best quality), pollutant class b (intermediate quality) and pollutant class c (worst quality).13,14
The known toxicity of sewage sludge has prompted the need to find affordable and effective means of decreasing its potential deleterious effects before it is discarded through landfilling or harnessed for agricultural application.6 Biochar has been identified as a suitable candidate to play such a role in reducing the toxic effects of sewage sludge.15 Biochar is a solid material obtained from the pyrolysis of a wide range of plant and animal biomasses.16 Together with bio-oil and biofuel, biochar is one of the by-products of this process.17-19 Several studies dealing with the application of select biochar types to contaminated soils have reported successful reduction in the toxicity, bioavailability and leachability of soil contaminants.20-28
In the present study, we aimed to investigate the effectiveness of biochar in the remediation of the toxicity of sewage sludge on the survival, reproduction, and biomass of the earthworm Eisenia fetida. A secondary aim was to assess, at the biomarker level, if biochar on its own could prove detrimental to earthworms. We hypothesised that the inclusion of biochar in the soil would improve the survival, reproduction and biomass of the earthworms. We also expected that the potential beneficial effects of biochar at the level of the whole organism would be supported by concurrent biomarker responses within the organism.
80 https://doi.org/10.17159/sajs.2024/15521 Volume 120| Number 5/6 May/June 2024 © 2024.
Published under a Creative Commons Attribution Licence. Research
The Author(s).
Article
Materials and methods
Study area
Sewage sludge was collected from the wastewater treatment plant (WWTP) in Harrismith (28°16’46.5”S; 29°05’46.9”E). This town is located in the Maluti-A-Phofung municipality within the Drakensberg Afromontane region of the eastern Free State Province of South Africa. The area rises from 1500 m to 2400 m above sea level and experiences summer rainfall (www.floodmap.net). The chosen WWTP receives wastewater from neighbouring households and industries in the region, which is a densely populated peri-urban economic hub, with several industries such as textile, dairy, and aluminium industries.29
Experimental organism
Adult E. fetida earthworms bred in the Ecotoxicology Laboratory, housed in the Department of Zoology and Entomology of the University of the Free State, QwaQwa Campus, were used as the experimental organism. The earthworms were maintained on a diet consisting only of dried cow dung .
Preparation of exposure substrates
Preparation of soil
The artificial soil used during this study was prepared following the Organisation for Economic Co-operation and Development (OECD) guidelines.30 The soil was composed of 20% kaolin clay, 70% air-dried quartz sand, and 10% sphagnum peat (pH of 5.5–6.5). The prepared OECD artificial soil was used both as a clean control substrate and in the preparation of varying concentrations (amendment rates) of sewage sludge.
Preparation of non-biochar amended sewage
The sewage sludge was dried at room temperature before use. After drying, it was blended and sieved through a 2 mm sieve. Non-biochar amended sewage was prepared by mixing OECD artificial soil with sewage sludge. The mixing was carried out to make the following concentrations of the sludge: 0 (OECD artificial soil control), 25, 50, and 100% sewage sludge. The total exposure substrate weight per treatment was 500 g. Distilled water was used to moisten each soil treatment to 40–60% of their respective water-holding capacity.30
Preparation of biochar amended sewage sludge
Biochar from pine wood obtained in pellet form was purchased from C FERT™ South Africa. According to the manufacturer, it was made at a pyrolysis temperature range of 400–500 °C. This produced a biochar with about 100 μm pore size on average and containing 30.35% carbon, 3.54% nitrogen, 0.13% potassium, 0.02% phosphorus, 20.31% calcium, 0.34% magnesium, and 0.14% sulfur. Biochar-amended substrates were made by replacing 50 g of the 500 g non-amended OECD/sewage substrates with 50 g of biochar for each concentration (including the control), thus making a 10% biochar amendment. Thus, a 10% biochar amendment rate was applied to the 0, 25, 50, and 100% sludge treatments. Distilled water was used to moisten each biocharamended treatment to 40–60% of their respective water-holding capacity. All the treatments were prepared and left undisturbed for 7 days before exposure. This was necessary to allow for biochar activation by the microorganisms in the sewage sludge.
Metal contents of the sewage sludge
The total concentrations of arsenic (As), cadmium (Cd), chromium (Cr), copper (Cu), lead (Pb), mercury (Hg), nickel (Ni), and zinc (Zn) in the sewage sludge were determined following the EPA 3052 digestion method31, while the concentrations of metals readily available in the water phase of the soil were obtained through the water extraction method.14 These analyses were performed at the Institute for Soil, Climate, and Water (an Institute of the South African Agricultural Research Council located in Pretoria, Gauteng Province). Inductively coupled plasma-optical emission spectroscopy (ICP-OES) (PerkinElmer Optima 3000 DV) was used to determine the concentrations of the metals of interest.
Ecotoxicological assays
Prior to exposure, the earthworms were weighed, and their masses were recorded. Ten adult E. fetida were exposed to the biochar-amended and non-amended treatments and incubated at 20 ± 2 °C (in a Labcon low-temperature incubator) for 28 days. All exposures were carried out in triplicate. During the exposure period, the worms were fed 5 g of ground and moist cattle manure once a week. After 4 weeks, the earthworms were weighed once again, and their masses were recorded. The number of cocoons laid in each treatment was recorded. To assess whether biochar on its own could prove detrimental to earthworms at biomarker level, in another experiment, we exposed 10 adult E. fetida to 500 g of OECD artificial soil (no sewage sludge involved) amended with 0, 5, 10, and 15% biochar. The exposures conducted in triplicate were incubated at 20 ± 1 °C (in a Labcon low-temperature incubator) for a duration of 4 days. This exposure duration was chosen both to fill a gap in the literature because studies on biochar often last longer26,32-34, and to increase the chances of observing biomarker responses, which can peak in the early days of the experiment and vanish after relatively longer exposure durations35. No feeding took place during the exposure period. After 96 h, the worms were stored at 80 °C until acetylcholinesterase (AChE) and catalase analyses.
Determination of acetylcholinesterase activity
Acetylcholinesterase (AChE) is an enzyme involved in the hydrolysis of acetylcholine (which is an essential neurotransmitter of the central nervous system) into choline.36 The enzyme was measured to find out whether the sewage sludge had neurotoxic effects on the earthworms. To prepare tissue homogenates for AchE activity, two worms from each exposure treatment were defrosted. Three to five segments of the tail end were sectioned for the assessment of AChE activity and protein determination. Tris-buffer (pH 7.4) was used to homogenise the tissues, which were centrifuged at 9500 g for 10 min at 4 °C. Supernatants were then used for AChE and protein analyses. The protein concentrations of the homogenates were determined using the Bradford method.37 Ellman’s method38 was used for the assessment of AChE activity. For each tissue homogenate, measurements were made in triplicate. AChE activity was determined by calculating the average absorbance of the readings at each time interval from time 0 to time 6 min. Readings were done at 412 nm in 1-min intervals over a 6-min period. The linear graph for each sample was drawn and expressed as the change in absorbance over time. Then, the gradient was calculated for each sample curve and divided by 6 (minutes). AChE activity was calculated as follows: (Absorbance/min/mg protein) = (Abs/min)/mg protein.
Determination of catalase activity
Catalase activity was determined following the method of Cohen et al.39 The reaction mixture contained the sample homogenate (10 µL) in 10 µL of 0.09 M phosphate buffer (pH 7.0) and 93 µL of 6 mM (30%) hydrogen peroxide, 19 µL of 6 N sulfuric acid and 130 µL of 0.01 N potassium permanganate. The degradation of hydrogen peroxide by the catalase present in the samples was measured within 60 s at 490 nm and expressed in μmol H2O2/min/mg protein.
Statistical analysis
The data obtained from this study were subjected to statistical analysis using Microsoft Excel 2010 and GraphPad Prism version 13.2. Statistical analyses of survival, reproduction, biomass and acetylcholinesterase activity data were performed in GraphPad Prism using a one-way ANOVA followed by a Bonferroni post-test for pairwise comparisons. The level of significance was p < 0.05. Finally, ToxRat® version 2.10.05 was used to generate median lethal concentrations (LC50) and half-maximal effective concentrations (EC50) whenever possible.
results and discussion
Concentration of heavy metals in sewage sludge
Using the EPA 3052, the concentration of metals observed in sewage sludge in this study were in the following order: Zn > Cu > Pb > Cr >
Volume 120| Number 5/6 May/June 2024 81 https://doi.org/10.17159/sajs.2024/15521 Research
Biochar to improve sewage sludge quality Page 2 of 8
Article
Ni > As > Hg > Cd, varying from 840 mg/kg for Zn to 0.66 mg/kg for Cd (Table 1). The water extraction method revealed the following order: Zn > Cu > Ni > Hg > As > Cd > Pb > Cr, varying from 4.76 mg/kg for Zn to 0.03 mg/kg for Cr. (Table 1). When comparing the EPA 3052 and the water extraction data, it was discovered that Zn was the chemical with the highest concentration in both methods, while Cd had the lowest concentration in the EPA 3052, and Cr had the lowest concentration in the water extraction method. This trend is consistent with the findings of Berrow and Webber40, Zufiaurre et al.41 and Mosolloane et al.14, who reported concentrations of heavy metals in sewage sludge from treatment plants in England, Spain and South Africa, respectively. High total concentrations of metals indicate that the wastewater treatment plants receive raw sewage from anthropogenic sources like industries and domestic activities, while high concentrations of Zn and Cu can be attributed to the high organic content of the sewage sludge.41,42 In South Africa, the works of Snyman and Herselman43 and Herselman and Snyman13 are used to classify sewage sludge based on the concentration thresholds of the following metals: As, Cd and Hg (40 mg/kg); Ni and Pb (420 mg/kg); Cr, Cu and Zn (2800 mg/kg). The total metal concentrations of the sewage sludge used in this study were evaluated using this classification system; consequently, the sewage was classified as ‘best quality’
pollutant class a sludge. It was found that, when combining the concentrations of As, Cd and Hg, they summed to 3.68 mg/kg, which is below the threshold of 40 mg/kg. The concentrations of Ni and Pb added up to 62.51 mg/kg, which did not exceed the threshold of 420 mg/kg. Finally, Cr, Cu and Zn added up to 1001.61 mg/kg, which was below the threshold of 2800 mg/kg (Table 1). Therefore, from the results of the total metal analysis, the concentrations of metals were below the specified limits.
Nevertheless, the presence of these heavy metals in the sewage sludge and the water extract especially, implies that they could be a source of pollution and toxic stress in soils, especially in agricultural lands where they can accumulate to higher levels.44,45 The relatively low concentrations of metals in the water extract nevertheless point to lower potential for significant toxic effects. These metals were similarly found in minute quantities in the sewage sludge sampled from the same WWTP by Mosolloane et al.14
Ecotoxicological assays
Survival of Eisenia fetida in biochar-amended and non-amended sewage sludge
The results show that there was no significant difference (p > 0.05) in the survival rates of E. fetida exposed to biochar-amended and nonamended sewage sludge for 28 days (Figure 1). This indicates that the presence of biochar did not statistically affect or improve the odds of survival of E. fetida. Nevertheless, survival rates in the 25, 50 and 100% sewage sludge treatments was 100% (Figure 1). In comparison, in the absence of biochar in the same treatments, survival rates were 60, 80 and 90% for 25, 50 and 100% treatments, respectively. Such beneficial attributes of biochar to the survival of the earthworm E. fetida have been reported by several authors: Elliston and Oliver46 , Malińska et al.11, Malińska et al.47, Kim et al.48, Zhang et al.49 and Nyoka et al.26 Earthworms have been reported to thrive in sewage sludge amended with biochar by ingesting sewage and biochar particles, later dispersing them through casting.50 51 Domínguez et al.52 also reported that E. fetida utilises sewage sludge as a food source, thus its ability to do well in soil amended with sewage sludge. This report has been corroborated by the works of Contreras-Ramos et al.53 and Malińska et al.47 It is worth noting that a sewage sludge of ‘best quality’ class a should not inflict significant mortality on such terrestrial worms as previously reported by Mosolloane et al.14 using the portworm Enchytraeus albidus
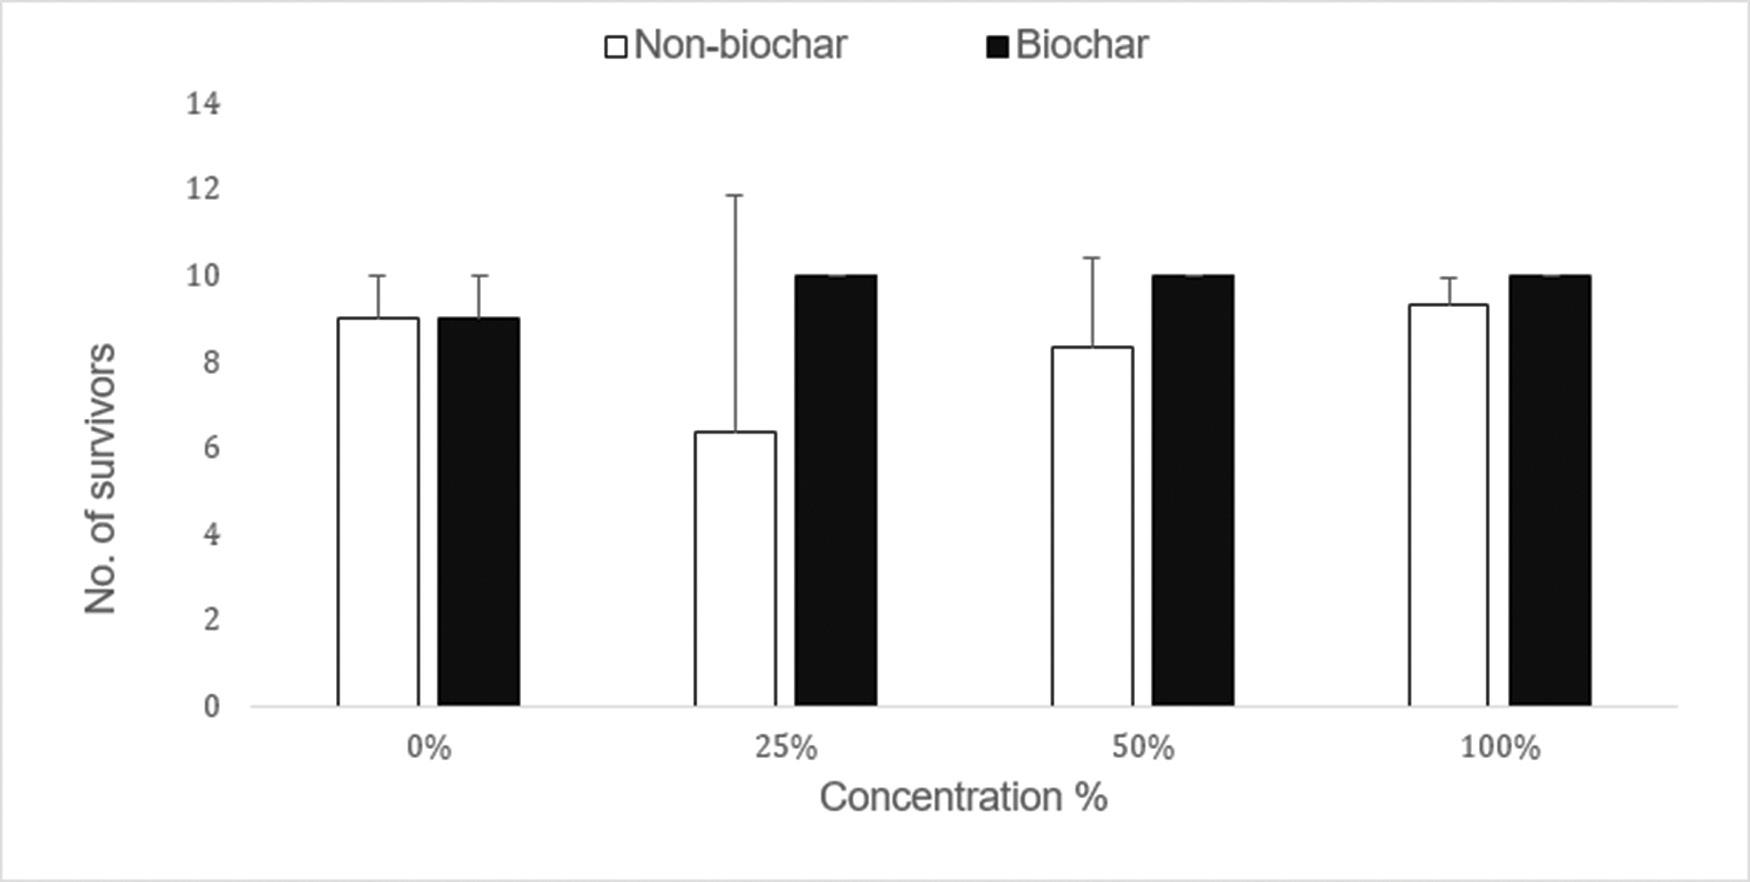
Volume 120| Number 5/6 May/June 2024 82 https://doi.org/10.17159/sajs.2024/15521 Research Article Biochar to improve sewage sludge quality Page 3 of 8
Metal (mg/kg)EPA 3052 methodWater extraction Cr22.110.03 Ni11.50.53 Cu139.50.88 Zn8404.76 Cd0.66 < 0.5 Pb51.01 < 0.2 Hg0.800.16 As2.220.14
table 1: Total EPA 3052 and water extraction results for metals that were found in the sewage sludge
Figure 1: Survival rate of adult Eisenia fetida worms at 20 °C after 28 days of exposure to non-biochar and 10% biochar amended sewage sludge from the Harrismith Wastewater Treatment Plant. Error bars represent standard deviations.
reproduction of Eisenia fetida in biochar-amended and non-amended sewage sludge
For both biochar-amended and non-amended sewage sludge, there was no significant reduction in cocoon production in the 100% (pure) sewage sludge when compared to the control (p > 0.05; Figure 2). Despite this observation, in pure sewage sludge, the reproduction of E. fetida was visibly hampered in both the biochar-amended and non-amended sewage sludge. This observation is similar to the findings of Mosolloane et al.14 who reported a lack of reproductive output in the pot worm Enchytraeus albidus after exposure to the pure sewage sludge from the same WWTP.
In the present study, the lack of significant differences in cocoon production between all the treatments indicates that biochar amendment did not improve the odds of reproduction in E. fetida. Although some authors, such as Gong et al.54 and Nyoka et al.34, have reported improved reproduction rates in E. fetida in biochar-amended soil, others, such as Li et al.33, have reported the contrary in the same species. The same dichotomy exists in enchytraeids, with some26 finding improved reproduction rates in Enchytraeus albidus and others55 reporting no effect of biochar on the reproduction of Enchytraeus crypticus. Dlamini and Voua Otomo56 have argued that these seemingly heterogeneous findings could be explained by differences in both biochar amendment rates and the sources of the feed used to make the biochar. Indeed, in both studies by Nyoka et al.26,34, an amendment rate of 10% biochar was used, and the biochar was made of pine wood. In the study by Gong et al.54, the rates varied from 0% to 6% and bamboo was used to make the biochar. Li et al.33 used apple wood chips as a source of their biochar and applied amendment rates ranging from 0% to 20%. Marks et al.55 used even greater rates, ranging from 0% to 50% with biochar made from poplar and pine wood.
Biomass change in Eisenia fetida exposed to biochar-amended and non-amended sewage sludge
After 28 days of exposure, there were no significant changes in the biomass of E. fetida in all amended and non-amended treatments except for the 50% biochar amended treatment in which a significant weight gain was observed (Figure 3). The results from this study are similar to the results obtained by Liesch et al.32 after they looked at the effect of pine chip biochar on the growth and survival of E. fetida. Although not always significant, Figure 3 reveals a slight increase in biomass in all biochar-amended treatments, indicating that the presence of biochar
has a somewhat positive effect on the biomass of E. fetida. This could be attributed to the fact that there was an increase in nutrient content in the soils amended with biochar. It has been reported that biochar can increase the capacity of the soil to absorb and replenish plant nutrients, which in turn has a positive impact on soil invertebrates.57,58 The observed increase in earthworm biomass is supported by the findings of Li et al.33 who reported biomass gains after incubating E. fetida for 28 days in soil amended with different rates (0.1,10, and 20%) of biochar produced from apple wood chips. Atkinson et al.59 reported that biochar can convert organic matter into useful and consumable nutrients or elements that soil invertebrates use as food, thus resulting in increases in biomass. However, other authors, such as Gomez-Eyles et al.60, have reported weight loss in E. fetida exposed to soil treated with deciduous, hardwood-derived biochar.
Acetylcholinesterase
activity of Eisenia fetida
After assessing the activity of AChE in different rates of biochar in the absence of sewage sludge, significantly high activity could only be observed in the 15% biochar amended soil (Figure. 4). These findings demonstrate that even in the absence of a pollutant, high biochar amendment levels, particularly above 15%, resulted in an increase in AChE activity. Khalid et al.61 claimed that adding biochar from corncob biomass to soils alone can harm earthworms at a molecular level, in addition to affecting their behaviour, growth and reproduction. Furthermore, they reported a substantial increase in AChE inhibition (i.e. low AChE activity) in the earthworm Pheretima posthuma at 5% and 10% amendment rates after 30 days of exposure in soil amended with 0, 5, 10, and 25% biochar. Such inhibition in AChE activity was not observed in the present study. The pine tree biochar assessed herein favoured biochar activity, especially in the 15% amendment rate. The divergence in findings between our studies could be due to differences in both the biomass used to create the biochar and the duration of exposure, which was substantially shorter in our case (4 vs 30 days).
Catalase activity of Eisenia fetida
Catalase activity was similar in the earthworms exposed to all biochar amendment rates except for the 10% amendment in which it was significantly higher. This indicates an increase in oxidative stress associated with greater rates of biochar amendment (Figure 5), especially considering that catalase activity was statistically similar in both highest amendment rates.
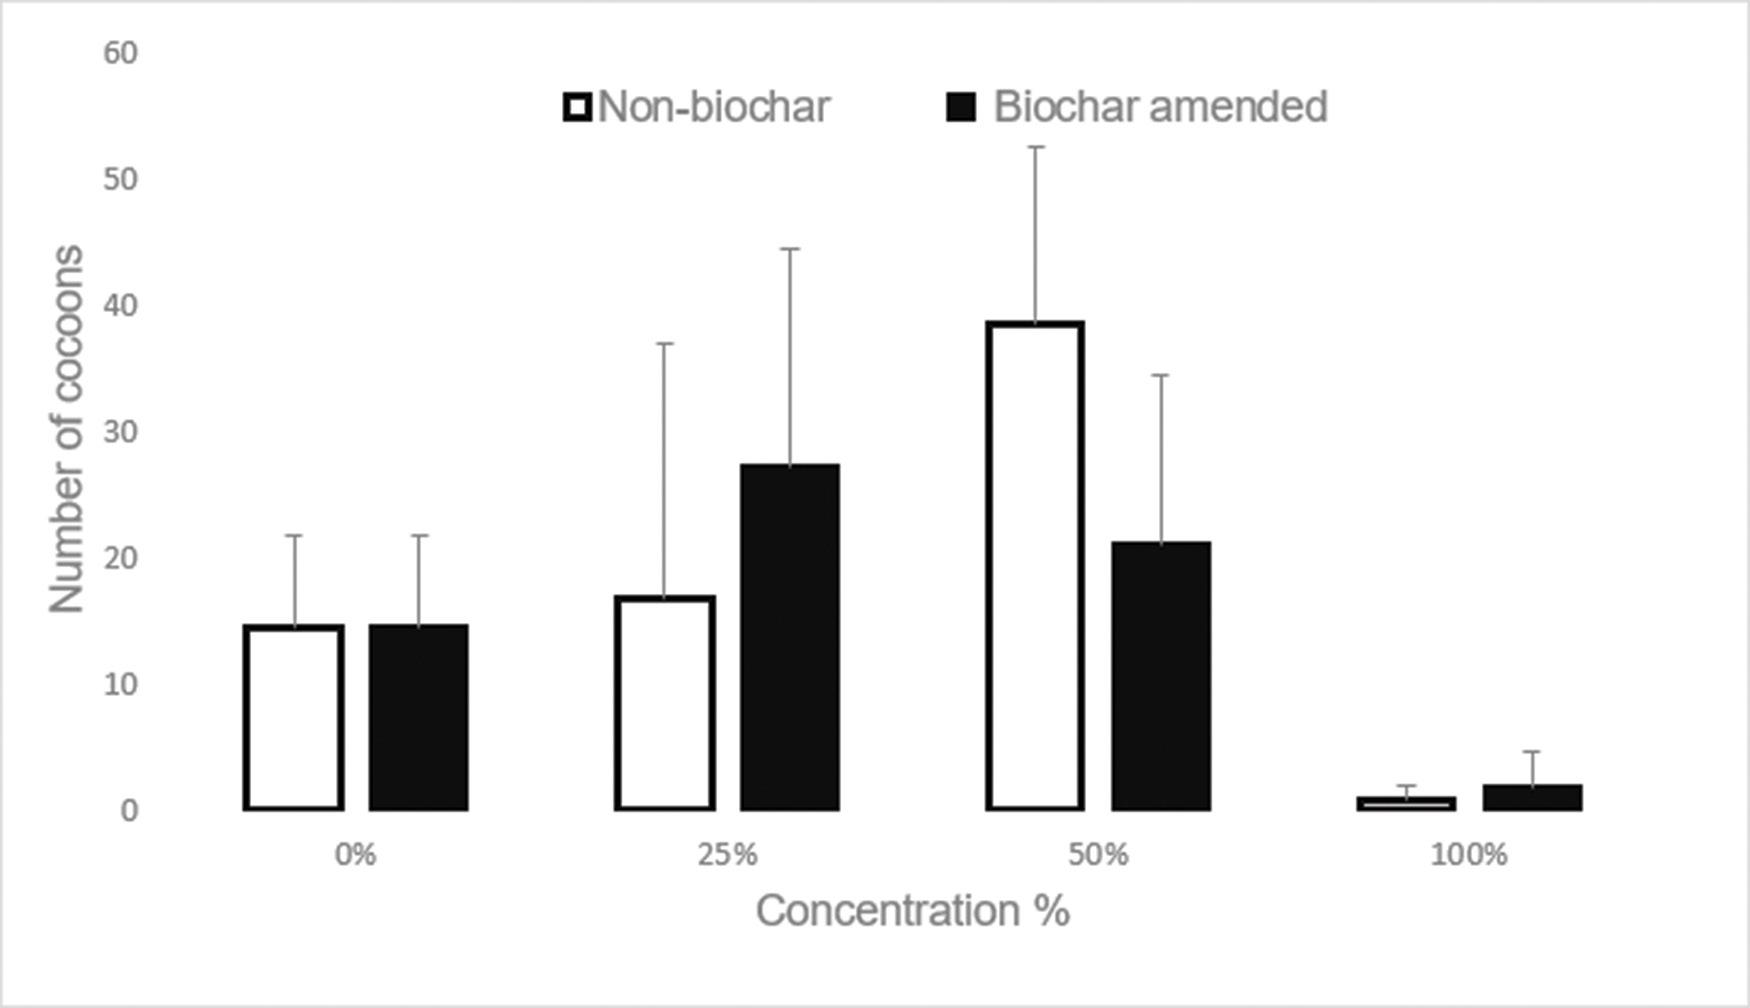
Volume 120| Number 5/6 May/June 2024 83 https://doi.org/10.17159/sajs.2024/15521 Research
Biochar to improve sewage sludge quality Page 4 of 8
Article
Figure 2: Number of Eisenia fetida cocoons produced at 20 °C after 28 days of exposure to non-biochar and 10% biochar amended sewage from the Harrismith Wastewater Treatment Plant.Error bars represent standard deviations.
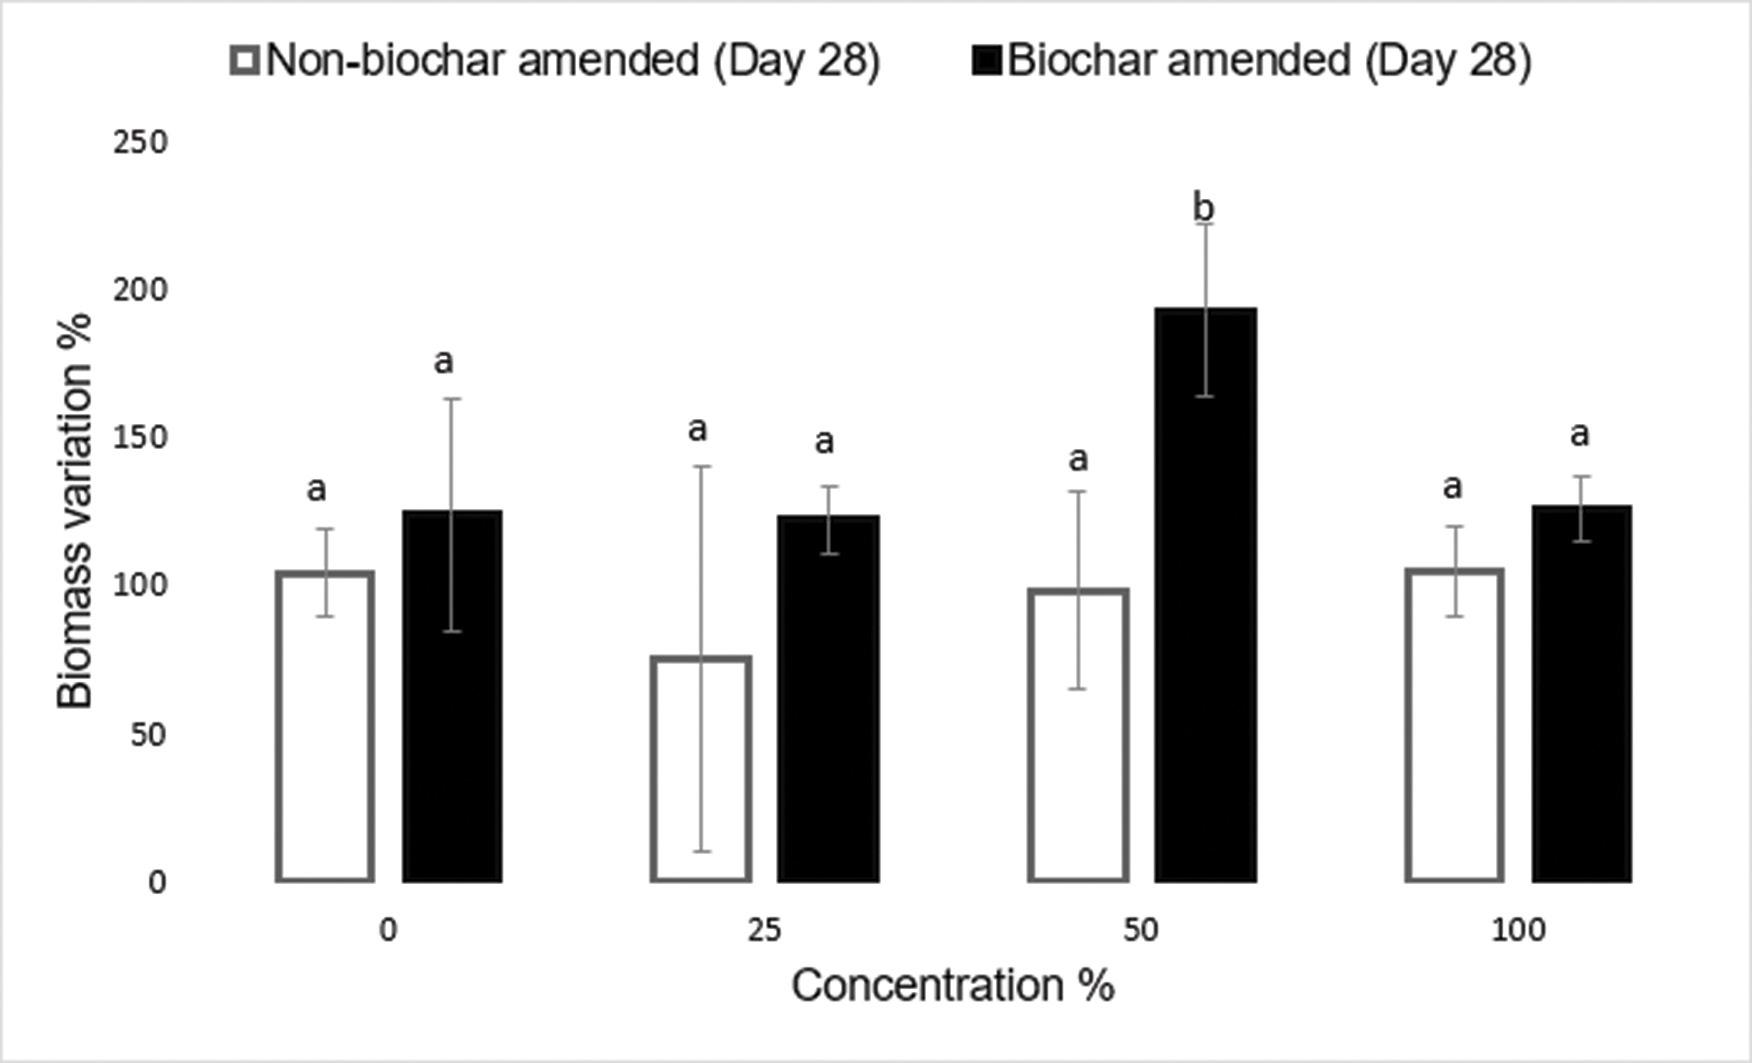
Figure 3: Comparison of the biomass of Eisenia fetida at 20 °C before and after 28 days of exposure to non-biochar and 10% biochar amended sewage sludge from the Harrismith Wastewater Treatment Plant. Error bars represent standard deviations.
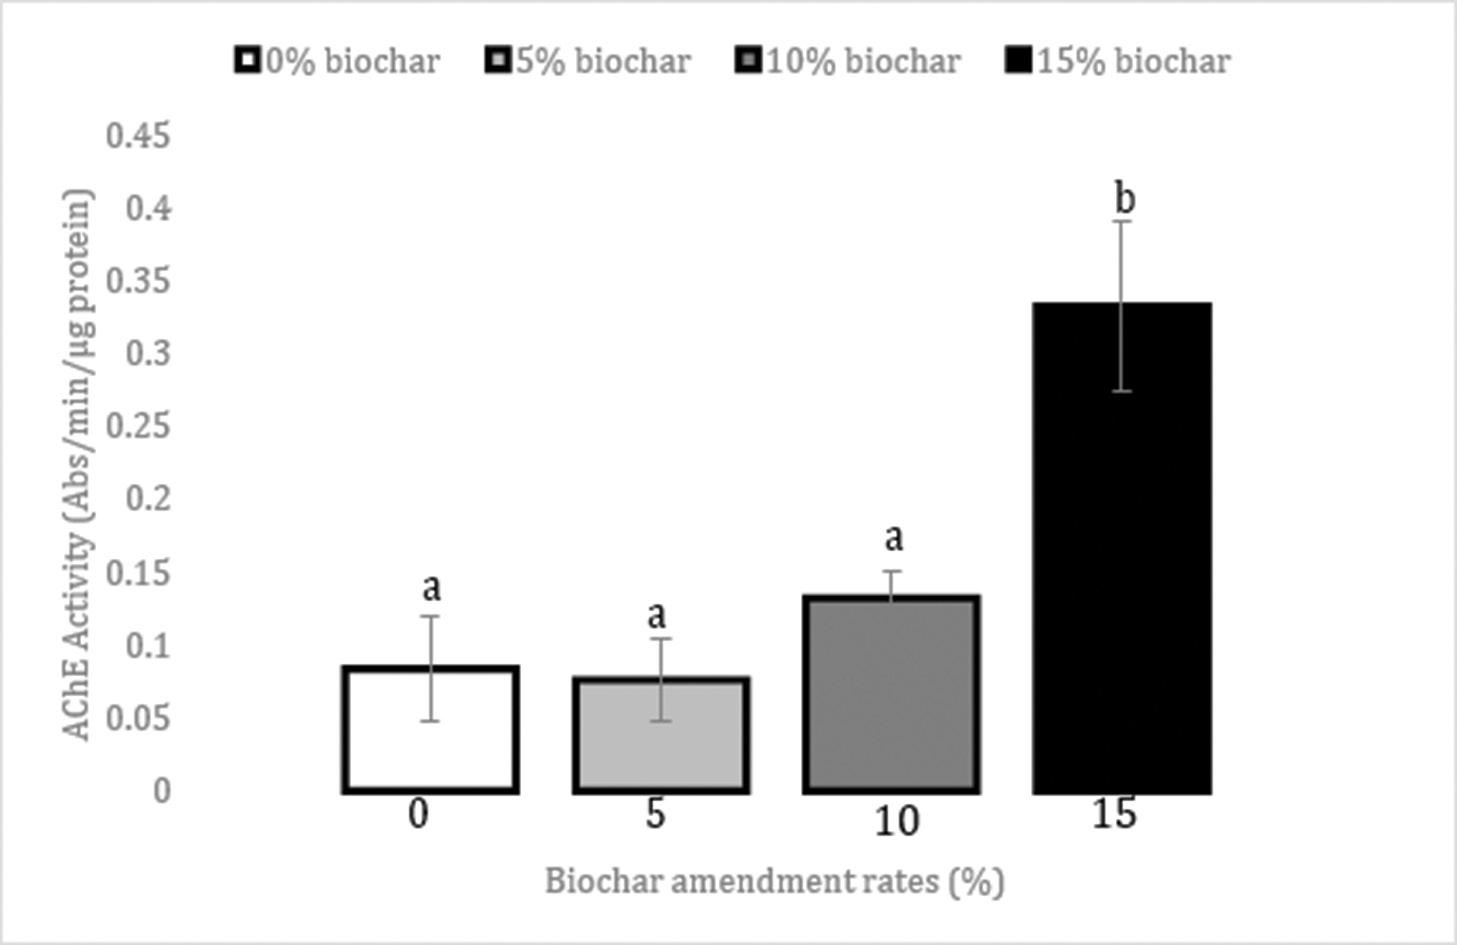
Figure 4: AChE activity in Eisenia fetida after a 96-h exposure to biochar-amended (5, 10 and 15%) and non-amended OECD artificial soil. Data represented are the means of three replicates. Error bars represent standard deviations and different letters represent significant differences.
Our findings are supported by those of Han et al.62 who found no appreciable variations in the catalase activity of E. fetida exposed to 0–5% biochar made from rice straws, although other authors such as Shi et al.63 have reported a significant increase in catalase activity in E. fetida exposed to soil amended with less than 5% biochar made from cow dung. In our study, such low biochar rates did not result in any significant alterations in catalase activity, indicating that the feed used to make the biochar might play a role in the observed variations. The pyrolysis temperature might also be a factor. Shi et al.63 discovered that biochar made at a pyrolysis temperature of 550 °C resulted in
more increased catalase activity than those at the lower temperature of 350 °C or the higher temperature of 750 °C. Similarly, Kim et al.48 examined how biochar generated from biomasses of perilla, sesame, and pumpkin seeds affected the earthworm E. fetida, and discovered that at 5% amendment, the biochar produced at a pyrolysis temperature of 550 °C caused higher catalase activity than biochar produced at a temperature of 300 °C. The biochar utilised in this study was made at a temperature range that should cause relatively less catalase activity (400–450 °C), although our pine tree biochar did cause noticeable catalase increases at 10% amendment (Figure 5).
Volume 120| Number 5/6 May/June 2024 84 https://doi.org/10.17159/sajs.2024/15521 Research Article Biochar to improve sewage sludge quality Page 5 of 8
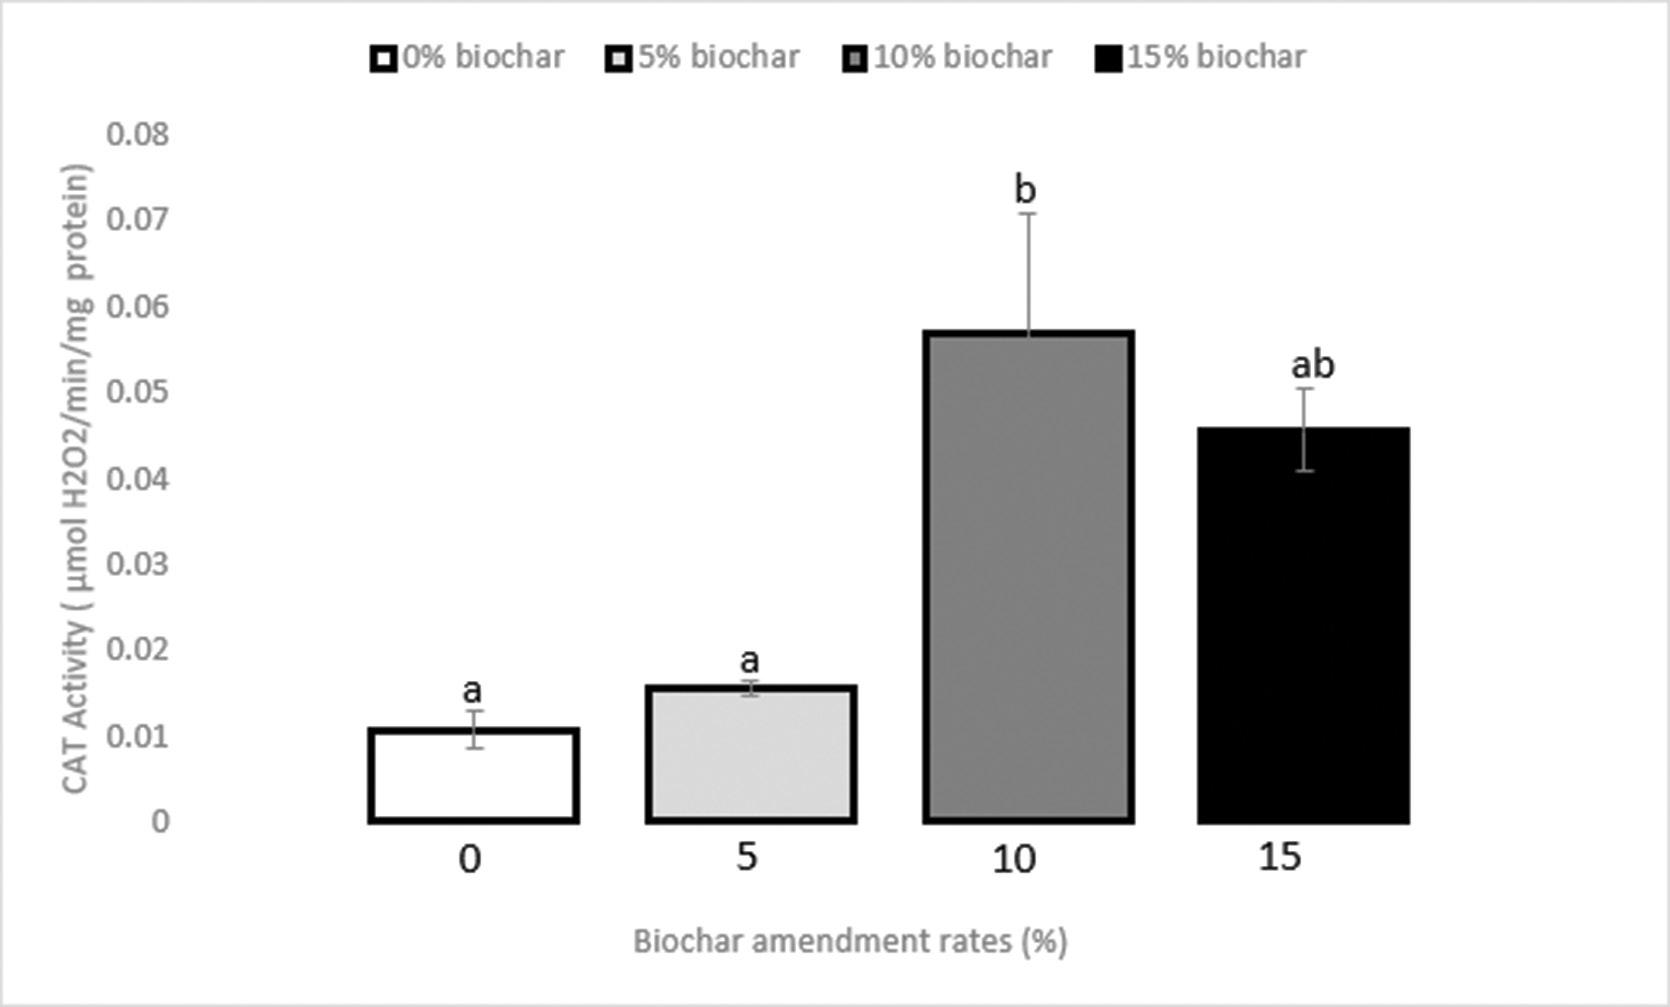
Figure 5: Catalase activity of Eisenia fetida after a 96-h exposure to biochar-amended (5, 10 and 15%) and 0% biochar amended OECD artificial soil. Data represented are the means of three replicates. Error bars represent standard deviations and different letters represent significant differences.
Conclusions
We set out to test whether biochar amendment could help improve the quality of sewage sludge by assessing multiple endpoints at biomarker and whole organism levels in the earthworm Eisenia fetida. Our results show little to no benefit to selected life-cycle parameters. A biochar rate experiment revealed that biochar rates of 10% and 15% could significantly increase catalase and AChE activities, respectively. Overall, the results indicate that biochar amendment could help organisms such as earthworms better withstand environmental stress brought about by sewage sludge application or be used as a prior step to environmental disposal of wastewater treatment waste.
Acknowledgements
We acknowledge funding from the South African National Research Foundation.
Competing interests
We have no competing interests to declare.
Authors’ contributions
N.P.D.: Methodology; investigation; project administration; writing – first draft, reviewing and editing. P.V.O.: Supervision; writing – reviewing and editing; project management, project administration.
references
1. Baffour-Asare E. Co-composting of dewatered sewage sludge (biosolids) and sawdust for agricultural use as an organic fertilizer: A case study of the KNUST sewage treatment plant [doctoral dissertation]. Kumasi: Department of Theoretical and Applied Biology, Kwame Nkrumah University of Science and Technology; 2009.
2. Sohi S, Lopez-Capel E, Krull E, Bol R. Biochar, climate change and soil: A reviewtoguidefutureresearch.CSIROLandWaterSciRep.2009;5(9):17–31.
3. StraussM,HeinssU,MontangeroA.On-sitesanitation:Whenthepitsarefull–planning for resource protection in faecal sludge management. Schriftenr Ver Wasser Boden Lufthyg. 2000;105:353–360.
4. Oleszczuk P, Hollert H. Comparison of sewage sludge toxicity to plants and invertebrates in three different soils. Chemosphere. 2011;83(4):502–509. https://doi.org/10.1016/j.chemosphere.2010.12.061
5. Gorman ML, Trowbridge BJ. The role of odor in the social lives of carnivores. In: Carnivore behavior, ecology, and evolution. Boston, MA: Springer; 1989. p. 57–88.
6. Bagreev A, Bandosz TJ, Locke DC. Pore structure and surface chemistry of adsorbents obtained by pyrolysis of sewage sludge-derived fertilizer. Carbon.2001;39(13):1971–1979.https://doi.org/10.1016/S0008-6223(01) 00026-4
7. Banerjee MR, Burton DL, Depoe S. Impact of sewage sludge application on soil biological characteristics. Agric Ecosyst Environ. 1997;66(3):241–249. https://doi.org/10.1016/S0167-8809(97)00129-1
8. Lewis-Jones R, Winkler M. Sludge parasites and other pathogens. Chichester: Ellis Horwood Limited; 1991.
9. Wong JW, Li K, Fang M, Su DC. Toxicity evaluation of sewage sludges in Hong Kong. Environ Int. 2001;27(5):373–380. https://doi.org/10.1016/S01 60-4120(01)00088-5
10. Klee N, Gustavsson L, Kosmehl T, Engwall M, Erdinger L, Braunbeck T, et al. Changes in toxicity and genotoxicity of industrial sewage sludge samples containing nitro-and amino-aromatic compounds following treatment in bioreactors with different oxygen regimes. Environ Sci Pollut Res. 2004;11(5):313–320. https://doi.org/10.1007/BF02979645
11. Malińska K, Zabochnicka-Świątek M, Cáceres R, Marfà O. The effect of precomposted sewage sludge mixture amended with biochar on the growth and reproduction of Eisenia fetida during laboratory vermicomposting. Ecol Eng. 2016; 90:35–41. https://doi.org/10.1016/j.ecoleng.2016.01.042
12. Singh RP, Agrawal M. Effects of sewage sludge amendment on heavy metal accumulation and consequent responses of Beta vulgaris plants. Chemosphere. 2007;67(11):2229–2240. https://doi.org/10.1016/j.chemos phere.2006.12.019
13. Herselman JE, Snyman HG. Guidelines for the utilisation and disposal of wastewater sludge. Pretoria: Water Research Commission; 2009.
14. Mosolloane PM, Bredenhand E, Otomo PV. Laboratory assessment of the ecotoxic effects of sewage sludge from the Maluti-Drakensberg region on a terrestrial oligochaete species. Ecotoxicol. 2019;28(1):86–91. https://doi.or g/10.1007/s10646-018-2002-9
15. Wang M, Zhu Y, Cheng L, Andserson B, Zhao X, Wang D, et al. Review on utilization of biochar for metal-contaminated soil and sediment remediation. J Environ Sci. 2018;63:156–173. https://doi.org/10.1016 /j.jes.2017.08.004
Volume 120| Number 5/6 May/June 2024 85 https://doi.org/10.17159/sajs.2024/15521 Research Article Biochar to improve sewage sludge quality Page 6 of 8
16. Roberts KG, Gloy BA, Joseph S, Scott NR, Lehmann J. Life cycle assessment of biochar systems: Estimating the energetic, economic, and climate change potential. Environ Sci Technol. 2010;44(2):827–833. https://doi.org/10.102 1/es902266r
17. Bridgwater AV. Renewable fuels and chemicals by thermal processing of biomass. J Chem Eng. 2003;91(2–3):87–102. https://doi.org/10.1016/S13 85-8947(02)00142-0
18. Cantrell KB, Ducey T, Ro KS, Hunt PG. Livestock waste-to-bioenergy generation opportunities. Bioresour Technol. 2008;99(17):7941–7953. https ://doi.org/10.1016/j.biortech.2008.02.061
19. Ro KS, Cantrell KB, Hunt PG. High-temperature pyrolysis of blended animal manures for producing renewable energy and value-added biochar. Indust Eng Chem Res. 2010;49(20):10125–10131. https://doi.org/10.1021/ie101155m
20. Park JH, Choppala GK, Bolan NS, Chung JW, Chuasavathi T. Biochar reduces the bioavailability and phytotoxicity of heavy metals. Plant Soil. 2011;348(1):439–451. https://doi.org/10.1007/s11104-011-0948-y
21. Zhang X, Wang H, He L, Lu K, Sarmah A, Li J, et al. Using biochar for remediation of soils contaminated with heavy metals and organic pollutants. Environ Sci Pollut Res. 2013;20(12):8472–8483. https://doi.org/10.1007/s 11356-013-1659-0
22. FelletG,MarmiroliM,MarchiolL.Elementsuptakebymetalaccumulatorspecies grown on mine tailings amended with three types of biochar. Sci Total Environ. 2014;468:598–608. https://doi.org/10.1016/j.scitotenv.2013.08.072
23. Paz-Ferreiro J, Lu H, Fu S, Mendez A, Gasco G. Use of phytoremediation and biochar to remediate heavy metal polluted soils: A review. Solid Earth. 2014;5(1):65–75. https://doi.org/10.5194/se-5-65-2014
24. PugaAP,AbreuC,MeloLC,BeesleyL.Biocharapplicationtoacontaminatedsoil reduces the availability and plant uptake of zinc, lead and cadmium. J Environ Manage. 2015;159:86–93. https://doi.org/10.1016/j.jenvman.2015.05.036
25. Zou Q, An W, Wu C, Li W, Fu A, Xiao R, et al. Red mud-modified biochar reduces soil arsenic availability and changes bacterial composition. Environ Chem Lett. 2018;16(2):615–622. https://doi.org/10.1007/s10311-017-0688-1
26. Nyoka NW, Kanyile SN, Bredenhand E, Prinsloo GJ, Voua Otomo P. Biochar alleviates the toxicity of imidacloprid and silver nanoparticles (AgNPs) to Enchytraeus albidus (Oligochaeta). Environ Sci Pollut Res. 2018;25(11):10937–10945. https://doi.org/10.1007/s11356-018-1383-x
27. Cui L, Noerpel MR, Scheckel KG, Ippolito JA. Wheat straw biochar reduces environmental cadmium bioavailability. Environ Int. 2019;126:69–75. https:// doi.org/10.1016/j.envint.2019.02.022
28. Yu H, Zou W, Chen J, Chen H, Yu Z, Huang J, et al. Biochar amendment improves crop production in problem soils: A review. J Environ Manage. 2019;232:8–21. https://doi.org/10.1016/j.jenvman.2018.10.117
29. Liedtke S. DTI completes R50m Phase 1 upgrade of Phuthaditjhaba Industrial Park. Creamer Media Engineering News. 2018 May 3. Available from: https ://www.engineeringnews.co.za/article/dti-completes-r50m-phase-1-upgrad e-of-phuthaditjhaba-industrial-park-2018-05-03
30. Organisation for Economic Co-operation and Development (OECD). Earthworm reproduction test. Guideline for testing chemicals no. 222. Paris: OECD; 2004.
31. Environmental Protection Agency US. Method 6010B: Inductively coupled plasma-atomic emission spectrometry. SW-846 test methods for evaluating solid wastes. Washington: US Environmental Protection Agency; 1996.
32. Liesch AM, Weyers SL, Gaskin JW, Das KC. Impact of two different biochars on earthworm growth and survival. Ann Environ Sci. 2010;4:1–9.
33. Li D, Hockaday WC, Masiello CA, Alvarez PJ. Earthworm avoidance of biochar can be mitigated by wetting. Soil Biol Biochem. 2011;43(8):1732–1737. http s://doi.org/10.1016/j.soilbio.2011.04.019
34. Nyoka NWK, Ogbeide O, Otomo PV. Reproduction and biomarker responses of Eisenia fetida after exposure to imidacloprid in biochar-amended soil. Biochar. 2021;3:615–624. https://doi.org/10.1007/s42773-021-00103-4
35. Wang Y, Cang T, Zhao X, Yu R, Chen L, Wu C. Comparative acute toxicity of twenty-four insecticides to earthworm, Eisenia fetida. Ecotoxicol Environ Saf. 2012;79:122–128. https://doi.org/10.1016/j.ecoenv.2011.12.016
36. Colovic MB, Krstic DZ, Lazarevic-Pasti TD, Bondzic AM, Vasic VM. Acetylcholinesterase inhibitors: Pharmacology and toxicology. Curr Neuropharmacol. 2013;11(3):315–335.
37. Bradford MM. A rapid and sensitive method for the quantitation of microgram quantities of protein utilizing the principle of protein-dye binding. Anal Biochem. 1976;72(1–2):248–254. https://doi.org/10.1016/0003-2697(76) 90527-3
38. Ellman GL, Courtney KD, Andres V Jr, Featherstone RM. A new and rapid colorimetricdeterminationofacetylcholinesteraseactivity.BiochemPharmacol. 1961;7(2):88–95. https://doi.org/10.1016/0006-2952(61)90145-9
39. Cohen G, Dembiec D, Marcus J. Measurement of catalase activity in tissue extracts. Anal Biochem. 1970;34(1):30–38. https://doi.org/10.1016/0003-2 697(70)90083-7
40. Berrow ML, Webber J. Trace elements in sewage sludges. J Sci Food Agric. 1972;23(1):93–100. https://doi.org/10.1002/jsfa.2740230112
41. Zufiaurre R, Olivar A, Chamorro P, Callizo A. Speciation of metals in sewage sludge for agricultural uses. Analyst. 1998;123(2):255–259. https://doi.org /10.1039/A705168I
42. Ščančar J, Milačič R, Stražar M, Burica O. Total metal concentrations and partitioning of Cd, Cr, Cu, Fe, Ni and Zn in sewage sludge. Sci Total Environ. 2000;250(1–3):9–19. https://doi.org/10.1016/S0048-9697(99)00478-7
43. Snyman HG, Herselman JE. Guidelines for the utilisation and disposal of wastewater sludge volume 1: Selection of management options. WRC report no. TT 261/06. Pretoria: Water Research Commission; 2006.
44. Obbard JP. Ecotoxicological assessment of heavy metals in sewage sludge amended soils. Appl Geochem. 2001;16(11–12):1405–1411. https://doi.org /10.1016/S0883-2927(01)00042-7
45. Tytła M. Assessment of heavy metal pollution and potential ecological risk in sewage sludge from municipal wastewater treatment plant located in the most industrialized region in Poland — case study. Int J Environ Res Public Health. 2019;16(13):2430. https://www.mdpi.com/journalproposal/sendpro posalspecialissue/ijerph
46. Elliston T, Oliver IW. Ecotoxicological assessments of biochar additions to soil employing earthworm species Eisenia fetida and Lumbricus terrestris Environ Sci Pollut Res. 2020;27(27):33410–33418. https://doi.org/10.100 7/s11356-019-04542-2
47. Malińska K, Golańska M, Caceres R, Rorat A, Weisser P, Ślęzak E. Biochar amendment for integrated composting and vermicomposting of sewage sludge–the effect of biochar on the activity of Eisenia fetida and the obtained vermicompost. Bioresour Technol. 2017;225:206–214. https://doi.org/10.1 016/j.biortech.2016.11.049
48. Kim WI, Kunhikrishnan A, Go WR, Jeong SH, Kim GJ, Lee S, et al. Influence of various biochars on the survival, growth, and oxidative DNA damage in the earthworm Eisenia fetida. Korean J Environ Agric. 2014;33(4):231–238. http ://dx.doi.org/10.5338/KJEA.2014.33.4.231
49. Zhang Q, Saleem M, Wang C. Effects of biochar on the earthworm (Eisenia foetida) in soil contaminated with and/or without pesticide mesotrione. Sci Total Environ. 2019;671:52–58. https://doi.org/10.1016/j.scitotenv.2019.03 .364
50. Ameloot N, Graber ER, Verheijen FGA, De Neve S. Interactions between biochar stability and soil organisms: Review and research needs. Eur J Soil Sci. 2013;64:379–390. https://doi.org/10.1111/ejss.12064
51. Sanchez-Hernandez JC, Ro KS, Díaz FJ. Biochar and earthworms working in tandem: Research opportunities for soil bioremediation. Sci Total Environ. 2019;688:574–583. https://doi.org/10.1016/j.scitotenv.2019.06.212
52. Domínguez J, Edwards CA, Webster M. Vermicomposting of sewage sludge: Effect of bulking materials on the growth and reproduction of the earthworm Eisenia andrei. Pedobiologia. 2000;44(1):24–32. https://doi.org/10.1078/S0 031-4056(04)70025-6
53. Contreras-Ramos SM, Alvarez-Bernal D, Dendooven L. Characteristics of earthworms (Eisenia fetida) in PAHs contaminated soil amended with sewage sludge or vermicompost. Appl Soil Ecol. 2009;41(3):269–276. https://doi.or g/10.1016/j.apsoil.2008.11.008
54. Gong X, Cai L, Li S, Chang SX, Sun X, An Z. Bamboo biochar amendment improves the growth and reproduction of Eisenia fetida and the quality of green waste vermicompost. Ecotoxicol Environ Saf. 2018;156:197–204. http s://doi.org/10.1016/j.ecoenv.2018.03.023
55. Marks EA, Mattana S, Alcañiz JM, Domene X. Biochars provoke diverse soil mesofauna reproductive responses in laboratory bioassays. Eur J Soil Biol. 2014;60:104–111. https://doi.org/10.1016/j.ejsobi.2013.12.002
https://doi.org/10.17159/sajs.2024/15521
Volume 120| Number 5/6 May/June 2024 86
Research
Biochar to improve sewage sludge quality Page 7 of 8
Article
56. Dlamini NP, Voua Otomo P. High rates of biochar soil amendment cause increased incidences of neurotoxic and oxidative stress in Eisenia fetida (Oligochaeta) exposed to glyphosate. Appl Sci. 2022;12, Art. #2381. https:/ /doi.org/10.3390/app12052381
57. Cheng CH, Lehmann J, Engelhard MH. Natural oxidation of black carbon in soils: Changes in molecular form and surface charge along a climosequence. Geochimica et Cosmochimica Acta. 2008;72(6):1598–1610. https://doi.org /10.1016/j.gca.2008.01.010
58. Laird DA, Fleming P, Davis DD, Horton R, Wang B, Karlen DL. Impact of biochar amendments on the quality of a typical Midwestern agricultural soil. Geoderma. 2010;158(3-4):443–449. https://doi.org/10.1016/j.geoderma.20 10.05.013
59. Atkinson CJ, Fitzgerald JD, Hipps NA. Potential mechanisms for achieving agricultural benefits from biochar application to temperate soils: A review. Plant Soil. 2010;337(1):1–8. https://doi.org/10.1007/s11104-010-0464-5
60. Gomez-Eyles JL, Sizmur T, Collins CD, Hodson ME. Effects of biochar and the earthworm Eisenia fetida on the bioavailability of polycyclic aromatic hydrocarbons and potentially toxic elements. Environ Pollut. 2011; 159(2):616–622. https://doi.org/10.1016/j.envpol.2010.09.037
61. Khalid H, Kashif Zahoor M, Riaz D, Arshad M, Yaqoob R, Ranian K. Sewage sludge induced effect on growth, enzyme inhibition and the genotoxicity can be ameliorated using wheat straw and biochar in Pheretima posthuma earthworms. Front Environ Sci. 2022;10:633. https://doi.org/10.3389/fenvs. 2022.888394
62. Han J, Huang Y, Meng J, Fan C, Yang F, Tan H, et al. Exposure of earthworm (Eisenia fetida) to rice straw biochar: Ecotoxicity assessments for soilamended programmes. Sci Total Environ. 2021;794:148802. https://doi.or g/10.1016/j.scitotenv.2021.148802
63. Shi Z, Yan J, Ren X, Wen M, Zhao Y, Wang C. Effects of biochar and thermally treated biochar on Eisenia fetida survival, growth, lysosomal membrane stability and oxidative stress. Sci Total Environ. 2021;770, Art. #144778. https://doi.org/10.1016/j.scitotenv.2020.144778
Volume 120| Number 5/6 May/June 2024 87 https://doi.org/10.17159/sajs.2024/15521 Research Article Biochar to improve sewage sludge quality Page 8 of 8
AuthorS:
Melvi Todd1
Jako Volschenk2
Elizabeth Joubert1,3
AFFILIAtIoNS:
1Department of Food Science, Stellenbosch University, Stellenbosch, South Africa
2Stellenbosch Business School, Stellenbosch University, Cape Town, South Africa
3Plant Bioactives Group, Post-Harvest and Agro-Processing Technologies, Agricultural Research Council, Infruitec-Nietvoorbij, Stellenbosch, South Africa
CorrESPoNDENCE to: Melvi Todd
EMAIL: melvitodd19@gmail.com
DAtES:
received: 08 June 2022
revised: 06 Feb. 2024
Accepted: 26 Feb. 2024
Published: 30 May 2024
hoW to CItE:
Todd M, Volschenk J, Joubert E. Multi-stakeholder value creation and appropriation from food-related health claims. S Afr J Sci. 2024;120(5/6), Art. #14091. https://doi.org/10.1715 9/sajs.2024/14091
ArtICLE INCLuDES:
☒ Peer review
☒ Supplementary material
DAtA AVAILABILItY:
☐ Open data set
☐ All data included
☐ On request from author(s)
☒ Not available
☐ Not applicable
EDItor: Floretta Boonzaier
KEYWorDS:
value creation, health claims, food labels, non-communicable disease, qualitative research
FuNDING:
South African National Research Foundation (MND190508435061), South African Department of Science and Innovation
Multi-stakeholder value creation and appropriation from food-related health claims
Health claims are considered a means to add value to food and beverages; however, it is not always evident which stakeholders benefit and to what extent they benefit. In this paper, we extend the investigation of value creation and appropriation into the domain of food, specifically food labels. Using a qualitative approach, we aimed to elucidate which forms of value can be created by legislating health claims (including those for bioactive compounds found in South African indigenous plants) on food labels. The findings reveal that health claims have the potential to advance the sustainable development agenda in South Africa, but only if structures can be put in place to appropriate human and intellectual (HI) value, as well as environmental value. Currently, there is strong evidence for economic value creation and appropriation potential, but little clear evidence that HI or environmental value will be appropriated from health claims, especially if these health claims exclude benefits from bioactive compounds found in indigenous South African plants. If we could find a means to measure the HI and environmental value creation potential of health claims, using metrics that people understand, we may be able to develop strategies to ensure that such products can benefit stakeholders beyond economic value alone (i.e. more sustainable value creation). The findings could directly impact food labelling policy formulation, considering current draft regulations to implement health claims in South Africa.
Significance:
The medicinal plant biodiversity of South Africa offers opportunities for economic, human and intellectual (HI), and environmental value creation through legislated health claims. Without clear metrics for the HI and environmental components, economic value creation may dominate, but the value created might not be sustainable or appropriated by the desired stakeholders. Furthermore, because the current draft legislation for health claims excludes any bioactives from indigenous South African plants, much of the economic, HI and environmental value creation potential reported as potential outcomes for this research (e.g. funds to communities, knowledge preservation or biodiversity conservation) will not materialise.
Introduction
In South Africa, as in much of the world, the growing incidence of non-communicable diseases (NCDs) is of concern.1 Key drivers of NCDs are more sedentary lifestyles and changes in the composition of our food.2-4 Research highlights that, post-1994, South Africans have been eating fewer vegetables and consuming more kilojoules – many derived from sugar-sweetened beverages and processed foods.5 Not only is there an increase in diabetes-related mortality (7% compared to a global average of 3%)1, but also in the challenges of living with such a disease: reduced personal well-being, reduced capacity to work and increased healthcare costs6-8
Food labelling is considered a cost-effective tool in the fight against the rising NCD burden due to the potential it holds to communicate information about the nutritional properties of food.9 In particular, health claims on food labels can bridge the information gap that exists between the consumer’s knowledge and the manufacturers’ understanding of the intrinsic qualities of a food product.10 In South Africa, ‘health claim’ means an effect on the human body, including an effect on one or more of the following: (1) a biochemical process or outcome; (2) a physiological process or outcome; (3) a functional process or outcome; (4) growth and development; (5) physical performance; (6) mental performance; (7) a disease, disorder or condition; and (8) oral hygiene.11 There are various means by which to establish such claims. Screening, identification and analysis of functional ingredients, analysis of mechanism of action, and development of agricultural products rich in these functional ingredients is a primary mechanism.12 Traditional medicinal use is another acknowledged method to establish a health claim, although not widely accepted in food legislation.13
Japan is a good example of a country that has tailored food labelling and legislation to achieve better health outcomes and has an established history of allowing foods to carry a range of scientifically validated health claims.14 Food for Specialised Health Uses (FOSHU) was adopted by the Japanese government in 1991, followed by Food with Nutrient Functional Claims (FNFC) in 2001, and Food with Function Claims (FFC) in 2015.15 The introduction of FFC unlocked new market growth in a sector that had essentially become stagnant after 2007.15 One of the first primary processed products for which a claim was allowed was Japanese green tea, produced from the Benifuuki cultivar.16 In comparison with common green tea, Benifuuki is rich in O-methylated catechins, responsible for anti-allergic effects.17 With the recent expansion of FFC to include selected fresh produce, producers (i.e. farmers) can now also benefit from the system.12 Examples of FFC fresh produce are β-cryptoxanthinrich Satsuma mandarins12 and the corresponding claim “This food contains β-cryptoxanthin, which reportedly maintains bone health; 3 mg/day”18
South African legislation relating to health claims on food is still pending.11 Claims under consideration include function claims such as “Beta-carotene functions as a tissue antioxidant and so keeps cells healthy” and reduction of disease risk claims such as “Diets low in sodium may reduce the risk of high blood pressure, a disease associated with many risk factors, in some individuals”. Notably, there are no claims for plant bioactives such as mangiferin,
88 https://doi.org/10.17159/sajs.2024/14091 Volume 120| Number 5/6 May/June 2024 © 2024. The Author(s). Published under a Creative Commons Attribution Licence. Research Article
aspalathin, and L-canavanine from the South African plants honeybush, rooibos, and Sutherlandia frutescens19-25 , typically consumed as teas and with a long history of traditional use. Bioactive compounds of indigenous plants such as these show promise in preventing and reducing risk factors for NCDs, although human studies are still needed.
Consumers, producers, non-governmental organisations, industry bodies, marketing agents and policymakers (to name but a few) all play a role in influencing food policy.26 When dealing with such a diverse collection of stakeholders, there are complementarities and trade-offs to consider and, thus, a holistic view of value creation and appropriation from the perspective of these stakeholders could provide the ability to maximise the value ‘pie’ that can be created from food labels. This study examines the types of value that can be created by putting health claims on food labels in South Africa (including claims related to bioactives from indigenous plants). It also outlines the stakeholders for which value can be created and where it might be captured.
Methods
Study design and setting and recruitment
A pragmatic paradigm was used to answer the research question.27 To gain an in-depth understanding of potential value creation, in-depth qualitative interviews were conducted with a focused sample. The aim was not to make generalisations about the views of a larger population.27 The study was conducted in accordance with the Declaration of Helsinki, and approved by the Research Ethics Committee of Stellenbosch University (FESCAGRI-2020-11491) prior to commencement of the research. Respondents provided informed consent before the start of the interviews. They were thanked for their contribution, but not compensated. Professionals were specifically recruited for their diverse professional qualifications to achieve maximum variation in perspectives. Professional contacts of the lead author were approached initially, followed by snowball sampling (accounting for approximately 50% of respondents). Consumer respondents were approached via Facebook through direct messaging based on their ability to inform the research question. A deliberate effort was made to exclude consumers who worked in the food or healthcare industries.
Procedure
Prior to the interviews, the interview guide was tested with a convenience sample of three professionals. All interviews, typically 45–60 min long, were conducted in English via video conferencing between February and May 2020. Respondents were asked to share their views on what type of value could be created by incorporating health claims on food labels in South Africa. Based on their responses, follow-up questions, such as “What other benefits are there from food labels, and who benefits from them?” were asked to gain additional insight or clarity. Interviews were conducted until theoretical saturation was achieved28, i.e. when no new insights emerged from interviews.
Data analysis and trustworthiness
The interviews were audio recorded, transcribed and coded (i.e. names assigned to segments of the interview transcripts, based on the content). The six capitals model of the International Integrated Reporting Council29 was used as an initial guide to identify forms of value reported by participants30. Thematic analysis was performed31 whereby codes were arranged into groups with similar themes, resulting in three final themes pertaining to value creation through health claims on food labels. Trustworthiness was ensured through the process of respondent validation (also known as member checking)32,33 and by ensuring a clear audit trail34
results
Study sample characteristics
A total of 49 interviews were conducted with food-related professionals accounting for 35% (n = 13) of the professional sample, healthcarerelated professionals for 32.5% (n = 12) and professionals not associated with either industry (n = 12). Details of the professional respondents, including potential conflicts of interest, are provided in
Supplementary table 1. Furthermore, 12 consumer respondents were interviewed; 7 of the 12 consumer respondents had a B-degree, while 4 had a postgraduate qualification.
Value creation by food labels incorporating health claims
Respondents initially struggled to answer the question, “What forms of value do you think can be created by including health claims (including indigenous health claims) on food labels?” Better responses were obtained by rephrasing the question and replacing the term ‘value’ with ‘benefits’.
Using thematic analysis, we found support that food labels bearing scientifically validated health claims could add value in three domains –namely economic, human and intellectual (HI) and environmental – for a range of stakeholders including farmers or producers, businesses, government, individuals, communities, and society at large. It is important to note that health claims are both a manifestation of, and tool for, transferring ‘knowledge value’. This was captured as intellectual value, incorporated into HI value.
Economic, HI and environmental benefits did not receive equal mention (Table 1). Overall, the majority of respondents (n = 38; 77.6%) believe that food labels with health claims could generate economic value. Only two respondents (4.1%) directly highlighted environmental benefits, whilst approximately half of the respondents (n = 27; 55.1%) felt that health claims could create HI benefits. Some respondents mentioned broader HI and environmental benefits associated with labelling in general, but they did not explicitly link these to the presence of health claims. These are reflected as indirect mentions in Table 1. Illustrative quotes used to identify the value domains are available in Supplementary tables 2–4
Economic value
Most respondents considered the value creation potential of food labels with health claims to be primarily economic in nature but appropriated by different stakeholders.
Farmers, producers and businesses
Health claims were predominantly considered to benefit (in terms of economic value) businesses such as food manufacturers due to the commercial opportunity they present (P17). This relates specifically to opportunities to develop new products with claims that will drive product differentiation and enhance desirability – ultimately leading to increased sales or higher prices (P33, P13, P14, P21).
Health claims, according to Respondent P24, would increase product appeal on the international market (thereby boosting market growth), as well as allow producers to charge higher prices for their products and generate higher profits. This was felt to be especially relevant when communities are highlighted as beneficiaries (P24), as consumers enjoy supporting such initiatives. Whilst respondents agreed that health claims could generate economic benefits for businesses, several raised concerns about whether such benefits would be evenly distributed between smaller and larger enterprises (P37) (i.e. appropriation bias to larger players).
Respondent E9 echoed the possibility of higher profits for all stakeholders in the value chain, starting with farmers and producers. Respondent P12 indicated that plant breeders could benefit economically (financially) from the cultivation of specific plants with desirable properties (including substances that could be used to make health claims).
Finally, several respondents highlighted that the government would need to be wary of unscrupulous manufacturers and marketers who might make unsubstantiated claims to defraud consumers simply to make profits. The quote from Respondent C3 is illustrative:
If I think about the average person, if you make a claim, it will probably create a hype and excitement and people will make decisions based on that [substance] being in a product… It’s hard for a consumer to know whether it’s a marketing claim or a scientific claim…I think there’s too much chance of corruption
Volume 120| Number 5/6 May/June 2024 89 https://doi.org/10.17159/sajs.2024/14091 Research Article Multi-stakeholder value creation from health claims Page 2 of 7
table 1: The percentage of respondents who mentioned economic, human and intellectual or environmental value for food labels with health claims
Yes
Consumers (n = 12)920
Sub-total “Yes” (n = 49)38 (77.6%)27 (55.1%)2 (4.1%)
Indirect Not food nor healthcare industry(n = 12)012 Food industry or related*(n = 13)006 Healthcare industry or related*(n = 12)001
Consumers (n = 12)022
Sub-total “Indirect” (n = 49)0 (0%)3 (6.1%)11 (22.4%)
No mention
Not food nor healthcare industry(n = 12) 249
Food industry or related*(n = 13) 516
Healthcare industry or related*(n = 12) 1611
Consumers (n = 12) 3810
Sub-total “No mention”(n = 49)11 (22.4%)19 (38.8%)36 (73.5%) TOTAL 494949
*One respondent worked in both the food industry and the healthcare industry; we counted the respondent in the healthcare group.
Government
The key anticipated economic value that can be created by health claims would be a healthier public (P33), which spills over into economic value in the form of reduced healthcare spending for governments. If the public is not healthy, costs escalate, as articulated by P34:
If our diabetics and hypertensives [i.e. hypertensive patients] are on treatment but they are very unhealthy and these conditions are poorly controlled, they cost us more money. They cost everybody else more money because of how medical schemes work - the healthy people subsidise the sick people. So, if you have more sick people, then the contributions go up, and we spend more on health, and the cost of health care just keeps going up, and up, and up.
Individuals, communities, and society at large
Links to economic value for individual consumers that can be derived from health claims were limited. Respondent P17 alluded to the idea that if consumers appropriately use health claim information, it could presumably lead to better health and more efficient spending (i.e. reduced personal financial health burden). This benefit, however, is not necessarily available to all. Respondent P27 highlighted that healthier products, including those with claims, frequently come at a higher cost to individual consumers, limiting the ability of lowerincome consumers to reap such benefits. Respondent P37 also highlighted an important caveat for the appropriation of economic value to individuals:
It really adds to the tools that you have at your disposal… to use labels to educate clients and patients. But it is within the limitations of saying that it is more your well-educated consumer that it will benefit, and it will probably not benefit the others [less educated consumers] because it will just make it more confusing.
Communities were highlighted as a potential beneficiary of economic value only in cases where the health claims were derived from indigenous knowledge (P12) and the source material is grown in such communities. In such cases, government protocols must be in place to guarantee that communities benefit. Respondent P11 expressed concerns around longterm monitoring and evaluation of such benefits, citing past challenges with Fairtrade rooibos where small-scale farmers did not experience all the anticipated benefits due to the greater efficiency of larger-scale farmers.
Through healthier choices, individuals can also influence the market in the longer term and make healthier choices the more economical choices for society: “If we start seeing a shift towards healthier foods, then economies of scale will drive down the costs and the unhealthier ones will become less popular.” [C5]
Human and intellectual value
Health claims have the potential to create HI value for individual consumers if consumers read the food label, interpret the information and then use the information to make food-based decisions that benefit their health (P27, P24, P13, P17). Apart from the economic benefit of better health described in the previous section, good health has value in itself in the form of quality of life, happiness, longevity, etc.
Volume 120| Number 5/6 May/June 2024 90 https://doi.org/10.17159/sajs.2024/14091 Research Article Multi-stakeholder value creation from health claims Page 3 of 7
respondent Economic human and intellectual Environmental
Not food nor healthcare industry(n = 12)1071 Food industry or related*(n = 13)8121 Healthcare industry or related*(n = 12)1160
Whilst HI value of health cannot be appropriated by business (as it is a public good), it can be appropriated at an individual level in the form of increased (individual) knowledge about the benefits of products (due to claims). Respondent P16 spoke of the health platform that is well established for cranberries and the prevention of urinary tract disorders (i.e. when consumers understand the benefit and this drives its demand). Health platforms, as a result of knowledge gain, result in economic value. The potential for the sharing and preservation of traditional knowledge is an interesting result from the interviews, although only one respondent (P12) was able to expound on this. She emphasised the need for preserving such knowledge because younger generations are not always interested in doing so, and the knowledge may be lost as a result. Furthermore, Respondents P12 and P16 stated that applying this knowledge could result in economic benefits for communities by creating jobs (due to the cultivation of indigenous plants). However, concern was expressed about the materialisation and management of such benefits (Respondent P12, Supplementary table 3).
Environmental value
Overall, respondents made very little mention of the potential for health claims to create environmental value. Although two respondents (P18 and P19) pointed out that smaller businesses can differentiate their products by demonstrating greater care for the environment, they did not link this directly to health claims. The most significant references to environmental value from health claims concerned biodiversity preservation. Respondent P13, an entrepreneur and marketer of indigenous teas, explained how communities are preventing indigenous trees from becoming firewood, and protecting them from ‘parasites’, so that the leaves might be sold to her tea company. Her teas are widely linked to various health benefits based on traditional knowledge, although she does not make direct health claims on her products. Similarly, Respondent P12 shared insights into how traditional healers are cultivating the plants used in their traditional herbal remedies, thereby contributing to biodiversity preservation. Respondent P25, using Fairtrade as an example, pointed out that, due to various governance and certification procedures (and the cost involved), such programmes do not represent the majority of products on the shelf and therefore their total impact is limited.
Integrated view of value creation
Based on interview responses, the key value creation ‘mechanisms’ from food labels with health claims, when such health claims are derived from indigenous products, were integrated into a system diagram (Figure 1). Reinforcing loop R1 shows that the consumption of products with health claims can lead to increased demand for such products, enticing farmers to cultivate indigenous crops, thereby increasing industry capacity, as well as subsequent supply. Increased supply generally has an inverse impact on product cost, hence the cost of such products could reduce in the longer term. In the short term, however, the higher cost of products with health claims would limit their consumption. As highlighted by respondents, economic, HI and environmental value may be created throughout this process, but the stakeholders appropriating the value do not remain constant. This is discussed further in the next section.
Reinforcing loop R2 shows that the consumption of products with health claims can improve personal health, potentially reducing the personal financial burden of ill health, and increasing expendable income. This additional expendable income can presumably also be spent on products with health claims, thus driving consumption (feeding into R1). At the population level, improved personal health drives the proportion of the public that are healthy, which would reduce the public health burden (assuming real health benefits are attained from the consumption of food products with health claims). Finally, reinforcing loop R3 illustrates that the demand for products with health claims can drive investment in research, increasing the level of proof for the health benefits of indigenous products, as well as driving consumption. In the process, indigenous knowledge is preserved.
Discussion
How, by whom, and for whom value is created are three perspectives on value that can influence food policymakers’ decisions, and yet are poorly described in food labelling policy literature. Based on the interviews conducted, South Africa’s biodiversity presents an opportunity for economic, HI and environmental value creation through health claims. However, the distribution across these domains is not equal. Health claims are only perceived as positive by specific target
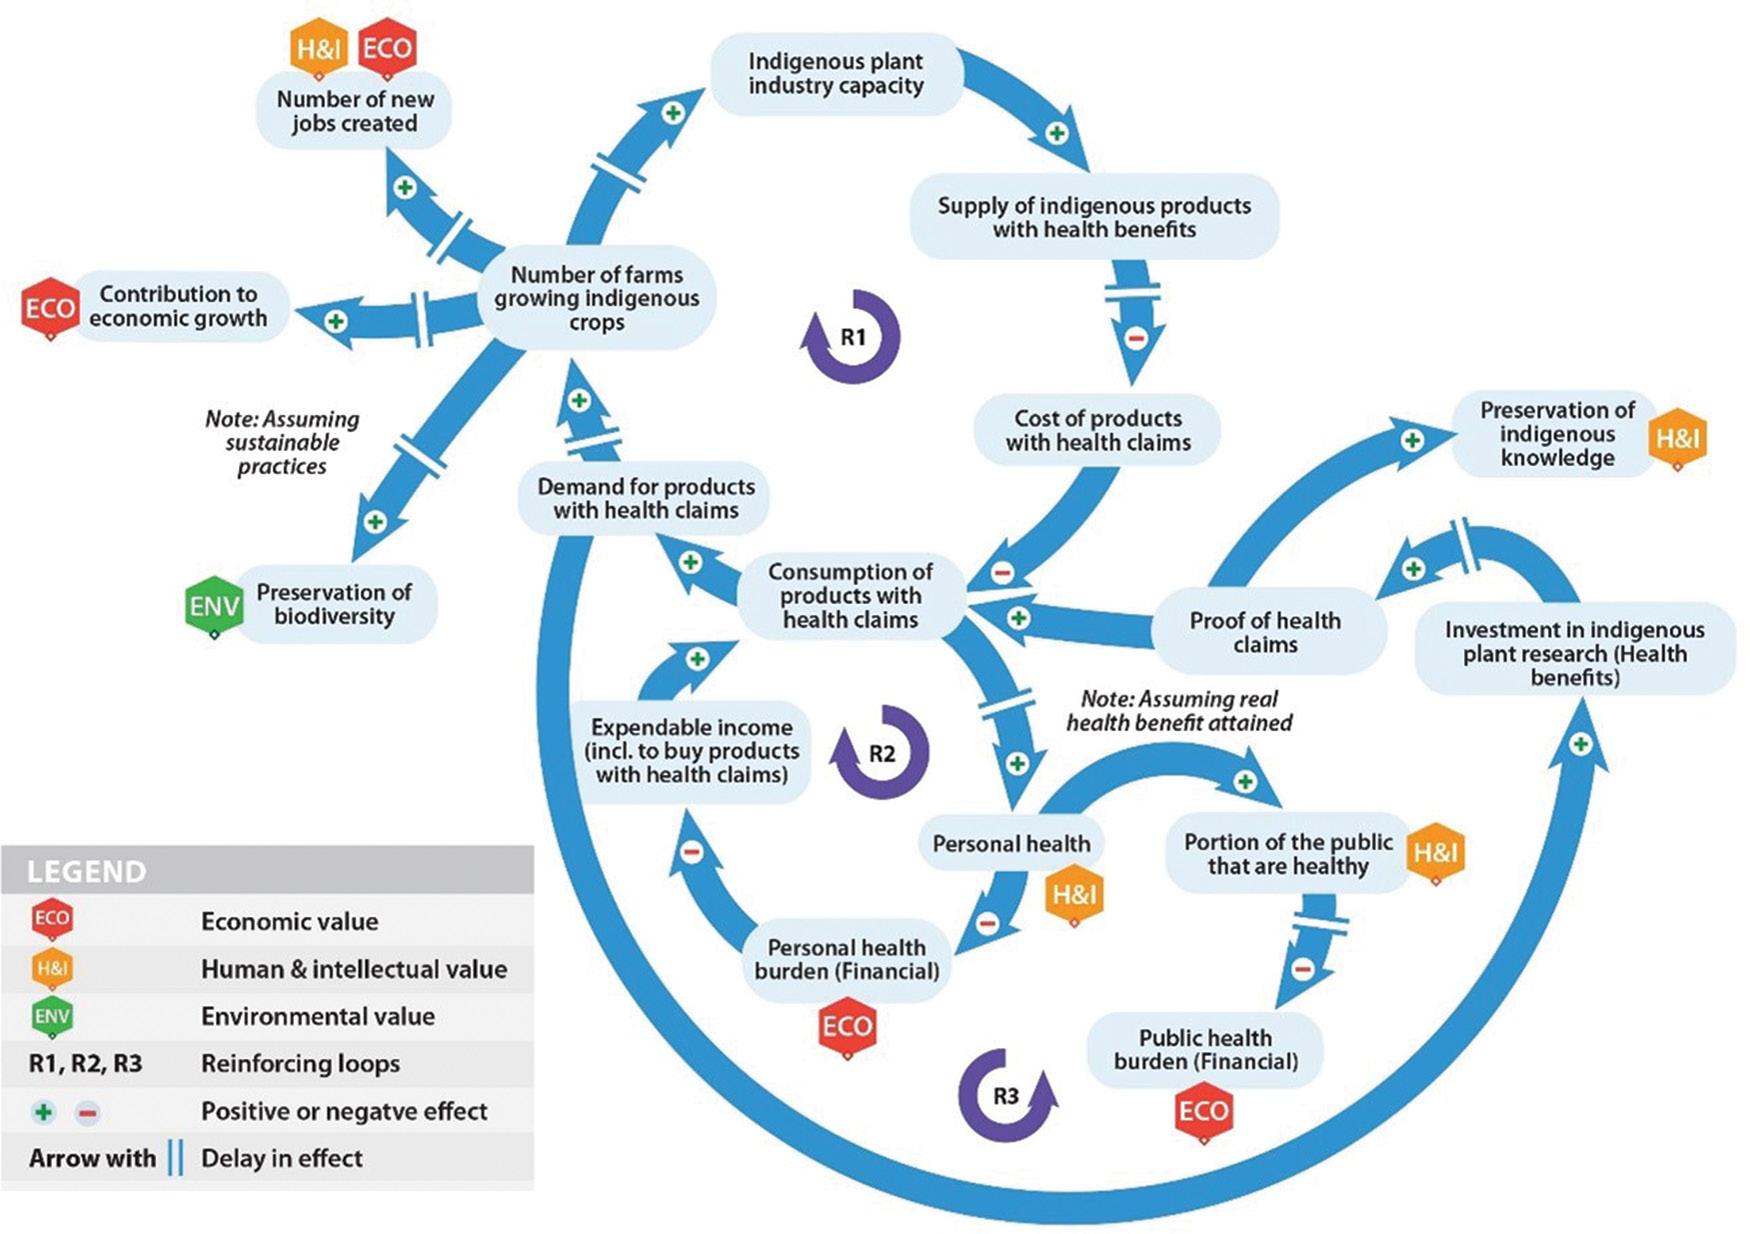
Volume 120| Number 5/6 May/June 2024 91 https://doi.org/10.17159/sajs.2024/14091 Research Article Multi-stakeholder value creation from health claims Page 4 of 7
Figure 1: Systems diagram illustrating the economic, human and intellectual, and environmental value creation potential of food products with health claims.
consumers – those who need the product, understand the benefit, and can afford it. Similar findings exist in the literature35; but what is pertinent for South Africa, is that these customers appear to be from higher-income and better-educated demographics, which are at odds with where benefits are most needed (i.e. in the lower-income groups who are less educated and largely reliant on public health). So, whilst health claims can generate economic value for plant breeders, farmers, communities, and businesses, achieving that value may conflict with the HI value creation of making the wider society healthier. The wider public may be able to reap the HI value (health benefit) if individuals with greater purchasing power can push demand to the point where prices of products with health claims fall; however, this could be at the expense of farmers, communities, and businesses. In other words, in the longer term, value could slip (i.e. when value is created by one source but captured by another36) from the plant breeders, farmers, communities and businesses to the public.
A further challenge to value creation from health claims emanates from the question of whether consumers will understand the health claims, or what format they must take to sway consumer purchase decisions (assuming they can afford the product). Health claim formats have not been researched in South Africa. The increasing amount of information on food labels increases the complexity of consumer decision-making and can result in greater consumer scepticism toward food labels.37 Furthermore, we know that consumers are likely to receive the same claims differently based on their pre-established networks and beliefs.38 We also know that food labels (without health claims) are not well understood under current circumstances in South Africa39, so adding more information might not have the desired effect, i.e. of enhancing knowledge and health.
In the long run, health claims may lead to an increase in the number of ‘health platforms’, as more customers become aware of the benefits of specific products, thereby driving sales. This raises the question of how to create and grow such health platforms. One approach to accomplish this could be through marketing by businesses that have conducted the research or have access to research. Despite respondents in this study being sceptical about the motivation of companies making health claims (i.e. only to make money), we need to acknowledge that such companies represent one lever that can be used to establish ‘health platforms’ that can ultimately benefit the public.
The cost and time associated with validating health claims may be prohibitive for smaller players, and thus to benefit more stakeholders, the government would need to step in and make the research available to all. This is the situation in Japan with FFC.12 South Africa, unlike Japan, does not have approved health claims, so whilst the government’s bioeconomy strategy40 is already driving research on various indigenous plants and other areas, it could be considered a waste of resources if claims are not legally permitted (i.e. value is not captured).
Without health claims, consumers cannot learn of benefits; knowledge cannot grow, be shared or preserved; ‘health platforms’ cannot form; fewer products may be sold; and thus little to none of the economic, HI or environmental value will be realised. This highlights the need to reconsider how health claims could be verified and implemented in South Africa. The Japanese FFC model might be the most advantageous to investigate for possible implementation in South Africa, bearing cultural differences in mind.
Various Fairtrade and other studies have shown that when products for the mainstream market are derived from communities that have never before participated in the economy, such trade has the potential to create jobs and address HI challenges related to poverty.41-43 The signing of the Rooibos Benefit Sharing Agreement in South Africa is a local example of international significance that has for the first time led to funding streams for indigenous communities.44
There is little doubt that health information about specific food products would enhance their sale and use – as highlighted by Respondent P16 in his reference to the urinary tract ‘health platform’ for cranberries. Rooibos has benefitted from global demand and
distribution due to its perceived health benefits20, although no such claims are presently allowed. More human studies substantiating the health benefits of rooibos are required.45 Care should be taken, if health claims are legislated, that sustainable value is created for multiple stakeholders rather than benefitting a few (as was the case in the past with rooibos).
46
Whilst environmental value can be created by labelling initiatives43 , the present study highlights two key challenges. Firstly, there is a low awareness of the environmental value creation potential of health claims. Consumers in South Africa often struggle to identify environmentally friendly goods and are unable to verify the environmental claims made by these goods.47 Secondly, the costs of verifying the environmental value could hamper the benefits. Without claims, there would be lower demand and less incentive to cultivate indigenous plants, reducing the potential for biodiversity preservation.48,49
Lastly, health claims provide an opportunity to conserve knowledge, as well as the possibility to create new knowledge as a result of further research.50 Because of cost and time, it may be necessary to adopt a more innovative strategy, such as the formation of industry bodies that can undertake research and disseminate the results to all stakeholders, big and small. In Japan, the government coordinates knowledge generation and dissemination51, but in a country with limited resources, such as South Africa, private–public partnerships would be needed.
Limitations
Given the qualitative methodology, the study remains explorative. Nevertheless, it can serve as a starting point for more research into long-term value creation from food labels with health claims or any other health-related on-pack mechanisms.
Conclusion
While the economic value creation potential of incorporating health claims on food labels already appears to be fairly well understood, the findings clearly indicate that more work is needed to close the gaps in understanding how HI and environmental value can be captured. If this is not done, the introduction of health claims is unlikely to deliver sustainable value for multiple stakeholders. This research also highlights a paradox: by boosting economic value for stakeholders such as producers, communities, and enterprises (increased demand and pricing, driven by health claims), a large percentage of the general population may be excluded from the benefit of better health. That is, without additional interventions, the wealthier and better educated in South Africa may be the only ones who improve their health. Of final concern is the fragmented approach to research on indigenous and other products, as value can only be fully appropriated if health claims can be made. There are opportunities for long-term value creation, but more research is needed for a deeper understanding of what barriers exist and how to overcome them.
Acknowledgements
The National Research Foundation of South Africa is acknowledged for a scholarship to the lead author (grant number: MND190508435061). The study forms part of a research project funded by the South African Department of Science and Innovation (contract DST/CON 00029/2019).
Competing interests
The authors declare that they have no known competing financial interests or personal relationships that could have appeared to influence the work reported in this paper. The associations of respondents to the food- and healthcare-related industries have been clearly identified.
Authors’ contributions
M.T.: Conceptualisation; methodology; investigation; data curation; visualisation; formal analysis; writing – original draft. J.V.: Writing –reviewing and editing; methodology; visualisation. E.J.: Funding acquisition; supervision, project administration; writing – reviewing and editing.
Volume 120| Number 5/6 May/June 2024 92 https://doi.org/10.17159/sajs.2024/14091 Research Article Multi-stakeholder value creation from health claims Page 5 of 7
references
1. World Health Organization (WHO). Noncommunicable diseases: Country profiles 2018. Geneva: WHO; 2018. Available from: https://www.who.int/pub lications/i/item/9789241514620
2. World Health Organization. Non-communicable diseases [webpage on the Internet]. c2022 [cited 2022 Jan 31]. Available from: https://www.who.int/ne ws-room/fact-sheets/detail/noncommunicable-diseases
3. Cecchini M, Sassi F, Lauer JA, Lee YY, Guajardo-Barron V, Chisholm D. Tackling of unhealthy diets, physical inactivity, and obesity: Health effects and cost-effectiveness. Lancet. 2010;376(9754):1775–1784. https://doi.or g/10.1016/S0140-6736(10)61514-0
4. Lane MM, Davis JA, Beattie S, Gómez-Donoso C, Loughman A, O’Neil A, et al. Ultraprocessed food and chronic noncommunicable diseases: A systematic review and meta-analysis of 43 observational studies. Obes Rev. 2021;22(3):1–19. https://doi.org/10.1111/obr.13146
5. Ronquest-Ross LC, Vink N, Sigge GO. Food consumption changes in South Africa since 1994. S Afr J Sci. 2015;111(9–10), Art. #2014-0354. https://d oi.org/10.17159/sajs.2015/20140354
6. MayosiBM,FlisherAJ,LallooUG,SitasF,TollmanSM,BradshawD.Theburdenof non-communicable diseases in South Africa. Lancet. 2009;374(9693):934–947. https://doi.org/10.1016/S0140-6736(09)61087-4
7. Lawana N, Booysen F, Tsegaye A, Kapingura FM, Hongoro C. Lifestyle risk factors, non-communicable diseases and labour force participation in South Africa. Dev South Afr. 2020;37(3):446–461. https://doi.org/10.1080/03768 35X.2019.1678459
8. Lee JT, Hamid F, Pati S, Atun R, Millett C. Impact of noncommunicable disease multimorbidity on healthcare utilisation and out-of-pocket expenditures in middle-income countries: Cross sectional analysis. PLoS ONE. 2015;10(7), e0127199. https://doi.org/10.1371/journal.pone.0127199
9. Campos S, Doxey J, Hammond D. Nutrition labels on pre-packaged foods: A systematic review. Public Health Nutr. 2011;14(8):1496–1506. https://doi.or g/10.1017/S1368980010003290
10. Hobbs JE, Kerr WA. Consumer information, labelling and international trade in agri-food products. Food Policy. 2006;31(1):78–89. https://doi.org/10.10 16/j.foodpol.2005.08.001
11. South African Department of Health (DoH). Regulations relating to the labelling and advertsing of foods: Amendment. Government notice R. 429 of 29 May 2014 promulgated under Foodstuffs, Cosmetics and Disinfectants Act, 54 of 1972. Government Gazette. Pretoria: DoH; 2014. Available from: https://www.gov.za/sites/default/files/gcis_document/201409/37695rg102 05gon429.pdf
12. Maeda-Yamamoto M. The use of functional agricultural products in the functional food labeling system and its challenges after five years. Food Sci Technol Res. 2021;27(2):169–179. https://doi.org/10.3136/fstr.27.169
13. European Commission. Evaluation of the regulation on nutrition and health claims [webpage on the Internet]. c2022 [cited 2022 May 02]. Available from: https://ec.europa.eu/food/safety/labelling-and-nutrition/nutrition-and-h ealth-claims/evaluation-regulation-nutrition-and-health-claims_en
14. Kamioka H, Tsutani K, Origasa H, Yoshizaki T, Kitayuguchi J, Shimada M, et al. Quality of systematic reviews of the foods with function claims registered at the consumer affairs agency web site in Japan: A prospective systematic review. Nutr Res. 2017;40:21–31. https://doi.org/10.1016/j.nutr es.2017.02.008
15. Iwatani S, Yamamoto N. Functional food products in Japan: A review. Food Sci Hum Wellness. 2019;8:96–101. https://doi.org/10.1016/j.fshw.2019.03.011
16. Maeda-Yamamoto M. Development of functional agricultural products and use of a new health claim system in Japan. Trends Food Sci Technol. 2017;69:324–332. https://doi.org/10.1016/j.tifs.2017.08.011
17. Maeda-Yamamoto M, Ema K, Shibuichi I. In vitro and in vivo anti-allergic effects of “benifuuki” green tea containing O-methylated catechin and ginger extract enhancement. Cytotechnology. 2007;55(2–3):135–142. https://doi.o rg/10.1007/s10616-007-9112-1
18. Maeda-Yamamoto M, Ohtani T. Development of functional agricultural products utilizing the new health claim labeling system in Japan. Biosci Biotechnol Biochem. 2018;82(4):554–563. https://doi.org/10.1080/09168 451.2017.1422175
19. Joubert E, De Beer D, Malherbe CJ, Louw A, Gelderblom WCA. Formal honeybush tea industry reaches 20-year milestone – progress of product research targeting phenolic composition, quality and bioactivity. S Afr J Bot. 2019;127(2019):58–79. https://doi.org/10.1016/j.sajb.2019.08.027
20. Joubert E, De Beer D. Rooibos (Aspalathus linearis) beyond the farm gate: From herbal tea to potential phytopharmaceutical. S Afr J Bot. 2011;77(4):869–886. [cited 2019 Oct 21]. https://doi.org/10.1016/j.sajb.2 011.07.004
21. Street RA, Prinsloo G. Commercially important medicinal plants of South Africa: A review. J Chem. 2013;2013, Art. #205048. https://doi.org/10.1 155/2013/205048
22. Aboyade OM, Styger G, Gibson D, Hughes G. Sutherlandia frutescens: The meeting of science and traditional knowledge. J Altern Complement Med. 2014;20(2):71–76. https://doi.org/10.1089/acm.2012.0343
23. Du S, Liu H, Lei T, Xie X, Wang H, He X, et al. Mangiferin: An effective therapeutic agent against several disorders (Review). Mol Med Rep. 2018; 18(6):4775–4786. https://doi.org/10.3892/mmr.2018.9529
24. Muller CJF, Joubert E, Chellan N, Miura Y, Yagasaki K. New insights into the efficacy of aspalathin and other related phytochemicals in type 2 diabetes – a review. Int J Mol Sci. 2022;23(1), Art. #356. https://doi.org/10.3390/ijms 23010356
25. Sia C. Spotlight on ethnomedicine: Usability of Sutherlandia frutescens in the treatment of diabetes. Rev Diabet Stud. 2004;1(3):145–149. https://doi.org/ 10.1900/RDS.2004.1.145
26. Yi SS, Lee M, Russo R, Li Y, Trinh-Shevrin C, Kwon SC. Dietary policies and programs: Moving beyond efficacy and into “real-world” settings. Health Equity. 2021;5(1):194–202. https://doi.org/10.1089/heq.2020.0050
27. Creswell JW, Poth CN. Qualitative inquiry and research design: Choosing among five approaches. Thousand Oaks, CA: Sage; 2016. Available from: https://us.sagepub.com/en-us/nam/qualitative-inquiry-and-research-design /book246896
28. Guest G, Bunce A, Johnson L. How many interviews are enough?: An experimentwithdatasaturationandvariability.FieldMethods.2006;18(1):59–82. https://doi.org/10.1177/1525822X05279903
29. Adams C, Coulson A, Emmelkamp T, Greveling R, Kluth G, Nugent M. Capitals background paper for IR. London: International Integrated Reporting Council; 2013. Available from: https://integratedreporting.org/wp-content/uploads/20 13/03/IR-Background-Paper-Capitals.pdf
30. Volschenk J. The value implications of coopetition. In: Fernandez A-S, Chiambaretto P, Le Roy F, Czakon W, editors. Routledge companion to coopetition strategies. London: Routledge; 2018. p. 326–335. Available from: https://doi.org/10.4324/9781315185644-31
31. Braun V, Clarke V. Using thematic analysis in psychology. Qual Res Psychol. 2006;3(2):77–101. https://doi.org/10.1191/1478088706qp063oa
32. Lincoln Y, Guba EG. Naturalistic inquiry. Thousand Oaks, CA: Sage; 1985. https://doi.org/10.1016/0147-1767(85)90062-8
33. Birt L, Scott S, Cavers D, Campbell C, Walter F. Member checking: A tool to enhance trustworthiness or merely a nod to validation? Qual Health Res. 2016;26(13):1802–1811. https://doi.org/10.1177/1049732316654870
34. Koch T. Establishing rigour in qualitative research: The decision trail. J Adv Nurs. 1994;19:976–986. https://doi.org/10.1111/j.1365-2648.1994.tb01177.x
35. Vanuul VJB, Brouns FJPH. Nutrition and health claims as marketing tools. Crit Rev Food Sci Nutr. 2015;55(11):1552–1560. https://doi.org/10.1080/10408 398.2012.754738
36. Lepak DP, Smith KG, Taylor MS. Value creation and value capture: A multilevel perspective. Acad Manag Rev. 2007;32(1):180–194. https://doi.org/10.546 5/amr.2007.23464011
37. Fenko A, Kersten L, Bialkova S. Overcoming consumer scepticism toward food labels: The role of multisensory experience. Food Qual Prefer. 2016;48:81–92. https://doi.org/10.1016/j.foodqual.2015.08.013
38. Hodgkins CE, Egan B, Peacock M, Klepacz N, Miklavec K, Pravst I, et al. Understanding how consumers categorise health related claims on foods: A consumer-derived typology of health-related claims. Nutrients. 2019;11(3):539. https://doi.org/10.3390/nu11030539
https://doi.org/10.17159/sajs.2024/14091
Volume 120| Number 5/6 May/June 2024 93
Research
Multi-stakeholder value creation from health claims Page 6 of 7
Article
39. Koen N, Wentzel-Viljoen E, Nel D, Blaauw R. Consumer knowledge and use of food and nutrition labelling in South Africa: A cross-sectional descriptive study. Int J Consum Stud. 2018;42(3):335–346. https://doi.org/10.1111/ij cs.12422
40. Indian Department of Science and Technology. The bio-economy strategy. New Delhi: Department of Science and Technology; 2013. p. 148. Available from: https://www.gov.za/sites/default/files/gcis_document/201409/bioecon omy-strategya.pdf
41. Tóth J, Migliore G, Schifani G, Rizzo G. Sustainable value creation in the food chain: A consumer perspective. Sustainability. 2020;12(4), Art. #1438. http s://doi.org/10.3390/su12041438
42. Knößlsdorfer I, Sellare J, Qaim M. Effects of Fairtrade on farm household food security and living standards: Insights from Côte d’Ivoire. Glob Food Sec. 2021;29, Art. #100535. https://doi.org/10.1016/j.gfs.2021.100535
43. Berry C, Romero M. The fair trade food labeling health halo: Effects of fair trade labeling on consumption and perceived healthfulness. Food Qual Prefer. 2021;94, Art. #104321. https://doi.org/10.1016/j.foodqual.2021.104321
44. Schroeder D, Chennells R, Louw C, Snyders L, Hodges T. The Rooibos benefit sharing agreement – breaking new ground with respect, honesty, fairness, and care. Cambridge Q Healthc Ethics. 2020;29(2):285–301. https://doi.org /10.1017/S0963180119001075
45. Bond T, Derbyshire E. Rooibos tea and health: A systematic review of the evidence from the last two decades. Nutr Food Technol Access. 2020;6(1): 1–11. https://doi.org/10.16966/2470-6086.166
46. Wynberg R. Making sense of access and benefit sharing in the rooibos industry: Towards a holistic, just and sustainable framing. S Afr J Bot. 2017; 110:39–51. https://doi.org/10.1016/j.sajb.2016.09.015
47. Struwig M, Adendorf C. Consumers’ perception of eco-labels in South Africa. Athens J Bus Econ. 2018;4(2):163–178. https://doi.org/10.30958/ajbe.4.2.3
48. Shewayrga H, Sopade PA. Ethnobotany, diverse food uses, claimed health benefits and implications on conservation of barley landraces in North Eastern Ethiopia highlands. J Ethnobiol Ethnomed. 2011;7:1–15. https://doi. org/10.1186/1746-4269-7-19
49. OladeleA,AladeG.Medicinalplantsconservationandcultivationbytraditional medicine practitioners (TMPs) in Aiyedaade Local Government Area of Osun State, Nigeria. Agric Biol J North Am. 2011;2(3):476–487. https://doi.org/10 .5251/abjna.2011.2.3.476.487
50. Zizka A, Thiombiano A, Dressler S, Nacoulma BI, Ouédraogo A, Ouédraogo I, et al. Traditional plant use in Burkina Faso (West Africa): A nationalscale analysis with focus on traditional medicine. J Ethnobiol Ethnomed. 2015;11(1):1–10. https://doi.org/10.1186/1746-4269-11-9
51. Maeda-Yamamoto M. The use of functional agricultural products in the functional food labeling system and its challenges after five years. Food Sci Technol Res. 2021;27(2):169–179. https://doi.org/10.3136/FSTR.27.169
Volume 120| Number 5/6 May/June 2024 94 https://doi.org/10.17159/sajs.2024/14091 Research Article Multi-stakeholder value creation from health claims Page 7 of 7
AuthorS:
Alison F. Ridel1
Fabrice Demeter2,3
Ericka N. L’Abbé1
Dirk Vandermeulen1,4
Anna C. Oettlé1,5
AFFILIAtIoNS:
1Department of Anatomy, Faculty of Health Sciences, University of Pretoria, Pretoria, South Africa
2Lundbeck Foundation GeoGenetics Centre, Globe Institute, University of Copenhagen, Copenhagen, Denmark
3Department of Man and the Environment, Museum of Man, Paris, France
4Center for Processing Speech and Images (PSI), Department of Electrical Engineering (ESAT), KU Leuven, Leuven, Belgium
5Department of Anatomy, School of Medicine, Sefako Makgatho Health Sciences University, Pretoria, South Africa
CorrESPoNDENCE to: Alison Ridel
EMAIL: alison.ridel@up.ac.za
DAtES:
received: 15 Dec. 2021
revised: 23 Aug. 2023
Accepted: 27 Feb. 2024
Published: 28 May 2024
hoW to CItE:
Ridel AF, Demeter F, L’Abbé EN, Vandermeulen D, Oettlé AC. Shape analysis of the nasal complex among South African groups from CBCT scans. S Afr J Sci. 2024;120(5/6), Art. #12972. https://doi.org/10.1715 9/sajs.2024/12972
ArtICLE INCLuDES:
☒ Peer review
☐ Supplementary material
DAtA AVAILABILItY:
☐ Open data set
☐ All data included
☒ On request from author(s)
☐ Not available
☐ Not applicable
EDItorS:
Pascal Bessong
Shane Redelinghuys
KEYWorDS:
human variation of South African groups, cone-beam computer tomography scans, geometric morphometric methods, South African standard facial reconstruction methods
FuNDING:
None
Shape analysis of the nasal complex among South African groups from CBCT scans
Three-dimensional (3D) anatomical extraction techniques could help the forensic anthropologist in a precise and inclusive assessment of biological phenotypes for the development of facial reconstruction methods. In this research, the nose morphology and the underlying hard tissue of two South African populations were studied. To this end, a 3D computer-assisted approach based on an automated landmarking workflow was used to generate relevant 3D anatomical components, and shape discrepancies were investigated using a data set of 200 cone-beam computer tomography (CBCT) scans. The anatomical landmarks were placed on the external nose and the mid-facial skeleton (the nasal bones, the anterior nasal aperture, the zygoma, and the maxilla). Shape differences related to population affinity, sex, age, and size were statistically evaluated and visualised using geometric morphometric methods. Population affinity, sexual dimorphism, age, and size affect the nasal complex morphology. Shape variation in the mid-facial region was significantly influenced by population affinity, emphasising that shape variability was specific to the two population groups, along with the expression of sexual dimorphism and the effect of ageing. In addition, nasal complex shape and correlations vary greatly between white and black South Africans, highlighting a need for reliable population-specific 3D statistical nose prediction algorithms.
Significance:
• 3D anatomical structures were acquired and extracted from 200 CBCT scans of modern South Africans.
• Geometric morphometric methods were applied.
• Soft- and hard-tissue nasal complex morphology vary across South African groups.
Introduction
The human phenotype is a suite of apparent morphological characteristics of a person, which are dependent on the expression of genes (genotype) and the environment. Today, with the development of new technologies, biological anthropologists are able to extensively and intensively collect these quantitative phenotypic data for evaluating variation within and between populations. These population-specific data are often applied in the forensic sciences (e.g. biological profile and facial reconstruction), medicine (e.g. orthopaedics, prosthetics, and plastic surgery), and education.1 Today, modern 3D digital imaging methods provide researchers with extensive in vivo and noninvasive databases of 3D representations of the face (soft and hard tissues).
Ultrasound2, magnetic resonance imaging3, computer tomography (CT), and cone-beam computed tomography (CBCT)4,5 scans are examples of digital imaging modalities that provide an optimal means for capturing information on facial appearance within a population.
However, standard approaches for working with big data, as represented in readily available 3D images from public and private hospitals, have not grown as fast as the research ideas for applying variation found among phenotypic features within a population to real-world outcomes. With knowledge of both soft tissue and hard tissue, we can now use this understanding of variation in forensic anthropology, such as quantifiable biological variation among population groups, which helps provide an accurate biological profile.6 Precise quantification of anatomical shape from digital images is essential for evaluating phenotypic variation and applying this knowledge to evolutionary processes, medicine, and the forensic sciences. Nevertheless, standard guidelines for how to collect data from 3D images need to be considered. Traditionally, in biological anthropology, this has been accomplished by collecting: (1) linear distances; (2) measurements between manually set landmarks; or (3) shape data by assessing the entire array of landmarks using geometric morphometric models (GMM). However, the manual placement of anatomical landmarks is time-consuming, prone to significant intra- and inter-observer error, and remains challenging to standardise in practice.1,5,7 To avoid the problems of manually placing landmarks by multiple operators, the utilisation of automatic anatomical extraction techniques, such as automatic landmarking, is more suitable for analysing large data sets.5,8 Today, the utilisation of GMM instead of linear distances is fostered for phenotypic variation analysis because it allows the extraction of size-free shape variables to elucidate the patterns of shape variation more satisfactorily. Using a dense configuration of landmarks will also give a more comprehensive evaluation of the morphology and is preferable for applications that need extensive knowledge of the biological phenotypic changes, such as estimating a biological profile in forensic anthropology.
There are discrete patterns of biological variation among humans, such as clinal phenotypic variability, which is often driven by social and cultural aptitudes and noticed at geographical distances.6,9 Numerous bioanthropological investigations on population affinity related shape changes have proven the effect of environmental influences on nose shape10, emphasising the fundamental premise that the external nose shape and anterior nasal aperture are pivotal in climate adaptation.10 From the scientific literature, discrete morphological differences have already been noticed between all South African groups.11-13 Numerous osteometric investigations have indicated that some
95 https://doi.org/10.17159/sajs.2024/12972 Volume 120| Number 5/6 May/June 2024 ©
under
Attribution
2024. The Author(s). Published
a Creative Commons
Licence. Research Article
mid-face features, such as alveolar prognathism and nasal breadth, are population affinity related morphological variations.11-13
Identification of a person from their skeletal remains is problematic in many developing-world countries, including South Africa.14 Due to social and politicalsituations,standardidentificationproceduressuchasfingerprinting andDNAcomparisonsarenotalwaysapplicable.Furthermore,manySouth African people do not have identification documents. Further compounding these circumstances is that many migrants are coming into the country from all over Africa. Consequently, this context necessitates using creative and cost-effective technologies such as facial reconstruction techniques to assist in creating visual representations for the prospective identification of deceased family members.
Craniofacial reconstruction (CFR) is defined as the presumed morphological correlation between soft tissue and underlying hard tissue. Three categories of facial reconstruction techniques exist: 2D, 3D manual facial reconstruction, and 3D computer-based facial reconstruction. The scientific community acknowledges that manual CFR techniques necessitate a high level of sculptural and anatomical proficiency and remain subjective in practice.15,16 Today, researchers in the field of CFR utilise technological advances such as computer science and medical imaging to develop alternative computer-based CFR methods to improve the objectivity of facial reconstructions during criminal investigations.4,5,17 Computers are more impartial and consistent than forensic artists.17 The computer incorporates all modelling assumptions and provides identical output data repeatedly.17 Furthermore, some techniques may be automated, such as developing several reconstructions from the same target skull based on various modelling assumptions (e.g. biological variation).17 The history and evolution of craniofacial reconstruction methods and their applications have shown the extent of human diversity within and across communities, laying the foundations for the current development of accurate population-specific standards.
The presumptive identification of an unknown person is predicated on the existence of quantifiable phenotypic variations and the relationship of these variations to the individual’s socio-cultural identity.18 Socio-cultural identity in South Africa is based on the cohesive social classifications imposed on people during the apartheid period, notably ‘White’, ‘Black’, ‘Coloured’, and ‘Indian’. People in these groups hail from vastly distinct
geographical environments and have already exhibited various cultural and biological characteristics. For instance, ‘white’ people mainly descend from European immigrants, including Dutch, German, British, and French.11 In comparison, the modern ‘black’ population groups are the descendants of Sotho, Venda, Nguni, and Shangaan-Tsonga migrants who came to southern Africa due to Bantu language tribes migrating from central and western Africa.18,19
In addition, assortative mating among the modern South African population enhanced the already substantial biological variability between groups. Consequently, it fostered the persistence of skeletal variation to the extent that forensic anthropologists may categorise an unknown person into four major socially identifiable categories: black, coloured, Indian or white South Africans.20
In this study, we aimed to establish standardised and comprehensive morphological representations of the nasal complex (mid-facial skeleton and external nose) within two South African population groups from an extensiveCBCTdatabasethatcanbeusedtoexaminephenotypicdiversity. In this research, we propose a reliable assessment of morphological variations attributable to variables (population affinity, age, sex, and allometry) by applying an automated landmarking workflow5,8 and GMM.
Materials and methods
A retrospective and anonymised database of CBCT scans was collected from two South African institutions: the Life Groenkloof Hospital and the Oral and Dental Hospital, Pretoria, South Africa. All CBCT scans were acquired using a CBCT scanning modality with the following specifications: 90 kV, 11.2 mA, 0.4 mm voxel size, and 230 × 260 mm field of view. Subjects were excluded if they presented with any condition that could affect the morphology of the face (e.g. orthodontic treatment, pathological conditions, facial asymmetry, or any facial interventional reconstructive surgery), resulting in 200 usable scans. Therefore 200 adult South Africans with an average age of 40.51 years (SD: 16.17), of whom 100 were black South Africans (33 women, 67 men) and 100 were white South Africans (65 women, 35 men), were selected from the available database for this study. Ethical approval (No: 301/2016) to conduct this research was obtained from the Main Research Ethics Committee of the Faculty of Health Sciences at the University of Pretoria in South Africa.
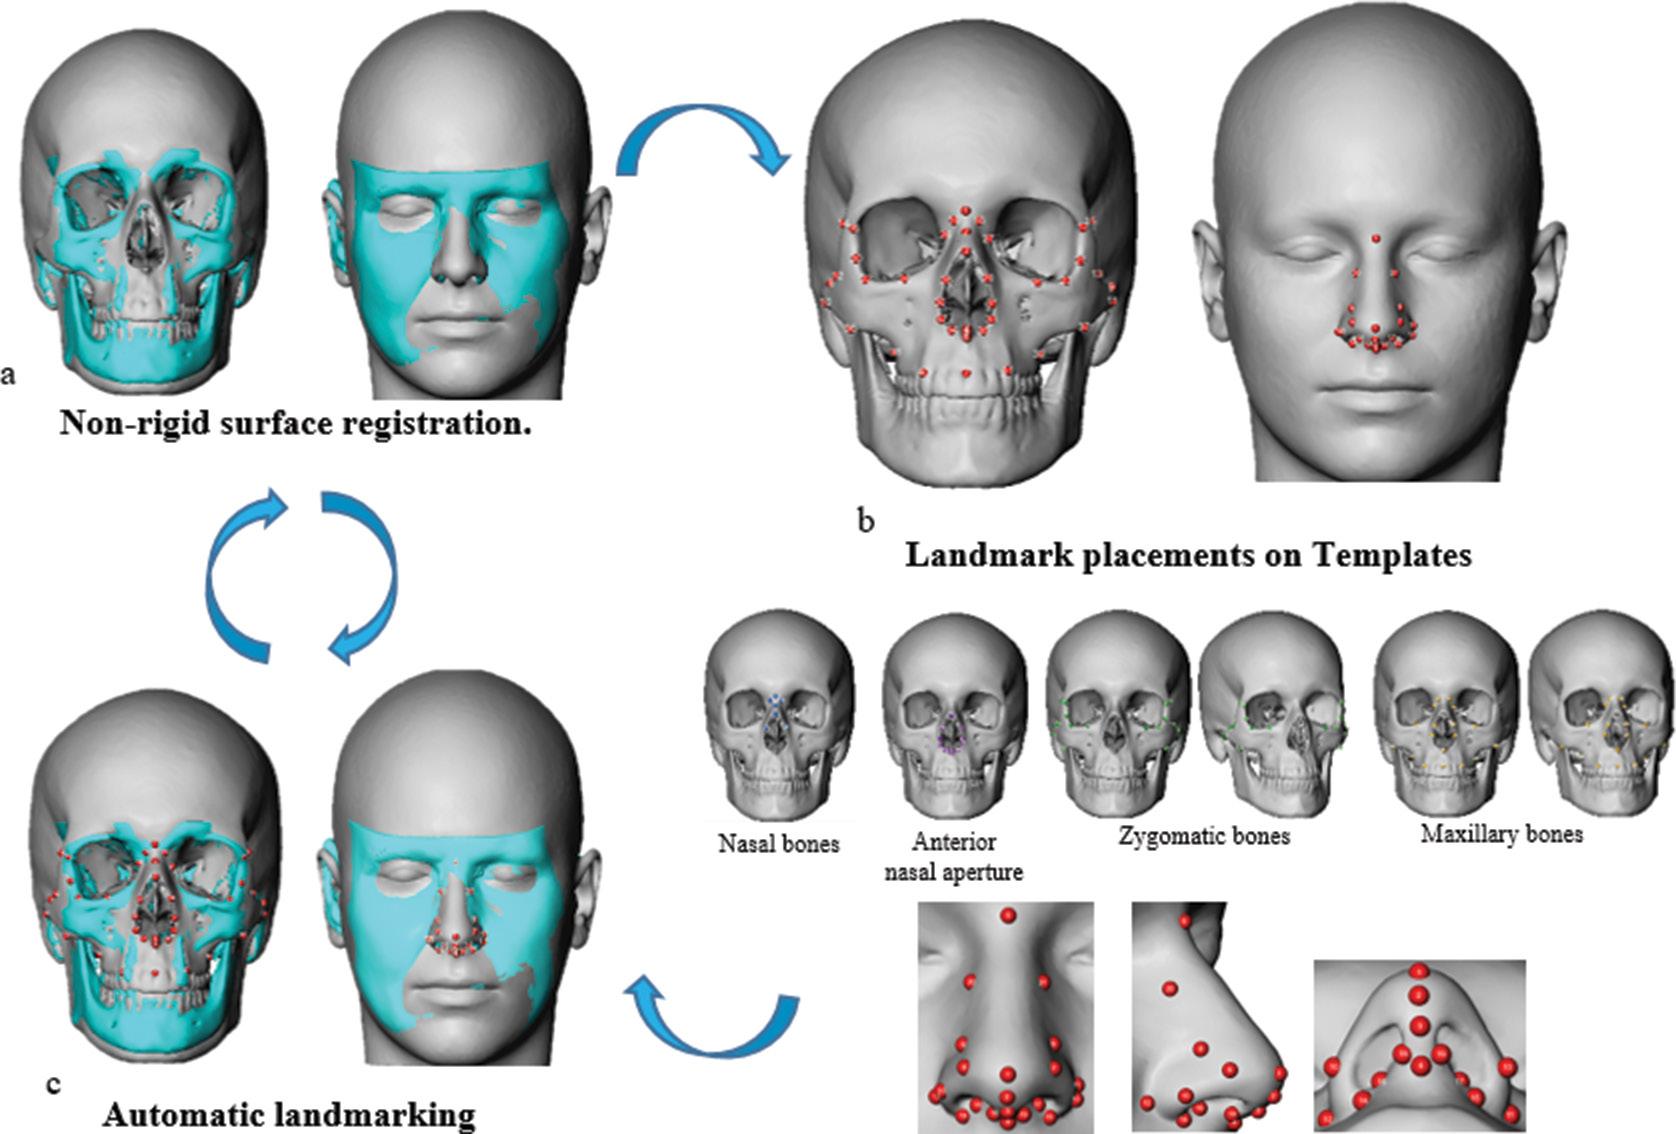
Volume 120| Number 5/6 May/June 2024 96 https://doi.org/10.17159/sajs.2024/12972 Research
analysis of the nasal complex Page 2 of 12
Article Shape
Figure 1: Automatic landmarking workflow from Ridel et al. used in this study: (a) non-rigid surface registration process; (b) templates generation and landmarks positioning; and (c) automatic landmarking.5,8
We used the MeVisLab v. 2.7.1 software to create the triangular surface mesh and carry out anatomical extraction. Relevant anatomical structures in 3D were obtained and retrieved using an already tested and published automatic dense landmarking workflow.5,8 The automated landmarking workflow used is depicted in Figure 1.
Biological landmarks were respectively placed on the external nose (soft tissue) and the facial skeleton (hard tissue) following the definition in facial approximation literature4,21 (Figure 1b). A total of 21 capulometric landmarks were placed to capture the external nose morphology. Five craniometric landmarks were recorded on the nasal bones and eight craniometric landmarks on the anterior nasal aperture. On the zygomatic bone,ninecraniometriclandmarkswereplaced,whereas,onthemaxillary bone, ten craniometric landmarks (two median and eight bilateral pairs) were positioned. A total of 41 craniometric and 21 capulometric
landmarks were recorded for 3D manual facial reconstruction and 3D computer-based facial reconstruction, respectively. Table 1 shows the definition and reproducibility of craniometric landmarks placed automatically and used in this study.
In this research, all statistical analyses were carried out using R studio for Windows22 version 1.0.44-®2009-2016. The complete sample (400 3D reconstructions) was subjected to a test of the repeatability of the digitisation in terms of inter- and intra-observer errors using the dispersion5 for each landmark and specimen. The dispersion was used to assess the reproducibility of digitisation across and between observers (inter- and intra-observer) for the complete sample (400 3D reconstructions) based on the utilisation of automatic landmarking. The mean Euclidean distance between the landmark and the mean of the (x,y,z)-landmark coordinates across all observations for each specimen is used to measure dispersion.
table 1: Definition and reproducibility of craniometric landmarks placed automatically and used in this study4,21
LandmarksAbbreviationNatureDefinition
Craniometric
1 NasionnMIntersection of the nasofrontal sutures in the median plane.
2 Mid-nasalmnMMidline point on the internasal suture midway between the nasion and rhinion.
3 RhinionrhiM
4 NasospinalensM
5 Subspinale bssM
Most rostral (end) point on the internasal suture.Cannot be determined accurately if nasal bones are broken distally.
The point where a line drawn between the inferior most points of the nasal aperture crosses the median plane. Note that this point is not necessarily at the tip of the nasal spine.
The deepest point seen in the profile view below the anterior nasal spine (orthodontic point A).
6 AkanthionakMMost anterior midline point of the nasal spine.
7 ProsthionprM
Median point between the central incisors on the anterior most margin of the maxillary alveolar rim.
8/9 Zygotemporale superiorztsBMost superior point of the zygomatico-temporal suture.
10/11 Zygotemporale inferiorztiBMost inferior point of the zygomatico-temporal suture.
12/13 JugalejuB
Vertex of the posterior zygomatic angle, between the vertical edge and horizontal part of the zygomatic arch.
14/15 Frontomalare temporalefmtBMost lateral part of the zygomaticofrontal suture.
16/17 Frontomalare orbitalefmoBPoint on the orbital rim marked by the zygomaticofrontal suture.
18/19 NasomaxillofrontalenmfBPoint at the intersection of the frontal, maxillary, and nasal bones.
20/21 EctoconchionecBLateral point on the orbit at a line that bisects the orbit transversely.
22/23 OrbitaleorB
Most inferior point on the inferior orbital rim. Usually falls along the lateral half of the orbital margin.
24/25 ZygoorbitalezoBIntersection of the orbital margin and the zygomaticomaxillary suture.
26/27 MaxillofrontalemfBIntersection of the anterior lacrimal crest with the frontomaxillary suture.
28/29 NasomaxillarenmBMost inferior point of the nasomaxillary suture on the nasal aperture.
30/31 AlarealB
Instrumentally determined as the most lateral point on the nasal aperture in a transverse plan.
32/33 Piriform curvaturecpBMost infero-lateral point of the piriform aperture.
34/35 NarialenaBMost inferior point of the piriform aperture.
36/37 ZygomaxillarezmBMost inferior point on the zygomaticomaxillary suture.
38/39 Submaxillare curvaturecsmB
Most supero-medial point on the maxillary inflexion between the zygomaxillare and the ectomolar.
40/41 Supra caninescBPoint on the superior alveolar ridge superior to the crown of the maxillary canine.
Volume 120| Number 5/6 May/June 2024 97 https://doi.org/10.17159/sajs.2024/12972 Research
analysis of the nasal complex
12
Article Shape
Page 3 of
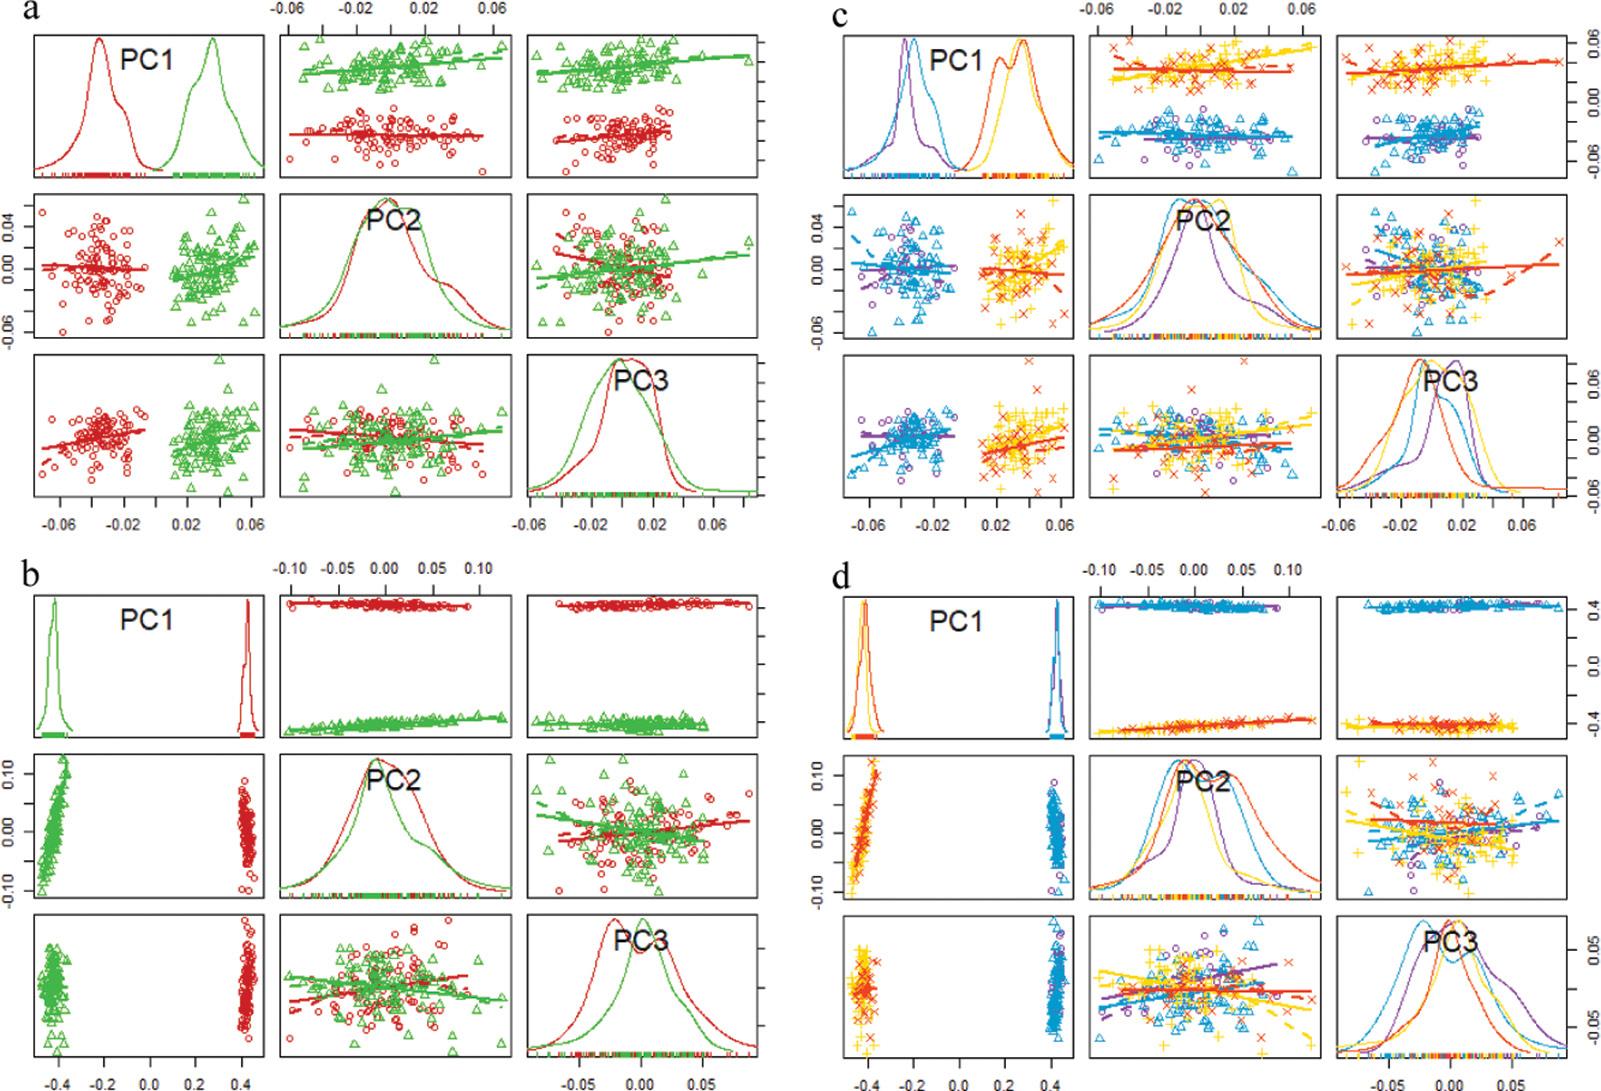
Figure 2: Between-group principal component (PC) analysis of external nasal soft tissue shape and mid-facial hard tissue and components grouped by population affinity (a,b) and by sex and population affinity (c,d). (a, c) Mid-facial hard tissue and (b, d) external nasal soft tissue. Red circles indicate black South Africans; green triangles indicate white South Africans; purple circles indicate black women; blue triangles indicate black men; yellow pluses indicate white women; and orange crosses indicate white men.
Geometric morphometric methods were used to quantify and evaluate shape differences attributable to population affinity, sex, size, age variables, and covariates in both shape configurations (soft and hard tissues). Geometric morphometrics reflects the geometry of the placed landmarks and enables visualisations of statistical findings as real shape deformations.23
Prior to statistical analysis, a general Procrustes analysis, a principal component analysis, and a multivariate normality test using Q-Q plots were run on both 3D reconstruction types for the complete sample and each population subgroup, namely white and black South Africans. First, a general Procrustes analysis was used to provide pose-invariant shape coordinates for both configurations.24,25 Then, a principal component analysis was applied to minimise the dimensionality of the data and provide independent principal component scores that accounted for 95% of the sample’s total variance. Finally, by evaluating Q-Q plots24 , the normality of soft and hard tissue principal component scores was examined. The effect of the population affinity, sex, age, and allometry variables on the complete sample’s soft and hard tissues was first performed. The expression of sexual dimorphism, ageing, and size effect (allometry) was then analysed for each subsample independently to identify population-specific variations. Finally, the covariations between nasal soft and hard tissue and population affinity dependency were analysed.
Using R-package geomorph26, simple and multiple analysis of variance (ANOVA/MANOVA) parametric tests were applied to examine shape variations across the population, sexes, and age groups. Additionally, R packages ffmanova27 and Morpho28 were used to execute two nonparametric tests, 50-50 MANOVA27 and permutation testing4, to support the findings. Finally, standard discriminant function analysis (DFA)4 using the Morpho28 R package was also carried out to categorise population affinity and sex based on leaving-one-out cross-validation to evaluate the classification’s reliability.
Using the JVM R package29, allometry’s impact was determined by generating linear models using soft and hard tissue configurations as response variables and population affinity, sex, age, and centroid size as predictors. The significance of each variable was determined
using 50-50 MANOVA and multivariate analysis of (co)variance (MANCOVA)29 with Pillai trace. MANCOVA is employed to analyse the relationships between several dependent variables and one or more categorical or continuous explanatory factors.29 In addition, the correlation between the two blocks of shape coordinates was examined using the two-block partial least squares30 analysis available in the Geomorph R package.26
results
Multivariate normality analysis indicated non-parametric distributions for various hard tissue features, such as the anterior nasal aperture and the maxillary morphologies, for the complete sample and within population affinity subgroups. For this reason, all results were examined using both parametric and non-parametric tests, and outcomes were only judged acceptable if both tests yielded equivalent results. With regard to the intraand inter-measurement errors of the craniometric (mean: 0.22 mm; SD: 0.02mm) and capulometric (mean: 0.23 mm; SD: 0.04 mm) landmark locations placed using the automatic landmarking procedure, lower mean values were found for both configurations (soft and hard tissues).
Complete sample
The findings revealed that population affinity contributed the most to shape variance in the complete sample for both soft and hard tissue shape component configurations (Figure 2a,b). Moreover, all statistical tests (Table 2) demonstrated a significant difference between the population means. Finally, the classification reliability was 100% overall. (Table 2). Judging by visual observation in Figure 4a,b of the hard tissue (Figure 4a) and soft tissue (Figure 4c) mean shape representations, the wider shape could be attributed to black South Africans. The box plots (Figure 3a,b) further illustrated that the centroid sizes were slightly larger within black South Africans than in white South Africans. Nonetheless, this variance was limited in terms of the mean morphologies of the groups, showing relatively small shape variations related to population affinity specific size. Also, the interaction between size and population affinity testing reported non-significant differences for hard tissue, including all the skeletal elements evaluated separately, as well as for the soft tissue (Table 2).
Volume 120| Number 5/6 May/June 2024 98 https://doi.org/10.17159/sajs.2024/12972 Research
Shape analysis of the nasal complex Page 4 of 12
Article
table 2: Results of soft and hard tissue population affinity differences and covariation between soft and hard tissues and their dependence on population affinity
Test1, MANOVA; Test2, permutation test; DFA, discriminant function analysis; Test3, ANOVA. Significant p-values (<0.05) are indicated in bold.
*Correlation between mid-facial region and external nose tested by two-block partial least square (pls) analyses.
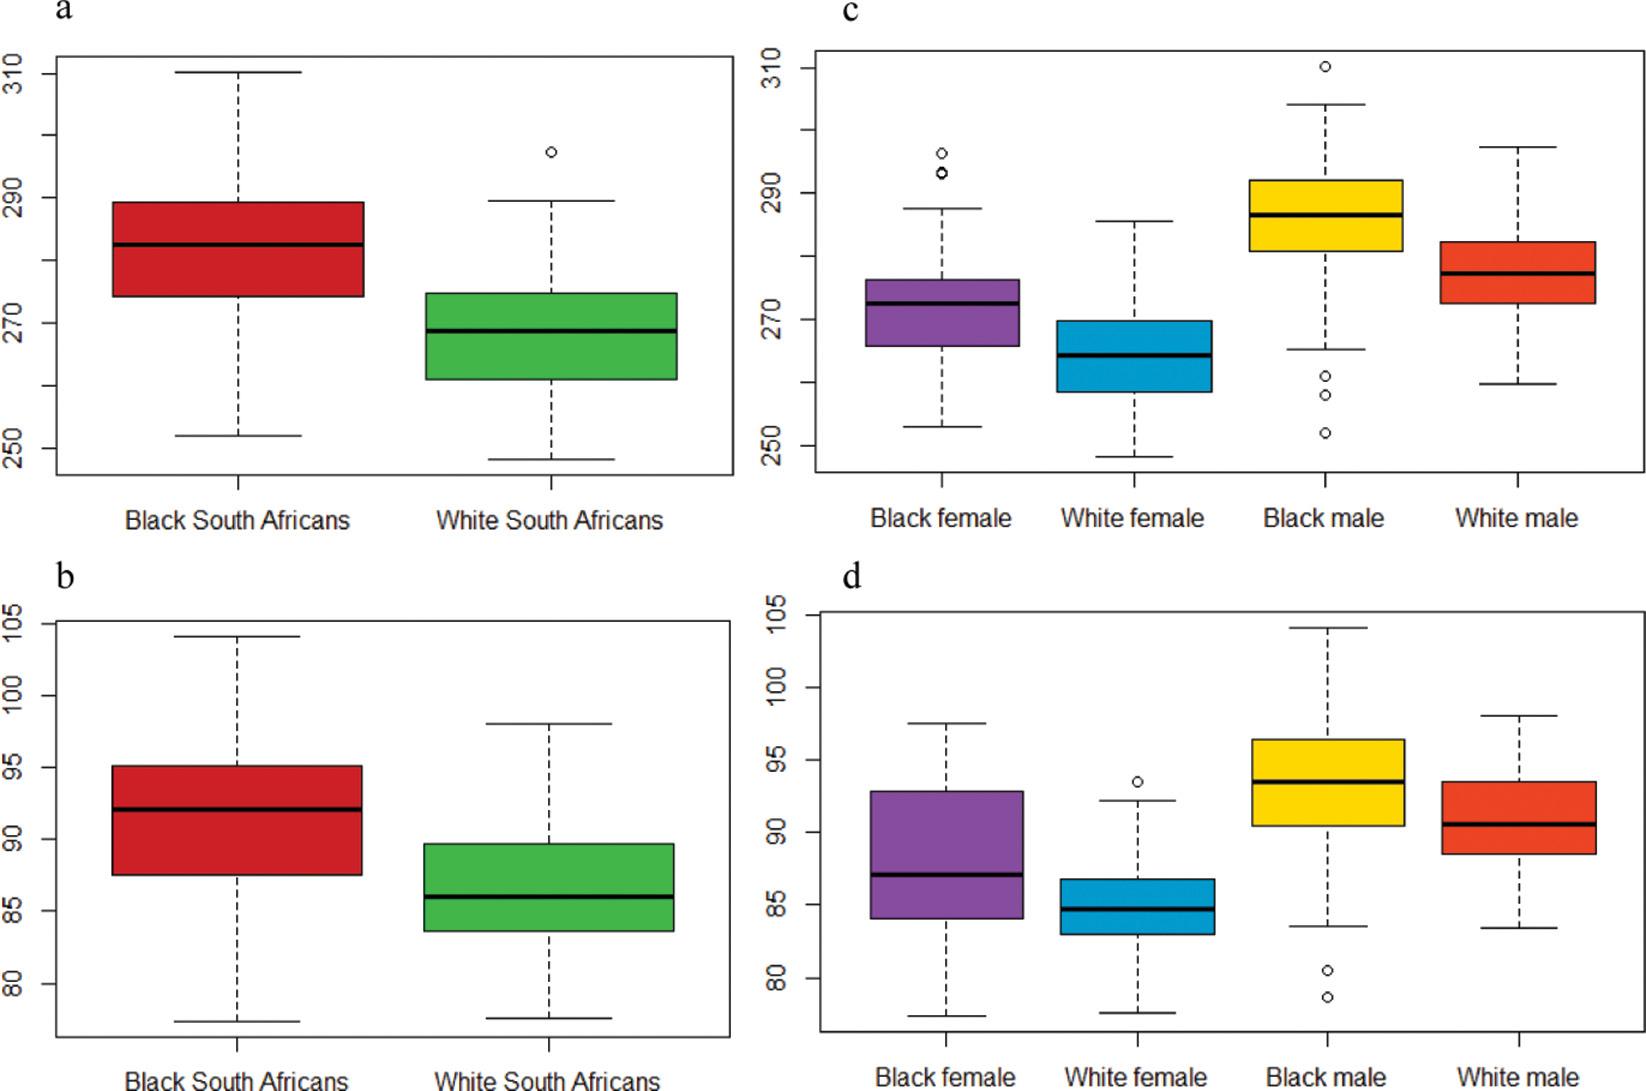
Figure 3: Centroid sizes grouped by population affinity (a,b) and by sex and population affinity (c,d) of the mid-facial hard tissue (a,c), and the external nasal soft tissue (b,d) shape components. Red: black South Africans; green: white South Africans; purple: black women; yellow: white women; blue: black men; orange: white men.
The external nose and the underlying mid-face configuration of the two South African populations appeared morphologically distinct (Figure 4a,b). Indeed, white South Africans were seen to have a longer and more prominent external nose than their black South African counterparts.
Furthermore, while evaluating the components of the mid-facial skeleton, the nasal bones of black South Africans appeared to be more integrated into the skull (or blunt), whereas the nasal bones were more prominent in white South Africans. The anterior nasal aperture of black South Africans
Volume 120| Number 5/6 May/June 2024 99 https://doi.org/10.17159/sajs.2024/12972 Research Article Shape analysis of the nasal complex Page 5 of 12
Black South AfricanWhite South Africans Population affinityPopulation affinity*SizeCovariation*Covariation* Test1 Test2 DFA Test3 r-pls p-valuer-pls p-value Mid-facial region 0.0010.001 100%0.4310.613 0.001 0.563 0.001 Nasal bones 0.0010.001 100%0.2160.562 0.001 0.545 0.001 Nasal bone (left) 0.0010.001 99%0.5540.549 0.001 0.492 0.002 Nasal bone (right) 0.0010.001 100%0.5830.584 0.001 0.515 0.001 Anterior nasal aperture 0.0010.001 100%0.6230.468 0.008 0.523 0.003 Anterior nasal aperture (left) 0.0010.001 99%0.5800.460 0.007 0.477 0.008 Anterior nasal aperture (right) 0.0010.001 100%0.5630.467 0.008 0.468 0.007 Zygoma 0.0010.001 100%0.5560.570 0.001 0.458 0.022 Zygomatic bone (left) 0.0010.001 100%0.5530.536 0.001 0.465 0.006 Zygomatic bone (right) 0.0010.001 100%0.5340.577 0.001 0.4140.052 Maxilla 0.0010.001 100%0.5980.605 0.001 0.540 0.001 Maxillary bone (left) 0.0010.001 100%0.6270.587 0.001 0.518 0.002 Maxillary bone (right) 0.0010.001 100%0.6230.570 0.001 0.3300.505
Complete sample
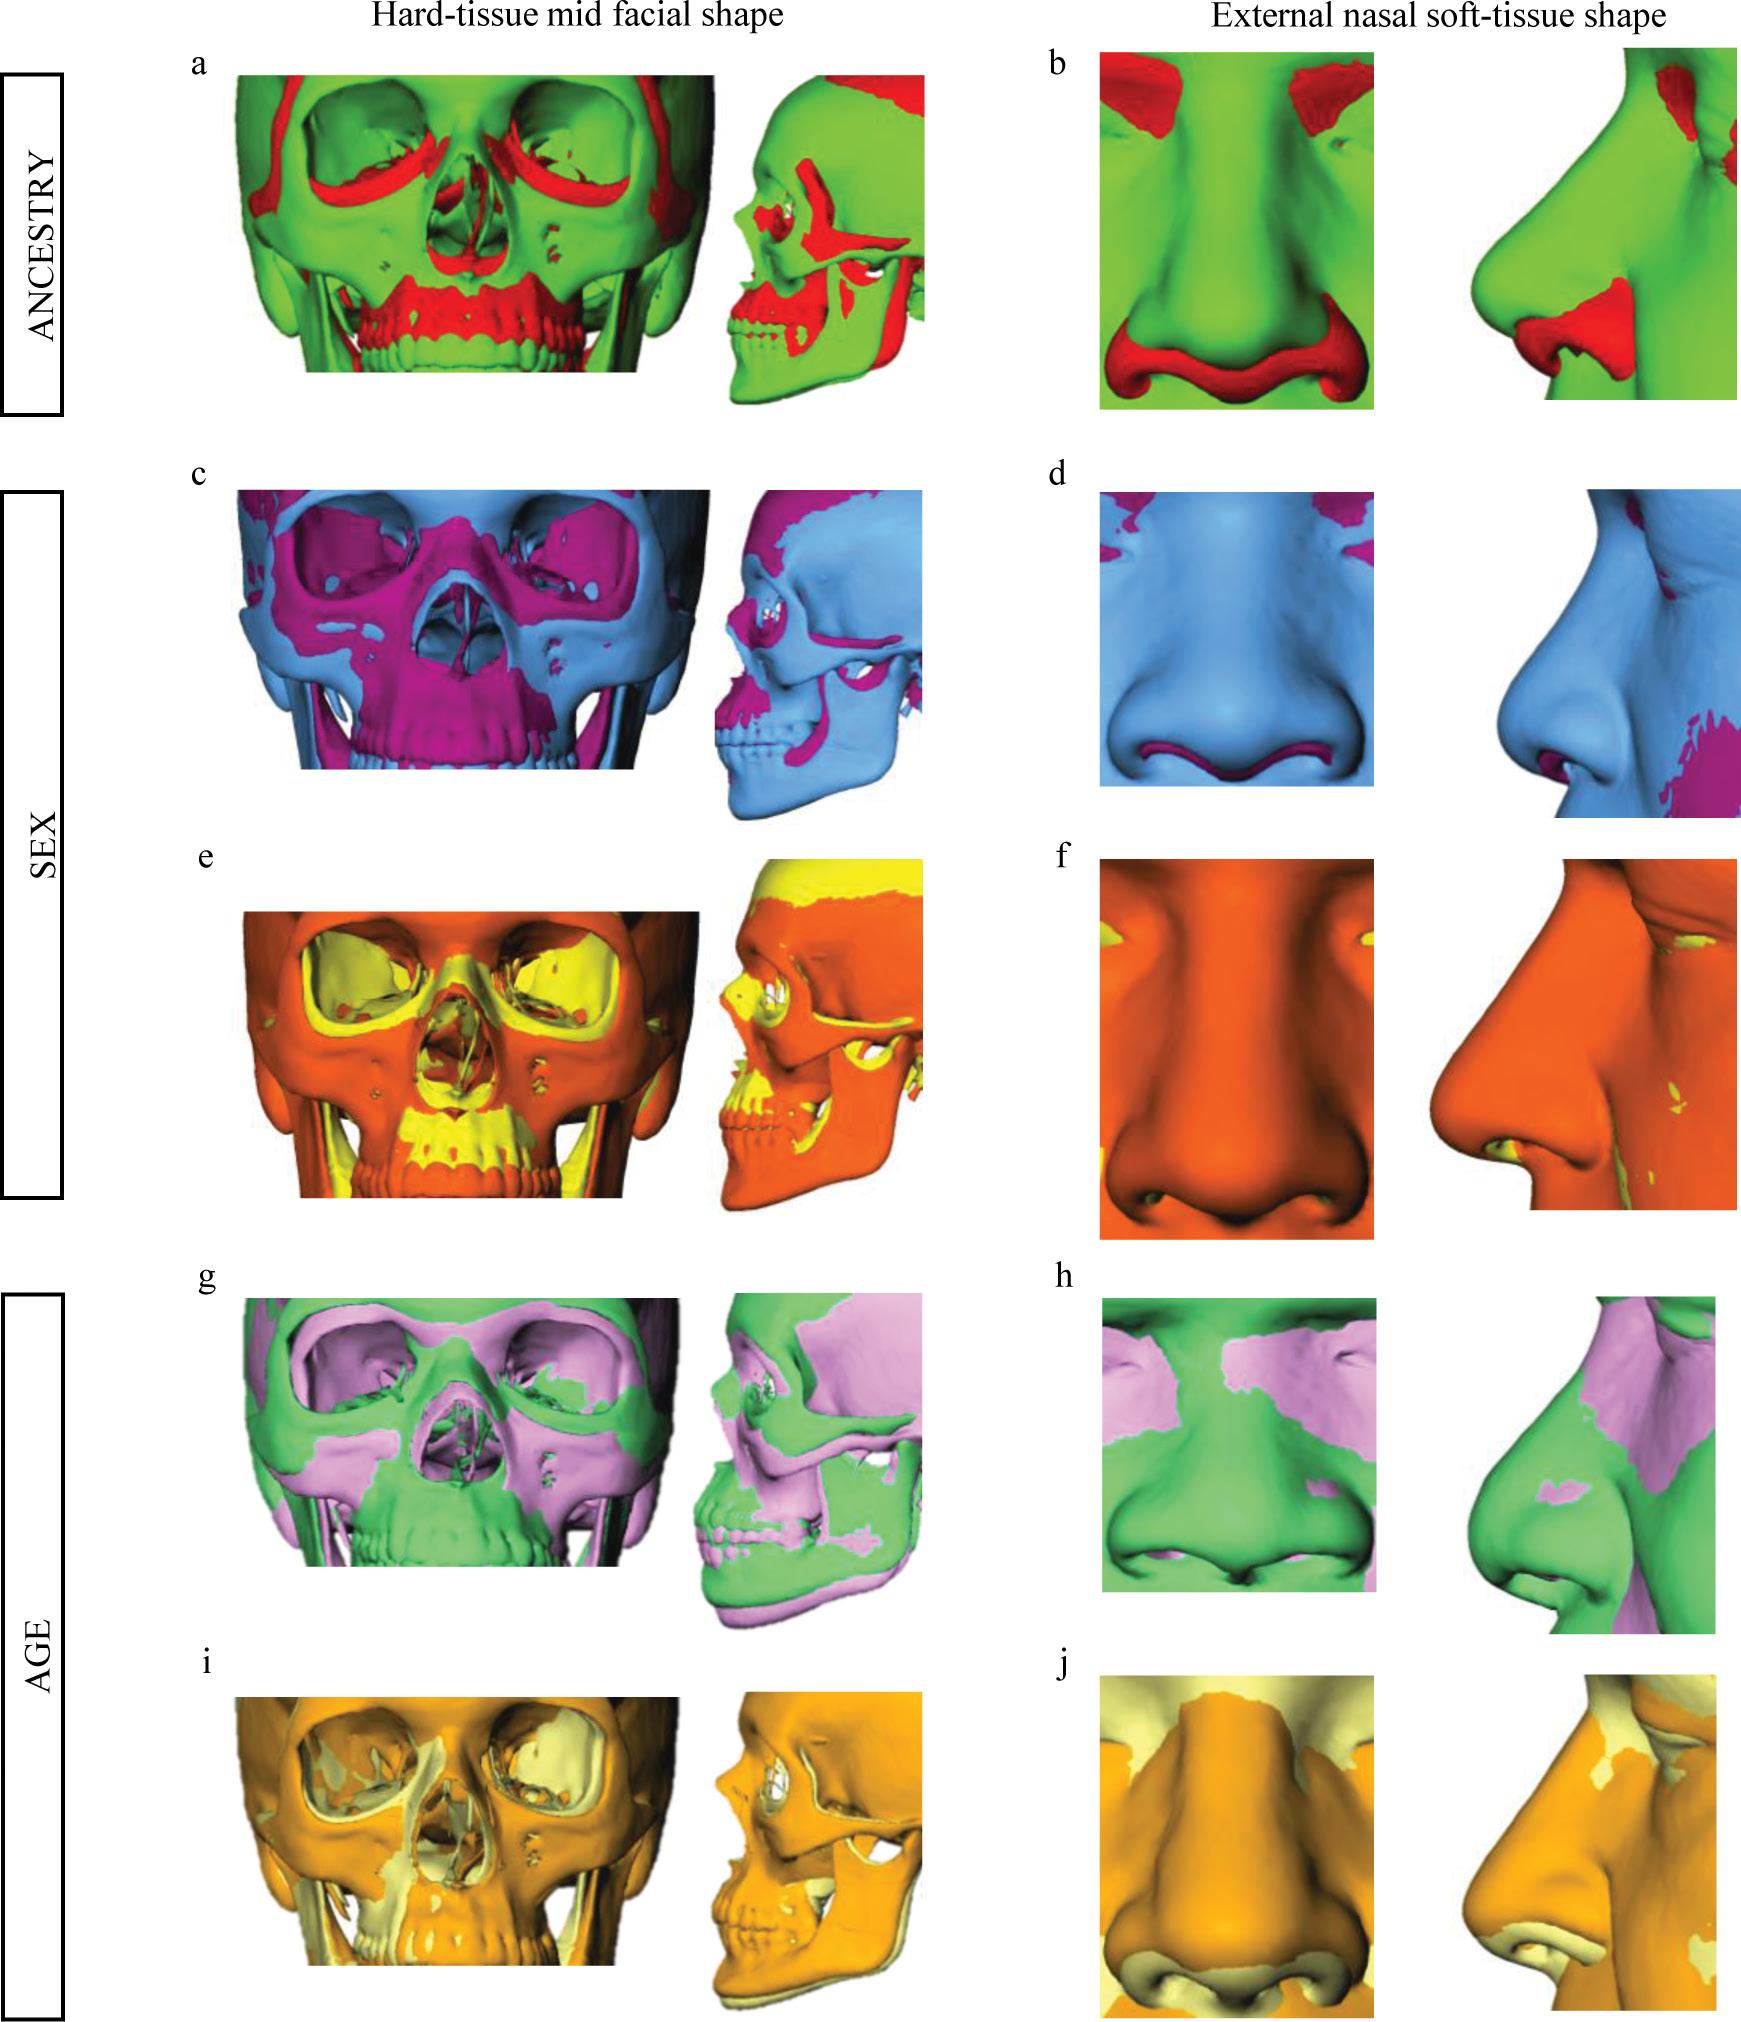
Figure 4: Mid-facial hard tissue and external nasal soft tissue shape differences between population affinity, sex, and age averages. (a,b) Mid-facial hard tissue and external nasal soft tissue shapes. Red: black South Africans; green: white South Africans. (c,d,e,f) Sexual dimorphism in mid-facial hard tissue and external nasal soft tissue shape differences for the black and white populations separately. (c,d) Soft and hard tissue shapes of black South Africans (purple: black women; blue: black men). (e,f) Soft and hard tissue shapes of white South Africans (yellow: white women; orange: white men). (g,h,i,j) Soft and hard tissue shape ageing differences for the black and white populations separately. (g,h) Soft and hard tissue shapes of black South Africans (purple: 18 years; green: 79 years). (i,j) Soft and hard tissue shapes of white South Africans (yellow: 18 years; orange: 79 years).
is wider and more rounded than that of white South Africans, which is smaller and more restricted (or pear-shaped). In terms of the maxilla, black South Africans displayed prognathism, while white South Africans displayed orthognathism. In both population groups, the zygomatic bones were retracted, although this was more pronounced in the white South Africans than in the black South Africans. Additionally, white South Africans have narrower zygomatic bones than black South Africans.
Sex interacted with population affinity in the complete soft and hard tissue sample. The between-group principal component analyses (Figure 2c,d) confirmed a strong separation between population groups and illustrated a similar expression with sexual dimorphism (Figure 4c,d,e,f) for both
soft (Figure 2c) and hard tissue (Figure 2d) shape components. However, when elements of the mid-facial shape were considered separately, the covariation between sex and population affinity was insignificant (Table 3), demonstrating the absence of population affinity specific expression of sexual dimorphism for the hard tissue shape. However, the interaction between sex and population affinity was statistically significant for the external nose, suggesting population affinity specific expression of sexual dimorphism (Table 3).
In the complete soft and hard tissue sample, the interaction of age and the covariate age with population affinity and sex was shown. For the underlying bone tissue morphology, all tests did not report a similar
Volume 120| Number 5/6 May/June 2024 100 https://doi.org/10.17159/sajs.2024/12972 Research Article Shape analysis of the nasal complex Page 6 of 12
table 3: Soft and hard tissue sexual dimorphism in the complete sample and within population affinity groups
Anterior nasal aperture (left)0.4000.097
Maxillary bone (right)0.2750.2280.1330.147
Test1, MANOVA; Test2, Permutation test; Test3, ANOVA; Test4, MANCOVA; Test5, 50-50 MANOVA; DFA, discriminant function analysis. Significant p-values (<0.05) are indicated in bold.
outcome for age, but significance was reported for the covariation between population affinity and age (Table 4). Regarding the soft tissue shape, both parametric and non-parametric tests reported significance with age, and for the interaction between age and population affinity. When the hard tissue elements were analysed separately, the right anterior nasal aperture and the right maxilla seemed to show a higher variability of shape with ageing when compared to the other skeletal elements, as well as for the interaction between population affinity and age (Table 4). On the other hand, apart from the right maxillary bone, all tests on soft tissue and skeletal elements reported significance for the interaction between sex and age, or for the interaction among population affinity, sex, and age. Age and its interaction with population affinity significantly contributed to overall soft and hard tissue shape variation (Figure 4g,h,i,j).
All three variables – population affinity, sex, and centroid size – were examined to create an impression of the extent to which allometry is responsible for variability in the morphology of soft and hard tissues in the complete sample. All statistical tests indicated size significance for the hard tissue shape (Table 5). In addition, the nasal bones, the left anterior nasal aperture, the left zygomatic bone, and the left maxillary bone were significant for the interaction between size and population affinity when all parts of the hard tissue area were evaluated independently. On the other hand, no significance was found for the interaction between sex and size, and only the nasal aperture and the maxilla showed a significant interaction among population affinity, sex, and size, with both parametric and non-parametric tests. Regarding the soft tissue shape, both parametric and non-parametric statistical tests reported significance for size (Table 5). No significant interaction was observed between population affinity and size, or among population affinity, sex, and size for soft tissue shapes. Overall, size is an essential contributor to the variation found in the soft and hard tissue shapes.
Population affinity subsamples
Population affinity differences were visible within the data, and to identify significant population affinity specific variations, the expression of sexual
dimorphism, the ageing process, and the impact of size (allometry) were analysed for each population affinity subsample (white and black subsamples) separately and on both soft and hard tissues.
Sexual dimorphism was verified in all hard tissue elements in the black South African sample (Table 3), while only the maxillary and the right maxillary shapes had no significance in parametric and non-parametric tests. For the hard tissue structure, a DFA showed an accuracy rate of 96%. When we examined the anatomical parts independently in the black South African population, the zygomatic morphology showed the most significant sexual dimorphism, with a DFA of 91%. Only the morphology of the zygoma and the maxilla demonstrated the presence of sexual dimorphism in the white South African population, with DFA achieving 93% and 94% accuracy, respectively. Sexual dimorphism in the soft tissue shape was confirmed in both populations (Table 3). Although sexual dimorphism of the soft tissue shape was accentuated for the white South African sample, all tests also reported significant differences between group means for the black South African sample. A DFA on the soft tissue shape revealed an accuracy of 88% for the black South African sample and 90% for the white South African group, demonstrating the prevalence of sexual dimorphism in both populations.
The soft tissue and hard tissue shape differences between sex averages for black South Africans (Figure 4c,d) and white South Africans (Figure 4e,f) confirm the statistical findings of sexual dimorphism in each population group. Non-significant differences in the size variations for the hard tissue, including all the skeletal elements evaluated separately, as well as for the soft tissue (Table 3), were noted. For both population affinity groups and for both soft and hard tissue shape configurations, the centroid sizes were slightly larger in the male individuals than in the female individuals (Figure 3c,d), demonstrating that the expression of sexual dimorphism regarding centroid size is therefore very similar in each population group.
Table 5 shows that, in both groups, age had a statistically significant influence on hard tissue morphology, demonstrating that age affects hard tissue shape variation. There was a strong correlation between
Volume 120| Number 5/6 May/June 2024 101 https://doi.org/10.17159/sajs.2024/12972 Research Article Shape analysis of the nasal complex Page 7 of 12
Complete sample Black South AfricansWhite South Africans Population affinity*SexSize*sexSize*sex Test4 Test5 Test1 Test2 Test4 DFA Test3 Test1 Test2 Test4 DFA Test3
0.0150.0080.008 96%0.270 0.0170.019 0.61693%0.501
Mid-facial region0.3250.253
0.000 83%0.629
0.0360.034 0.05271%0.6190.068 0.055 0.01470%0.620
0.0060.0060.000 79%0.5580.1650.178 0.000 80%0.621
0.0050.0050.003 82%0.3780.5140.5160.47679%0.152
Nasal bones0.1210.086 0.0530.0490.000 76%0.6310.1580.164
Nasal bone (left)0.3640.396
Nasal bone (right)0.0600.082
Anterior nasal aperture0.6220.562
0.0030.0060.002 82%0.6180.4540.4240.23468%0.615
76%0.5710.2390.2140.12976%0.587 Zygoma0.2490.372 0.0010.0010.000 91%0.381 0.0010.0010.000 93%0.593 Zygomatic
0.0020.0020.000 86%0.088 0.0010.0010.000 90%0.532 Zygomatic
0.0010.0010.000 84%0.521 0.0020.0010.000 94%0.516 Maxilla0.3970.311 0.097 0.107 0.002 88%0.531 0.029 0.021 0.000 94%0.579 Maxillary bone (left)0.1730.188 0.0250.0320.000 82%0.684 0.034 0.025 0.000 90%0.378
0.003 82%0.620 0.0130.0080.000 91%0.641 External nose 0.0080.0080.0050.0050.014 88%0.679 0.0010.0010.016 90%0.378
Anterior nasal aperture (right)0.5550.495 0.0110.0060.001
bone (left)0.3940.502
bone (right)0.6840.765
table 4: Soft and hard tissue shape change associated with age in the complete sample and within population affinity groups
Complete sample Black South AfricansWhite South Africans
Nasal bones0.4200.3090.7630.4840.5010.7600.9890.9960.3570.3720.8800.8630.4010.4290.3060.328
Nasal bone (left) 0.3630.2300.7400.5470.7820.6320.9310.9750.6700.6940.7580.7700.5480.5830.5650.586
Nasal bone (right)
0.5070.2980.3910.2660.3020.4120.9810.9520.5950.5810.7700.7750.5480.5480.7540.797
Test4, MANCOVA; Test5, 50-50 MANOVA. Significant p-values (<0.05) are indicated in bold.
the form of the anterior nasal aperture, right zygoma and left maxilla in the black South African sample and the impact of age on shape variability in the white South African sample, according to all statistical tests. In both samples, significant interactions between age and sex were found in the hard tissue shape, indicating that sex-dependent ageing processes exist. In addition, all tests reported a significant influence of age on the soft tissue, suggesting that age affects, or at least influences, shape variability of the external nose (Table 4) in both population groups. No significance was found for the interaction of sex and age on the soft tissue, indicating that the influence of ageing was independent of sex.
The statistical findings on ageing processes in each group are confirmed in Figure 4, representing the external nose and the underlying hard tissue shape differences between average age from 18 to 79 years for black South Africans (Figure 4g,h) and white South Africans (Figure 4i,j).
Separately for both population affinity groups, all tests showed significance for size for all soft and hard tissue components. In both groups, no statistical significance was noted for the interaction between
sex and size on the soft and hard tissue shapes, demonstrating a similar trend for allometry between the sexes and tissue types. Only the left zygomatic bone and the right maxillary bone showed a significant interaction between sex and size in the black South African sample (Table 5). In both population groups, size is essential for explaining soft and hard tissue shape variability.
Covariation within soft and hard tissues in each population affinity subsample
Population affinity is paramount to evaluating shape variation in the soft and hard tissues of the nose. Therefore, to assess covariation within soft and hard tissue morphology and its reliance upon population affinity, the data set was divided into subgroups specific to ethnicity (white South African and black South African). In black South Africans, all correlations between soft and hard tissue components were reported to be significant. In comparison, most variables, excluding zygomatic matrices and the right maxillary component, were significantly correlated within white South Africans (Table 2).
Volume 120| Number 5/6 May/June 2024 102 https://doi.org/10.17159/sajs.2024/12972 Research Article Shape analysis of the nasal complex Page 8 of 12
Age Population affinity* Age Sex*Age Population affinity*Sex* Age AgeSex*AgeAgeSex*Age Test4 Test5 Test4 Test5 Test4 Test5 Test4 Test5 Test4 Test5 Test4 Test5 Test4 Test5 Test4 Test5 Mid-facial region 0.054 0.0120.0020.0000.454 0.2880.3170.302 0.0060.0000.001 0.064 0.0010.0150.0200.015
nasal aperture 0.1090.127 0.0170.003 0.7460.8420.6870.691 0.0090.0000.008 0.0570.134 0.038 0.8260.901
nasal aperture
0.112 0.0320.0340.011 0.5980.7960.3480.5330.115 0.057 0.368 0.454 0.2820.2760.9040.934
nasal
0.0240.036 0.1340.1080.4330.6250.0810.052 0.0110.0020.0030.002 0.080 0.030 0.7480.731 Zygoma0.5300.596 0.014 0.1450.8960.7910.7690.700 0.040 0.0920.0700.1510.1020.0790.5210.412
0.3730.450 0.038 0.1650.7370.6740.2100.1930.1210.1130.1530.1550.5740.4080.3040.188 Zygomatic
0.1900.302 0.026 0.0600.5180.4670.1510.098 0.0420.023 0.098 0.030 0.1590.0780.7320.518 Maxilla0.1320.064 0.0150.000 0.2280.3700.1290.1170.149 0.001 0.280 0.028 0.0310.0900.1190.121 Maxillary bone (left) 0.1370.094 0.0790.038 0.3790.2790.5870.528 0.0160.011 0.6790.7200.1850.3930.5660.376 Maxillary
0.0040.001 0.101 0.0190.009 0.0200.005 0.002 0.109 0.0430.0440.0460.039 0.0570.075 0.017 External nose 0.0010.0000.0090.010 0.6740.6650.7230.730 0.0000.0000.002 0.595 0.0070.006 0.7540.876
Anterior
Anterior
(left)
Anterior
aperture (right)
Zygomatic bone (left)
bone (right)
bone (right)
table 5: Soft and hard tissue shape changes associated with size in the complete sample and within population affinity groups
Test4, MANCOVA; Test5, 50-50 MANOVA. Significant p-values (<0.05) are indicated in bold.
Discussion
Variation in the mid-facial skeleton and related soft tissue (the external nose) is influenced by a variety of factors, including population affinity, sex, age and allometry. Nasal shape variation results from the divergent development and growth of the craniofacial skeleton. This biological variation, in both soft and hard tissues, can be attributed to hormonal, genetic and epigenetic factors as well as external stimuli (e.g. biomechanical factors)31-34 and must be considered in the approximation of the nose. The understanding and quantification of human biological phenotypes allow for the development of accurate facial approximation guidelines applicable to forensic anthropology.
During skeletal development, and to preserve function and proportionate growth, the bony elements of the face fluctuate in size and morphology, as well as in location within the craniofacial complex.31-33 During growth, the skull evolves through two concurrent and interassociated processes, namely ‘modelling’ and ‘displacements’ of the skeletal components.31-33 Due to the bone growth biomechanics of craniofacial morphology, such as the resorption of the canine fossae, the nasal area, and the inferior edge of the zygomatic region, the adult face exhibits forward and downward development directions.34 During adulthood, the remodelling of the underlying skeletal structure34 and changes in the facial musculature resulting from gravity and the effects of hyperdynamic facial expressions may influence the soft tissue morphology of the nose with advancing ageing.34 Literature indicates that facial soft tissue ageing varies by a decade of life, gender, and population affinity.34 Consequently, our findings demonstrate that the remodelling of the underlying skeletal structure influences the shape of the nose throughout craniofacial development, highlighting that the
components of the nose cannot be regarded as independent aspects of the craniofacial skeleton and that the effect of variables such as population affinity, sex, and age must be taken into account to interpret the observed variation.
Several bio-anthropological studies have demonstrated the effect of environmental variables on variance in nose morphology across populations.10 Generally, researchers consider that the shape of the external nose and the anterior nasal aperture contribute to climate adaptation by controlling air temperature to protect the pulmonary functions against extreme environments.10 On account of geographical variation, physical anthropologists are able to estimate population affinity by translating biological traits to a culturally elaborated labelling system.35
In addition, Serre and Pääbo36 noted a close relationship between biology and culture and stated that “genetic discontinuities seen between population groups are not racial or continental in nature but depend on historical and cultural factors”. Moreover, Ousley and colleagues6 have demonstrated that biological phenotypic variation within population groups is quantifiable and may be useful in providing a potential classification of an unknown individual. Morphological variation is observed over geographical distances, which is often driven by cultural and social aptitudes.9
Apartheid-era categories are no longer enforced by law in South Africa; yet contemporary South Africans continue to self-identify according to such classifications. People’s cultural position in the nation depends on their ability to socially identify as a member of one of the several South African ethnicities.37 As a result, the majority of South Africans (80.5%) identify as black, followed by coloured (8.8%),
Volume 120| Number 5/6 May/June 2024 103 https://doi.org/10.17159/sajs.2024/12972 Research
Shape analysis of the nasal complex Page 9 of 12
Article
Complete sample Black South AfricansWhite South Africans Size Population affinity*Size Sex*Size Population affinity*Sex*Size SizeSex*SizeSizeSex*Size Test4 Test5 Test4 Test5 Test4 Test5 Test4 Test5 Test4 Test5 Test4 Test5 Test4 Test5 Test4 Test5 Mid-facial region 0.0000.000 0.5270.4780.6360.7280.4670.716 0.0000.000 0.2800.277 0.0000.000 0.1240.098 Nasal bones 0.0000.0000.0000.002 0.6110.4450.3130.238 0.0000.000 0.2290.190 0.0000.000 0.7180.676 Nasal bone (left) 0.0000.0000.000 0.1440.3120.2480.5770.476 0.0000.000 0.1420.142 0.0000.000 0.7800.780 Nasal bone (right) 0.0000.0000.0140.004 0.2870.2080.4660.658 0.0000.000 0.3230.324 0.0000.000 0.6320.632 Anterior nasal aperture 0.0000.000 0.2630.2150.5590.444 0.0230.0130.0000.000 0.4620.406 0.0000.000 0.0900.072 Anterior nasal aperture (left) 0.0000.0000.0000.0210.029 0.1220.3550.092 0.0000.000 0.0420.065 0.0000.000 0.1350.135 Anterior nasal aperture (right) 0.0000.000 0.4600.3290.135 0.099 0.1590.137 0.0000.000 0.6900.629 0.0000.000 0.1060.085 Zygoma 0.0000.000 0.2270.1660.4050.3570.2640.212 0.0000.000 0.1250.187 0.0000.000 0.1220.362 Zygomatic bone (left) 0.0000.0000.0170.010 0.2980.3370.5520.487 0.0000.0000.0440.0290.0000.000 0.2300.375 Zygomatic bone (right) 0.0000.000 0.1490.0780.5610.4820.3800.481 0.0000.000 0.3730.558 0.0000.000 0.8560.984 Maxilla 0.0000.000 0.074 0.044 0.7180.655 0.0050.0120.0000.000 0.1350.303 0.0000.000 0.7800.709 Maxillary bone (left) 0.0000.0000.0240.013 0.9110.8560.1620.127 0.0000.000 0.8290.749 0.0000.000 0.5320.473 Maxillary bone (right) 0.0000.0000.0120.085 0.6100.593 0.0000.0000.0020.0010.0060.0030.0000.000 0.5770.515 External nose 0.0000.000 0.1670.1890.9320.9320.3830.383 0.0000.000 0.1380.1910.809 0.0000.047 0.530
white (8.3%), and Indian/Asian (2.5%).37 The assortative mating within these groups has bolstered the already evident morphological differences within and across groups20, resulting in the continuation of skeletal variation.20 Consequently, the three primary social categories of South Africans are now black, coloured and white.
Several studies have described distinct biological variations in midfacial shape and size among South African groups.11-13,38 Indeed, distinct characteristics from the mid-face, such as inter-orbital breadth, nasal width, alveolar prognathism and nasal bone morphology, are significant population affinity related phenotypic variations.11-13 38 Variation in nasal soft and hard tissue structures between and among worldwide population groups has also been described.4 For instance, Schlager4 observed a significant difference in soft and hard tissue nasal morphologies between Chinese and European groups. While European nasal features are relatively pronounced, Chinese nasal shapes are smoother and more integrated into the craniofacial skeleton.4 In our study, black and white South Africans demonstrated distinct population shape variation in soft and hard tissues. These variations present a challenge for facial reconstruction. Few effective techniques exist that take into account the influences of biological parameters (population affinity, sex, age) on the morphology of the face.4,38 Current facial approximation approaches restrict the objectivity and precision of the reconstruction by ignoring population-specific variables. Recent research among South African groups39 and on other European and Asian populations4 emphasises the significance of taking into account the effect of variables such as population affinity, sex, and age on the approximation of the nose. Disregarding biological parameters when initiating approximations will affect the precision of the final facial reconstruction.
The assessment of sex is dependent on quantifying and interpreting the manifestation of sexual dimorphism in a population.40,41 Based on our results, sexual dimorphism plays a crucial role in the overall variance of the nose’s soft and hard tissues and might help discriminate between the sexes. At birth, babies display a slight sexual dimorphism, with significant divergence occurring during puberty, which is also expressed as variation in nasal dimensions.42 In recent literature, variation in nasal complex shape has been investigated using standard morphometric methods, based on angles and distances43-46 or soft tissue thickness43, that address a link between asymmetry and facial masculinity.
In CFR, the nose is crucial in differentiating female and male facial features, and therefore contributes to the creation of precise facial approximation of an unknown individual.46
Only one approach, developed by Schlager4 using GMM on Chinese and European samples, has been used to address these challenges for reconstructing the nose. Schlager4 observed that population affinity seemed to statistically impact the manifestation of sexual dimorphism in differences in the shape of the nose among Chinese and European populations. Nevertheless, Schlager emphasised that “this impact is negligible from a biological standpoint”. Numerous studies8,11-13 using conventional morphometric techniques have shown considerable variation in facial skeletal morphology (size and form) between the sexes in the South African research environment. In general, it has been established that sexual dimorphism is less pronounced in the black South African population than in other populations (white and coloured).8,11-13
In our study, visualisations of sexual dimorphism suggest that the shape change is consistent between soft and hard tissue configurations, and that the general similarity seems to outweigh the difference. Nonetheless, the sex distribution in each sample (100 black South Africans (33 female, 67 male) and 100 white South Africans (65 female, 35 male)) may affect the findings on sexual dimorphism to some extent.
Ageing is almost as important as sex when considering variation in both soft and hard tissue shapes. Generally, studies focus on standard metric measurements44,45 and/or additional area and volume analyses44
of the external nose. These studies have revealed ageing-related nose lengthening, broadening, and angle changes.44,45
Few studies using GMM describe age-related craniofacial shape variations. Only two recent findings, on a French sample46 and a Chinese and European sample4, found age-related changes in adults’ external nose dimensions.
Our results on age-induced changes in the shape of soft tissues are similar to those of prior research using conventional anthropometric techniques. Indeed, in both population affinity groups, age influenced soft and hard tissue shape. In this research, we observed that agerelated morphological differences across population affinity might be explained by tissue deterioration and the effects of gravity. However, findings on the effect of ageing may, to some extent, be impacted by the sample’s age distribution.
Conclusion
Population affinity, sex, age, and size (allometry) influence the biological variability of the nasal complex, both in soft and hard tissue shapes. Population affinity was found to be an essential factor for shape variation within the sample, highlighting population affinity specific differences. Additionally, within population affinity groups, sexual dimorphism and ageing appeared to influence distinct elements of the shape of the midfacial region. From the findings, the two South African groups varied considerably in terms of soft- and hard-tissue nasal complex shapes and their correlations, emphasising the importance of considering biological parameters and highlighting the need for population-specific, accurate, and reliable 3D statistical prediction methods. The current situation of unidentified persons in South Africa will significantly benefit from research into morphological variation among modern South African populations to generate consistent and precise identification guidelines, such as using South African standard facial reconstruction methods.
Acknowledgements
We thank Dr André Uys from the Oral and Dental Hospital, University of Pretoria, South Africa, and Dr Sarel Botha from the Life Groenkloof Hospital, Pretoria, South Africa, for providing the CBCT data. We acknowledge the AESOP+ consortia coordinated by Prof. José Braga (Université Paul-Sabatier, Toulouse, France/ University of the Witwatersrand, Johannesburg, South Africa), and the Erasmus Mundus programme, Bakeng se Afrika, coordinated by Prof. Ericka L’Abbé (University of Pretoria, Pretoria, South Africa) and Prof. Anna Oettlé (Sefako Makgatho Health Sciences University, Ga-Rankuwa, Pretoria, South Africa).
Competing interests
We have no competing interests to declare.
Authors’ contributions
A.F.R.: Conceptualisation, methodology, data collection, data analysis, validation, data curation; writing – the initial draft, writing – revisions, project leadership, funding acquisition. F.D.: Validation, writing –revisions. E.N.L.: Conceptualisation, validation, writing – revisions, student supervision, project leadership. D.V.: Conceptualisation, methodology, data analysis, validation, writing – revisions, project leadership. A.C.O.: Conceptualisation, writing – revisions, student supervision, project leadership, project management.
references
1. White JD, Ortega-Castrillón A, Matthews H, Zaidi AA, Ekrami O, Snyders J, et al. MeshMonk: Open-source large-scale intensive 3D phenotyping. Sci Rep. 2019;9, Art. #6085. https://doi.org/10.1038/s41598-019-42533-y
2. Baillie LJ, Muirhead JC, Blyth P, Niven BE, Dias GJ. Position effect on facial soft tissue depths: A sonographic investigation. J Forensic Sci. 2016;61:S60–S70. https://doi.org/10.1111/1556-4029.12935
Volume 120| Number 5/6 May/June 2024 104 https://doi.org/10.17159/sajs.2024/12972 Research
Shape analysis of the nasal complex Page 10 of 12
Article
3. Sipahioğlu S, Ulubay H, Diren HB. Midline facial soft tissue thickness database of Turkish population: MRI study. Forensic Sci Int. 2012;219:282. e1–282.e8. https://doi.org/10.1016/j.forsciint.2011.11.017
4. Schlager S. Soft-tissue reconstruction of the human nose: Population differences and sexual dimorphism [dissertation]. Freiburg: Albert Ludwig University of Freiburg; 2013.
5. Ridel A, Demeter F, Galland M, L’abbé E, Vandermeulen D, Oettlé A. Automatic landmarking as a convenient prerequisite for geometric morphometrics. Validation on cone beam computed tomography (CBCT)-based shape analysis of the nasal complex. Forensic Sci Int. 2020;306, Art. #110095. https://doi.org/10.1016/j.forsciint.2019.110095
6. Ousley S, Jantz R, Freid D. Understanding race and human variation: Why forensic anthropologists are good at identifying race. Am J Phys Anthropol. 2009;139:68–76. https://doi.org/10.1002/ajpa.21006
7. Fagertun J, Harder S, Rosengren A, Moeller C, Werge T, Paulsen RR, et al. 3D facial landmarks: Inter-operator variability of manual annotation. BMC Med Imaging. 2014;14:35. https://doi.org/10.1186/1471-2342-14-35
8. Ridel AF, Demeter F, L’abbé EN, Vandermeulen D, Oettlé AC. Nose approximation among South African groups from cone-beam computed tomography (CBCT) using a new computer-assisted method based on automatic landmarking. Forensic Sci Int. 2020;313, Art. #110357. https:// doi.org/10.1016/j.forsciint.2020.110357
9. L’Abbé EN, Kenyhercz M, Stull KE, Ousley SD. Craniometric assessment of modern 20th century black, white and coloured South Africans. In: Proceedings of the 65th Annual Meeting of the American Academy of Forensic Sciences; 2013 February; Washington DC, USA. Colorado Springs, CO: AAFS; 2013. p. 444. Available from: https://www.aafs.org/sites/default/files/ media/documents/2013_Proceedings.pdf
10. Franciscus RG, Long JC. Variation in human nasal height and breadth. Am J Phys Anthropol. 1991;85:419–427. https://doi.org/10.1002/ajpa.133085 0406
11. L’Abbé EN, Van Rooyen C, Nawrocki SP, Becker PJ. An evaluation of nonmetric cranial traits used to estimate ancestry in a South African sample. Forensic Sci Int. 2011;209:195.e1–195.e7. https://doi.org/10.1016/j.forsci int.2011.04.002
12. McDowell JL, L’Abbé EN, Kenyhercz MW. Nasal aperture shape evaluation between black and white South Africans. Forensic Sci Int. 2012;222:397. e1–397.e6. https://doi.org/10.1016/j.forsciint.2012.06.007
13. McDowell JL, Kenyhercz MW, L’Abbé EN. An evaluation of nasal bone and aperture shape among three South African populations. Forensic Sci Int. 2015;252:189.e1–189.e7. https://doi.org/10.1016/j.forsciint.2015.04.016
14. L’Abbé EN, Loots M, Meiring JH. The Pretoria bone collection: A modern South African skeletal sample. HOMO. 2005;56:197–205. https://doi.org/1 0.1016/j.jchb.2004.10.004
15. Tyrrell AJ, Evison MP, Chamberlain AT, Green MA. Forensic three-dimensional facial reconstruction: Historical review and contemporary developments. J Forensic Sci. 1997;42:653–661. https://doi.org/10.1520/JFS14176J
16. Vandermeulen D, Claes P, De Greef S, Willems G, Clement J, Suetens P. Automated facial reconstruction. In: Wilkinson C, Rynn C, editors. Craniofacial identification. Cambridge: Cambridge University Press; 2012. p. 203. https:// doi.org/10.1017/CBO9781139049566.017
17. Claes P, Vandermeulen D, De Greef S, Willems G, Clement JG, Suetens P. Computerized craniofacial reconstruction: Conceptual framework and review. Forensic Sci Int. 2010;201:138–145. https://doi.org/10.1016/j.forsciint.201 0.03.008
18. Krüger GC, Liebenberg L, Myburgh J, Meyer A, Oettlé AC, Botha D, et al. Forensic anthropology and the biological profile in South Africa. In: Latham KE, Bartelink EJ, Finnegan M, editors. New perspectives in forensic human skeletal identification. Cambridge: Academic Press; 2018. p. 313–321. https: //doi.org/10.1016/B978-0-12-805429-1.00027-2
19. Franklin D, Freedman L, Milne N, Oxnard CE. Geometric morphometric study of population variation in indigenous Southern African crania. Am J Hum Biol. 2007;19:20–33. https://doi.org/10.1002/ajhb.20569
20. Sutherland C. Biological distance among modern and parental South African groups using discrete traits of the skull [MSc dissertation]. Pretoria: University of Pretoria; 2016.
21. Caple J, Stephan CN. A standardized nomenclature for craniofacial and facial anthropometry. Int J Legal Med. 2016;130:863–879. https://doi.org/10.100 7/s00414-015-1292-1
22. R. The R Project for statistical computing [cited 2020 May 12]. Indianapolis, IN: The R Foundation; n.d. Available from: https://www.r-project.org/
23. Bookstein FL. Shape and the information in medical images: A decade of the morphometric synthesis. CVIU. 1997;66:97–118. https://doi.org/10.1006/c viu.1997.0607
24. Balakrishnan N, Colton T, Everitt B, Piegorsch W, Ruggeri F, Teugels JL, editors. Wiley StatsRef: Statistics Reference Online. Hoboken, NJ: Wiley; 2014. https://doi.org/10.1002/9781118445112
25. Slice DE. Landmark coordinates aligned by Procrustes analysis do not lie in Kendall’s shape space. Syst Biol. 2001;50:141–149. https://doi.org/10.108 0/10635150119110
26. Adams D, Collyer M, Kaliontzopoulou A, Baken E. Geometric morphometric analyses of 2D/3D landmark data. geomorphR/geomorph. R Foundation; 2024. Available from: https://cran.r-project.org/web/packages/geomorph/in dex.html
27. LangsrudØ.50-50multivariateanalysisofvarianceforcollinearresponses.JR Statist Soc D. 2002;51:305–317. https://doi.org/10.1111/1467-9884.00320
28. Schlager S. zarquon42b/Morpho [software on the Internet]. Available from: https://github.com/zarquon42b/Morpho.
29. Selker R, Love J, Dropmann D, Moreno V. The ‘jamovi’ analyses [software on the Internet]. Available from: https://cran.r-project.org/web/packages/jm v/index.html
30. Rohlf FJ, Corti M. Use of two-block partial least-squares to study covariation in shape. Syst Biol. 2000;49:740–753. https://doi.org/10.1080/106351500 750049806
31. Atchley WR, Hall BK. A model for development and evolution of complex morphological structures. Biol Rev. 1991;66:101–157. https://doi.org/10.11 11/j.1469-185X.1991.tb01138.x
32. Lieberman D. The evolution of the human head. Cambridge, MA: Belknap Press of Harvard University Press; 2011.
33. Bastir M. A systems-model for the morphological analysis of integration and modularity in human craniofacial evolution. J Anthropol Sci. 2008;86:37–58.
34. Albert AM, Ricanek K, Patterson E. A review of the literature on the aging adult skull and face: Implications for forensic science research and applications. Forensic Sci Int. 2007;172:1–9. https://doi.org/10.1016/j.forsciint.2007.03 .015
35. Sauer NJ. Forensic anthropology and the concept of race: If races don’t exist, why are forensic anthropologists so good at identifying them? Soc Sci Med. 1992;34:107–111. https://doi.org/10.1016/0277-9536(92)90086-6
36. Serre D, Pääbo S. Evidence for gradients of human genetic diversity within and among continents. Genome Res. 2004;14:1679–1685. https://doi.org/1 0.1101/gr.2529604
37. Statistics South Africa (Stats SA). Mid-year population estimates (census no. P0302). Pretoria: Stats SA; 2015.
38. Oettlé AC, Demeter FP, L’abbé EN. Ancestral variations in the shape and size of the zygoma: Ancestral variations of the zygoma. Anat Rec. 2017;300:196–208. https://doi.org/10.1002/ar.23469
39. Ridel AF, Demeter F, Liebenberg J, L’Abbé EN, Vandermeulen D, Oettlé AC. Skeletal dimensions as predictors for the shape of the nose in a South African sample: A cone-beam computed tomography (CBCT) study. Forensic Sci Int. 2018;289:18–26. https://doi.org/10.1016/j.forsciint.2018.05.011
40. Gapert R, Black S, Last J. Sex determination from the occipital condyle: Discriminant function analysis in an eighteenth and nineteenth century British sample. Am J Phys Anthropol. 2009;138:384–394. https://doi.org/10.1002 /ajpa.20946
41. Chronicle EP, Chan M-Y, Hawkings C, Mason K, Smethurst K, Stallybrass K, et al. You can tell by the nose—judging sex from an isolated facial feature. Perception. 1995;24:969–973. https://doi.org/10.1068/p240969
Volume 120| Number 5/6 May/June 2024 105 https://doi.org/10.17159/sajs.2024/12972 Research
Shape analysis of the nasal complex Page 11 of 12
Article
42. Troncoso Pazos JA, Suazo Galdames IC, Cantín López M, Zavando Matamata DA.SexualdimorphisminthenosemorphotypeinadultChilean.IntJMorphol. 2008;26:537–542. https://doi.org/10.4067/S0717-95022008000300005
43. Rynn C, Wilkinson CM, Peters HL. Prediction of nasal morphology from the skull. Forensic Sci Med Pathol. 2010;6:20–34. https://doi.org/10.1007/s12 024-009-9124-6
44. Sforza C, Grandi G, De Menezes M, Tartaglia GM, Ferrario VF. Age- and sex-related changes in the normal human external nose. Forensic Sci Int. 2011;204:205.e1–205.e9. https://doi.org/10.1016/j.forsciint.2010.07.027
45. Chen F, Chen Y, Yu Y, Qiang Y, Liu M, Fulton D, et al. Age and sex related measurement of craniofacial hard thickness and nasal profile in the Chinese population. Forensic Sci Int. 2011;212:272.e1–272.e6. https://doi.org/10.10 16/j.forsciint.2011.05.027
46. Schlager S, Rüdell A. Analysis of the human osseous nasal shape-population differences and sexual dimorphism: Human osseous nasal shape. Am J Phys Anthropol. 2015;157:571–581. https://doi.org/10.1002/ajpa.22749
Volume 120| Number 5/6 May/June 2024 106 https://doi.org/10.17159/sajs.2024/12972 Research
Article
Shape analysis of the nasal complex Page 12 of 12
