An updated chronology for Umbeli Belli and its implications for the Middle and Later Stone Ages
102
Chantal Tribolo, Nicholas J. Conard, Matthias Blessing, Gregor D. Bader .................................. 111
Challenges with measures used for assessing research impact in higher education institutions
Andiswa Mfengu, Jaya Raju 120
Research Letter
Catalysing gender transformation in research through engaging African science granting councils
Ingrid Lynch, Lyn E. Middleton, Lorenza Fluks, Nazeema Isaacs, Roshin Essop, Heidi van Rooyen 126
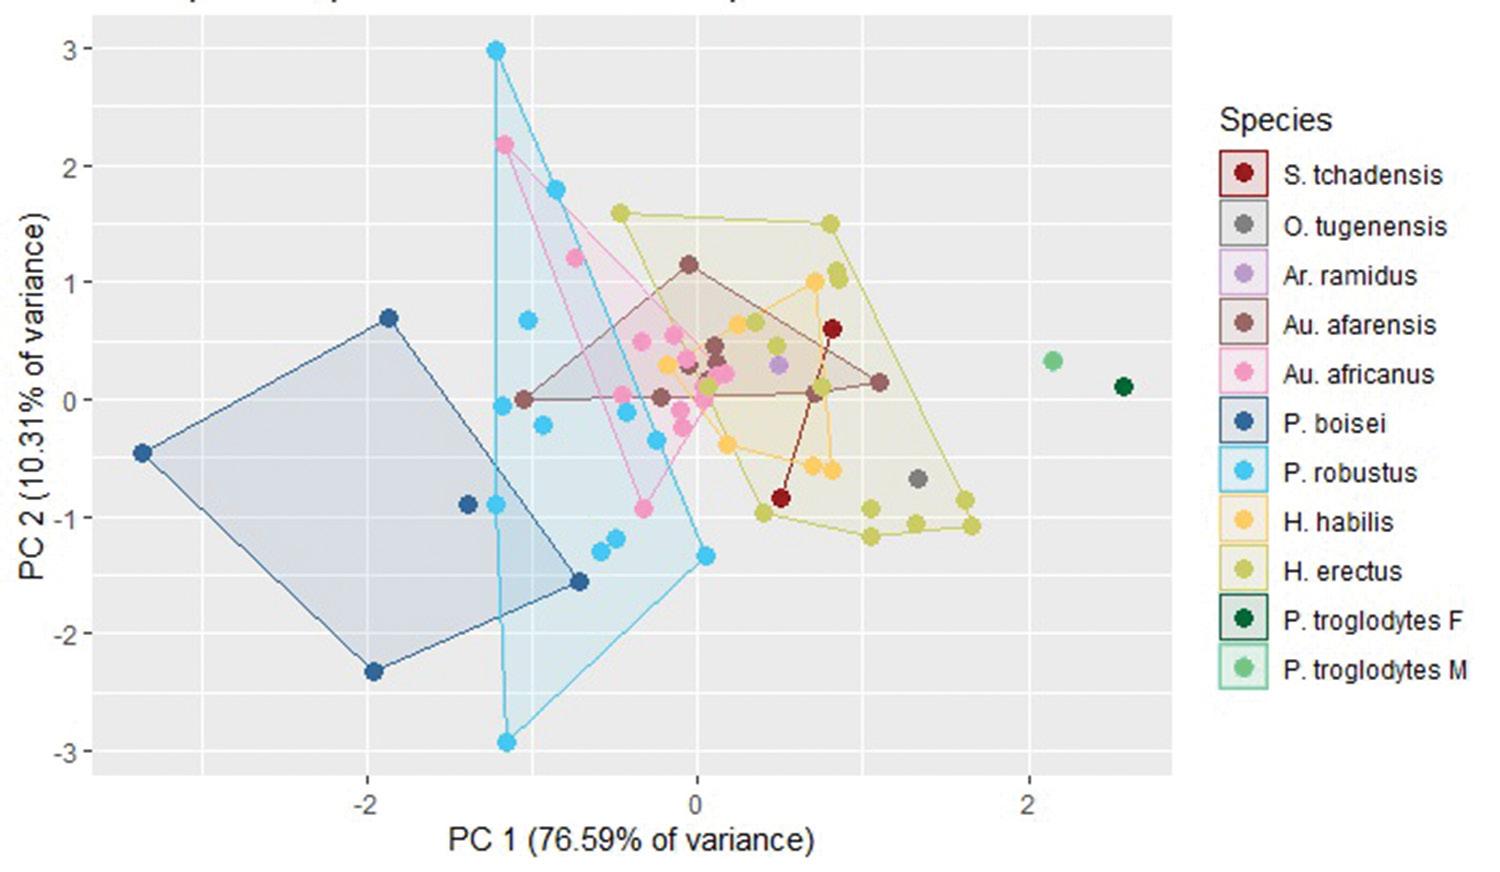
Dental metrics of Sahelanthropus tchadensis: A comparative analysis with apes and Plio-Pleistocene hominins
Walter Neves, Leticia Valota, Clovis Monteiro 129
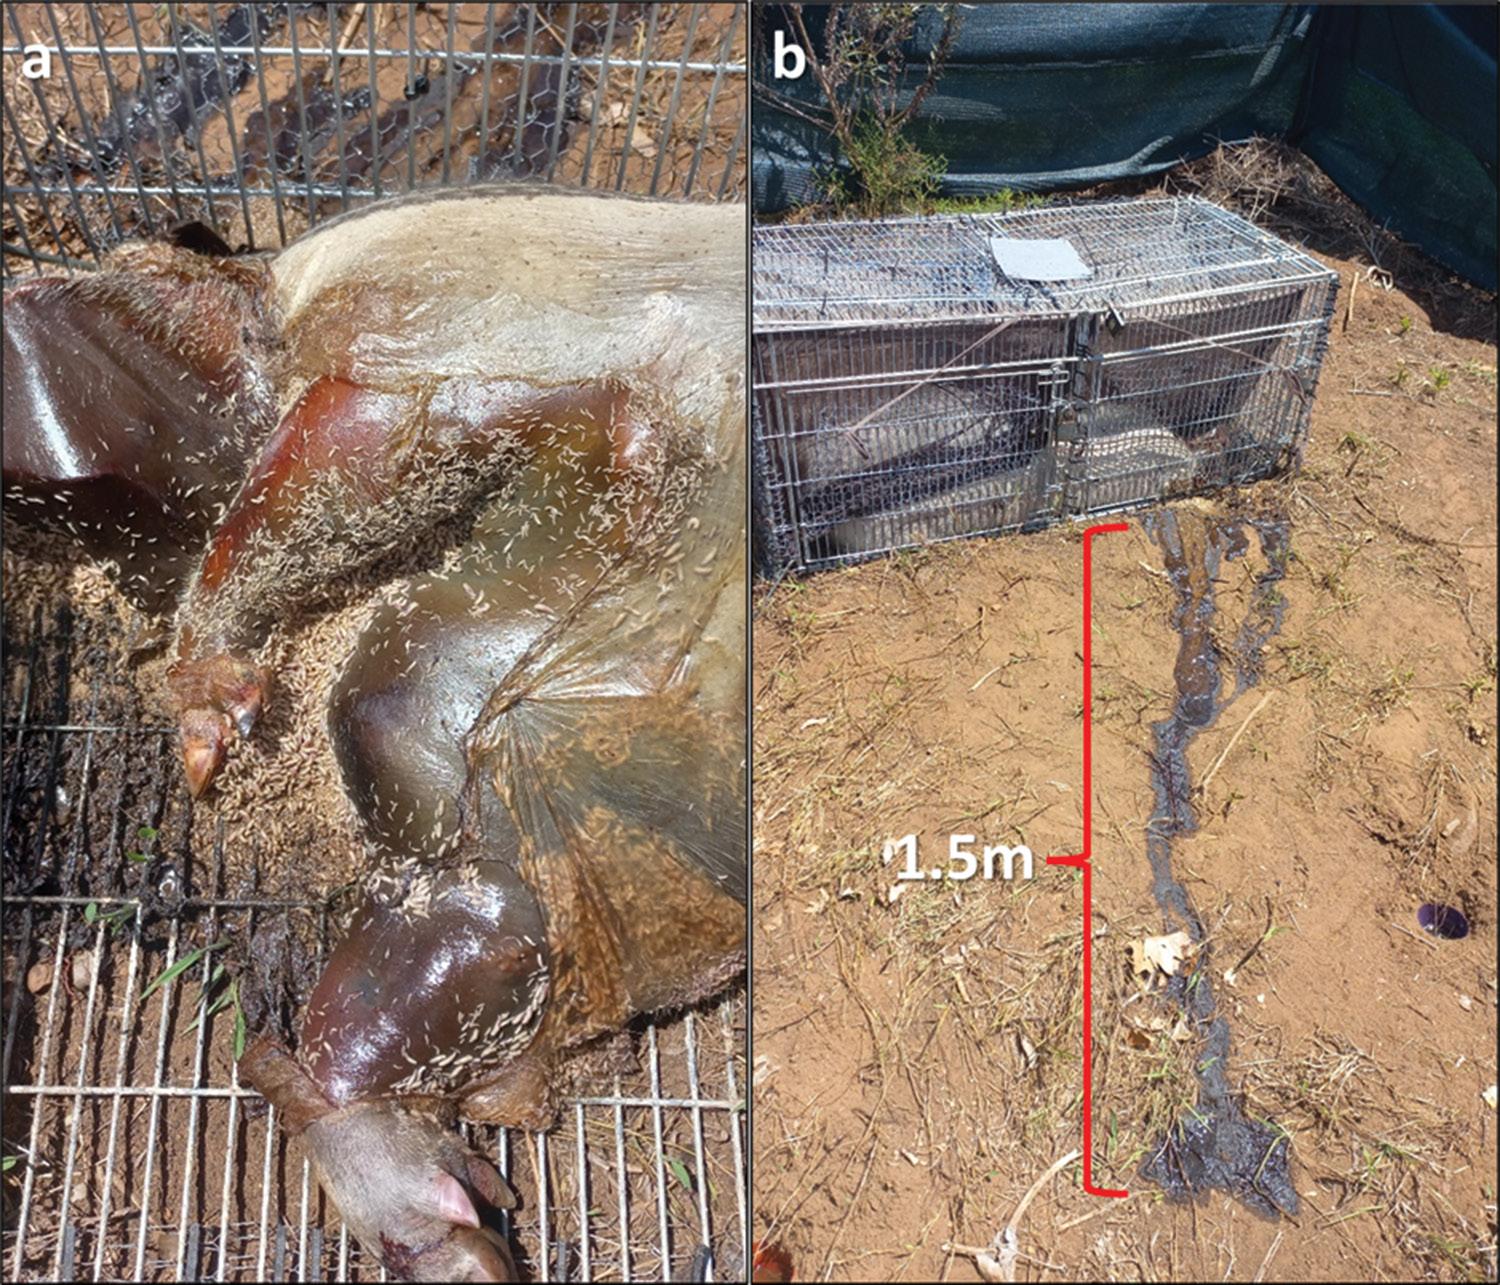
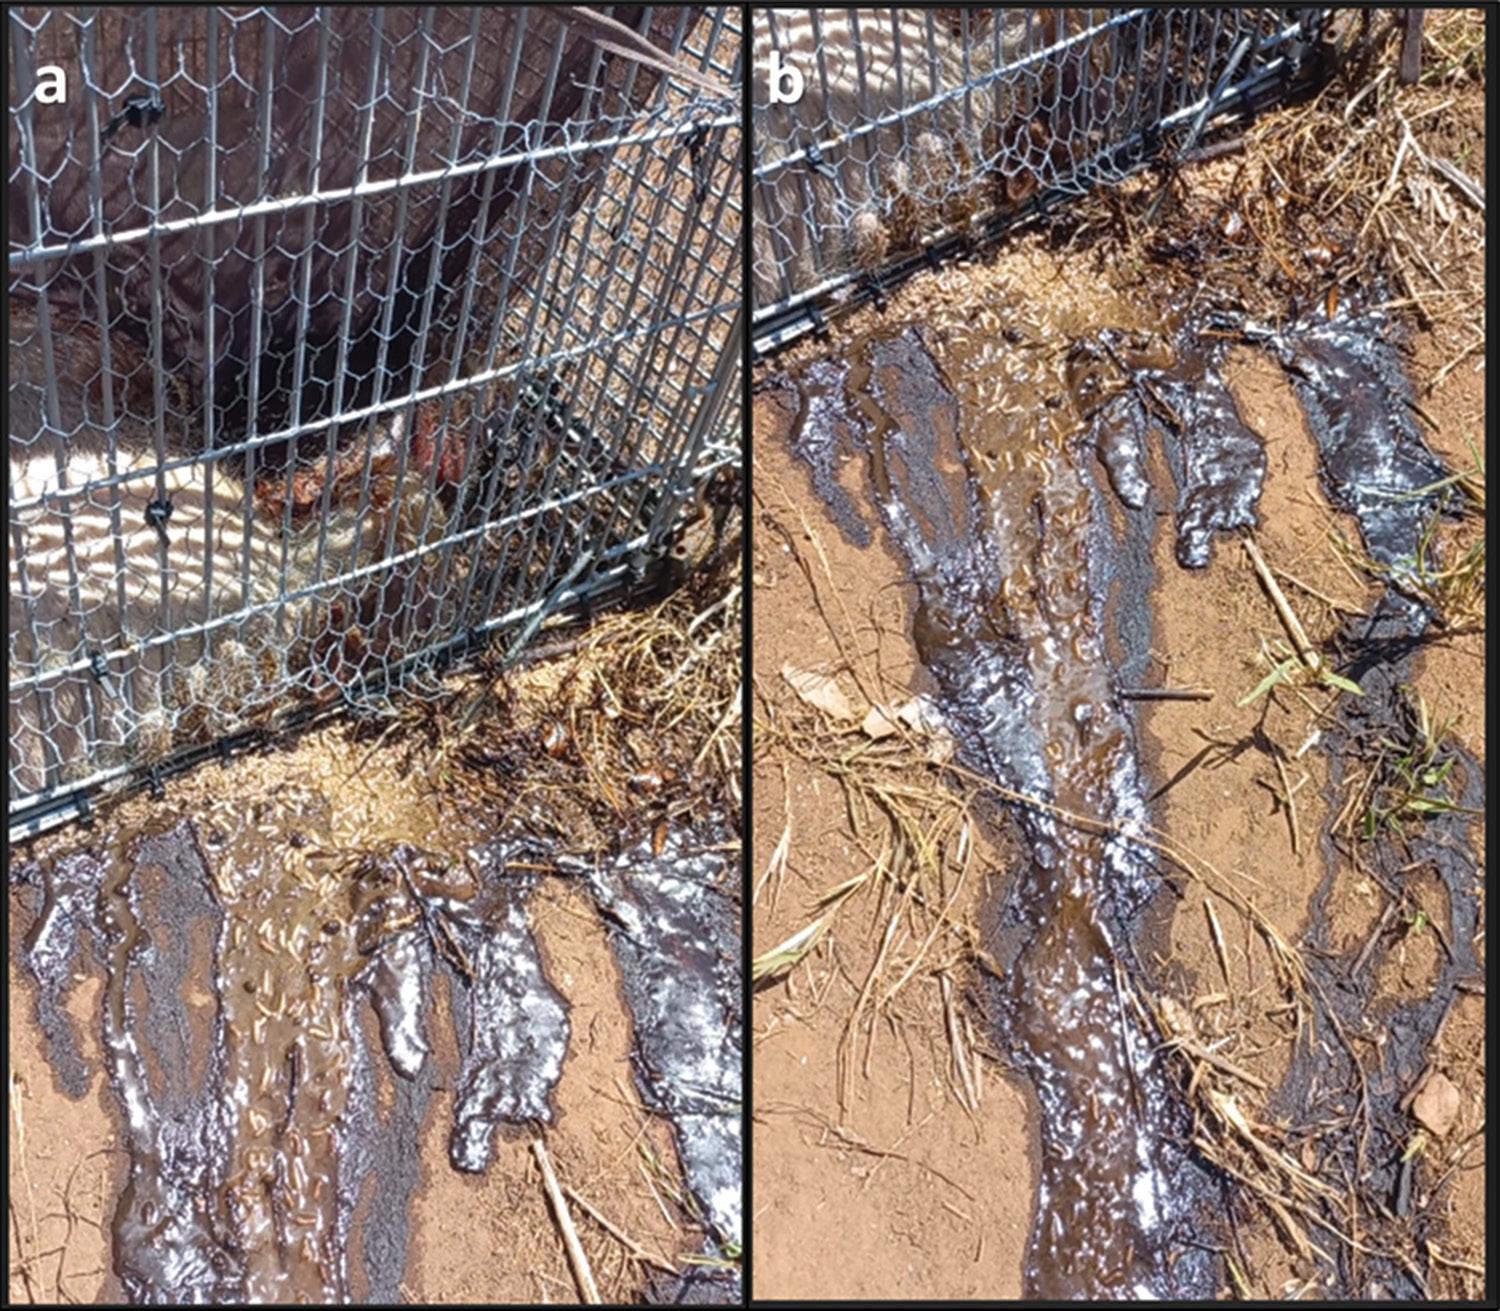
Unidirectional dispersal of blow fly larvae following decomposition fluids from a pig carcass
Adeyemi D. Adetimehin, Calvin G. Mole, Devin A. Finaughty, Marise Heyns
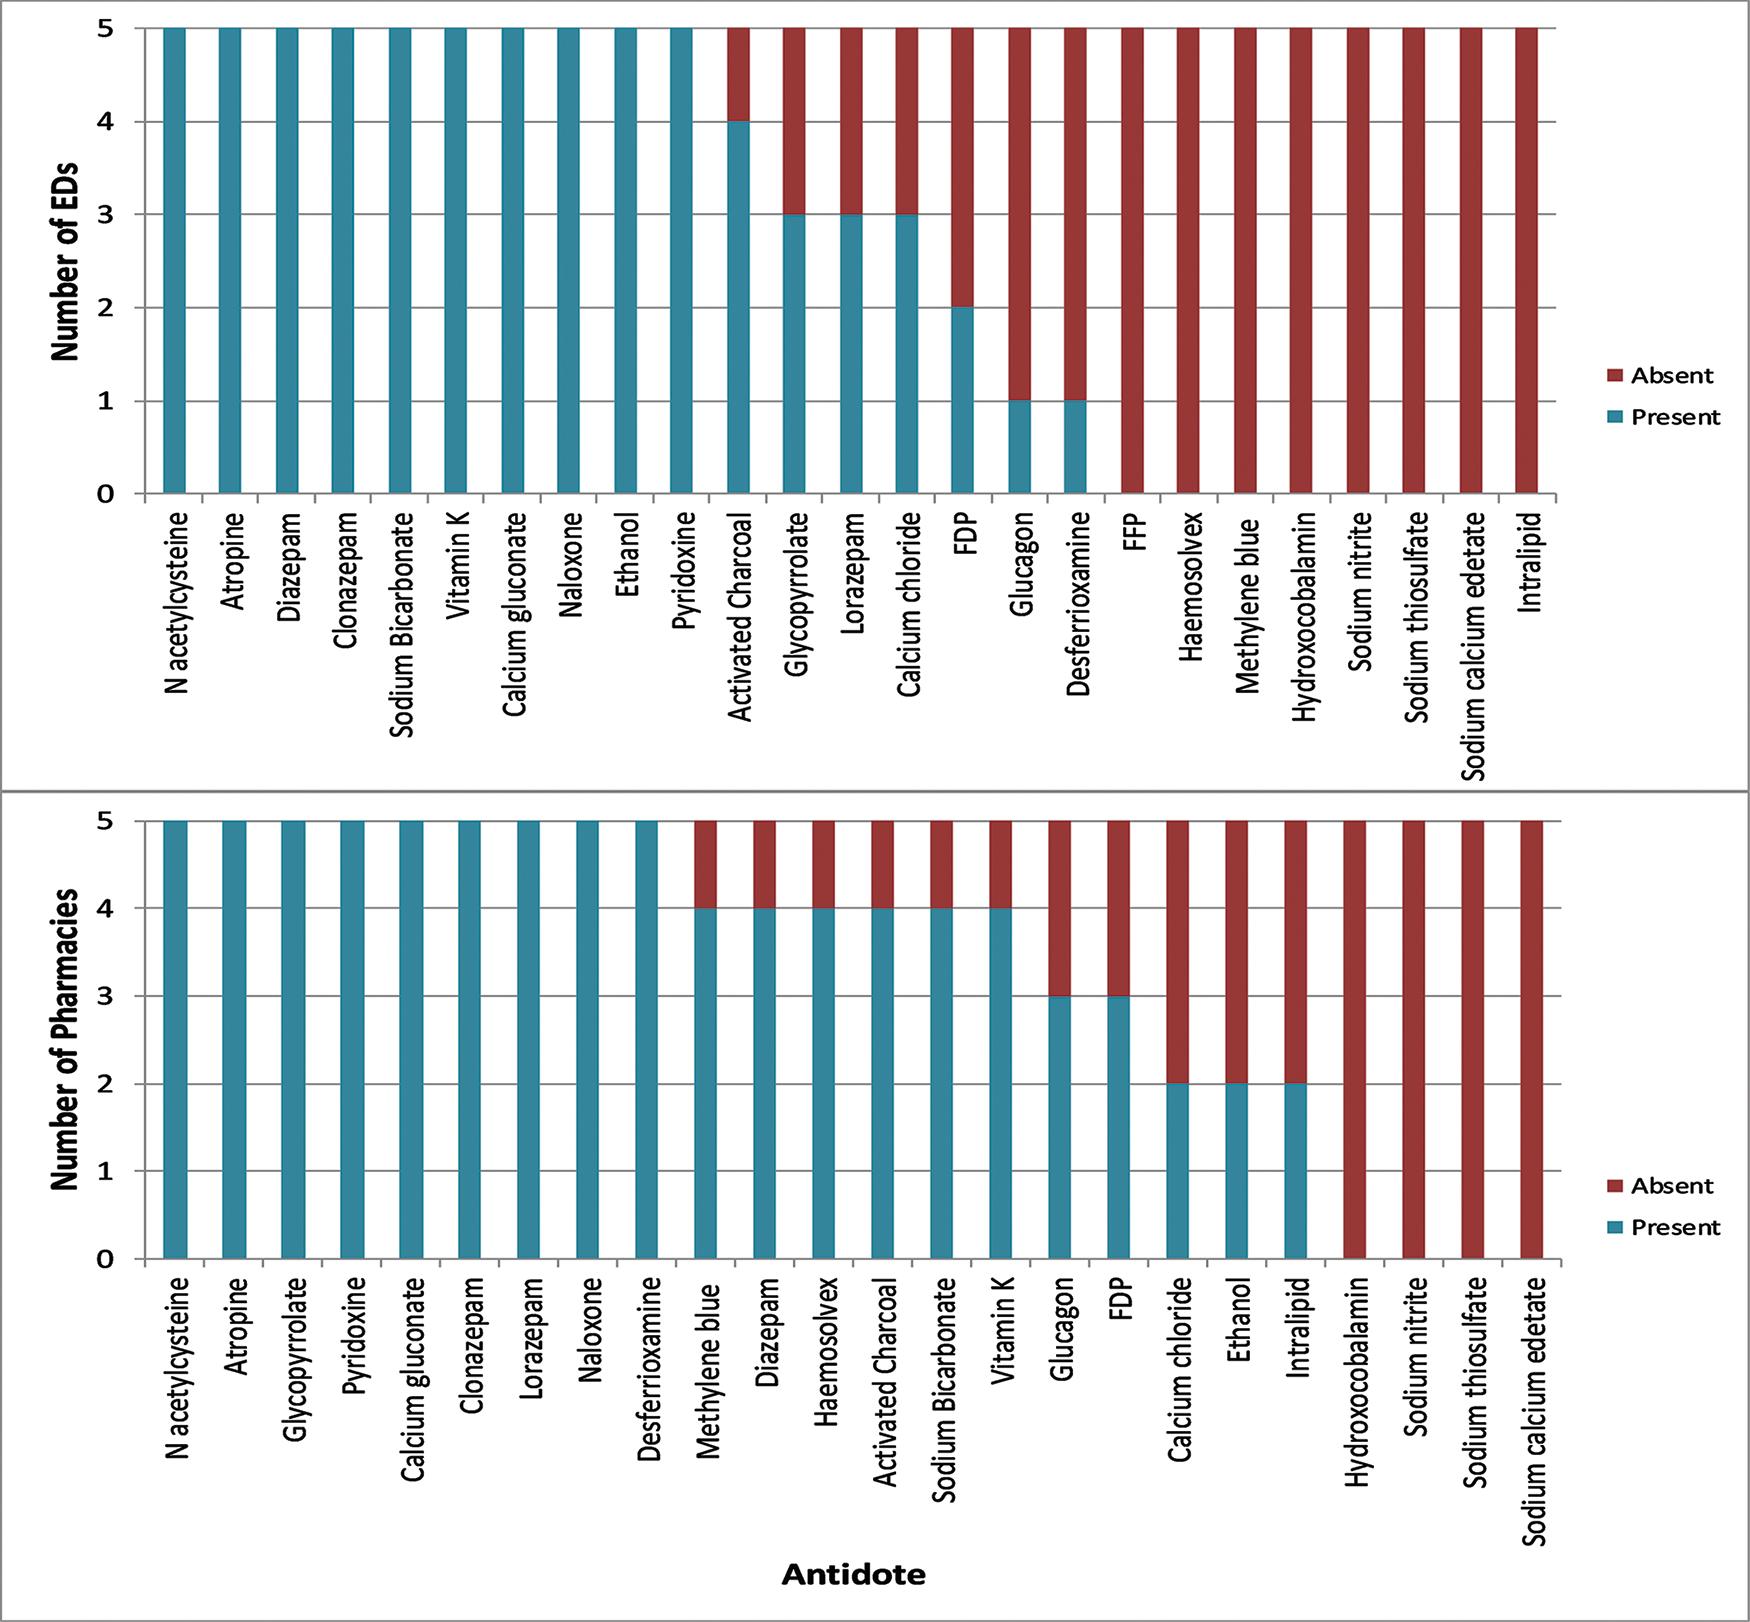
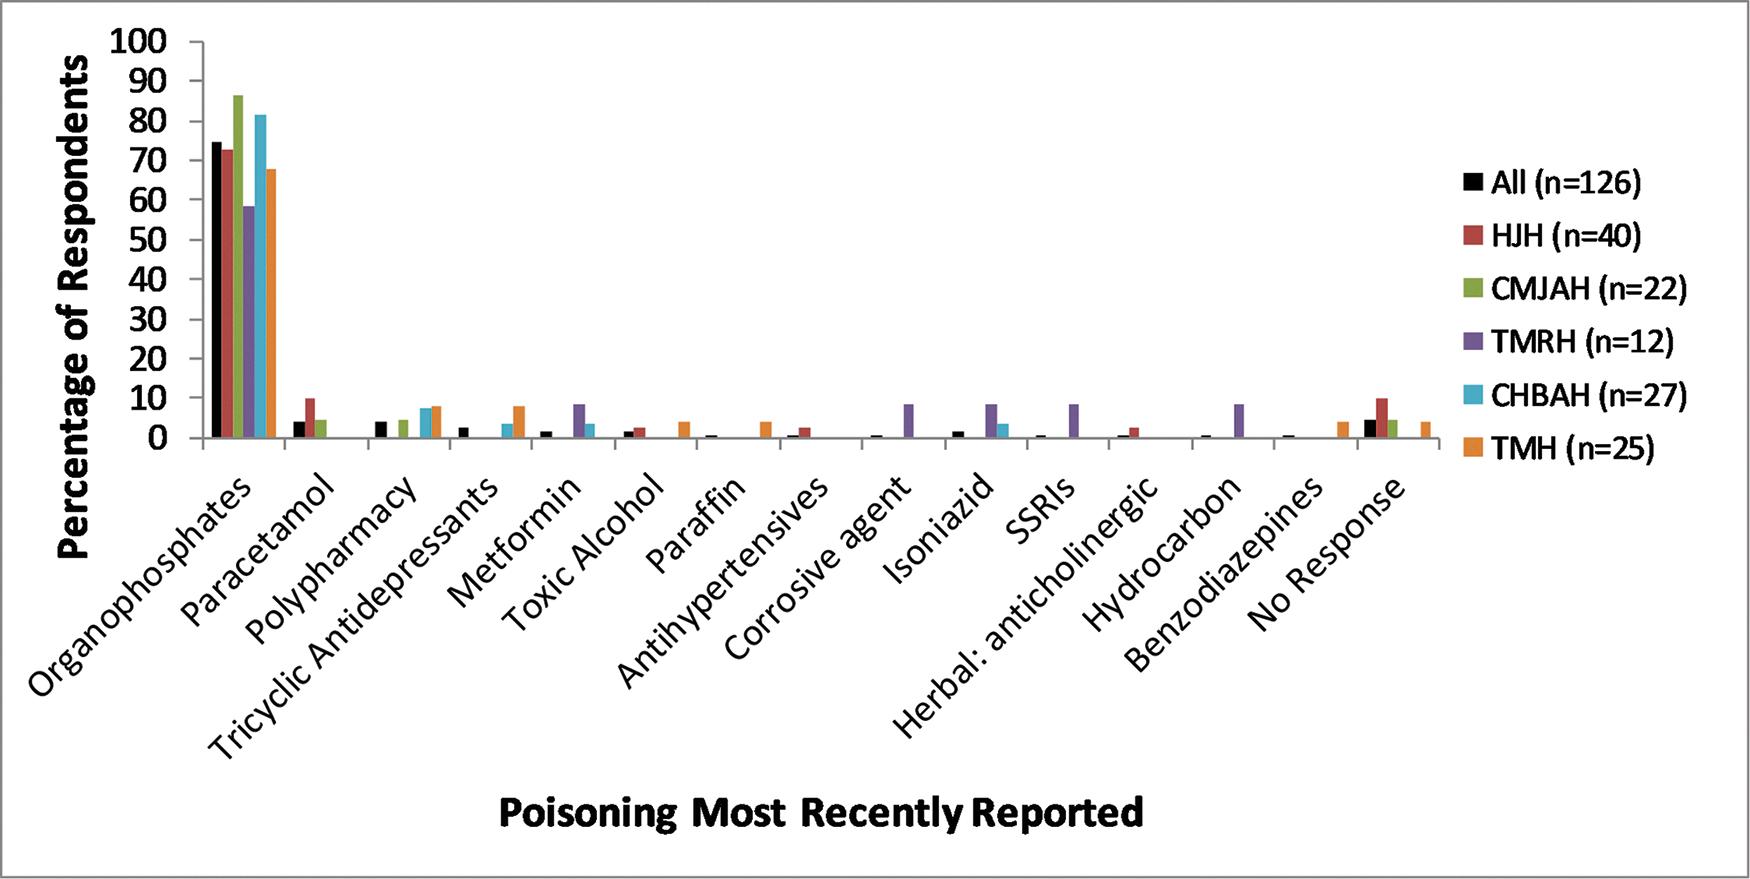
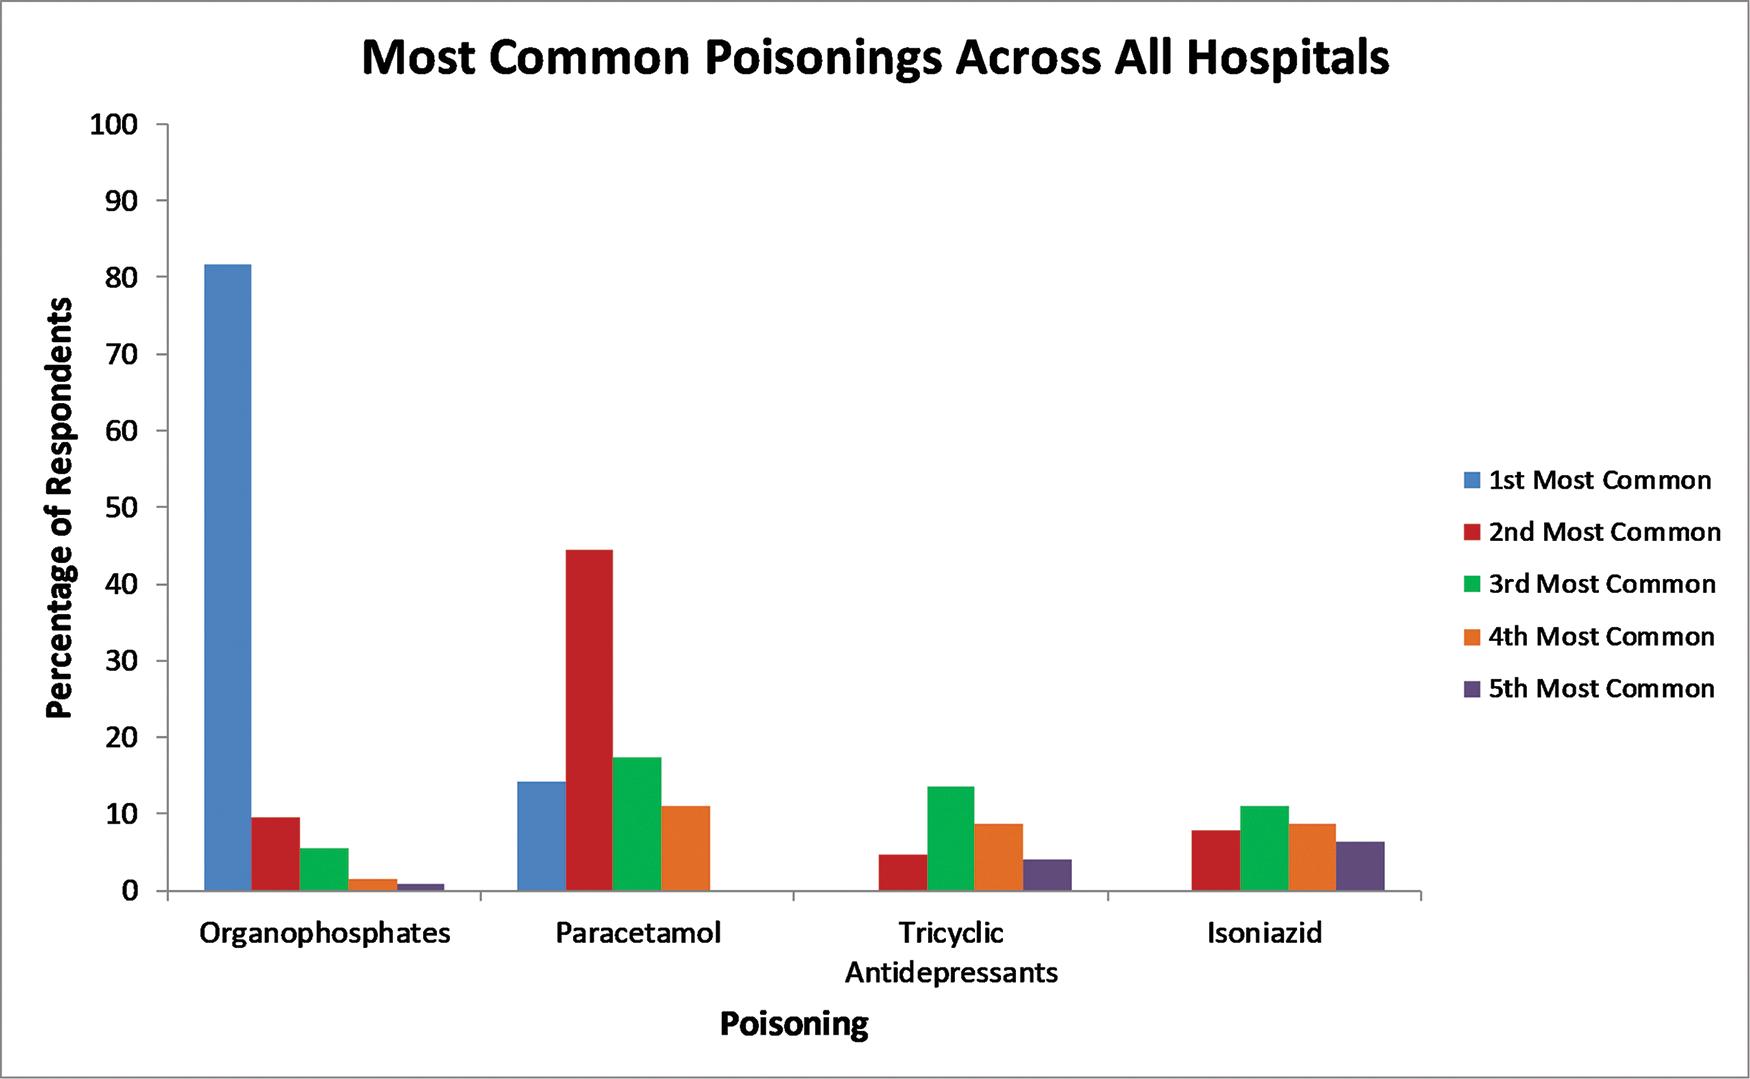
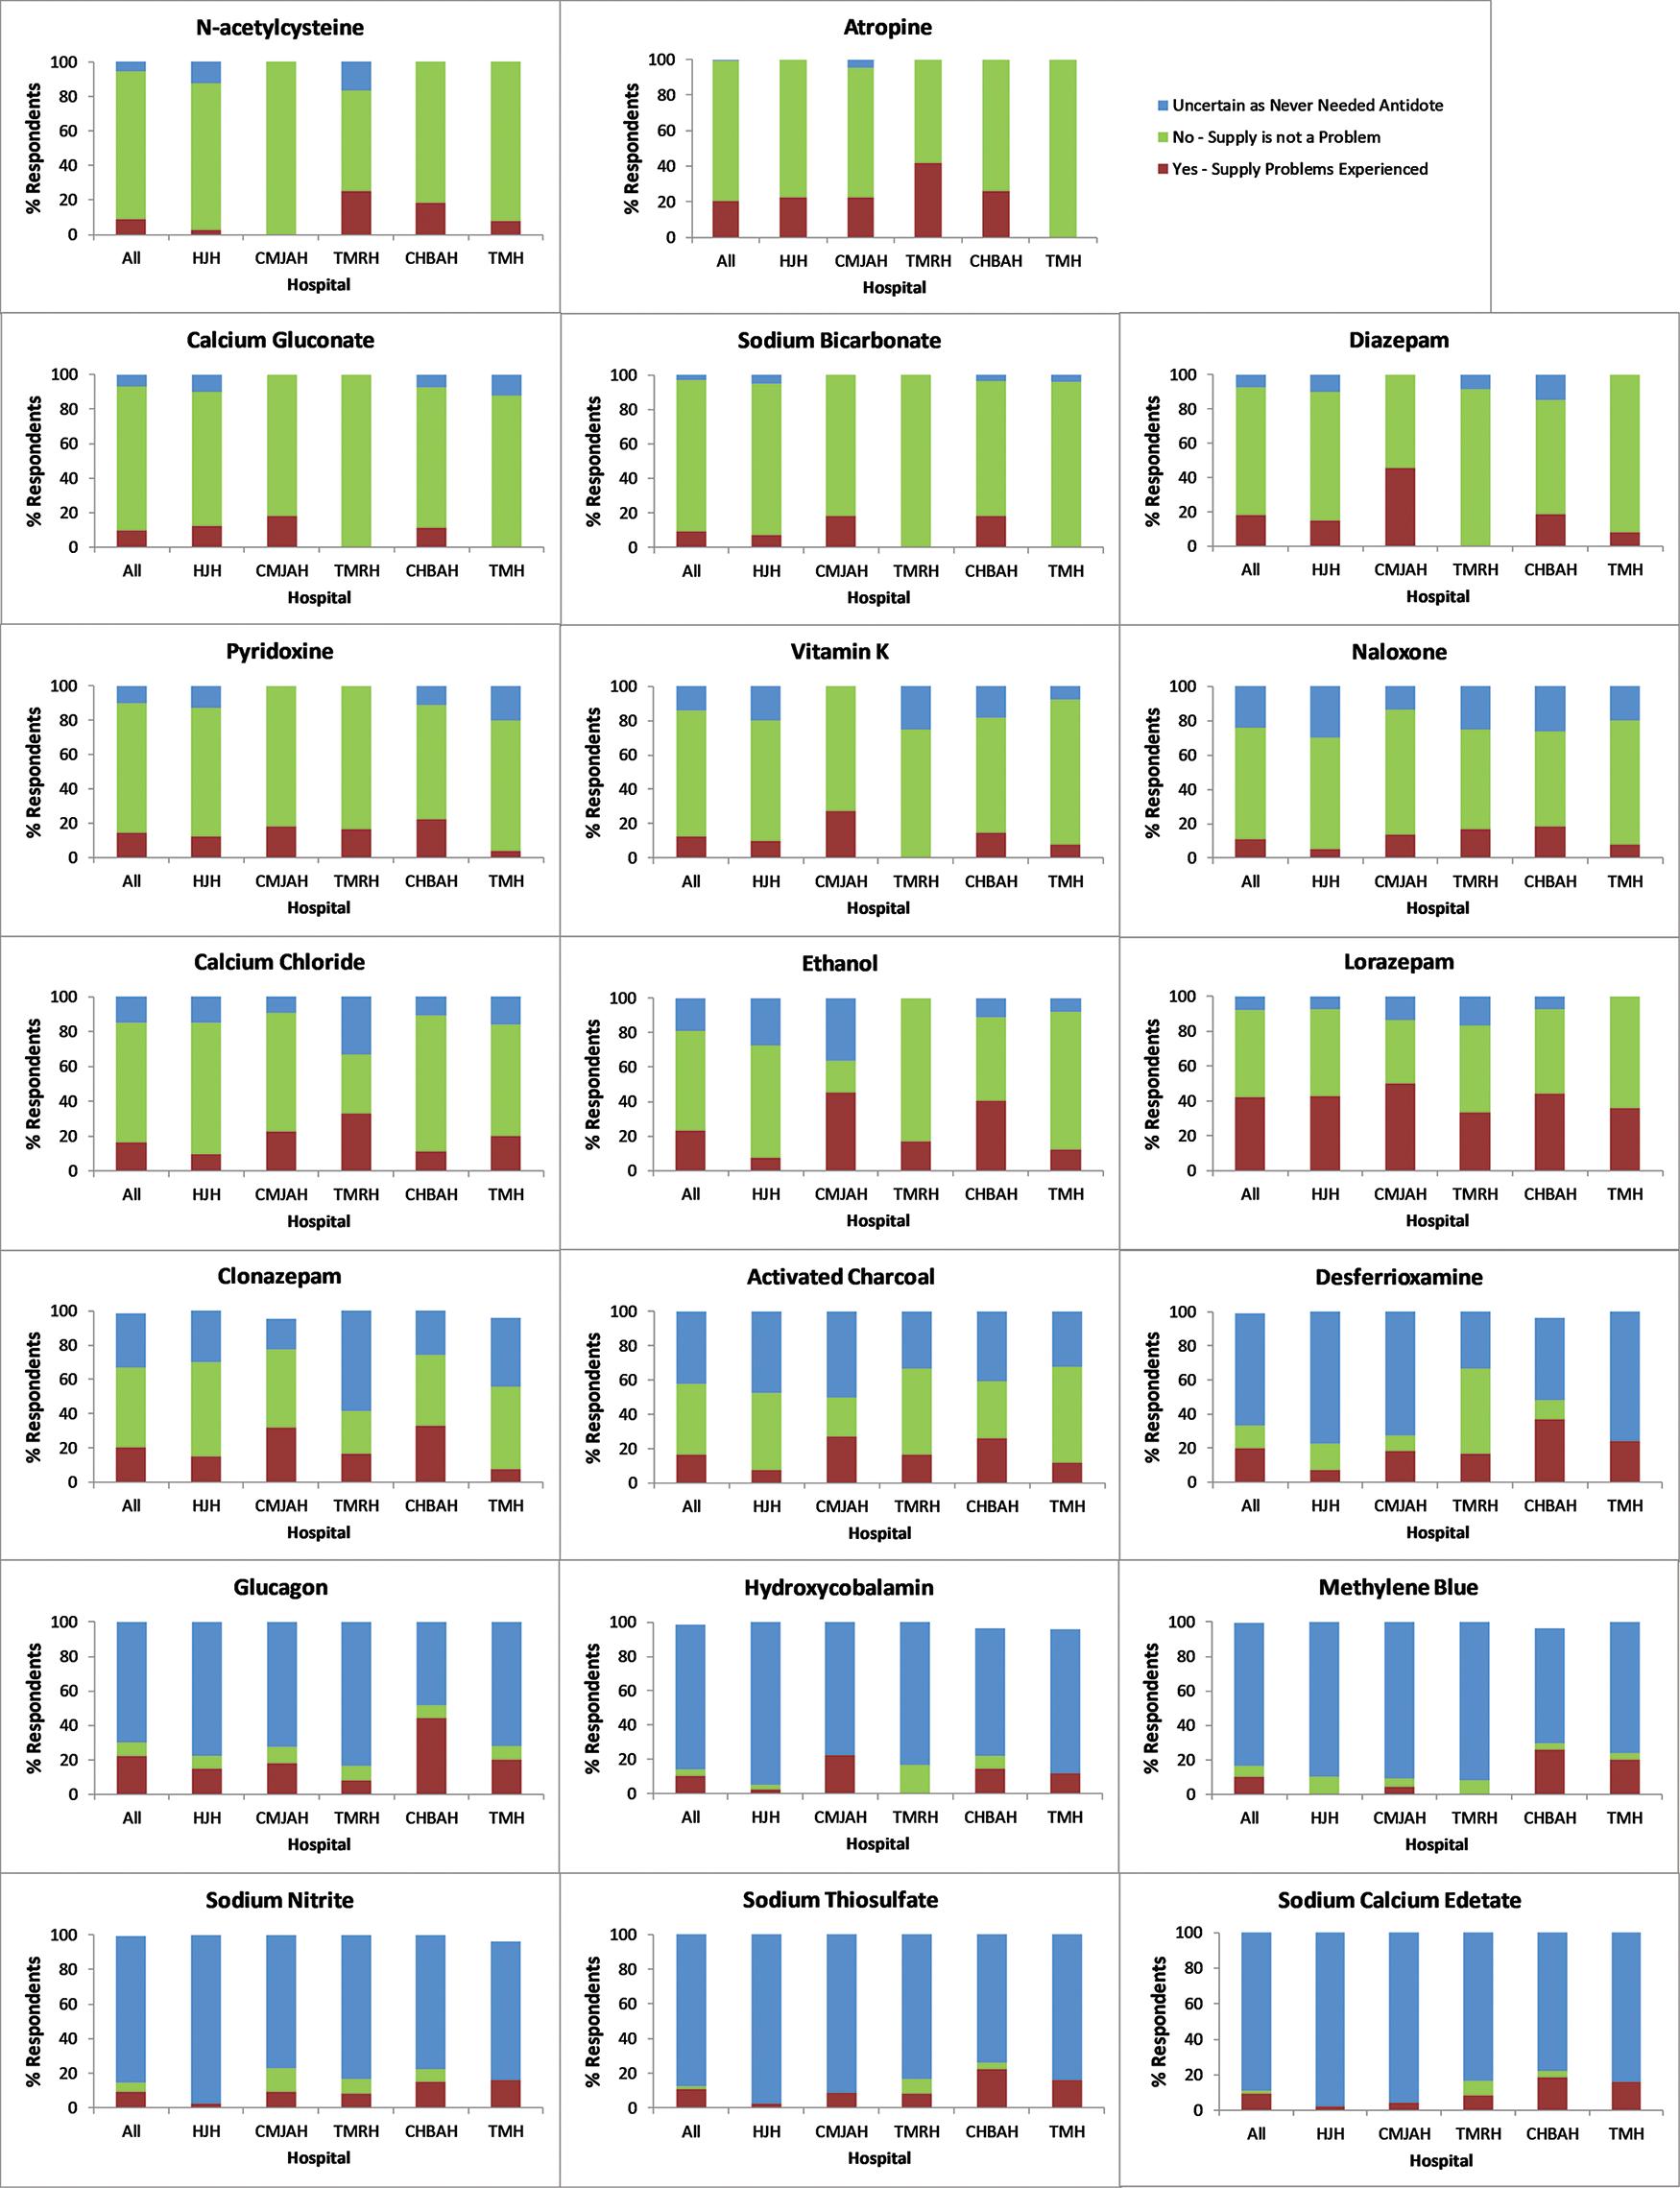
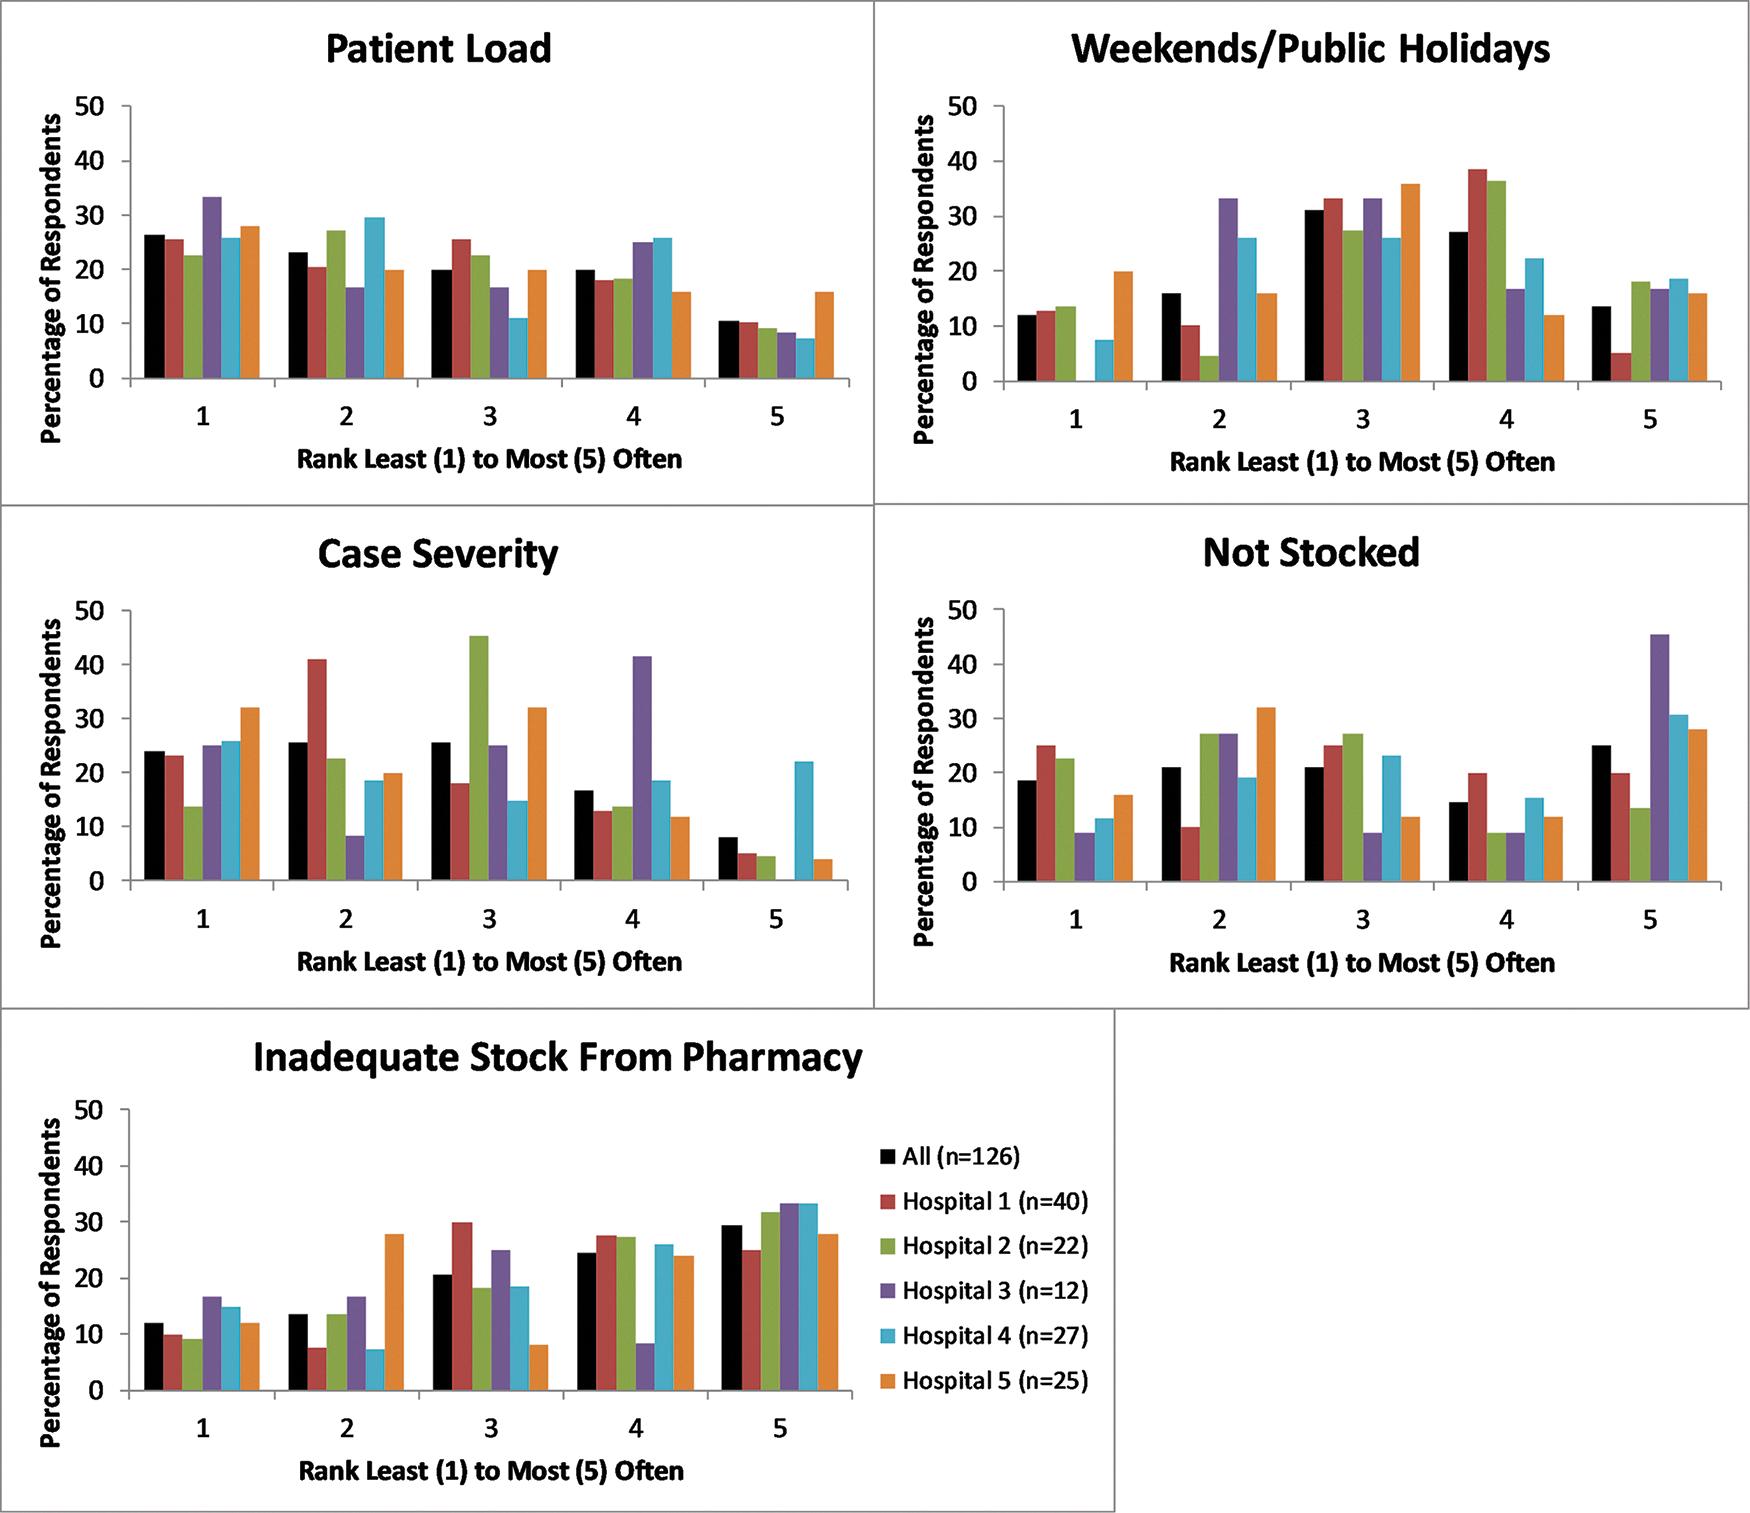
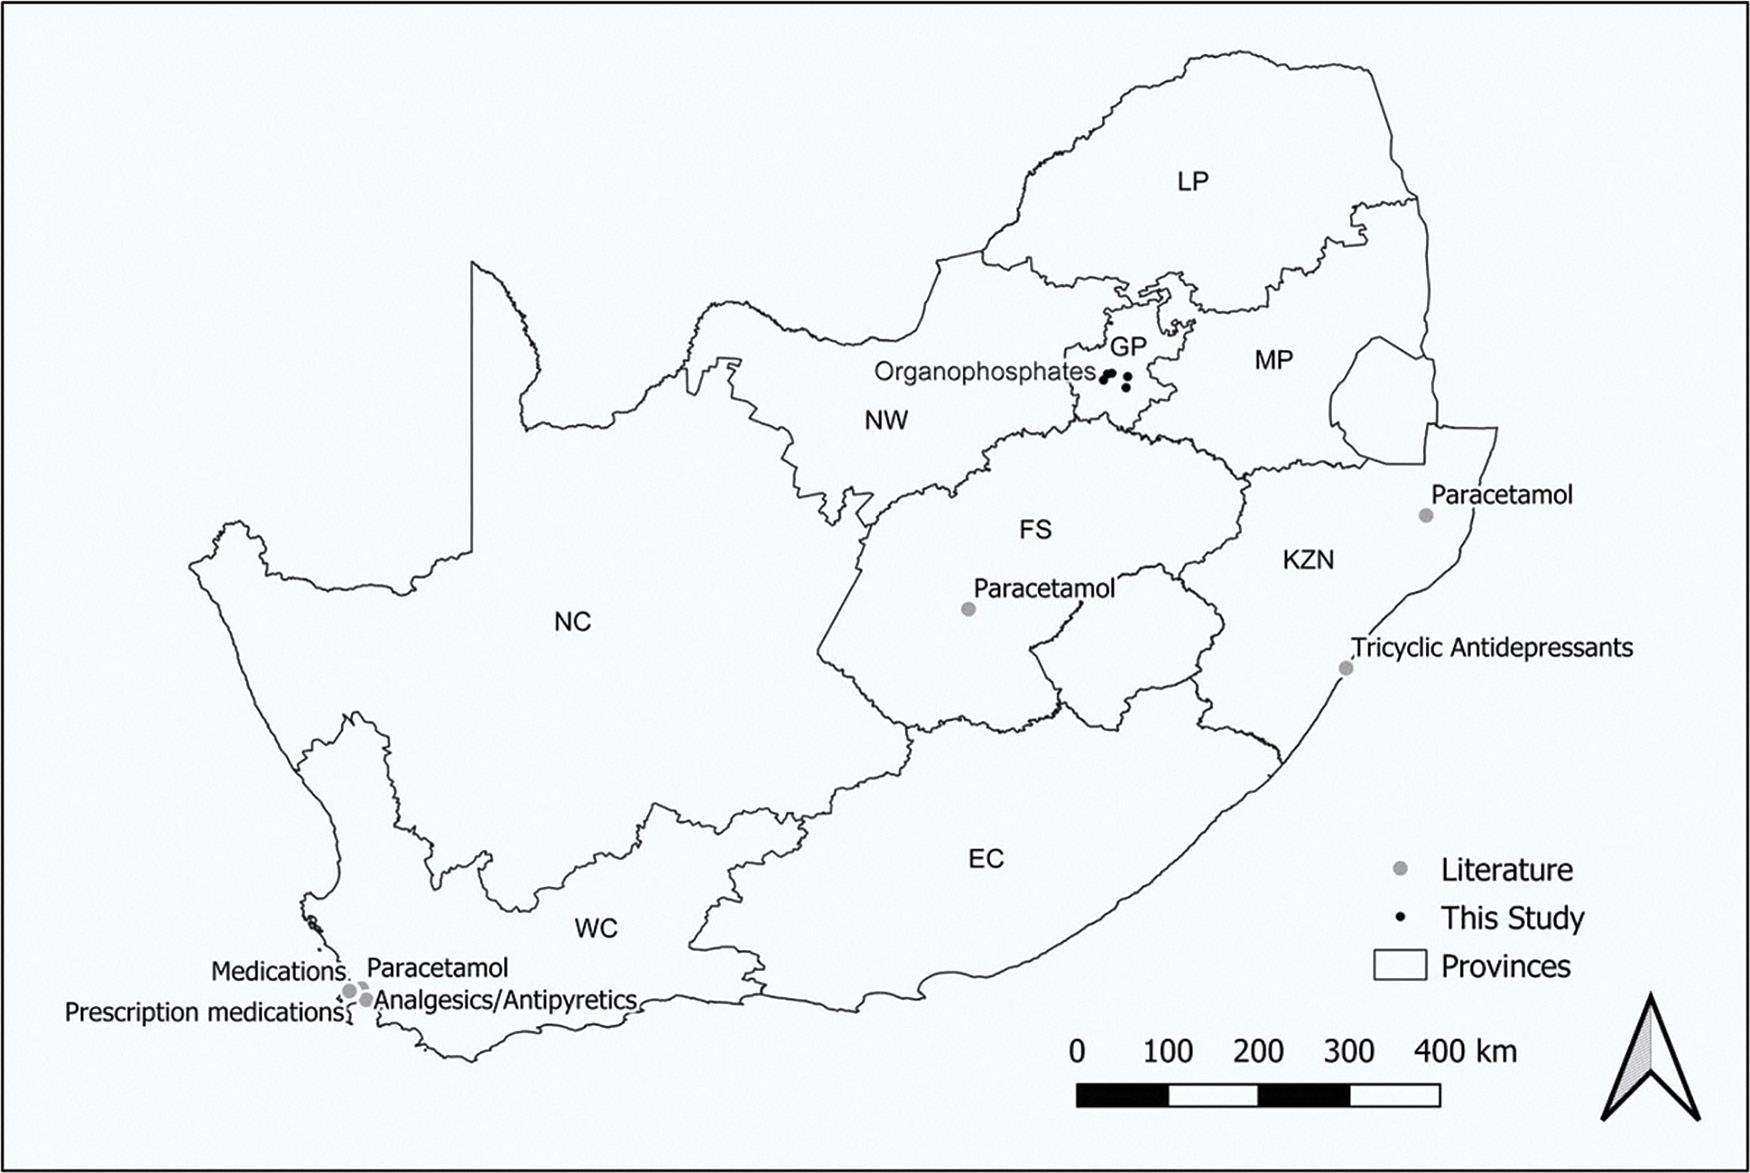
Emergency care providers arriving at a hospital emergency department. In this issue, Govender and colleagues review the state of emergency medical services in South Africa, and Fitchett, Saffy and Lewis investigate the availability of antidotes for drug poisonings in emergency departments in a South African province.
Authorship and inclusion – we need more debate and discussion
We all know the stories. The one about the departmental chair who insists on having their name on every paper published from their department. The one about the supervisor who gave no feedback on the dissertation but insists on being senior co-author on all papers from the dissertation. The one about the even worse supervisor who publishes from a student’s work without informing the student, without citing the student as co-author, without even mentioning the dissertation from which the supervisor is, to all intents and purposes, plagiarising. The one about the researcher at another university who has the password to a data set they did not create but who will not give researchers access to the data set unless they are listed as a co-author on a study in which they have played no role whatsoever. The one about the authorship cartel in which a group of authors agree to list one another on every article they publish, thereby upping substantially the number of publications each author can claim to have written. And so on and so on... Fill in the blank here with your example of an even more egregious unethical authorship practice.
All these examples share two key features. First, they are products, in part, of the global phenomenon of audit culture, and the particular South African version of this (for a trenchant satire on this, please see the poem by Sioux McKenna we published recently). Second, they involve, in various ways, the unfair exercise of power and access. Although journals are not uncommonly party to authorship disputes, journal editors cannot know who has actually contributed to an article and in what ways, and in general cannot be the adjudicators of authorship on any particular article –this is the work of the authorship team. Journals may, of course, enquire about authorship (our own journal has an Author Declaration form which must be completed by all (co)authors) and ask questions, but we usually cannot police whether authors are being honest with their declarations.
Although much of the focus on websites, blogs and, in our experience, in everyday corridor talk about academia, is on powerful people claiming and abusing authorship rights, there is another side to the authorship question which is emerging and also needs our attention. Our journal, like many others globally and locally, is concerned about questions of exclusion from scholarship and knowledge on the basis of a number of factors including race, gender, disability, and country of origin and residence. There is no question that epistemic exclusion and injustice is a reality – one has simply to examine rates of numeracy and literacy for different groups. At the same time, we are concerned (and have a number of special issues in the works looking at this issue from different perspectives) about how knowledge may be skewed by the foregrounding of professional knowledges to the exclusion of what we can learn from people who have lived experience of social, environmental, and health conditions, to name just three ‘expert by experience’ groups. The British Medical Journal (BMJ), for example, has an explicit Patient and Public Partnership strategy and requires authors of all submissions to report on if and how they have relied on the expertise of patients in conducting their work. The BMJ group notes the value that patient input can play in health research, and explicitly requests authors to co-produce research outputs together with patients for the Education section of articles in the BMJ, and provides guidelines1 for this. One way of co-producing with patients is to include patients as authors on scientific articles. The BMJ guideline on p. 3 of the document is as follows1:
In the article which BMJ suggests as an example, the patient co-author is identified in the author materials as ‘Alex Bakker transgender man with 20 years of experience taking hormonal treatment’ with no academic affiliation. In a recent example from our own journal, non-academic authors of a Research Article entitled ‘The end of the beginning: Establishing isiZulu names for all bird species recorded in South Africa’ included those from conservation organisations as well as selfemployed bird guides.
The ICMJE (International Committee of Medical Journal Editors) criteria for authorship are very stringent, and it is noteworthy that the BMJ explicitly says, as quoted above, that ‘patient co-authors should not be tokenistic’. There are a range of conventions and criteria for authorship of journal articles; in their discussion on authorship criteria, the Committee on Publication Ethics (COPE) note that: “Two minimum requirements define authorship across all definitions – making a substantial contribution to the work and being accountable for the work and its published form.”
There have been a number of debates about the inclusion or exclusion of technical contributors, such as statisticians or highly skilled laboratory technicians on academic papers.2 More complex, perhaps, are the discussions around authorship ethics when there are research partnerships between authors based in high-income countries and those in low- and middle-income countries.3 This issue has of course been addressed in the Cape Town Statement on Fostering Research Integrity through Fairness and Equity, which we have discussed previously in our journal. A number of disciplines have suggested guidelines for fair authorship.4
One thing which has been less considered in these debates, as far as we are aware, is the question of authorship, and as COPE suggests above, “being accountable for the work and its published form”. What does “being accountable” mean in the context, for example, of an author who may not be fluent in the language in which the article is written (and the problem of the global dominance of English is obvious here)? What if an author who made a substantial contribution is not functionally literate, for reasons of exclusion from education, neurological reasons, or any other? How much room is there, given the basic COPE requirements, to acknowledge the authorship role of people excluded, for a range of reasons, from fluent use of the written word? At what point, by contrast, does a wish to honour all knowledge contributions ethically and inclusively, devolve into the ‘tokenism’ against which the BMJ warns? How do we factor in the affordances and potential pitfalls of the use of artificial intelligence and large language models into our probably now outdated ideas about ‘independence’ in scientific writing and thinking?
As we think collectively about opening science and striving for greater and fairer recognition of forms of expertise which have previously been ignored or devalued, we are forced back into fundamental questions about scholarship and authorship. There is much debate about this in the sciences, and we would welcome much more discussion about this in our journal. We all have a responsibility for thinking about these issues.
References
Patient co-author
When patients or carers have been equal partners in the writing of the article, and are listed at [sic] authors. Whilst this is often seen as optimal, patient co-authors should not be tokenistic. This must fulfill ICMJE requirements as for all other authors.
Example: Long term hormonal treatment for transgender people
1. The BMJ. Co-production guidance for Education articles [document on the Internet]. c2021 [cited 2024 Jun 26]. Available from: https://www.bmj.co m/sites/default/files/attachments/resources/2021/06/educationcoproguidan ce_2021_0.pdf
2. Smith E. “Technical” contributors and authorship distribution in health science. Sci Eng Ethics. 2023;29(4), Art. #22. https://doi.org/10.1007/s1 1948-023-00445-1
3. Smith E, Hunt M, Master Z. Authorship ethics in global health research partnerships between researchers from low or middle income countries and high income countries. BMC Med Ethics. 2014;15, Art. #42. https://doi.org /10.1186/1472-6939-15-42
HOW TO CITE:
Authorship and inclusion – we need more debate and discussion
Page 2 of 2
4. Morton B, Vercueil A, Masekela R, Heinz E, Reimer L, Saleh S, et al. Consensus statement on measures to promote equitable authorship in the publication of research from international partnerships. Anaesthesia. 2022;77(3):264–276. https://doi.org/10.1111/anae.15597
Swartz L. Authorship and inclusion – we need more debate and discussion. S Afr J Sci. 2024;120(7/8), Art. #18977. https://doi.org/10.17159/ sajs.2024/18977
https://doi.org/10.17159/sajs.2024/18977
BOOK TITLE: Independent Africa, dependent science: Scientific research in Africa
1Director: Research Development, University of the Witwatersrand, Johannesburg, South Africa
EMAIL: Robin.Drennan@wits.ac.za
HOW TO CITE:
Drennan R. Confirmation that science can contribute to African independence. S Afr J Sci. 2024;120(7/8), Art. #18238. https:// doi.org/10.17159/sajs.2024/18238
ARTICLE INCLUDES:
☐ Peer review
☐ Supplementary material
PUBLISHED: 31 July 2024
Confirmation that science can contribute to African independence
I enjoyed reading Prof. Sooryamoorthy’s book, Independent Africa, Dependent Science. It is a thorough piece of work that has been carefully written and skilfully edited. I recommend it as a good read for all those interested in science at the system level and particularly in the science systems of Africa. I would like to take the liberty to recommend it as vital, even compulsory, reading for those in leadership positions in government departments focused on science, engineering and technology, or higher education; research funding agencies; and similar organisations across Africa.
The book is a combination of original research and an extensive review of the pertinent literature. These two threads are skilfully entwined to map how scientific research can help accelerate development in Africa.
The book describes an ambitious bibliometric study of scientific publications recorded in the Web of Science index and published by African authors over an 18-year period from 2001 to 2019. The work examines these publications at various levels. Starting at the country level, the book provides data for all 54 countries in Africa. This analysis is then extended to the scientific disciplines that are covered in these publications: the top five being chemistry, engineering, physics, environmental studies and ecology, and material science. The study then moves to the institutional level and considers the major producers of research publications across the same period. Thereafter, the study extracts information about the funding bodies that are acknowledged in the publications reviewed. Finally, the study examines partnerships based on co-authorship of publications. This extensive chapter looks at Global South and Global North interactions, South–South interactions and intra-African interactions. An unexpected and fascinating part of the study is the examination of the partners of African scholars.
A few of the many conclusions presented in the book are shared here to provide a taste of the richness of the book’s contribution to the scientometric study of African research. They have been selected in such a way that they reflect my set of interests but will point to the abundance of the book’s conclusions. They include:
• The production of science across the African continent is uneven – the top two countries produce 47% of the publications, the next eight produce 37% and the rest produced about 17%. (p. 68)
• The most common disciplines “point to problems that affect Africa”. (p. 80)
• “African funding agencies based in Africa provided funding for [only] about 10% of all the funded publications…” (p. 98)
• The international partners that co-publish with African scholars remain shaped by the colonial history of the continent. The top five being the USA, France, England, Germany and Canada. However, there are signs of this pattern shifting with more Global South collaborations realising publications, with Saudi Arabia and China playing a more prominent role. It would appear from the analysis that geo-political rivalry does not overly affect scientific collaboration. (p. 116)
• Collaboration is not always equal and can be characterised by the northern partner “keen to gain access to data and fieldwork”, and the southern partners looking for “funding and publication opportunities”. (p. 240)
• African science relies on international funding agencies for funding. (p. 248)
• Over reliance on international funding shifts the agenda away from the African agenda and prevents “national science”. (p. 287)
• Improving the quality of African research will lead to more equitable partnerships. (p. 289)
• The need for all African countries to develop science policies is important, but “should make use of some of … the structures already in place”, like ARUA. (p. 290)
There are many more conclusions drawn from the study and the literature review. All of which gave a reassuring sense of confirming my assumptions about African science. This should not be viewed as a negative comment; indeed, the value of the work is to provide evidence to confirm these commonly held assumptions, turning them into facts. Facts that can be used for strategic planning purposes that will enhance the African science systems, and thus relieve the reliance on the Global North, and further African independence.
In summary, this book provides telling insights and confirms anecdotal assumptions.
https://doi.org/10.17159/sajs.2024/18238
BOOK TITLE: The evolving structure of South Africa’s economy: Faultlines and futures
Mapungubwe Institute for Strategic Reflection (MISTRA), Johannesburg, South Africa
PUBLISHED: 2023
REVIEWER: Michael Sachs1
AFFILIATION:
1Southern Centre for Inequality Studies, University of the Witwatersrand, Johannesburg, South Africa
EMAIL: michael.sachs@wits.ac.za
HOW TO CITE: Sachs M. Strategic reflections on South Africa’s economy. S Afr J Sci. 2024;120(7/8), Art. #18034. https:// doi.org/10.17159/sajs.2024/18034
ARTICLE INCLUDES:
☐ Peer review
☐ Supplementary material
PUBLISHED: 31 July 2024
Strategic reflections on South Africa’s economy
As the name suggests, the Mapungubwe Institute for Strategic Reflection has emerged as an important forum for contemplating South Africa’s long-term development path. This is a precious gift in our noisy democracy, which is often caught in the details of immediate policy problems. Strong validation for this role is provided by this edited volume, which takes stock of South Africa’s economic structure and its evolution. The problem of structural transformation – how we should shift the economy towards higher productivity economic sectors – is identified as the central policy issue. Another recent volume on this topic strongly focuses on industrial policy.1 The Evolving Structure of South Africa’s Economy, by contrast, casts its net far more widely with eminent contributors covering topics including macroeconomics, black economic empowerment, climate change, spatial development, regional integration, the changing nature of work, the prospects for social compacting, the role of state companies, the relationship between economic structure and social conditions, and industrial policy.
The editors make clear that the book is a forum for discussion of policy. The common foundation for discussion is the idea of a ‘minerals and energy complex’, or MEC, which is put forward as the only conceptual framework capable of understanding the South African economy today. This idea – first advanced in the seminal work of Fine and Rustomjee2 – is grounded in the empirical reality of deep interactions between mining, energy production and heavy industrial sectors that lie at the core of South Africa’s economy. The MEC framework suggests an evolving process of capital accumulation and power relations – a ‘system of accumulation’ – has retarded the structural transformation of South Africa’s economy in the 20th century and still constitutes the economic basis for social exclusion and political dysfunction.
The editors tell us that escaping from the MEC’s grip requires that “a form of capitalism should be developed in South Africa that delivers the type of economic transformation needed to build an egalitarian, resilient and democratic society” (p.560). To achieve this requires a state capable of directing capital and orchestrating industrial development, and the key obstacle to the creation of such a state is the grip of neo-liberal ideology.
The editors claim that the book offers an alternative policy vision, but I am doubtful that it succeeds in doing so. This may be a consequence of the varied nature of the contributions and the difficulty this poses in reaching clear and coherent conclusions. But it may also reflect weaknesses in the conceptual framework itself. As historian Bill Fruend pointed out, the MEC lens, notwithstanding its defining contribution to the historiography of South Africa’s industrial development, has always struggled to define clear policy implications.3 In Fruend’s words, Fine and Rustomjee “is an impressive assessment but what to do with it? The final section of the book that tries to look ahead to policy is in my view much less incisive and clear. This is one reason why … the MEC has seemingly had so little impact on policy”3
This ambiguity with respect to policy is, in my view, reflected in two tensions that run through the chapters of the book. The first concerns the role of the state. At the centre of the book’s policy advice is, in the words of Fine and Mohammed, that “developmentalism depends on [the state] taking command of financial resources to guarantee appropriate levels of directed investment, in conformity with targeted policy” (p.45). This is well and good, but as the chapter by Swilling et al. points out, the literature on developmental states does not provide clarity on “the granular details of how developmental capabilities are institutionalised in practice” (p.509). A host of issues related to the South African state’s policy shortcomings are discussed across various chapters. But beyond general appeals against ‘neoliberalism’, the book does not offer a cogent analysis of the causes of these state failures in contemporary South Africa, how these relate to the evolution of the MEC, and how they might be overcome.
The state itself is an essential component of the MEC. Private interests in mineral, energy and adjunct manufacturing sectors are seen as co-constituting the core of the economy together with large state actors, such as Eskom. If we frame matters like this, we risk losing sight of the potential for the state to play an autonomous and developmental role. It is also unclear how the politics of non-racial democracy might be relevant to the problem of the state’s role in economic transformation.
One is forcefully reminded of these questions when reading the chapter on the just transition. Here, Baker and Burton suggest that “the country may be moving towards a ‘decarbonised MEC’, given that many of the incumbent institutions and relationships have started to unravel” (p.287). In this context, “financial sector trends are now showing investors moving away from carbon-intensive lending and starting to price in environmental … criteria while allocating capital” (p.279). Yet the state continues to preside over core MEC sectors and, arguably, it is the state itself – or perhaps certain fractions of the state – that are acting to retard effective industrial restructuring away from the MEC.
By making the blunt assumption that the state is acting solely on behalf of the MEC and its related fractions of finance capital, the democratic state is conceived as a neoliberal continuation of its apartheid predecessor. This limits the book’s engagement with the contradictions thrown up by democratic governance and restricts its consideration of policy to the realm of more abstract questions of ideology.
The second tension concerns the relationship between the structural transformation of the economy and social conditions. The chapter on social reproduction bluntly reminds us that “the concept of structural transformation is an inadequate measure of development as … the link between economic development (which the definition addresses) and social reproduction is missing” (p.384–385). In response per haps, the editors are fastidious in reminding us at every turn that the concept of structural transformation must be extended to include various social dimensions. In my view, however, the tension is not clearly resolved. This is a serious weakness because social questions are, of course, particularly apposite in South Africa, where social engineering was such an important
https://doi.org/10.17159/sajs.2024/18034
aspect of the apartheid growth path. Indeed, several other authors have argued that, rather than directing investment in favour of industrial restructuring, the central challenge facing a developmental state in South Africa might be reconstructing social relations.4 5
Arguably, on the path to academic hegemony that it now commands, the idea of the MEC displaced these and other South African approaches to political economy that were better able to frame these questions about the state and its politics, social transformation, and the economy. Various iterations of the theory of internal colonialism, for instance, place the relationship between social reproduction, capital accumulation, race, class and political structure at their centre.6 We are reminded of these debates in the chapter by Netshitenzhe (p.328–360), which suggests a conception of South Africa as a metropolis and colony developing along parallel lines, and attempts to define a policy agenda to overcome this bifurcation. A second line of theory can be found in the work of Stephen Gelb, which considered South Africa in the light of Marxist regulation theory, tightly linking the crisis of production to the structural conditions of unequal consumption.3 7 A third approach is suggested in the work of Seekings and Nattress, which highlights the relationship between economic change and the ‘distributional regime’, and how these have evolved into the democratic era.8
The Evolving Structure presents a conversation about South Africa’s development challenges. But while expansive in policy scope, a rather narrow political economy lens is imposed on the discussion. The goal of strategic reflection may be better served by a more ecumenical approach to the theory of South African society.
References
1. Andreoni A, Mondliwa P, Roberts S, Tregenna F, editors. Structural transformation in South Africa: The challenges of inclusive industrial development in a middle-income country. Oxford: Oxford University Press; 2021. https://academic.oup.com/book/39853
2. Fine B, Rustomjee Z. The political economy of South Africa: From mineralsenergy complex to industrialisation. Johannesburg: Wits University Press; 1996.
3. Freund B. The significance of the minerals-energy complex in the light of South African economic historiography. Transformation: Critical Perspectives on Southern Africa. 2010;71(1):3–25. https://doi.org/10.1353/trn.0.0048
4. Arrighi G, Aschoff N, Scully B. Accumulation by dispossession and its limits: The southern Africa paradigm revisited. Stud Comp Int Dev. 2010;45(4):410–438. https://doi.org/10.1007/s12116-010-9075-7
5. Evans P. Constructing the 21st century developemntal state: Potentialities and pitfalls. In: Edigheji O, editor. Constructing a democratic developmental state in South Africa: Potentials and challenges. Pretoria: HSRC Press; 2010. p. 1–33. https://doi.org/10.1515/9780796926531-005
6. Wolpe H. Race, class & the apartheid state. London: Currey; 1988.
7. Gelb S, editor. South Africa’s economic crisis: An overview. Cape Town / New Jersey: D. Philip / Zed Books; 1991.
8. Seekings J, Nattrass N. Class, race, and inequality in South Africa. New Haven, CT: Yale University Press; 2005. https://doi.org/10.12987/yale/978 0300108927.001.0001
BOOK TITLE: A country of two agricultures: The disparities, the challenges, and the solutions
1Economic Analysis Unit, Agricultural Research Council, Pretoria, South Africa
EMAIL: siphezantsi@yahoo.com
HOW TO CITE:
Zantsi S. How can we build a more inclusive South African agriculture? S Afr J Sci. 2024;120(7/8), Art. #18121. https://doi.org/10.17159/sa js.2024/18121
ARTICLE INCLUDES:
☐ Peer review
☐ Supplementary material
PUBLISHED: 31 July 2024
How can we build a more inclusive South African agriculture?
The dualism of the South African agriculture is a symbol of colonial policies, particularly those of the apartheid regime which was preoccupied with perpetuating a separate development across racial lines. Even in the postapartheid-era, this separate development is still the distinguishing feature of South African agriculture. While a lot has been written about this dualism since Lipton’s1 contribution in 1977, Sihlobo brings a fresh and a detailed perspective to this issue. What is also refreshing is that his approach takes this discussion to ordinary people who are not necessarily scholars.
As in his first book Finding Common Ground, Equity and Agriculture2, he uses articles that he has published in popular public media platforms – such as Business Day, Daily Maverick, and The Conversation – to develop his argument in A Country of Two Agricultures. As such, the book is not a hardcore scientific or academic book, but rather an enjoyable and informative collection of essays which are refreshing to read and add hope about developments within South African agriculture. This approach was intentional, as the author claims in the book’s preface, to have a wider impact extending beyond academia.
The book is divided into 12 parts (chapters). The first half of the book is mostly devoted to telling the story of the growth of South African agriculture and what hinders growth for black farmers (the disparities), while the second half proposes solutions to grow the sector inclusively.
In the first part, Sihlobo starts by narrating a story of a black commercial farmer in Bronkhorstspruit – an example to which he frequently refers in the rest of the book. In the second part, Sihlobo talks about how, from 2001/2002, South African agriculture has thrived; he attributes this growth to good policy, mainly deregulation of South African agriculture, and the adoption of technology. A concern he raises, which is probably shared with most citizens, is that this growth is one-sided, resembling separate development. For example, Greyling et al.3 examined the performance of the South African agricultural sector from 1994 to 2013 and found that smallholders contributed a mere 5%to the sector.
Growth in the agricultural sector, especially in smallholder agriculture, has been the key focus of national policies. For example, the National Growth Path, the National Development Plan (NDP) and the recent Agriculture and Agroprocessing Master Plan. Thus, Sihlobo’s argument is in line with key national priorities and is concerned with development policy, growth and practice. These are necessary considerations in a country with high rates of unemployment and poverty as a result of under-development, especially in the former homelands in which many smallholders are situated.4 For example, analysis by Kwenda et al.5 shows that, on average, former homeland areas have higher levels of unemployment (33%) relative to non-former-homeland areas (24%).
While Sihlobo2 attributes the lack of growth from smallholder agriculture to several factors, the key factors he emphasises are the failures of government to implement policies and governance within local municipalities to build and maintain infrastructure. This issue of policy–practice gaps has recently been emphasised6, with a focus on land redistribution. The latter is an angle which has been an oversight of many development practitioners in explaining the endurance of the dualism within South African agriculture.
In the fourth part of the book, Sihlobo talks about the political economy of South African agriculture, and shows the divisions within South African agriculture caused mainly by the lack of trust, lack of a common vision and lack of public–private partnerships, which he believes are necessary to achieve inclusive growth. He blames the government for not levelling the playing field, resulting in a lack of trust from the private sector. Indeed, division is an enemy of success within the sector, as Sihlobo explains it; he makes an example of farmer organisations that are built along racial lines. Zantsi et al.7 argued similarly, emphasising the fact that the envisaged unified agricultural sector in which farmers compete on equal terms8 could be difficult to achieve because the process disadvantages black farmers who are low on expertise and lack participation in value chains.
In part nine, a part that will interest development practitioners, the author revisits the NDP’s target of creating one million jobs in agriculture and agro-processing. Here Sihlobo first deconstructs from where the one million jobs were envisaged to come. He reminds the readers that these jobs were conditional, subject to implementation of the set of issues highlighted in the NDP, such as redistribution of land to suitable beneficiaries with tradeable leases or titles and access to finance, all of which have hardly been successfully implemented.4,9 He shows that, despite the poor implementation, some targets have been met in certain sub-sectors, like horticulture.
The author concludes his book with the crucial issue of agricultural finance, which is also the key to growing the sector. In summary, this is an informative book for both academics and development practitioners, as well as ordinary citizens who care about development.
References
1. Lipton M. South Africa: Two agricultures? In: Francis W, Alide K, Delia H, editors. Farm labour in South Africa. Cape Town: David Philip; 1977. p. 72–85.
2. Sihlobo W. Finding common ground: Land, equity and agriculture. Johannesburg: Picador Africa; 2020.
https://doi.org/10.17159/sajs.2024/18121
3. Greyling JC, Vink N, Mabaya E. South Africa’s agricultural sector twenty years after democracy (1994 to 2013). Prof Agric Workers J. 2015;3(1):1–15.
4. Zantsi S. Unlocking the potential of the emerging smallholder farming sector in South African agriculture: An agent based approach [doctoral dissertation]. Stellenbosch: Stellenbosch University; 2021.
5. Kwenda P, Ntuli M, Mudiriza G. Exploring unemployment differentials between former and non-former homeland areas in South Africa: A decomposition approach. Dev South Afr. 2023;40(1):166–190. https://doi.org/10.1080/03 76835X.2021.1983411
6. Zantsi S, Nengovhela R. The policy–practice gap: A comment on South Africa’s land redistribution. Dev Pract. 2024;34(4):437–446. https://doi.org/ 10.1080/09614524.2024.2309576
7. Zantsi S, Hlakanyane L, Nkunjana T. Towards a united South African agriculture: A review of social networking between black smallholder and white commercial farming communities through farmer organisations. Int J Afr Renaiss Stud Multi- Inter- Transdiscipl. 2022;17(1):146–170. https://doi. org/10.1080/18186874.2022.2073244
8. Van Zyl J. A new vision for agriculture and management of the transition. In: Van Zyl J, Kirsten J, Binswanger HP, editors. Agricultural land reform in South Africa: Policies, markets and mechanisms. Cape Town: Oxford University Press; 1996. p. 602–608.
9. Bureau for Economic Research. South Africa’s progress towards its development objectives. Research report. Stellenbosch: Bureau for Economic Research, Stellenbosch University; 2021.
AUTHOR: Caroline Kerfoot1
AFFILIATION:
1Centre for Research on Bilingualism, Department of Swedish Language and Multilingualism, Stockholm University, Stockholm, Sweden
CORRESPONDENCE TO: Caroline Kerfoot
EMAIL: caroline.kerfoot@biling.su.se
HOW TO CITE: Kerfoot C. Language, translanguaging, and epistemic justice: Multilingual learning across the curriculum. S Afr J Sci. 2024;120(7/8), Art. #18146. https:// doi.org/10.17159/sajs.2024/18146
South African National Research Foundation (62314), Swedish Riksbankens Jubileumsfond (SAB171020:1), Stockholm University, Wallenberg Foundations
PUBLISHED:
31 July 2024
2024. The Author(s). Published under a Creative Commons Attribution Licence.
Language, translanguaging, and epistemic justice: Multilingual learning across the curriculum
Significance:
This Invited Commentary discusses how language-in-education policies and practices that embrace multilingualism and multilingual learning can promote epistemic justice, constructing more equitable, just, and ethical conditions for learning. The findings considered are significant in that they illuminate sustained multilingual knowledge-building among peers, showing how these processes enhanced disciplinary learning, legitimated all learners as producers of knowledge, and simultaneously constructed a decolonial ethics of knowing. In so doing, they challenge persistent, colonial linguistic and epistemic hierarchies of value as well as longstanding assumptions about the difficulties and costs of implementing mother-tongue-based multilingual education across the curriculum.
This Invited Commentary draws on a recently published paper1 to illuminate the potential of multilingual learning for epistemic justice, that is, for recognising all learners as knowers and, especially, producers of knowledge. The paper is based on data from a Grade 6 Economic and Management Sciences classroom collected during the implementation of the Western Cape’s Language Transformation Plan (LTP)2 in 2007–2009. Under this plan, learners were no longer required to switch to English as the language of learning in Grade 4. Instead, they could choose any of the three regional languages – IsiXhosa, Afrikaans, and English – as the medium of instruction until the end of Grade 6. Those working with teachers in pilot schools added a crucial further dimension: learners were encouraged to use all languages or language varieties in their repertoires in any classroom, thus changing from a monolingual to a multilingual episteme.
During the LTP, literacy results improved dramatically. Of the 16 pilot schools that opted to write the Grade 6 assessment in their chosen language (isiXhosa), 8 achieved almost four times higher than their scores for 2005 after 2 years.3 This significant improvement resulted in plans for a roll-out of the LTP to all Western Cape schools. However, a change of political leadership in the Western Cape led to a unilateral shutdown.
The paper discussed here presents findings from a 4-year ethnography carried out prior to and during the 3-year pilot of the LTP. It shows how the shift to multilingual learning enabled processes of sustained multilingual knowledgebuilding among peers, as well as the emergence of new social, epistemic and ethical orders from below. These findings have considerable importance for current debates on language-in-education policy, language across the curriculum, mother-tongue-based bi- or multilingual education, and teacher education. They challenge persistent colonial ideologies of language as well as assumptions about the difficulties of implementing multilingual learning across the curriculum. Overall, they suggest that language education can promote epistemic justice, constructing more just, equitable, and ethical conditions for learning.
Epistemic justice and contemporary language-in-education policies
Epistemic justice challenges forms of unfair treatment that relate to knowledge, understanding, and participation in communicative practices.4 5 It is concerned with relations of knowing: those that construct (or fail to construct) others as knowers and, more importantly, as producers of knowledge. From a decolonial perspective, it is profoundly entangled with questions of language, having to do with who can legitimately know and through what language.1 Epistemic injustice can thus be seen as inextricably bound to coloniality, the racialised structures of power and prescriptions of value that survive colonialism and are kept alive in contemporary structures of governance.6 From this perspective, questions of bi- or multilingual education are not just language or policy matters, but epistemic ones.
There has long been a compelling international consensus that a solid foundation in a familiar language is a robust predictor of educational success.7,8 A recent comparative study of 56 countries spanning six continents found a “very strong, positive correlation between poor basic literacy outcomes and the presence of a mismatch between the languages of home and schooling, controlling for country income”9(p.9). Research worldwide shows that children who are not taught in a familiar language can take 5–7 years to catch up with their monolingual counterparts, even in well-resourced contexts.9 10 Consequently, experts recommend a minimum of 5–6 years in the first language.8-10 Confirming the wisdom of these recommendations, a 9-year system-wide assessment of education in Ethiopia found that learners who received 8 years of mother-tongue education achieved the highest scores across the curriculum.11 A range of international longitudinal studies further show that scores for proficiency in the L2, or official language of schooling, improve in proportion with the number of years of education in the first language12, thus allaying common fears about the effect of first language instruction on learners’ ability to acquire the dominant language of economic and often sociopolitical power. Note that the terms ‘mother tongue’, ‘home language’, ‘first’, ‘second’ and ‘additional’ language are used here in line with South African educational terminology. These terms do not, however, capture the fact that many learners come from bi- or multilingual homes. For this reason, the term ‘familiar language’ is also used to index a language spoken at home and/or more broadly in everyday interactions. Despite this extensive body of empirical research and a language-in-education policy that emphasises the importance of learning through a familiar language, South Africa, like most countries worldwide, still implements a monolingual, essentially colonial, model of education. This model requires more than 75% of learners to learn through an unfamiliar language from Grade 4 or earlier. Moreover, as urban schools face increasing diversity
in learner populations, education authorities lag behind in imaginative responses to promoting the linguistic and academic well-being of all learners, instead maintaining the essentialised connections between language and ethnicity on which the apartheid system was founded, and perpetuating social and epistemic harm.1
As a result, and almost without exception, linguistically structured inequalities persist. They are evident in substantial differences in educational outcomes for speakers of marginalised languages. The latest South African results in the Progress in International Reading Literacy Study (PIRLS 2021) stand as stark testimony. In 2021, 81% of Grade 4 learners could not read for meaning in any language – a 3% increase since 2016. Brazilian Grade 4s are 3 years ahead of South African Grade 4s.13 These literacy outcomes are compounded by weak disciplinary knowledge14, which is particularly acute in science and mathematics where, for example, in 2021 only 16% of the 36% writing the Maths exam achieved 60% or more in Mathematics, a figure which converts to 6% of all those writing matric15(table 2.5). These figures suggest that, by the end of their schooling, the majority of those learning through a second or additional language acquire “only the most superficial ability to engage with school knowledge, that is, to negotiate it, appropriate it, transform it or transmit it effectively to others”1(p.466). The authors of the paper discussed here argue that such monolingually oriented language-in-education policies and practices constitute a form of epistemic injustice in that they can inhibit or prevent learners from making epistemic contributions, that is, from conveying knowledge to others.4 For Miranda Fricker, this kind of “testimonial” injustice is: “a wrong done to someone specifically in their capacity as a knower […] in a capacity central to human value”4(p.1,5) It is frequently tied to deeper forms of “hermeneutic” injustice through which dominant, often northern, interpretative frames can obscure “significant aspects of [individuals’] social experiences from collective understanding”4(p154). These language-based forms of epistemic injustice sustain social perceptions that misrecognise the cognitive capacities of second language speakers as deficient or less credible.16 In classrooms, they can result in epistemic exclusion, silencing, or resistance. Moreover, these injustices are “tracker prejudices” which are “systematically connected with other kinds of actual or potential injustice”4(p.27). In South Africa, they render learners vulnerable to “long-term trajectories of economic and sociopolitical exclusion and disadvantage, along with reduced confidence in their own epistemic worth”1(p.466)
The transformative potential of unmarking multilingualism
In contrast, the paper underpinning this commentary explores the ways in which a transformative language-in-education policy can contribute to epistemic justice by countering exclusion, reducing harm, and promoting more equitable participation. The study shows what happens when multilingualism is ‘unmarked’ – seen as the norm rather than an exception – and all languages are given equal value as learning resources. It examines the interactions of a group of learners in a large, multigrade, English-medium, Economic Sciences classroom in Delft, a large ‘township’ on the periphery of Cape Town with a uniformly low socio-economic status. All learners in this group spoke isiXhosa at home but also English and Afrikaans with friends at school.
The analysis illuminates the ways in which they used the different languages and language varieties in their repertoires – a practice often known as translanguaging – to negotiate knowledge, construct others as knowers, and promote solidarity. The analysis focuses on a 13-yearold learner who had chosen isiXhosa as medium for the first 5 years of her schooling. She had successfully completed each year, a lively participant in class who obviously enjoyed learning. However, once she reached Grade 6, her mother, perhaps influenced by wider neoliberal ideologies of the low value of African languages, changed her to the English-medium stream. She subsequently failed and had to repeat the grade. In contrast to previous years, observations during Ensha’s first year in Grade 6 showed her as a mostly silent and non-participating member of the class, often visibly distressed by others’ reactions to her ways of speaking in English. Here her ability to be recognised as a competent knower was compromised by her inability to articulate that knowledge in a particular language. This linguistic marginalisation
can be seen as a form of epistemic exclusion, reducing her ability to participate in a given epistemic community and denying her “part of what it is to be fully human”4(p.4). In such cases, a person “may be, quite literally, prevented from becoming who they are”4(p.4)
As a result of these experiences, even after passing Grade 6 the second time in English, Ensha stated unequivocally that she would have preferred to continue with isiXhosa as medium. Nevertheless, her failure and then repetition of Grade 6 had interesting consequences for her academic identity: her second year in this grade coincided with the implementation of the LTP where all languages were considered legitimate resources for learning. She took advantage of this to mediate knowledge for her Grade-6 peers in the English class: observations showed her moving transmodally between the English textbook, the diagrams, isiXhosa, and features of other urban vernaculars such as Kaaps Afrikaans, along with embodied meaning-making strategies such as gaze and gesture. In this way, she engaged in complex forms of multilingual, multimodal knowledge construction, including the meshing of academic and informal registers. Her ‘schooled’ register was for the most part in isiXhosa and was characterised by use of the passive form, complex and compound sentences, increased semantic density and abstraction. It was striking that isiXhosa was used for all significant discipline-specific, knowledgebuilding work (elaborating, exemplifying, evaluating, building from example to abstract concept). This finding is evidence of the fact that without support or previous learning of this content in isiXhosa, she was able to resemiotise knowledge acquired in English the previous year into this language. It belies the belief that teachers are unable to use first or home languages for content subjects without lengthy and specific training.
A further significant feature of her knowledge-negotiating practices was the use of a range of inclusive and dialogically expansive strategies which served to maintain relations of solidarity, work against hierarchical relations of knowledge, and strengthen a participation framework in which all had equal status as knowers. For this purpose, she used humour, discourse markers of familiarity, and face-saving moves; she refrained from explicit evaluations of others’ contributions, instead leaving space for disagreement and seeking consensus. Here, too, moving seamlessly among languages was a key feature. The dialogic relationships created in this way embodied an emergent and decolonial ethics of knowing, premised on openmindedness, respect for others, and solidarity. Such values are associated with the relational ethics of ‘ubuntu’17, an Nguni Bantu term meaning ‘humanity’, sometimes translated as ‘I am because we are’.
Towards epistemic justice
The implications of these findings for future policy and planning are both conceptual and practical. The argument made here is that a shift from a monolingual to a multilingual language-in-education policy is a relatively straightforward and easily implementable strategy to address longstanding issues of epistemic injustice and rapidly enhance learning outcomes. This shift will require two conceptual moves: from epistemic access to epistemic justice, and from languages to languaging and translanguaging.
In postcolonial contexts, epistemic access, defined as access to the knowledge that educational institutions distribute, is geared towards a monolingual outcome, that is, towards academic proficiency in only the official language. As outlined above, epistemic justice on the other hand, challenges us to find ways of recognising all learners as knowers, not only accessing but producing knowledge and conveying it to others. This implies a second shift to the recognition of all language resources as legitimate learning resources, that is, constructing educational systems on the understanding that multilinguality, or the multilingual capability, is an essential condition of what it means to be human.18
Local and international research has demonstrated the potential of translanguaging or trans-semiotising practices such as Ensha’s for supporting scientific argumentation, conceptual understanding, and learners’ confidence in their own epistemic abilities. However, the goal in the vast majority of cases researched is ultimately to promote access to knowledge in the second language, that is, to support a transition to the official language of schooling. Translanguaging, therefore, very often remains “an affirmative rather than transformative strategy, leaving
underlying hierarchies of value and relations of knowing unchanged and promoting epistemic access rather than justice”1(p.464). The concept of languaging19 seems better able to carry the onto-epistemological challenge of rethinking language in education. While translanguaging suggests moving across fixed language boundaries, languaging captures the flexibility of spontaneous multilingual practices, dynamically combining languages and language varieties and incorporating a plurality of expressive practices.
The practical implications of these conceptual moves include the following:
• Begin with multilingualism as the norm and see multilingual practices as the basis for acquiring and producing knowledge.
• Recognise all linguistic varieties and semiotic modes as legitimate in producing and mediating knowledge.
• Encourage teachers to move ahead with multilingual learning even when the resources commonly thought necessary are not yet in place.
• Promote peer mediation processes, especially in highly diverse classrooms where teachers cannot be proficient in all languages spoken.
• The choice of first language instr uction and/or translanguaging pedagogies will depend on the profile of the learners. Therefore, decentralise decision-making and support teachers and schools to develop multilingual policies, pedagogies and practices from the ground up.
• Offer pre- or in-ser vice bilingual teacher education which models processes of pedagogical translanguaging, multilingual learning and assessment, along with ethical relations of knowing.
• Engage with teachers, caregivers, and communities to enrich understandings of the value of multilingual resources and multilingual literacy practices.
Experience in the LTP further demonstrates that publishers are ready and willing to produce bi- or even multilingual texts when sure of state support. Moreover, rapid developments in technology and expanded digital access across Africa offer enriched possibilities for the support and development of multilingual literacies and learning across the curriculum (see for example, the online African Storybook project in over 200 languages20 and work done on simulated classrooms for teacher education21).
Education authorities, when well informed and willing to put learners’ well-being and life opportunities ahead of wider political goals, can ease obstacles and promote swift rollout as in the case of the recent Eastern Cape pilots.22 The announcement in May 2024 of an incremental nationwide rollout from 2025 offers long-overdue hope to future generations of South African learners.23
Lastly, decades of economic research have shown that the initial costs of mother-tongue-based multilingual education may be 4 or 5 percentage points higher than those for a single language of instruction across all schools.24 Technological advances can now reduce this cost substantially. Moreover, the cost of mother-tongue-based bi- or multilingual education to the state will always be far less than the cost of high repetition and pushout rates and, in the long term, of citizens who are unable to participate fully in social, economic and political processes.
Conclusion
The research presented here has highlighted the potential of multilingual learning for the promotion of epistemic justice. Such policies and pedagogies hold equal promise for progress towards the United Nations Sustainable Development Goals of quality education and reducing inequalities within and between countries, with longer term implications for reducing poverty and promoting economic growth.
While “language is not everything in education, […] without language, everything is nothing in education”25(p.92). Language on its own cannot
transform entrenched structural inequalities. Nevertheless, unmarking multilingualism and giving equal value to all languages as epistemic resources has the potential to disrupt hegemonic regimes of language and learning, constructing new relations of knowing and new paths to knowledge. It can also begin the long process of undoing epistemic harms and lay the basis for conditions of greater epistemic justice.
Acknowledgements
This commentary emerges from several decades of collaboration and discussion with South African researchers, educators, and organisations. First, I acknowledge Dr Basirat Bello-Nonjengele, co-author of the paper discussed here, and whose doctoral thesis identified the joint construction of linguistic, social and academic identities in multilingual schools. Further, work discussed builds on the ground-breaking research and practice in bi- and multilingual education by, among others, Neville Alexander, Michelle Bedeker, Zubeida Desai, Xolisa Guzula, Kathleen Heugh, Ntombizanele Mahobe, Pinky Makoe, Leketi Makalela, Ntombizanele Naledi Mbude, Carolyn McKinney, Someka Ngece, Vuyokazi Nomlomo, Meshach Ogunniyi, Peter Plüddemann, Margie Probyn, Christopher Stroud, Robyn Tyler, Jill Adler and Mamokgethi Setati. Space constraints prevent me from citing this body of work. This commentary is also a tribute to the far-sighted leadership of the Western Cape Minister of Education at the time, Cameron Dugmore, and Anne Schlebusch, special advisor to the Language Transformation Plan in the Western Cape Education Department. I thank the editor, Leslie Swartz, for inviting this commentary.
Funding
The research on which this commentary builds was supported by the National Research Foundation (NRF) of South Africa under grant 62314, the Swedish Riksbankens Jubileumsfond (RJ) Project no. SAB17-1020:1, the Faculty of Humanities at Stockholm University, and the Wallenberg Foundations through a Fellowship at the Stellenbosch Institute for Advanced Study (STIAS).
Declarations
I declare no use of AI.
Competing interests
I have no competing interests to declare.
References
1. Kerfoot C, Bello-Nonjengele BO. Towards epistemic justice: Constructing knowers in multilingual classrooms. Appl Linguist. 2023;44(3):462–484. htt ps://doi.org/10.1093/applin/amac049
2. Western Cape Education Department. WCED Language Transformation Plan. Cape Town: Western Cape Education Department; 2007. Available from: http s://wcedonline.westerncape.gov.za/circulars/circulars07/lgsp.html#e4_07_ sp.html*e_inf.html#e28_07.html
3. Western Cape Education Department. Study shows Grade 6 learners improve literacy skills, but maths remains a challenge. Statement by Western Cape Education MEC Cameron Dugmore [webpage on the Internet]. c2008 [cited 2024 Mar 03]. Available from: https://www.westerncape.gov.za/news/stud y-shows-grade-6-learners-improve-literacy-skills-maths-remains-challenge
4. Fricker M. Epistemic injustice: Power and the ethics of knowing. New York: Oxford University Press; 2007. https://doi.org/10.1093/acprof:oso/9780198 237907.001.0001
5. Santos B de S. Epistemologies of the South: Justice against epistemicide. Boulder, CO: Paradigm Publishers; 2014.
6. Quijano A. Coloniality of power, Eurocentrism, and Latin America. Nepantla: Views from South. 2000;1(3):533–580. https://doi.org/10.1177/02685809 00015002005
7. UNESCO. The use of the vernacular languages in education. Report no. 8: Monographs on Foundations of Education. Paris: UNESCO; 1953.
8. World Bank. Loud and clear: Teach children in a language they use and understand [video on the Internet]. c2021 [cited 2021 Nov 16]. Available from: https://www.youtube.com/watch?v=LmR1I7znnZU
9. Alkateb-Chami M. Learning poverty when schools do not teach in children’s home language: A comparative perspective. Int J Educ Dev. 2024;105, Art. #102975. https://doi.org/10.1016/j.ijedudev.2023.102975
10. Collier VP, Thomas WP. Validating the power of bilingual schooling: Thirtytwo years of large-scale, longitudinal research. Annu Rev Appl Ling. 2017;37:203–217. https://doi.org/10.1017/S0267190517000034
11. Heugh K, Benson C, Yohannes MEG, Bogale B. Implications for multilingual education: Student achievement in different models of education in Ethiopia. In: Skutnabb-Kangas T, Heugh K, editors. Multilingual education and sustainable diversity work: From periphery to center. New York: Routledge; 2011. p. 239–283.
12. Heugh K. Theory and practice – language education models in Africa: Research, design, decision-making and outcomes. In: Ouane A, Glanz C, editors. Optimising learning, education and publishing in Africa: The language factor: A review and analysis of theory and practice in mother-tongue and bilingual education in sub-Saharan Africa. Hamburg and Tunis Belvédère: UNESCO Institute for Lifelong Learning (UIL) and the Association for the Development of Education in Africa (ADEA)/African Development Bank; 2011. p. 105–158. Available from: http://uil.unesco.org/home/programme-areas/pr iority-africa/news-target/optimising-learning-education-and-publishing-in-afr ica-the-language-factor/a80946e6e20c19513c9e04fbcb5e96e0/
13. South African Department of Basic Education (DBE). PIRLS 2021: South African preliminary highlights report. Pretoria: DBE; 2023. Available from: https://www.up.ac.za/media/shared/164/ZP_Files/2023/piirls-2021_highligh ts-report.zp235559.pdf
14. Taylor N. Inequalities in teacher knowledge in South Africa. In: Spaull N, Jansen JD, editors. South African schooling: The enigma of inequality: A study of the present situation and future possibilities. Cham: Springer; 2019. p. 263–282. https://doi.org/10.1007/978-3-030-18811-5_14
15. Van der Berg S, Van Wyk C, Gustafsson M, Meyer H, Chari A, Van Biljon, et al. What rich new education data can tell us [webpage on the Internet]. Research on Socio-Economic Policy (RESEP). c2023 [cited 2024 Feb 27]. Available from: https://resep.sun.ac.za/what-rich-new-education-data-can-te ll-us/sample-post/
16. Gabriela A. Veronelli. The coloniality of language: Race, expressivity, power, and the darker side of modernity. Wagadu. 2015;13:108–134.
17. Etieyibo E. Ubuntu, cosmopolitanism, and distribution of natural resources. Philos Papers. 2017;46(1):139–162. https://doi.org/10.1080/05568641.20 17.1295616
18. Agnihotri RK. Multilinguality, education and harmony. Int J Multiling. 2014;11(3):364–379. https://doi.org/10.1080/14790718.2014.921181
19. Maturana HR. Emociones y lenguaje en educación y política [Emotions and language in education and politics]. Santiago de Chile: Dolmen Ediciones; 1990. Spanish.
20. Norton B, Tembe J. Teaching multilingual literacy in Ugandan classrooms: The promise of the African Storybook. Appl Ling Rev. 2021;12(4):565–584. https://doi.org/10.1515/applirev-2020-2006
21. Nel C, Marais E. Pre-service teachers’ perceptions on eliciting learners’ knowledge in a mixed-reality simulation environment. Read Writ. 2023;14(1), Art. #a422. https://doi.org/10.4102/rw.v14i1.422
22. South African Department of Basic Education (DBE). Ministry responds to pertinent matters in the Basic Education Sector as part of the Social Services Cluster response to Parliament [document on the Internet]. c2023 [cited 2024 Feb 27]. Available from: https://www.education.gov.za/ArchivedDocuments /ArchivedArticles/Ministry-responds-to-pertinent-matters-in-the-Basic-Edu cation-Sector-as-part-of-the-Social-Services-Cluster-response-to-Parliame nt.aspx
23. Department of Basic Education. Implementation of mother tongue-based bilingual education announced during International Mother Language Day celebration [webpage on the Internet]. c2024 [cited 2024 Jul 28]. Available from: https://www.education.gov.za/ArchivedDocuments/ArchivedArticles/ Implementation-of-Mother-Tongue-based-Bilingual-Education-0224.aspx
24. Heugh K. Cost implications of the provision of mother-tongue and strong bilingual models of education in Africa. In: Ouane A, Glanz C, editors. Optimising learning, education and publishing in Africa: The language factor: A review and analysis of theory and practice in mother-tongue and bilingual education in sub-Saharan Africa. Hamburg and Tunis Belvédère: UNESCO Institute for Lifelong Learning (UIL) and the Association for the Development of Education in Africa (ADEA)/African Development Bank; 2011. p. 255–289. http://repository.hsrc.ac.za/handle/20.500.11910/3363
25. Wolff HE. Background and history – Language politics and planning in Africa. In: Ouane A, Glanz C, editors. Optimising learning, education and publishing in Africa: The language factor: A review and analysis of theory and practice in mother-tongue and bilingual education in sub-Saharan Africa. Hamburg and Tunis Belvédère: UNESCO Institute for Lifelong Learning (UIL) and the Association for the Development of Education in Africa (ADEA)/African Development Bank; 2011. p. 49–104. Available from: http://uil.unesco.org/ home/programme-areas/priority-africa/news-target/optimising-learning-edu cation-and-publishing-in-africa-the-language-factor/a80946e6e20c19513c9 e04fbcb5e96e0/
AUTHORS: Helen Dallas1 2 Jeremy Shelton1
AFFILIATIONS:
1Freshwater Research Centre, Cape Town, South Africa
2Department of Botany, Faculty of Science, Nelson Mandela University, Gqeberha, South Africa
CORRESPONDENCE TO: Helen Dallas
EMAIL: helen@frcsa.org.za
HOW TO CITE:
Dallas H, Shelton J. Biodiversity data at your fingertips: The Freshwater Biodiversity Information System. S Afr J Sci. 2024;120(7/8), Art. #18705. https://doi.org/10.17159/sa js.2024/18705
Biodiversity data at your fingertips: The Freshwater Biodiversity Information System
Dr Helen Dallas is the Executive Director of the Freshwater Research Centre. The Freshwater Biodiversity Information System (FBIS) was developed by the Freshwater Research Centre (FRC) and its technical partner Kartoza. The FBIS Team is the recipient of the 2022/2023 NSTF-South32 Data for Research Award for the development of FBIS, a powerful, open-access system for hosting, analysing and serving freshwater biodiversity data for South Africa, to facilitate decision-making on freshwater systems.
Significance:
The Freshwater Biodiversity Information System (FBIS) is a powerful, open-access platform for hosting, sharing, and analysing freshwater biodiversity data for South Africa. Platform design and functionality were strongly informed by the requirements of key data end-users and decision-makers. The platform has over 790 000 occurrence records, which are freely available to data-users and are now being converted into impact through incorporation in national decision-support tools. With better data comes better decisions, and access to a data repository like FBIS means that the monitoring, management and conservation of our freshwater ecosystems can be improved, for the long-term betterment of both people and biodiversity.
Introduction
Freshwater ecosystems are among the most biologically diverse habitats on Earth, but they are also among the most threatened and vulnerable, with numerous anthropogenic activities compromising these ecosystems.1 Landuse change, catchment transformation, flow regulation, water abstraction, pollution, invasive species, and global climate change all threaten these ecosystems.2 Monitoring, managing and conserving freshwater ecosystems require access to reliable, long-term biodiversity data.3 Such data are critical for measuring the impact of anthropogenic activities on freshwater ecosystems and biodiversity, informing national and international biodiversity assessments, and enhancing our ability to make informed policy, management, and conservation decisions.3
The Freshwater Biodiversity Information System
The Freshwater Biodiversity Information System (FBIS; https://freshwaterbiodiversity.org), developed by the Freshwater Research Centre (FRC) and technical partner Kartoza, is a powerful, open-access system for hosting, sharing, and analysing freshwater biodiversity data for South Africa.3 The FRC recognised that access to longterm freshwater biodiversity data sets was vital, but lacking for monitoring, managing and protecting freshwater ecosystems in South Africa. While there was a wealth of biodiversity data in existence for freshwater ecosystems, there was not an operational platform providing access to these data. Existing systems were isolated, difficult to access, not well maintained, and had limited capacity for managing freshwater biodiversity data. In addition, FRC wanted to promote the concept of recycling data, where data collected for one purpose could be reused for another. The FBIS was thus developed to address this knowledge gap by providing a platform for hosting high-quality biodiversity data, and by making these data freely available to a wide range of stakeholders.
Consultation with end-users and stakeholders
Platform design and functionality were strongly informed by the requirements of key data end-users and decisionmakers, and by the desire to ensure FBIS functions as a ‘data source’ rather than a ‘data sink’. Key end-users were consulted early in the project at workshops to identify their specific data requirements in terms of reporting, outputs, analyses, scale, visualisation, etc. and this information was then used to inform the design and functionality of the FBIS. Key end-users from both governmental and non-governmental organisations included (1) water resource managers, (2) biodiversity/conservation managers, (3) researchers and (4) environmental consultants. These endusers have played an integral role in guiding the development of the platform, and the refinement of its functionality, through feedback and testing of each version of FBIS released. This approach has resulted in a growing community of practice amongst organisations and individuals using the FBIS, encouraging collaboration and data sharing.
Data currently included in FBIS
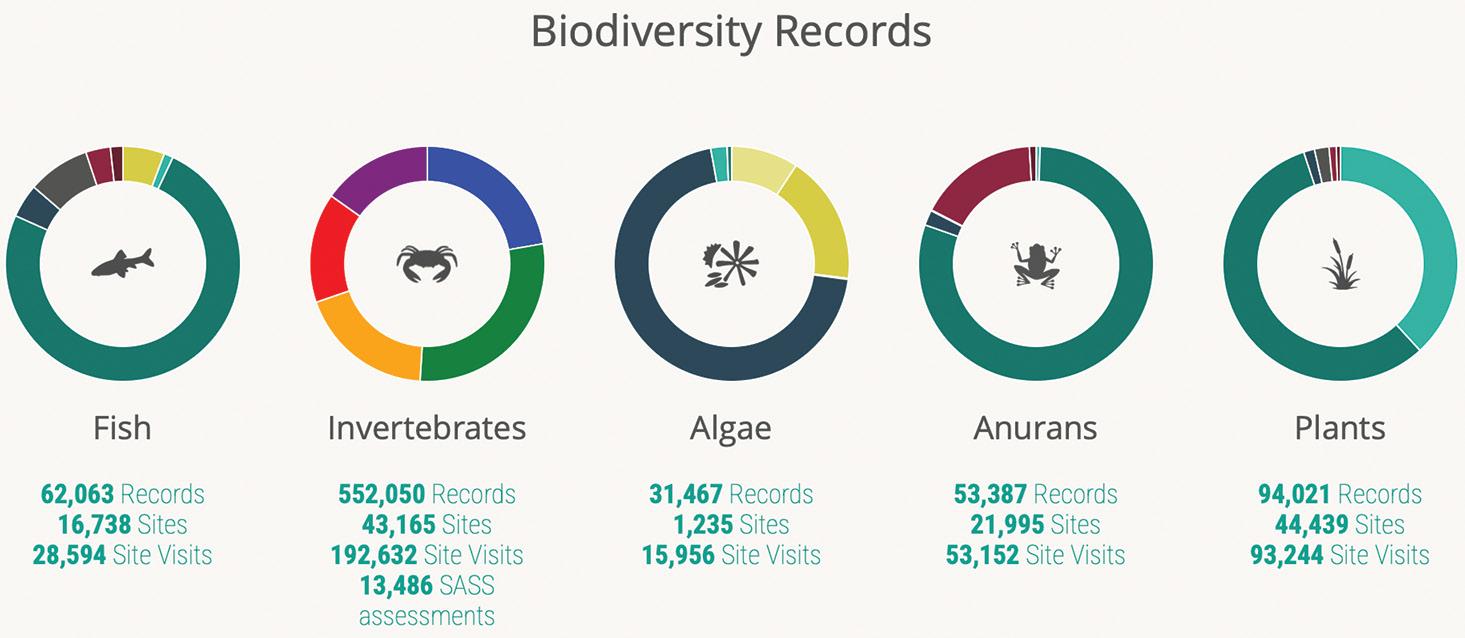
The primary data provided by the FBIS are biodiversity occurrence records for freshwater ecosystems, with FBIS currently serving five biological modules, for the taxonomic groups anurans, fish, aquatic invertebrates, plants and algae (Figure 1). Associated abiotic data such as physicochemical data are provided when available. These biodiversity occurrence records currently come from three sources: (1) data harvested from the Global Biodiversity Information Facility (GBIF), (2) non-GBIF data collated and mobilised by the FRC, and (3) data (OdonataMap and FrogMap) harvested from the Virtual Museum (Fitzpatrick Institute of African Ornithology, University of Cape Town 2021). Legacy databases that existed pre-FBIS, including the Rivers Database4 and Biobase5, were integrated into FBIS. For the non-GBIF or ‘FBIS’ data, the FRC collaborated with project partners to undertake South Africa’s biggest freshwater data consolidation to date. Data were collated from all available sources including peer-reviewed scientific articles, published reports, university theses, and unpublished reports. The FBIS now has >790 000 occurrence records, which are freely available to its data users via the open-access FBIS website (see Dallas et al.3 for further details). The FBIS community is now regularly adding new data to the platform, and data flow into the system will soon be boosted via the release of the FBIS mobile app. All data in the FBIS are freely available
https://doi.org/10.17159/sajs.2024/18705
and follow the FAIR data principles (Findable, Accessible, Interoperable, and Reusable). Data entered into FBIS are validated and quality checked and all data have associated metadata, so that contributors to the FBIS can be fully acknowledged through appropriate citation. Data uploaded to FBIS are also pushed to GBIF under ‘The Freshwater Biodiversity Information System (FBIS) Dataset’, with the recent addition of >30 000 fish occurrence records6 to GBIF.
Key features of the FBIS
In designing the FBIS, the FRC aimed to complement the GBIF, which is widely used by organisations across the globe, including local organisations such as the South African Institute for Aquatic Biodiversity and several museums, to publish and share their biodiversity data. GBIF serves as a global data repository with simple species occurrence record
data from a range of different institutions, with limited functionality for querying, visualising and analysing the data. In comparison, FBIS is a customisable platform that can harmonise and add value to GBIF and other non-GBIF data through data querying, visualisation and analysis tools according to the specific needs of a country or organisation. FBIS also allows for the inclusion of more detailed biodiversity information than does GBIF, and has powerful tools for user administration, data management and data upload. Key features of the FBIS are summarised in Table 1
Converting data into impact
Access to reliable biodiversity data underpins informed conservation and management decisions. Access to a data repository like FBIS means that the monitoring, management and conservation of our freshwater
Table 1: The Freshwater Biodiversity Information System (FBIS) and Global Biodiversity Information Facility (GBIF) are complementary platforms. The table summarises several advantages of working through the FBIS platform.
FBIS and GBIF
FBIS provides open access to comprehensive and standardised freshwater biodiversity data.
FBIS has powerful tools for visualising, querying and analysing data
FBIS has an autonomous, flexible user administration management system that allows for hierarchical management and assignment of user access and rights.
FBIS overcomes the GBIF shortcoming of distinguishing freshwater taxa from non-freshwater taxa.
FBIS adds value to existing biodiversity data by allowing for custom management of taxon lists and adding taxon (species) attributes like threat status, endemism, and migratory species to support management-based data queries.
FBIS allows users to add (and download) more detailed data from biodiversity surveys, including information on sampling effort, method, species abundance, species photographs, habitat information and an extensive range of habitat and environmental variables accompanying the biodiversity data.
FBIS harmonises GBIF and non-GBIF data sets (biodiversity data sets not yet on GBIF) for improved data access and analysis.
FBIS can be used to harvest data from GBIF, and functionality is being developed to seamlessly push data from FBIS to GBIF
FBIS allows users to add (and download) abiotic data in addition to biodiversity data.
FBIS allows users to add (and download) ecological condition (river health) data based on bioassessment metrics.
FBIS allows custom spatial layers to be added for visualising and filtering biodiversity data sets.
FBIS has user-friendly data upload forms for everything from a single sample to a large spreadsheet data set.
FBIS allows data quality labelling and filtering
FBIS has a comprehensive source reference management system to link to online citations and/or to upload PDF documents for access by users.
FBIS can be customised to link to existing databases where APIs exist and are available to use, e.g. IUCN Red List of Threatened Species website; IUCN Red List 2020.
FBIS encourages a community of practice amongst organisations and individuals using the information system, encouraging collaboration and data sharing.
Figure 1: Biodiversity occurrence records for five biodiversity modules currently in the Freshwater Biodiversity Information System. The number of site visits and sites are also provided for each.
ecosystems can be improved, for the long-term betterment of both people and biodiversity. In South Africa, the data from FBIS feed into key national South African freshwater decision-making tools, such as the River Ecostatus Monitoring Programme, Climate change monitoring and management, National Biodiversity Assessment, Department of Forestry, Fisheries and the Environment Environmental Impact Assessment Screening Tool7, National Freshwater Ecosystem Priority Areas, and Global and National Species Red List assessments. FBIS is becoming an indispensable resource for water resource managers, biodiversity/ conservation managers and planners, researchers, environmental consultants, and citizen scientists. Reports, scientific papers, river health assessments, biodiversity assessments, gap analyses, funding proposals, to name but a few, are all types of products produced using the FBIS. A recent example of how FBIS data are deepening our understanding of patterns in South Africa’s freshwater biodiversity is the publication8 on the status of South Africa’s freshwater fish fauna, which provides a spatial analysis of diversity, threat, invasion, and protection of fishes in South Africa based on occurrence data extracted from the FBIS.
Deployment beyond the borders of South Africa
The long-term vision of the FRC and Kartoza was to develop the FBIS in a generic way such that the technological infrastructure could be deployed in other countries and regions. To date, the information system has been deployed in Rwanda (Rwanda Biodiversity Information System) and Botswana (Okavango Repository for BIodiverSity data) and systems currently under development include the FIPbio in Europe (FIPbio to replace the Freshwater Information Platform data portal) and the South African National Parks Biodiversity Management System. Further expansion of the platform is envisaged across Africa and beyond freshwater ecosystems.
Acknowledgements
We thank the FRC staff and interns for their support in developing the FBIS database. We are grateful to the team at Kartoza for their hard work and support in the technical development and implementation of the FBIS platform.
Funding
Funding for the development of the FBIS was provided by the JRS Biodiversity Foundation (grants 60606 and 60919).
Data availability
All data and tools developed in the FBIS project are accessible. Data are available via the Freshwater Biodiversity Information System (FBIS)
(https://freshwaterbiodiversity.org). FBIS was built with open source software and all digital data products are published on GitHub with the bulk of the core logic available here: https://github.com/kartoza/django-bims The FBIS mobile app is available on Google Play and the App Store. FBIS tutorials and other resources are available on the FRC YouTube channel (https://www.youtube.com/@freshwaterresearchcentre2825).
Declarations
AI was not used during the preparation of this manuscript. Both authors read and approved the final version.
Competing interests
We have no competing interests to declare.
References
1. Dudgeon D. Multiple threats imperil freshwater biodiversity in the Anthropocene. Curr Biol. 2019;29:942–995. https://doi.org/10.1016/j.cub.2019.08.002
2. Reid AJ, Carlson AK, Creed IF, Eliason EJ, Gell PA, Johnson PTJ, et al. Emerging threats and persistent conservation challenges for freshwater biodiversity. Biol Rev. 2019;94(3):849–873. https://doi.org/10.1111/brv.12480
3. Dallas HF, Shelton JM, Sutton T, Tri Ciputra D, Kajee M, Job N. The Freshwater Biodiversity Information System (FBIS) – mobilising data for evaluating longterm change in South African rivers. Afr J Aquat Sci. 2022;47(3):291–306. https://doi.org/10.2989/16085914.2021.1982672
4. Dallas HF, Molteno A, Ewart-Smith J, Janssens MP. Rivers Database Version 3: User manual. Report for the Department of Water Affairs and Forestry River Health Programme. Cape Town: Freshwater Consulting Group; 2007.
5. Dallas HF, Janssens MP, Day JA. An aquatic macroinvertebrate and chemical database for riverine ecosystems. Water SA. 1999;25:1–8.
6. Kajee M, Dallas HF, Swanepoel A, Griffiths CL, Shelton JM. The Freshwater Biodiversity Information System (FBIS) fish data: A georeferenced dataset of freshwater fishes occurring in South Africa. J Limnol. 2023;82(S1), Art. #2133. https://doi.org/10.4081/jlimnol.2023.2133
7. Kajee M, Henry DA, Dallas H, Griffiths CL, Pegg J, Van Der Colff D, et al. How the Freshwater Biodiversity Information System (FBIS) is supporting national freshwater fish conservation decisions in South Africa. Front Environ Sci. 2023;11, Art. #1122223. https://doi.org/10.3389/fenvs.2023.1122223
8. Kajee M, Dallas HF, Griffiths CL, Kleynhans CJ, Shelton JM. The status of South Africa’s freshwater fish fauna: A spatial analysis of diversity, threat, invasion, and protection. Fishes. 2023;8(12), Art. #571. https://doi.org/10. 3390/fishes8120571
AUTHORS: Casparus J. Crous1
James S. Pryke1
AFFILIATION:
1Department of Conservation Ecology and Entomology, Stellenbosch University, Stellenbosch, South Africa
CORRESPONDENCE TO:
Casparus Crous
EMAIL: casperc@sun.ac.za
HOW TO CITE:
Crous CJ, Pryke JS. Are we ready for biodiversity offsetting? S Afr J Sci. 2024;120(7/8), Art. #16757. https:// doi.org/10.17159/sajs.2024/16757
ARTICLE INCLUDES:
☐ Peer review
☐ Supplementary material
KEYWORDS:
biodiversity conservation, biodiversity offsets, capacity building, functional diversity, knowledge and technology transfer
Biodiversity offsetting is a last-resort scheme to prevent biodiversity loss due to development. However, measuring biodiversity is a complex endeavour, even more so in hyperdiverse landscapes. With few South African scientists able to comprehensively measure biodiversity, assuming equivalence between sacrificial and offset areas would be problematic and potentially fatal. Caution is required as the erosion of our unique biodiversity is at stake. We advise that a panel of biome-specific experts and data modellers unite to provide tools for more accurate trade-offs, based on functional diversity. In the meantime, the value of focusing on landscape heterogeneity is highlighted.
Biodiversity offsetting: Ideals vs reality
Background
South Africa’s National Biodiversity Offset Guideline, Government Gazette 48841 (Notice No. 3569), was published on 23 June 2023. Biodiversity offsets are designed to compensate for residual biodiversity loss after a development’s initial avoidance or minimisation plans were deemed ineffective. These guidelines heeded national calls to mitigate increasing ecosystem losses even more intently, as outlined in the National Biodiversity Assessment 2018.1
Aligned with the National Environmental Management Act (NEMA), biodiversity offsets may be triggered during the environmental impact assessment (EIA) process. Draft and implemented provincial offset guidelines have been around for more than a decade. However, now EIA practitioners and other environmental services have a nationally standardised framework to work from, and all regional authorities can request biodiversity offsetting where deemed necessary. Effectively, it is a last-resort tool to ensure national environmental management law compliance, whose objective is to ensure a healthy environment for all: “When designed well, a biodiversity offset system may provide opportunities for the achievement of ecological integrity, economic efficiency and social justice”2
Ideally
Biodiversity offsetting mainly intertwines a no-more-loss philosophy with the polluter-pays principle. During the Anthropocene, we can no longer allow ruthless profiteering that contributes to ecological and societal collapse. Publishing these national guidelines is testament to the ongoing efforts by policymakers and legislators to align South Africa with good global environmental practice, putting us on par with global trends in combatting the biodiversity crisis. Where developments are fatally flawed – that is, there is irreplaceable loss of species and no vetoing public interest in the project – losses can not be offset. The proposed area would be declared an area unsuitable for development (a no-go zone) for the foreseeable future. However, in the event offsetting is prescribed, the ethical and ecological principles behind it are not straightforward.
Reality
Potential ethical and implementation issues around biodiversity offsets have been comprehensively detailed in general3, and for South Africa in particular4 5 From these works, and references therein, there is a clear warning of the likelihood of abuse. Most worryingly, deceptive marketing, popularly known as greenwashing, becomes more plausible when complex-to-grasp policies such as biodiversity offsetting are implemented. Reviewing biodiversity offset policies across Australia, Maron et al.6 highlight that, by not clearly communicating to stakeholders what constitutes no net loss or gain, biodiversity might still be declining in some regions, so no net loss does not equate to no more loss – society might be misled by believing they are biodiversity secure in the future, encouraging these policies. Concerns around non-additionality and leakage are also important to recognise5: double counting of conservation gains is possible if developers buy offset land already earmarked for conservation by governments (non-additionality), and, if large tracks of land are removed as offset areas, adjacent ecosystems might bear the brunt of increased human activity to compensate for this ‘loss’ (leakage).
Many of the caveats of biodiversity offsetting originate from the fact that when biodiversity becomes a commodity, species and ecosystems will become priced credits with which to buy deemed-equivalent land. This is redefining non-human life as inherently movable or interchangeable at a cost (value), as determined by humans, simplifying the complex (hyperdiverse) reality.7 Powerful economic incentives also may override even fatally flawed development concerns, such as where large-scale road and housing infrastructure are required to resettle rural people closer to the free market, regardless of what stands in the way.8 Thus, in lieu of an evidence-based, more transparent decision-making framework, biodiversity offsetting is likely to have unintended and counterproductive consequences: a gameable incentive system is likely to be, and has been, exploited by people for financial gain.3
A focus on biodiversity offsetting might overshadow our more immediate restoration needs. Finance instruments to help unlock biodiversity offsetting potential already exist, such as the UN’s Biodiversity Finance Initiative, even though current restoration projects may suffer from sustainable funding issues. It has been suggested that one would need about 50% intact nature to retain a ‘safe’ percentage of biodiversity.9 Below this threshold, ecosystems are compromised, and an area would struggle to provide the full breadth of ecosystem goods and services, impacting the well-being of humans and other species.9 Some South African vegetation types already fall short of this level (>50% transformed).10 We should first recoup our losses by rehabilitating as much degraded land as possible.
Ecosystems with less than 50% remaining should be considered unsuitable for offsetting from the start. South Africa has regions such as the Cape Winelands, with many critically endangered vegetation types10, that have seen high levels of ‘semigration’, placing increasing pressure on terrestrial and freshwater resources. If we accept a 50% safety threshold, most new development there would be stopped, regardless of framing the development as ecologically sensitive. For example, in South Africa, some ‘eco-estates’ technically contribute to de-greening or urban sprawl.11 Moreover, if offsetting is allowed in such threatened landscapes, which mechanisms are in place to safeguard any offset agreement should a land user become insolvent? For highly impacted biomes, a focus on restoration rather than offsetting losses would be advised. For example, an existing residential estate can become more ecologically minded, instead of creating new versions on irreplaceable biodiversity. However, development will remain key in South Africa to pursue a more equal and healthy society. Hence, we can expect biodiversity offsetting to be increasingly implemented.
Are we equipped to implement well-informed, future-proof biodiversity offsetting schemes to counteract these anticipated future losses? Currently, there is no apparent evidence to support this debate at a national level. Counterfactual thinking, or the outlining of all alternative scenarios should a conservation measure be implemented or not, is a powerful tool to assess the likelihood of achieving conservation success. For biodiversity offsetting, we now know that a range of counterfactuals is necessary to evaluate its efficacy to achieve set biodiversity conservation ideals.12 The fact that a range of counterfactuals is required to fill the expected gradient of outcomes, neatly fits the call for more robust metrics integrating multiple aspects of biodiversity science, acknowledging ecological complexity.13 Then there needs to be rapid transfer of this and future-found knowledge to all practitioners nationally. Knowing if we can sufficiently measure biodiversity, or ecological complexity, is of fundamental importance; without doing so, insufficient baseline sampling is likely to exaggerate the real impact of offset areas on ecosystem goods and services.6 Well-established carbon-offset markets were recently exposed to be greatly flawed in modelling impacts on deforestation.14 Key weaknesses identified were finding a true control or equivalent site to measure performance against when in a biophysically diverse biome and not incorporating, or having foresight, of the temporal changes in drivers of ecosystem change – natural or anthropogenic. This negative outcome has essentially knocked confidence in such schemes –an error one cannot allow for biodiversity offsets when dealing with irreplaceable biodiversity.
Can we reliably measure biodiversity?
Ecological complexity in hyperdiverse South Africa
Biodiversity studies are often fixated on the loss of specialist, rare species, or species of special concern. Their presence clearly red flags the potential for extinction prevention. Yet, these specialist species often rely on a mutualistic network of generalist species to lower environmental flux.15 A decrease in the ecological dynamics that helped shape hyperdiverse landscapes would lead to a proportionate decrease in available ecosystem services.16 Although species vulnerability data are clearly important, many records might be outdated, and others need validation. For example, very few species are Red-Listed based on quantitative data, with land-cover quality (habitat loss) the determining factor predicting their extinction.17 Moreover, most Red-Listed species are vertebrates and plants, with little information on two major ecosystem-engineer groups: insects and fungi.17 Soil biota can significantly enhance ecosystem resilience.18 Yet, these microbes and their interaction networks are difficult and costly to detect. They also require much longer time scales to ascertain than those afforded in the EIA process. Nonetheless, it is exactly this ecological complexity, especially an understanding of the natural dynamics of species interactions, that needs to be measured and assessed for truly societyfriendly biodiversity offsetting.19
Biodiversity offsetting is thus likely to focus on alpha diversity – counting and comparing the number of species per site – due to its relative ease. This instead of functional diversity, which would more appropriately determine if there is a like-for-like replacement of ecological processes
and, ultimately, ecosystem goods and services. The idea of no more loss might be difficult to execute if assessments are based on species lists of a few charismatic, easy-to-measure species. It becomes even more problematic when exchanging diversity across hyperdiverse biomes, such as fynbos and grasslands. Equivalence is extremely difficult to establish without knowing the extent of what needs to be conserved in the landscape. There are very few scientists currently in South Africa who can calculate total biodiversity to a high degree of certainty, let alone independent consultants who require such knowledge transfer from academia to implement these policies in the field.
Caveats of basing offsetting on species richness instead of intactness
Intact biodiversity is associated with more stable and efficiently functioning ecosystems. The general argument is that a decrease in plant species numbers leads to a decrease in ecosystem stability, and hence plant species diversity could indicate ecosystem intactness in a given area.20 A study of montane grasslands in KwaZulu-Natal, South Africa showed that, in 18 intact grassland patches, species richness ranged between 40 and 90.21 Developing the lower richness area (site with 40 species) and offsetting the area with 90 species, could be seen as representing a biodiversity gain. Yet this is misinformed without knowing whether the area with 40 species represents a unique community and the site with 90 species is bolstered by generalist species. In fact, for the studied montane grasslands, it was abiotic heterogeneity – a gradient of ecosystems – and not species richness that performed better in helping to conserve multiple functional groups.
Recognising the third dimension: Topography
It is known that lowland areas are more impacted than sloped, mountainous areas. Conditions are tough at the top, typically harbouring species adapted to colder, windier, and drier conditions. These areas are naturally less preferred for development due to logistical and engineering problems associated with steep slopes, and far from ideal for any largescale residential development. Thus, trading up the slope would be inaccurate, even if the sites are within a short distance of each other. We should avoid an archipelago-like remnant distribution, where mainly high-lying biodiversity is offset, effectively leading to isolated intact ‘islands’ in an inhospitable ‘sea’ of degraded ecosystems.22
Is ecosystem degradation a good proxy for habitat loss?
The biodiversity offset guidelines do state one has to also describe the level of ecosystem degradation as a surrogate of intactness (the extent of natural biodiversity left in each ecosystem23). Qualitative measures of degradation will vary among observers and in time. Offsetting between ecosystems may also be problematic considering the temporal nature of a disturbance. A grassland disturbance may disappear in a year’s time, but in the karoo, the same disturbance might take a century to recover from (sensu Bailey24). Thus, whereas ecosystem intactness can be measured more reliably in time, degradation can be fleeting. Understanding the spatial and temporal scale of the disturbance that caused any deemed degradation is crucial, as the offset ratios are ultimately dependent on accurate assessments of the current state of the offset area.
Lastly, any observed degradation, such as biological invasions, should not be used as an argument to relieve the offset ratio; rather, it should trigger rehabilitation efforts. Indeed, to rectify or remain within safe ecosystem boundaries in time, preserving intactness and restoring as widely as possible is the first prize.23 For accurate biodiversity offsetting, it would make more sense to assess ecosystem intactness; that is, the offset ecosystem must contain similar natural heterogeneity to the to-bedeveloped area.
Potential
solutions
Focusing on landscape heterogeneity: The role of specific landscape features
Specific landscape features – e.g. water bodies, decaying logs in a forest, riparian zones, rocky outcrops, or a hilly topography – are often associated with specific biotic communities compared to the matrix. Vegetation
mapping often does not include the whole complement of these features, and especially not ‘small natural features’, which have significant ecological influence disproportionate to their size.25 In highly disturbed environments, specific landscape features can be perceived as too small or insignificant in the larger landscape due to their extent. Yet many features are important refuges for a variety of species, such as rockiness as protection against fire in hyperdiverse South African grasslands.21 The result is that specific features are often unappreciated due to insufficient documentation of their existence and value, and are thus vulnerable to degradation, some even at risk of complete destruction.25
The implication for biodiversity offsetting is that the offset areas should be similarly heterogeneous in landscape features to the sacrificial ones. Conversely, the traded patches should be similar ecological regions (ecoregions), indicating homogeneous ecosystem types. Similar ecoregions would ensure that the quality and quantity of the total environmental resources are maintained, and thus also the customary ecosystems goods and services.26 Loss of these features must not be negotiated but explicitly included, even if they were introduced at some stage to aid in biodiversity conservation. Considering landscape heterogeneity in all biodiversity conservation plans is crucial.
Open-access web tools constructed by expert ecologists and data modellers
As it is impossible to include all species in offsetting assessments, bioindicators are often used. They are great measures of environmental stress, although they are less well developed as biodiversity indicators. Biodiversity science is a complex and dynamic discipline, with better methods and data analysis tools constantly emerging. Furthermore, the statistics necessary to do these analyses would be daunting to many individual specialists and authorising agencies. In support of calls for capacity building4, we suggest expert ecologists and data modellers work more closely together to simplify biodiversity assessments for all stakeholders involved in biodiversity offsetting. For example, workshops consisting of experts in each biome, together with ecological data modellers, could create an online platform to calculate the thresholds of offsetting, which are especially important when traversing ecosystems. Documenting the functional diversity of each site also needs to be explored. Sites with higher functional diversity and divergence are more likely to have higher ecosystem service contributions and the sites themselves to have long-term resilience. Surrogacy is the best we have at present, but a no-more-loss principle requires more evidence-based methods with fewer assumptions. Make no mistake, this is an immense task.
Conclusion
Multiple ecosystems can exist within a vegetation type. Accounting for the variety of ecosystems, no matter how small, would more accurately depict intactness and thus landscape resilience. Only after recognising and implementing such a finer-scale approach nationally, would we get a more representative idea of the breadth of ecosystem services one stands to lose or gain by biodiversity offsetting. To make offsetting easier for environmental practitioners, a cost-saving for developers, and more reliable, an evidence-based, expertly modelled, continuously updated tool, specifically designed to measure biodiversity offsetting, would be beneficial to add to the existing national biodiversity assessment toolbox. Such a tool would require only minor oversight by the appointed specialist and competent authority. In the meantime, a focus on special landscape features – abiotic and biotic landscape heterogeneity – would aid biodiversity inventories.25 Being visually easy to identify, landscape features allow for a variety of differently trained consultants to standardise their approaches. This standardisation must be communicated more clearly and widely; it must be instilled in the process.
South Africa is a country on the rise, and this means more development is inevitable. As biodiversity offsetting is predicted to increase after publishing the official, national guidelines, we need to ask the tough questions: Are we ready to implement these guidelines nationally? Are quick-and-dirty reports regarding only a few species or groups, where time constraints inhibit proper investigation, leading to merely qualitative likelihood synopses? To truly achieve the aims of biodiversity offsetting, more discussion, workshopping, and efficient distribution of practical
tools for South Africa are necessary. The cost of getting offsetting wrong, is the erosion of our unique biodiversity.
Acknowledgements
We thank the anonymous readers for insightful feedback on earlier versions of this manuscript.
Declarations
We have not used any type of AI for the writing of this manuscript. Both authors read and approved the final manuscript.
Competing interests
We have no competing interests to declare.
References
1. Skowno AL, Poole CJ, Raimondo DC, Sink KJ, Van Deventer H, Van Niekerk L, et al. National Biodiversity Assessment 2018: The status of South Africa’s ecosystems and biodiversity. Synthesis report. Pretoria: South African National Biodiversity Institute; 2019.
2. Western Cape Department of Environmental Affairs and Development Planning. Provincial guideline on biodiversity offsets. Cape Town: Western Cape Department of Environmental Affairs & Development Planning; 2007.
3. Gordon A, Bull JW, Wilcox C, Maron M. Perverse incentives risk undermining biodiversity offset policies. J Appl Ecol. 2015;52(2):532–537. https://doi.org /10.1111/1365-2664.12398
4. Brownlie S, Von Hase A, Botha M, Manuel J, Balmforth Z, Jenner N. Biodiversity offsets in South Africa – challenges and potential solutions. Impact Assess Proj Apprais. 2017;35(3):248–256. https://doi.org/10.1080 /14615517.2017.1322810
5. Coetzee BWT, Duncan FD, Erasmus BFN, Scholes RJ, Sheridan C, Witkowski ETF. Position paper and recommendations to the draft national biodiversity offset policy [document on the Internet]. No date [cited 2023 Aug 08]. Available from: https://www.wits.ac.za/gci/gci-news/position-paper-and-rec ommendations-to-the-draft-national-biodiversity-offset-policy/
6. Maron M, Bull JW, Evans MC, Gordon A. Locking in loss: Baselines of decline in Australian biodiversity offset policies. Biol Conserv. 2015;192:504–512. https://doi.org/10.1016/j.biocon.2015.05.017
7. Apostolopoulou E, Greco E, Adams WM. Biodiversity offsetting and the production of ‘equivalent natures’: A Marxist critique. ACME. 2018;17(3):861–892.
8. McNeely JA. Economics and biological diversity: Developing and using economic incentives to conserve biological resources. Gland: IUCN; 1988.
9. Obura DO, DeClerck F, Verburg PH, Gupta J, Abrams JF, Bai X, et al. Achieving a nature- and people-positive future. One Earth. 2023;6(2):105–117. https:// doi.org/10.1016/j.oneear.2022.11.013
10. Rouget M, Jonas Z, Cowling RM, Desmet PG, Driver A, Mohamed B, et al. Ecosystem status and protection levels of vegetation types. The vegetation of South Africa, Lesotho and Swaziland. Pretoria: South African National Biodiversity Institute; 2006. p. 725–737.
11. Mistry A, Spocter M. Exploring the ‘eco-ness’ of South Africa’s eco-estates. J Urban. 2022:1–20. https://doi.org/10.1080/17549175.2022.2050279
12. Coetzee BWT, Gaston KJ. An appeal for more rigorous use of counterfactual thinking in biological conservation. Conserv Sci Pract. 2021;3, e409. https:/ /doi.org/10.1111/csp2.409
13. Bull JW, Suttle KB, Gordon A, Singh NJ, Milner-Gulland EJ. Biodiversity offsets in theory and practice. Oryx. 2013;47(3):369–380. https://doi.org/10 .1017/S003060531200172X
14. West TA, Wunder S, Sills EO, Börner J, Rifai SW, Neidermeier AN, et al. Action needed to make carbon offsets from forest conservation work for climate change mitigation. Science. 2023;381(6660):873–877. https://doi.org/10.1 126/science.ade3535
15. Bascompte J, Jordano P, Melián CJ, Olesen JM. The nested assembly of plant–animal mutualistic networks. Proc Natl Acad Sci USA. 2003;100(16):9383–9387. https://doi.org/10.1073/pnas.1633576100
16. Reich PB, Tilman D, Isbell F, Mueller K, Hobbie SE, Flynn DF, et al. Impacts of biodiversity loss escalate through time as redundancy fades. Science. 2012;336(6081):589–592. https://doi.org/10.1126/science.1217909
17. Cazalis V, Di Marco M, Butchart SH, Akçakaya HR, González-Suárez M, Meyer C, et al. Bridging the research-implementation gap in IUCN Red List assessments. Trends Ecol Evol. 2022;37(4):359–370. https://doi.org/10.10 16/j.tree.2021.12.002
18. Martínez-García LB, De Deyn GB, Pugnaire FI, Kothamasi D, Van der Heijden MG. Symbiotic soil fungi enhance ecosystem resilience to climate change. Glob Change Biol. 2017;23(12):5228–5236. https://doi.org/10.1111/gcb.13785
19. Thompson JN. The evolution of species interactions. Science. 1999; 284(5423):2116–2118.
20. Hautier Y, Tilman D, Isbell F, Seabloom EW, Borer ET, Reich PB. Anthropogenic environmental changes affect ecosystem stability via biodiversity. Science. 2015;348(6232):336–340. https://doi.org/10.1126/science.aaa1788
21. Crous CJ, Samways MJ, Pryke JS. Exploring the mesofilter as a novel operational scale in conservation planning. J Appl Ecol. 2013;50(1):205–214. https://doi.org/10.1111/1365-2664.12012
22. Gilpin ME, Diamond JM. Subdivision of nature reserves and the maintenance of species diversity. Nature. 1980;285(5766):567–568. https://doi.org/10.1 038/285567a0
23. Newbold T, Hudson LN, Arnell AP, Contu S, De Palma A, Ferrier S, et al. Has land use pushed terrestrial biodiversity beyond the planetary boundary? A global assessment. Science. 2016;353(6296):288–291. https://doi.org/1 0.1126/science.aaf2201
24. Bailey RG. Ecosystem geography: From ecoregions to sites. 2nd ed. New York: Springer; 2009.
25. Hunter Jr ML, Acuña V, Bauer DM, Bell KP, Calhoun AJ, Felipe-Lucia MR, et al. Conserving small natural features with large ecological roles: A synthetic overview. Biol Conserv. 2017; 211:88–95. https://doi.org/10.1016/j.biocon. 2016.12.020
26. Omernik JM, Bailey RG. Distinguishing between watersheds and ecoregions 1. J Am Water Resour Assoc. 1997;33(5):935–949. https://doi.org/10.1111/j. 1752-1688.1997.tb04115.x
AUTHOR: Anne Fitchett1
AFFILIATION:
1School of Civil and Environmental Engineering, University of the Witwatersrand, Johannesburg, South Africa
CORRESPONDENCE TO: Anne Fitchett
EMAIL: anne.fitchett@wits.ac.za
HOW TO CITE:
Fitchett A. The transition to retirement from academia. S Afr J Sci. 2024;120(7/8), Art. #18723. https:// doi.org/10.17159/sajs.2024/18723
ARTICLE INCLUDES:
☐ Peer review
☐ Supplementary material
KEYWORDS: meaning of work, third age, successful ageing, identity, productive work
PUBLISHED: 31 July 2024
The transition to retirement from academia
Significance:
Retirees represent a growing segment of the population as life expectancy increases and the length of retirement is extended. This growth has prompted a number of studies into the nature of retirement. Associated with this interest is an exploration of the meaning of work and impacts on meaning formation in the transition to retirement. Increasingly, retirees are exploring concepts such as the ‘third age’ and ‘successful ageing’ as they enter their retirement years in a good state of mental and physical capacity. This exploration is particularly prevalent in those retiring from academic posts, for whom identity is often closely bound with their productive work, whether in research or teaching. Whatever the mode of stepping down from full-time paid employment, the literature is unanimous in its observation that planning for retirement is the strongest indicator of a successful and meaningful transition.
Since the late 1980s, the Meaning of Work has been the subject of many studies, following the pioneering study done by the MOW International Research Team’s publication of The Meaning of Work1, which represented 14 000 respondents in eight countries2. This seminal work explored five dimensions: “...work centrality as a life role, societal norms regarding work, valued work outcomes, importance of work goals, and work-role identification”3 While the concept of work has changed over the past decades as work has become more flexible for many, it is still regarded as “inherently a meaningful activity” (emphasis in the original).4 Work can be defined by the extent to which it fulfills “...four different important functions: economic (to earn a living), social (to interact with others), prestige (social position), and psychological (identity and recognition)”3. This centrality of work in our society then raises the question: How does one construct meaning in life when work ceases, especially at retirement?
As life expectancy increases and retirement age becomes more flexible, people can expect to live a substantial proportion of their life in retirement of one form or another. Some people are opting to retire early, whether to engage in leisure activities, family care or productive pursuits, while others may be encouraged to take early retirement through retrenchment or workplace restructuring. In a society that places much emphasis on productive work, meaning in retirement becomes a challenging concept. This challenge is heightened in academia, where one’s identity is often bound up with one’s productive output, especially in the form of research or professional contribution.
Given its prevalence in formal economies, the phenomenon of retirement is relatively recent, dating to Bismark’s introduction of old-age social insurance in 1889.5 Retirement itself has undergone transformation in recent decades, as retirees seek out alternatives to the normative concept in which the retiree ceases paid employment and spends the rest of their life engaging in unpaid activities (e.g. leisure, volunteering), gradually downscaling to the end of life. An exploration of the literature highlights that there is increasing diversity in modes of retirement, as well as in people’s relationship to paid work, with many of retirement age opting to downscale with their pre-retirement employer, or seek alternative paid work, whether to pursue other interests or for financial reasons. Increasingly, the transition to retirement is no longer linear from one state to another, but rather “a bricolage of interwoven life processes”6
Ours is a society that places considerable emphasis on work, attributing to it authenticity, self-efficacy, self-esteem, purpose, belongingness, transcendence and sense-making.7 It is not surprising then that people facing retirement may experience existential dread with the expectation that their life will lose meaning, and that they will lose status in their new situation. To counter this, we observe in the ‘baby boomer’ generation, a number of concepts and strategies around retirement that resist these negative associations with retirement, concepts such as the ‘third age’ and ‘successful ageing’. The latter concept is founded on the observation that many reaching retirement age are still in a good state of health, are fully mentally and physically functional and are actively engaged.8 The ‘third age’ concept has many similarities, with the emphasis on mental and physical health and fitness, characterised by continual learning and engagement in fulfilling activities.9
Fasbender et al.10 recognise four categories of meaning that we attribute to work: social, personal, financial and generative. All four of them potentially feed into meaning in retirement, depending on individual circumstances. Of the four, the generative is the most interesting, in that Fasbender et al.10 have determined that people in postretirement paid employment will tend to be egotistical, whether hedonistic or for financial gain, whereas those who engage in civic work or family care will have more altruistic motivation. August11 identifies four kinds of meaning in retirement: (1) as a new phase of life which opens up new possibilities and priorities; (2) a final phase of life; (3) a frightening period associated with financial, social, or personal loss; and (4) a mark of achievement in one’s life presaging a period of relaxation as a reward. Mapped against Fasbender et al.’s10 pragmatic meanings attributed to work, August11 sees meaning more as emotional responses to the retired situation, each of which potentially embodies some or all of Fasbender et al.’s10 categories. For example, if retirement is seen as a new phase of life, this could entail new social engagement, personal growth in new skills and knowledge, a new income stream and/or the creation of new outputs from the new knowledge and skills.
In academia, retirement is often a transitional process, in which the retiree scales back from administrative duties, but may still continue to teach and supervise postgraduate research. This is more prevalent among the professorial cohort, for whom lifelong emeritus positions are common. The focus of many of these semi-retired people is on
research – an area of engagement that, for many, was relegated to the back seat in the last few years of their full-time employment, when they may have had a senior appointment with a large administrative burden, preventing them from engaging in their preferred activities such as research.12 In an emeritus or honorary position, the individual often has the freedom to choose how they spend their time in academic pursuits, whether teaching, supervision, research or community outreach on behalf of the university. There is also a prevalence of retired academics seeking out a larger role within the institution, often crafted on their previous administrative duties or some new venture that they orchestrated towards the end of their career. This is often a conscious strategy to ensure identity and meaning post the retirement age, thereby postponing ‘real’ retirement. It should be noted that not all academics and few administrative staff in higher education have the luxury of choice in their post-employment relationship with their institution – for them, retirement is a clean break, requiring them to seek other avenues in which to craft meaning. Also of note is the changing environment of research, moving from a more discipline-based to a more collaborative scenario, across disciplines and/or inclusive of industry and other government entities.13 Such collaboration with bodies and individuals outside academia, while potentially impacting on research autonomy and its integral link to intellectual identity, might, on the positive side, offer postretirement opportunities for ongoing employment or less formal interaction.
So the question is then: How does one conceptualise and forge meaning in retirement, after a career in academia in which meaning is so strongly embedded? The meaning of work in an academic setting is both internal, in terms of personal growth, and external, through teaching and supervision in which skills and knowledge are transferred to others. This may be why so many in emeritus and honorary positions elect to continue teaching, and not just continue their research activities. Moreover, teaching helps to preserve the physical routines of the academic year, providing structure and purpose.
Whether one takes up an honorary post, or opts to make a clean break, the literature is unanimous in support of planning for retirement. Planning may take many forms, from the obvious and often imposed financial planning, through to one’s daily routines and social contacts. There is an inevitable shift in one’s relationship with colleagues when one has an honorary position: what was previously dominated by workplace engagement, now takes on a more social or mentorship complexion. There is a sense that one takes a more passive role, waiting for others to initiate communication as their time is less flexible.
There is debate about whether a retiree should aim to structure a new set of routines, or celebrate the newfound flexibility afforded by retirement. Self-motivated activities may seem quite forced and artificial, selfindulgent or ‘consumptive’, in contrast with the ‘productive’ orientation that may have characterised much of one’s activities prior to retirement. This said, it is often the first real opportunity to be able to take up a new venture, such as learning a language or musical instrument, for the pleasure of doing it, rather than because it was demanded by one’s employment.
In the first few weeks and months of retirement, there is a necessary period of adjustment, whether as simple as restructuring one’s wake-up routine, or on a much larger timescale. Suddenly, the demands have to come from within, rather than from the imposed regimen of meetings and other scheduled activities.
Researchers into meaning in retirement have looked to continuity theory as a way of conceptualising decisions of retirees. As described by Cahill et al.14: “...continuity theory suggests that one will aim to maintain a coherent sense of self by retaining experiences, habits and lifestyle patterns acquired during their life”. They note that female academics who continue activities related to their previous academic role transition to retirement more effectively, as a means of preserving “a coherent sense of self”15.
This discussion is framed within a context of financial and intellectual privilege in a country (South Africa) with extreme contrasts of wealth and educational opportunity. Likewise, much of the literature on retirement is located within the upper-middle income group in highly developed countries. Much work needs to be done in researching people’s creation of meaning in their post-retirement age from other income groups and from other sectors of the population, such as disadvantaged groups and the unemployed.16
Declarations
AI was not used in the preparation of this article.
Competing interests
I have no competing interests to declare.
References
1. MOW International Research Team. The meaning of work. London: Academic Press; 1987.
2. Brief AP. MOW revisited: A brief commentary. Eur J Work Organ Psychol. 1991: 176–181. https://doi.org/10.1080/09602009108408523
3. Pignault A, Houssemand C. What factors contribute to the meaning of work? A validation of Morin’s Meaning of Work Questionnaire. Psicol: Reflex Crít. 2021;34:2. https://doi.org/10.1186/s41155-020-00167-4
4. Bendassolli PF, Tateo L. The meaning of work and cultural psychology: Ideas for new directions. Cult Psychol. 2018;24(2):135–159. https://doi.org/10.1 177/1354067X17729363
5. Quadagno J. The transformation of old age security: Class and politics in the American welfare state. Chicago, IL: University of Chicago Press; 1988.
6. Kristensen MM, Simonsen P, Mørch KK, Pihl ME, Rod MH, Folker AP. “It’s not that I don’t have things to do. It just all revolves around me” – men’s reflections on meaning in life in the transition to retirement in Denmark. J Aging Stud. 2023;64, Art. #10111290. https://doi.org/10.1016/j.jaging. 2023.101112
7. Rosso BD, Dekas KH, Wrzesniewski A. On the meaning of work: A theoretical integration and review. Res Organ Behav. 2010;30:91–127. https://doi.org/1 0.1016/j.riob.2010.09.001
8. Malette J, Oliver L. Retirement and existential meaning in the older adult: A qualitative study using life review. Couns Psychother Health. 2006;2(1):30–49.
9. Kojola E, Moen P. No more lock-step retirement: Boomers’ shifting meanings of work and retirement. J Aging Stud. 2016;36:59–70. https://doi.org/10.10 16/j.jaging.2015.12.003
10. Fasbender U, Wang M, Voltmer JB, Deller J. The meaning of work for postretirement employment decisions. Work Aging Retire. 2016;2(1):12–23. http s://doi.org/10.1093/workar/wav015
11. August RA. Women’s retirement meanings: Context, changes, and organizational lessons. Gend Manag. 2011;26(5):351–366. https://doi.org/10. 1108/17542411111154895
12. Cahill M, Pettigrew J, Robinson K, Galvin R. The transition to retirement experiences of academics in “higher education”: A meta-ethnography. Gerontologist. 2019; 59(3):e177–e195. https://doi.org/10.1093/geront/gnx206
13. Henkel M. Academic identity and autonomy in a changing policy environment. High Educ. 2005;49:155–176. https://doi.org/10.1007/s10734-004-2919-1
14. Cahill M, Galvin R, Pettigrew J. The retirement experiences of women academics: A qualitative, descriptive study. Educ Gerontol. 2021;47(7):297–311. https://doi.org/10.1080/03601277.2021.1929266
15. Rowson TS, Phillipson C. ‘I never really left the university’: Continuity amongst male academics in the transition from work to retirement. J Aging Stud. 2020;53, Art. #100853. https://doi.org/10.1016/j.jaging.2020.100853
16. Shultz KS, Wang M. Psychological perspectives on the changing nature of retirement. Am Psychol. 2011;66(3):170–179. https://doi.org/10.1037/a0022411
AuthorS: Jennifer M. Fitchett1
Ariel Prinsloo1
Ogone Motlogeloa1
Zandizoloyiso Mnguni1
Charné Meyer1
Dineo Mokgehle1
Salome Jones1
Mukhtaar Waja1
Yusuf Mansoor1
Alexi Marinaki1
Kayleigh Raines1
Cassia Holtz1
Nicholas Baart1
AFFILIAtIoN:
1School of Geography, Archaeology and Environmental Studies, University of the Witwatersrand, Johannesburg, South Africa
CorrESPoNDENCE to:
Jennifer Fitchett
EMAIL: Jennifer.Fitchett@wits.ac.za
hoW to CItE:
Fitchett JM, Prinsloo A, Motlogeloa O, Mnguni Z, Meyer C, Mokgehle D, et al. Giving feedback on oral presentations: Critically considering the line between constructive criticism and unhelpful feedback.
S Afr J Sci. 2024;120(7/8), Art. #17350. https://doi.org/10.17159/sa js.2024/17350
University of the Witwatersrand Friedel Sellschop Grant (JFTC022)
PubLIShED: 31 July 2024
Giving feedback on oral presentations: Critically considering the line between constructive criticism and unhelpful feedback
Significance:
For students and early career researchers, the opportunity to present their research at internal seminars and external workshops and conferences is met with both excitement and trepidation. For researchers eager to receive feedback, and for experts in the field wanting to reflect and engage with the work they are doing, conferences provide a space for deep and invigorating development of their argument and research. However, instances in which commentary offered is overly critical, not mindful of the context of the work, and unhelpful, leave students and early career researchers questioning the value of their research, and increasingly disillusioned about academia. We offer a set of key questions that can be used to frame comments at conferences and workshops to maintain engagement whilst enhancing constructive feedback and minimising unhelpful criticism.
Introduction
There is an established and growing literature reflecting on what has been posited as a toxic culture in academia.1,2 Undesirable practices may be hidden under the auspices of critical thinking, constructive feedback, or engagement.3-5 Not coincidentally, this occurs alongside an attrition from academia both during and after PhDs, in part as a result of unhealthy research environments.6 7 The literature has captured these impacts in cohort studies of PhD students, postdocs and campus-wide surveys, finding shared experiences in different parts of the world and across varied disciplines.3-7 The reports of individuals captured within these works provide greater insight into the numbers that are reported in quantitative studies. Reflecting on personal experience, Roberts-Gregory recalls an engagement with a member of their graduate studies panel: “He denigrated the conceptual framing of my research, my chosen methods, my writing style, and my ability to conduct ‘systematic analysis’”5(p.132)
As Hellyer3 points out, these practices often take place at conferences and workshops, spaces in which students and early career researchers are often excited to share their research, and to have an audience who are engaged in and reflective of the work they have done, yet they may be met with unreasonable and harmful criticism:
One recent example highlighted online showed how a Bath University PhD student was attacked and ridiculed at a conference by a senior academic who said she should be “ashamed,” pointing his finger in her face and calling her a “disgrace.” When she tried to respond, he continued to attack her and her research.3(p.1)
Rather than seeking to learn from the presenter and to approach a conference presentation with curiosity, such responses suggest that the audience member sees their role as a critic, tasked with finding mistakes in the work presented. As Harris and González8 put it,
On the one hand, the university champions meritocracy, encourages free expression and the search for truth, and prizes the creation of neutral and objective knowledge for the betterment of society… on the other hand, women of colour too frequently find themselves ‘presumed incompetent’ as scholars, teachers, and participants in academic governance.8(p.1)
These issues may contribute to increasing barriers to postgraduate student retention in academia6 7, imposter syndrome9 10, and unnecessary stress when attending departmental seminars, external workshops and conferences. Early career researchers and students in turn may feel discouraged from speaking in public (an already anxiety-provoking task for most) and attending conferences. Negative feedback received in these spaces is of questionable use to the professional development of the student, or the academic rigour of their work. Central to this is perhaps a lack of consensus on the meaning and understanding of constructive criticism or feedback, and how it compares to more detrimental forms of feedback.11 This issue is arguably heightened in the context of neoliberal academia, which is characterised in part by precarious academic labour, the framing of achievement as inherently individualistic, and the resultant feelings of competition.12 13
It is estimated that 20% of students experience imposter syndrome10, and as Pellier et al.4 argue, it is the enabling environments in academia that allow toxic practices of unreasonable criticism to exacerbate these experiences. In 1993, Costa and Kallick14 wrote of the role of a ‘critical’ friend in academia:
A critical friend, as the name suggests, is a trusted person who asks provocative questions, provides data to be examined through another lens, and offers critique of a person’s work as a friend. A critical friend takes the time to fully understand the context of the work presented and the outcomes that the person or group is working towards.14(p.50)
While academic work during the COVID-19 pandemic revealed even greater concerns of toxicity relating to job insecurity, overtime work requirements, and a challenge in juggling parenthood and other care responsibilities with
academic work15, research on the impact of denigrating feedback has continued to emerge through this period16-18. Research has also revealed a wide-ranging list of reasons for leaving academia which are parallel to, although often entangled with, the harms of overly critical feedback, including job insecurity, low pay, an over-saturated job market, and challenges in balancing family life with academia.19,20
To address one of these concerns, and in attempt to provide clear alternatives to toxic criticism in academia, we need a culture shift. This shift has already begun in many contexts, and requires multiple actors to work together in creating a less individualistic and competitive, and instead a more supportive environment, in which researchers feel that they have a safe space to share their work and ideas. Can we position ourselves as the ‘critical friend’, or indeed the ‘interested listener’ when attending workshops and conferences in which students and early career researchers present? Would this provide greater learning and development for these early career researchers than the disparaging comments that are so often veiled as ‘constructive criticism’, and in turn serve the intended knowledge generation and dissemination that forms the key purpose of academia? Following discussions in our Biometeorology research workshop, we argue that this can be initiated by the people posing questions to researchers, and who represent important role models for future generations of researchers, carefully reflecting on their own positionality when engaging. We present the framework below that we encourage all audience members to consider, and to remain reflexively engaged in. Although this list may, and indeed should, include what is common sense, and may for some be common practice, we encourage people to critically consider when in the audience of any presentation:
1. Why is the speaker there?
Are they being graded for their degree? Are they sharing their work? Are they there to learn? Would they choose to attend this workshop or conference if they knew this was the feedback they would get? Will they want to attend future workshops or conferences if they do receive unreasonably harsh feedback? Remember that, just like you, this speaker is here to share the research that has consumed their days over the past weeks to months to years. Let us retain their excitement to do so. For some, it may be their first experience at a conference or workshop, and perhaps the first time anyone in their family has presented their own research to a specialist audience.
2. Why are you there?
To grade a qualification? To find the gaps or the weaknesses in the work presented? To fuel your curiosity and to learn? In the setting of a workshop or conference, it is most likely the latter. You are attending the workshop to keep up to date on current research, to present your work, and to meet with colleagues in the field. If your role is not to grade a student, or to find gaps in their work, do not impose this task on yourself.
3. What is your level of specific, specialist knowledge?
Some of the time, you will have specialist and specific knowledge far greater than that of the presenter. Often, however, they will be the expert on the nuances of their specific topic. They will be more familiar with which methods are viable and suitable, what data are available, and what the results represent in the local setting. You can learn from them, even if they sit much lower in the academic hierarchy. By all means, ask questions to understand, but if you are not familiar with all the literature on the topic, you probably do not know of a viable better way to conduct a study than the person presenting. Rather than stating that the approach you have thought up is better, ask how their approach considers the various limitations.
4. If it could have been done, it probably would have been
It is very easy to think up hypothetical projects with excellent data sets from the comfort of our seats. Obtaining and working with the data are often far more difficult than we might imagine, if not impossible. As an audience member, your role is not to tell the speaker how to do their study better, but to be curious about their results and interpretations of
the work that has been done. In the same sense, you could positively enquire whether the speaker has ideas about work beyond their study, and express your own willingness to share data and expertise. This fuels both creativity and networking opportunities.
5. It is impossible to convey an entire 8000-word paper in 10 minutes
Conference or workshop presentations are invariably a very short summary of a much longer written paper and of years of research. If the full paper has been published, and you have read it in detail ahead of the presentation – wonderful! If you have not yet had a chance to do so, be mindful that a lot more detail is likely to be contained within it. If a speaker mentions that it is covered in the paper, make a note to go and read the full paper. You could always contact them later on with questions.
6. Do not badger the speaker
In competitive debating, badgering refers to offering so many points of information that the speaker cannot complete their sentence. The adjudicators or chairs will usually intervene. In academic presentations, this is similar to the dreaded ‘follow-up’ question, which is seldom a new question, but the audience member pushing their agenda or point of view over and over again. The speaker, and the rest of the audience, most likely heard and understood you the first time. Allow others to ask their questions. A good chair, similar to a debating adjudicator, will often intervene, but prevention is better than intervention.
7. Are you asking a question just to have your voice heard?
Although we do sometimes need to provide our institutions with proof that we attended a conference, individual presentations should not be treated as an ‘attendance register’. You also are unlikely to demonstrate your expertise in the field through making a ‘comment rather than a question’. If you are raising your hand to prove that you are there, or to demonstrate that you have knowledge of the topic, it probably is not of value to the person presenting or the audience. A more constructive input would be to simply commend the speaker.
8.
be mindful of your choice of words
Remember that just one word can have a profound and long-lasting effect. It should go without saying that telling a person that their work is “rubbish” is not acceptable. But are you not saying something pretty similar if you tell them that their work is “not sophisticated,” that it is “poorly conceived,” or that it is of “little practical value”? These are just a few examples. When raising your hand, think through what you plan to say, and how it could be received. Remember that a person’s past experiences and their cultural background can influence how they both offer and receive feedback, and making a conscious effort to ensure that feedback is not hurtful is important.
Do...
After this long list of ‘don’ts’ you may now feel that it is not safe to engage or ask questions at a conference or workshop, or that you have been ‘silenced’. That is not the aim at all! Critical, reflective and curious listening and engagement is wonderful. So many students and early career researchers are very keen to have an audience of people who really think about their topic, and to show enthusiasm for the work that consumes their everyday. So:
• Do ask questions.
• Do suggest literature that you think is valuable to their work.
• Do, politely, ask why the methods or site of the study were chosen.
• Do ask the researcher to share the limitations of their study and how they addressed these.
• Do ask for clarification on things that you did not completely understand in their talk, bearing in mind that this could stem from your own confusion.
• Do encourage fur ther discussion in the breaks, rather than asking follow-up questions in the session.
• Do listen with curiosity and listen to lear n.
• Do recognise the researcher’s specialist knowledge on the topic; whether that comprises a small or large component of what they are presenting, there will be content that is new to you and the rest of the audience.
• Do reflect on the questions you were asked, whether it was decades ago or earlier that day, and consider which of those really helped you to advance your thinking.
We do also acknowledge the importance of a chair in facilitating a session of a workshop or conference where positive feedback is encouraged, and where problematic feedback is handled appropriately. We therefore also encourage prospective session chairs to reflect on both our lists of ‘dos and don’ts’, and to consider ahead of chairing a session what they might do in response to instances where harsh criticism is raised, researchers are badgered, or language is inappropriate. We do, however, recognise that chairs themselves may well be early career researchers, and that power dynamics may make this difficult.
Finally, this list is intended specifically for the setting of workshops and conferences. Many universities and departments hold internal seminars and presentation days, where the role of the audience members is to evaluate, grade and critique a student’s work. While these questions could similarly be valuable in these settings, the answer for the first two questions would then be yes, and would frame the setting for the subsequent answers. Our aim is to be supportive in the context of current debates, and we welcome further discussion on these issues.
Acknowledgements
We thank the three anonymous readers and the Editor-in-Chief for their thought-provoking comments, and participants in the continued discussions within the Biometeorology group at Wits University regarding constructive modes of research development.
Funding
This work was supported by a University of the Witwatersrand Friedel Sellschop Grant [JFTC022].
Declarations
AI was not used in the writing or editing of this manuscript. All authors contributed to the writing, and read and approved the final manuscript.
Competing interests
We have no competing interests to declare.
r eferences
1. Averbuch T, Eliya Y, Van Spall HG. Systematic review of academic bullying in medical settings: Dynamics and consequences. BMJ Open. 2021;11(7), e043256. https://doi.org/10.1136/bmjopen-2020-043256
2. Tight M. Bullying in higher education: An endemic problem? Tert Educ Manag. 2023;29(2):123–137. https://doi.org/10.1007/s11233-023-09124-z
3. Hellyer HA. These days, academics are some of the biggest classroom bullies. National News. 2022 September 08. Available from: https://www.the nationalnews.com/opinion/comment/2022/09/08/these-days-academics-ar e-some-of-the-biggest-classroom-bullies/
4. Pelletier KL, Kottke JL, Sirotnik BW. The toxic triangle in academia: A case analysis of the emergence and manifestation of toxicity in a public university. Leadership. 2019;15(4):405–432. https://doi.org/10.1177/1742715018773828
5. Roberts-Gregory F. Surviving departmental toxicity: An autoethnographic reflection of navigating gendered and racialized violence in environmental science, policy, and management. Women Gend Fam Color. 2020;8(2):126–133. https://doi.org/10.5406/womgenfamcol.8.2.0126
6. Kis A, Tur EM, Lakens D, Vaesen K, Houkes W. Leaving academia: PhD attrition and unhealthy research environments. PLoS ONE. 2022;17(10), e0274976. https://doi.org/10.1371/journal.pone.0274976
7. Dorenkamp I, Weiß EE. What makes them leave? A path model of postdocs’ intentions to leave academia. High Educ. 2018;75:747–767. https://doi.org/ 10.1007/s10734-017-0164-7
8. Harris AP, González CG. Introduction. In: Muhs GG, Niemann YF, González CG, Harris AP, editors. Presumed incompetent: The intersections of race and class for women in academia. Boulder, CO: University Press Colorado; 2012.
9. Breeze M. Imposter syndrome as a public feeling. In: Taylor Y, Lahad K, editors. Feeling academic in the neoliberal university: Feminist fights, flights and failures. Cham: Palgrave Macmillan; 2018. https://doi.org/10.1007/97 8-3-319-64224-6_9
10. Abdelaal G. Coping with imposter syndrome in academia and research. Biochemist. 2020;42(3):62–64. https://doi.org/10.1042/BIO20200033
11. Fong CJ, Warner JR, Williams KM, Schallert DL, Chen LH, Williamson ZH, et al. Deconstructing constructive criticism: The nature of academic emotions associated with constructive, positive, and negative feedback. Learn Individ Differ. 2016;49:393–399. https://doi.org/10.1016/j.lindif.2016.05.019
12. Feldman Z, Sandoval M. Metric power and the academic self: Neoliberalism, knowledge and resistance in the British university. tripleC. 2018;16(1):214–233. https://doi.org/10.31269/vol16iss1pp214-233
13. Zabrodska K, Linnell S, Laws C, Davies B. Bullying as intra-active process in neoliberal universities. Qual Inq. 2011;17(8):709–719. https://doi.org/10.11 77/1077800411420668
14. Costa AL, Kallick B. Through the lens of a critical friend. Educ Leadersh. 1993;51:49–51.
15. Plotnikof M, Utoft EH. The ‘new normal’ of academia in pandemic times: Resisting toxicity through care. Gend Work Organ. 2022;29(4):1259–1271. https://doi.org/10.1111/gwao.12778
16. Mahmoudi M. Academic bullies leave no trace. BioImpacts. 2019;9(3):129–130. https://doi.org/10.15171/bi.2019.17
17. Tuma TT, Adams JD, Hultquist BC, Dolan EL. The dark side of development: A systems characterization of the negative mentoring experiences of doctoral students. CBE Life Sci Educ. 2021;20(2), ar16. https://doi.org/10.1187/cbe .20-10-0231
18. Kaguhangire-Barifaijo M, Nkata LJ. Collegial cooperation turns toxic: Its depth and breadth: What are the implications for higher education institutions (HEIs)? J Educ Res Rev. 2021;9(2):44–52. https://doi.org/10.33495/jerr_v9i2.20.189
19. Chen S. Leaving academia: Why do doctoral graduates take up nonacademic jobs and to what extent are they prepared? Stud Grad Postdr Educ. 2021;12(3):338–352. https://doi.org/10.1108/SGPE-08-2020-0057
20. Grönlund A. Having it all, or avoiding black holes? Career-family strategies and the choice between leaving or staying in academia among Swedish PhDs. Community Work Fam. 2020;23(5):576–592. https://doi.org/10.1080/1366 8803.2020.1777090
AUTHORS:
Tom A. Moultrie1
Rob E. Dorrington1
AFFILIATION:
1Centre for Actuarial Research, Faculty of Commerce, University of Cape Town, Cape Town, South Africa
CORRESPONDENCE TO: Tom Moultrie
EMAIL: tom.moultrie@uct.ac.za
HOW TO CITE:
Moultrie TA, Dorrington RE. Problems and concerns with the 2022 South African census. S Afr J Sci. 2024;120(7/8), Art. #18585. https:// doi.org/10.17159/sajs.2024/18585
ARTICLE INCLUDES:
☐ Peer review
☐ Supplementary material
KEYWORDS:
census, demography, South Africa, migration, age-sex distribution
PUBLISHED:
31 July 2024
Problems and concerns with the 2022 South African census
A census provides a snapshot of a population at a point in time. In addition to describing the basic demographic and socio-economic characteristics of a population, census data provide denominators for estimating rates; inform resource allocation and policy, development and infrastructural investment; and are used to define sampling frames for other national inquiries. Although the 2022 South African census attempted to correct for a national undercount of over 30%, it was not entirely successful. We identify a number of concerns with the estimates released, which suggest that the data may not be fit for purpose.
Introduction
The 2022 South African census, released on 10 October 2023, estimated the population as 62.03 million in February 2022.1 The Post-Enumeration Survey (PES) report2 revealed the undercount to be 31% (and 72% of the Indian and 62% of the white population groups) – the highest reported by any country and more than double that of the previous census.
An undercount of this magnitude is consequential – not only in terms of the greater uncertainty surrounding estimates of the population size, but also because of the implications for the reliability of estimates for smaller populations, particularly those defined at a granularity finer than the dimensions used to stratify the PES.
The estimated size of the population surprised demographers, both locally and internationally, particularly taking into account the assumed impact of the COVID-19 pandemic on both mortality and migration. Prior to the release of the census, the estimates of the size of the South African population at the date of the 2022 census, based on population projections from a variety of credible sources, ranged from 57.2 million3 to 60.3 million (Stats SA’s mid-year population estimates (MYPE)4).
Even under near-ideal conditions, running a national census is a costly, complex, and logistically demanding undertaking. The US National Academies describe the US Census as the “federal government’s largest and most complex peacetime operation”5. The 2022 South African census is estimated to have cost ZAR3.2 billion.6
Many developed countries are in the process of replacing their national censuses through linking of a variety of essentially complete administrative databases and official registers. However, given the generally poor quality of administrative data in developing countries, such an exercise would be foolish, and censuses take on even greater importance.
While the census offers a snapshot of the demographic and socio-economic characteristics of a country’s inhabitants at a point in time, the census also serves a multiplicity of other purposes. Apart from providing denominators for estimation of rates, it allows us to track changes in the population (and its characteristics) over time; it provides essential data for policy and planning (not least in the spheres of education, health, and infrastructure); it provides the sampling frame for state- and privately funded surveys; and – of particular relevance to South Africa – it is the single-most important constituent of the Equitable Share Formula used to allocate revenue from the National Treasury to the provinces.
This Commentary draws attention to and summarises the most pertinent results of a detailed Technical Report published by the South African Medical Research Council (SAMRC)7 and lays out several concerns with the data that have been released from the 2022 South African census.
Issues with the 2022 South African census
Balance equation (national)
One of the most basic tools for evaluating a census or population projection is the ‘balance equation’. For censuses, the balance equation asserts that if all numbers are correct, the numbers in the current census (nationally, by age, by sex, by province, by population group, etc.) should be equal to those of the previous census, plus the births, less the deaths, plus in-migration less out-migration (i.e. net in-migration) over the intercensal period.
The work of the SAMRC-UCT (University of Cape Town) collaboration8 9 which monitored deaths in South Africa during the COVID-19 pandemic, provides a solid understanding of the number of deaths in South Africa through to 2023. Likewise, the trend in the number of births is relatively well understood based on the results of previous censuses and surveys, analysis of the data on registered births released by Stats SA, as well as births recorded by the District Health Information System (DHIS), each corrected for late or under-reporting. Although the total numbers of intercensal births and deaths remain approximate, they are probably accurate, nationally, to within one hundred thousand.
Using the data published in the 2022 census release1, together with the results from the 2011 census and our estimates of the numbers of intercensal births and deaths in the country, we can reasonably accurately reconstruct the implied dynamics of the South African population over the intercensal period. Table 1 demonstrates this reconstructive process at a national level.
immigration (place of residence) (6)
(7)
Notes, sources, and formulae:
(1) Table 2.11
(2) Own estimate (probably accurate to nearest 100 000)
(3) Own estimate (probably accurate to the nearest 100 000)
(4) (5) - ((1)+(2)-(3))
(5) Table 2.11
(6) Table 3.11; the reported value of in-migration in Limpopo is miscalculated based on the data shown
(7) Own estimate (subtracting estimated survivors of foreign-born identified in the 2011 census from those reported as foreign-born in the 2022 census)
To reconcile the estimates from the two censuses, net immigration (i.e. immigration less emigration) over the intercensal period would have to have been approximately 3.7 million, assuming both census populations were accurately estimated.
Not only does this number seem high given the restriction on travel during the COVID-19 pandemic, but it implies that only 16% of these migrants were identified by the census when asked where they were at the time of the previous census and even fewer (12%) when asked about place of birth. This level of under- and mis-reporting is significantly higher than in the previous intercensal period.
The estimate of the cumulative foreign-born (2.4 m) also stands in stark contrast to the foreign-born populations reported in the 2011 census (2.2 m) or the 1.769 m net immigrants over the period 2011–2021 assumed by Stats SA in their most-recently released population projections and repeated without comment in a report on migration in South Africa which also made extensive use of the 2022 census data.4 10
Comparison with previous census results
A second investigation was to compare the results from the most recent census to those projected from previous censuses. The sources of any observed discrepancy between the two numbers must arise from errors in either or both the census counts, or errors in the estimates of mortality or migration. Consistency in the numbers of the population by age observed in successive censuses, allowing for mortality, points to a general coherence of the data.
In addition, demographers make use of cohort-component projection models to provide a counterfactual population based on assumed patterns and trends in mortality, fertility, and migration. Demographers can estimate these components with reasonable accuracy (less so for migration) by applying an array of demographic techniques11 to data from past censuses, national demographic surveys, and vital registration systems.
Again, consistency between the results of past censuses and population projections with the results from a more recent census increases confidence in the reliability of the more recent census data. Conversely, where the results from a more recent census depart markedly from a coherent and consistent prior set of results and population projections, the reliability of the more recent census is called into question.
National population
Figure 1 shows the national population of South Africa by age as observed in the four post-apartheid censuses, as well as that used by
1: Census 2022 numbers by age compared to numbers projected from past
Table 1: Reconstruction of the South African population using the balance equation, at a national level
Figure
the SAMRC-UCT collaboration to estimate excess COVID-19 deaths, and Stats SA (as released in their MYPE).
There is strong congruence between the estimates of the population (by age in 2022) from previous censuses (up to 2011), allowing for mortality and migration, and the two sets of population projections. The identified undercount of children aged under five in 199611 (who would be aged 26 to 30 in October 2022) is apparent. The MYPEs produced by Stats SA, especially between ages 30 and 39, are somewhat higher (and more in line with those from the 2022 census) than suggested by the SAMRC-UCT population projection. Although the Stats SA methodology for producing their population projections is somewhat opaque, this difference is likely mostly attributable to different assumptions regarding migration.
When one considers the age distribution of the difference between census numbers and those expected from the projection models (Figure 1), it can be observed that only a little more than 40% of the difference is to be found in the typical age range of migration (as evidenced from the previous intercensal period), namely people aged 20–39 at the time of the 2022 census. This again creates doubt as to the reliability of the data provided by the most recent census.
However, there are several other features that are of concern.
The first is an apparent underestimate in the 2022 census of the numbers of children aged 5–9. This is due to an unexplained undercount of children aged 5 last birthday (and if these children were counted at a different age, it was not in the in the 5–9 age group).
A possible explanation for much of the excess of the census estimates over the projections for ages 40+ is provided by a comparison of the census estimates by population group (proportionally reallocating the small numbers recorded as ‘Other’ to the four specified groups) to those projected from past censuses and by the SAMRC-UCT and Stats SA projections in Figure 2.
If one assumes that the excess of the census estimates of the African population over the projections in the age range 20–39 is due to migration unaccounted for by the projections, the estimates from the census for the African and coloured population groups are close to the numbers of the projections. Thus, much of the excess seen in the national population aged 40+ is to be found in the Indian and white population groups.
As noted, the estimated undercount of these two population groups was exceedingly high. It is quite likely that much of the excess of the census above the projections seen at the national level at these ages is due to an over-adjustment for undercount (with the true numbers lying somewhere between the SAMRC-UCT and Stats SA projections). The excess of the census over the projections amounts to 24% of the projected population for the Indian and 14% for the white population group.
Provincial populations
Figure 3 shows the same comparisons for the provinces as that shown for the country in Figure 1. From this we see that the undercount of the 5–9-year-olds is apparent in all provinces and the excesses over age 50 is in all provinces except Gauteng (which is interesting, as this is where it would be most likely to appear if it was due to international migration) and the North West. The comparisons also highlight inconsistencies between the more recent censuses and, particularly, the 1996 and, to a lesser extent, 2001 censuses.
In summary, census 2022 numbers in total are probably reasonable approximations for the Free State, Gauteng, North West and Western Cape, possibly less so for Limpopo and Mpumalanga, and poor estimates for the Eastern Cape (it is improbable that there has been net immigration in the 20-39 age group) and KwaZulu-Natal (overstated for all adult ages), and unknown for the Northern Cape (which has proven difficult to estimate in the past as well).
Issues at a sub-provincial level
The problems identified above manifest even more clearly when one evaluates the data at both district and local municipality levels. The
SAMRC Technical Report identifies several significant anomalies in the sub-provincial data, when compared with
• the district-level results from the 2011 census (which reveals implausible levels of population growth in some of the remotest and least developed parts of the country);
• Stats SA’s district-level MYPE4; and
• the numbers of adults over 18 registered on the voters’ roll at the time of the 2011 and 2021 Local Government Elections.
As before, discrepancies between data from these other sources and the census results at a district level cannot be taken as prima facie evidence of errors in the census; nevertheless, significant differences require investigation in order to understand why or how those differences might have occurred.
The Technical Report explores each of these in greater detail. However, as a single example, the 2022 census population of the Central Karoo District (DC4, in the Western Cape) increased by more than 40% between the 2011 and 2022 censuses; and is more than 35% higher than the MYPE of this district’s population at the census date. Further, within this district, the population aged 18 and over of the Beaufort West local municipality (WC053), which accounts for around 70% of the district’s population, increased by nearly 55% between the censuses, while the number of registered voters increased by only 13% between the two local government elections. Finally, examination of satellite imagery of the growth of the town of Beaufort West over this period indicates that the population growth implied between the two censuses is implausible.
The Post-Enumeration Survey
The United Nations Statistics Division12 recommends that a PES be carried out shortly after a census to estimate the extent of (and, often, to adjust for) a census undercount. Unfortunately, delays in completing the fieldwork meant that the 2022 South African PES was run several months (rather than weeks) after the census date.
With the 31% undercount, the PES-derived weights are doing much more heavy lifting in producing an estimate of the population in 2022. In other words, in the 2022 census, the population estimates are far more affected by the adjustment factors applied than in previous censuses. And, while it is the case that all PES-adjusted population results are estimates rather than counts of the population, the extent of the adjustment required in the 2022 census makes this observation all the more salient.
Our key concern in this regard is illustrated by a comparison of data from the PES reports from the 2011 and 2022 censuses.2 13
From Table 2, we note that the undercount standard errors (UC SEs) from the PES data are, as might be expected, markedly higher in 2022 than they were in 2011. Based on the PES, the 95% confidence interval for the national undercount in 2011 was narrow (14.34%; 14.86%). In 2022, the equivalent interval was much wider (27.99%; 31.21%). However, when it comes to the standard errors of the population corrected for the undercount, the uncertainty surrounding the census estimate for 2022 all but disappears, nationally, and is only higher (relative to 2011) in the 2022 census in the Western Cape and comparable (but still lower) in KwaZulu-Natal and Gauteng.
In short, it is difficult to understand how it can be that the two censuses (2011 and 2022) had broadly equivalent PES sampling fractions, but with the undercount in 2022 about twice as high, one can be 95% certain that the true size of the population is within 235 000 of the estimated population size, whereas in 2011, one could only be 95% certain that the true population was within 1.955 million either side of the estimated population size. In the absence of any other explanation, this suggests a computational error in the derivation of the standard errors for the population in the more recent census.
Conclusions
Despite official pronouncements to the contrary, there is sufficient doubt about the quality and content of the data produced by Stats SA from the 2022 census to conclude that – as they currently stand – the data, at least in terms of numbers of people, may not be fit for purpose to assist with fiscal allocation, or for national, provincial, or local government planning and resource allocation. In addition, other important demographic data, inter alia on fertility, mortality, and migration, have not yet been released.
Although the investigation is at this stage, perforce, preliminary, it would appear that the population of South Africa may have been overestimated by as much as a million people, with about half of that number accounted for by significant overestimates of the white and Indian/Asian populations, particularly. Furthermore, this overall excess is concentrated in the age groups aged 50 and over – an age range
unlikely to have been affected by substantial in-migration and appears to be a little higher for men than women.
While a full analysis of all the factors that may have contributed to the poor execution of the 2022 census is beyond the scope of the current work, and would require access to internal documents that are not in the public domain, it is nonetheless possible to identify some of the factors that impeded the successful conduct of the census.
SARS-CoV-19 was first detected in South Africa in March 2020, which resulted in lockdowns of variable severity and repeated waves of infection and excess mortality that lasted until mid-2022. Although it is not clear to what extent preparations for a census in October 2021 were on track in March 2020, there is no doubt that the outbreak of the COVID19 pandemic was a major interruption to the process, forcing Stats SA to delay the census.
White
Figure 2: Census 2022 numbers (in thousands) by age compared to numbers projected from past censuses and models, by population group.
Figure 3: Census 2022 numbers (in
Table 2: Estimates of the undercount (UC) and their standard errors (UC SE), and estimates of the population and their standard errors (SE), for South Africa and its provinces, for 2011 and 2022
Had they been consulted, most demographers would have strongly motivated for the census to be deferred to 10 October 2022, or even 10 October 2023, to ensure that processes and implementation were not rushed, that it was on an anniversary of previous censuses, and that the census took part when the population was most stable (in terms of migration and other interruptions).
Unfortunately, the threat of the withdrawal of funding by National Treasury6 14 if the census was not undertaken in the financial year ending March 2022, offered Stats SA Hobson’s choice – either carry out the census in that financial year or lose the funding for the census, possibly to 2031. Thus, Stats SA was forced to undertake the census while not ready to do so, and entered the enumeration period in a state of significant unreadiness.
Both public and private sectors should exercise caution in drawing policy conclusions or making long-term plans based on these data. We are particularly concerned that – as they currently stand – the estimates of the population (by age, sex, province, population group) may lead to significant misallocation of resources through (for example) the Equitable Share Formula, or of education and health resources at national, provincial, or local government levels.
There is an urgent need to produce alternative population estimates that better describe the South African population in the mid-2020s than those in the census 2022 data. Those estimates might then be used to inform evidence-based resource allocation and planning in order to benefit the lives of all South Africans.
Declarations
We did not use AI in the writing of this article. Both authors read and approved the final manuscript.
Competing interests
We have no competing interests to declare.
References
1. Statistics South Africa. Census 2022 statistical release. Report P0301.4. Pretoria: Statistics South Africa; 2023. Available from: https://census.statssa.gov.za/asset s/documents/2022/P03014_Census_2022_Statistical_Release.pdf
2. Statistics South Africa. Post-enumeration survey statistical release. Report P0301.5. Pretoria: Statistics South Africa; 2023. Available from: https://cens us.statssa.gov.za/assets/documents/2022/P030152022.pdf
3. GBD 2021 Demographics Collaborators. Global age-sex-specific mortality, life expectancy, and population estimates in 204 countries and territories and 811 subnational locations, 1950–2021, and the impact of the COVID-19 pandemic: A comprehensive demographic analysis for the Global Burden of Disease Study 2021. Lancet. 2024;403(10440):1989–2056. https://doi.org/ 10.1016/S0140-6736(24)00476-8
4. Statistics South Africa. Mid-year population estimates, 2022. Report P0302. Pretoria: Statistics South Africa; 2022. Available from: https://www.statssa.g ov.za/publications/P0302/P03022022.pdf
5. US National Research Council. The 2000 census: Counting under adversity. Washington DC: National Academies Press; 2004. https://doi.org/10.1722 6/10907
6. Parliamentary Monitoring Group. Briefing by Statistician-General on the census 2022 results [webpage on the Internet]. c2023 [cited 2024 May 15]. Available from: https://pmg.org.za/committee-meeting/37818/
7. Moultrie TA, Dorrington R. The 2022 South African census. Cape Town: South African Medical Research Council; 2024. Available from: https://www.samrc .ac.za/research-reports/2022-south-african-census
8. Bradshaw D, Dorrington R, Laubscher R, Groenewald P, Moultrie T. COVID-19 and all-cause mortality in South Africa – the hidden deaths in the first four waves. S Afr J Sci. 2022;118(5/6), Art. #13300. https://doi.org/10.17159 /sajs.2022/13300
9. Bradshaw D, Dorrington RE, Laubscher R, Moultrie TA, Groenewald P. Tracking mortality in near to real time provides essential information about the impact of the COVID-19 pandemic in South Africa in 2020. S Afr Med J. 2021;111(8):732–740. https://doi.org/10.7196/SAMJ.2021.v111i8.15809
10. Statistics South Africa. Migration profile report for South Africa. Report 03-09-17. Pretoria: Statistics South Africa; 2024. Available from: https://ww w.statssa.gov.za/publications/03-09-17/03-09-172023.pdf
11. Dorrington RE. Who was counted in? Some possible deficiencies with the 1996 South African census results. Paper presented at: Actuarial Society of South Africa Convention; 1999 November 2–3; Johannesburg, South Africa.
12. UN Statistics Division. Post-enumeration surveys: Operational guidelines [Technical Report]. New York: United Nations Statistics Division; 2010.
13. Statistics South Africa. Post-enumeration survey. Report 03-01-46. Pretoria: Statistics South Africa; 2012. Available from: http://www.statssa.gov.za/cens us/census_2011/census_products/Census_2011_PES.pdf
14. Statistics South Africa. Annual report 2022/23 (Book 1). Pretoria: Statistics South Africa; 2023. Available from: https://www.statssa.gov.za/publications/ AnnualReport/StatisticsSouthAfricaAnnualReport202223_Book1.pdf
AUTHORS: Mukhtaar Waja1 Ogone Motlogeloa1
AFFILIATION:
1School of Geography, Archaeology, and Environmental Studies, University of the Witwatersrand, Johannesburg, South Africa
CORRESPONDENCE TO: Mukhtaar Waja
EMAIL: mukhtaarwajanew@gmail.com
HOW TO CITE:
Waja M, Motlogeloa O. The need for robust research methodology when studying climate and health in developing countries: Comments on Trickey et al. (AIDS Behav. 2024;28:1752–1765). S Afr J Sci. 2024;120(7/8), Art. #18588. https:// doi.org/10.17159/sajs.2024/18588
The need for robust research methodology when studying climate and health in developing countries: Comments
on Trickey et al. (AIDS Behav. 2024;28:1752–1765)
Significance:
A paper recently published in AIDS and Behavior on 20 February 2024, authored by Trickey et al.1, argues that drought potentially increases HIV (Human Immunodeficiency Virus) transmission in sub-Saharan Africa. They established a positive correlation between drought, poverty, sexual behaviour, and HIV contraction. The study’s methodology is problematic, and does not consider key confounding factors, utilises data which is subject to biases, and utilises inappropriate means to define drought. We do not dispute the possibility that links exist between these variables, but assert that the data and methods used in this study are insufficient to support such a claim.
Introduction
Research on the impact of climate change on disease transmission in developing countries is of great value to policymakers, and to the scientific community at large. The value inherent in such research requires that, when undertaking this research, the researchers utilise carefully considered methodology, consider and adjust for confounding factors, and engage critically with the data used in the study. In this Commentary, we argue that, given the significance of their findings, the methodology utilised by Trickey et al.1 in their study investigating the associations between drought, poverty, high-risk sexual behaviours, and HIV incidence in sub-Saharan Africa, should be more robust, and that the study fails to engage with several important factors that may have impacted the study findings.
Trickey et al.1 hypothesise that drought increases poverty, and that increased poverty may lead individuals to engage in risky sexual practices – such as transactional and/or intergenerational sex, and sex without the use of contraception – leading to higher rates of HIV (Human Immunodeficiency Virus) transmission. To test this hypothesis, data on HIV prevalence, socio-economic status, age, gender, and sexual behaviour were compiled from five Population-Based HIV Impact Assessment (PHIA) surveys conducted in 2016 in Eswatini, Lesotho, Tanzania, Uganda, and Zambia.1 The survey data were then geospatially compared with gridded precipitation data for each area for 2014 to 2016, which was acquired from the Climate Hazards Group InfraRed Precipitation with Station Data (CHIRPS).1 Multivariable logistic regression was then used to examine the associations between drought and poverty, wealth quantile and sexual behaviour, sexual behaviour and recent contraction of HIV, and drought and recent HIV contraction. While we do not dispute that drought has a significant impact on poverty2 3, the logical steps that follow this require far more robust analysis. We unpack the issues inherent in this methodology.1
Defining drought and poverty
Curiously, Trickey et al.1 did not utilise a drought index to define drought, and instead chose to classify drought conditions by comparing the precipitation data for 2014-2016 to rainfall levels for historical 2-year periods ranging from 1981 to 2016. Trickey et al.1 justify the decision as a measure of the threshold below which a deficit in rainfall becomes severely detrimental to agricultural production and yield.4 We argue that an official drought index, such as the standardised precipitation index (SPI), would have been more appropriate. The SPI would work well for such a study as the only climatic input variable it requires is precipitation, and the index is suitable for monitoring drought over a 2-year timescale.5 Furthermore, the World Meteorological Organization (WMO) recommends that the SPI be used for classifying drought events.6 7 Trickey et al.1 do not provide clear justification for not having used a wellestablished drought index.
A key variable in this study – poverty – is a multidimensional concept, which must be clearly defined to be accurately measured.8 Several issues make measuring poverty difficult8, but Trickey et al.1 do not sufficiently explain how these issues were addressed. Such a complex and important variable requires greater engagement.
Internal validity
The internal validity of the study is compromised by the failure to account for key confounding factors.9 Trickey et al.1 define and examine drought periods in their research, but do not control for non-drought periods, as they do not outline the HIV prevalence, poverty rates, and sexual behaviour of the population during periods without drought. Thus, a baseline is not established against which to compare the study findings, so that conclusions about the significance of the findings can be formed. A stronger correlational relationship could have been developed if non-drought periods were considered as a control variable, strengthening the internal validity of the study.
The study also does not consider the lag period between the onset of a drought event and the impact of drought on the population.10 A lag period is critical to establish for a study of this nature, because the effects of drought would not occur immediately, but would develop over time.10 A decrease in rainfall would not instantaneously cause food shortages, nor would the population’s response to food shortages – such as turning to transactional
2024. The Author(s). Published under a Creative Commons Attribution Licence.
Commentary
sex to access resources – occur as soon as food shortages begin. Additionally, the study does not account for the lag period between an individual contracting HIV and being tested for HIV, weakening the notion that the study examines HIV incidence as opposed to prevalence. While it is possible to calculate a lag period between the onset of a drought event and the agricultural and socio-economic effects of the drought11, it is much more difficult to establish an average lag period between contracting and testing for HIV. Furthermore, an increase in reported HIV cases does not necessarily reflect an increase in HIV incidence, but is more likely a symptom of increased testing in the region. Research on complex issues such as extreme weather events and disease transmission should consider as many confounding variables as is practical, so that the research methodology – both the data collection and analysis – can be designed to address these variables appropriately.
Statistical analysis
Having explained the need to establish a lag period between the onset of drought and the impacts of drought on the human population10, one can then understand why a multivariate logistic regression model is not the most appropriate method for analysing the impact of drought on HIV, poverty, and sexual behaviour, and why a distributed lag non-linear model (DNLM) would be more appropriate. DNLMs are statistical models which can be used to examine statistical correlations between variables, where one variable has a delayed effect on another variable – i.e. where a lag period is involved.12 DNLMs are appropriate for research within climate and health, where environmental stressors (a drought) often present a delayed effect on human health (HIV).12 13 Utilising a DNLM would allow for a better handling of the complexity of this research, its multiple variables, and confounding factors. The authors do not provide a clear rationale for the use of more simplistic statistical approaches, as opposed to the methods used currently within the discipline of climate and health.
Flaws within the data set
While the data analysis of this research study could be improved, we also argue that certain elements of the data are problematic. The study utilises cross-sectional data, which is inadequate for testing a causal hypothesis, as it does not account for time intervals.14 Trickey et al.1 also utilise gridded precipitation data from CHIRPS for Eswatini, Lesotho, Tanzania, Uganda, and Zambia, but have conducted no ground validation or further independent analysis6 of the climate of these topographically diverse and climatically distinct regions. The data utilised for this study, and as a result the study findings, could be made more reliable if the precipitation data acquired from CHIRPS were supported by independent climatological analysis, validating the data set, and displaying a comprehensive engagement with the data and the study sites.
Data on HIV prevalence, socio-economic status, sexual behaviour, age, and gender were acquired from PHIA surveys, and accompanying HIV tests were conducted by the survey staff.1 The aim of the study is to examine the relationship between drought and HIV incidence, but the authors use data on positive HIV tests, which does not reflect incidence. It is suggested that, through the HIV tests, it is possible to recognise when a person has recently contracted HIV based on the individual’s optical density and the suppression of their viral load, but the study does not provide any way to conclusively state when any of the participants contracted HIV, which weakens the reliability of the correlational analysis the study attempts to establish, due to the aforementioned uncertainties in the lag period.
Furthermore, self-reported survey data are subject to several biases which weaken their reliability15, and Trickey et al.1 acknowledge that social desirability bias and recall bias may have influenced survey responses. Due to the sensitive nature of the survey questions – with questions focusing on HIV and sexual practices – we argue that social desirability bias would be a major concern.15 Trickey et al.1 also suggest that some participants may not have fully understood certain concepts – such as transactional sex – or may not have viewed these concepts in the same manner as they were defined in the study, further weakening the validity of the data set used in this study.
Conclusion
Scientific rigour is important in such research because of the impact of the research on the populations studied. The populations of sub-Saharan Africa are highly vulnerable to the adverse effects of climate change, and to the threat of diseases such as HIV, and are thus an important population to study – but this research must maintain scientific rigour if it is to be beneficial. In this Commentary, we have highlighted the ways in which a study can fail to engage comprehensively and critically with the data being collected and analysed, the sites being studied, and the models and methods being used to develop the research findings. When engaging in research with the potential to influence policy decisions and future research, it is the responsibility of the researcher to ensure that the research is conducted correctly, and with consideration for the population under study. If there is a perception that HIV infections decrease under non-drought conditions, it is possible that this perception may profoundly impact human behaviours that affect HIV transmission, healthcare preparedness, and policy interventions.
Acknowledgements
Professor Jennifer Fitchett is acknowledged for facilitating early critical discussions pertaining to the writing of the manuscript. The anonymous readers and SAJS editorial team are acknowledged and thanked for their constructive feedback on the first draft of this manuscript.
Declarations
AI was not used in the writing of this manuscript. Both authors read and approved the final manuscript.
Competing interests
We have no competing interests to declare.
References
1. Trickey A, Johnson LF, Bonifacio R, Kiragga A, Howard G, Biraro S, et al. Investigating the associations between drought, poverty, high-risk sexual behaviours, and HIV incidence in sub-Saharan Africa: A cross-sectional study. AIDS Behav. 2024;28:1752–1765. https://doi.org/10.1007/s10461-0 24-04280-8
2. Pape UJ, Wollburg PR. Impact of drought on poverty in Somalia. World Bank Policy Research Working Paper no. 8698. Washington DC: World Bank; 2019. https://doi.org/10.1596/1813-9450-8698
3. Udmale PD, Ichikawa Y, Manandhar S, Ishidaira H, Kiem AS, Shaowei N, et al. How did the 2012 drought affect rural livelihoods in vulnerable areas? Empirical evidence from India. Int J Disaster Risk Reduct. 2015;13:454–469. https://doi.org/10.1016/j.ijdrr.2015.08.002
4. Burke M, Gong E, Jones K. Income shocks and HIV in Africa. Econ J. 2015;125(585):1157–1189. https://doi.org/10.1111/ecoj.12149
5. Tirivarombo S, Osupile D, Eliasson P. Drought monitoring and analysis: Standardised precipitation evapotranspiration index (SPEI) and standardised precipitation index (SPI). Phys Chem Earth Parts A/B/C. 2018;106:1–10. https://doi.org/10.1016/j.pce.2018.07.001
6. Fitchett JM. On defining droughts: Response to ‘The ecology of drought –a workshop report’. S Afr J Sci. 2019;115(3–4), Art. #5910. https://doi.org /10.17159/sajs.2019/5910
7. World Meteorological Organization. Standardised precipitation index user guide. WMO-no. 1090. Geneva: World Meteorological Organization; 2012.
8. Thorbecke E. Multidimensional poverty: Conceptual and measurement issues. In: Kakwani N, Silber J, editors. The many dimensions of poverty. Hampshire: Palgrave Macmillan; 2007. p. 3–19. https://doi.org/10.1057/9 780230592407_1
9. Cahit K. Internal validity: A must in research designs. Educ Res Rev. 2015;10(2):111–118.
10. Choubin B, Soleimani F, Pirnia A, Sajedi-Hosseini F, Alilou H, Rahmati O, et al. Effects of drought on vegetative cover changes: Investigating spatiotemporal patterns. Extreme Hydrol Clim Var. 2019:213–222. https://doi.org/10.1016/B 978-0-12-815998-9.00017-8
11. Ji Y, Li Y, Yao N, Biswas A, Zou Y, Meng Q, et al. The lagged effect and impact of soil moisture drought on terrestrial ecosystem water use efficiency. Ecol Indic. 2021;133, Art. #108349. https://doi.org/10.1016/j.ecolind.2021.108349
12. Gasparrini A, Armstrong B, Kenward MG. Distributed lag non‐linear models. Stat Med. 2010;29(21):2224–2234. https://doi.org/10.1002/sim.3940
13. Logar-Henderson C, Ling R, Tuite AR, Fisman DN. Effects of large-scale oceanic phenomena on non-cholera vibriosis incidence in the United States: Implications for climate change. Epidemiol Infect. 2019;147, e243. https://d oi.org/10.1017/S0950268819001316
14. Kesmodel US. Cross‐sectional studies – what are they good for? Acta Obstet Gynecol Scand. 2018;97(4):388–393. https://doi.org/10.1111/aogs.13331
15. Tourangeau R, Yan T. Sensitive questions in surveys. Psychol Bull. 2007; 133(5):859–883. https://doi.org/10.1037/0033-2909.133.5.859
AUTHORS:
Adam Trickey1
Leigh F. Johnson2
Rogerio Bonifacio3
Agnes Kiragga4
Guy Howard5
Samuel Biraro6
Thorsten Wagener7
Andrea Low8
Peter Vickerman1 9
AFFILIATIONS:
1Population Health Sciences, University of Bristol, Bristol, UK
2Centre for Infectious Disease Epidemiology and Research, School of Public Health and Family Medicine, University of Cape Town, Cape Town, South Africa
3Geospatial Analysis Unit, World Food Programme, Rome, Italy
4Research Department, Infectious Diseases Institute, College of Health Sciences, Makerere University, Kampala, Uganda
5Department of Civil Engineering and Cabot Institute of the Environment, University of Bristol, Bristol, UK
6ICAP at Columbia University, Nakasero, Kampala, Uganda
7Institute of Environmental Science and Geography, University of Potsdam, Potsdam, Germany
8Department of Epidemiology, Mailman School of Public Health, Columbia University, New York, USA
9NIHR Health Protection Research Unit, Behavioural Science and Evaluation, University of Bristol, Bristol, UK
CORRESPONDENCE TO: Adam Trickey
EMAIL: adam.trickey@bristol.ac.uk
HOW TO CITE:
Trickey A, Johnson LF, Bonifacio R, Kiragga A, Howard G, Biraro S, et al. Response to Waja and Motlogeloa (2024): The need for robust research methodology when studying climate and health in developing countries.
S Afr J Sci. 2024;120(7/8), Art. #18818. https://doi.org/10.17159/sa js.2024/18818
ARTICLE INCLUDES:
☐ Peer review
☐ Supplementary material
KEYWORDS: drought, poverty, sexual behaviours, HIV, sub-Saharan Africa
when studying climate and health in developing countries
Significance:
We clarify several areas of misunderstanding raised by Waja and Motlogeloa’s (S Afr J Sci. 2024;120(7/8), Art. #18588) critique of our previous publication analysing the associations between drought and acquiring HIV in several countries in sub-Saharan Africa.
We thank Mukhtaar Waja and Ogone Motlogeloa for their critique1 of our analysis2 looking at the associations between drought, poverty, sexual behaviours, and HIV acquisition in sub-Saharan Africa. Their review has highlighted several difficulties in investigating the associations between an exposure and an outcome that are separated by many links in a possible causal pathway. Such projects require working in a cross-disciplinary field to combine expertise in both climate science and the epidemiology of HIV, as well as using the best available data.
We used publicly available data from five nationally representative Population-Based HIV Impact Assessment (PHIA) surveys conducted in Eswatini, Lesotho, Tanzania, Uganda, and Zambia during 2016, which included data on 102 081 adults. These are bio-behavioural surveys containing questionnaires and HIV testing. We combined these HIV survey data with gridded precipitation data from the Climate Hazards Group InfraRed Precipitation with Station (CHIRPS) data that compared the rainfall from mid-2014 to mid-2016 with the equivalent rainfall from 1981 to 2016 in each location, defining a drought in this period if the rainfall was less than the 15th percentile compared with all other 2-year periods.
Waja and Motlogeloa argue that we could have instead used the standardised precipitation index (SPI) to define droughts, which is a good suggestion. However, their argument that the World Meteorological Organization (WMO) recommends that the SPI be used for classifying drought events and that it is “an official” drought index is not entirely accurate. The WMO recommends the use of SPI as a benchmark tool for defining drought3 as it only requires precipitation as input and is, therefore, easy to calculate. The WMO also states in their Handbook of Drought Indicators and Indices, “Just as there is no ‘one-size-fits-all’ definition of drought, there is no single index or indicator that can account for and be applied to all types of droughts, climate regimes and sectors affected by droughts.”3 There are often alternative options when considering which data to use, with choices made for a variety of reasons. We chose this metric to align with previous research by the Vulnerability Analysis and Mapping Geospatial Analysis Team at the Analysis and Trends Service of the World Food Programme.4 Additionally, the measure we used is nearly functionally equivalent to a commonly used SPI-based definition of drought as SPI < 1. The PHIA and CHIRPS data sets are all publicly available, so we welcome others to investigate the associations using these data.
It was suggested by Waja and Motlogeloa that the combination of the CHIRPS data could have been made more reliable had we conducted a ground validation of the climate at the study sites. It is not realistic to require that every study should perform ground validation on all data regarding climate measures through independent climatological analyses, as this would be an enormous drain on resources. We suggest that this validation should be done in studies focusing on the attributes of a specific climate data set. Of particular note is that the CHIRPS data set is extensively used and relied upon by a number of international agencies working on early warning and drought monitoring, such as the Famine Early Warning Systems Network, the World Food Programme, the Food and Agriculture Organization, among others.
We agree with Waja and Motlogeloa’s statement that poverty can be problematic to define, particularly across multiple countries. Waja and Motlogeloa state that several issues make measuring poverty difficult and that we did not sufficiently explain how these issues were addressed. Unfortunately, they did not state what specific issues they were referring to, so we are unable to address them here. To summarise, we used a relative measure of poverty (wealth quintiles, with these quintiles calculated separately for each survey country) because an absolute measure of poverty was unavailable within this data source. We feel using this measure is justifiable because purchasing power is usually assessed relative to the setting, and so we think our measure is suitable for an analysis including data from five countries.
In their Commentary, Waja and Motlogeloa critique our analysis for not having defined non-drought control periods and, separately, for using cross-sectional data. Unfortunately, non-drought control periods cannot be constructed using cross-sectional surveys as data on the participants are only available for one point in time. We acknowledged the weaknesses of using cross-sectional data in our limitations section. If they were available, we would be keen to perform similar analyses on longitudinal data sets that contained information on important variables such as poverty, food insecurity, sexual risk behaviour, and HIV transmission. Although imperfect, we believe the methods we utilised are useful for raising hypotheses that can be tested in other data sets. The authors also state that we did not consider the lag period between the onset of a drought event and the impacts this would have on things such
as crop production, and then on poverty and other factors in our model. Across many areas of southern Africa, the mid-2014 to mid-2016 period stands out as one of the driest 2-year periods on record, containing two consecutive seasons affected by drought (2014–2015 and 2015–2016).4 Given that populations had already been affected by a first drought, the impacts of the second drought were felt with a very short lag4, and so we feel our model should be valid. On a related note, Waja and Motlogeloa also suggest that distributed lag non-linear models (DNLMs) would be more appropriate than multivariable logistic regression models, as they would account for the lag between the exposure and outcome. However, in the data we used, we could not attribute a precise enough date to these drought periods because they entailed a major reduction in precipitation over a 2-year period (mid-2014 to mid-2016). This long-term exposure contrasts with climatic events such as heatwaves, floods, or hurricanes, which are acute exposures, and it is easier to define when they happened. DNLMs require exact time-exposure information, which is unavailable here, so these models could not have been used.
The authors also criticise our approach for not accounting for the lag period between an individual acquiring HIV and being tested for HIV, as well as pointing out that an increase in reported cases of HIV could just be due to increased testing. This would be a valid criticism if we were relying on routine HIV testing data collected over time, but we utilised a cross-sectional survey that tested all respondents for HIV regardless of their diagnosis status, and identified individuals who had recently acquired HIV based on additional tests. When using routine clinical testing to assess trends in HIV incidence over time, the lags between people acquiring and testing for HIV can be an issue, as is the reporting of HIV cases reflecting testing patterns. However, these are non-issues for this bio-behavioural survey.
Furthermore, Waja and Motlogeloa repeatedly use the terms “HIV prevalence” and “recent HIV contraction” interchangeably throughout their critique, but these are distinct concepts, and this is crucial to understanding our analysis. The PHIA survey data contained a marker of having recently acquired HIV using the HIV-1 Limiting Antigen Avidity enzyme immunoassay, which is effective at determining whether someone acquired HIV within the few months prior to the test.5 People who tested positive for prevalent HIV using standard assays could have acquired HIV many years before a drought occurred. However, the people in our study who tested positive for having recently acquired HIV, would have acquired HIV after or during the drought period.
As with all data, these surveys have limitations, which we acknowledged in our manuscript. These include the dependence on self-reported data for determining wealth and sexual behaviour. However, when capturing data on sexual behaviours in particular, there is little alternative but to use self-reporting. The survey staff underwent 2-month training programmes, as well as refresher training sessions, regarding the potential biases and ways that such surveys should be conducted to mitigate these issues; for example, interviewing each survey participant separately from their other household members. Several of the study’s authors were involved in the organisation and collection of PHIA data and advised on the appropriate use and interpretation of these data sets.
These enormous, nationally representative PHIA surveys are widely used by national, regional, and global policymakers to understand both HIV prevalence and HIV incidence in sub-Saharan Africa6,7, as well as to assess the characteristics and prevalence of risk behaviour within these populations.
To conclude, although Waja and Motlogeloa’s critique of our work contains several areas of misunderstanding, they do also highlight the general limitations of this type of work with the currently available data. Ideally, future studies should use longitudinal data to improve the strength of evidence for the causal pathway between climate events and the epidemiology of HIV, to enable a better understanding of the potential pathways linking the two.
Declarations
AI was not used in the writing of this manuscript. All authors read and approved the final manuscript.
Competing interests
We have no competing interests to declare.
References
1. Waja M, Motlogeloa O. The need for robust research methodology when studying climate and health in developing countries: Comments on Trickey et al. (AIDS Behav. 2024;28:1752–1765). S Afr J Sci. 2024;120(9/10), Art. #18588. https://doi.org/10.17159/sajs.2024/18588
2. Trickey A, Johnson LF, Bonifacio R, Kiragga A, Howard G, Biraro S, et al. Investigating the associations between drought, poverty, high-risk sexual behaviours, and HIV incidence in sub-Saharan Africa: A cross-sectional study. Aids Behav. 2024;28:1752–1765. https://doi.org/10.1007/s10461-0 24-04280-8
3. World Meteorological Organization, Global Water Partnership. Handbook of drought indicators and indices. Geneva: World Meteorological Organization; 2016. https://www.droughtmanagement.info/literature/GWP_Handbook_of_ Drought_Indicators_and_Indices_2016.pdf
4. World Food Programme. Southern Africa growing season 2016–2017: Recovery after two years of drought? [document on the Internet]. c2016 [cited 2024 May 22]. Available from: http://documents.wfp.org/stellent/grou ps/public/documents/ena/wfp289520.pdf
5. Lau JKO, Murdock N, Murray J, Justman J, Parkin N, Miller V. A systematic review of limiting antigen avidity enzyme immunoassay for detection of recent HIV-1 infection to expand supported applications. J Virus Erad. 2022;8(3), Art. #100085. https://doi.org/10.1016/j.jve.2022.100085
6. UNAIDS. Data for impact: How UNAIDS data is guiding the world to end AIDS. Geneva: Joint United Nations Programme on HIV/AIDS; 2022. Available from: https://www.unaids.org/sites/default/files/media_asset/how-UNAIDS-data-i s-guiding-the-world-to-end-AIDS_en.pdf
7. US Centers for Disease Control and Prevention. PHIA Surveys: A new approach to help countries control their HIV epidemics. Atlanta, GA: US Centers for Disease Control and Prevention; 2018. Available from: https:// www.cdc.gov/globalhivtb/who-we-are/resources/keyareafactsheets/phia.pdf
AUTHORS:
Shaun Govender1
Olive P. Khaliq2
Raveen Naidoo3
Jagidesa Moodley4
AFFILIATIONS:
1KwaZulu-Natal College of Emergency Care, Durban, South Africa
2Department of Paediatrics and Child Health, School of Clinical Medicine, Faculty of Health Sciences, University of the Free State, Bloemfontein, South Africa
3Directorate: Emergency Medical Services & Disaster Medicine, National Department of Health, Pretoria, South Africa
4Women’s Health and HIV Research Group, Department of Obstetrics and Gynaecology, Faculty of Health Sciences, University of KwaZuluNatal, Durban, South Africa
CORRESPONDENCE TO: Shaun Govender
EMAIL: shaun.govender3@kznheath.gov.za
DATES:
Received: 15 May 2023
Revised: 10 Apr. 2024
Accepted: 15 May 2024
Published: 31 July 2024
HOW TO CITE:
Govender S, Khaliq OP, Naidoo R, Moodley J. The current state of emergency medical services in South Africa: A review. S Afr J Sci. 2024;120(7/8), Art. #16138. https:// doi.org/10.17159/sajs.2024/16138
ARTICLE INCLUDES:
☒ Peer review
☐ Supplementary material
DATA AVAILABILITY:
☐ Open data set
☐ All data included
☐ On request from author(s)
☐ Not available
☒ Not applicable
EDITORS: Pascal Bessong
Shane Redelinghuys
KEYWORDS: emergency medical services, EMS, paramedic, prehospital, emergency care provider, South Africa
FUNDING: None
The current state of emergency medical services in South Africa: A review
Emergency medical services (EMS) are a vital component of the health system and provide pre-hospital emergency care and specialised transport for patients requiring access to health facilities, thereby contributing to universal health coverage and improving health outcomes. Evidence regarding the current state of EMS within South Africa to fulfil this role is lacking and was the motivation for this review. Our objective was to describe the current state of EMS in South Africa. A literature search was conducted using keywords, BOOLEAN operating terms, and eligibility criteria on Sabinet, EBSCOhost, Google Scholar, ProQuest, Medline, PubMed, and ScienceDirect databases to find articles related to the components of the EMS system in South Africa. The articles were critically assessed, and six themes emerged: leadership and governance; resources; preparedness (knowledge, attitude, and practices) of the emergency care provider; health and safety; training; and communications. Challenges were found in all themes at a provincial EMS level despite improvements in legislation, leadership, and governance from the National Department of Health. These themes demonstrate that all components in the EMS system are not functioning optimally and may be affecting its contribution to improving universal health coverage and health outcomes. The current state of EMS appears to be constrained and requires greater leadership and governance from the Provincial Departments of Health to improve poorly functioning components of the EMS system.
Significance:
The current state of EMS in South Africa lacks efficiency in its role to provide emergency care and transportation for patients wanting to access health facilities. Poorly functioning components of the EMS system have been identified and provide an opportunity for health authorities to make improvements so that the goal of universal health coverage and improved health outcomes can be realised.
Introduction
Inequalities in health infrastructure, inequitable access to services1 and the burden of disease (identified through communicable and non-communicable diseases, injury, mental health, and maternal and child health)2 remain healthcare challenges in South Africa. These challenges also exist globally, prompting the World Health Organization (WHO) to advocate for additional efforts to improve health care to “the most disadvantaged, marginalised and hardto-reach populations, to ensure that no one is left behind”3. The WHO recommended that emergency services, also known as emergency medical services (EMS), be integrated into the health system to improve patient access to the appropriate level of care.3
In South Africa, the Integrated Healthcare Delivery Platform (Figure 1) is the model used.4 This model promotes the relationship between Core Health Services, Support Services (linked to the WHO health system building blocks)5, and Linkage Services which is expected to yield improved health outcomes. Integrating EMS with other health services improves universal health coverage, keeping with the recommendation of the WHO.3 The role of EMS within this model is to provide efficient emergency care and transport for patients requiring access to Core Health Services.4
While the EMS in South Africa is going through reform in emergency care education6 and clinical practice7, complaints and challenges of service delivery have also been noted8. In trying to understand the effectiveness of EMS in the integrated healthcare delivery model, our research question was developed: What is the current state of EMS in South Africa? There is a paucity of information to answer this research question, therefore we explored the current state of EMS in South Africa and make recommendations. The review approach was used to identify, analyse and learn from existing published South African EMS studies and to provide a background and context for subsequent studies.
Method
We conducted a literature search of Sabinet, EBSCOhost, Google Scholar, Proquest, Medline, PubMed, and ScienceDirect databases using the following keywords: ‘emergency medical service’, ‘EMS’, ‘paramedic’, ‘prehospital’, ‘pre-hospital’ and ‘South Africa’. These keywords were also used to search university repositories. The Boolean operating terms ‘OR’ and ‘AND’ were used to refine the database search.
The inclusion criteria were limited to the English language within the South African setting, and to the period 2010 to 2023. Sources of information included journal articles, dissertations/theses, official reports and government documents.
The Integrated Healthcare Delivery Platform, understood in the context of the WHO Health Systems Framework, provided key components (building blocks) of an EMS system. As the study was focused on the EMS system, articles were deemed eligible for inclusion if they related to the components of the EMS system. The state of EMS could therefore be described using these critical components, as proposed by Mehmood et al.9
Anecdotal information and articles that did not contain information about the components of EMS were excluded.
Source: South African Department of Health4; reproduced under a non-exclusive licence for educational and informational purposes
Results
The literature search process (Figure 2) returned 1548 records; of these, 1478 were excluded as they consisted of duplicate articles and those that did not meet the inclusion criteria. A further 33 articles were excluded after screening as they did not relate to the objective of the study, leaving a total of 37 articles that were analysed using a thematic coding approach.
Each article was read, and key findings were coded and tabulated on an electronic spreadsheet alongside the corresponding title, study location and reference. Codes with commonalities were grouped and developed into initial themes. Themes were selected based on their ability to provide information on the components of an EMS system, which was key to effectively addressing the research question. Finally, interrelated themes were grouped, titled and validated by all authors. The following themes emerged from the analysis of the articles:
• Leadership and governance
• Resources
• Emergency care provider preparedness
• Knowledge
• Attitude
• Practice
• Health and safety
• Training
• Communication systems
Discussion
Background
on emergency medical services
Prior to 1994, governance in South Africa comprised four ‘white’ provincial administrations (Cape of Good Hope, Orange Free State, Transvaal, and Natal) and four ‘black’ homelands (Transkei, Bophuthatswana, Venda, and Ciskei).10,11 During this apartheid era, the provision of EMS was the responsibility of the local authorities (municipalities), who also provided services such as firefighting and motor vehicle rescue in each town.11 After the 1994 democratic elections, there was a redress of governance in South Africa which resulted in the establishment of nine provinces: Western Cape, Northern Cape, Eastern Cape, North West, Free State, Gauteng, Mpumalanga, Limpopo and KwaZulu-Natal.10 Redress also included removing the responsibility of EMS from the local authorities, leaving the latter to concentrate on fire and rescue services. EMS was deemed a provincial function (provincialised) and became governed by the Provincial Departments of Health (PDOH).12
Currently, EMS has been provincialised in all nine provinces. Table 1 illustrates the provincial geographical area in relation to the population size in South Africa13, thereby providing context for this review.
Theme 1: Leadership and governance Governance
Leadership and governance are critical components of the Integrated Healthcare Delivery Platform and the pre-hospital EMS framework as they hold management accountable for the quality of health services rendered to the public.4 The EMS Regulations, promulgated under the National Health Act, 200314, and regulating the operation of public and private EMS in South Africa, were published in 2017. This was a sign of improving governance as EMS providers were required to be accredited and licensed through the PDOH Inspectorate and Licensing Division.14
Regulations relating to standards of operating EMS in South Africa were, however, lacking in governance. Assessing the quality of service delivery is possible through standard quality assessment tools guided by governance policies and systems; however, in 2020, Howard et al. found no supporting documentation in the way of national policies and/or guidelines for EMS in either implementing quality systems, measuring quality or reporting performance. Furthermore, there was a general lack of policy outlining minimum standards for EMS quality systems altogether.15
In 2022, the National Department of Health (NDOH) addressed issues of governance, whereby Regulations relating to Standards for EMS were promulgated under the National Health Act, 2003 (Act No. 61 of 2003).16 While these regulations were going through the stages of becoming gazetted, the NDOH implemented the Ideal EMS Framework, including its assessment tools designed to evaluate the progress made towards achieving the EMS standards (Table 2).16 This approach demonstrates NDOH’s focus on improving issues of governance.
According to the Regulations relating to Standards for EMS16, leadership and governance are the responsibility and accountability of the PDOH, whose role is to oversee and support the EMS by ensuring a functional governance structure exists and that there is quality in service delivery. The outcomes of provincial assessments are not yet in any published records; therefore, the quality of provincial leadership and governance remains to be determined.
Leadership
The Campaign on Accelerated Reduction of Maternal (and Child) Mortality in Africa (CARMMA) was a strategic plan introduced by the
Data source: Government Communication and Information System of South Africa13
NDOH, in 2009, to improve maternal and child health. This campaign required “allocating dedicated obstetric ambulances to every subdistrict to ensure prompt transfer of women in labour and women with obstetric emergencies to the appropriate level of care”17. Most provinces implemented obstetric ambulances and resolved that obstetric cases be triaged as a priority.18 In 2015, Yancy et al. investigated the implementation status of obstetric ambulances in KwaZulu-Natal and Mpumalanga and found that the number of operational ambulances and staff was inadequate.19 The operation of dedicated obstetric
ambulances appears to be unstainable given the shortage of staff and operational ambulances. NDOH leadership appears to be providing strategic direction, while provincial leadership needs improvement in implementation, oversight, and reform.
Recommendation regarding leadership and governance:
• Assessments of all components of EMS need to be
by
to
Figure 2: Flow diagram showing literature search, screening and search process.
Table 1: Provincial area size related to population size in South Africa
EMS standards Requirements
Patient rights
Clinical governance and clinical care
Clinical support services
Leadership and governance
Operational management
Facilities and infrastructure
• Dignity of patients, information for patients, stakeholder satisfaction surveys, complaints management
• Patient health records, clinical management of emergency care provision, dispatch of emergency vehicles, response management, clinical leadership and clinical risk, inter-facility transfers, planned patient transport services, patient safety incidents, prevention and control of infections, waste management
• Medicines and medical supplies, medical equipment management
• Oversight and accountability
• General management, human resources management, occupational health and safety, emergency and disaster preparedness, fleet management
• Management of buildings and grounds, building engineering ser vices, security services, linen services
Data source: National Health Act, 2003 (Act No. 61 Of 2003): Regulations Relating to Standards for Emergency Medical Services16
• The PDOH should develop and implement a quality improvement plan in response to the assessments and report outcomes to the NDOH that provides oversight to provinces.
• The NDOH needs to establish a standardised and comprehensive national database of provincial EMS resources and assessments for purposes of monitoring, evaluation, strategic planning, and reporting.
Theme 2: Resources
Ambulance availability and equipment
South Africa has a population of approximately 60 million people.13
The standard provision of 1 ambulance for every 50 000 people is an international recommendation20; however, in South Africa, the national ‘norm’ is 1 ambulance per 10 000 people, which is dependent on socio-economic and geographic distribution.19 None of the provinces has achieved this norm.8,21 Studies have found that the high case load outweighs the number of scheduled ambulances.8,22 This situation is worsened when scheduled ambulances are unavailable due to repairs, accident damage, and awaiting vehicle parts (import delays). The high breakdown rate is due to the fleet operating with mileages beyond 300 000 kilometres.21
A study in KwaZulu-Natal found that response times for obstetric patients were delayed due to the unavailability of ambulances.22 Several studies in South Africa have also attributed poor patient outcomes to delayed ambulance availability.23-25
Ashokcoomar et al.25 found problems such as a lack of essential equipment, malfunctioning equipment, and unsterile clinical procedures; and concluded that the emergency care providers in KwaZulu-Natal lacked preparedness to manage inter-facility neonatal transfers. Improving the number of fully equipped ambulances is vital for EMS to fulfil its role within the Integrated Healthcare Delivery Platform.
Recommendation regarding resources:
• The PDOH needs to prioritise and increase funding for EMS to assist with staffing and procurement of fully equipped ambulances to meet and maintain the norms and standards of the NDOH.
Helicopter emergency medical services
The helicopter emergency medical services (HEMS) is a vital resource for the EMS and is beneficial in cases such as long-distance patient transfer, inaccessible terrain, and when advanced clinical skills are unavailable in the districts. Studies show HEMS operations in the Western Cape, Eastern Cape, KwaZulu-Natal, Gauteng, Free State, Mpumalanga and North West provinces; the status of HEMS in other provinces is unknown due to the lack of published records.26
27 Studies into the operation of the HEMS revealed mixed outcomes. While challenges such as underutilisation of this resource28, over-triage, and overuse29 were
noted, Pule et al.30 reported on the usefulness and appropriateness of the HEMS in long-distance transfers of patients who had major trauma. Similarly, Vlok et al.27 found that HEMS served as a vital critical care transport resource for inter-facility transfers.
Recommendation regarding HEMS:
• HEMS provides invaluable support to the EMS and should be included as an additional service operated nationally with clearer dispatch guidelines developed through future studies.
Theme 3: Emergency care provider preparedness
Three levels of emergency care providers exist in the EMS in South Africa: Basic Life Support, Intermediate Life Support, and Advanced Life Support.9 Emergency care providers’ knowledge, attitude, and practice (especially in Basic and Intermediate Life Support) was reported to be lacking in most of the articles reviewed, suggesting a lack of preparedness in managing patients.31-35 For example:
• Emergency care providers lacked knowledge of the Glasgow Coma Scale31, triage32, management of attempted suicide34 and management of psychiatric emergencies36
• Emergency care providers’ attitude showed a lack of empathy34, fear, and apprehension towards mental health care users37. Mosca et al. found that emergency care providers expressed difficulty in managing paediatric emergencies due to the complexity of such cases, a lack of support such as protocols, and lack of specific equipment.38
• Several studies have highlighted clinical practice challenges, including lack of equipment, delays in response to cases, and Emergency Communication Centre (ECC) problems.22-25 VincentLambert et al.39 found that 51% of trauma patients who arrived at an emergency department were hypothermic, with a core temperature of <36 °C.38 In KwaZulu-Natal, Royal and McKerrow40 found a mean time delay of 9 hours for inter-facility transfer of critically ill paediatric patients and that emergency care providers (mainly Basic Life Support) failed to keep these patients stable in transit.
The lack of preparedness of emergency care providers could increase the risk of negligence, clinical mismanagement, harm to the patient (maleficence), and litigation for the provider and the EMS.
Recommendations regarding emergency care provider preparedness:
• All emergency care providers need to be audited to determine compliance with the Health Professions Council of South Africa’s (HPCSA) Continuing Professional Development policy.
• Training plans ought to be developed and implemented through collaboration between the provincial EMS, College of Emergency Care, and Human Resource Development structures.
Table 2: Regulations relating to standards for emergency medical services (EMS)16
• Future studies are required to investigate the relationship between selection, recruitment and development and the preparedness of emergency care providers.
Theme 4: Health and safety
According to Section 6 of the Occupational Health and Safety Act 85 of 1993, “Every employer shall take all practicable steps to ensure the safety of employees while at work”41. The National Health Act No. 61 of 2003 also places responsibility on managers to ensure the safety of employees in the workplace.13 While legislation is in place, reports indicate that violence against emergency care providers is primarily initiated by patients and people known to the patient (family, community), which compromises health and safety.42
The South African EMS Safety Forum reported that an increase in assault, theft of personal belongings, theft of equipment and damage to ambulances has affected the morale of emergency care providers and caused a noticeable increase in resignations, transfer requests, and absenteeism. EMS personnel did not feel supported by executive management.42
Driver safety, physical fitness and mental fitness have also emerged as health and safety issues:
• Driver’s safety
Holgate43 found that 54.2% of private and government EMS respondents have been exposed to motor vehicle accidents. Most respondents (74.4%) agreed that EMS management could do more to improve emergency vehicle driver safety and alluded to the need for specialised driver training.
• Physical fitness
The nature of EMS work requires a high level of physical fitness to perform strenuous tasks and emergency care providers who are not adequately prepared for this line of work increase their risk of injury. Mthombeni et al.44 measured the physical fitness of emergency care providers in the North West Province and found that many participants were not physically fit to perform duties. The participants demonstrated a high body mass index and poor upper body and grip strength amongst other assessments. There was no evidence of physical fitness assessments or programmes in the other provinces. It may be generalised that emergency care providers in other provinces are also unfit to perform their duties.
• Mental fitness
Ntatamala and Adams45 investigated the risk of Post-Traumatic Stress Disorder (PTSD) in emergency care providers in the Western Cape and found that this condition was prevalent in 30% of the respondents. PTSD and burnout were also found in a study in Limpopo46 and paramedic trainees in Gauteng demonstrated high prevalence rates for PTSD (16%), depression (28%), alcohol abuse (24%) and alcohol dependence (8%)47. These studies show that dysfunctional coping mechanisms such as smoking, abusing prescription drugs, drinking alcohol and using illicit drugs were common to manage PTSD. In a similar study, Van Rooyen et al.48 found a high prevalence of stimulant use amongst emergency care providers as a coping mechanism to overcome work-related stress, to stay awake and to improve physical and mental performance.
The impact of work-related stress, with or without substance abuse, compromises the health and safety of emergency care providers44 45 and the performance of their duties37 38 45 47, which could affect the availability of ambulances and the quality of care afforded to patients.
Recommendations regarding health and safety:
• The PDOH Directorate for Employee Health and Wellness Programme needs to improve EMS participation in wellness programmes and ensure access to Employee Health and Wellness practitioners.
• The PDOH, guided by the South African EMS Safety Forum, needs to urgently develop and implement strategies to reduce attacks on emergency care providers.
Theme 5: Training
In South Africa, emergency care providers hold qualifications from institutions that provide skills-based short-course training or from higher educational institutions that offer diplomas and degrees.9 ‘Short-course training’ ended as it was not compliant with the National Qualifications Framework Act (NQF). The EMS colleges are now guided by the National Emergency Care Education and Training Policy, which aims to “align emergency care education and training with current education legislation, national education and training needs…”6
The Higher Certificate in Emergency Medical Care (1-year programme) and the Diploma in Emergency Medical Care (3-year programme) are two new courses that have replaced short-course training. EMS colleges wanting to provide these NQF-accredited courses must be registered as higher education colleges, which requires accreditation with the Council on Higher Education, South African Qualifications Authority, and the HPCSA.6 49 The accreditation process has been slow, with only two of the nine provincial colleges receiving provisional accreditation.49 In the interim, some provincial and private colleges have partnered with public universities such as the University of Johannesburg and Cape Peninsula University of Technology which offer one or both of these new courses.49 The transformation in EMS training is a necessity to promote lifelong learning; however, many emergency care providers are struggling to meet the new course entry requirements.49 Emergency care providers' morale may therefore be low due to lost academic and career progression. Programmes and discussions are ongoing in an effort for emergency care providers to meet the course entry requirements.49
While the accreditation process in EMS training continues, emergency care providers are required to attend training to keep abreast of current evidence-based clinical practice50; however, we found poor compliance amongst emergency care providers in attending clinical update training. These findings appear to be correlated with the poor knowledge of emergency care providers described earlier. In 2019, the HPCSA released the new clinical practice guidelines that significantly increased the scope of practice of emergency care providers.6 Emergency care providers were required to attend and complete the clinical practice guidelines training; however, compliance with this directive is unknown.
Recommendations regarding training:
• PDOH needs to develop and implement strategies to assist their provincial EMS colleges in achieving accreditation as higher educational institutions. This will enable emergency care providers to access new qualifications, thereby increasing their scope of practice and standard of care.
Theme 6: Communication systems
Access to emergency services such as the police, the EMS, the fire department, and sea rescue has been traditionally through contacting their respective telephone numbers. A short code number – 112, the legislated emergency number for EMS – was launched in October 2019 and may now be used to access any of the emergency services in South Africa.10 The ‘old’ EMS emergency number (10177) will be phased out through a process of government notice.
The dispatching system used by EMS varies between provinces and ECCs, making integration impossible and information not directly accessible by the NDOH. The disparity also exists due to varying standard operating procedures, technology, infrastructure, and staffing.10 There are no nationally accepted criteria for ECC call handling and dispatch processes.
Studies have identified this component as one of the problems within EMS.13 25 36 51 In a study by Lambert and Wade51, respondents described the ECC as ineffective, due to problems such as unanswered calls, call takers not understanding basic medical terminology, and poorly co-ordinated inter-facility transfers.
Stander et al.37 noted that challenges with the ECC dispatching system were one of the barriers to managing behavioural emergencies. Similarly, a study by Alshehri et al.52 found that the ECC was possibly over-triaging cases. Participants also highlighted challenges with the ECC dispatch
system, lack of training, and interpersonal conflict. Similar issues with the ECC were found in another study.53 The ECC appears to be plagued with various issues that contribute to its less-than-satisfactory role within EMS.
Recommendation regarding communication systems:
• The NDOH needs to develop a National EMS Communication Framework and Policy to guide standardisation of ECC technology, training and daily operations.
Limitations
Firstly, despite the operation of EMS and its colleges in all provinces, the research articles available did not represent every province. As a result, official reports and government records were used to provide evidence for those provinces. Secondly, most articles focused on provincial EMS, while some articles had a mix of private and public EMS participants. Based on the principle of generalisability, our findings may represent only provinces with similar EMS challenges and geographical settings. Thirdly, we did not explore planned patient transport, inter-facility transfers, the role of EMS in disasters, ground rapid response services, or medical rescue services. These are also core services provided by EMS and require further study. Lastly, this review focused only on South African EMS studies, as context was needed for the development of a subsequent study.
Relevance of the study
In a study regarding the state of EMS in Africa, Mould-Millman et al.54, citing the WHO55 and Lopez et al.56, stated:
People in Africa bear a disproportionate burden of preventable and excess deaths before arrival at a health facility – the pre-hospital setting – even when compared to low- and middle-income countries on another continent.54
The study found that fewer than one in three African countries had an EMS system in place, and, where EMS systems existed, they were “inadequate to meet the demands of the population”54. The relevance of the current study is that it adds to the body of knowledge of an African EMS system and provides an opportunity for other African countries to mitigate their approach in developing or modifying their EMS systems, thereby contributing to universal health coverage and outcomes.
Conclusion
The WHO Health Systems Framework provides key components (building blocks) of a functional health system. This study found that all components applicable to the EMS system are not functioning optimally, thereby contributing to the apparent constrained state of EMS. The six themes that emerged from the articles were: leadership and governance; resources; emergency care provider preparedness; health and safety; training; and communication systems. Challenges were found in all themes at a provincial EMS level, despite improvements in legislation, leadership, and governance by the NDOH. The evidence suggests that the EMS system is not adequately fulfilling its role in the Integrated Healthcare Delivery Platform in South Africa – a finding which requires further study and urgent intervention by the NDOH. Greater leadership and governance, especially from the provincial and district health levels, are required to improve poorly functioning components of the EMS system to ensure that the state of EMS improves.
Association to other research
This study was designed to provide information on the current state of EMS, to provide background and context to a current doctoral study regarding the management of obstetric haemorrhage by emergency care providers in the KwaZulu-Natal Province.
Ethical considerations
All ethical standards were followed. There was no direct contact with human or animal subjects.
Funding
No funding was received for this research.
Data availability
There are no data emanating from this study.
Declaration of AI use
This study was not aided through the use of AI.
Authors’ contributions
S.G.: Conceptualised the study, performed the literature search, and drafted the manuscript. R.N.: Contributed data and statistics available to the NDOH. O.P.K. and J.M.: Revised the manuscript. All authors read and approved the final manuscript.
Competing interests
R.N. is the Director of Emergency Medical Services & Disaster Medicine, National Department of Health (NDOH), Gauteng, South Africa. R.N. did not inappropriately influence the writing of this article.
References
1. Achoki T, Sartorius B, Watkins D, Glenn SD, Kengne AP, Oni T, et al. Health trends, inequalities and opportunities in South Africa’s provinces, 1990–2019: Findings from the Global Burden of Disease 2019 Study. J Epidemiol Community Health. 2022;76:471–481. http://dx.doi.org/10.1136/jech-202 1-217480
2. South African Department of Health. Health research priorities (revised) for South Africa 2021–2024 [document on the Internet]. Pretoria: Department of Health; 2022 [cited 2023 Feb 20]. Available from: https://knowledgehub.heal th.gov.za/elibrary/health-research-priorities-revised-south-africa-2021-2024
3. World Health Organization (WHO). Emergency care systems for universal health coverage: Ensuring timely care for the acutely ill and injured [document on the Internet]. Geneva: WHO; 2019 [cited 2023 Feb 20]. Available from: htt ps://apps.who.int/gb/ebwha/pdf_files/WHA72/A72_31-en.pdf
4. South African Department of Health. Referral policy for South African health services and referral implementation guidelines [document on the Internet]. Pretoria: Department of Health; 2020 [cited 2023 Feb 20]. Available from: https://knowledgehub.health.gov.za/elibrary/referral-policy-soth-african-heal th-services-and-referral-implementation-guidelines
5. World Health Organization (WHO). Everybody’s business: Strengthening health systems to improve health outcomes. WHO’s Framework for Action [document on the Internet]. Geneva: WHO; 2007 [cited 2023 Feb 20]. Available from: https://www.who.int/publications/i/item/everybody-s-busine ss----strengthening-health-systems-to-improve-health-outcomes
6. South African Department of Health. National emergency care education and training policy [document on the Internet]. Pretoria: Department of Health; 2017 [cited 2023 Feb 20]. Available from: https://www.hpcsa-blogs.co.za/ wp-content/uploads/2018/08/national-emergency-care-education-and-train ing-policy.pdf
7. Professional Board for Emergency Care. Clinical practice guidelines [document on Internet]. Pretoria: Health Professions Council of South Africa; 2018 [cited 2023 Feb 05]. Available from: https://www.hpcsa.co.za/Content /upload/professional_boards/emb/guidelines/CLINICAL_PRACTICE_GUIDEL INES_PROTOCOLS_JULY_2018.pdf
8. Rapanyane MB. The dire shortage of ambulances in the South African healthcare system: Unblurring implications on the right to health. Afr J Develop Stud. 2022;12(3):61–81. https://hdl.handle.net/10520/ejc-aa_affri ka1_v12_a4
9. Mehmood A, Rowther AA, Kobusingye O, Hyder AA. Assessment of prehospital emergency medical services in low-income settings using a health systems approach. Int J Emerg Med. 2018;11:53. https://doi.org/10. 1186/s12245-018-0207-6
10. Gordon DF, Lowe CC, Nel A, Hall M, Vigne R, Cobbing JRD, et al. Union of South Africa [webpage on the Internet]. Encyclopedia Britannica; 2023 [updated 2023 Feb 18; cited 2023 Feb 21]. Available from: https://www.brita nnica.com/place/South-Africa
11. Vincent-Lambert C. International perspectives: South African ambulance services in 2020. In: Wankhade P, Mackway-Jones K, editors. Ambulance services. Cham: Springer International Publishing; 2015. p. 175–183. https:/ /doi.org/10.1007/978-3-319-18642-9_15
12. Tucker JM, Chalkidouii K, Pillay Y. Establishing the NHI service benefits framework: Lessons learnt and stakeholder engagement [document on the Internet]. Durban: Health Systems Trust; 2019 [cited 2023 Feb 20]. Available from: https://www.hst.org.za/publications/South%20African%20Health%20R eviews/04%20SAHR_2019_Establishing%20the%20NHI%20service%20ben efits%20framework.pdf
13. Government Communication and Information System. South Africa’s provinces [webpage on the Internet]. Pretoria: Government Communications; 2024 [cited 2024 Jun 12]. Available from: https://www.gov.za/about-sa/sou th-africas-provinces
14. South African Department of Health. National Health Act, 2003 (Act No. 61 of 2003): Emergency service regulations [statute on the Internet]. Pretoria: Department of Health; 2017 [cited 2023 Jul 21]. Available from: https://www .gov.za/sites/default/files/gcis_document/201712/41287gon1320.pdf
15. Howard I, Cameron P, Wallis L, Castrén M, Lindström V. Understanding quality systems in the South African pre-hospital emergency medical services: A multiple exploratory case study. BMJ Open Qual. 2020;9(2), e000946. https: //doi.org/10.1136/bmjoq-2020-000946
16. South African Department of Health. National Health Act, 2003 (Act No. 61 of 2003): Regulations relating standards for emergency medical services [statute on the Internet]. Pretoria: Department of Health; 2021 [cited 2023 Jul 21]. Available from: https://www.gov.za/sites/default/files/gcis_docume nt/202102/44161gon94.pdf
17. South African Department of Health. Strategic plan for a campaign on accelerated reduction of maternal and child mortality in Africa (CARRMA) [document on the Internet]. Pretoria: Department of Health; 2012 [cited 2023 Jul 21]. Available from: https://www.health-e.org.za/2015/10/08/policy-natio nal-strategic-plan-for-a-cam
18. South African Department of Health. National Health Council highlights in respect of emergency medical services [briefing document]. Pretoria: Department of Health; 2013.
19. Yancy AH, Mould-Millman N. The implementation status of obstetric EMS systems in selected South African health districts with recommendations for future development [technical report]. Unpublished report; 2015.
20. Thind A, Hsia R, Mabweijano J, Hicks ER, Zakariah A, Mock CN. Prehospital and emergency care. In: Debas HT, Donkor P, Gawande A, Jamison DT, Kruk ME, Debas HT, editors. Essential surgery: Disease control priorities. 3rd ed (volume 1). Washington DC: The International Bank for Reconstruction and Development / The World Bank; 2015. p. 245–262. https://doi.org/10.15 96/978-1-4648-0346-8_ch14
21. South African Department of Health. EMS readiness plans for COVID-19. Surge report. Pretoria: Department of Health; 2021.
22. Govender S. Emergency transport of obstetric patients within the Ugu Health District [master’s thesis]. Durban: University of Technology; 2015 [cited 2023 Jun 11]. https://hdl.handle.net/10321/688
23. Chowdhury S, Navsaria PH, Edu S, Nicol AJ. The effect of emergency medical services response on outcome of trauma laparotomy at a level 1 trauma centre in South Africa. S Afr J Surg. 2016;54(4):17–21. https://scielo.org.za/ scielo.php?script=sci_arttext&pid=S0038-23612016000400006
24. South African Department of Health. Saving mothers: Annual report for 2021 [document on the Internet]. Pretoria: Department of Health; 2017 [cited 2023 Jul 21]. https://www.health.gov.za/wp-content/uploads/2023/09/Saving-Mot hers-Report-2021.pdf
25. Ashokcoomar P, Bhagwan R. Towards a safer and more efficient neonatal transfer system in South Africa: A qualitative inquiry with advanced life support paramedics. Australas J Paramedicine. 2021;18:1–9. https://doi.o rg/10.33151/ajp.18.951
26. McKelvin R. Prehospital medicine: South Africa vs. the United Kingdom. Int Paramed Pract. 2018;7(3). https://doi.org/10.12968/ippr.2017.7.3.32
27. Vlok N, Wylie C, Stassen W. A 12-month retrospective descriptive analysis of a single helicopter emergency medical service operator in four South African provinces. Afr J Emerg Med. 2023;13(3):127–134. https://doi:10.1016/j.afj em.2023.05.007
28. D’Andrea PA, van Hoving DJ, Wood D, Smith WP. A 5-year analysis of the helicopter air mercy service in Richards Bay, South Africa. S Afr Med J. 2014;104(2):124–126. https://doi.org/10.7196/SAMJ.7310
29. Muhlbauer D, Naidoo R, Hardcastle TC. An analysis of patients transported by a private helicopter emergency medical service in South Africa. S Afr Med J. 2016;106(2):201–205. https://doi.org/10.7196/samj.2016.v106i2.9919
30. Pule MS, Hodkinson P, Hardcastle T. A descriptive study of trauma patients transported by helicopter emergency medical services to a level one trauma centre. Afr J Emerg Med. 2022;12(3):183–190. https://doi.org/10.1016/j.af jem.2022.03.004
31. Butler MW, Adefuye AO. Assessing the knowledge of emergency medical care personnel in the Free State, South Africa, on aspects of paediatric prehospital emergency care. Pan Afr Med J. 2019;32, Art. #98. https://doi. org/10.11604/pamj.2019.32.98.17718
32. Allgaier R, Laflamme L, Wallis LA. Operational demands on prehospital emergency care for burn injuries in a middle-income setting: A study in the Western Cape, South Africa. Int J Emerg Med. 2017;10, Art. #2. https://doi. org/10.1186/s12245-017-0128-9
33. Nel D, Stassen W. The accuracy of Johannesburg based ambulance personnel in identifying stroke. S Afr J Crit Care. 2015;31(2):58–61. https://doi.org/10.7 196/sajcc.2015.v31i2.247
34. Evans K, Geduld H, Stassen W. Attitudes of pre-hospital providers on transport decision-making in the management of patients with a suicide attempt refusing care: A survey based on the Mental Health Care Act of 2002. S Afr J Psychiatr. 2018;24, Art. #1156. https://doi.org/10.4102/sajpsychia try.v24i0.1156
35. Erefaan I. Preparedness of Western Cape ALS providers to provide clinical stabilisation and intensive care for neonates during the patient journey. Australas J Paramed. 2020;17(1):1–6. https://doi.org/10.33151/ajp.17.781
36. Mothibi JD, Jama M, Adefuye AO. Assessing the knowledge of emergency medical care practitioners in the Free State, South Africa, on aspects of prehospital management of psychiatric emergencies. Pan Afr Med J. 2019;33, Art. #132. https://doi.org/10.11604/pamj.2019.33.132.18426
37. Stander C, Hodkinson P, Dippenaar E. Pre-hospital care providers’ understanding of responsibilities during a behavioural emergency. S Afr J Psychiatr. 2021;27, Art. #1545. https://doi.org/10.4102/sajpsychiatry.v27 i0.1545
38. Mosca CG, Stein C, Lawrence H. South African prehospital emergency care personnel’s lived experiences of managing paediatric emergencies: A qualitative research design utilising one-on-one interviews. Health SA. 2021;26, Art. #1558. https://doi.org/10.4102/hsag.v26i0.1558
39. Vincent-Lambert C, Smith CM, Goldstein LN. Hypothermia in trauma patients arriving at an emergency department by ambulance in Johannesburg, South Africa: A prospective study. Pan Afr Med J. 2018;31, Art. #136. https://doi. org/10.11604/pamj.2018.31.136.13615
40. Royal C, McKerrow NH. A retrospective review of the transfer of critically ill children to tertiary care in KwaZulu-Natal Province, South Africa. S Afr J Child Health. 2015;9(4):112–118. https://doi.org/10.7196/SAJCH.2015. v9i4.913
41. South African Government. Occupational Health and Safety Act 85 of 1993 [statute on the Internet]. c1993 [cited 2023 Jul 21]. Available from: https://w ww.gov.za/sites/default/files/gcis_document/201409/act85of1993.pdf
42. Naidoo R. Update on EMS safety. Presentation at the South African EMS Safety Forum. Durban: Department of Health; 2019.
43. Holgate R. The opinion of Emergency Medical Service personnel regarding safety in prehospital emergency care practice [master’s thesis]. Johannesburg: University of the Witwatersrand; 2015 [cited 2023 Jul 21]. Available from: https://core.ac.uk/download/pdf/188774815.pdf
44. Mthombeni S, Coopoo Y, Habib N. Fitness levels of rural emergency medical and rescue service providers in the Northwest Province, South Africa. Occup Health. 2020;26(3):111–116. Available from: https://www.occhealth.co.za/_ assets/articles/332/2063.pdf
45. Ntatamala I, Adams S. The correlates of post-traumatic stress disorder in ambulance personnel and barriers faced in accessing care for work-related stress. Int J Environ Res Public Health. 2022;19(4), Art. #2046. https://doi. org/10.3390/ijerph19042046
46. Manganyi PS. Lived experiences of emergency medical personnel in Capricorn District: Towards the development of user-led model [PhD thesis]. Limpopo: University of Limpopo; 2021 [cited 2023 Jul 21]. Available from: http://ulspace.ul.ac.za/bitstream/handle/10386/3661/manganyi_ps_2021.p df?sequence=1&isAllowed=y
47. Fjeldheim CB, Nöthling J, Pretorius K, Basson M, Ganasen K, Heneke R, et al. Trauma exposure, posttraumatic stress disorder and the effect of explanatory variables in paramedic trainees. BMC Emerg Med. 2014;14, Art. #11. https: //doi.org/10.1186/1471-227X-14-11
48. Van Rooyen LR, Gihwala R, Laher AE. Stimulant use among prehospital emergency care personnel in Gauteng Province, South Africa. S Afr Med J. 2021;111(6):587–590. https://doi:10.7196/SAMJ.2021.v111i6.15465
49. South African Department of Health. Update on status of public EMS colleges. Cape Town: EMS Colleges Principals Forum; 2022.
50. Adefuye A, Wyk C, Sookram B. Non-compliance with continuing professional development requirements: Perspectives of emergency medical care practitioners in a resource-poor setting. Austr J Paramed. 2020;17, Art. #746. https://doi.org/10.33151/ajp.17.746
51. Vincent-Lambert C, Wade G. Challenges relating to the inter-facility transport of high acuity paediatric cases. Afr J Emerg Med. 2018;8(1):29–33. https:// doi.org/10.1016/j.afjem.2017.12.001
52. Alshehri MF, Pigoga JL, Wallis LA. A mixed methods investigation of emergency communications centre triage in the Government Emergency Medical Services System, Cape Town, South Africa. Afr J Emerg Med. 2020;10(1):S12–S17. http://doi.org/10.1016/j.afjem.2020.02.004
53. Anest T, de Ramirez S, Balhara KS, Hodkinson P, Wallis L, Hansoti B. Defining and improving the role of emergency medical services in Cape Town, South Africa. Emerg Med J. 2016;33(8):557–561. http://doi.org/10.1136/emerme d-2015-205177
54. Mould-Millman N, Dixon J, Sefa N, Yancey A, Hollong B, Hagahmed M, et al. The state of emergency medical services (EMS) systems in Africa. Prehosp Disaster Med. 2017;32(3):273–283. http://doi.org/10.1017/s1049023x170 00061
55. World Health Organization. World Health Report – Health systems: Improving performance [document on the Internet]. c2000 [cited 2023 Feb 20]. Available from: https://apps.who.int/iris/handle/10665/42281
56. Lopez AD, Mathers CD, Ezzati M, Jamison DT, Murray CJL. Global and regional burden of disease and risk factors, 2001: Systematic analysis of population health data. Lancet. 2006;367(9524):1747–1757. http://doi.org /10.1016/s0140-6736(06)68770-9
AUTHOR: Derica Lambrechts1
AFFILIATION:
1Department of Political Science, Stellenbosch University, Stellenbosch, South Africa
CORRESPONDENCE TO: Derica Lambrechts
EMAIL: derica@sun.ac.za
DATES:
Received: 12 Apr. 2023
Revised: 01 Mar. 2024
Accepted: 16 May 2024
Published: 31 July 2024
HOW TO CITE:
Lambrechts D. The provision of goods and governance in local communities during an emergency: Findings from an urban space in southern Africa. S Afr J Sci. 2024;120(7/8), Art. #15913. https:// doi.org/10.17159/sajs.2024/15913
South African National Research Foundation (119508)
The provision of goods and governance in local communities during an emergency: Findings from an urban space in southern Africa
The provision of political goods and governance in marginalised local communities, located in Cape Town, South Africa, during the national lockdown periods (due to the COVID-19 pandemic) is described. The focus is on an African city, drawing attention to the growing importance of urban governance on the continent. Rapid urbanisation and emergency periods (such as the pandemic) are adding to the complexity of the urban space. This study found that communities in the city relied mostly on themselves for the provision of goods, and that the provision of security remains a critical political good, informing governance. However, the findings confront literature on a hierarchy of political goods, in which security is at the apex. In the given context, the sequence of the provision of goods changes to a non-hierarchical process. The fulfilment of other political goods will facilitate improved provision of security. Good governance needs to be informed by an integrated approach to, and the synchronous fulfilment of, political goods.
Significance:
• During times of emergencies, already marginalised urban communities experience greater political neglect and are left to protect themselves and to provide for each other.
• These communities experience deser tion across the spectrum of political goods.
• Resilience in such communities needs to be improved through good governing principles.
• Although optimal local level governance relies heavily on the provision of security, the importance of the provision of education, employment, political freedom, housing, and health services (to mention a few) requires renewed attention.
Introduction
Africa is experiencing rapid and intense urbanisation, and the future of the continent will be positioned in the urban context. African cities are the fastest growing in the world and the number of cities on the continent has doubled since 1990.1 2 The significant influx of people to the urban space has brought about opportunities and challenges, mostly hampering the road to resilience.3-6 Part of the latter relates to governance: control over territory, distribution of resources, and the provision of goods and services to all citizens of the urban space. As noticed by Wiliams7: “The massive population surge into the cities of the Global South…not only preceded the building of new infrastructure but swamped existing infrastructure and overloaded the capacity for service provision”. Parallel to the process of urbanisation is the increase in violence and criminal activities.7 Rapid urbanisation has also increased structural differences in the urban space and locations facing socio-economic deprivation, and, consequently, local level governance is becoming increasingly important in the African context.8 Indeed, in South Africa, urbanisation has increased the informal urban space, including informal economic and social settings, and perpetuated the lingering ailments of apartheid, of which spatial separation is the most prominent.9 This is particularly accurate in the case of Cape Town.
A 2022 report on the state of the City of Cape Town indicates that global trends in urbanisation necessitate improved public transport, affordable housing, and the provision of basic services. The report asserts that, although basic services have improved across the city, informality remains high, at close to 20% in 2020. Pressure on environmental resources is also highlighted as one of the main results of urbanisation, especially in light of worsening environmental conditions due to climate change.10 The importance of new research on urban governance was noted by Da Cruz et al.11, due to new challenges and increased complexity, and that particular attention should be given to the Global South. The notion of ‘taking stock’ during crisis periods in order to improve urban governance was also observed by Pieterse12: “The value of a crisis in urban politics is that it potentially reveals the limits of what is possible in terms of prevailing systems of power and hegemonic discourses”. This article assesses the challenges caused by a state of emergency in a city in southern Africa: it draws attention to the impact of the COVID-19 pandemic on lower-income, marginalised communities in Cape Town.
The socio-economic capacity of individuals and communities greatly influenced their pandemic lockdown preparedness.13 Accordingly, there is a body of literature on the impact of the pandemic on various components of cities in Africa, given the complexity of the space (for example, Anaafo et al.14, Asante and Mills15; Schotte and Zizzamia16; Skinner and Watson17). The pandemic also forced the debate to reconsider urban governance in the Global South, due to the complicated network of actors involved.18 Cape Town is no different and is a city of vast socio-economic inequalities, and the provision of goods and governance in developing parts of the city was already impaired in the pre-pandemic setting. The area under investigation for this study is the Cape Flats. It was first established under apartheid in the wake of the coloured communities’ forcible relocation from various districts of Cape Town, particularly District Six, during the 1960s and 1970s (according to the Groups Areas Act). Families were split up, and most of those who relocated had to give up their work, which led to widespread unemployment and poverty. This led to the progressive disintegration of working-class culture and extended families in the Cape Flats. Over time, these conditions facilitated the growing presence of non-state actors, most noticeably, criminal
gangs.19 Accordingly, the research question is, when looking back at the periods of lockdown, what can be ascertained from the provision of political goods and governance in a developing urban space, to make these spaces more resilient to disasters, given the new reality of a permacrisis: “an extended period of instability and insecurity, especially one resulting from a series of catastrophic events”20
Complex urban spaces
As most of the writings on urban politics are based on spaces in the Western developed world4,11, there is limited understanding of how these theories transfer to Africa. For the purposes of this article, conceptual difficulties related to urban governance are noted.21 Accordingly, ObengOdoom8 argues for a reframing of urban governance in the African context, based on a disconnection between urban governance in theory and urban governance observed. Governance is regarded as part of the development paradigm, confirming the importance of urban space in the African context. Urban governance in Africa “cannot be uprooted from the historical-institutional context into which the paradigm of urban governance has been imported”.8 Lindell22 also argues that, due to extensive informalisation of economic activities in African cities (complexity of the space), Western assumptions of urban governance (for example the policy network approach) are not ideal to understand the African context. By analysing marketplaces in Maputo, Mozambique, Lindell22 develops a conceptualisation of urban governance, illustrating the complexity of the African city: “a range of actors, multiple sites, various layers of relations, a broad range of activities or practices…involving various modes of power, as well as different scales”. Resilience – the capacity to withstand a crisis and recover rapidly – is informed by good urban governance.23 In line with the above, Rotberg24 advocates for assessing governance as an output. The performance of governments (their governance ability) needs to be measured by the delivery of political goods to citizens (in contrast to measuring input, a more Western-centric approach). If governance is measured as an output-oriented approach, it becomes tangible and the result is about the quantity and quality of government services.24 The provision of political goods regards outputs, but also “outcomes…the consequences of outputs – consequences for the people, for the society as a whole, or for some subset other than the polity”25. Good governance (in the urban space) refers to “a multidimensional concept that focuses on the improvement of the quality of living conditions of local citizens, especially those of marginalised and disadvantaged communities”23 and is often linked to deliverables, for example, safety of citizens, provision of health care, and a beneficial commerce environment.23 Rotberg specifies a hierarchy of political goods, of which the supply of security (specifically human security) is the most important one.26-28 Security includes the prevention of cross-border invasions and infiltrations and defusing domestic threats, with the potential to undermine social order.26-28 The notion of human security focusses on the safeguarding of the individual; thus, the unit of analysis moves from the national level to the individual level. Other political goods include political freedom (freedom to participate in political processes), medical and health care, schools and education, physical infrastructure, communication networks, money and banking systems, fiscal and institutional context, civil society, and environmental commons. Rotberg25 argues that, on a macro level (national), “the delivery of a range of other desirable political goods becomes possible when a reasonable measure of security has been sustained”. He also states that: “Only when reasonable provisions for security exist within a country, especially in a fragile, newly reconstructed nation-state in the developing world, can governments deliver other desirable political goods”.28 Security is to be guaranteed first, for the process of good governance to be initiated. Despite the complexity in measuring governance, the premise is that good governance or effective governance is directly related to the delivery of political goods.29 Rotberg’s conceptualisation of political goods relates to tangible and assessable outputs by the government (for example, health care and education), to satisfy the daily, basic needs of citizens of a state and generate possibilities for development.
This view of governance corresponds with the Worldwide Governance Indicators (WGI), referring to governance as the policy choices and implementation thereof, by those selected. Rotberg’s political goods can also be noted in the WGI’s six dimensions of governance: Voice and Accountability, Political Stability and Absence of Violence/Terrorism,
Government Effectiveness, Regulatory Quality, Rule of Law, and Control of Corruption.30,31 This article is informed by the complexity of governance in an urban space in southern Africa. Therefore, the outputorientated approach to the provision of tangible political goods is applied on a local level. The focus of the article is to assess the supply of goods, services and governance within communities faced with social and political exclusion during emergencies. This is done through a single case study research design and a qualitative methodology, as will be explained below.
Data collection during lockdown
The study received ethical clearance from the Research Ethics Committee: Social, Behavioural and Educational Research, Humanities of Stellenbosch University (Project number: 17325). Due to the pandemic, data collection techniques such as face-to-face key informant interviews and group discussions could not be used. Online interviews via platforms such as Microsoft Teams can, to a certain extent, fill the gap in data collection. However, only relying on this technique to obtain data, means losing out on what qualitative methodology is about in social science research: richness of context and insight into the world of the respondent. Therefore, the Ipsos AppLife mobile application was used to collect most of the data. The app can be downloaded on most smartphones and interaction on the app can be done offline, to be uploaded when connected to a data point. The app is described as a qualitative data collection tool, as it poses open-ended questions to respondents, and they can participate by using text, audio recordings or photos and videos. The app also allows for interaction between the researcher and the participants. It is an attempt to blend elements from observation, key informant interviews and small group discussions. For this study, 34 respondents were randomly selected from an Ipsos database and invited to participate. Sourcing was conducted in three locations on the Cape Flats: Bonteheuwel, Lentegeur and Manenberg. The app was formally run for three days and remained open for five days, during which respondents had full access to all the themes and probes covered. The broad research themes were linked to political goods and operationalised. As the formal lifespan of the app was only three days, factors were grouped together for some days: getting to know you and safety and security (day one), delivery of services (day two) and communication and sources of information (day three). A list of the questions can be found in Supplementary appendix 1. During the data analysis process, two key informant interviews were conducted with a prominent community activist and a teacher, to discuss preliminary outcomes of the study.
Although the pre-set themes and open-ended questions mainly guided the interaction, respondents reacted favourably to ad-hoc probes. Interaction on the app resulted in an initially daunting amount of data: more than 50 media responses in audio recordings, images and video clips were captured along with 1440 text responses. The text responses quoted in this article are used verbatim and have not been edited. The app facilitated the collection of visual data, assisting in understanding the local context. Although it was impossible to make an emotional and expressive connection to the answers of the respondents, reactions such as fear, anger and frustration were singled out during the analysis of the audio and text files. Collecting data on such a platform remains a gamble. No response is guaranteed by the respondents and there is no minimum prescribed number of responses per question per respondent. The researcher has limited control of the research process and what respondents upload on the app. Some data can therefore be regarded as greatly sensitive but also potentially inappropriate. The process is also time intensive for the researcher, especially if every response is followed for the duration of the project, to initiate detailed themes for coding and analysis. A detailed list of the respondents can be found in Supplementary appendix 2; respondents who participated via the app were anonymised and ranked alphabetically, according to their first name. The data were received in the form of an MS Excel Spreadsheet, and separate media files. The analysis of the data was done in the form of coding: tags or labels were used to assign meaning to the descriptive information compiled during the study. Each of the text responses was manually coded through several rounds, to in the end assemble reoccurring and prominent topics and arguments presented by the respondents.
The failures of local governance, informal authorities, and the complexity of marginalised spaces
From the contextual part of the respondents’ feedback, socio-economic conditions appeared to be cyclical from generation to generation, as many of the respondents indicated that they lived with their extended family – parents, grandparents, siblings, aunt, or uncle – and that they were also born in the area in which they currently lived. Contributing to the perpetuation of generational challenges were a lack of employment and financial instability. The political good of education was also extensively mentioned: respondents referred to the need to complete their own education in addition to being able to provide their children with the opportunity to finish school. Education was accordingly highlighted as essential to improving respondents’ current conditions, but was a difficult goal to achieve. As in the case of education, there was a great need to improve their present conditions; an additional main goal for respondents was to be in the position to purchase a house outside of the area in which they currently lived. The following quote highlights the main goals and dreams echoed by respondents:
I have big dreams plans to one day own my own home maybe start my own business put my child through university etc, but one of my challenges is in order for me to make my dreams a reality is to first find myself a steady permanent job. I was retrenched in 2019 and 2020 was just a difficult year for us all especially for the job seekers looking for work because most companies was closed and ddnt hire, a lot of people were also retrenched from there jobs, some companies closed there doors permanently [sic] (Respondent 16, 2020)
Lack of housing remains a challenge for residents of the Cape Flats, confirming limited physical infrastructure as a political good. In some cases, residents get access to houses subsidised by the City of Cape Town, but reports indicate that there has been an increase in renting out city council homes to gangs which operate therefrom. The increase comes as a direct result of increased levels of unemployment32, and security in the community is compromised due to a lack of employment opportunities. Levels of comfort were generally low. This was mainly due to scarcity of goods, people not adhering to the government’s mandated protocols, and increased levels of crime. Local stores had very few essential products to rely on and minimal stock. There was also a significant increase in the price of essential (material) goods. What complicated the matter even further was the lack of their own transport and increased reliance on public transport: taxis were crowded as people rushed to get food and supplies and the alternative of using e-hailing services was very expensive. Limited reliable public transport was a key theme that emerged from this analysis. Lack of comfort was another prominent theme. For example, a respondent replied about ease of living during the lockdown:
Very uncomfortable, due to the fact that we had very little essentials to rely on, everything became very scares [scarce]…They looted the small tuckshops and stole whatever they could take. Being in an over populated area which we live in I feared that the virus could be knocking on my door as we do not have the necessary utilities to protect ourselves but do the basic to stay covered and wash your hands regularly [sic] (Respondent 8, 2020)
This was increased by residents not obeying the lockdown rules, for example, not practising social distancing, having gatherings, and not wearing masks. Respondents also felt that the loss of personal freedom curbed their comfort during this period.
Crime and criminality
During the analysis of the data, lawlessness emerged as a key thematic area of the study. This was triggered by the lockdown situation that facilitated conditions that enhanced operational ease for gangs. Daily
robberies occurred and respondents were scared to walk to the shops. As people could not afford to buy in bulk, they were forced to go to the local store every day. One respondent commented:
now that people can wear a mask a cover their face, gangsters use it to their advantage. Just add a cap and u can walk around as normal, you will not see the killer walking around the corner just a person u think is scared of covid [sic] (Respondent 7, 2020)
Due to the curfew and residents being required to be in their homes earlier than usual, respondents experienced an increase in car break-ins. Essential workers returning from nightshifts were also at increased risk of being targeted by robbers on their way home. The theme of lawlessness was also situated in the poor relationship between communities and law enforcement. There was also limited reporting of crimes and even more limited response by law enforcement. This speaks to a disconnect between governance layers and structures. Feedback was conclusive that law enforcement (police) was so focused on enforcing pandemic protocols, that they forgot about everyday crimes. Feeling unsafe in these communities was intensified by three main factors: fear of looting and riots (due to the lack of essential goods and the prohibitions on alcohol and cigarettes), fear of getting infected, and fear of gang activity. Residents were scared to report gang activities as they were afraid of being targeted by the gangs. People were also afraid of law enforcement officials during night patrols, as rumours did the rounds of officers entering private property without a justifiable reason to enter the premises. Police officers also allegedly used gas guns to shoot at children playing outside (Respondent 19, 2020). During January 2021, the army was deployed in many areas of the Cape Flats33 and, although the presence of the military usually results in an immediate drop in violent crime, it does not present these communities with any long-term improvement of the security conditions.
Reports surfaced in the media of prominent leaders of gangs operating soup kitchens and handing out food parcels to communities. The media also reported on a truce between prominent gang leaders, coordinated by a pastor not originally from the Cape Flats. Through his guidance, gang leaders worked together in handing out food parcels to the community.34 35 Although these acts did provide temporary relief, the ceasefire was short-lived, and acts of philanthropy were met with doubt. Gangs used the lockdown period as an opportunity to boost their image as benevolent dictators and create stronger ties with the local communities. Indeed, a key informant interview confirmed that these acts were used as a smokescreen to move illicit goods:
I followed it in fact, and he was just, uhm, manipulated and used again by the gang…that was the reality…because why it was in the Covid-19, and they needed to transport the drugs…because business was stagnated with the movement of people. The pastor in fact helped them by giving those food parcels out to people so the drugs could be transported, guns and hits could be done more directly in that process... business did not stop for the gang. Live stopped for most of the people, but for the gang nothing has stopped. They got avenues, like the pastor was a vehicle for them, to be operating still [sic] (Key informant interview 2, 2021)
Gang response to community needs and the provision of goods differed from group to group and neighbourhood to neighbourhood. There was no standardised or permanent approach, indicating various layers of governance in the urban space. This respondent commented on the delivery of food by the gangs during the lockdown:
It was only in fact for the gang members and the people that hold the guns and drugs…It was a form of payment because the work must go on… You could find anything in the community…it was the only space you would get. Cigarettes, alcohol, whatever you wanted the gang thrived more in Covid…Again, just like the state left our people
out and to dry and to die. And leave them on their own with the gangs, again it was like that [sic] (Key informant interview 2, 2021)
The rise in gang shootings was attributed to fights to keep control of territory, enforced by strict guarding of territory and goods. Gangs clashed frequently for control over the licit (extortion, for example, the abovementioned renting out of city council houses) and the illicit market (most noticeably drugs and guns). Gangs also used this time for increased and active recruiting of gang members, due to the sharp rise in unemployment and levels of poverty. A worrying trend that emerged was the increase in youth recruitment during the hard lockdown, again due to poverty, the prospect of employment, a sense of belonging and (illicit) activities to pass the time. During an interview, a community activist described a mother’s answer on how she can allow her seven-year-old son to join a gang:
Nobody cares what happens him. Nobody cares what happens to us. We have no one to call on. The gang sees to that the light is burning. We have a piece of bread. And at this moment that is all we need to survive [sic] (Key informant interview 2, 2021)
The increased insecurity facilitated further marginalisation of communities; this can also be referred to as territorial stigmatisation. Wacquant36 links the concept to “zones reserved for the urban outcasts… Whether or not these areas are in fact dilapidated and dangerous, and their population composed essentially of poor people, minorities and foreigners, matters little in the end: the prejudicial belief that they are suffices to set off socially noxious consequences”. What Wacquant36 describes rings true in the case of the Cape Flats, and this unfortunate description increased during the pandemic. It emerged that stronger community ties with gangs were not based on the provision of goods and services by the gangs, but out of (1) fear of the gang and (2) worsening socio-economic conditions. During this emergency, the criminal governance of spaces increased, recognising and in accordance with Lindell’s22 range of actors in the urban space. Certain territories remained under the control of gangs, and others shifted control, but spaces were not claimed back by either the state or the community. Findings on the theme of lawlessness correspond with the hierarchy of political goods. The provision of security was viewed as instrumental to good governance: regrettably, in this context, the conversations were dominated by poor provision of security by state structures and territorial security governance by the gangs. The lack of security and increased lawlessness perpetuated the Cape Flats as an urban outcast of the City of Cape Town.
Delivery of services
Reduced service delivery was a dominant thematic area. The theme rested on two factors: first was a disjoint between members of the community and government representatives, and the second was neglected maintenance of limited government services available. When probed if there was any contact with a ward councillor or a member of a political party during the lockdown, most of the respondents confirmed that they had no contact with a ward councillor and/or that they did not know who their local councillor was:
There was no contact with them during this period of lockdown. I wouldn’t know if it was that they were hiding or shying away from the issues but they were not seen or heard and clearly not taking any steps to make people in the community feel any safer or reassured during this time [sic]
(Respondent 31, 2020)
Respondents also commented on extremely poor service delivery, on output-based governance, and in some cases on service delivery that came to a complete standstill, for example, fixing of potholes, blocked drains, dumping sites and housing projects. The general feeling was that people were left to fend for themselves. Another theme that surfaced that illustrated the relationship with local government is political neglect: the government is not eager to help its people and no steps were taken by the government to make the people in the community feel safe. On the first mentioned topic, one respondent commented:
Government makes it hard for people like me to go apply for home loans as well as to start up a small business they will say yes, we here but our community suffers day in and out. So, our government must start to REALISE we not only here when it comes to voting. Main objective is government don’t support “GHETTO COMMUNITY’S [sic] (Respondent 4, 2020)
There is a disjoint between the community and both local and national structures of governance. This is based on strong feelings of continued marginalisation through territorial stigmatisation and the lack of provision of political goods in the form of basic service delivery. There is also resonance to governance complexities caused by vertically divided authority; different levels of government occupied by opposing political parties will often play a blaming game in cases of poor service delivery.3
On political participation, one respondent confirmed that they had contact with a ward councillor who gave out food parcels (Respondent 12, 2020). There was also a community WhatsApp group through which the ward councillor sent information related to the lockdowns (Respondent 24, 2020). Political response was based more on the individual involved (local councillor) rather than a political culture of participation and accountability by politicians. On the topic of food parcels, the theme of corruption emerged during a key informant interview. An acquaintance of the key informant explained: “during the hard lockdown last year the ward counsellor handed out parcels to her people, however, these parcels were handed out to the counsellor’s people, and she basically rationed the items from a bigger food parcel into smaller parcels” [sic] (Key informant interview 1, 2021). The respondent also mentioned another project that they were informed about, in which the provincial government assisted the national Department of Social Development. This was a once-off project to distribute food parcels to the community; however, it was unsuccessful as many people never received any food parcels (Key informant interview 1, 2021).
Some respondents mentioned that they had contact with the local neighbourhood watch as a way of involvement in an organised (community) response to community challenges; communities formed street committees and used this as a platform to get in contact with a local ward councillor (Respondent 24, 2020). Although these territories are regarded as part of the City of Cape Town by geographical ward inclusion and legislative authority, the delivery of these political goods is haphazard at best, and more compromised during an emergency. The local neighbourhood watch groups played an important role in community communication and planning around security (Respondents 15, 20 and 26; 2020).
With regard to health care and access to health care, when respondents visited healthcare facilities, services were experienced as poor or satisfactory, with very long waiting times. Healthcare facilities were full, with limited capacity to assist residents. Access was problematic for some; for example, one respondent commented that older members of the community had to rely on others to get their medication at the local clinic (Respondent 13, 2020). A few years before the lockdown, a provincial hospital in Manenberg was demolished, with the prospect of being rebuilt with better facilities. At the time of conducting the interviews, the space where the hospital once stood was an open field, filled with litter and rubble. It was confirmed during a key informant interview that the field is often the scene of rape and other crimes, and that bodies have been dumped there in the past (Key informant interview 2, 2021).
There were limited to no state-driven developmental projects; however, several community-organised projects were reported. Examples included soup kitchens, feeding projects, neighbourhood watch groups and smallscale job creation strategies. Food distribution initiatives were funded by local non-governmental organisations and produce donated by residents and local shops, or residents paid for the food out of their own pockets:
Yes, myself & a friend started handing out sandwiches to the kids in our street, from there we made 1 pot of soup per week and there after we
were blessed with basic items for food from family, friends and neighbours. We could then make 1pot of soup & 1 pot of food for our street kids & elderly. We started this without any financial support but with 10 loaves of bread & R50 polony. Doing this in this period was ensuring that residents gave not gone hungry during this time [sic] (Respondent 24, 2020)
When probed on what they would change if they were the councillor in charge, respondents focused on three main themes. First, creation of more opportunities for youth-related employment (indicative of the lack of the political good of education), skills development projects to ensure employment, and permanent food projects or community feeding schemes, for the unhoused and unemployed. Two community-based training workshops were also reported by the respondents: sports activities for children and the teaching of computer skills (Respondent 22, 2020; Respondent 29, 2020). This clearly illustrates the needs of the community, considering governance as an output.
Communication and knowledge
As distrust was a noticeable theme during the discussion of communication and knowledge, it is not surprising that the main method of communication during the lockdowns was social media: WhatsApp and Facebook. The reasoning for WhatsApp is that it is by far the cheapest way to communicate. Topics discussed during lockdown included: COVID-19 and if it is a hoax, local hotspots for the virus or outbreak areas, and COVID-19 rules and regulations. News on protocols and rules regarding the lockdown were also often sourced from Facebook. Information was more often sourced from smartphones and social media than from formal news outlets, such as television or radio, although it was mentioned that news sourced from television was the most accurate. This related to the president addressing citizens on protocols and developments. Respondents were often confronted with fake news, in the form of videos (most often via WhatsApp).
On thoughts and reflections on lockdown restrictions, respondents felt that the initial lockdown measures were important, reasonable, and appropriate. It was also regarded to be in the best interest of everyone, with reference to health and safety. Respondents felt comfortable sharing political opinions with friends and family, but not on broader social media platforms. They were, in fact, very cautious about sharing any opinion on social media in fear of negative reactions (misinterpretation). Although many respondents agreed with the restrictions, their political opinion and general judgement of the national government remained one of incompetence. Respondents expressed disappointment in the general political conditions of the country. One respondent also commented that a negative opinion of the national government on social media may hamper the possibility of securing employment in government in the future (Respondent 31, 2022). Another did not want to share their political opinion due to fear of losing their job (Respondent 7, 2020). Some respondents also expressed that there was no need to share their political opinion as nothing would change, and even that there was no need to have any political opinion, as the government did not care about poor people and governance would not improve:
…Not really, because it falls on deaf ears. I remember one of my friends posted on Facebook to say when are they bringing food parcels here to us, On the news you use to see how these food parcels was distributed to different areas bt never do you see people coming here to deliver-he never got response but they always posting stuff… Because most of the time it falls on deaf ears. You raise your opinions but nothing comes from it, you don’t even get responses sometimes… [sic]
(Respondent 16, 2020)
As with the provision of other political goods, communication and knowledge also mostly emerged from the community. Although the president was considered as a stable source of information, local governance structures were not relied upon to respond to the needs of the community. Respondents voiced limited need to participate in political
processes as they did not see the value, and expressions of political freedom were low. The theme of overall political neglect was thus echoed in obtaining reliable knowledge and communication, and in increased levels of distrust in political processes and governance structures.
Discussion: Sequence and context of political goods
Appropriate and timely response to an emergency can facilitate mitigation and reduce the immediate and lasting impact. To establish mitigation and reduction of the impact of an emergency in an urban space, two components need to be present: (1) high levels of community resilience and (2) strong state directives coordinating the response. The first can only be present in communities that have an adequate representation of political goods before the onset of the emergency. If this is not the case, the provision of goods and governance will further deteriorate during the period of calamity. The data provided above were collected in communities on the geographical outskirts of the City of Cape Town. Even though apartheid ended more than 30 years ago, the cycle of violence, unemployment and a lack of education continue in this part of the city. These issues were intensified during the pandemic. These communities experienced more unemployment, more poverty and hunger, less development and more insecurity and crime. The provision of political goods came from the community (non-formalised groups) and temporarily from criminal gangs. The latter came with haphazard rules and regulations, subject to change at the will of the various criminal groups. Local state level governance, measured as an output, declined. This article illuminates that, during this emergency, the main operational shortcoming of governance was the provision of security, and this overshadowed the entire lockdown period. It is therefore hypothesised that, regardless of the emergency, impediments in the provision of security will dominate the agenda of the provision of political goods. This occurs in the complex context of marginalised, developing communities, suffering from territorial stigmatisation36, located on the border of socioand political control. The complexity of the space is informed by the historical-institutional setting8, layers of relations, a variety of actors, numerous sources and methods of executing power, and a myriad of activities22. Therefore, the article motivates for a revised construction of the political good of security by providing it with a more human and social dimension. Within this complexity, the importance of the provision of security as a political good is not disputed: it is regarded as crucial. What differs, however, is the notion of sequence and context: in the above analysed micro setting, other political goods are not dependent on security, but rather the contrary. This can be explained by answering the following question: how do we improve the provision of security to strengthen community response and resilience during an emergency? By using an outcome- and output-based framework, security is the most important in the hierarchy of political goods, but it cannot be achieved in the surveyed communities without the fulfilment of the other political goods. Security is reliant on the presence of other political goods. In this context, different actors have different priorities, but in terms of governance, the provision of political goods (other than security) is the priority of the communities and should be for the government as well to subsequently curb criminal activity. Effective provision of security will be attained only with higher levels of political freedom, participation in political processes, medical and health care, effective communication networks and infrastructure, and education (not an exhaustive list). The presence of these political goods will position communities to better respond to an emergency, enhancing the safeguarding of the individual. To safeguard and provide individual and community security, other political goods, and their provision, need to be prioritised. If not, the cycle of insecurity will be perpetuated and deepened by future calamities. Local level governance will be improved by following an integrated approach to the provision of goods, not a hierarchical one. The provision of security in the promotion of good governance needs to be acknowledged.
Conclusion
Urban governance in Africa is leaping in importance, and traditional notions of governance should increasingly be challenged to best understand the concept and improve capacity in African cities. This article adopts the perception of governance as being measured in an
outcome-based approach. Although security is an essential political good, in this context, political goods cannot be fulfilled in a hierarchical manner. It is recommended that the notion of sequence (improved provision of other political goods to achieve stable levels of safety and security) and context (developing marginalised communities) is tested with similar cases on the continent: will the provision of state security be enhanced with higher levels of education, employment, political participation, and freedom? In essence, the bottom-up structure of achieving durable security in marginalised urban spaces warrants additional examination, to build resilience in communities located on the border of socio- and political control.
Acknowledgements
I am grateful to staff at the Ipsos Cape Town office (2020) who assisted with the technical part of the data collection process.
Funding
Funding was received from the South African National Research Foundation (grant no. 119508).
Data availability
The data supporting the results of this study are available upon request to the corresponding author.
Declaration of AI use
AI was not used in the preparation of this article.
Competing interests
I have no competing interests to declare.
References
1. OECD/UN ECA/AfDB. Africa’s urbanisation dynamics 2022: The economic power of Africa’s cities. Paris: OECD Publishing; 2022. https://doi.org/10.1 787/3834ed5b-en
2. Bello-Schünemann J, Aucoin C. African urban futures. African Futures Paper 20.2016 November. Available from: https://issafrica.org/research/papers/af rican-urban-futures
3. Resnick D. Urban governance and service delivery in African cities: The role of politics and policies. Dev Policy Rev. 2014;32(1):3–17. https://doi.org/1 0.1111/dpr.12066
4. Resnick D. The politics of urban governance in sub-saharan Africa. Reg Stud Reg. 2021;31(1):139–161. https://doi.org/10.1080/13597566.2020.1774371
5. Smith JM. Urban regime theory. In: Orum AM, editor. The Wiley Blackwell encyclopaedia of urban and regional studies. Hoboken, NJ: John Wiley & Sons; 2019. p. 1–9. https://doi.org/10.1002/9781118568446.eurs0389
6. Fernández IC, Manuel-Navarrete D, Torres-Salinas R. Breaking resilient patterns of inequality in Santiago de Chile: Challenges to navigate towards a more sustainable city. Sustainability. 2016;8(8), Art. #820. https://doi.org/ 10.3390/su8080820
7. Williams P. Urban violence in the Global South: Drug traffickers, gangs, and organized crime. In: Glass MR, Seybolt TB, Williams P, editors. Urban violence, resilience and security: Governance responses in the Global South. Cheltenham: Edward Elgar Publishing; 2022. p. 21–38.
8. Obeng-Odoom F. Urban governance in Africa today: Reframing, experiences and lessons. Growth Change. 2017;48(1):4–21. https://doi.org/10.1111/gr ow.12164
9. Rogerson J, Kotze N, Rogerson C. Addressing South Africa’s urban challenges. Urbani Izziv. 2014;25(Suppl:S1–S4. https://doi.org/10.5379/urbani-izziven-2014-25-supplement-000
10. City of Cape Town. State of Cape Town 2022. Cape Town: Research Branch, Policy and Strategy Department, Future Planning and Resilience Directorate, City of Cape Town; 2022. Available from: https://resource.capetown.gov.za /documentcentre/Documents/City%20research%20reports%20and%20revie w/State_Of_Cape_Town_Report_2022.pdf
11. Da Cruz NF, Rode F, McQuarrie M. New urban governance: A review of current themes and future priorities. J Urban Aff. 2018;41(1):1–19. https://doi.org/10 .1080/07352166.2018.1499416
12. Pieterse E. Building with ruins and dreams: Some thoughts on realising integrated urban development in south africa through crisis. Urban Stud. 2006;43(2):285–304. https://doi.org/10.1080/00420980500404020
13. Turok I, Visagie J. COVID-19 amplifies urban inequalities. S Afr J Sci. 2021;117(3/4), Art. #8939. https://doi.org/10.17159/sajs.2021/8939
14. Anaafo D, Owusu-Addo E, Takyi SA. Urban planning and public policy responses to the management of COVID-19 in Ghana. Cities Health. 2021;5(1):280–294. https://doi.org/10.1080/23748834.2021.1876392
15. Asante LA, Mills RO. Exploring the socio-economic impact of COVID-19 pandemic in marketplaces in urban ghana. Afr Spectr. 2020;55(2):170–181. https://doi.org/10.1177/0002039720943612
16. Schotte S, Zizzamia R. The livelihood impacts of COVID-19 in urban South Africa: A view from below. Soc Indic Res. 2023;165:1–30. https://doi.org/10 .1007/s11205-022-02978-7
17. Skinner C, Watson V. Planning and informal food traders under COVID-19: The South African case. Town Plan Rev. 2020;91(6):1–7. http://doi.org/10 .3828/tpr.2020.38
18. Van Belle S, Affun-Adegbulu C, Soors W, Srinivas PN, Hegel G, Van Damme W, et al. COVID-19 and informal settlements: An urgent call to rethink urban governance. Int J Equity Health. 2020;19, Art. #81. https://doi.org/10.1186 /s12939-020-01198-0
19. Lambrechts D. The impact of organised crime on state social control: Organised criminal groups and local governance on the Cape flats, Cape Town, South Africa. J South Afr Stud. 2012;38(4):787–807. https://doi.org/1 0.1080/03057070.2012.749060
20. Bushby H. Permacrisis declared Collins Dictionary word of the year. BBC. 2022 December 05. Available from: https://www.bbc.com/news/entertainm ent-arts-63458467
21. Obeng-Odoom F. On the origin, meaning, and evaluation of urban governance. Nor Geogr Tidsskr. - Nor. J. Geogr. 2012;66(4):204–212. https://doi.org/10. 1080/00291951.2012.707989
22. Lindell I. The multiple sites of urban governance: Insights from an African city. Urban Stud. 2008;45(9):1879–1901. https://doi.org/10.1177/0042098 008093382
23. Meyer N, Auriacombe C. Good urban governance and city resilience: An afrocentric approach to sustainable development. Sustainability. 2019;11(19), Art. #5514. https://doi.org/10.3390/su11195514
25. Pennock JR. Political development, political systems, and political goods. World Politics. 1966;18(3):415–434. https://doi.org/10.2307/2009763
26. Rotberg RI.Failed states, collapsed states, weak states: Causes and indicators. In: Rotberg RI, editor. State failure and state weakness in a time of terror. Washington DC: Brookings Institution Press; 2003. p. 1–25.
27. Rotberg RI.The failure and collapse of nation-states: Breakdown, prevention and repair. In: Rotberg RI, editor. When states fail: Causes and consequences. Princeton, NJ: Princeton University Press; 2004. p. 1–45.
28. Rotberg RI.Strengthening governance: Ranking countries would help. Wash Quart. 2004;28: 71–81. https://doi.org/10.1162/0163660042518215
29. Besançon M. Good governance rankings: The art of measurement. Somerville, MA: World Peace Foundation; 2003. p. 36.
30. Kaufmann D. It’s complicated: Lessons from 25 years of measuring governance. The Brookings Institution. 2021 September 30. Available from: https://www.brookings.edu/articles/its-complicated-lessons-from-25-year s-of-measuring-governance/
31. World Bank Group. Worldwide governance indicators [database on the Internet]. c2021 [cited 2023 Jul 20]. Available from: http://info.worldbank. org/governance/wgi/
32. Solomons L. Cape Town gang violence: Residents ‘renting’ their homes to gangsters to earn a quick living. News24. 2022 June 04. Available from: https://www.news24.com/news24/southafrica/news/pics-cape-town-gan g-violence-residents-renting-their-homes-to-gangsters-to-earn-a-quick-livin g-20220604
33. Bhengu L. Police confirm: Army patrolling streets of Cape Town, Garden Route to help enforce lockdown rules. News24. 2021 January 10. Available from: https://www.news24.com/news24/SouthAfrica/News/sandf-confirms-arm y-patrolling-streets-of-cape-town-garden-route-to-help-enforce-lockdown-r ules-20210110
34. DW. Cape Town gangs help feed poor devastated by lockdown. 2020 June 20. Available from: https://www.dw.com/en/cape-town-gangs-help-feed-poor-de vastated-by-lockdown/av-53724531
35. BBC. How coronavirus inspired a gangland truce in South Africa [video]. BBC. 2020 April 08. Available from: https://www.bbc.com/news/av/world-a frica-52205158
36. Wacquant L. Territorial stigmatization in the age of advanced marginality. Thesis Elev. 2007;91(1):66–77. https://doi.org/10.1177/0725513607082003
AUTHORS: Margaret P. Fitchett1
Patricia M. Saffy1
Carolyn M. Lewis1
AFFILIATION:
1Division of Emergency Medicine, Department of Family Medicine, Faculty of Health Sciences, University of the Witwatersrand, Johannesburg, South Africa
CORRESPONDENCE TO: Margaret Fitchett
EMAIL: mpfitchett@gmail.com
DATES:
Received: 27 June 2023
Revised: 14 Mar. 2024
Accepted: 01 Apr. 2024
Published: 31 July 2024
HOW TO CITE:
Fitchett MP, Saffy PM, Lewis CM. Availability of antidotes for drug poisonings and doctors’ perspectives thereof. S Afr J Sci. 2024;120(7/8), Art. #16394. https://doi.org/10.1715 9/sajs.2024/16394
ARTICLE INCLUDES:
☒ Peer review
☐ Supplementary material
DATA AVAILABILITY:
☐ Open data set
☐ All data included
☐ On request from author(s)
☒ Not available
☐ Not applicable
EDITORS: Pascal Bessong
Shane Redelinghuys
KEYWORDS: antidotes, poisoning, organophosphate, paracetamol, emergency department
FUNDING: None
Availability of antidotes for drug poisonings and doctors’ perspectives thereof
Drug poisoning is an important area of study in South Africa as a treatable cause of mortality. While research has been conducted on poisoning, there is a paucity of literature on the availability of antidotes in South Africa. The objectives of this study were to assess the availability of antidotes in selected teaching hospitals in the Southern Gauteng City-Region and to explore doctors’ experiences of antidote supply. The availability of antidotes in the emergency departments (EDs) and pharmacies was assessed and recorded using a data sheet that was completed in person at each of the teaching hospitals. A questionnaire exploring experiences of antidote supply was distributed to 126 doctors working in the EDs. Our results indicate that N-acetylcysteine, atropine, diazepam, clonazepam, sodium bicarbonate, vitamin K, calcium gluconate, naloxone, ethanol, and pyridoxine were present in all EDs; activated charcoal was present in 80%; lorazepam, glycopyrrolate, and calcium chloride in 60%; freeze-dried plasma in 40%; glucagon and desferrioxamine in 20%; and fresh frozen plasma, hydroxocobalamin, sodium nitrite, sodium thiosulfate, sodium calcium edetate, and intralipid were not present in any of the EDs. Doctors reported organophosphate poisoning and paracetamol overdose as the most common drug poisonings (81.7% and 14.3% of 126 respondents, respectively). Most doctors experienced no supply issues for N-acetylcysteine, calcium gluconate, sodium bicarbonate, or pyridoxine (85.7%, 83.3%, 87.3%, and 75.4% of 126 respondents, respectively). The antidotes to the most common poisonings reported by doctors were present in all EDs. However, concerns were raised about consistency of supply, which will be an important avenue for further research.
Significance:
• These findings highlight the lack of uniform availability of antidotes to common and critical drug poisonings in emergency departments.
• The experiences of doctors in Gauteng concerning the most commonly encountered poisonings contrast with existing literature from South Africa, suggesting regional differences within the country.
Introduction
Poisoning, both accidental and intentional, is a significant problem in South Africa.1-7 Accidental poisoning was reported to comprise 2.7% of external causes of accidental injury, which made up 66.5% of non-natural deaths in South Africa in 2016. Intentional self-harm, of which poisoning is one of multiple causes, is reported as 0.8% of non-natural deaths. Consequently, poisonings altogether account for approximately 2% of non-natural deaths in South Africa.8 Despite a low mortality, poisoning is a common presentation to emergency departments (EDs). Selfpoisoning accounted for 8.3% of all ED admissions over a 6-month period at Khayelitsha District Hospital in the Western Cape3, while Pelonomi Regional Hospital in Bloemfontein in the Free State had 260 incidents of deliberate self-poisoning in an 18-month study from January 2010 to July 20117. Antidotes are agents directed at treating or reversing the effects of specific poisons. While many poisons can be treated adequately with supportive care alone, there are some which benefit from specific antidotes.9
Globally, antidote availability has been shown to be of concern. Studies in Canada revealed that most hospitals did not stock all of the antidotes that were considered.10,11 A study in the UK similarly showed that while over 90% of hospitals sampled had the most commonly used antidotes, the less commonly used antidotes were less reliably stocked.12 In a Massachusetts (USA) survey, while 9.8% of the hospitals had stock of all antidotes assessed, fewer had a sufficient supply to treat even one adult.13 A Sri Lankan study of essential medicine availability in primary and secondary hospitals found none of the hospitals had 100% of the antidotes assessed available, with atropine, DL-methionine, and naloxone being the most reliably stocked.14 In South Africa, a study on antidote availability reported tertiary public hospitals stocking only 46% of antidotes considered, with secondary-level and private hospitals stocking less.15
While the types of poisoning cases that present to South African EDs have been documented in various regional studies, there is a paucity of studies about the availability of antidotes. This paucity presents challenges in determining whether there are shortages in supply that need to be addressed and whether this impacts patient mortality. There is also a lack of published data on the poisoning presentations seen in EDs in Gauteng as compared to other provinces. Therefore, in this study, we aimed to assess the availability of antidotes to poisonings, and doctors’ experiences thereof, in a selection of EDs in teaching hospitals in the Southern Gauteng City-Region of South Africa.
Methods
This cross-sectional observational and interrogative study took place from December 2020 to March 2021 in the EDs and pharmacies of five purposively selected teaching hospitals in the Southern Gauteng City-Region, namely Charlotte Maxeke Johannesburg Academic Hospital (CMJAH), Chris Hani Baragwanath Academic Hospital (CHBAH), Helen Joseph Hospital (HJH), Tambo Memorial Hospital (TMH) and Thelle Mogoerane Regional Hospital
(TMRH). These hospitals were chosen for their status as teaching hospitals including regional, tertiary, and central academic facilities, providing a cross-section of the variety of cases seen and ED total patient numbers. Their status as teaching hospitals is important in that it both provides a spectrum of doctors’ experience levels and because teaching hospitals have previously been found to be more likely to adequately stock antidotes.11 16
The antidotes assessed in this study were selected based on reports in the literature on the most common poisons implicated in ED presentations in South Africa (Table 1). The poisons were evaluated to isolate those with specific antidotes (Table 1).9 Activated charcoal and benzodiazepines were included as they are required for gut decontamination and treatment of seizures resulting from many poisons.9 Additionally, antidotes which are less commonly used but are still necessary to stock were identified using the World Health Organization (WHO) Model List of Essential Medicines.17 These antidotes include methylene blue, pyridoxine, sodium nitrite, sodium thiosulfate, hydroxocobalamin, sodium calcium edetate, and ethanol (fomepizole, the alternative antidote to toxic alcohol poisoning, was not included in this study as it is available only on a named patient basis from Equity pharmaceutical company after approval from the South African Health Products Regulatory Authority (SAHPRA)).17,18 Intralipid, the antidote for local anaesthetic toxicity, was included as local anaesthetics are widely used in EDs.19
Data collection took place in two stages. The first stage involved assessing the presence of antidotes in the EDs and pharmacies through completing one data sheet per hospital across five separate days in December 2020. The second stage explored the experiences of doctors through the use of a questionnaire administered in hard copy to the doctors working in the respective EDs from December 2020 to March 2021. Doctors were approached at academic meetings or at shift handover times and questionnaires were completed in the presence of the first author to ensure that there was no collaboration between respondents. Participants were given an information sheet before their participation and were made aware that they could withdraw their participation at any time.
The study population for the questionnaires consisted of any doctor in each ED who had worked there for more than 1 month. The temporal requirement addressed biases that might have arisen from respondents not yet having experienced the specific poisonings common to that ED. Part-time doctors were excluded from the study as they work less often in the specific ED and would thus be less accurate in attributing poisoning trends to an individual hospital. The study population was thus 168 doctors, with the sample size required to achieve a confidence interval of 95% with a margin of error of 5% being 118 doctors.20
The information from the data sheet and the data obtained from the questionnaires were captured on two separate spreadsheets. The variables considered in this study were: the most common poisonings, the presence or absence of specific antidotes, the quantity of each antidote, restrictions in access to each antidote, and doctors’ experiences of supply issues.
Data were manually classified and thereafter assessed using means, ranges, and percentages to draw comparisons between poisonings, antidotes, and the different hospitals. When analysing the section of the questionnaire on causes of shortages, if a range was given, the lower value was captured (for example, 4–5 was captured as 4). Frequency distributions were used to explore the results of Likert-style questions. Relationships between potentially associated factors were assessed using Pearson’s correlation coefficient, following confirmation that the data were normally distributed.
Ethics approval was granted by the University of the Witwatersrand Human Research Ethics Committee (Medical); clearance certificate number M200628 MED20-05-134.
Results
Demographics
A total of 126 respondents completed the questionnaire; 40 (31.7%) from HJH, 22 (17.5%) from CMJAH, 12 (9.5%) from TMRH, 27 (21.4%) from CHBAH, and 25 (19.8%) from TMH. The levels of expertise represented
was not included in this study due to concerns regarding safety in poly-pharmacy overdose and the risk of precipitating seizures.9
Table 1: Poisons commonly implicated in emergency department presentations in South Africa and their antidotes
were consultants (10; 7.9%), registrars (24; 19.0%), medical officers (MOs; 52; 41.3%), community service medical officers (CSMOs; 12; 9.5%) and interns (28; 22.2%) (Table 2). The duration of time spent by respondents in each ED was predominantly 1–6 months, but with longer time periods well represented (Table 2).
Presence of antidotes
The number of listed antidotes present in the ED ranged from 12 (48.0%) at TMH to 15 (60.0%) at TMRH. The pharmacy with the largest number of the listed antidotes available was at HJH with 18 (72.0%); the fewest antidotes (13; 52.0%) were available at the pharmacy of CMJAH.
N-acetylcysteine, atropine, clonazepam, calcium gluconate, naloxone, and pyridoxine were present in all EDs and pharmacies (Figure 1). Diazepam, vitamin K, ethanol, and sodium bicarbonate were present in all EDs but not all pharmacies, while glycopyrrolate, lorazepam and desferrioxamine were present in all pharmacies but not all EDs. Hydroxycobalamin, sodium nitrite, sodium thiosulfate, and sodium calcium edetate were absent in all EDs and pharmacies; pharmacists were asked about the individual drugs as well as the combination –Tripac-cyano – and they confirmed that none was stocked in any form. Haemosolvex, methylene blue, and intralipid were absent in all EDs but were present in some pharmacies.
The two regional hospitals (TMH and TMRH) did not have calcium chloride but they did have greater quantities of calcium gluconate than the other hospitals. Desferrioxamine was available at all of the hospital pharmacies, but only in the ED at TMRH. Similarly, methylene blue was available in four of the five hospital pharmacies but not stocked in any of the EDs. Intralipid was present in two of the pharmacies and in none of the EDs.
All the hospitals in this study have access to a blood bank from which fresh frozen plasma can be issued. Freeze-dried plasma was available in the ED at HJH and TMRH, in the pharmacy but not the ED at TMH, and was not available at CMJAH and CHBAH.
Antidote location within EDs
Benzodiazepines, all of which are schedule 5 drugs, are kept in locked cupboards (Table 3).18 Atropine, which is schedule 2, is kept in unlocked areas in all hospitals as 0.5 mg and 1 mg vials (Table 3).18 By contrast, the 100 mg vials are kept in locked cupboards in all EDs which stock this dose.
Perceived relative frequency of poisonings
The majority of respondents, both overall and at each hospital, named organophosphate poisoning as the most recent case (x = 74.6%; n = 126; range: 58.3% at TMRH to 86.4% at CMJAH; Figure 2). Paracetamol poisoning was the second most commonly noted as the most recent case at HJH and CMJAH. At CMJAH, this frequency is shared with polypharmacy, which is also the second most commonly noted as recent at CHBAH and TMH. The same number of doctors at TMH reported tricyclic antidepressant poisonings as the most recently experienced polypharmacy cases. Paracetamol poisoning was not reported as most recently experienced by any respondents at TMRH, CHBAH or TMH.
The majority of respondents reported organophosphate poisoning (x = 81.7%; n = 126; range: 72.5% at HJH to 96.3% at CHBAH; Figure 3) as the most common poisoning. It was ranked second most common by 12 (9.5%) respondents, third by 7 (5.6%), fourth by 2 (1.6%), and fifth by 1 (0.8%) respondent.
Paracetamol is the second most frequently reported poisoning as most common (x = 14.3%; n = 126; range: 0.0% at TMRH to 25.0% at HJH; Figure 3) and is most commonly reported as second most common across all hospitals (x = 44.4%; n = 126; range: 33.3% at TMRH to 74.1% at CHBAH; Figure 3). From third ranked onwards, there is more variety in poisonings reported and more varied dominance.
The relationship between the responses for the most recent poisoning and the first-ranked poisoning for organophosphate poisoning across hospitals demonstrated a very weak, statistically insignificant, correlation (r = 0.02, p = 0.9768). Of 103 doctors who reported organophosphate poisoning as first ranked, 82 experienced it as their most recent. There is a stronger, but statistically insignificant, correlation for paracetamol (r = 0.66, p = 0.2302) and polypharmacy (r = 0.08, p = 0.9044). The rest of the poisonings that were listed as the first most common were not mentioned by any respondent as the most recent, therefore no correlation could be calculated.
Shortages of antidotes
Doctors predominantly reported no supply issues for N-acetylcysteine, calcium gluconate, sodium bicarbonate, and pyridoxine, which is in keeping with the finding that all four of these antidotes were present in all the hospitals’ EDs (Figures 1 and 4). Sodium bicarbonate was the treatment most reliably reported as having no supply issues (x = 87.3%; n = 126; range: 77.7% at CHBAH to 100% at TMRH; Figure 4). Supply
HJH, Helen Joseph Hospital; CMJAH, Charlotte Maxeke Johannesburg Academic Hospital; TMRH, Thelle Mogoerane Regional Hospital; CHBAH, Chris Hani Baragwanath Academic Hospital; TMH, Tambo Memorial Hospital
Table 2: Doctors’ current roles and durations working in the emergency department (ED)
issues for atropine were reported by more than 20% of respondents at all hospitals except for TMH, where 25 (100%) respondents reported no supply issues (Figure 4). This finding is, however, not in keeping with the finding of atropine being stocked in all the hospitals’ EDs and pharmacies (Figure 1).
Lorazepam was the drug for which the greatest number of respondents reported supply issues (x = 42%; n = 126; range: 33.3% at TMRH to 50% at CMJAH), while clonazepam and diazepam had fewer responses indicating lack of supply – a result which is reflected by the finding that while diazepam and clonazepam were present in all of the hospitals’ EDs, lorazepam was only present in three of the five (60%) (Figures 1 and 4).
Methylene blue, sodium nitrite, sodium thiosulfate, sodium calcium edetate and glucagon had supply issues reported as unknown by the majority of respondents as they had not needed to use them (Figure 4).
Perceived reasons for supply issues
Inadequate stock from the pharmacy was ranked as the most frequent cause of supply problems (rank 5; x = 29.4%; n = 126; range: 25.0% at HJH to 33.3% at TMRH and CHBAH; Figure 5). Second most commonly rated as most frequent was that the antidote was not stocked (x = 25%; n = 126; range: 13.6% at CMJAH to 45.5% at TMRH). The cause ranked as least common for supply issues (rank 1) was patient load (x = 26.4%; n = 126; range: 22.7% at CMJAH to 33.3% at TMRH; Figure 5).
Key experiences of access
The most commonly experienced issue regarding access to antidotes related to atropine. Atropine 100 mg vials require section 21 forms to be
completed, which leads to difficulties accessing stock at times. While smaller vials were available at all hospitals, these can be time-consuming to use when a severe organophosphate poisoning case is treated.
Another common challenge raised by respondents was that of timeous replacement of the drugs after use, both when the pharmacies are closed after hours when the on-call pharmacist would have to assist and on a day-to-day basis when there is delayed ordering of stock by ED staff. A further concern raised was that of infrequently used antidotes not being stocked as they expire before use.
Discussion
Globally, the availability of antidotes for poisonings is reported as inadequate, both in variety and quantity.10-14 21 Antidotes for poisonings common within the populations studied are reported to be more reliably stocked.12 14 21 Similarly, in this study, none of the EDs had stock of all the antidotes surveyed, but the antidotes for the most common poisonings, as reported by the doctors, were present in all the EDs. However, when considering the reliability of supply, there were no antidotes for which all the doctors in any of the EDs reported having never experienced a supply issue. This suggests that, at times, the quantity of antidotes ordered is not adequate for the needs of the EDs. The authors of a prior study performed in Khayelitsha in the Western Cape reported that 79% of the poisoning cases had presented after hours, which reinforces the need highlighted in this study for an adequate supply of antidotes in the ED.3 As the presence of antidotes in the EDs and pharmacies was assessed on a single day in each hospital, prior shortages could be overlooked, which may reflect the doctors’ experiences reported in the
Figure 1: Antidote availability in emergency depar tments and pharmacies in five teaching hospitals in the Southern Gauteng City-Region of South Africa.
Table 3: Antidote location within the emergency departments (EDs) of five teaching hospitals in the Southern Gauteng City-Region of South Africa
questionnaire. Furthermore, the mere presence of the antidote does not ensure there is a sufficient quantity to treat the patient population; for example, the 7.7 g of pyridoxine available at CMJAH would potentially only be sufficient to treat one patient if the maximum dose of 5 g was required.22 23 This finding mirrors the results of a study in Massachusetts which found that, while 9.8% of the hospitals surveyed had stock of the antidotes assessed, fewer had sufficient supply to treat even one adult.13
To ensure that the appropriate antidotes are stocked in EDs in South Africa, various departments have input. If the antidote is not already available in the ED, or not on the essential drug list for the hospital level, a consultant or similar appropriate healthcare worker should motivate for the antidote to be ordered. If approved by the hospital pharmaceutical and therapeutics committee, the pharmacy will then order the appropriate drug if it is available at a reasonable cost. If the drug is unavailable or unregistered in South Africa, it may have to be ordered or sourced internationally using a section 21 form – the SAHPRA form for unregistered medicines.24 The perception of doctors that the most common reason for poor antidote supply is that there is inadequate stock from the pharmacy is in contrast to the finding that most antidotes were present in the pharmacies. The problem might lie in communication between the EDs and the pharmacies in terms of what
is needed and the quantities thereof. At TMRH, the doctors reported a lack of stock of antidotes as a reason for the lack of supply in far greater proportion than a lack of stock from the pharmacy, perhaps reflecting better communication between the ED and pharmacy at this hospital.
Studies done from 2003 to 2015 in other provinces in South Africa have reported the most common poisoning cases presenting to South African EDs as paracetamol, antihistamines, antihypertensives, and corrosive chemicals.1-5 7 Data from Gauteng and KwaZulu-Natal reported from eight hospitals show paraffin to be the most common poisoning presenting in 2005, but, of note, the two provinces were not compared in the study.25 A study reporting calls received over a 1-year period spanning 2008 to 2009 by the Tygerberg Poisons Information Centre, reflecting 42% of calls from the Western Cape and the remainder from the other provinces, noted irritants/corrosive substances to be the most commonly reported poisoning, followed by paracetamol, benzodiazepines, and then cholinesterase inhibitors.1 The linked study of patients presenting to Tygerberg Academic Hospital in the Western Cape during the same time span reported paracetamol as the most common poisoning presentation, followed by amitriptyline (a tricyclic antidepressant), antihistamines,
agents and then organophosphates, and notably that the most common poisoning cases
requiring ICU admission were amitriptyline and organophosphates.2 Similarly, a study based in the ICU and high-care area in an Eastern Cape hospital reported tricyclic antidepressants and organophosphates as the most common poisoning admissions for the 1-year study period spanning 2014 to 2015.6 A further study performed from 2014 to 2015 in a tertiary hospital in the Western Cape reported ingestion of prescription medication to be the most common poisoning presentation followed by non-prescription medication and other poisons being less common.26 Deliberate self-poisoning cases presenting to Pelonomi Hospital in Bloemfontein from 2010 to 2011 were reported as most commonly paracetamol followed by household chemicals.7 A recent study based in a Durban hospital’s ICU from 2015 to 2017 reported tricyclic antidepressants, antiepileptics, ethylene glycol, and isoniazid as the most commonly implicated poisons, while a prior study of patients
presenting to a regional hospital in Northern KwaZulu-Natal from 2012 to 2013 reported paracetamol overdose as the most common, followed by antiretroviral drugs and then organophosphates.5 27 In contrast to the data reported by these studies, organophosphate poisoning was reported as most common and as most recent by the majority of doctors in this study (Figure 6). The lack of a statistically significant correlation between the response of the most common and the most recent being organophosphate poisoning suggests that doctors are not being biased in their responses by what they had most recently treated. The contrast of the findings of this study with prior regional studies outside of Gauteng reporting organophosphate poisoning to be less common is also reflected in the National Institute for Communicable Diseases Notifiable Medical Condition reporting for agricultural or stock remedy poisoning (this category includes organophosphates) for March and April of 2023,
Figure 2: Most recent poisonings reported by doctors working in five teaching hospitals in the Southern Gauteng City-Region of South Africa.
HJH, Helen Joseph Hospital; CMJAH, Charlotte Maxeke Johannesburg Academic Hospital; TMRH, Thelle Mogoerane Regional Hospital; CHBAH, Chris Hani
Baragwanath Academic Hospital; TMH, Tambo Memorial Hospital
Figure 3: Most common poisonings reported by doctors working in the emergency eepartments of five teaching hospitals in the Southern Gauteng City-Region of South Africa.
noting that 44 of the 66 cases and 50 of the 75 cases for March and April, respectively, were from Gauteng.28 29 Regional differences in the common poisoning presentations (Figure 6) necessitate more specific local guidelines in terms of antidote supply, as needs would vary. Both studies reporting on ICU admissions specifically reported organophosphate poisoning as a common reason for ICU admission, which raises concern about the burden on ICU beds in Gauteng and the need for critical care in the ED for the larger proportion of patients presenting with this poisoning.2,6
Atropine, the antidote to the muscarinic effects of organophosphates, was present in all the EDs on the days on which data collection was performed. However, consistency of supply is of concern, as over 20% of doctors across the five EDs reported that supply problems had been experienced with this antidote. N-acetylcysteine, as the antidote for the second most common poisoning reported, had fewer supply issues reported by doctors, and was present in all EDs at the time of data collection – a finding that is in keeping with another study in South Africa that found N-acetylcysteine was well supplied.15
Figure 4: Experiences of antidote supply issues reported by doctors working in the emergency departments of five teaching hospitals in the Southern Gauteng City-Region of South Africa.
HJH, Helen Joseph Hospital; CMJAH, Charlotte Maxeke Johannesburg Academic Hospital; TMRH, Thelle Mogoerane Regional Hospital; CHBAH, Chris Hani Baragwanath Academic Hospital; TMH, Tambo Memorial Hospital
Reasons for antidote supply issues as ranked by respondents from the emergency departments of five teaching hospitals in the Southern Gauteng City-Region of South Africa.
indicating the most prevalent cases of poisoning in South African provinces based on information from the literature2-5 7 25 26 and this study.
Cyanide antidotes were absent in all hospitals as they are not listed in the South African Essential Drugs List.23 However, 'Tripac-Cyano', which is a cyanide antidote kit containing amyl nitrite for inhalation, sodium nitrite, and sodium thiosulphate, is listed in the South African Medicines Formulary, suggesting that it should be accessible.18 For all of the cyanide antidotes, the majority of respondents reported not knowing whether they were present as they had never needed them, suggesting that cyanide poisoning is not a common presentation to the hospitals in question or that the diagnosis is not actively pursued. Methylene blue, while present in many pharmacies, was absent in all EDs; this could be due to the worldwide shortage of methylene blue due to supply issues from the manufacturer.30 Intralipid was similarly absent from all the EDs and present in only two of the pharmacies; in this study we did not assess whether it was present in the operating theatres, which would be a helpful location to access.
Calcium chloride is not on code for regional hospitals, but calcium gluconate is listed on the Essential Drugs List for primary hospitals as well as higher levels of care.18 While calcium chloride contains a higher amount of elemental calcium than calcium gluconate (272 mg vs 92 mg), there is a risk of damage to veins, or to the tissue if there is extravasation.19 This risk leads to the recommendation that calcium chloride be administered through central venous access when feasible.19 By contrast, calcium gluconate may be administered safely through any intravenous access.
Certain poisonings have more than one antidote, leading to differences in what is stocked in each ED. The EDs that have freeze-dried plasma in addition to fresh frozen plasma in their blood bank are both mixed EDs that receive trauma cases as well as medical and surgical cases. That this antidote is more commonly ordered as a trauma resuscitation fluid than as an antidote for anticoagulant poisoning is reflected in the abundance of literature on freeze-dried plasma in the trauma setting.31,32 Despite fresh frozen plasma and freeze-dried plasma being ver y similar substances, fresh frozen plasma is issued by the blood bank and freezedried plasma by the pharmacy. As learned from personal communication with pharmacists at HJH, these substances are charged to different parts of the hospital's budget (blood products, including fresh frozen plasma, are charged via the provincial budget and freeze-dried plasma is charged directly via the hospital pharmacy budget), which raises further logistical and cost considerations which may deter hospitals from ordering freezedried plasma.
Across all the hospitals’ EDs there are a few distinct locations where antidotes were found, between open shelves in the areas where poisoned patients are treated, cupboards to which senior nurses hold the key, and cupboards to which doctors have access. This allows for treatment to be easily located once each new staff member to the unit is orientated to the specific ED. Certain drugs are kept in areas where access is tightly controlled in order to regulate use. Reasons for this include the potential for abuse, notably for the benzodiazepines and alcohol, and the need for section 21 motivation for 100 mg atropine vials.
Limitations of this study include the period across which the questionnaires were administered to the doctors, as experiences could change at different times of the year. In terms of data collection on the presence of antidotes in each hospital, a better comparison could have been made if data were collected on the same day at all the hospitals, as stock amounts are likely affected by day of the week and time of the month. Efforts were made to mitigate this limitation by ensuring that data collection was conducted on weekdays only, and during the same month to limit variation between months. The potential for recall bias when asking respondents for the most common poisoning is also a potential limitation. This limitation was accounted for by also asking respondents for the most recent case, with the lack of correlation between the responses for what is recent and what is common suggesting that recall bias was not a significant factor.
Conclusion
We aimed to assess the availability of antidotes and how this relates to doctors’ experiences of antidote supply. The teaching hospitals
surveyed stock the appropriate antidotes for the poisoning cases that are common in the population groups they serve, as reported by the doctors working in the EDs. Consistency of supply is of concern, especially for atropine and lorazepam, and more regular restocking or protocols surrounding minimum acceptable amounts of antidotes could help to prevent supply problems from occurring. Further research to quantify the prevalent poisoning cases and determine whether the less common poisonings are experienced more frequently than is perceived by doctors in this study could further inform the development of antidote stocking guidelines. In addition, a longitudinal study could offer valuable insights into the temporal changes in antidote availability.
Acknowledgements
We thank Prof. Jennifer Fitchett for her invaluable guidance and for her assistance with the statistical analysis of the data and the hospital staff who completed the questionnaires and aided in data collection.
Funding
We received no funding for this study.
Data availability
The ethical clearance granted was on the basis that data would be accessible only to the researchers. Data are available on request from the authors, subject to secondary ethical clearance.
Declaration of AI use
There was no use of AI in the writing of this article.
Authors’ contributions
M.P.F.: Conceptualisation, data collection, data analysis and writing –the initial draft, writing – revisions. P.M.S.: Conceptualisation, writing – revisions, student supervision. C.M.L: Conceptualisation, writing – revisions, student supervision. All authors read and approved the final manuscript.
Author information
M.P.F. is a lecturer in the Division of Emergency Medicine, Department of Family Medicine and Primary Care, Faculty of Health Sciences at the University of the Witwatersrand and works as an emergency physician at Far East Rand Hospital. She holds the qualifications MBBCh, DipPEC (SA), MMed (EM) and FCEM (SA). P.M.S. is a lecturer in the Division of Emergency Medicine, Department of Family Medicine and Primary Care, Faculty of Health Sciences at the University of the Witwatersrand and head of the Emergency Department at Helen Joseph Hospital. She holds the qualifications MBBCh, FCEM (SA), MSc (Med in EM), DipPEC (SA) and DA (SA). C.M.L. is a lecturer in the Division of Emergency Medicine, Department of Family Medicine and Primary Care, Faculty of Health Sciences at the University of the Witwatersrand and consultant in Emergency Medicine at University Hospital Wales – Cardiff. She holds the qualifications MBChB, FCEM (SA), MMed (EM), DipROM (RCS Ed) and DipPEC (SA).
Competing interests
M.P.F. and P.M.S. currently work in hospital emergency departments in Gauteng, there were no material conflicts of interest and no external funding sources.
References
1. Veale DJH, Wium CA, Muller GJ. Toxicovigilance I: A survey of acute poisonings in South Africa based on Tygerberg Poison Information Centre Data. S Afr Med J. 2013;103(5):293–297. https://doi.org/10.7196/SAMJ.6647
2. Veale DJH, Wium CA, Muller GJ. Toxicovigilance II: A survey of the spectrum of acute poisoning and current practices in the initial management of poisoning cases admitted to South African hospitals. S Afr Med J. 2013;103(5):298–303. https://doi.org/10.7196/SAMJ.6648
3. Van Hoving DJ, Hunter LD, Gerber RJ, Lategan HJ, Marks CJ. The burden of intentional self-poisoning on a district-level public Hospital in Cape Town, South Africa. Afr J Emerg Med. 2018;8:79–83. https://doi.org/10.1016/j.afj em.2018.03.002
4. Balme K, Roberts JC, Glasstone M, Curling L, Mann MD. The changing trends of childhood poisoning at a tertiary children’s hospital in South Africa. S Afr Med J. 2012;102(3):142–146. https://doi.org/10.7196/SAMJ.5149
5. Ani JO, Ross AJ, Campbell LM. A review of patients presenting to accident and emergency department with deliberate self-harm, KwaZulu-Natal, South Africa. Afr J Prm Health Care Fam Med. 2017;9(1), Art. #a1234. https://doi. org/10.4102/phcfm.v9i1.1234
6. Rowe K. The burden of drug overdose on critical care units in East London, South Africa. S Afr Med J. 2016;106(3):227–228. https://doi.org/10.7196/S AMJ.2016.v106i3.9933
7. Benedict MOA, van Loggerenberg CJ, Steinberg WJ. The profile of deliberate self-poisoning cases presenting at the emergency department of Pelonomi Regional Hospital, Bloemfontein. S Afr Fam Pract. 2019;61(1):11–17. https:/ /doi.org/10.1080/20786190.2018.1527133
8. Stats SA. Mortality and causes of death in South Africa, 2016: Findings from death notification. Statistical Release P0309.3. Pretoria: Stats SA; 2019.
10. Wiens MO, Zed PJ, Lepik KJ, Abu-Laban RB, Brubacher JR, Gorman SK, et al. Adequacy of antidote stocking in British Columbia hospitals: The 2005 Antidote Stocking Study. Can J Emerg Med. 2006;8(6):409–416. https://doi. org/10.1017/S1481803500014214
11. Juurlink DN, McGuigan MA, Paton TW, Redelmeier DA. Availability of antidotes at acute care hospitals in Ontario. Can Med Assoc J. 2001;165(1):27–30.
12. Thanacoody RHK, Aldridge G, Laing W, Dargan PI, Nash S, Thompson JP, et al. National audit of antidote stocking in acute hospitals in the UK. Emerg Med J. 2013;30:393–396. https://doi.org/10.1136/emermed-2012-201224
13. Woolf AD, Chrisanthus K. On-site availability of selected antidotes: Results of a survey of Massachusetts hospitals. Am J Emerg Med. 1997;15(1):62–66. https://doi.org/10.1016/S0735-6757(97)90051-6
14. Rathish D, Premarantha I, Jayathilake T, Kandegedara, C, Punchihewa K, Ananda L, et al. Availability of essential medicines in selected public, primary and secondary health care institutions of a rural Sri Lankan district: A spot survey. BMC Health Serv Res. 2017;17(1):11. https://doi.org/10.1186/s129 13-016-1969-2
15. Wium CA, Hoffman BA. Antidotes and their availability in South Africa. Clin Toxicol. 2009;47:77–80. https://doi.org/10.1080/15563650701877366
16. Gorman SK, Zed PJ, Purssell RA, Brubacher J, Willis GA. Antidote stocking in British Columbia hospitals. Can J Emerg Med. 2003;5(1):12–17. https://doi. org/10.1017/S1481803500008058
17. World Health Organization (WHO). World Health Organization model list of essential medicines 21st list. Geneva: WHO; 2019.
18. Rossiter D, editor. South African medicines formulary. 14th ed. Pretoria: South African Medical Association; 2022.
19. Walls RM, editor. Rosen’s emergency medicine concepts and clinical practice. 9th ed. Philadelphia: Elsevier; 2018.
20. Underhill L, Bradfield D. Introstat. University of Cape Town: Department of Statistical Sciences; 2013.
21. Fernandes LCR, Galvão TF, Ricardi AST, De Capitani EM, Hyslop S, Bucaretchi F. Antidote availability in the municipality of Campinas, São Paulo, Brazil. Sao Paulo Med J. 2017;135(1):15–22. https://doi.org/10.1590/1516-3180.201 6.00171120816
22. Bateman DN, Page CB. Antidotes to coumarins, isoniazid, methotrexate and thyroxine, toxins that work via metabolic processes. Br J Clin Pharmacol. 2015;81(3):437–445. https://doi.org/10.1111/bcp.12736
23. South African Department of Health. Essential drugs programme. Hospital level (Adults) Standard Treatment Guidelines and Essential Medicines List. 5th ed. Pretoria: National Department of Health; 2019.
24. Gauteng Department of Health. Guidelines for implementation of pharmaceutical and therapeutics committee in Gauteng province. 1st ed. Johannesburg: Gauteng Department of Health; 2013. Available from: https://siapsprogram.org/wp-content /uploads/2014/01/13-191-PTC-Guidelines-Gauteng-SA-FINAL.pdf
25. Malungu N, Ogunbanjo GA. A profile of acute poisoning at selected hospitals in South Africa. South Afr J Epidemiol Infect. 2009;24(2):14–16. https://doi. org/10.1080/10158782.2009.11441343
26. Pieterse D, Hoare J, Louw KA, Breet E, Henry M, Lewis I, et al. Methods of deliberate self-harm in a tertiary hospital in South Africa. S Afr J Psychiat. 2020;26(1):1–7. https://doi.org/10.4102/sajpsychiatry.v26i0.1399
27. Goga R, de Vasconcellos K, Singh D. Acute poisonings presenting to King Edward VIII hospital intensive care unit in Durban, South Africa. South Afr J Crit Care. 2021;37(1):10–15. https://doi.org/10.7196/SAJCC.2021.v37i1.408
28. South African National Institute for Communicable Diseases. NMC Surveillance report March 2023 [webpage on the Internet]. c2023 [cited 2023 Jun 06]. Available from: https://www.nicd.ac.za/nmc-overview/nmc-m onthly-surveillance-report
29. South African National Institute for Communicable Diseases. NMC Surveillance report April 2023 [webpage on the Internet]. c2023 [cited 2023 Jun 14]. Available from: https://www.nicd.ac.za/nmc-overview/nmc-monthl y-surveillance-report
30. American Society of Health-System Pharmacists (AHSP). Current drug shortages – Methylene blue. Bethesda: AHSP; 2020.
31. Mok G, Hoang R, Khan M, Pannell D, Peng H, Tien H, et al. Freeze-dried plasma for major trauma – Systematic review and meta-analysis. J Trauma Acute Care Surg. 2020;90(3):589–602. https://doi.org/10.1097/TA.0000000000003012
32. Feuerstein SJ, Skovmand K, Møller AM, Wildgaard K. Freeze-dried plasma in major haemorrhage: A systematic review. Vox Sang. 2020:115;263–274. https://doi.org/10.1111/vox.12898
AuthorS: Akwasi Boadu1 2 Rajshekhar Karpoormath1
Manimbulu Nlooto1 3
AFFILIAtIoNS:
1Synthetic and Medicinal Chemistry
Research Group, Department of Pharmaceutical Chemistry, Discipline of Pharmaceutical Sciences, School of Health Sciences, University of KwaZulu-Natal, Durban, South Africa
2Physical Sciences Department, Wesbury College of Science, Port Shepstone, South Africa
3Department of Pharmacy, School of Health Care Sciences, University of Limpopo, Polokwane, South Africa
CorrESPoNDENCE to: Akwasi Boadu
EMAIL: concordf14@gmail.com
DAtES:
r eceived: 02 Oct. 2022
r evised: 29 Mar. 2024
Accepted: 08 May 2024
Published: 31 July 2024
hoW to CItE:
Boadu A, Karpoormath R, Nlooto
M. Pharmaco-phytochemistry of esters isolated from leaf extracts of Spondias mombin as potential antiviral agents. S Afr J Sci. 2024;120(7/8), Art. #14913. https:// doi.org/10.17159/sajs.2024/14913
Pharmaco-phytochemistry of esters isolated from leaf extracts of Spondias mombin as potential antiviral agents
The present work reports on the isolation and characterisation of two novel antiviral ester compounds from dichloromethane leaf extracts of Spondias mombin (SM). The characterisation and structural elucidation were established from spectroscopic evidence of nuclear magnetic resonance, Fourier transform infrared and mass spectroscopy. The compounds identified were 6-methylheptyl pentadecanoate and 6-methylheptyl-15-(1,2,3,4,4a,8a-hexahydronaphthalen-1-yl)pentadecanoate. The novel isolated ester compounds were reported to have anti-rhino virus activity in silico against a known biological target (HsNMT1) that plays a key role in developing therapeutics against the common cold. Molecular docking analysis revealed the binding affinity across all targets within the range of 4.6 to 8.2 kcal/mol, whilst molecular dynamic simulation showed that systems attained good stability due to the maintenance of mean root-mean-square deviation values within the acceptable range of 1.5 2.5 Å. It can be concluded that the novel compounds are potential inhibitory candidates against rhinovirus protein target HsNMT1. However, in vitro and in vivo experiments are further required to validate the possible inhibitory candidates against rhinovirus disease (common cold).
Significance:
The significance of this study contributes to the scientific rationale for using SM leaf extracts to treat viral diseases. Two novel compounds, 6-methylheptyl pentadecanoate and 6-methylheptyl-15-(1,2,3,4,4a,8ahexahydronaphthalen-1-yl)pentadecanoate, were predicted through computer-aided techniques to possess anti-rhinovirus properties.
Introduction
Novel phytochemical compounds have diverse phytochemical and pharmacological properties. These phytochemicals are abundant in natural products1, with some used as new drugs, leading to drug discovery2 The combination of ethnomedicinal uses, phytochemistry and pharmacological properties of crude, fractionated and/or isolated, pure compounds against numerous biological targets has led to the discovery of numerous drugs for treating infectious diseases.3-5 Natural products, such as Spondias mombin (Anacardiaceae; SM) leaf extracts, have been used to treat several infectious diseases.6 The pharmacological activities of leaf extracts of S. mombin have been attributed to some bioactive compounds isolated from the medicinal plant. Some of these isolated compounds from leaf extracts of S. mombin include esters such as 3β-olean-12-en-3-yl (9Z)-hexadec-9-enoate7, chlorogenic acid butyl ester8 and caffeoyl ester9 10. The leaves are reported to be part of the medicinal plant, and are mostly used for treating viral respiratory infections such as rhinovirus in traditional African healing systems.11 Human rhinoviruses affect the upper and lower respiratory tract and cause common colds associated with pneumonia, wheezing and asthma.12
Isolated compounds from natural products are identified by several chromatographic and spectroscopic methods, such as thin layer chromatography (TLC), column chromatography (CC), Fourier transform infrared (FTIR) spectroscopy, gas chromatography and mass spectroscopy (GC–MS) and nuclear magnetic resonance (NMR), among others. These methods for the separation, identification and structural determination of phytochemicals are becoming increasingly powerful.13 TLC might be the simplest of all chromatographic methods, but it provides critical information for identifying compounds separated by other methods during the phytochemistry analysis of natural products.14
FTIR is known to identify only the types of functional groups in a compound, most commonly CH2, CH3, =CH, ≡CH, O–H, C=O, C–O, C=C, C≡C, C–O–C and C–C–O.15 FTIR and NMR analysis, coupled with mass spectroscopy (MS), are helpful tools in the structural elucidation of an isolated compound.
In order to assess the therapeutic potential of the selected compounds via in silico methods, it was necessary to identify a peculiar biological target. The prediction of the biological activities of the compounds was determined by utilising the PASSonline software.16 This software is used for the prediction of different physiological activities for multiple compounds, both natural and synthetic, based on their chemical formula. Additionally, PASSonline predicts pharmacological effects, mechanisms of action, adverse effects, interaction with metabolic enzymes and transporters, and influence on gene expression. It uses the 2D molecular fragments known as multilevel neighbours of atom descriptors, which postulates that a compound’s molecular structure may determine whether it is biological.17 With this software, the evaluated activity of a compound is estimated as probable activity (Pa) and probable inactivity (Pi).18
We aimed to isolate, identify, characterise and predict the antiviral properties of novel esters using computer-aided drug design methods on novel inhibitors of human rhinovirus protease through molecular docking and molecular dynamic simulation. The results reveal, for the first time, two ester compounds from S. mombin leaf extracts that possess antiviral properties in an in silico molecular target prediction.
Methods
Material processing and extraction
Fresh leaves of S. mombin Linn were collected from Cape Coast, Ghana, and authenticated. Leaves dried at room temperature were pulverised by using a hammer mill. The leaf powder of mass 100 g was initially defatted with 1 L of hexane and then extracted with 2 L DCM by cold maceration for 72 h until the solvent was clear. The extracts were filtered with filter paper and concentrated using a rotary evaporator under reduced pressure at 40 °C. The concentrate was completely dried with a weight of 5.19 g (5.17%) and denoted as SM-DCM.
General analytical information
1H and 13C NMR spectra were recorded on a Bruker AV 400 MHz instrument at 400 MHz (1H NMR) and 100 MHz (13C NMR). All 1H NMR spectra were measured in parts per million (ppm) downfield or relative to the residual proton signals of d1-chloroform (CDCl3,7.26 ppm). All 13C NMR spectra were reported in ppm relative to the residual carbon signals of CDCl3 (77.16 ppm). Coupling constants (J) are reported in Hertz (Hz). Multiplicity is indicated as follows: s (singlet), d (doublet), t (triplet), q (quartet), p (pentet) and m (multiplet).15 Thin layer chromatography (TLC) was performed on precoated Merck Silica gel 60 F254 plates using different polarities of hexane-ethyl acetate solvent systems, and compounds were visualised with UV light at 254 nm.19 The retention factor (Rf) values of the different spots that were observed were calculated.20
The Rf values were calculated using Equation 1:
R f = Distance traveled by the solute Distance traveled by the solvent
Equation 1
F TIR spectroscopy was performed using a PerkinElmer Spectrum 100 spectrophotometer at room temperature, whilst the MS of isolates was determined using a CombiFlash Purlon Mass Spectrometer (2000 Da Polarity Auto Switching).
Preliminary phytochemical screening of SM-DCM extract
Preliminary phytochemical screening was performed as a qualitative process to investigate the presence of different classes of phytochemicals according to standard procedures as reported by other authors.21,22 Briefly, crude DCM leaf extract of S. mombin was used for the qualitative analysis to determine the presence of alkaloids, steroid flavonoids, saponins, terpenoid tannins, anthraquinone derivatives and cardiac glycosides.
Column fractionation of SM-DCM mixture
The S. mombin DCM extract was loaded onto a glass column packed with silica gel. It was then eluted with mixtures of ethyl acetate and hexane of increasing gradient polarity, starting with 100% hexane to 100% ethyl acetate. One hundred and seventy-one fractions were collected in 50 mL aliquots. Based on their TLC analysis, aliquots 55–100 with a similar Rf value (retention factor), were bulked together (denoted C) for further separation of the two compounds. It was further separated using column chromatography with silica gel using a solvent mixture of gradient, ethyl acetate and hexane. Seventy fractions were collected in 10 mL aliquots, and based on the TLC, aliquots 1–23 were bulked into CS1 and 24 to 70 into CS2.
Characterisation of isolated compounds
Chemical shifts are reported for DSS-trimethyl singlet resonance at 0.0000 ppm and multiplicity.
Characterisation of 6-methylheptyl pentadecanoate (CS1)
A dark green solid, 6-methylheptyl pentadecanoate (CS1): FTIR (KBr) νmax cm−1: 2927 (CH2), 1748(C=O), 1465 (CH bending), 1220 (C–O), 725 (CH). 1H NMR (CDCl3, 400 MHz) δ1h (ppm): 3.96 (2 H, q, J = 2.56 Hz, H-8), 2.30 (2 H, q, J = 4.72 Hz, H-10), 1.64 (1 H, m, H-11), 1.55 (1 H, q, J = 5.96 Hz, H-2), 1.30 (30 H, m, H4–7, H-11–21), 0.90 (12 H, m, H1&3, H23&22). 13C NMR (CDCl3, 400 MHz) δ13C (ppm):
PASSonline software16 is used to predict physiological activities, pharmacological effects, mechanisms of action, toxic and adverse effects, interaction with metabolic enzymes and transporters and influence on gene expression for multiple compounds, both natural and synthetic, based on their chemical formula.
The evaluated activity of a compound is estimated as Pa and Pi.18 Compounds presenting Pa higher than Pi relative to a particular activity are considered feasible for that specific medical activity, and those with Pi higher than Pa are, therefore, eliminated. To this end, the selected compounds were assessed for their biological activities on PASSonline.
Molecular docking
The X-ray crystal structures of some selected rhinovirus antiviral targets (PDB ID: 5FX6, 5MU6, 4C2X and 1CQQ)23 were retrieved from the Protein Data Bank24. These structures were co-crystallised with native inhibitors that defined their respective binding sites. The structures, 5FX6, 5MU6, 4C2X and 1CQQ, were then prepared by using UCSF Chimera version 1.13.125 to remove all non-standard residues, and Modeller 9.25 version26 was employed to fix missing residues. The binding site residues were obtained by zoning the native inhibitors and selecting residues that lie within 5 Å for each target protein. Subsequently, the selected compounds were optimised using Avogadro 2.0 software and saved. Molecular docking was carried out for the three selected compounds against each of the rhinovirus target proteins using Prix software. The target that showed the best docking properties against all compounds was selected for molecular dynamics simulation.
Molecular dynamic simulation
Molecular dynamic (MD) simulations were performed using the AMBER18 GPU package for the best-docked ligand, CS1 and CS2, and IMP-1088 for the target (HsNMT1). The ligand and receptor were both defined and optimised using the AMBER force fields using the Antechamber and LEAP modules, respectively. Solvation and neutralisation were carried out on the receptor prior to its combination with the ligand. Partial minimisation of the receptor in the system was conducted for 2500 steps with a restraint potential of 500 kcal/mol Å2, followed by complete minimisation of 10 000. The system underwent heating at 300 K using a Langevin thermostat in a canonical ensemble (NVT). Equilibration of the system was carried out to ensure that AMBER rechecks the system, and it was at 300 K. MD simulation was run for 12 h at 100 ns, and results were obtained in the form of trajectories and analysed using statistics. The trajectories generated allow for the measurement of the binding energies of the association of the ligand with the receptor. The visualisation of the interactions was produced by Snapshots and Discovery Studio.
Binding free energy analysis via MM/GBSA method
The molecular mechanics/generalised-born surface area (MM/ GBSA)27 28 method was employed in estimating the binding free energy
for each of the inhibitor-bound systems. The binding free energy (ΔGbind) was calculated from the following equations:
ΔG bind = G complex – G receptor – G ligand
ΔG bind = E gas + ΔG sol TS,
Equation 2
Equation 3
where ΔGbind is the summation of the gas phase and solvation energy terms less the entropy (TS) term.
E gas = E int + E vdw + E lec
Equation 4
E gas is the sum of the AMBER force field internal energy terms Eint (bond, angle and torsion), the covalent van der Waals (Evdw) and the non-bonded electrostatic energy component (Elec). The solvation energy is calculated from the following equation:
G sol = G GB + G non-polar
G non polar = γSASA + b
Equation 5
Equation 6
where ΔGbind is taken to be the sum of the gas phase and solvation energy terms less the entropy (TΔS) term and GComplex represents the energy of the receptor–ligand complex, whilst Greceptor and Gligand represent the energies of receptor and ligand, respectively. Egas denotes gasphase energy; Eint signifies internal energy; and Eele and Evdw indicate the electrostatic and van der Waals contributions, respectively. Egas is the gas phase, elevated directly from the FF14SB force terms. Gasol denotes solvation-free energy and can be decomposed into polar and non-polar contribution states. The polar solvation contribution, GGB, is determined by solving the GB equation, whereas GSA, the non-polar solvation contribution, is estimated from the solvent-accessible surface area (SASA) determined using a water probe radius of 1.4 Å. T and S correspond to temperature and total solute entropy, respectively. γ is a constant.29 Per-residue decomposition analyses were also carried out to estimate the individual energy contribution of residues in the substrate pocket towards the affinity and stabilisation of each target.
r esults and discussion
Figures 1 and 3 show structures of isolated esters: 6-methylheptyl pentadecanoate and 6-methylheptyl 15-(1,2,3,4,4a,8a-hexahydronaphthalen-1-yl)pentadecanoate from DCM leaf extracts of S. mombin. The FTIR, NMR and MS/MS spectra of the isolated compounds are provided in Supplementary figures 1–14
Preliminary phytochemical screening and TLC test of compounds CS1 and CS2
Table 1 indicates a phytochemical test to examine the qualitative chemical constituents contained in leaf extracts of S. mombin. The phytochemical test revealed the presence of anthraquinone derivatives, steroids, tannins and cardiac glucosides. The results of the preliminary phytochemical screening are in line with reports by other authors.30 31
The percentage yield in this study was calculated using the weight of the extracted sample divided by the total sample used and found to be 11.14% (Table 2).
During the TLC test, the retention factor values obtained in this experiment (Table 3) did not give many clues as to the type of compounds in the
3: Thin layer chromatography test of
extract, but they did suggest the polarity of the compounds as reported by Talukdar et al.14 The authors indicated that a high Rf value in a less polar solvent system possesses low polarity.14
Structural elucidation of 6-methylheptyl pentadecanoate (CS1)
The FTIR spectrum was used to identify the functional groups of the active components present in the extract based on the peak values in the region of IR radiation. When the extract was analysed by FTIR, the functional groups of the components were separated based on their peak ratio.
The peak values were recorded in Supplementary table 1 and Supplementary figure 1 for CS1, indicating the carbonyl group, which represents an ester with C=O stretch, was observed at 1748.0 cm-1 with ver y strong intensity (1750 1735 cm-1).36 This is in line with the reported carbonyl group of 1750 cm-1 by Wang et al 36 At 1748.0 cm−1 , the peak assigned to C=O ester was confirmed by other researchers to be between 1734 and 1745 cm−1 37-39 An aliphatic ester O=C–O–C, with two bands, one stronger than the other, was also observed at 1220.0 cm1 (1160–1210 cm-1).40,41 As noted, the two bands at 1220.0 cm-1, with one stronger than the other, are attributed to the presence of an aliphatic ester C–O, although Jain et al.42 assigned a C–O stretching at 1253.97 and 1054.89 cm-1. Compound CS1 has bands at 2927.0 cm-1 that are due to the symmetric stretching of the SP3 carbon (C–H stretch), this wavelength being reported by other authors at a figure between 2961 cm-1 and 2923 cm-1 39,42-44 Findings from this study revealed a band at 1465.0 cm-1, indicating a C–H bending, although other investigators reported the C–H bending at 1470 cm-1 44
table 1: Preliminary phytochemical screening of SM-DCM extract
Class of phytochemicals tests performed
Alkaloids Meyer
Spondias mombin leaf extracts SM-DCM
Anthraquinone derivatives Bontrager test +
Steroids Liebermann-Burchard test +
Terpenoids Liebermann-Burchard test
Saponins Frothing
Flavonoids Sulfuric acid test
Tannins Ferric chloride test +
Cardiac glucosides Keller Killian +
Key: +, present; –, absent
table 2: Physical appearance, weight of dry crude extract per solvent of extraction and percentage (%) yield from 60 g SM dry powder
Physical appearance Yellowish green
table
CS1 and CS2
The NMR analysis of CS1, as referenced in Supplementary table 2, indicates that the proton shifts between carbons C1–C7 are aliphatic alkanes, with carbons C8, C10, C11 and C2 at 3.96 ppm (q, 2 H, J = 2.59 Hz, H-8)45, 2.30 ppm (q, 2 H, J = 4.72 Hz, H-10)6 46 47, 1.64 ppm (m, 1 H, H-11)48, 1.55 (1 H, q, J = 5.96 Hz, H-2) with 0.9 ppm (m, 12 H, H1&3, H23&22)48-51. Carbon C8 is an alkyl (–CH2) of the ester, with C10 showing a carbonyl ester group (O–CH2); this is in line with the literature and reported to be an alkyl adjacent to a heteroatom (R–O–CH2).36,48,52 Proton on carbon C10, indicated two hydrogen quartets at 2.30 ppm, which is in line with reports by Buckingham48, who also revealed a band at 2.30 ppm to be CH3COR. The singlet hydrogen, occurring at 7.25 ppm (7.05–7.25 ppm), indicates a proposed functional group of CR3R4R3 48
Supplementary table 4 indicates the analysis of the 13C NMR spectrum for CS1, which revealed that the 13C spectrum has approximately 16 carbon peaks (δ 10.97, 14.03–14.11, 22–25, 30, 32, 35, 36, 40, 68, 79 and 173.57 ppm), as expected given the top/bottom overlaps in the spectrum, with a strong carbonyl peak at 173.57 ppm assigned to carbon 9 (Figure 1).
The distortionless enhancement by polarisation transfer (DEPT-135), which shows all the resonances of protonated carbons, obviously distinguishes between the methyl (–CH3) (14.11, 14.04 and 10.97 ppm), methine (CH) (38.74 ppm) and methylene52 (–CH2) (66.63, 34.01, 31.93, 30.41, 29.70, 29.37, 28.92, 24.49, 23.79, 22.99, 22.69 ppm)52 53 of the ethyl chain (Supplementary figures 7 and 12). The peak, close to carbonyl at 66.63 ppm, was assigned to –CH2– carbon 8, that of tertiary carbon two at 34.01 ppm, whilst primary carbons 1 and 3
also appeared at 14.11 ppm and 14.04 ppm, respectively. The rest of the methylene carbons 4–7 could be seen at 29.37– 31.93 ppm (Figure 4).
Electron ionisation mass spectroscopy (EIMS) of the isolated compound CS1 showed a mass ion peak at m/z 355 [M + H] (Supplementary figure 3), from which a molecular formula of C23H46O2 was assigned. Typically, molecule CS1, at a retention time (Rt) of 0.714 min (Table 3), produces a precursor ion at m/z 355 [M + H], and the fragmentation of this molecule (Figure 2) generated product ions at m/z 298. These were derived from the loss of the isobutyl side chain (–57 Da) after a possible 1,3 methyl rearrangement of the isopropyl derivative of methylheptyl pentadecanoate to a more stable butyl pentadecanoate derivative (Figure 2). Product ions at m/z 284, due to the neutral loss of methyl ( 14 Da), and at m/z 266 (loss of propyl molecule) were also observed. Based on these data, CS1 was identified as 6-methylheptyl pentadecanoate.
We, therefore, propose the structure and IUPAC name for compound CS1 based on the information obtained as 6-methylheptyl pentadecanoate. The fragmentation pattern of 6-methylheptyl pentadecanoate was based on the analysis of mass spectroscopy in Supplementary figure 3. The fragmentation pattern is indicated below (Figure 2).
Structural elucidation of CS2
Similar to the FTIR analysis of Supplementary table 1 and Supplementary figure 2, compound 6-methylheptyl-15-(1,2,3,4,4a,8ahexahydronaphthalen-1-yl)pentadecanoate (CS2) indicates that the isolated compound is an ester. Evidence of the presence of an ester
Figure 1: Proposed structure of CS1-Compound 1.
Figure 2: Fragmentation pattern of CS1 from mass spectroscopy.
showed peaks at 1748 cm−1 and 1220 cm−1, indicating the functional groups of C=O and C–O, respectively.36 40 41
The NMR data analysis, as indicated in Supplementary table 3, revealed that compound CS2 showed proton shifts on carbons C10–C17 as aliphatic alkanes, –CH2–CH2 between 1.19 and 1.26 ppm (0.8–1.6 ppm).45 46 Protons on carbon numbers C18–C23 and C25–C28 indicate the presence of cyclic alkane, CH2–CH2–CH with shifts between 1.20 and 1.63 ppm (1.2–1.7 ppm).6 45 46 Similarly, proton shifts of carbons 5–8, between 5.80 and 7.29 ppm (4.0–7.3 ppm), indicate an alkene, HC=CH.54 55 A proton shift of 7.66 ppm on carbon 5, =CH, shows that the compound CS2 contains a cyclic alkene.54 Significantly, on compound CS2, the proton on carbon number 8 indicated an alkyl of ester, –OCH2 at 4.20 ppm (3.5–4.8 ppm), whilst the proton adjacent to C=O on carbon 10, 2.88 ppm (2.0–3.0 ppm), shows –CH.
Proton on carbon C8 confirms the ester nature of CS2.54,55 Supplementary table 5 indicates the analysis of 13C NMR spectrum, with approximately 19 carbon peaks (δ 10.98, 14.04, 14.11, 22.69, 22.96, 23.79, 24.48, 28.92, 29.37, 29.66, 29.70, 30.41, 31.93, 34.00, 38.74, 66.81, 114.03, 127.58 and 173.57 ppm), as expected given the overlaps in the spectrum, with a strong carbonyl peak at 173.57 ppm, assigned to carbon 9 (Figure 3).
The 2D NMR of the proposed compound, CS2, demonstrates varying coupling dimensions. A typical example is the two protons on carbon 10 close to the carbonyl moiety coupled with the adjacent proton on carbon 9 (Supplementary figure 13) as confirmed by HSQC Supplementary figure 14. Similarly, protons on carbons 12 and 13 can also be confirmed by the HSQC spectrum, which also coupled with each other to give triplets at δ 2.29 and 1.65. The methylene protons
Figure 3: Proposed structure of CS2–Compound 2.
Figure 4: Fragmentation pattern of CS2 from mass spectroscopy.
between carbon 4 and carbon 8, as well as carbon 14 and 23, shifted up field and overlapped at δ 1.261.
The mass spectrometric analysis of CS2, showed a mass ion peak at m/z 489 (M + H), from which a molecular formula of C33H60O2 was assigned (Supplementary figure 4). A retention time of (Rt) of 0.464 min (Table 3) produced a precursor ion at m/z 489 [M + H], and fragmentation of this molecule (Figure 4) generated product ions at m/z 414, derived from the loss of the isopentyl side chain (–75 Da), and m/z 359 due to the loss of propanol (–58 Da), m/z 300 also due to loss of the second propanol (–59 Da). Based on these data, in addition to the NMR and FTIR data, molecule CS2 was identified as 6-methylheptyl-15-(1,2,3,4,4a,8a-hexahydronaphthalen-1-yl)pentadecanoate. The fragmentation pattern of CS2 was based on the analysis of mass spectroscopy in Supplementary figure 4. The fragmentation pattern is indicated in Figure 4
Biological activity prediction
A biological activity spectrum for a substance is a list of biological activity types for which the probability to be revealed (Pa) and the probability not to be revealed (Pi) are calculated. Pa and Pi values are independent, and their values vary from 0 to 1. Biological activity spectra were predicted for the two isolated structures of 6-methylheptyl pentadecanoate and 6-methylheptyl-15-(1,2,3,4,4a,8a-hexahydronaphthalen1-yl)pentadecanoate via PASSonline 2005 version.56 Generally, in predicting the desired biological activity, Pa > Pi is considered feasible as there is a high chance of the compound revealing that activity. If Pa > 0.7, the compound is likely to reveal its activity in experiments, but in this case, the chance of being the analogue of the known pharmaceutical agent is high. If 0.5 < Pa < 0.7, the compound is likely to reveal this activity in experiments, but this is less, and the compound is not so similar to the known pharmaceutical agent. If Pa < 0.5, the compound is unlikely to reveal this activity in experiments, but if the presence of this activity is confirmed in the experiment, the compound might be a new chemical entity.
The biological activities predicted for each of the compounds herein include antieczematic, antiphobic, and antipruritic for CS1, as shown in Table 4, and antieczematic and antiulcerative for CS2, as shown in Table 4. Findings from the biological activity prediction show that both compounds had diverse activities towards different biological processes. However, the selected compounds were predicted to have a common antiviral property, particularly against rhinovirus.
In this study, special attention was given to certain reported activities of S. mombin that actively have antiviral properties.57 58 Hence, the selection of a suitable biological activity related to the antiviral activity of its isolated compounds, CS1 and CS2, was feasible. Additionally, the desired novelty of a chemical compound is important as well. The predicted Pa values for CS1 (0.655) and CS2 (0.643) both correlated to antiviral activity (rhinovirus), which falls within the 0.5 < Pa < 0.7 threshold correlating to a novel compound that has no known similarity to a known pharmaceutical agent. Subsequently, various antiviral
table 4: Predicted biological activity via PASSonline
Biological activity
CS1 CS2 Pa Pi Activity Pa Pi Activity
0.962
macromolecules were selected to test the efficiency of CS1 and CS2 via in silico molecular docking.
Molecular docking
Molecular docking of selected rhinovirus targets used was human rhinovirus HRV (5FX6), human N-myristoyltransferase-HsNMT1 (5MU6), human N-myristoyltransferases-HsNMT2 (4C2X), and rhinovirus 3C protease (1CQQ). The compounds showed good binding towards the selected targets, as evidenced by obtaining an overall binding affinity in the range of 4.6 to 8.2 kcal/mol across all targets, as shown in Table 5 However, CS1 and CS2 proved to have the best binding affinity when docked to HsNMT1 (5MU6), suggesting they may have potential activity towards the HsMNT1 micromolecule, which is a potential drug target in developing therapeutics against the common cold.
Analysis of molecular dynamic simulation
Molecular dynamic simulations were conducted to assess the conformation dynamics as well as the spatial distribution of atoms in the backbone structure of HsMNT1 upon binding of the compounds. MD simulations were also employed to further validate findings from molecular docking by showing the most stable conformations of the complexed structures across time. Post-MD analysis protocols, including root-mean-square deviation (RMSD), and root-mean-square fluctuation (RMSF), radius of gyration (RoG) and solvent-accessible surface area (SASA), were employed to provide insights on the structural impact of the phytochemical compounds on HsNMT1. An error assessment was also established in analysing all MD trajectories to consider technical and biological variability. Eliminating these systematic errors lowers experimental variability and makes it possible to determine the underlying dynamics of protein motion in cellular signalling with greater accuracy.
Structural stability of HsNMT1
A 150-ns MD simulation trajectory was established to analyse the conformational dynamics of the c-α atoms in the backbone structure of HsNMT1 in all the simulated systems. The root means square deviation gives an estimation of the protein convergence and stability of the simulated system. Furthermore, the RMSD value estimates the average variation in atomic displacement over a given period of time compared to a reference time.59 The acceptable threshold for an average change in RMSD of a protein-ligand complex is between 1 and 3 Å. If the RMSD average is more significant than this threshold, it implies there is an extensive conformational alteration in the structure of the protein. Findings show that systems converged early during the simulation and maintained steady atomic motions till the 150-ns simulation run, as shown in Figure 5A. The mean RMSD estimated for all the simulated systems were 1.88, 2.15, 1.54 and 1.83 Å for the unbound HsNMT1, 6-methylheptyl pentadecanoate, 6-methylheptyl-15-(1,2,3,4,4a,8ahexahydronaphthalen-1-yl)pentadecanoate and IMP-1088 complex systems, respectively. As observed from the findings, all systems attained good stability due to the maintenance of mean RMSD values
table 5: Molecular docking scores
within the acceptable range of 1.5 2.5 Å during the simulation. Also, good stability highlights the reliability of the simulated systems for further conformational analysis.
Structural flexibility of HsNMT1
The root means square fluctuations were assessed to determine the relative flexibility of the c-α atoms in the backbone structure of HsNMT1 upon binding of the inhibitors. As such, the RMSF values of the unbound HsNMT1, CS1, CS2 and IMP-1088 complexed with HsNMT1 were estimated to observe the change in protein structural flexibility during the simulation run. As shown in Figure 5B, all the selected compounds, including the reference IMP-1088 compound, show a peak area of the protein at Glu130, Leu175, Lys240, Ser315 and Thr395 residual positions that fluctuate the most during the simulation. It was observed that the amino acid residues where the reference IMP-1088 bound have similar structural behaviour as that of the phytochemically bound systems of HsMNT1. The mean RMSF values estimated were 0.98 ± 0.03, 1.01 ± 0.04, 0.87 ± 0.02 and 0.95 ± 0.03 Å for unbound HsNMT1, CS1, CS2 and IMP-1088, respectively, showing that the values are very close to each other. However, in comparing the relative flexibilities of the simulated systems, the complexed HsNMT1 systems show lower fluctuations in contrast to the native unbound system of HsNMT1, indicating that the bound inhibitors enact rigidity on the protein structure.
Radius of gyration
The spatial arrangement of atoms in a protein-ligand complex system around its axis is known as the radius of gyration (RoG).56 60 Estimating RoG is one of the most crucial indicators for predicting a macromolecule’s structural activity, and it provides insights into variations in the compactness of the protein complex. Therefore, the stability of the unbound HsNMT1, CS1, CS2 and IMP-1088 complexes was estimated by measuring RoG over the 150-ns simulation as shown in Figure 5C. The respective RoG averages computed were 21.85,
21.75, 21.77 and 21.78 Å for the Apo (HsNMT1), CS1, CS2 and IMP1088 systems. The similarity in mean values of the native unbound state (apo) of HsNMT1 and the bound complexes indicates that the selected compounds do not induce major conformational changes to the active site upon binding.
Solvent-accessible surface area
Solvent-accessible surface area (SASA) impacts the structure and activity of biological macromolecules. SASA analysis provides important insights into residual exposure to surrounding solvent molecules during the simulation. Furthermore, due to the location of active site residues at the surface of the protein, greater insight into residue accessibility to solvent would be important in understanding the solvent-like behaviour (hydrophilic or hydrophobic) of a molecule as well as the protein–ligand complex.61,62 SASA analysis can also be used to describe protein folding and unfolding.61 As such, the SASA for the simulated systems was computed, as shown in Figure 5D. The averages estimated for the simulated systems were 18570.40, 17877.74, 17707.02 and 18000.32 Å2 for the Apo (iron-free), CS1, CS2 and Imp-1088, respectively. The SASA values of the complexed systems were slightly lower than those of the unbound HsNMT1 system, indicating a lower surface area exposed to solvent. The binding of the inhibitors induces rigidity in the amino acids in the structure of HsNMT1 upon binding. Findings further highlight the similarity in the structural impact of the compounds and the reference inhibitor of HsNMT1.
Binding free energy
The mechanics/generalised-born surface area (MM/GBSA) method was employed to estimate the binding free energetics of the complexed systems of CS1 and CS2, including the reference IMP-1088 compound. It is well recognised that the MM/GBSA method for predicting binding energy is more accurate than most molecular docking scoring functions and computationally less complex than alchemical free energy techniques.63-66
alterations upon binding of the compounds
reference
which indicate the compounds induced relative stability on the
(B) The RMSF plots indicating peak regions of residual fluctuations. (C) Relative compactness of all simulated systems of complex structures and the unbound (Apo) system. (D) The surface area exposed to solvent between the simulated systems.
Figure 5: Comparative C-α RMSD, RMSF, RoG and SASA plots showing conformational
and
compound to HsNMT1 over the 150-ns MD simulation time. (A) The RMSD plots,
HsNMT1 enzyme upon binding.
The computed binding free energies for the complexed systems of HsNMT1 were estimated to be 35.20 kcal/mol for CS1, 44.55 kcal/mol for CS2 and 47.06 kcal/mol for IMP-1088. Findings show that CS2 had the strongest binding free energy among the two compounds; however, both compounds demonstrated overall stronger energies than the reference compound used in the study. The results indicate that these compounds can be considered potential inhibitors of HsNMT1. Table 6 indicates the energy terms that contribute to the binding free energy, the most favourable components being the Δ�� ������, Δ�� ������ and Δ�� gas, whilst ΔGsol is unfavourable. The MM/GBSA method is a well-known technique that demonstrates computational effectiveness using implicit solvent and also offers a transparent environment for determining the physical causes of observed effects in protein-ligand interactions.28 66 Taken together, the energies presented by these compounds suggest the spontaneity, permeation and a measure of the reaction kinetics that characterise their complexing with the target protein.
Binding interactions
The types of interactions a molecule has in a target protein’s binding pocket emphasise how therapeutically effective it is for the protein.67 The binding interactions of CS1, CS2 and the reference IMP-1088 compound bound to HsNMT1 were assessed. The CS1 and CS2 as potential inhibitors were observed to engage in a variety of interactions involving conventional and carbon–hydrogen bonds, van der Waals and pi-alkyl, alkyl interaction as depicted in Figure 5. The variation in interaction types between the potential inhibitors and the binding site residues was attributed to the different molecular features. Assessing the interaction profile of the reference (IMP-1088) compounds showed similar interaction types, as observed in Figure 6. The interactions observed herein include conventional and carbon-hydrogen bonds, van der Waals and pi-alkyl, alkyl interaction, pi–pi stacked, and pi–pi T-shaped. Findings revealed similar interactions with binding site residue between the compounds and the reference compound, suggesting CS1
Figure 6: 2D molecular interactions of inhibitors (A) CS1, (B) CS2 and (C) IMP-1088 within the binding site of HsNMT1 showing similar interactions with the binding site residues, suggesting the compounds have the potential to elicit similar therapeutic effects as reference IMP-1088.
table 6: Binding free energy estimations via MM/GBSA
and CS2 compounds may have the potential to elicit similar therapeutic effects against HsNMT1.
The outcome of this investigation highlighted several possible biological activities. However, the selection of suitable biological activity was considered based on a higher Pa value than a Pi value. Special attention was given to the reported biological activity associated with the S. mombin leaf extracts known to have antiviral activity. Thus, the suitable biological activity predicted for the two isolated novel esters was antiviral activity, particularly towards rhinovirus. Amongst the selected targets, CS1 and CS2 showed a higher binding potential for HsMNT1, an essential enzyme in treating the common cold. The MD simulation employed to test the effect of the compounds against HsNMT1 enzymes revealed that the compounds exhibited good stability, flexibility, structural rigidity, and reduced surface area exposed to solvents. These structural effects of the compounds towards HsNMT1 were similar to the structural effects of the reference inhibitor, suggesting the potential inhibitory effects of the compounds towards HsNMT1.
In silico molecular recognition protocols were employed to assess the pharmacological effects of the compounds CS1 and CS2 on the S. mombin leaf. The predicted biological activity for the two isolated novel esters was anti-rhinovirus activity.
Molecular docking analysis indicated that CS1 and CS2 showed a higher binding potential towards HsMNT1. The MM/GBSA method revealed stronger binding free energy in CS1 and CS2 than the reference compound. Assessment of binding interactions also shows similarity in interactions CS1, CS2 and the reference IMP-1088 inhibitor, indicating the potential to elicit similar therapeutic effects against HsNMT.
Conclusion
The current study of the phytochemical analysis of DCM leaf extracts of S. mombin led to the identification of two esters that had previously not been reported in the plant. These compounds, 6-methylheptyl pentadecanoate and 6-methylheptyl-15-(1,2,3,4,4a,8a-hexahydronaphthalen1-yl)pentadecanoate, possess anti-rhino virus (HsNMT1) properties as indicated through an in silico molecular targeting prediction.
Further in vitro validation is required to optimise a potential drug candidate.
Funding
No funding was obtained.
Data availability
The data supporting the results of this study are included in the article and as supplementary material.
Declaration of AI use
AI was not used in the conceptualisation or preparation of the manuscript.
Authors’ contributions
A.B.: Conceptualisation, data collection, data analysis, writing – the initial draft. R.K.: Student supervision. M.N.: Student supervision. All authors read and approved the final manuscript.
Competing interests
The authors declare that they have no known competing financial interests or personal relationships that could have influenced the work reported here.
r eferences
1. Sasidharan S, Chen Y, Saravanan D, Sundram K, Latha LY. Extraction, isolation and characterization of bioactive compounds from plants’ extracts. Afr J Tradit Complement Altern Med. 2011; 8(1), Art. #60483. https://doi.org/1 0.4314/ajtcam.v8i1.60483
2. Anand U, Jacobo-Herrera N, Altemimi A, Lakhssassi N. A comprehensive review on medicinal plants as antimicrobial therapeutics: Potential avenues of biocompatible drug discovery. Metabolites. 2019; 9(11), Art. # 258. http s://doi.org/10.3390/metabo9110258
3. Mukherjee PK, Rai S, Kumar V, Mukherjee K, Hylands P, Hider R. Plants of Indian origin in drug discovery. Expert Opin Drug Discov. 2007; 2(5): 633–657. https://doi.org/10.1517/17460441.2.5.633
4. Balunas MJ, Kinghorn AD. Drug discovery from medicinal plants. Life Sci. 2005; 78(5): 431– 441. https://doi.org/10.1016/j.lfs.2005.09.012
5. Mustafa G, Arif R, Atta A, Sharif S, Jamil A. Bioactive compounds from medicinal plants and their importance in drug discovery in Pakistan. Matrix Sci Pharma. 2017; 1(1): 17– 26. https://doi.org/10.26480/msp.01.2017.1 7.26
6. Osuntokun OT. Synergistic efficacy of Aframomum melegueta [Roscoe] K. Schum and Spondias mombin (Linn), A predictive treatment of SARS-CoV-2 (COVID-19) Infection. J Biosci Bioeng. 2020; 1(2): 1– 8.
7. Fred-Jaiyesimi A, Kio A, Richard W. α-Amylase inhibitory effect of 3β-olean-12en-3-yl (9Z)-hexadec-9-enoate isolated from Spondias mombin leaf. Food Chem. 2009; 116(1): 285– 288. https://doi.org/10.1016/j.foodchem.2009.02.047
8. Corthout J, Pieters L, Claeys M, Berghe DV, Vlietinck A. Antiviral caffeoyl esters from Spondias mombin. Phytochemistry. 1992; 31(6): 1979– 1981. h ttps://doi.org/10.1016/0031-9422(92)80344-E
9. Ojo OA, Afon AA, Ojo AB, Ajiboye BO, Oyinloye BE, Kappo AP. Inhibitory effects of solvent-partitioned fractions of two Nigerian herbs (Spondias mombin Linn. and Mangifera indica L.) on α-amylase and α-glucosidase. Antioxididants. 2018; 7(6), Art. # 73. https://doi.org/10.3390/antiox70600 73
10. dos Santos Sampaio TI, de Melo NC, de Freitas Paiva BT, da Silva Aleluia GA, da Silva Neto FLP, da Silva HR , et al. Leaves of Spondias mombin L. a traditional anxiolytic and antidepressant: Pharmacological evaluation on zebrafish (Danio rerio). J Ethnopharmacol. 2018; 224: 563– 578. https://doi .org/10.1016/j.jep.2018.05.037
11. Cock IE, Van Vuuren SF. The traditional use of southern African medicinal plants in the treatment of viral respiratory diseases: A review of the ethnobotany and scientific evaluations. J Ethnopharmacol. 2020; 262, Art. # 113194. https://doi.org/10.1016/j.jep.2020.113194
12. Drysdale SB, Mejias A, Ramilo O. Rhinovirus-not just the common cold. J Infect. 2017; 74:S41–S46. https://doi.org/10.1016/S0163-4453(17)301 90-1
13. Revathi N, Dhanaraj T. Evaluation of bioactive phytochemicals in leaves extract of Dodonaea angustifolia using gas chromatography and mass spectroscopic technique. J Pharmacogn Phytochem. 2019; 8(3): 4406– 4409.
14. Talukdar AD, Choudhury MD, Chakraborty M, Dutta B. Phytochemical screening and TLC profiling of plant extracts of Cyathea gigantea (Wall. Ex. Hook.) Haltt. and Cyathea brunoniana. Wall. ex. Hook (Cl. & Bak.). Assam Univ J Sci Technol. 2010; 5(1): 70– 74.
15. Uli H, Noor A, Mandey FW, Sapar A. Isolation, identification and bioactivity test of non polar compounds on N-hexane extract of Haliclona (Reniera) fascigera from Samalona Island-Spermonde Archipelago. Marina Chimica Acta. 2016; 17(2).
16. Varnek A, Tropsha A, editors. Chemoinformatics approaches to virtual screening. Cambridge: Royal Society of Chemistry; 2008 . https://doi.org/ 10.1039/9781847558879
17. Lagunin A, Stepanchikova A, Filimonov D, Poroikov V. Internet server for on-line prediction of the biological activity spectrum for a substance. Bioinformatics. 2000; 16(8): 747– 748. https://doi.org/10.1093/bioinformatics/16.8.747
18. Jairajpuri DS, Hussain A, Nasreen K, Mohammad T, Anjum F, Rehman MT , et al. Identification of natural compounds as potent inhibitors of SARS-CoV-2 main protease using combined docking and molecular dynamics simulations. Saudi J Biol Sci. 2021; 28(4): 2423– 2431. https://doi.org/10.1016/j.sjbs.2021.01.040
19. Cheng Z, Wu T. TLC bioautography: High throughput technique for screening of bioactive natural products. Comb Chem High T Scr. 2013; 16(7): 531–549. https://doi.org/10.2174/1386207311316070004
20. Djide MN. Sartini. Analisis mikrobiologi farmasi [Pharmaceutical microbiology analysis]. Makassar: Laboratory of Pharmaceutical Microbiology and Pharmaceutical Biotechnology, Faculty of Mathematics and Natural Sciences, Hasanudin University; 2008. Indonesian.
21. Shaikh JR, Patil M. Qualitative tests for preliminary phytochemical screening: An overview. Int J Chem Stud. 2020; 8(2): 603– 608. https://doi.org/10.222 71/chemi.2020.v8.i2i.8834
22. Pandith JI. Phytochemical screening of certain plant species of Agra city. J Drug Deliv Ther. 2012; 2(4), Art. #212. https://doi.org/10.22270/jddt.v2i4.212
23. Hofmann MH, Gmachl M, Ramharter J, Savarese F, Gerlach D, Marszalek JR , et al. Bi-3406, a potent and selective SOS1-KRAS interaction inhibitor, is effective in KRAS-driven cancers through combined MEK Inhibitionpan-KRAS SOS1 protein-protein interaction inhibitor Bi-3406. Cancer Discov. 2021; 11(1): 142– 157. https://doi.org/10.1158/2159-8290.CD-20-0142
24. Berman HM, Westbrook J, Feng Z, Gilliland G, Bhat TN, Weissig H , et al. The protein data bank. Nucleic Acids Res. 2000; 28(1): 235– 242. https://doi.or g/10.1093/nar/28.1.235
25. Eric FP, Thomas DG, Conrad CH, Gregory SC, Daniel MG, Elaine CM , et al. UCSF Chimera? A visualization system for exploratory research and analysis. J Comput Chem. 2004; 25(13): 1605– 1612. https://doi.org/10.1002/jcc.20084
26. Webb B, Sali A. Protein structure modeling with MODELLER. In: Kihara D, editors. Protein structure prediction: Methods in molecular biology. Volume 1137. New York: Humana Press; 2014. p. 1–15. https://doi.org/10.1007/97 8-1-4939-0366-5_1
27. Massova I, Kollman PA. Combined molecular mechanical and continuum solvent approach (MM-PBSA/GBSA) to predict ligand binding. Perspect Drug Discovery Des. 2000; 18(1): 113– 135. https://doi.org/10.1023/A:1008763014207
28. Genheden S, Kuhn O, Mikulskis P, Hoffmann D, Ryde U. The normal-mode entropy in the MM/GBSA method: Effect of system truncation, buffer region, and dielectric constant. J Chem Inf Model. 2012; 52(8): 2079– 2088. https:/ /doi.org/10.1021/ci3001919
29. Sitkoff D, Sharp KA, Honig B. Accurate calculation of hydration free energies using macroscopic solvent models. J Phys Chem. 1994; 98(7): 1978– 1988. https://doi.org/10.1021/j100058a043
30. Ugadu AF, Ominyi M, Ogbanshi M, Eze U. Phytochemical analysis of Spondias mombin. Int J Innov Res Dev. 2014; 3(9): 101– 107.
31. Sameh S, Al-Sayed E, Labib RM, Singab AN. Genus Spondias: A phytochemical and pharmacological review. Evid Based Complement Alternat Med. 2018; 2018, Art. #5382904. https://doi.org/10.1155/2018/5382904
32. Salifu EY, Issahaku AR, Agoni C, Ibrahim MA, Manimbulu N, Soliman ME. Prioritizing the catalytic gatekeepers through Pan-inhibitory mechanism of entrectinib against ALK, ROS1 and TrkA tyrosine kinases. Cell Biochem Biophys. 2022; 80(1): 11– 21. https://doi.org/10.1007/s12013-021-01052-2
33. Salifu EY, Agoni C, Soliman ME. Highlighting the mechanistic role of Olutasidenib (FT-2102) in the selective inhibition of mutated isocitrate dehydrogenase 1 (mIDH1) in cancer therapy. Inform Med Unlocked. 2022; 28, Art. # 100829. https://doi.org/10.1016/j.imu.2021.100829
34. Genheden S, Ryde U. The MM/PBSA and MM/GBSA methods to estimate ligand-binding affinities. Expert Opin Drug Discov. 2015; 10(5): 449– 461. h ttps://doi.org/10.1517/17460441.2015.1032936
35. Durrant JD, McCammon JA. Molecular dynamics simulations and drug discovery. BMC Biol. 2011; 9(1): 1– 9. https://doi.org/10.1186/1741-7007-9-71
36. Quach HT, Steeper RL, Griffin GW. An improved method for the extraction and thin-layer chromatography of chlorophyll a and b from spinach. J Chem Educ. 2004; 81(3), Art. # 385. https://doi.org/10.1021/ed081p385
37. Sathya S. Separation of algal pigments by thin layer chromatography (TLC) and high performance liquid chromatography (HPLC). World J Pharm Res. 2017; 6: 1275– 1284.
38. Sherma J, Fried B. Handbook of thin-layer chromatography. 3rd ed. Boca Raton, FL: CRC Press; 2003. https://doi.org/10.1201/9780203912430
39. Hamberg M, Samuelsson B. Prostaglandin endoperoxides. Novel transformations of arachidonic acid in human platelets. Proc Natl Acad Sci USA. 1974; 71(9): 3400– 3404. https://doi.org/10.1073/pnas.71.9.3400
40. Wang Y, Han Y, Hu W, Fu D, Wang G. Analytical strategies for chemical characterization of bio‐oil. J Sep Sci. 2020; 43(1): 360– 371. https://doi.o rg/10.1002/jssc.201901014
41. Baruah N, Dey SS, Nayak SK. Evaluation of dissolved gas analysis and longterm performance of non-edible natural ester. IEEE Trans Dielectr Electr Insul. 2020; 27(5): 1561– 1569. https://doi.org/10.1109/TDEI.2020.008768
42. Pratheeba T, Ragavendran C, Natarajan D. Larvicidal, pupicidal and adulticidal potential of Ocimum gratissimum plant leaf extracts against filariasis inducing vector. Int J Mosq Res. 2015; 2(2): 1– 8.
43. Udo GJ, Etesin UM, Awaka-Ama JJ, Nyong AE, Uwanta EJ. GCMS and FTIR spectroscopy characterization of Luffa cylindrica seed oil and biodiesel produced from the oil. Comm Phys Sci. 2010; 5(1–3).
44. Socrates G. Infrared and Raman characteristic group frequencies: Tables and charts. Hoboken, NJ: John Wiley & Sons; 2004.
45. Silverstein R, Bassler GC, Morrill TC. Sptrometric identification of organic compounds. New York: Wiley; 1981.
46. Jain P, Soni A, Jain P, Bhawsar J. Phytochemical analysis of Mentha spicata plant extract using UV-VIS, FTIR and GC/MS technique. J Chem Pharm Res. 2016; 8(2): 1– 6.
47. Karthikaiselvi R, Subhashini S. Study of adsorption properties and inhibition of mild steel corrosion in hydrochloric acid media by water soluble composite poly (vinyl alcohol-o-methoxy aniline). J Assoc Arab Univ Basic Appl Sci. 2014; 16: 74– 82. https://doi.org/10.1016/j.jaubas.2013.06.002
48. Pramila D, Xavier R, Marimuthu K, Kathiresan S, Khoo M, Senthilkumar M , et al. Phytochemical analysis and antimicrobial potential of methanolic leaf extract of peppermint (Mentha piperita: Lamiaceae). J Med Plant Res. 2012; 6(2): 331– 335. https://doi.org/10.5897/JMPR11.1232
49. Rakhmatullin IZ, Efimov SV, Klochkov AV, Gnezdilov OI, Varfolomeev MA, Klochkov VV.NMR chemical shifts of carbon atoms and characteristic shift ranges in the oil sample. Pet Res. 2022; 7(2): 269– 274. https://doi.org/10.1016/j.ptlrs.2021 .10.001
50. Osuntokun OT, Idowu T, Gamberini MC. Bio-guided isolation, purification and chemical characterization of epigallocatechin; epicatechin, stigmasterol, phytosterol from of ethyl acetate stem bark fraction of Spondias mombin (Linn.). Biochem Pharmacol. 2018; 7: 1. https://doi.org/10.4172/2167-0501.1000240
51. López-Camacho PY, Martínez-Espinosa JC, Basurto-Islas G, Torres-Zarraga A, Márquez-Villa JM, Macías-Alonso M , et al. Spondias mombin seed oil compounds identification by raman spectroscopy and NMR. Appl Sci. 2021; 11(6), Art. # 2886. https://doi.org/10.3390/app11062886
52. Buckingham A. Chemical shifts in the nuclear magnetic resonance spectra of molecules containing polar groups. Can J Chem. 1960; 38(2): 300– 307. htt ps://doi.org/10.1139/v60-040
53. Cao X, Lattao C, Pignatello JJ, Mao J, Schmidt-Rohr K. Sorption selectivity in natural organic matter probed with fully deuterium-exchanged and carbonyl13C-labeled benzophenone and 1H-13C NMR spectroscopy. Environ Sci Technol. 2014; 48(15): 8645– 8652. https://doi.org/10.1021/es501129f
54. Wu Q, Yu S, Hao N, Wells T Jr, Meng X, Li M , et al. Characterization of products from hydrothermal carbonization of pine. Bioresour Technol. 2017; 244: 78– 83. https://doi.org/10.1016/j.biortech.2017.07.138
55. Neiens SD, Geißlitz SM, Steinhaus M. Aroma-active compounds in Spondias mombin L. fruit pulp. Eur Food Res Technol. 2017; 243(6): 1073– 1081. htt ps://doi.org/10.1007/s00217-016-2825-7
56. Zheng C, Zhu M, Zhang D. Characterisation of asphaltenes extracted from an Indonesian oil sand using NMR, DEPT and MALDI-TOF. Energy Procedia. 2015; 75: 847– 852. https://doi.org/10.1016/j.egypro.2015.07.176
57. David AA, Oladele AA, Philip AO, Zabdiel AA, Olufunso AB, Tolulope OO, et al. Tropical Journal of natural product research. 2022;6(2):281–286.
58. Elufioye TO, Obuotor EM, Agbedahunsi JM, Adesanya SA. Anticholinesterase constituents from the leaves of Spondias mombin L.(Anacardiaceae). Biologics: Targets & Therapy. 2017; 11, Art. # 107. https://doi.org/10.2147/BTT.S136011
59. Echeme JO, Ahuchogu AA, Uchegbu RI. Spondias mombin Linn. Am J Chem Appl. 2014; 1(3): 28– 31.
60. Huynh T, Smith JC, Sanson A. Protein unfolding transitions in an intrinsically unstable annexin domain: Molecular dynamics simulation and comparison with nuclear magnetic resonance data. Biophys J. 2002; 83(2): 681– 698. h ttps://doi.org/10.1016/S0006-3495(02)75200-4
61. Osuntokun O, Ige O, Idowu T, Gamberini M. Bio-activity and spectral analysis of gas chromatography/mass spectroscopy (GCMS) profile of crude Spondias mombin extracts. SciFed J Anal Biochem. 2018; 1(2): 1– 12.
62. Fred-Jaiyesimi AA, Wilkins RM, Abo KA. Glucose lowering activities of mombintane I and mombintane II isolated from the leaves of Spondias mombin L. Int J Biol Chem Sci. 2017; 11(3): 1315– 1319. https://doi.org/1 0.4314/ijbcs.v11i3.31
https://doi.org/10.17159/sajs.2024/14913
63. Kufareva I, Abagyan R. Methods of protein structure comparison. In: Orry A, Abagyan R, editors. Homology modeling. Methods in molecular biology. Volume 857. Totowa, NJ: Humana Press ; 2011. p. 231– 257. https://doi.org /10.1007/978-1-61779-588-6_10
64. MIu L, Bogatyreva N, Galzitskaia O. Radius of gyration is indicator of compactness of protein structure. Mol Biol. 2008; 42(4): 701– 706. https:// doi.org/10.1134/S0026893308040195
65. Durham E, Dorr B, Woetzel N, Staritzbichler R, Meiler J. Solvent accessible surface area approximations for rapid and accurate protein structure prediction. J Mol Model. 2009; 15(9): 1093– 1108. https://doi.org/10.100 7/s00894-009-0454-9
66. Tiwari A, Mukherjee B, Dixit M. MicroRNA key to angiogenesis regulation: miRNA biology and therapy. Curr Cancer Drug Targets. 2018; 18(3): 266–277. https://doi.org/10.2174/1568009617666170630142725
67. Xue J, Huang X, Zhu Y. Using molecular dynamics simulations to evaluate active designs of cephradine hydrolase by molecular mechanics/PoissonBoltzmann surface area and molecular mechanics/generalized Born surface area methods. RSC Adv. 2019; 9(24): 13868– 13877. https://doi.org/10.10 39/C9RA02406A
AUTHORS:
Mary Maluleke1
Nic van Schalkwyk2
Anika de Beer2
Hendrik Smith1 3
James Blignaut1 2 3 4
Jaap Knot1
Gerrie Trytsman1
Liane Erasmus1
AFFILIATIONS:
1ASSET Research, Sedgefield, South Africa
2Restore Africa Funds, Stellenbosch, South Africa
3South African Environmental Observation Network (SAEON), Pretoria, South Africa
4School for Public Leadership, Stellenbosch University, Stellenbosch, South Africa
CORRESPONDENCE TO: Mary Maluleke
EMAIL: maryameliamaluleke@gmail.com
DATES:
Received: 24 Oct. 2023
Revised: 13 May 2024
Accepted: 15 May 2024
Published: 31 July 2024
HOW TO CITE:
Maluleke M, van Schalkwyk N, de Beer A, Smith H, Blignaut J, Knot J, et al. Comparing the financial benefits of different grain production systems in South Africa’s summer rainfall region.
S Afr J Sci. 2024;120(7/8), Art. #17091. https://doi.org/10.17159/sa js.2024/17091
ARTICLE INCLUDES:
☒ Peer review
☐ Supplementary material
DATA AVAILABILITY:
☐ Open data set
☐ All data included
☒ On request from author(s)
☐ Not available
☐ Not applicable
EDITORS: Teresa Coutinho
Lindah Muzangwa
KEYWORDS: crop production systems, conservation and regenerative agriculture, financial analysis, investment J-curve
FUNDING: None
Comparing the financial benefits of different grain production systems in South Africa’s summer rainfall region
There is growing evidence that soil degradation, among other factors, has led to both the decline and constraint of agriculture in southern Africa. Conservation and regenerative agriculture (CA/RA) have been proposed as a grain crop production system that could slow down, halt or even reverse some of these disturbing trends. But the question remains whether it is financially viable. We sought to find an answer to this question by comparing the financial returns of a CA/RA system over a 20-year period to its alternatives, namely conventional tillage (CT) and no-tillage (NT) production systems. The cumulative free cash flow (CFCF) of the average between the realistic and conservative CA/RA scenarios in year 20 is considerably higher than that of the other systems under investigation. The CFCF for CA/RA in year 20 in Mpumalanga is estimated to be ZAR86 million, compared to -ZAR51 million for CT and about ZAR4 million for NT. That is a net difference between ZAR137 million (compared to CT) and ZAR82 million (compared to NT). In the Maluti area, the CFCF for the CA/RA production system is estimated at ZAR26 million, compared to -ZAR66 million for CT and -ZAR19 million for NT. In the North-West production area, the CFCF for the CA/RA production system is estimated at ZAR35 million, compared to -ZAR9 million for CT and about ZAR21 million for NT. The differences between the CFCF of the CA/RA system and the other systems represent the financial opportunity cost of not converting to the CA/RA system.
Significance:
• Soil degradation leads to both the decline and constraint of agriculture in souther n Africa.
• Conser vation and regenerative agriculture (CA/RA) have been proposed as a grain crop production system that could slow down, halt or even reverse some of these disturbing trends.
• CA/RA are financially more viable in three grain production areas of South Africa.
• The cumulative free cash flow (CFCF) CA/RA in year 20 is considerably higher than that of the other systems.
• The differences between the CFCF of the CA/RA system and the other systems represent the financial opportunity cost of not converting to the CA/RA system.
Introduction
There is growing evidence that factors such as land and soil degradation, water insecurity and changes in climatic conditions have led to both the decline and constraint of agriculture at all levels in southern Africa.1-3 These factors pose a major risk to the continuity and sustainability of the sector with an adverse impact on national and household food security. Given the widespread poverty and South Africa’s precarious socio-economic context, the country is in great need of taking proactive steps to reduce all threats to food production.4 5 The agriculture sector, be it small-scale, subsistence or commercial, must adapt to the current conditions and mitigate the risk factors in a way that protects the environment and its natural resources and reinforces production and sustainability.6 7 To achieve this, the sector must embrace resilient, productive and profitable production systems that will restore, protect and sustain the health and productivity of the country’s natural resources, notably its soil.
According to the Food and Agriculture Organization of the United Nations8, about 60% of South Africa’s commercial farming sector, on an area basis, employs conventional deep-tillage and monocrop grain crop-livestock production systems. While this system has proven its high productive capacity in the past, it is very disruptive and leads to environmental degradation. This reduces a farm’s resilience, sustainability and profitability.9 10 Unfortunately, a vicious circle emerges. Conventional production systems’ focus on maximising yields on increasingly degraded and disturbed soils makes them more dependent on the intensive and increasing use of external inputs to boost productivity, manage diseases and control pests, which, in turn, leads to further degradation, the sterilisation of the soil, and increased land requirements.11-13 To combat this vicious circle of yield maximisation that requires high external inputs and leads to degradation that requires further external inputs to secure the yields, prudent or virtuous alternatives are required. These sought after virtuous alternatives must enable farmers to both adapt to climate variation and restore the land, while reducing the cost of production and upholding yield (Table 1).14-19
Conservation and regenerative agriculture (CA/RA) has been proposed as one such alternative and virtuous production system.20,21 CA/RA systems have gained much ground, mainly due to their long-term ecological and economic benefits.22-27 CA/RA is, however, not a recipe, but an approach embedded in five principles and practices: minimum soil disturbance, maximum cropping diversity, permanent organic soil cover, maintenance of a living root for as long as possible, and integration of livestock.28 29 Although CA/RA has gained momentum, the relative success, feasibility and applicability of the system are still debated.30-32 Questions have been raised about (1) the
Prevention of soil erosion and moisture depletion. Reduction of weed pressure and water loss. Improved soil aggregation, structure, aeration, infiltration, drainage, and nitrogen. Increased crop yields. Less greenhouse gases, time, and labour requirements. Improved energy efficiencies. Increased soil organic carbon. Reduced capital and operating costs.
Minimum soil erosion, compaction, pollution, and disturbance. Improved infiltration, water holding capacity and drought resilience. Improved soil aggregation, fertility, health, and nutrient cycling. Increased input use efficiency, atmospheric carbon drawdown, and soil organic carbon. Enhanced crop productivity and productive capacity. Long-term sustained yields and soil quality. Reduced capital, maintenance, and replacement costs. Improved farm profitability. Overall reduction in risk. Additional medium- to long-term economic gains. Strengthened financial position and sustainability. Higher levels of climate resilience and adaptation.
lack of evidence with respect to a detailed financial analysis that quantifies the real costs and benefits of adopting or switching to CA/RA, and (2) the perceived risk and uncertainty associated with the adoption of CA/RA due to its relatively high initial costs and management ambiguities. In light of this, the objectives of this study were the following:
• To evaluate the financial implications (costs and benefits) of adopting the CA/RA systems relative to both conventional tillage (CT) and no-till (NT) systems.
• To assess the short-, medium- and long-term risks associated with both the adoption and non-adoption of CA/RA, and what implications these have on food security and the food system.
Given these objectives, an answer to the following question was sought: Is CA/RA the more financially desirable management practice when compared to its alternatives, namely CT and NT? We sought to address this question by employing an Excel-based financial modelling approach using primary data for the three production systems (CA/RA, CT, and NT) from six fully statistical trials from three different summer rainfall grain production regions in South Africa. Herein, we do not argue for or against CA/RA’s claims with respect to its environmental benefits or its superior ability to adapt to climate change and other challenges. We seek to provide insights into the short-, medium- and long-term financial performance of the three crop production systems over a 20-year period.
Materials and
Site description
methods
Data from six on-farm trials in summer grain crop production areas in South Africa has been used. These areas are the Mpumalanga Highveld area (three trial sites), the Maluti area in the eastern Free State (two trial sites), and the North West Province (data from one study group and one trial) (see Figure 1). The latter data were collected by the Delareyville study group in cooperation with Noord-Wes Koöperasie (NWK), a local farmers’ cooperative, as well as an on-farm trial done in collaboration with the Ottosdal No-till Club. All the on-farm trials were implemented
Disadvantages (costs)
Loss of soil organic carbon, leading to an increase in soil degradation and compromised soil health. Increased soil erosion, soil structure breakdown, acidification, and compaction. Loss of soil nutrients. High dependence on the use of fertilisers and chemicals. Loss of biodiversity, and a decline in water quality and quantity. Overall alteration of on-farm ecosystem functions and services. Reduced farm capacity to respond to environmental challenges, resulting in elevated impacts of environmental challenges. Increased risk of reduced crop productivity. Increased costs of production. Reduced profitability. Increasing rates of debt-repayment defaulting. Extra fuel costs due to additional passes over fields.
Lower climate resilience. Limited soil organic carbon and soil restoration. Higher risk of possible crop failure or impaired crop production in adverse weather conditions. Possible reduced income.
A high initial livestock investment is required for soil restoration. Other additional financial expenses when introducing the principles of CA/RA, such as a no-tillage planter and cover crops in a crop rotation. Short-term profitability may decline. The time-lag effect (J-curve) on the benefits during the transition phase. The financial viability of cover crops. Associated trade-offs (lost/forgone cash crop revenue). Possible failure to successfully implement and manage the new system is often due to lack of resources, knowledge, and skills (knowledge- and management-intensive). Perceived risk of impaired crop and financial performance due to farm managerial competencies.
through the CA Farmer Innovation Programme (FIP) with funding from The Maize Trust and coordination by ASSET Research.33
The three regions lie in the summer grain crop production area of South Africa with average annual rainfall varying between 500 mm (in the west) and 900 mm (in the east). Daily maximum temperatures during the growing season are frequently above 20 °C, especially in the west. Rainfall in these areas typically occurs in the form of thunderstorms with frequent long dry spells in between. The arable soils in these crop production areas vary considerably. However, deep, well-drained sandy soils dominate in the dryer western parts, while shallower sandy-loam soils dominate in the wetter eastern areas. These soils naturally have low soil organic carbon (SOC) content of between around 1% in the west and 2% in the east. The average SOC level in soils under annual cropland in SouthAfrica has been reduced by 46% due to tillage34, and combined with bare fallow tilled fields, the soils are extremely susceptible to erosion, leading to average long-term soil loss rates from water erosion of 13 tonnes/ha/year under annual grain crops35. This is about equivalent to 3 tonnes of soil lost for every tonne of maize produced per year.
On-farm trials as the basis for innovation platforms and modelling
The on-farm trials were conducted for the 2020/2021 and 2021/2022 production seasons during which the three dominant farming systems discussed above, namely CT, NT and CA/RA, were compared. The basic description of the trial design and treatments at the sites, inclusive of the crop rotations followed, are shown in Table 2
Data collection
Trial data were collected on production income and input costs (expenditure) as per the typical production budget. These data were used to calculate various financial indicators, such as the gross and net margins of cash crops, cover crops and livestock production (see Table 3). Grain yield was determined per farm by the farmer using combined harvesters with digital yield report equipment, dividing the total kg of grain by the distance or area
CA/RA
Table 1: Advantages and disadvantages of alternative farming systems in South Africa
1: Map of the on-farm trial sites in the study.
Table 2: Farming systems definitions and region-specific crop rotation systems used in trials
System Definition
Type
Crop rotation system
Mpumalanga Highveld and Maluti Eastern Free State North West
Conventional tillage (CT)
Employed various primary and secondary tillage practices before planting with simple crop rotations and livestock grazing on the grazing lands (veld) only. Mixed system with livestock not integrated.
Increased use of pre- and post-emergence herbicides for weed control and the planting of a clean seedbed.
High rates of fertiliser use.
No tillage (NT)
Regenerative conservation agriculture (CA/RA)
Chemical weed, pest, and fungus control.
Employed no-tillage planters with simple rotations, and livestock grazing on the grazing lands (veld) only. Mixed system with livestock not integrated.
High rates of fertiliser inputs.
Employed no-tillage practices with a more complex crop rotation system (integrating cash crops with cover crops), while livestock is used intensively in both the grazing area and croplands.
Decreasing chemical control of weeds, pests and fungi and increasing use of bio-stimulants and bio-foliar.
Decreasing use of fertilisers.
A fully integrated crop-livestock system with seasonal rotations.
Maize and soya
Maize and sunflower
Maize and soya
Maize and sunflower
Note: SCC is a summer multi-species cover crop mixture; WCC is a winter cover crop mixture or grains.
Table 3: An outline of the income and expenditure data collected from the trials
Data collected
Income
Operating expenditure
Cash crops: sale of crops
Livestock related: grazing crop residue and grazing cover crop income
Cash crops: fertiliser, lime, foliar application, seed, inoculant, fuel, herbicide, insecticides/fungicide, marketing costs, repair and maintenance, interest on production credit
Sources of information
Grain SA, Trial and Delareyville study group data
Trial data
Grain SA, Trial and Delareyville study group data
Cover crops: fertiliser, seed, fuel, herbicides, repair and maintenance, interest on production credit Trial and Delareyville study group data
Livestock: veterinarian costs, licks, and other expenses
Tractors, planters and harvesters
Trailers, tillage implements, sprayers and lime distributors
Capital expenditure
Livestock: buying cattle for higher grazing intensities on cover crops and pasture
Other
Trial data
VKB and trial data
VKB and trial data
Trial data
VKB
Sources: The South African grain producer’s organisation, Grain SA36 | CA Farmer Innovation Programme trials | The local farmers’ cooperatives VKB (Vrystaat Koöperasie Beperk) and NWK (Noord-Wes Koöperasie) | The Delareyville study group. Income and operating expenditure data for CT, NT and CA/RA were obtained for two seasons, 2020/2021 and 2021/2022, for the Mpumalanga and Maluti regions, and only one season 2020/2021 for the North West region. Capital expenditure data was for the 2020/2021 financial period and varied per type and number of implements required by each farm (on which a trial was implemented) for all three farming systems and regions.
covered. All modelled yields were verified against the farm’s long-term averages. Grain income per ton was derived from SAFEX rates at the time of harvest minus a standardised fee for grain handling and storage. Additional income from livestock through grazing of crop residues and cover crops was derived from farm-collected production data, that is, dry matter (DM) yield of the cover crop, feed use efficiency and feed conversion ratios to determine kg of meat produced per ha multiplied by meat prices for the type of animal (i.e. beef, sheep) used. All farm expenditure was discussed and verified with the trial farmers based on their commercial enterprise experience. Actual costs were used for fertiliser, herbicide and pesticide rates applied, multiplied per unit cost as per that season’s farm expenditure sheets. Diesel prices would fluctuate during the season; therefore, one annual rate was used, based on the farmer’s price per litre of diesel. All commercial farmers are granted a lower diesel price than consumer pump prices due to bulk purchases. All farm equipment (mechanisation) passes are described per system. The diesel use per pass is based on the actual cost per farm, based on farmer experience. The diesel used per farm per pass can therefore differ per trial (and mechanisation tables) depending on the type of equipment and farm conditions. Farm expenditure included all variable input costs. Overhead costs were obtained per farm and verified per farming system (CA/RA, NT, and CT). Overhead costs differed per farm and comprised administration, land purchase and labour costs.
Model assumptions
Uniform assumptions
The Microsoft Excel-based financial cost-benefit model used the above trial design and data to calculate and compare a range of financial indicators for all the production systems at the six trial sites, most notably the cumulative free cash flows (CFCFs) (after taking into consideration loan settlements and the value of livestock at the end of the modeling period) and the average free cash flow/ha in real terms (AFCs). CFCF is defined as cash flow that is available to shareholders (the owners) of a company and is free of any claims from other stakeholders. The macro assumptions (see Table 4) have been kept uniform for all three production systems.
In addition to these macro assumptions (Table 4), we kept the production per production area and crop uniform (Figure 2). These are based on the averages obtainable in each production region. For cover crops, additional tonnes of biomass from both intercropping and double cover cropping were included. Unlike cash crops, covered crop biomass (yield) was included only under the CA/RA production system.
Production system-specific assumptions
Three sets of production system-specific assumptions were necessary. These relate to the cover crop utilisation, the efficiency of the major production inputs (fertiliser, herbicides, and pest control), and the capital replacement period of each. In addition, to allow for system-wide variation under the CA/RA system, optimistic and conservative scenarios were considered. These assumptions are as follows:
1. Intercrop utilisation
• Zero for CT and NT
• CA/RA
• Optimistic scenario: based on regional average biomass (Figure 2).
• Conservative scenario: reduced to accommodate internal and external conditions that might affect the planting, growth cycle and yield of cover crops. In the Mpumalanga region, maize intercrop and soya intercrop yields were reduced from 2 tons each to 1.2 and 1.5, respectively; in the Maluti region, these were reduced to 0.7 and 1, respectively, while for the North West these were reduced to 1 and 1.5 tons, respectively. Utilisation rates were not changed but kept the same as in the optimistic scenario (DCC = 50%, SCC = 50%, WCC = 70% and IC = 70%).
2. Cover crop utilisation:
• Zero for CT and NT
• CA/RA:
• Optimistic scenario: based on regional average biomass (Figure 2).
• Conservative scenario: reduced to accommodate internal and external conditions that might affect the planting, growth cycle and yield of cover crops. In the Mpumalanga and Maluti regions, SCC and WCC yields were reduced to 6 and 1.5 tons, respectively, while in the North West, these were reduced to 10 and 1.5, respectively. Utilisation rates were not changed but kept the same as in the optimistic scenario (DCC = 50%, SCC = 50%, WCC = 70% and IC = 70%).
Table 4: The macro assumptions used in the model kept uniform for all the production systems
Selling
of crops (ZAR/t, after 10% marketing commission)
Selling prices of cattle (ZAR/kg)
t DM/ha at a 65% utilisation rate in year 4, which was incrementally phased in from 40% in year 1 (per CT and NT)
Figure 2: Cash, intercrop and cover crop production and utilisation assumptions; kept uniform for all production systems.
3. Input efficiency (fertiliser, herbicides and pest control):
• CT: 0.5% increase in input volume required per annum, adding up to an overall 110% input requirement by year 20.
• This assumption is because tillage will continue degrading the soil’s fertility, which will require increasing amounts of synthetic fertilisers.40,41
• NT: kept constant at 100% of the initial input volume requirement.
• This assumption is because, while no-till systems do not lead to physical soil degradation, they also do not lead to an adequate restoration of soil health and fertility, lacking crop diversity, biomass, and livestock integration.42-44
• CA/RA:
• Optimistic scenario: Kept constant at 100% of the initial volume required during the first 4 years for Mpumalanga and Maluti (5 years for the North West), followed by a 10% annual decrease in volume for the next five years, and stabilised at 50% of the initial requirement thereafter.
• Conservative scenario: Kept constant at 100% of initial volume required during the first 4 years for Mpumalanga and Maluti (5 years for North West); followed by a 5% annual decrease in volume required for the next 10 years; stabilising at 50% of the initial requirement thereafter.
This assumption is based on sufficient evidence that fully integrated crop-livestock CA/RA systems lead to the restoration of soil health, increased natural fertility and, hence, the reduction of required synthetic fertiliser quantities.45–47
4. Capital replacement period:
• Every 5 years for CT and every 8 years for NT
• CA/RA:
• Optimistic scenario: every 8 years
• Conservative scenario: every 7 years
This assumption was based on data from VKB, farmer co-workers, and justified by the reduced number of passes and implements (units) in the NT and CA/RA systems.45 The conservative scenario is to accommodate the additional planting and harvesting of cover crops that is not applicable in the NT systems.
The modelling exercise, which ran over a period of 20 years, started with all the production systems on the same level, implying that they all had to incur the necessary costs (operating and capital) unique to each right at the start.
Results
We analysed the above-stated question of whether CA/RA is the more profitable practice compared to CT and NT in two ways. First, by observing the financial performance of each system by means of a year-on-year system-specific analysis of the average discounted free cash flow in real terms (AFC) (R/ha) and overall net benefit or cost (loss) achievable in each system. Figure 3 illustrates the region-specific AFCs/ha over 5-, 10-, 15- and 20-year periods to provide a regional overview of how each system performs on average. It should be noted that all cost values are inflated by 6% and all revenue values by 5%, as defined in Table 4. This implies a marginal reduction in nominal cash flows only offset by possible production changes, as highlighted above. To compare the results, we calculated real cash flows using a discount rate of 7%. Aside from any productivity gains, a declining trend in all the AFCs is thus to be expected. Second, we compared the relative financial performance of the three
different systems over the long term (20 years) by means of cumulative free cash flows (CFCFs). Finally, the results were broken into a financial analysis of the cost of major production inputs, total costs of production, revenue from crop and cattle production, and debt uptake.
A comparative analysis of the average discounted free cash flow in real terms of various summer grain production systems
The AFC/ha under the CT system in Mpumalanga declined significantly from about ZAR1 960/ha in year 5 to -ZAR900 in year 20 in real terms (Figure 3). The AFCs/ha under the NT system is relatively constant for the first 10 years at approximately ZAR2 200/ha, but then declines to about ZAR560/ha in real terms by year 20 due to cost-push effects. Both the optimistic and conservative scenarios of the CA/RA systems behave differently, following an inverse trend. The AFC at year 5 ranges between ZAR900/ha and ZAR2 760/ha, peaking at almost ZAR3 600/ha in year 10, and settles between ZAR1 130/ha and ZAR3 100/ha in real terms in year 20. There are, therefore, no negative cash flows over time in real terms despite the cost-push effects. The results in both Maluti and the North West (Figure 3) mirror those in Mpumalanga, albeit at a marginally lower level in Maluti. In the North West region, CT indicates longer periods of positive returns for the CT system than Maluti and Mpumalanga.
A comparative analysis of the CFCFs of various summer grain production systems
The CFCFs of the various production systems in the three areas are shown in Figure 4. There is a consistent trend across the three regions of high initial free cash flow accumulation under the CT production system that, over time, becomes an accumulated negative cash flow. The CFCF of the NT and conservative CA/RA scenarios track each other in most cases, with the CA/RA scenario slightly higher than the NT in Mpumalanga but lower in the North West and virtually the same for the Maluti region. The CFCFs of the optimistic scenario are at a much higher level in all cases. Despite this, the pattern of the CFCF follows what is known as the investment curve, also known as the J-curve. This curve indicates an initial decline in free cash flow for a period, whereafter it takes an upward turn, cumulating net positive cash flow. The results are summarised in Table 5. The average of the two CA/RA systems in year 20 is considerably higher than that of all the other systems for all three production areas. For example, the CFCF in year 20 for Mpumalanga is estimated to be ZAR86 million, compared to -ZAR51 million for CT and about ZAR4 million for NT. That is a net difference of between ZAR137 million when compared to CT and ZAR82 million compared to NT. The smallest difference is compared to the NT system in the North West of ZAR14 million. These differences represent the financial opportunity cost of not converting to CA/RA systems. No additional economic benefit with respect to any possible environmental benefit has been included.
A comparative breakdown of the cost, revenue and debt uptake of various summer grain production systems
Considering the total direct allocated variable cost (TDAVC) (ZAR/ha), Table 6 shows that, over the 20-year period, CT had the highest % growth rate followed by NT, while CA/RA have the lowest growth rate. The total cost of the four major production inputs also shows the same trend as the TDAVC/ha with fertiliser and herbicides as key drivers.
CT generated the highest total revenue from crop production throughout the 20-year period, followed by NT, while CA/RA generated the lowest crop revenue. However, the opposite is observed for total revenue from cattle production, where both CT and NT generate the lowest revenue relative to CA/RA, which has the highest revenue at an exponential rate. Figure 5 shows the total net accumulated cattle and crop revenue. Of the three systems, CA/ RA requires the most initial cattle investment (J-curve) throughout the period.
In terms of debt (loan repayments and finance costs), CT incurred the highest uptake over the period (shown by a steep upward trendline), followed by NT, while CA/RA incurred the lowest uptake. The same was observed for wear and tear (see Figure 6)
3: Mpumalanga
Maluti Eastern Free State, and North West – average free cash flow per ha in real terms (AFC/ha) over four different periods; the most plausible range for CA/RA has been indicated as a bar with the lower end reflecting the conservative value and the upper end reflecting the optimistic value.
Discussion
The results indicate that, in the short term (5 years), CT had the highest average free cash flow in real terms on a per-hectare basis, followed by NT with CA/RA producing the lowest returns on investment. In the long term (10–20 years), the opposite is observed, wherein CT produced the highest losses, followed by NT, while CA/RA produced the best return on investment. These results are consistent across the three regions, with minor variations.
Short-term financial implications of CT, NT and CA/RA production systems
The high initial gains under the CT system might be due to: the continued high cash flow generated from crop production (Figure 5); the absence of additional investments required for extra cattle (Table 7);
and relatively lower finance costs for the farm (Figure 6) and loan repayments toward additional cattle and infrastructure investments at the start of the period (Figure 6). Similar reasons apply for the high initial gains under NT farming. These positive returns, however, accrue for a relatively longer period than CT due to: relatively lower operational costs incurred through the years, resulting in prevailing cost savings; delayed capital replacement costs; and additional ecological benefits that translate into significant economic value to NT farmers and their operations (Tables 1 and 6).10 43 45 48 Contrariwise, the initial negative return (financial dip) observed under the CA/RA system is consistent with the general understanding in literature that farmers often experience an additional financial expense when introducing the principles of fully integrated CA/RA systems.49,50 The results of this study confirm that the main factor contributing to the initial dip relates to the additional livestock investment required as a
Figure
Highveld,
Figure 4: Cumulative free cash flows of the three regions over a 20-year period under CT, NT and CA/RA.
5: Cumulative free cash flow (CFCF) in year 20 for three production systems in three regions
Table 6: Total direct allocated variable cost (ZAR/ha) and total of four major inputs % difference over the 20-year period for three production systems in three regions
(year 1 vs year 19)
(year 2 vs year 20)
(year 1 vs year 19)
of four major inputs (fertiliser,
tool for soil restoration at the start of the period (Table 7). During the initial transition period, the incorporation of double-cover crops in the crop rotation system resulted in forgone cash crop revenue (Figure 5), while the average free cash flow of crops was still high.51 This situation changes after the transition period because the integration process has an associated time-lag effect wherein (1) the financial benefits (i.e. the reduction in inputs) of the additional financial investment and spending (on cattle) are not immediate but are dependent on the restoration process46; and (2) the average free cash flow of cropping
Looking at the CT results, the main contributing factors to this medium- to long-term decline in both AFCs/ha and CFCFs include the (1) year-on-year increase in the volume and cost of major production inputs (fertiliser, CFCF (ZAR millions) in year 20
under CT drops due to increasing volumes and costs of total direct allocated variable and capital costs.52
Medium- to long-term financial implications of CT, NT and CA/RA production systems
Table
Mpumalanga
Maize
Figure 5: Cumulative net cattle and crop production revenue over a 20-year period under CT, NT and CA/RA.
Table 7: Cumulative cattle investment (purchase cost) over a 20-year period under CT, NT and CA/RA over the 20-year period for three production systems in three regions
herbicides, pest control and fuel/diesel) required due to declining soil health (Table 6); (2) an overall excessive rise in the farmer’s cost/ha before marketing costs (Table 6a); (3) expensive capital replacement costs (every 5 years); (4) high wear and tear expenditure (Figure 6), (5) the recurrent debt uptake for mechanisation through high loan repayments and finance costs (Figure 6) – all lead to the decline in AFCs/ha. The magnitude of this decline, however, is also largely influenced by the negative impacts associated with CT practices (Table 1).51 53-55 Apart from the positive start in NT results, the results also indicate a downward trendline in the longer term that varies in magnitude of losses across the three regions. This finding supports the existing argument that the success and performance of NT is to some extent in contexts, regions and climate-specific and can be limited (Table 1). The potential additional cattle revenue forgone under both CT and NT systems also adds to the gap in the performance of the two systems relative to CA/RA (Figure 5).
Likewise, as the ecological functions and services are restored and the benefits associated with the CA/RA system accrue (Table 1), farmers start to accumulate positive financial returns on their investment (indicated by the turning point of the J-curve). These positive returns are mainly driven by the gradual reduction in the volume cost of major inputs required and the overall cost of production (Table 6). Prevailing
benefits such as sustained crop productivity and long-term yields also contribute to positive returns through a year-on-year increase in crop revenue, while the benefit of additional biomass contributes to a yearon-year increase in livestock revenue (Figure 5). Significantly low loan repayments, finance costs and wear and tear (Figure 6); altogether, farm profitability increases, which strengthens the financial position and sustainability of CA/RA farmers and their farming operations.10 41 These positive returns are sustained through the medium- to long-term period and can be observed by the upward/positive trendline after the transition period. Although the long-term upward trendline in the CA/RA system is not smooth but fluctuating (yet positive), this can be attributed to the machinery replacement cycle and the recurring double cover crop with livestock rotation included in the model configuration. When replacement takes place, free cash flow is severely compromised; and when cover crops are in rotation, the revenue from cover crop and livestock on certain fields is lower than on fields with cash crops.2,56 It is from this premise that the debate around the financial viability of cover crops and associated trade-offs occurs.57 58 In this case, farmers need to consider the long-term ecological benefits of cover crops and the economic value they add to the whole farming operation.
Mpumalanga
Maluti
Figure 6: Cumulative debt uptake and wear and tear over a 20-year period under CT, NT and CA/RA.
Conclusion
The agricultural sector is in dire need of transformation and regeneration. The challenge of feeding a growing population will continue to increase with negative environmental impacts, variable climate conditions, rising external production costs and limited land.59,60 This, in addition to rising costs of production and farm debt uptake, a growing area under production but reduced productivity and declining number of farmers in South Africa. Farmers must start to incorporate sustainable principles geared toward climate change mitigation and adaptation, and if the adoption process is not accelerated, those lacking proper adaptation will quickly reach even higher levels of risk and unprofitable farming operations. Those who have adopted a NT farming system have already started to improve both the physical and biological characteristics of soils. However, this study emphasised the need to transcend the limitations of pure NT systems to a better alternative that will make more significant and lasting changes to soil properties, enhance yield sustainability and safeguard farm profitability. It further showed that CA/RA can relieve farmers of enormous financial risk that has the potential to grow exponentially over the medium to long term by prioritising the restoration of soil and ecosystem goods and services. Various studies have proven that CA/RA can reduce a farm’s heavy reliance on expensive inputs, offer significant cost savings and loss-avoidance, and provide supplementary profitgenerating opportunities through additional livestock and feed revenue. The results of this study also corroborate existing studies by providing evidence-based support that indicates that, relative to CT and NT, CA/RA offers the best/maximum return on investment in absolute terms, and even more so on a risk-adjusted basis.
As such, this study supported the message that (1) there are sound strategies to successfully navigate through the transition period when adopting and adapting to CA/RA; (2) active farmer networks and support by sharing past knowledge and experiences of success stories can contribute significantly to the inspiration and guidance of farmers starting this new journey; and (3) often NT and CA/RA practices have less total risks than CT if applied correctly (sometimes even in the short term but especially in the long term when taking into consideration the impact of future possible drought conditions among other expected climate variations and extremes). Granting that different conclusions can be drawn from the relevant information available, the reality remains that short-term needs must be balanced with long-term environmental, food and financial sustainability. The existing body of work implores policymakers to consider this reality because the ultimate decision to encourage the adoption of or conversion to CA/RA is centred on their perception of how such a move will alter their overall business risk.
Acknowledgements
We thank Ms Leandri vd Elst for her editorial and administrative support in the preparation of the manuscript. We also gratefully acknowledge the comments received from the anonymous reviewers.
Funding
We thank the Maize Trust for their financial support of the Conservation Agriculture project coordinated by ASSET Research which has, in part, contributed to this study.
Data availability
Data pertaining to this study are available on request and can be found at https://assetresearch.org.za/conservation-agriculture/
Declaration of AI use
We declare that we have not used AI tools in the preparation of this manuscript.
Authors’ contributions
M.M.: Conceptualisation, methodology, data collection, data analysis, validation, data curation, writing – the initial draft, writing – revisions, project leadership, project management. N.v.S. Conceptualisation, methodology, data analysis, validation, data curation, writing – revisions. A.d.B.: Conceptualisation, writing – revisions. H.S.: Conceptualisation, methodology, data analysis, validation, data curation, writing – the initial draft, writing – revisions, project leadership, project management. J.B.: Conceptualisation, methodology, data analysis, validation, data curation, writing – the initial draft, writing – revisions, project leadership, project management. J.K.: Conceptualisation, data collection, data analysis, writing – revisions. G.T.: Conceptualisation, data collection, writing –revisions. L.E.: Conceptualisation, data collection, writing – revisions.
Competing interests
We have no competing interests to declare.
References
1. Thierfelder C, Baudron F, Setimela P, Nyagumbo I, Mupangwa W, Mhlanga B, et al. Complementary practices supporting conservation agriculture in southern Africa. A review. Agron Sustain Dev. 2018;38(16):1–22. https://d oi.org/10.1007/s13593-018-0492-8
2. Mitchell J. Conservation agriculture systems. CABI Rev. 2019;14(1):1–25. https://doi.org/10.1079/PAVSNNR201914001
3. El Chami D, El Moujabber M. Drought, climate change and sustainability of water in agriculture: A roadmap towards the NWRS2. S Afr J Sci. 2016;112(9/10), Art. #2015-0457. https://doi.org/10.17159/sajs.2016/20 150457
4. Statistics South Africa. Agricultural survey preliminary. Pretoria: StatsSA; 2019. Available from: http://www.statssa.gov.za/publications/P1101/P1101 2019.pdf
5. Bardsley DK, Knierim A. Hegel, Beck, and the reconceptualization of ecological risk: The example of Australian agriculture. J Rural Stud. 2020;80:503–512. https://doi.org/10.1016/j.jrurstud.2020.10.034
6. South African Department of Agriculture, Land Reform and Rural Development (DALRRD). Annual report. Pretoria: DALRRD; 2021. Available from: http://w ww.old.dalrrd.gov.za/Portals/0/Annual%20Report/DALRRD%20Annual%20R eport%20%202020%20-%202021.pdf
7. Van der Walt AJ, Fitchett JM. Statistical classification of South African seasonal divisions on the basis of daily temperature data. S Afr J Sci. 2020;116(9/10), Art. #7614. https://doi.org/10.17159/sajs.2020/7614
8. UN Food and Agriculture Organization (FAO). An assessment of the adoption of conservation agriculture in annual crop-livestock systems in South Africa. Pretoria: FAO;2021. p. 1–28.
9. Huggins DR, Reganold JP. No-till: The quiet revolution. Sci Am. 2008;1:70–77. Available from: http://geraghtyconsulting.ie/wp-content/uploads/2011/11 /No-Till-The-Quiet-Revolution.pdf
10. Derpsch R, Friedrich T, Kassam A, Hongwen L. Current status of adoption of no-till farming in the world and some of its main benefits. Int J Agric Biol Eng. 2010;3(1):1–25.
11. Deloitte Africa Agribusiness Unit (DAAU). Four key success factors to growing agriculture opportunities in Africa. Johannesburg: DAAU; 2011. Available from: https://www.afrilogic.co.za/downloads/pdf/Agribusiness%204%20key %20success%20factors.pdf
12. Luan Y, Cui X, Ferrat M, Nath R. Dynamics of arable land requirements for food in South Africa: From 1961 to 2007. S Afr J Sci. 2014;110(1/2), Art. #2012-0088. https://doi.org/10.1590/sajs.2014/20120088
13. Fresco LO. Some thoughts about the future of food and agriculture. S Afr J Sci. 2014;110(5/6), Art. #a0066. https://doi.org/10.1590/sajs.2014/a0066
14. Bender MH. An Economic comparison of traditional and conventional agricultural systems at a county level: Appendices and expanded references. Am J Agric Res. 2001;16(1):2–15. https://doi.org/10.1017/S08891893000 08808
15. Mazvimavi K, Ndlovu PV, Henry A, Murendo C. Productivity, and efficiency analysis of maize under conservation agriculture in Zimbabwe. Paper presented at: International Association of Agricultural Economists Conference, 20212 August 18–24; Foz do Iguaçu, Brazil. https://doi.org/10.22004/ag.ec on.126767
16. Swanepoel CM. Assessment of the potential of conservation agriculture management practices to sequester organic carbon in South African soils [PhD thesis]. Pretoria: University of Pretoria; 2018.
17. Moswetsi G, Fanadzo M, Ncube B. Cropping systems and agronomic management practices in smallholder farms in South Africa: Constraints, challenges, and opportunities. J Agron. 2017;16:51–64. https://doi.org10. 3923/ja.2017.51.64
18. Sanchez AC, Kamau HN, Grazioli F, Jones SK. Financial profitability of diversified farming systems: A global meta-analysis. Ecol Econ. 2022;201(1), Art. #107595. https://doi.org/10.1016/j.ecolecon.2022.107595
19. Omulo G, Birner R, Koller K, Simunji S, Daum T. Comparison of mechanized conservation agriculture and conventional tillage in Zambia: A short-term agronomic and economic analysis. Soil Tillage Res. 2022;221(1), Art. #105414. https://doi.org/10.1016/j.still.2022.105414
20. Hobbs PR. Conservation agriculture: What is it and why is it important for future sustainable food production? J Agric Sci. 2007;145:127–137. https:// doi.org/10.1017/S0021859607006892
21. Friedrich T, Derpsch R, Kassam A. Overview of the global spread of conservation agriculture. Field Actions Sci Rep. 2012;Special Issue 6:1–7. Available from: http ://factsreports.revues.org/1941
22. Landers JN, de Freitas PL, de Oliveira MC, da Silva Neto SP, Ralisch R, Kueneman EA. Next steps for conservation agriculture. J Agron. 2021;11(12), Art. #2496. https://doi.org/10.3390/agronomy11122496
23. Strauss JA, Swanepoel PA, Laker MC, Smith HJ. Conservation agriculture in rainfed annual crop production in South Africa. S Afr J Plant Soil. 2021;38(3):217–230. https://doi.org/10.1080/02571862.2021.1891472
26. Rhodes CJ. The imperative for regenerative agriculture. Sci Prog. 2017;100(1):80–129. https://doi.org/10.3184/003685017X14876775256165
27. Blignaut J, Knot J, Smith H, Nkambule N, Crookes D, Saki A, et al. Promoting and advancing the uptake of sustainable, regenerative, conservation agricultural practices in South Africa with a specific focus on dryland maize and extensive beef production. Pretoria: ASSET Research; 2015. Available from: https://agbiz.co.za/uploads/documents/news/Newsletter/2015/15073 0_Promoting_ASSET.pdf
28. Newton P, Civita N, Frankel-Goldwater L, Bartel K, Johns C. What is regenerative agriculture? A review of scholar and practitioner definitions based on processes and outcomes. Front Sustain Food Syst. 2020;4:1–11. https://doi.org/10.3389/fsufs.2020.577723
29. Waswa SC, Mulyungi LM. Adoption of conservation agriculture in eastern Kenya: Identified and measured indicators of the sustainability of the CA practices. J Agric Ecol Res Int. 2021;22(5):52–62. https://doi.org/10.9734 /JAERI/2021/v22i530202
30. Knowler D, Bradshaw B. Farmers’ adoption of conservation agriculture: A review and synthesis of recent research. Food Policy. 2006;32:25–48. https: //doi.org/10.1016/j.foodpol.2006.01.003
31. Greiner R, Patterson L, Miller O. Motivations, risk perceptions and adoption of conservation practices by farmers. Agric Syst. 2009;1(1):86–104. https://do i.org/10.1016/j.agsy.2008.10.003
32. Ahnstro J, Höckert J, Bergea HL, Francis CA, Skelton P, Hallgren L. Farmers, and nature conservation: What is known about attitudes, context factors and actions affecting conservation? Renew Agric Food Syst. 2008;24(1):38–47. https://doi.org/10.1017/S1742170508002391
33. ASSET Research. Project: Conservation agriculture [webpage on the Internet]. No date [cited 2024 May 13]. Available from: https://assetresearch.org.za/c onservation-agriculture/
34. Swanepoel CM, Swanepoel L, Smith HJ. A review of conservation agriculture research in South Africa. S Afr J Plant Soil. 2018;35(4):297–306. https://doi .org/10.1080/02571862.2017.1390615
35. Le Roux JJ, Morgenthal TL, Malherbe J, Pretorius DJ, Sumner PD. Water erosion prediction at a national scale for South Africa. Water SA. 2008;34(3):305–314. https://doi.org/10.4314/WSA.V34I3.180623
36. Grain South Africa (GSA). Production reports. Pretoria: GSA; 2021; 2022. Available from: https://www.grainsa.co.za/pages/industry-reports/productio n-reports
37. South African Grain Information Services (SAgis). South African Futures Exchange.Pretoria: SAgis; 2021; 2022. Available from: https://www.sagis.or g.za/safex_historic.html
38. Red Meat Producers’ Organization (RMIS). Prices [webpage on the Internet]. c2021 [updated 2022; cited 2024 May 13]. Available from: https://rpo.co.z a/weekly-prices/
39. Statistics South Africa(Stats SA). CPI history.Pretoria: Stats SA; 2021; 2022. Available from: https://www.statssa.gov.za/publications/Report-01-41-01/R eport-01-41-012022.pdf
40. Sosibo NZ, Muchaonyerwa P, Visser L, Barnard A, Dube E, Tsilo TJ. Soil fertility constraints and yield gaps of irrigation wheat in South Africa. S Afr J Sci. 2017;113(1/2), Art. #2016-0141. http://dx.doi.org/10.17159/sajs.2 017/20160141
41. Somasundaram J, Sinha NK, Dalal RC, Lal RL, Mohanty M, Naorem AK, et al. No-till farming and conservation agriculture in South Asia – issues, challenges, prospects and benefits. Crit Rev Plant Sci. 2020;39(3):236–279. https://doi.org/10.1080/07352689.2020.1782069
43. Bolliger A, Magid J, Amado TJC, Scora Neto F, Dos Santos Ribeiro MDF, Calegari A, et al. Taking stock of the Brazilian “zero-till revolution”: A review of landmark research an farmers’ practice. Adv Agron. 2006;91:47–110. https://doi.org/10.1016/S0065-2113(06)91002-5
44. Pittelkow CM, Liang X, Linquist BA, van Groenigen KJ, Lee J, Lundy ME, et al. Productivity limits and potentials of the principles of conservation agriculture. Nature Adv Onl Pub. 2015;517:365–368. https://doi.org/10.1038/nature13809
45. Baker CJ, Saxton KE. The ‘what’ and ‘why’ of no-tillage farming. In: Baker CJ, Saxton KE, editors. No-tillage seeding in conservation agriculture. 2nd ed. Rome: FAO and CAB International; 2007. p. 1–10. Available from: https: //openknowledge.fao.org/server/api/core/bitstreams/85bbfdfe-51e2-4351-9 c45-38d6d531b2d3/content
46. Derpsch R. No-tillage and conservation agriculture: A progress report. In: Goddard T, Zoebisch MA, Gan YT, Ellis W, Watson A, Sombatpanit S, editors. No-till farming systems. Special Publication No. 3. Bangkok: World Association of Soil and Water Conservation; 2008. p. 7–39.
47. Dube E, Chiduza C, Muchaonyerwa P. High biomass yielding winter cover crops can improve phosphorus availability in soil. S Afr J Sci. 2014;110(3/4), Art. #2013-0135. https://doi.org/10.1590/sajs.2014/20130135
48. Jat ML, Gathala MK, Saharawat YS, Tetarwal JP, Gupta R. Double no-till and permanent raised beds in maize–wheat rotation of north-western IndoGangetic plains of India: Effects on crop yields, water productivity, profitability, and soil physical properties. Field Crops Res. 2013;149:291–299. https://doi.org/10 .1016/j.fcr.2013.04.024
49. UN Food and Agriculture Organization. Adoption of conservation agriculture [webpage on the Internet]. No date [cited 2024 May 13]. Available from: htt p://fao.org/ag/ca/6c.html
50. Mafongoyaa P, Rusinamhodzib L, Sizibac S, Thierfelderd C, Mvumie BM, Nhauf B, et al. Maize productivity and profitability in Conservation Agriculture systems across agro-ecological regions in Zimbabwe: A review of knowledge and practice. Agric Ecosyst Environ. 2016;220:211–225. https://doi.org/10. 1016/j.agee.2016.01.017
51. Knott S, Hoffmann W, Strauss J. The whole farm financial implications of different tillage systems on different crop rotations in the Swartland area of the Western Cape, South Africa. Int J Agic Manag. 2016;6(1):20–31.
52. Thierfelder C, Rusinamhodzi L, Ngwira AR, Mupangwa W, Nyagumbo I, Kassie GT, et al. Conservation agriculture in Southern Africa: Advances in knowledge. Renewable Agric Food Syst. 2014;30(4):246–258. https://doi.or g/10.1017/S1742170513000550
53. Smith P, Milne R, Powlson DS, Smith JU, Falloon P, Coleman K. Revised estimates of the carbon mitigation potential of UK agricultural land. Soil Use Manag. 2006;16(4):293–295. https://doi.org/10.1111/j.1475-2743.2000.tb 00214.x
54. Brussaard L, de Ruiter PC, Brown GG. Soil biodiversity for agricultural sustainability. Agric Ecosyst Environ. 2007;121:233–244. https://doi.org/1 0.1016/j.agee.2006.12.013
55. Chivenge PP, Murwira HK, Giller KE, Mapfumo P, Six J. Long-term impact of reduced tillage and residue management on soil carbon stabilization: Implications for conservation agriculture on contrasting soils. Soil Tillage Res. 2007;94(2):328–337. https://doi.org/10.1016/j.still.2006.08.006
56. Smith HJ, Blignaut JN, Van Zyl A, Yssel D, Vienings E. Determining the carbon footprint of different maize farming systems within the summer rainfall crop production area in South Africa, Phase 3. Interim progress report to The Maize Trust. Pretoria: ASSET Research; 2021
57. Scopel E, Triomphe B, Affholder F, Da Silva FAM, Corbeels M, Xavier JHV et al. Conservation agriculture cropping systems in temperate and tropical conditions, performances, and impacts. A review. Agron Sustain Dev. 2013;33:113–130. https://doi.org/10.1007/s13593-012-0106-9
58. Pannell DJ, Llewellyn RS, Corbeels M. The farm-level economics of conservation agriculture for resource-poor farmers. Agric Ecosyst Environ. 2014;187:52–64. https://doi.org/10.1016/j.agee.2013.10.014
60. Godfray HCJ, Beddington JR, Crute IR, Haddad L, Lawrence D, Muir JF, et al. Food security: The challenge of feeding 9 billion people. Science. 2010;327:812–818. https://doi.org10.1126/science.1185383
AUTHORS: Lisa-Claire Ronquest-Ross1 Gunnar O. Sigge2
AFFILIATIONS:
1v2food, Bulimba, Queensland, Australia
2Department of Food Science, Stellenbosch University, Stellenbosch, South Africa
CORRESPONDENCE TO:
Lisa-Claire Ronquest-Ross
EMAIL: lisaronquest@gmail.com
DATES:
Received: 03 Aug. 2023
Revised: 24 Mar. 2024
Accepted: 01 Apr. 2024
Published: 31 July 2024
HOW TO CITE:
Ronquest-Ross L-C, Sigge GO. South Africa’s food system: An industry perspective on past, present and future applications of science and technology. S Afr J Sci. 2024;120(7/8), Art. #16536. https:// doi.org/10.17159/sajs.2024/16536
ARTICLE INCLUDES:
☒ Peer review
☐ Supplementary material
DATA AVAILABILITY:
☐ Open data set
☐ All data included
☒ On request from author(s)
☐ Not available
☐ Not applicable
EDITORS: Teresa Coutinho
Lindah Muzangwa
KEYWORDS:
South Africa, food and beverage, science and technology, future applications
FUNDING: None
South Africa’s food system: An industry perspective on past, present and future applications of science and technology
The South African food system is facing severe challenges as increasing hunger, rising food costs, lack of dietary diversity, child stunting, foodborne illnesses, food waste and an obesity epidemic coupled with malnutrition are observed. In this study, we aimed to establish the application of science and technology advances in the food and beverage industry in South Africa in response to food consumption pattern changes since 1994 and how they could be used to address food security challenges. We found that food consumption shifts have been towards sugar-sweetened beverages, processed and packaged food, animal-source foods and added caloric sweeteners, and away from vegetables. These dietary shifts are concerning as they relate to public health. Most commitments to improve the nutritional status of South Africans have been limited to corporate social investment strategies and should be extended into core business strategies. Furthermore, although the South African food and beverage industry has kept pace with developments in food manufacturing practices, there has been little experimentation with non-commercial novel technologies. The expert survey revealed that indigenous African crops and food waste recovery are the two most promising emerging food sources that could be available to South Africans in the shortest time frame. South Africa has many enabling drivers to become a global leader in food technology advances. However, many barriers need to be overcome for industry, academia and government to collaborate to advance novel food science and technologies to reach commercialisation.
Significance:
• Drivers and consequences of food consumption changes in South Africa were modelled and broad food consumption trends between 1994 and 2009/2012 were identified.
• For the first time, the Access to Nutrition Index methodology was applied to South African owned food companies to identify strategies to enhance nutrition practices. Companies need to do more to deliver affordable and accessible products.
• Drivers and barriers in adopting advanced food science and technology were modelled. A collective ecosystem approach with industry, academia and government mobilisation around critical areas like hunger, malnutrition and poverty could be a way to tackle the failing food system.
Background
There are clear signs that the South African food system is facing severe challenges, as increasing hunger, rising food costs, lack of dietary diversity, child stunting, foodborne illnesses, food waste and an obesity epidemic coupled with malnutrition are observed.
Various factors affect food consumption, including accessibility, availability and choice. Food intake choices are influenced by several factors, such as geography, location, season, history, education, demographics, disposable income, government and other support services, urbanisation, globalisation, marketing, religion, culture, social networks, convenience, time and consumer attitudes.1-4 Consequences are associated with changes in food consumption patterns, including health and environmental impacts.1 It would be expected that changes in food consumption patterns would impact the food and beverage industry through product innovation demand, increased production capacity and efficiency improvements, applications of new science and technology, increased regulation on foodstuffs, and advancements in the value chain from raw materials, processing and distribution.
Various food- and nutrition-related studies conducted at provincial or community levels over the past few decades reported that South Africans have adopted more Western-oriented diets.5 6 South Africans consume a diet low in dietary variety, with informal urban areas worst affected.7 8 Based on a study by Steyn et al.9, in which they analysed dietary surveys, the South African adult population frequently consumed maize, sugar, tea, brown and white bread, non-dairy creamer, brick margarine, chicken meat, full-cream milk, and green leaves. Almost half (48%) of adult South Africans reported eating out of the home. Regarding frequency, most said they ate outside the home monthly (28.7%) or weekly (28.3%).7 There has never been a national dietary survey of adults in South Africa, and there has been only one national study on food consumption related to children, which was on children aged 1–9 years old in 1999.9 10 Furthermore, in a study by Steyn et al.11 to determine if mandatory fortification implemented in 2003 had improved micronutrient dietary intake, they concluded that there is a lack of dietary intake studies and again highlighted the need for a national survey of children’s dietary intake. Therefore, data on food consumption nationally is outdated and does not include all age groups, nor is there comprehensive data to analyse trends in the consumption of packaged foods and beverages.
The drivers of food consumption changes since 1994 in South Africa can be described through the environmental scanning technique of political, economic, social, technological, legal and environmental (PESTLE) factors. These factors ultimately lead to consequences for public health and the food system, as shown in Figure 1
The most significant political change for South Africa in the last 30 years was the end of apartheid, culminating in the first democratic election on 27 April 1994. The post-apartheid government put various economic and transformation plans in place, which resulted in increased income per capita and the rise of the black middle class with significant spending power.12 After economic and trade restrictions were lifted, social shifts occurred, such as increasing urbanisation, as the black population moved permanently from rural to urban areas looking for a better life.13 Unfortunately, the last decade saw a slowdown in economic growth due to policy uncertainty and energy constraints.14 Despite progressive legislative measures, women remain under-represented in the workplace.15 More than half the population still lives in poverty, and South Africa remains one of the most unequal countries in the world.16 Unemployment in 2019 was 29%14, with youth unemployment at 55% in 201917
Data from the South African National Health and Nutrition Examination Survey (SANHANES-1) conducted in 2012 revealed that 39% of women and 25% of men were obese and that obesity had increased since 2003.7 Diabetes affected 12.6% of adult women and 9.7% of adult men.7 Unfortunately, South Africa has made limited progress in reducing stunting in children under five years old, with 27% being stunted.18 Even though the SANHANES-1 survey indicated that anaemia and iron status have improved, poor micronutrient status remains common among young children.19 South Africa suffers from a double burden of disease with both overnutrition and undernutrition. South Africa is far from achieving the United Nations Sustainable Development Goal of Zero Hunger, with one in five South Africans (24%) in 2020 affected by moderate to severe food insecurity, while almost 15% experienced severe food insecurity.20 Poorer households can spend more than 40% of their total expenditure on food, compared with the national average of 13%.19 Unfortunately, most South Africans cannot afford to maintain a healthy diet.21 Fortunately, the governments’ various social assistance grants have been shown to reduce poverty and improve nutrition outcomes.14
Trade liberalisation post-apartheid saw international food and beverage companies entering South Africa, which led to increased competition for local players and the forming of partnerships.22 This resulted in rising global brand exposure and marketing to South Africans.4 23 Furthermore, supermarkets have grown significantly, especially in township areas,
accounting for about 60% of retail sales.24 25 The South African food and beverage manufacturing industry is dominated by a limited number of large national and multinational companies that control production capacity and sales across multiple food categories.22 The ten largest packaged food companies in South Africa accounted for 43.5% of total packaged food sales in 2020 (ZAR102 billion or ~1.8% of GDP in 2020).26 This dominance is a result of the technical barriers to entry imposed by the apartheid government.
Access to essential services like water, sanitation and electricity has advanced in post-apartheid South Africa, with 90% of households in 2020 having access to electricity, compared with 58% in 1996.16 This improved access created increased demand for durable goods such as refrigerators, ovens and microwaves, offering broader food choices due to the expanded food preparation and storage options. Socio-economic trends in South Africa, such as urbanisation and population growth, are projected to double the demand for commodities and increase the need for high-value foods like dairy and meat by 200%.23 As consumers become less trusting of the ‘faceless’ food and beverage industry and more aware of the effects of food production on the environment, they are increasingly considering product quality attributes such as food safety, nutrition, organic production, fair trade, free range, animal friendly and locally grown when making food choices.27 28
Regarding legal drivers, the South African Department of Health has implemented regulations on the food and beverage industry in an effort to improve public health. These regulations require fortifying staple foods, limiting salt in some foods, and taxing sugary drinks.
Global food production is the single most significant driver of environmental degradation and transgressor of planetary boundaries impacting climate change and ecosystem resilience.29 Current food systems are responsible for approximately one-quarter of anthropogenic greenhouse gas (GHG) emissions.30 Food systems are a leading cause of deforestation, biodiversity loss, freshwater use and water pollution, yet are also ineffective in feeding people adequately.30 South Africa’s food system contributes 15–20% of GHG emissions.31 A total of 80% of South African land is suitable for livestock farming; overgrazing on erosion-prone soils has led to widespread land degradation, dramatically
Figure 1: Drivers and consequences of food consumption changes in the South African food and beverage industry since 1994.
reducing soil carbon storage.23 Food production and processing are energy intensive, especially in a country dependent on coal-fired energy sources, substantially increasing the system’s carbon footprint.23 South Africa is a water-scarce country, with water fast becoming a crisis.32 A staggering 10 million tonnes of food (about one-third) go to waste in South Africa.33-35 The bulk of this loss (49%) arises from the processing and packaging stage and 18% from the consumption stage.35 This is of great concern due to the substantial portion of discarded food still being edible, the loss in potential value if food waste is disposed of, together with the related wasted resources and emissions in producing the food in the first place.34,36
The RethinkX report suggests that the world is on the edge of revolutionary disruption in food and agricultural production.37 This results in uncoupling from land and sea resources to novel protein sources derived from bacteria, yeasts and fungi.37-39 Science and technology are constantly developing to tackle the challenges of globalisation, sustainability, and the requirement for a stable and secure food supply.40-42 Regulatory authorities are also putting pressure on the food processing industry to minimise its impact on the environment.40-42 Moreover, consumers demand safer, higher quality, and minimally processed food. According to a survey conducted in the UK food and beverage industry, the use of advanced technology has been linked to enhancements in product quality, cost savings, and the development of new products, despite the increasing need to improve sustainability and resource efficiency.43 The study identified emerging technology trends, including improving efficiency, productivity and sustainability, and reducing salt and fat contents.43 There has been no comprehensive research for South Africa related to applying advanced science and technology developments or emerging technology trends. However, it would be expected that the South African Food and Beverage Industry (SAFBI) has adopted advances in science and technology to keep pace with the evolving South African consumer, regulatory and competitive landscape.
We aimed to investigate how SAFBI has utilised scientific and technological advancements to tackle changes in food consumption patterns since 1994 and how these advancements can address food security challenges faced by South Africans.
Materials and methods
This study is a compilation of four studies and hence four materials and methods are described below.
Establish food consumption shifts since 1994
To examine changes in the consumption of packaged foods in South Africa since the end of apartheid, the FAOSTAT Food Balance Sheets and Euromonitor Passport databases were used to gather comprehensive and comparable national data on food items consumed. Both exported data sets were converted into per capita consumption figures to account for population growth. Intervals of five-year periods, from 1994 to 2009 for FAOSTAT Food Balance Sheets data, and from 1999 to 2012 for EUROMONITOR PFBC data, were compared. Time overlaps were examined in 1999, 2004 and 2009.
Determine science and technology advances by SAFBI
We explored how advances in science and technology and investments made by the food and beverage industry can meet changing food consumption patterns and maintain competitiveness. South African food and beverage industry trade magazines covering reported applications and investments in advanced science and technology developments were used to source these data. A database was created by collecting articles from the South African Food Review from 1986 to 2012 and the South African Food and Beverage Reporter from 1995 to 2012. The data were analysed to identify trends in the application of science and technology advances.
Determine nutrition practices by SAFBI
As the SAFBI reaches every household and South Africa has significant health concerns, we used a modified version of the Access to Nutrition Index (ATNI) methodology to assess how nutrition practices are integrated into the core of business practices. The ATNI is a global initiative that
evaluates the largest food and beverage manufacturers’ policies, practices and disclosure related to nutrition and the degree to which these are embedded in core business functions. The methodology is based on existing international standards, guidelines and frameworks, such as those developed by the World Health Organization (WHO), Codex and other leading nutrition-focused organisations.44 ATNI’s assessment of companies’ nutrition practices relies mainly on their statements and published materials. Due to the specific South African focus of this study, the methodology was adapted to local circumstances. For example, questions relating specifically to EU or US criteria and geographic and developed versus developing country criteria were excluded. Data were gathered from company websites and annual integrated reports for 2013 and 2016. The nutrition performance of the top three South African food and beverage manufacturers over three years (between 2013 and 2016) was then evaluated to understand if improvements were made in this area.
Establish and map underutilised and emerging food sources to address food security
A literature review was conducted to identify underutilised or emerging new food sources that could provide a solution to providing safe, affordable and nutritious food for vulnerable South Africans (results not presented in this paper). A survey was then designed around criteria related to affordability, nutrition, safety, consumer acceptance and regulatory environment. A quantitative expert survey was conducted with South African food professionals from industry, academia and government (n = 40) to evaluate the identified underutilised or emerging new food sources against the set of criteria to determine the most promising and the time frame in which these could be expected to be available to South Africans. Ethics clearance for the quantitative expert survey was received from Stellenbosch University on 15 July 2021 with project number 22423. Based on the findings from these combined studies, barriers and drivers were identified for key role players to utilise and harness science and technology to improve food security for all South Africans.
Results and discussion
Establish food consumption shifts since 1994
Food consumption patterns in South Africa have undergone significant changes over the past few decades, and are expected to continue evolving. Over the last few decades, various community- and provinciallevel studies indicate that food consumption shifts in South Africa have been towards a more Western-orientated diet, with nutritional consequences contributing to increased obesity and other noncommunicable diseases. The results suggest that people consume more kilojoules per day, with a preference for sugar-sweetened drinks, processed and packaged foods (including vegetable oils), animal-based products, and added sweeteners. The most significant changes in food consumption (>25% increase) were observed for soft drinks; sauces, dressings and condiments; sweet and savoury snacks; meat; and fats and oils (Figure 2). Unfortunately, this shift is leading to a decreased consumption of vegetables (Figure 2). The main factors driving this trend are convenience, nutrition, health, and indulgence. These changes in eating habits are concerning due to the resultant change in nutritional content and potential impact on public health.
Determine science and technology advances by SAFBI
Food and beverage multinationals traditionally spend far less on R&D (only accounting for 3% of total R&D spent globally in 2016) than other sectors like health care, automotive and technology.45 We examined how advances in science and technology and investments made by the food and beverage industry are being utilised to adapt to changes in food consumption patterns and maintain competitiveness. SAFBI seems to adapt well to advancements in food manufacturing, such as automation, quality control, material handling, and centralised distribution centres with warehouse management systems. However, there is a lack of experimentation with non-commercial innovative technologies. Cilliers and Carinus46 point out the innovation paradox where established businesses, in an attempt to ensure predictability and maintain high turnover and profits, soon spiral into low-innovation,
low-risk, low-reward cycles. Start-ups can innovate quickly and adapt to consumer needs but lack the financial resources and credibility to deliver goods at scale. Some global food and beverage companies have created venture capital divisions to invest in food tech start-ups that are seen as an extension of their R&D departments and far less risky than significant merger and acquisition deals.45 This is an example for South African food and beverage manufacturers to follow. It is promising to see Tiger Brands utilising its recently launched venture capital fund to invest in the plant-based protein start-up Herbivore Earthfoods.47
Determine nutrition practices by SAFBI
The consequences of food consumption shifts in South Africa from a public health perspective unfortunately include increased obesity and other non-communicable diseases.5,48,49
Utilising the modified ATNI methodology, we found that most commitments to improve the nutritional status of South Africans were limited to corporate social investment strategies and programmes and should be extended into core business strategies to fully leverage the market and corporate reputation opportunity that this offers. Nutrition could be more explicitly incorporated into business strategy with senior leadership responsibility. Transparency and reporting on research and development (R&D) programmes related to product formulation could be improved. The market opportunity to reach underserved consumers with optimal affordable and nutritious products has not been realised.
Establish and map underutilised and emerging food sources to address food security
Venture investors are increasing investments in food tech start-ups, especially those creating new types of food and production methods.50 Global investment into food tech reached a record USD12.8 billion in 2021, significantly up from USD2.2 billion in 2017, where half of this investment went to companies creating alternatives to traditionally produced meat, seafood and dairy products.50 It is expected that food tech investment is likely to grow further. South Africa already has start-ups innovating in cell-based meat (Newform Foods and Mogale Meats) and precision fermentation (De Novo Dairy).51 In exploring underutilised or emerging new food sources that could provide safe, affordable, nutritious foods
relevant to South Africans, we found that indigenous African crops and food waste recovery are two of the most promising emerging food sources available to South Africans in the next 3–5 years that meet the need for affordable, nutritious, safe and culturally appropriate food (Figure 3). Fermentation (precision and biomass) and insects for human consumption were identified to become available to South Africans in less than 5–10 years (Figure 3). The two underutilised or emerging food sources thought to have the most extended time frame of more than 5–10 years to commercialisation were algae and cell-based meat and seafood (Figure 3). The extended time frame for commercialisation for cell-based meat and seafood was related to the investment required, availability of stakeholders and specialised scientific support and research, and ability to reach scale with local production and processes. The major hurdle for algae indicated by respondents is acceptance by the South African consumer.
Respondents in this study indicated that, for any underutilised or emerging food source or technology to reach the South African retail shelves, there needs to be investment from industry, governments and academia into research, technical capability building and scale-up infrastructure for commercialisation. According to a report conducted by Mouton et al.52 and published in 2019, South Africa invests too little in R&D. Gross Domestic Expenditure on R&D (GERD)/Gross Domestic Product (GDP) has remained unchanged at around 0.8% for the last 15 years compared to an elusive national target of 1%, resulting in South Africa being ranked 44th on GERD/ GDP in 2015.52 The number of patent applications (a proxy for research and innovation) registered by South African residents is low and has stagnated over the last 35 years.53 Fortunately, there has been growth in academic pipelines for master’s and doctoral graduates, increased publications, and significant participation of black people and women in the R&D workforce.16 52 Food sciences and technology feature second in publishing scientific research papers under agricultural sciences.52 It is promising that research projects like InnoFoodAfrica working on trying to increase dietary diversity by developing affordable, nutrient-dense and healthy food products from local African crops, are already underway.54 According to KaMshayisa (Researcher and Lecturer, Cape Peninsula University of Technology; written communication; 11 April 2022), there is also research across multiple academic institutions on insects, from techno-functional properties, allergenicity and microbial aspects to new product development for human food. Bessa (Co-Founder and Chief Science Officer, De Novo Foodlabs;
Figure 2: Per capita consumption and shifts in consumption of specific food categories in South Africa from 1994/1999 to 2009/2012 (FAOSTAT Food Balance Sheets & EUROMONITOR Packaged Food & Beverage Consumption).
written communication; 25 April 2022) states that research in South Africa is relatively cost-effective, and significant research can be conducted at a fraction of the cost to overseas universities. Bessa (Co-Founder and Chief Science Officer, De Novo Foodlabs written communication; 25 April 2022) also pointed out that South Africa lacks pilot plants’ scale-up capabilities or co-manufacturing scale-up facilities to bring new technologies to market. This means that trials often need to be conducted overseas, which is complicated, costly and slow.
South Africa's National Development Plan recognises that science, technology, and innovation (STI) are crucial for boosting economic growth, creating jobs, and promoting socio-economic reform.55 The Department of Science & Innovation offers various funding opportunities, including the Support Programme for Industrial Innovation and the Industrial Innovation Partnership Programme.55 The Technology Innovation Agency also provides grants, loans, and equity support for technology development and commercialisation.55 The Technology for Human Resources in Industry Programme facilitates research and development collaborations among private companies, universities, and science councils.16 The
government needs to ensure this funding and support for research skills and infrastructure, as well as acceleratory tax incentives for R&D, are accessible and provide an enabling environment for various stakeholders to collaborate and innovate to unlock new food science technologies. For example, in 2022, the government of the Netherlands announced funding of an initial USD60 million to expand and develop its domestic cultivated meat and seafood ecosystem.56 The funding will be used mainly to invest in education and innovation in this emerging industry.56 Our study also identified that for emerging or new food technologies to become available to South Africans, a progressive and agile regulatory environment needs to be in place, which is not the case today. Singapore’s Food Agency, for example, approved the sale of cultivated meat in 2020, enabling start-ups like Eat Just to test and scale this technology in that country.57
According to a 2019 White Paper on STI in South Africa, the National System of Innovation is hindered by several factors. These factors include insufficient and non-collaborative methods for setting an STI agenda, lack of policy coherence and coordination, weak partnerships between key stakeholders (minimal involvement from businesses and
Figure 4: Summary of drivers and barriers to advancing new food science and technologies to commercialisation, across critical stakeholders.
Figure 3: Time horizon and overall score analysis for commercialising underutilised and emerging food sources in South Africa (IAC = indigenous African crops).
civil society), inadequate monitoring and evaluation, insufficient highlevel science, engineering, and technology skills for the economy, a small research system, an unfavourable environment for innovation, and significant underfunding.55 In this study, we identified additional barriers to these, described in Figure 4, which must be overcome so that key stakeholders across the innovation system can collaborate to advance novel food science, technologies, and research to reach commercialisation.
Similar to how Israel has become known for its innovative technology, entrepreneurial spirit, supportive government policies and investment capital58, South Africa has many enabling drivers to become a global leader in food technology advances (Figure 4). Israel now has over 100 companies operating in the alternative protein sector, with investment funding totalling USD114 million in 2020, of which government funding alone was USD18 million.58
Conclusion
We have determined that food consumption shifts since 1994 have been towards increases in sugar-sweetened beverages, animal-source foods, and added caloric sweeteners, with a shift away from vegetables. These shifts in food consumption are concerning given their nutritional composition and potential effect on public health. Food security remains a significant and growing challenge for South Africa. Our findings indicate that there are under-utilised and emerging food sources that could go some way in addressing these and other socio-economic challenges like unemployment and inequality.
South Africa has strong research institutions supporting a healthy pipeline of postgraduate students, with research being conducted and published on many underutilised and emerging food technologies and sources. It is cost-effective to conduct research in South Africa, and with local and international funding, food science and technology research could build further necessary skills, capabilities and expertise. South Africa has a robust agricultural sector and an advanced and growing food and beverage manufacturing industry, with recent food tech start-ups conducting research and developing novel technologies in cell-based and precision fermentation. However, a lack of pilot plants and scale-up facilities for start-ups and innovators hinders these ideas from scaling up quickly and reaching the market. This often means costly and time-consuming trials offshore. The government could play a significant role in connecting the critical players across the research ecosystem and food value chain, including small-scale farmers, around essential research agendas such as hunger and malnutrition. They could co-invest in the relevant infrastructure for shared facilities where multiple innovators could collaborate to reach scale-up and provide accessible tax incentives for R&D investment to spur the food and beverage industry to overcome their risk aversion to innovating in novel food science technologies. The food and beverage industry could also invest in food tech start-ups to accelerate their commercialisation efforts and reach scale quicker. Our findings suggest that joint research collaborations in indigenous African crops and food waste recovery would be an excellent place to start as they are the most promising, near-term emerging sources of food to be utilised to achieve affordable, nutritious, safe and culturally appropriate food.
South Africa must become more resilient to climate change impacts on food security through collective engagement with critical stakeholders to harness the benefits of novel and emerging food science technologies. Many examples exist of countries doing this for enormous economic and food security benefits. If all stakeholders recognised their responsibility to address the failing food system and transform how food is produced, future diets of South Africans could be far more diverse and nutritious. This could further positively impact food security, employment generation and the overall economy.
Acknowledgements
We acknowledge Johan Visser and Anee Sieberhagen at Nampak Research & Development; Lu Ann Williams from Innova Market Insights; Rosalind Hartfall and Susie Johnson from Euromonitor Passport; Simona Kramer and Paul Vos from Access to Nutrition Foundation; Professor Nick Vink, Dr Scott Drimie, Maricel Krügel and Dr Melvi Todd from Stellenbosch University; Cindy Chin, Linda Drummond, Dr Leah Bessa
and Dr Vusi Mshayisa for their review and contribution to this research; all the food science professionals who participated in the survey on new and emerging food sources in South Africa; and Mars, Woolworths and Mane, for supporting L-C.R-R.’s studies.
Data availability
The data supporting the results of this study are available upon request to the corresponding author.
Declaration of AI use
No AI tools or large language models were used in the development of this work.
Authors’ contributions
L-C.R-R.: Conceptualisation, methodology, data collection, data analysis, validation, data curation, writing – initial draft, project leadership, project management. G.O.S.: Conceptualisation, methodology, writing –revisions, student supervision. Both authors read and approved the final manuscript.
Competing interests
L-C.R-R. worked in the South African food and beverage industry while conducting this research as part of her PhD thesis.
References
1. Kearney J. Review: Food consumption trends and drivers. Phil Trans R Soc B. 2010;365:2793–2807. https://doi.org/10.1098/rstb.2010.0149
2. Bureau for Food and Agricultural Policy. The South African agricultural baseline [webpage on the Internet]. c2011 [cited 2012 Feb 19]. Available from: http://www.sagis.org.za?BFAP_2011.pdfbfap.co.za
3. Wenhold F, Annandale J, Faber M, Hart T. Water use and nutrient content of crop and animal food products for improved household security: A scoping study. WRC report TT 537/12. Pretoria: Water Research Commission; 2012.
4. Claasen N, van der Hoeven M, Covic N. Food environments, health and nutrition in South Africa. Working paper 34. Cape Town: PLAAS, UWC and Centre of Excellence on Food Security; 2016.
5. Kruger HS, Puoane T, Senekal M, van der Merwe MT. Obesity in South Africa: Challenges for government and health professionals. Public Health Nutr. 2005;8(5):491–500. https://doi.org/10.1079/PHN2005785
6. Viljoen AT, Botha P, Boonzaaier CC. Factors contributing to changes in food practices of a black South African community. J Consum Sci. 2005;33:46–62. https://doi.org/10.4314/jfecs.v33i1.52875
7. Shisana O, Labadarios D, Rehle T, Simbayi L, Zuma K, Dhansay A, et al. South African National Health and Nutrition Examination Survey (SANHANES-1). Cape Town: HSRC Press; 2013.
8. Labadarios D, Steyn NP, Nel J. How diverse is the diet of adult South Africans? Nutr J. 2011;10(33):1–11. https://doi.org/10.1186/1475-2891-10-33
9. Steyn NP, Nel JH, Casey A. Secondary data analyses of dietary surveys undertaken in South Africa to determine usual food consumption of the population. Public Health Nutr. 2003;6(7):631–644. https://doi.org/10.107 9/PHN2003482
10. Labadarios D, Steyn NP, Maunder E, MacIntyre U, Gericke G, Swart R, et al. The National Food Consumption Survey (NFCS): South Africa, 1999. Public Health Nutr. 2005;8(5):533–543. https://doi.org/10.1079/PHN2005816
11. Steyn N, Eksteen G, Senekal M. Assessment of the dietary intake of schoolchildren in South Africa: 15 years after the first national study. Nutrients. 2016;8(509):1–14. https://doi.org/10.3390/nu8080509
12. RSA. The Presidency Republic of South Africa [homepage on the Internet]. c2014 [cited 2014 Oct 12]. Available from: www.thepresidency.gov.za
13. Posel D. Have migration patterns in post-apartheid South Africa changed? In: Proceedings of African Migration in Comparative Perspective Conference, Johannesburg, South Africa. 2003.
14. Bureau for Economic Research (BER). South Africa’s progress towards its development objectives: 2020 assessment report [document on the Internet]. c2021 [cited 2022 Mar 20]. Available from: https://scribd.com/ document/548862779/NDP-Assessment-Report-FINAL
15. Sinden E. Exploring the gap between male and female employment in the South African workforce. Mediterr J Soc Sci. 2017;8(6):37–51. https://doi.o rg/10.1515/mjss-2017-0040
16. WorldBank. Gini index [webpage on the Internet]. No date [updated 2023; cited 2022 Mar 20]. Available from: https://data.worldbank.org/indicator/S I.POV.GINI
17. StatsSA. Towards measuring the extent of food security in South Africa: An examination for hunger and food adequacy. Report no. 03-00-14. Pretoria: StatsSA; 2019. Available from: https://www.statssa.gov.za/publications/03-0 0-14/03-00-142017.pdf
18. May J, Witten C, Lake L. South African child gauge 2020: Food and nutrition security. Cape Town: Children’s Institute, University of Cape Town; 2020. Available from: https://ci.uct.ac.za/sites/default/files/content_migration/heal th_uct_ac_za/533/files/ChildGauge_2020_lowres_18_02.pdf
19. StatsSA. Living conditions of households in South Africa: An analysis of household expenditure and income data using the LCS 2014/2015 [document on the Internet]. c2017 [cited 2020 Sep 21]. Available from: http://www.stat ssa.gov.za/publications/P0310/P03102014.pdf
20. StatsSA. How COVID-19 affected food security in South Africa [document on the Internet]. c2022 [cited 2022 May 15]. Available from: https://www.stats sa.gov.za/?p=15273
21. Temple NJ, Steyn NP, Fourie J, de Villiers A. Price and availability of healthy food: A study in rural South Africa. Nutrition. 2011;27(1):55–58. https://doi. org/10.1016/j.nut.2009.12.004
22. Ntloedibe M. South Africa: Food processing ingredients report 2019. GAIN report no. SA1910. Washington DC: USDA Foreign Agricultural Service Global Agricultural Information Network.
23. Von Bormann T. Agri-food systems: Facts and figures. How South Africa can produce 50% more by 2050. Cape Town: WWF-SA; 2019. Available from: w ww.wwf.org.za/report/agrifood_systems
24. Stroebel L, van Schalkwyk HD. Food retailing and agricultural development. In: Van Schalkwyk HD, Groenewald JA, Fraser GCG, Obi A, van Tilburg A, editors. Unlocking markets to smallholders: Lessons from South Africa. Wageningen: Wageningen Academic Publishers; 2012. https://doi.org/10.3 920/978-90-8686-168-2
25. Bhana A. The flourishing informal food sector [webpage on the Internet]. c2018 [cited 2021 Aug 17] ]. Available from: https://www.moneyweb.co.za/ news/economy/the-flourishing-informal-food-sector/
26. Euromonitor Passport. Packaged food in South Africa [document on the Internet]. c2020 [cited 2021 May 14]. Available from: https://www.euromoni tor.com/packaged-food-in-south-africa/report
27. Harper GC, Makatouni A. Consumer perception of organic food production and farm animal welfare. Br Food J. 2012;104(3):287–299. https://doi.org/1 0.1108/00070700210425723
28. Evans S. South Africans ramping up their efforts to tackle climate change. Mail & Guardian. 23 September 2021. Available from: https://mg.co.za/sp ecial-reports/2021-09-23-south-africans-ramping-up-their-efforts-to-tackl e-climate-change/
29. Willett W, Rockström J, Loken B, Springmann M, Lang T, Vermeulen S. Food in the Anthropocene: The EAT-Lancet Commission on healthy diets from sustainable food systems. Lancet. 2019;393:447–492. https://doi.org/10.10 16/S0140-6736(18)31788-4
30. Röös E, Garnett T, Watz V, Sjörs C. The role of dairy and plant based dairy alternatives in sustainable diets. In: Future Food Reports 3. Uppsala: Swedish University of Agricultural Sciences; 2018.
31. Global Alliance for the Future of Food. Untapped opportunities for climate action: An assessment of food systems in nationally determined contributions. Global Alliance for the Future of Food; 2022. Available from: https://futureoffood.org/wp-content/uploads/2022/03/assessment-of-foodsystems-in-ndcs.pdf
32. World Wildlife Fund. Water [webpage on the Internet]. c2021 [cited 2021 Apr 16]. Available from: https://www.wwf.org.za/our_work/water/
33. Institute of Waste Management of South Africa (IWMSA). Food waste a problem in insecure SA, says IWMSA [webpage on the Internet]. c2012 [cited 2021 Apr 16]. Available from: http://www.infrastructurene.ws/2012/09/12/fo od-waste-a-problem-in-food-insecure-sa-says-iwmsa/
34. Nahman A, de Lange W. Costs of food waste along the value chain: Evidence from South Africa [document on the Internet]. c2013 [cited 2021 Apr 16]. Available from: https://researchspace.csir.co.za/dspace/bitstream/handle/10 204/7115/Nahman2_2013.pdf?sequence=3&isAllowed=y
35. Oelofse SHH, Polasi T, Haywood L, Musvoto C. Increasing reliable, scientific data and information on food losses and waste in South Africa. Waste Research Development and Innovation Roadmap Research report CSIR/ SPLA/SECO/ER/2021/0019/A. Pretoria: CSIR Smart Places; 2021. Available from: https://wasteroadmap.co.za/wp-content/uploads/2021/06/17-CSIRFinal_Technical-report_Food-waste.pdf
36. Food and Agriculture Organization of the United Nations (FAO). Global food losses and food waste – Extent, causes and prevention. Rome: FAO; 2011. Available from: https://www.fao.org/3/i2697e/i2697e.pdf
37. Tubb C, Seba J. Rethinking food and agriculture 2020–2030. A RethinkX Sector Disruption Report. RethinkX; 2019.
38. Pyett S, de Vet E, Trindade LM, van Zanten H, Fresco LO. Chickpeas, crickets and chlorella: Our future proteins. Wageningen: Wageningen University & Research; 2019. Available from: https://edepot.wur.nl/496402
39. Vanhercke T, Colgrave M. What’s brewing? Precision food proteins from fermentation [webpage on the Internet]. c2022 [cited 2022 Apr 18]. Available from: https://ecos.csiro.au/whats-brewing-precision-fermentation/.
40. Campden BRI. Scientific and technical needs of the food and beverage industry [document on the Internet]. c2012 [cited 2012 Oct 02]. Available from: www.foodanddrinktechnology.com/news/956/2012-and=beyond-futureindustry-challenges-revelaed/
41. Jermann C, Koutchma T, Margas E, Leadley C, Ros-Polski V. Mapping trends in novel and emerging food processing technologies around the world. Innov Food Sci Emerg Technol. 2015;31:14–27. https://doi.org/10.1016/j.ifset.2015.06.007
42. Bader F, Rahimifard S. Challenges for industrial robot applications in food manufacturing. In: ISCSIC '18: Proceedings of the 2nd International Symposium on Computer Science and Intelligent Control; 2018 September 21–23; Stockholm, Sweden. New York: Association for Computing Machinery; 2018. Art. #37. https ://doi.org/10.1145/3284557.3284723
43. Leatherhead. Survey: What’s most important when it comes to investing in new technology? [webpage on the Internet]. c2012 [cited 2012 Oct 02]. Available from: http://foodstuffsa.co.za/news-stuff/food-science-and-techn ology-stuff/2385-survey-whats-most-important-when-it-comes-to-investin g-in-new-technology
44. Access to Nutrition Index (ATNI). Global index 2013 [webpage on the Internet]. c2013 [cited 2019 Sep 03]. Available from: https://www.accesstonutrition.o rg/app/uploads/2019/11/atni_global_index_2013.pdf
45. Geller M. Food revolution: Megatrends turn to small start-ups for big ideas. Reuters. 24 May 2017. Available from: https://www.reuters.com/article/us-f ood-investment-insight-idUSKBN18K18O
46. Cilliers T, Carinus A. The innovation paradox: Innovation within the food industry in developing countries and the challenges associated with globalisation. FST Magazine. 2022 April:6–7.
47. Dludla N. Tiger Brands bets on plant-based food with Herbivore Earthfoods investment. Reuters. 28 March 2022. Available from: https://www.reuters.co m/world/africa/tiger-brands-bets-plant-based-food-with-herbivore-earthfood s-investment-2022-03-28/
48. Popkin BM. Global nutrition dynamics: The world is shifting rapidly toward a diet linked with non-communicable disease. Am J Clin Nutr. 2006;84:289–298. https://doi.org/10.1093/ajcn/84.2.289
49. Goetjies E, Pavlova M, Hongoro C, Groot W. Socioeconomic inequalities and obesity in South Africa – a decomposition analysis. Int J Environ Res Public Health. 2021;18, Art. #9181. https://doi.org/10.3390/ijerph18179181
50. Van Romburgh, M. Faux meat and dairy start-ups consume nearly half of record $13B VC investment into foodtech. Crunchbase News. 28 March 2022. Available from: https://news.crunchbase.com/business/food-tech-su mmit-fake-meat-dairy-vc-startups-investment/
51. Ngige L. 5 African alternative protein startups innovating to meet 3-fold increase in meat & dairy demand by 2050. AgFunderNews. 02 September 2022. Available from: https://agfundernews.com/5-african-alternative-protein-startups-innovatingto-meet-3-fold-increase-in-meat-dairy-demand-by-2050
https://doi.org/10.17159/sajs.2024/16536
52. Mouton J, Basson I, Blanckenberg J, Boshoff N, Prozesky H, Redelinghuys H, et al. The state of the South African research enterprise [document on the Internet]. c2019 [cited2022 Aug 03]. Available from: https://www.researchg ate.net/publication/335857684
53. Schmoch U, Pouris A. International patent applications and innovation in South Africa. S Afr J Econ Manag Sci. 2021;24(1), a4146. https://doi.org/ 10.4102/sajems.v24i1.4146
54. InnoFoodAfrica. An introduction to InnoFoodAfrica [homepage on the Internet]. No date [cited 2022 Aug 03]. Available from: https://innofoodafr ica.eu/
55. RSA. The Presidency Republic of South Africa. White Paper on Science, Technology and Innovation: Science, technology and innovation enabling inclusive and sustainable South African development in a changing world [document on the Internet]. cYear [cited 2022 July 15]. Available from: ww w.dst.gov.za
56. Selby G. Dutch government invests record €60 M to boost cellular meat & agriculture [webpage on the Internet]. c2022 [cited 2022 May 28. Available from: https://www.foodingredientsfirst.com/news/dutch-government-invest s-record-%E2%82%AC60m-to-boost-cellular-meat-agriculture.html
57. Connors E. FOMO drives Singaporeans to lab-grown meat [webpage on the Internet]. c2022 [cited 21 August 2022]. Available from: https://www.afr.c om/world/asia/fomo-drives-singaporeans-to-lab-grown-meat-20220503-p 5ai98
58. Good Food Institute (GFI). Israel State of alternative protein innovation report 2021 April [webpage on the Internet]. c2021 [cited 2022 May 28]. Available from: https://gfi.org/event/israel-state-of-innovation-report-2022/
AUTHORS:
Taryn Riddin1,2
Lara van Niekerk1 3 Felicity Strange4
Janine B. Adams1 2
AFFILIATIONS:
1Institute for Coastal and Marine Research, Botany Department, Nelson Mandela University, Gqeberha, South Africa
2DSI/NRF Research Chair in Shallow Water Ecosystems, Botany Department, Nelson Mandela University, Gqeberha, South Africa
3South African Council for Scientific and Industrial Research, Stellenbosch, South Africa
4Friends of Verlorenvlei, Dullstroom, South Africa
CORRESPONDENCE TO:
Taryn Riddin
EMAIL:
taryn.riddin@mandela.ac.za
DATES:
Received: 15 Sep. 2023
Revised: 22 Mar. 2024
Accepted: 26 Apr. 2024
Published: 31 July 2024
HOW TO CITE:
Riddin T, van Niekerk L, Strange F, Adams JB. Habitat changes in response to pressures in the Verlorenvlei Estuarine Lake, South Africa. S Afr J Sci. 2024;120(7/8), Art. #16868. https://doi.org/10.1715 9/sajs.2024/16868
ARTICLE INCLUDES:
☒ Peer review
☒ Supplementary material
DATA AVAILABILITY:
☐ Open data set
☐ All data included
☒ On request from author(s)
☐ Not available
☐ Not applicable
EDITOR: Jennifer Fitchett
KEYWORDS:
estuarine lake, anthropogenic impact, vegetation response, drought, lake acidification
FUNDING:
South African National Research Foundation (UID 84375), Council for Scientific and Industrial Research
Habitat changes in response to pressures in the Verlorenvlei Estuarine Lake, South Africa
Verlorenvlei is a globally important RAMSAR wetland on the arid west coast of South Africa. A prolonged drought between 2016 and 2021 and increasing competition for water from the agricultural sector resulted in extremely low water levels. We used historical aerial and satellite imagery from 1942 and rainfall and water level data for the past 50 years, to assess habitat changes within the estuarine functional zone of the Verlorenvlei Estuarine Lake. Prior to the drought, lake water levels and water surface area remained stable (1113 ± 27 ha (SE)). Since then, there has been a 64% decrease in open water area, exposing 193 ha of sandbanks, of which 190.9 ha were hyper-sulfidic pyrite-rich. The water in the lower lake was hypersaline (>100), and in the middle, it was acidic (pH<3). The low water level plus sediment and nutrient input from surrounding agriculture resulted in a localised increase in reeds. Additional pressures, such as fires, have reduced the above-ground biomass of reeds and sedges, potentially altering surface morphology and reducing stored carbon. Despite flooding and filling up in June 2023, the lake remained in an acidic state (3.9–4.3). Similar low-lake level, hypersaline and acidic conditions are predicted to become more common under future climate change scenarios where aridity and extreme weather events are anticipated. Inflow of fresh water into the estuary and control of farming practices are required to keep the Verlorenvlei in a functional state, with long-term monitoring necessary to assess the ecological condition in response to restoration actions.
Significance:
We assessed the habitat changes in Verlorenvlei, an estuarine lake on the arid west coast of South Africa. Estuarine lakes are scarce, and an extended drought greatly reduced the water surface area, exposing hypersulfidic pyrite-rich soils, leading to lake acidification and a negative response from biota. Competition for water from agribusiness and the burning of reeds are added pressures. Subsequent heavy rains have been slow to buffer lake acidity, and the impacts thereof serve as a warning for the management of similar ecosystems and their ecological water requirements, especially under climate change where extreme weather conditions, increased aridity and competition for water are realities.
Introduction
Estuarine lakes are particularly susceptible to anthropogenic pressures due to their shallow nature, large surface area, weak connectivity with the sea and low flushing rate.1 Verlorenvlei is the only freshwater lake on the very arid west coast of South Africa, being fed by both rainfall and a large secondary aquifer.2 It has historically been an important source of fresh water for early humans, later becoming the focal point of settlements, agriculture and, in the last few decades, an important agribusiness region.3-5 Verlorenvlei is also an important bird area, providing feeding, nesting and resting facilities, for up to 20 000 birds at a time; for these reasons, it achieved RAMSAR status in 1991 (No. 525). It also represents an important national peatland, a rare wetland ecosystem in South Africa, due to the buildup of organic matter over centuries.6 Ecologically, Verlorenvlei is located in an area that forms a transition between the Strandveld and Fynbos bioregions, supporting many rare and threatened species.7,8 This collectively makes it an estuary of high conservation importance, albeit with no statutory protection.1,6
Only 4% of South African estuaries are estuarine lakes (of which there are 13), yet they cover more than 60% of the country’s estuarine habitat area.1 Their high water retention results in a sensitivity to the influence of in situ processes such as low flushing rates and slow remineralisation of nutrients more than other estuary types, making them less resilient to change and more vulnerable to catchment land use and development pressures, as well as climate change. This is particularly true in shallow estuarine lakes such as Verlorenvlei. Not surprisingly, more than 84% of South Africa’s estuarine lake area is in a poor ecological state.1 The Verlorenvlei is particularly important because, despite being small in comparison to other estuarine lakes, it is an ecological and socio-economic source of fresh water on an arid coastline.9
Estuarine habitats fluctuate naturally over time, and this is particularly evident at Verlorenvlei, where research has documented the changes that have taken place since the late Holocene.4,10-12 Fossil pollen analysis conducted on sediments from Verlorenvlei shows that the dominant vegetation type within the vicinity of the lake shifted between drought-resistant woody shrubs and salt marsh vegetation.4,5,10,11 These shifts took place on several occasions over the last ca 6000 years, largely in response to changing sea levels. The present ecotonal mix of Strandveld and Fynbos vegetation was established around 1900 BP in response to lowered sea levels.4 10 11 A number of freshwater springs facilitated the proliferation of the current wetland species during this period of sealevel regression, and the permanence of the reed swamps resulted in the formation of large peat beds associated with Verlorenvlei, where peat is defined as “an area with or without vegetation with a naturally accumulated peat layer at the surface”, where peat is “sedentarily accumulated material consisting of at least 30% (dry mass) of dead organic material with a depth of least 300 mm”2,6
Interwoven with global climatic drivers, human presence and their pressures are also at play locally. Archaeological studies from Elands Bay Cave, situated south of Verlorenvlei’s mouth, show intermittent human presence over the
last 20 000 years.5,10,11,13 In the last 2000 years, pollen analysis shows a decline in grass species, probably due to the increased presence of grazers10,11, further exacerbated by colonial occupation in the area in 1741 and the introduction of wheat and corn production, and cattle3
Given the importance of Verlorenvlei, this study describes the extent of changes in the macrophyte habitat and their drivers over the last 90 years, a period when anthropogenic pressure resulted in the greatest change. We make use of historical aerial and satellite imagery, repeated photography, and historical abiotic data in a data-poor environment to gain an understanding of these changes. The implications of these changes were evaluated under future climate change scenarios where rainfall patterns are expected to be more extreme, aridity increased and anthropogenic pressures more likely.14 15 The present status assessment is a component of the estuarine health index needed for an evaluation of the ecological flow requirements of estuaries as specified by the South African Department of Water and Sanitation and will therefore support management at a regional and national scale.16-18
Materials and methods
Study site
Verlorenvlei lies approximately 180 km north of Cape Town with a surface area of approximately 198 000 ha and an average depth of between 2 m and 3 m.1 Rainfall ranges from 537 mm/year in the catchment to about 210 mm/year at the mouth.19 The lake can be divided into three distinct reaches: Lower, Middle and Upper (Figure 1).9 The Lower reach near the mouth has a small, shallow channel (~2.6 km) that connects the larger lake basin (Middle reach) to the sea. There is very little free water exchange between the sea and the lake, mostly being closed by a sandbar during the dry summer months overlying a rocky sill.
A migrating barrier dune has pushed the mouth progressively south. During the winter months, when rainfall is at its maximum, the sandbar is breached and limited tidal interaction occurs. Seawater can overtop the sandbar during high spring tides and stormy conditions. The Lower reach is separated from the main lake basin (Middle reach) via a causeway and rocky sill. The Middle reach has a lake basin with an average depth of between 2 m and 3 m and a maximum depth of 5 m.20 In the shallow Upper reaches, the Verlorenvlei River feeds the lake through a series of wetlands at Redelinghuys (Figure 1). There is extensive agriculture in the catchment, being the largest and most intensively cultivated and fastestgrowing agricultural area in the Sandveld.9 The main crops are potatoes, wheat, corn, vegetables, rooibos, vineyards and citrus.
A recent study on the estuarine lakes of South Africa showed that Verlorenvlei alternates between four abiotic states in response to local climate and rainfall.1 Historically, drought cycles occur every 10 to 20 years and the mouth breaches every 2 to 3 years, remaining open for 1–2 months after breaching. Under closed-mouth conditions, the estuarine lake can be in either a very low water level state (a drought state where water can either be brackish or progress to acidic), a low water level and fresh state, or a high water level and fresh state, fed by rainfall and a large groundwater recharge from a secondary aquifer.2 During the closed-mouth state, back flooding of the floodplain during high inflow periods causes high water levels that inundate large parts of the wetlands in the upper reaches, which in turn can result in the illegal practice of artificial breaching, for example, in 2014. The fourth state is one where the mouth is open and water levels are declining due to outflow. At the time of this assessment in November 2021, the mouth was closed and the water level was below 0.5 m MSL with hypersaline conditions in the lower mouth region. Large parts of the main basin were exposed and acidic (pH in Lower reaches > 8, Middle reaches < 3, and
Figure 1: Locality of the Verlorenvlei Estuarine Lake, along with places of interest mentioned in the text.
Source: Esri, Maxar, Earthstar Geographics and the CIS User Community; reproduced with permission
Upper reaches between 6 and 7.5)9 and vegetation was dying back as a result (Figure 2).
Present and past habitat distribution
Habitat changes within the estuarine functional zone (EFZ) (represented by the 5 m contour) were mapped manually by digitising in ArcMap 10.6.121 aerial imagery obtained from the Chief Directorate National
Habitat changes in the Verlorenvlei Estuarine Lake
Page 3 of 11
Geo-spatial Information (CDNGI) (http://www.cdngiportal.co.za/cdngi portal/)22 (Table 1). The present habitat (2021) was compared to the habitat in past years (1942, 1978, 1998, 2003, 2013). These years were chosen to represent decadal changes based on the availability and quality of images. While recent orthorectified images are of 50 cm resolution, the older images are of relatively poor resolution, and they were used in conjunction with Google Earth imagery to map past areal extent. From
Figure 2: Large exposed sandy areas appear orange as the water level recedes during low inflow. By November 2021, the exposed sands were oxidised, acid sulfate soils with yellow and orange mottling from jarosite and iron oxide minerals were present and resulted in the dieback of vegetation.
Table 1: Available data used in the assessment of habitat changes over time in Verlorenvlei
Data Period
Aerial imagery 1942, 1978, 1998, 2016
2013, 2021
Oblique imagery 1981, 2013, 2021
Elands Bay, 1978–2021
Rainfall data
Redelinghuys, 2008–2021
Afgunst, 1985–2004
Water level data 1994–2017 (water level too low thereafter to record)
Catchment land cover 1990, 2014, 2018, 2020
Additional landcover changes
Pre-colonial
Fire and peat 2013, 2016, 2017, 2018, 2019, 2010
Source
Historical aerial imagery available from the Department of Agriculture, Land Reform and Rural Development (http://www.cdngiportal.co.za/)22
Google Earth
Jenny Day (written communication, 2023), Dimitri Veldkornet (written communication, 2013), this study
South African Weather Service (https://www.weathersa.co.za/)26
Agricultural Research Council (ARC) (https://www.arc.agric.za/Pages/Home.aspx)27
Department of Water and Sanitation station G3T001 (https://www.dws.gov.za/Hydrology/)28
South African National Landcover Data (https://egis.environment.gov.za/sa_national_land_cover_datasets)29
Sinclair (1980)30
Parkington (1976)5
Felicity Strange, Friends of Verlorenvlei personal records and photographs (https://www.facebook.com/groups/113047522058060/)
Grundling et al. (2021)6; Grundling (written communication, 2023)
historical Google Earth imagery, the two states identified by Van Niekerk et al.9 could be clearly identified: closed with very low water levels in 2021, and closed with high water levels in 2013/2014. Although colonial settlers have inhabited the area since the 1600s, the earliest images to assess vegetation distribution were only available in 1942 and represent a near-natural state with little human pressure. Historical oblique photos, unpublished literature, social media and local conservancy groups (‘Friends of Verlorenvlei’) were widely sourced to gain an understanding of the spatio-temporal changes of vegetation at the local scale (Table 1). Where available, repeated photography from previous research on the estuary was used (1981, 2013 and 2021). This method of historical ecological analysis provides an accurate, practical tool to document vegetation changes, especially when used together with other historical information like long-term rainfall data. It is also invaluable as a method of comparing predicted climate change scenarios with actual changes3-25, especially in a data-poor environment such as this study site.
Estuarine habitat was categorised into the following subcategories: freshwater reeds and sedges, salt marsh, terrestrial vegetation, and open water, which represents microalgal habitat.31 Often, an ecotone forms in places with an intermingling of habitat. Also mapped were degraded habitat (where some original vegetation and biodiversity remain) and developed habitat (where complete transformation has taken place, usually represented by hard structures like roads, railways and the built-up environment, along with agriculture). To verify these habitats, ground truthing took place on 8, 9 and 10 November 2021, during which time geotagged images assisted with the identification of habitat type. During the field trip, random depth to groundwater and groundwater salinity measurements were taken to understand the location and extent of habitats and their drivers. These data are mentioned in the text.
Drivers of macrophyte change (rainfall, water level, human pressure)
Two important drivers influence habitat extent in the Verlorenvlei Estuary, namely rainfall/water level and human pressure.9 Monthly rainfall data from the South African Weather Service began only in 1967, and as late as 2008 for some sites in the catchment.26 To supplement this rainfall data, data from the Agricultural Research Council32 were sourced for the
catchment (Afgunst) and within the EFZ (Figure 1). These data, along with historical aerial imagery, were used to identify when the different abiotic states identified by Van Niekerk9 occurred and how this influenced habitat extent. The closed, very low water level state was clearly seen in the 2021 images, which represented the present state.
Water level data in the estuary were supplied by the Department of Water and Sanitation, station number G3T001.28 The gauge is located near Uithoek Farm, 11 km from the mouth of the reed beds (Figure 1). Data were obtained for the period 1994–June 2017, after which the lakebed dried at the monitoring point and no further measurements could be recorded. Salinity is closely linked to vegetation distribution and species composition in estuaries31 33, but as no historical data exist, known species tolerance ranges were used to assess temporal changes.
Historical accounts were used to assess the change in human pressures over time. Local knowledge regarding the fire history was sourced from the Friends of Verlorenvlei, a local conservancy group, and other available data such as the Estuary Management Plan.7 Changes in the catchment were assessed using the South African National Landcover Data22 29 and raster data on the rates and patterns of habitat loss, which cover four periods: 1990, 2014, 2018 and 2020.34 These images were clipped using the catchment and the EFZ polygons of the Verlorenvlei.
Results
Present and past habitat distribution
The main habitats associated with the Verlorenvlei are open water, reeds and sedges, sand and mudflats, and floodplains (Figure 3). Due to a drought between 2016 and 2023, open water area decreased by 64% from a mean of 1113 ± 27 ha (SE) before the drought to 421 ha during the drought (Figure 4). This exposed large areas of sand (189 ha) in the main basin (Middle reaches) and Upper reaches with a total sandbank area of 193 ha. Prior to the drought, there were very few exposed sandbanks due to the high water level (<2 ha). On Google Earth imagery, these beds appeared orange in colour in places due to their pyrite-rich content (data presented in a separate article). Similar orange colouration was seen in February 2019 (190.9 ha) and in December 2020 (61.1 ha). These highly acidic soils resulted in the dieback of many of the emergent habitats (Figure 2) with the 2021 state representing a
Figure 3: Present (2021) habitat of the Verlorenvlei with examples of habitat of salt marsh at the mouth; Phragmites australis stands in the middle with aquatic macrophytes, and ecotonal mixes of reeds, terrestrial and salt marsh species in places.
closed, very low and acidic state (Supplementary figure 1).1 The open water supports submerged and floating aquatic macrophytes, but this habitat could not be mapped or groundtruthed in November 2021 due to limited access as a result of the low water level. It was estimated that these macrophytes covered approximately 30% of the open surface water area (126 ha) (Figure 3). The open water in the Middle and Upper reaches was connected, but not in the Lower reaches. Submerged and floating aquatic macrophytes were represented by freshwater species. The naturalised exotic submerged aquatic Myriophyllum spicatum was not observed during the field trip nor in the satellite images, despite being prolific in the 1980s.3 Its presence in the past was suggested to be in response to nutrient run-off from surrounding agricultural activities. However, large beds of floating Crassula natans occurred, together with Cotula coronopifolia and Aponogeton distachyos, in the Middle and Upper reaches in 2021.
At the mouth, the water was hypersaline (>100), and no aquatic plants were observed. However, stands of reeds and sedges occur in the Lower and Middle reaches despite high surface salinity. Ad-hoc augured holes found the groundwater to be at 10–30-cm depths with a salinity of 10. These fresh water seepage areas maintain these plants in this area as they grow best at a salinity of below 15. This groundwater source is of significance as the water column salinity in the Lower reaches was hypersaline (mean 143). Most of the reeds and sedges (Phragmites australis, Scirpus maritimus, Schoenoplectus scirpoides, Typha capensis and various other Cyperus species) occur in the Middle and Upper reaches (688 ha) (Figure 3). Beds can either cover the width of the system (Middle and Upper reaches) or occur on the dry, exposed lakebed intermingled with salt marsh and terrestrial species, forming an ecotone (Figure 3). Despite the lack of physico-chemical data other than rainfall and estuary water level, it was possible to infer environmental conditions based on habitat and the salinity preferences of the dominant macrophytes. Phragmites australis indicates freshwater conditions even in the presence of hypersaline surface waters as was found in the Lower and Middle reaches35 as the roots and rhizomes are located in fresher water. During the field trip, surface water salinity was found to be over 140 in the lower reaches, but at sediment depths between 30 cm and 1.5 m, groundwater was 10. Analysis of historical aerial imagery shows the presence of reeds
and sedges in the exposed lakebed even under low water levels; fresh groundwater input would be important in maintaining these habitats. Reeds and sedges appear to be stable in extent over the last few years with only a 6% increase from 1942 to 2021 and a mean area of 704 ± 28.9 ha (SE) (Figure 4). Under very high water levels (2013), reed extent is reduced, probably due to depth limitations. Under very low water levels, there have been localised increases in reed and sedge extent in the Middle as well as in the Upper reaches into the exposed lake bed (Figure 5). The rate of expansion into the dry riverbeds was calculated at 1.4 ha/year. Where reeds have died due to high water levels and inundation, recovery to previous extents under lower water levels took about 14–19 months. Cape arid estuarine salt marsh and saline grasses (3 ha) occur in the Lower reaches around the mouth with species such as Salicornia spp., Bassia diffusa, Sporobolus virginicus, Cynodon dactylon, Paspalum vaginatum, Triglochin spp., Cotula spp. and Juncus kraussii. Salt marsh remains relatively constant (3 to 4 ha) and on the large floodplain above 2.5 m MSL (168 to 588 ha) (Figure 4), terrestrial species such as Mesembryanthemum crystallanum, various Aizoaceae and other ecotonal terrestrial species intermingle with Salicornia spp., Juncus spp. and Phragmites australis
The large salt marsh area in the lower reaches in 1942 (125 ha) would be a mix of ecotonal species, terrestrial and salt marsh, as is the case in the intermediate years. It was difficult to delineate salt marsh from ecotonal habitat due to the poor resolution of the earlier images, and it is possible that the high extent in the early years may include floodplain habitat. Other habitats, like rocks (habitat for epipelic microalgae) and beach and dune sand also occur within the EFZ, but to minor extents. Terrestrial vegetation consists of Lambert’s Bay Strandveld, Saldanha Flats Strandveld and Leipoldtville Sand Fynbos (99 ha) (Figure 3).7
Drivers of macrophyte change (rainfall, water level, human pressures)
Rainfall and lake water level
Analysis of rainfall data for the Elands’ Bay area showed that over the last 43 years there have been alternate wet and dry cycles (Figure 6), with a duration of 3–10 years. Although patchy datasets hamper statistical analyses, estuarine habitat shifts between low- and high-water states
Figure 4: Changes in habitat within the estuarine functional zone of the Verlorenvlei between 1942 and 2021.
5: Reed encroachment in the Middle/Upper reaches of the Verlorenvlei due to low water levels. Images show the transistion from high-water level in October 2018 to low water level and the expansion of reeds in February 2019, December 2020 and April 2022.
6: Annual rainfall for Elands Bay from 1978 to 2021 (South African Weather Service) and estuary water level as recorded at the Department of Water and Sanitation gauge G3T001 (blue = rainfall, grey = estuary water level, orange = expected annual rainfall). There are no water level data after July 2017 as the gauge site dried out. Arrows indicate the years used for mapping low- and high-water states.
as a result. Above average / wet years were experienced between 1993 and 1998, 2007 and 2011 and 2012 and 2015. Drought years occurred between 1978 and 1983, 1998 and 2006 and 2015 and 2020. Although the estuary water level gauge only began recording in 1994 and stopped in July 2017 due to exposure of the lakebed, it still shows the response of the water level to rainfall, especially the time lag between rainfall and increased water level at times only weeks later. Repeated photography has shown that variability in water surface area in the Verlorenvlei is part of a natural decadal cycle associated with rainfall and water level (Supplementary figure 1).
Human pressures: Fires and over-allocation of surface and groundwater
Development within the EFZ already covered 124 ha (5%) in the earliest aerial images of 1942 and has since increased to 12% (267 ha) in 2021 due to agriculture, roads, railway lines, gravel roads and various footpaths (Figure 4). As development increased, so did the presence of invasive species; for example, Eucalyptus stands occur around farmsteads planted for shade and wind protection. Cattle grazing, trampling, and footpaths have degraded habitat, mostly at the expense of floodplains and terrestrial vegetation. Almost 50% of the catchment has been transformed into either agriculture or development, most of which occurred prior to 1990 (44%) (Figure 7). Post-1990 changes account for 9% of the catchment. However, competition for water resources by farming and nutrient and sediment input arising from the various land-use practices in the catchment, particularly those related to fresh water abstraction, are serious pressures on the ecological health of the estuary. Hunter-gatherers and pastoralists have been intermittently present in the area over the last 20 000 years.5 10 11 13 The presence and associated pressures intensified with the settling of European settlers around the Verlorenvlei since the early 1600s (Figure 8). Land-cover changes first took place in the early 1600s, when loans were granted by the governing Dutch East India Company for grazing and wheat production.3 By the 1800s, settlements were well established in the area. Agricultural activities continued with further clearing of land, especially when the area became electrified in the 1960s, promoting the use of centre-pivot irrigation for the cultivation of seed potatoes. Vines and orchards are the other main forms of agriculture in the catchment. Since the 1960s, several major obstructions have altered tidal exchange in the
Lower Zone.3 A rocky sill at the mouth (that used to be a causeway); a causeway below the Sishen-Saldana railway bridge and the road crossing to Elands Bay. In addition to the constrictions in the lower estuary, there are also two causeways in the Upper Zone at Grootdrift and Redelinghuys that also pose a constraint on circulation, separating the zones and reducing biological connectivity.
Irregular fire practices have also impacted the Verlorenvlei habitats in the Lower to Middle reaches in the past 10 years. Some of these were due to lightning strikes (1 February 2020), others through illegal burning to clear the reeds by local farmers (13 May 2013, 6 April 2016, 8 March 2017, January 2018) (Figure 9). One such out-of-control fire at Bonteheuvel began on 6 April 2016 and continued to smoulder until 18 June. The fire residue was still evident on Google Earth imagery in October 2018. The most recent fire on 1 February 2020, caused by a double lightning strike, burned until 23 April 2023. However, the below-ground biomass (peat) continued to smoulder for a few months, finally being extinguished on 23 April 2020 (Grundling, personal communication).
Discussion
This article serves as a collation of available knowledge and published data on the Verlorenvlei Estuary so that its present habitat status (2021) and changes over time could be assessed. Unfortunately, for many of South Africa’s estuaries, long-term data are lacking and any local sources of information are invaluable in understanding changes over time. For this reason, we have made use of a variety of data sources –aerial photographs, repeated photography, rainfall records and anecdotal data – to gain an understanding of macrophyte changes in Verlorenvlei. This information can be used in ecological water requirement studies, which are marked with low, medium or high confidence depending on the available data. From this monitoring, data requirements are specified in the study to improve future assessments. These ecological water requirement studies by the Department of Water Affairs and Sanitation are a national requirement in the management of South African estuaries and encompass ecohydrological and ecosystem-based concepts.36 To date, the study approach has been applied to 40% of South Africa’s estuaries with the majority (68%) of studies being completed as low confidence desktop or rapid level assessments.18,37
Figure 7: Almost 50% of the Verlorenvlei catchment has been transformed into agriculture, most of which has occurred since the 1990s. The rainfall station Afgunst is shown in the catchment.
In this study, we found large changes in habitat area, in particular open water, over the last decade. The open water area has been reduced by 64% from a mean high-water area of 1113 ± 27 ha (SE) (1942–2013) in response to a prolonged drought beginning in 2016. The reduced open water has led to large exposed sandbanks (increasing from 2 ha under high water levels to 193 ha under low water levels). The reduced open water reduces habitat availability for associated submerged and floating
aquatic macrophytes. At the time of sampling in November 2021, the mouth was closed, the water level was below 0.5 m MSL, the Lower reaches were hypersaline and there were large, exposed areas in the Middle reaches with acidic soils (<3) and a dieback of reed habitat in some places. These orange-coloured sands suggest pyrite-rich sediments. Natural sulfate reduction processes in organic-rich aquatic sediments can result in the accumulation of sulfide minerals such as
Figure 9: Uithoek fire in 2017 (left) and the after-effects of the prolonged burn at Koopmansdrif 2020; (right). The black square indicates the area in which reeds burned.
Images: (left) Sara Louw; (right) Tiaan Carstens; with permission
Figure 8: Timeline of changes in the Verlorenvlei area from 1652 until 2023.
pyrite (FeS2). Upon exposure to air, pyrite can oxidise to produce sulfuric acid, dissolved ferrous iron and jarosite mottling.38 Thus, strongly acidic conditions can form upon rewetting (by rainfall or lake refill) of the exposed organic-rich sediments.39 Sediment and water analysis showed this is now a persistent and ongoing process in Verlorenvlei (article in preparation) with negative effects on the overlying vegetation (Figure 2). A similar process of lake acidification occurred in the Murray-Darling Basin of Australia, where a 2-year drought resulted in the exposure of more than 200 km2 39 Upon rewetting of the sediments, surface water had a pH of between 2 and 3, and high concentrations of dissolved metals were mobilised.39 This acidity persisted in the lake sediment and the water for several years after the drought broke, and surface water management was a long and costly process to return water pH levels to biologically acceptable levels. In the case of Verlorenvlei, partial rewetting from small rainfall events has produced standing pools of water with a pH below 3 in the Middle reaches. This has not changed much despite the increased inflow of fresh river water following the recent heavy rains of 2023 (1:20 year flood) along with water introduced from a burst dam in the catchment, adding another 150 000 m3 of water to the lake. The mottling of these hyper-sulfidic organic-rich soils by jarosites often occurs along Phragmites australis roots and cracks38 and was similarly found in this study in areas previously vegetated by Phragmites australis. These jarosites can retain acidity for many years, even decades, leading to continued low pH in the sediment and overlying water.38 Drought conditions also potentially increase salinity, which in a predominantly freshwater habitat, can have severe consequences. The Verlorenvlei ecological water requirement study found that before the drought in 2016, salinity mostly fluctuated between 1 and 3, while after 2017, the system showed a marked increase in salinity due to evaporation, with 12.6 (2018), 17.5 (2019), and values as high as 25.8 (2020) observed, before a decline to 5.9 (2021).9 These values are the highest on record for the system. While this is a predominantly freshwater ecosystem, salt marsh does occur in the Lower reaches but to a small extent. On the floodplain, it intermingles with terrestrial species to form an ecotone.
Reeds and sedges cover 704 ± 29 ha (SE) with little variation over time. However, there have been localised increases in the Upper (probably in response to sediment and nutrient input from agriculture) and Middle reaches (due to low water levels), with the latter taking place at a rate of 1.4 ha/year (Figure 5). Although reeds are an effective nutrient and sediment filter, especially in the Upper reaches, the increased organic plant matter could cause an increase in inorganic nutrients through remineralisation. Cyanobacterial blooms in the basin (Middle reaches) and also at times in the Upper reaches (especially during spring and summer when temperatures are higher and residence times are longest) support this hypothesis.1 Reeds in the Upper reaches rely on the Verlorenvlei River (which feeds the system through a series of wetlands at Redelinghuys) and freshwater springs and appear to have persisted since 1942, despite the absence of water at times. These freshwater springs also support stands of freshwater habitat in the Lower reaches, where hypersaline conditions occur in this closed, low and acidic state.
Palaeoenvironmental reconstruction of the Verlorenvlei area has provided insight into the climatic changes, sea-level fluctuations, vegetation changes and human activity in this coastal region.10,11 Around 4300 BP, marine and more xeric conditions disappeared and were replaced by freshwaterdominant hydrology and ecology. The decline in grass pollen from 1900 BP in sediment cores suggests the impacts of pastoralists, colonial and post-colonial disturbances of the vegetation. In the 350 years of colonial occupation, disturbance has been the greatest in the last few decades due to agri-business. Anthropogenic pressures have intensified over the last 100 years as agriculture, road and rail development have increased. These have led to competition for water resources, and land practices such as burning and clearing of reed swamps, which have fast-tracked land-cover change in the area. This increased abstraction has led to a reduction of 50% in baseflow, and together with a reduction in mean annual rainfall in the last 90 years, has led to a reduction in lake water level by 33 cm.9 These natural and anthropogenic pressures pose a serious threat to the ecological health
of the Verlorenvlei and, therefore, to its current RAMSAR status. Agricultural activities occupied over 50% of the catchment prior to the 1990s. Commercial agricultural activities include potato farming, rooibos plantations (Aspalathus linearis), vineyards and orchards. Centre-pivot irrigation, a method that uses rotational cropping and the clearing of large areas, the use of fertilisers to enhance nutrient-poor soils and groundwater abstraction have all increased to boost production.9,14 Agriculture accounts for more than 90% of the total registered groundwater use in the Sandveld, with potato farming accounting for 20% of the annual groundwater recharge.14,40 Over abstraction of groundwater not only threatens the deep baseflows of the large secondary aquifer that feeds and sustains the wetlands of Verlorenvlei, particularly during the dry seasons, but also increases salinisation of groundwater resources.41 While there is a disagreement amongst groundwater specialists as to the degree to which Verlorenvlei is dependent on groundwater versus surface water to maintain lake levels40-42, both ultimately contribute to the total flow into Verlorenvlei and lake levels.
The peat resources are also at risk due to the occurrence of regular fires. Although the above-ground biomass only burns for a few days, the belowground biomass can continue to smoulder for a few months as happened in 2016 and 2020. In the nearby Wadrif Estuary, a reed and sedge swamp similar to those in the Verlorenvlei existed for many years. The original swamps and resulting thick peat layers were fed by a freshwater spring.42 However, these springs were targeted as a water source by the government. As a result, the water table lowered, saline water intrusion occurred, and vegetation began to dry out and die. An electrical fire in the late 1990s resulted in a fire that continued to smoulder for 2 years due to the 2-m-thick desiccated peat layer. These peat swamps cannot be recovered, nor can their ecological service of acting as nutrient filters and carbon stores.43 Peatlands are among the world’s largest carbon sources, and the loss of potentially 688 ha of reed swamps in the Verlorenvlei could have serious local ecological consequences, along with the release of carbon into the atmosphere, which would have a wider impact. Clearing of peatlands by fire has an estimated release of 88 t C/ha.44 The clearing of land through fires and low lake levels also exposes large sand areas. This can lead to the buildup of sand through wind erosion, which can alter morphology, further restricting water flow and connectivity. A recent dust study showed that the main source of windblown sediment in the area was the exposed lakebed, Verlorenvlei catchment and surrounding agriculture sector.45
Future outlook
With the recent extreme low water level in Verlorenvlei, exposure to acidic soils and dieback of vegetation, what does the future hold for Verlorenvlei in the context of climate change predications of more extreme weather events (greater droughts and floods), increased temperatures, greater aridity and sea level rise? Since this study in 2021, the lake water level has declined further by 88% to 52 ha in May 2023 with water only occurring in the Middle reaches. Despite a 1:20-year flood in June 2023, which raised the lake water level, both sediment and water showed continued acidic conditions (article in preparation). This acidic state has had cascading effects on the lake biota as well as on surrounding livestock and farm animals. In the past, freshwater invertebrates were present throughout the lake, but under this new acidic state, no life occurs in the Lower and Middle reaches.9 Partial drying out and flooding are natural cycles in lakes due to their large surface area and shallow nature, and this study has reported on these fluctuations. Under climate change, this cycling is expected to occur more frequently with greater extremes. Increased aridity, increased extreme weather events (droughts, floods), increased temperatures, increased wind, decreased rainfall (especially during critical growing months for agriculture), increased mouth closure and increased evaporation will result in lower lake levels and increased acidification9,14,15,46, with the buildup of hyper-sulfidic sediment potentially remaining for decades47. What effects this will have on the long-term storage of seeds in the sediment, as well as the recovery of vegetation and aquatic communities, is unknown due to limited literature.48 The mean annual run-off has been predicted to further decrease from the current 30% to 50%9, putting more pressure on groundwater abstraction for commercial agriculture irrigation in particular. The additional pressure of
land-use practices and existing human pressures needs to be considered if Verlorenvlei is to maintain its current RAMSAR status. This can be achieved through compulsory water use licensing, a reduction in water abstraction, a reduction in inorganic nutrient input from the catchment, prevention of illegal artificial breaching of the mouth, restoration of hydrological connectivity, protection of resources and buffer zones (reduced reed burning, grazing of salt marsh), and promulgation as a formally protected area with agreements on the fresh water requirements of the downstream estuarine lake.9
Acknowledgements
We thank the Friends of Verlorenvlei for their historical input, the South African Weather Service for the historical weather data, and the anonymous reviewers for their critical assessment of this article.
Funding
The DSI/NRF Research Chair in Shallow Water Ecosystems (UID 84375) supported J.B.A. and provided running costs for this research. L.v.N.’s contribution was funded by the Council for Scientific and Industrial Research (CSIR), through the South African Department of Science and Innovation’s Parliamentary Grant.
Data availability
Data are available upon request to the corresponding author.
Declaration of AI use
No AI-generated content was used in this work.
Authors’ contributions
T.R.: Conceptualisation, methodology, data collection, sample analysis, data analysis, validation, data curation, writing – the initial draft. L.v.N.: Conceptualisation, data collection, validation, writing – revisions, project leadership. F.S.: Data collection, writing – revisions. J.B.A.: Conceptualisation, data collection, validation, writing – revisions, project leadership, funding.
Competing interests
We have no competing interests to declare.
References
1. Van Niekerk L, Taljaard S, Adams JB, Lamberth SJ, Weerts SP, Lotter D, et al. WRC project K5/2931: Development of climate change mitigation and adaptation strategies for the estuarine lakes of South Africa. Pretoria: Water Research Commission; 2022.
2. Watson A, Miller J, Fleischer M, de Clercq W. Estimation of groundwater recharge via percolation outputs from a rainfall/runoff model for the Verlorenvlei estuarine system, west coast, South Africa. J Hydrol. 2018;558:238–254. https://doi.org/10.1016/j.jhydrol.2018.01.028
3. Sinclair SA, Lane SB, Grindley JR. Report No. 32 - Verlorenvlei (CW 13). Stellenbosch: National Research Institute for Oceanology, CSIR; 1986.
4. Cowling RM, Cartwright CR, Parkington JE, Allsopp JC. Fossil wood charcoal assemblages from Elands Bay Cave, South Africa: Implications for Late Quaternary vegetation and climates in the winter-rainfall fynbos biome. J Biogeogr. 1999;26(2):367–378. https://doi.org/10.1046/j.1365-2699.1999.00275.x
5. Parkington JE. Elands Bay Cave: Keeping an eye on the past. South Afr Humanit. 2016;29:17–32. https://hdl.handle.net/10520/EJC-55bbe2aab
6. Grundling PL, Grundling A, Van Deventer H, Le Roux JP. Current state, pressures and protection of South African peatlands. Mires Peat. 2021;27, Art. #26. http://dx.doi.org/10.19189/MaP.2020.OMB.StA.2125
7. CSIR. Development of the Verlorenvlei estuarine management plan: Situation assessment. Report no. CSIR/NRE/CO/ER/2009/0153/B. Stellenbosch: CSIR; 2009.
8. Acocks JPH. Veld types of South Africa. 3rd ed. Mem Bot Surv S Afr. 1988;57:1–146. https://doi.org/10.1016/S0254-6299(15)30356-2
9. South African Department of Water and Sanitation. Reserve determination study for selected surface water, groundwater, estuaries and wetlands in the F60 and G30 catchments within the Berg-Olifants Water Management Area. Draft Verlorenvlei EWR Report RDM/WMA09/00/CON/0125. Pretoria: Department of Water and Sanitation, Water Ecosystem Management; 2023.
10. Meadows ME, Baxter AJ. Holocene vegetation history and palaeoenvironments at Klaarfontein Springs, Western Cape, South Africa. Holocene. 2001; 11(6):699–706. https://doi.org/10.1191/09596830195726
11. Meadows ME, Baxter AJ, Parkington J. Late Holocene environments at Verlorenvlei, Western Cape Province, South Africa. Quat Int. 1996;33:81–95. https://doi.org/10.1016/1040-6182(95)00092-5
12. Kirsten KL, Kasper T, Cawthra HC, Strobel P, Quick LJ, Meadows ME, et al. Holocene variability in climate and oceanic conditions in the winter rainfall zone of South Africa—inferred from a high resolution diatom record from Verlorenvlei. J Quat Sci. 2020;35(4):572–581. https://doi.org/10.1002/jqs.3200
13. Jerardino A, Klein RG, Navarro R, Orton J, Horwitz LK. Settlement and subsistence patterns since the terminal Pleistocene in the Elands Bay and Lamberts Bay areas. In: Jerardino A, Malan A, Braun D, editors. The archeology of the West Coast of South Africa. Oxford: Archaeopress; 2013.
14. Archer E, Conrad J, Münch Z, Opperman D, Tadross M, Venter J. Climate change, groundwater and intensive commercial farming in the semi-arid northern Sandveld, South Africa. J Integr Environ Sci. 2009;6(2):139–155. https://doi.org/10.1080/19438150902916589
15. Tadross M, Jack C, Hewitson B. On RCM-based projections of change in southern African summer climate. Geophys Res Lett. 2005;32(23), L23713. https://doi.org/10.1029/2005GL024460
16. Adams JB. A review of methods and frameworks used to determine the environmental water requirements of estuaries. Hydrol Sci J. 2014;59(3–4): 451–465. https://doi.org/10.1029/2005GL024460
17. Van Niekerk L, Adams JB, Bate GC, Forbes AT, Forbes NT, Huizinga P, et al. Country-wide assessment of estuary health: An approach for integrating pressures and ecosystem response in a data limited environment. Estuar Coast Shelf Sci. 2013;130:239–251. https://doi.org/10.1016/j.ecss.2013.05.006
18. Adams J, Cowie M, van Niekerk L. Assessment of completed ecological water requirement studies for South African estuaries and responses to changes in freshwater inflow. WRC report KV 352/152016. Pretoria: Water Research Commission; 2016.
19. Lynch S. Development of a raster database of annual, monthly and daily rainfall for southern Africa. Pretoria: Water Research Commission; 2004.
20. Robertson HN. An assessment of the utility of Verlorenvlei water [MSc thesis]. Cape Town: University of Cape Town; 1980.
22. Department of Agriculture, Land Reform and Rural Development. CDNGI Geospatial portal [database on the Internet]. No date [cited 2024 Mar 19]. Available from: http://www.cdngiportal.co.za/
23. Russell J, Ward D. Vegetation change in northern KwaZulu-Natal since the Anglo-Zulu War of 1879: Local or global drivers? Afr J Range Forage Sci. 2014;31(2):89–105. https://doi.org/10.2989/10220119.2013.827740
24. Santana Cordero A, Szabó P. Exploring qualitative methods of historical ecology and their links with qualitative research. Int J Qual Methods. 2019;18:1–11. https://doi.org/10.1177/1609406919872112
25. Hoffman MT, Rohde RF. The use of repeat photography in African historical ecology. In: Decocq G, editors. Historical ecology: Learning from the past to understand the present and forecast the future of ecosystems. London: ISTE Science Publishing Ltd; 2022. p. 57–70.
26. South African Department of Forestry, Fisheries and the Environment. SA National land-cover datasets [webpage on the Internet]. No date [cited 2024 Mar 19]. Available from: https://egis.environment.gov.za/sa_national_land_ cover_datasets
27. Adams JB, Veldkornet D, Tabot P. Distribution of macrophyte species and habitats in South African estuaries. S Afr J Bot. 2016;107:5–11. https://doi.o rg/10.1016/j.sajb.2016.08.001
28. Skowno AL, Jewitt D, Slingsby JA. Rates and patterns of habitat loss across South Africa’s vegetation biomes. S Afr J Sci. 2021;117:112–116. https://do i.org/10.17159/sajs.2021/8182
29. Moeletsi ME, Myeni L, Kaempffer LC, Vermaak D, de Nysschen G, Henningse C, et al. Climate dataset for South Africa by the Agricultural Research Council. Data. 2022;7(8):1–7.
30. Adams JB, Bate GC. Growth and photosynthetic performance of Phragmites australis in estuarine waters: A field and experimental evaluation. Aquat Bot. 1999;64:359–367. https://doi.org/10.1016/S0304-3770(99)00063-7
31. South African Department of Water and Sanitation. Hydrology [webpage on the Internet]. No date [cited 2024 month day]. Available from: https://www. dws.gov.za/Hydrology/
32. Van Niekerk L, Taljaard S, Adams JB, Lamberth SJ, Huizinga P, Turpie JK, et al. An environmental flow determination method for integrating multiple-scale ecohydrological and complex ecosystem processes in estuaries. Sci Total Environ. 2019;656:482–494. https://doi.org/10.1016/j.scitotenv.2018.11.276
33. Fernandes M, Adams J. Quantifying the loss of and changes in estuary habitats in the uMkhomazi and Mvoti estuaries, South Africa. S Afr J Bot. 2016;107:179–187. https://doi.org/10.1016/j.sajb.2016.04.009
34. Fitzpatrick RW, Mosley LM, Cook FJ. Understanding and managing irrigated acid sulfate and saltaffected soils: A handbook for the lower Murray Reclaimed Irrigation Area. Adelaide: University of Adelaide Press; 2017.
35. Mosley LM, Zammit B, Jolley AM, Barnett L. Acidification of lake water due to drought. J Hydrol. 2014;511:484–493. https://doi.org/10.1016/j.jhydrol.2014.02.001
37. Eilers A. Deep groundwater characterisation and recharge estimation in the Verlorenvlei catchment [MSc thesis]. Stellenbosch: Stellenbosch University; 2018.
38. GEOSS South Africa. Water use licence application geohydrological assessment: Laastedrif Agri (Pty) Ltd, Nuwerus: Farm 7/227, 8/227, 29/1 and 10/1. 2020.
39. Grundling P-L, Grundling A, Van Deventer H, Roux J. Current state, pressures and protection of South African peatlands. Mires Peat. 2021;27:26. https://d oi.org/10.19189/MaP.2020.OMB.StA.2125
40. Leng LY, Ahmed OH, Jalloh MB. Brief review on climate change and tropical peatlands. Geosci Front. 2019;10(2):373–380. https://doi.org/10.1016/j.gsf.2017.12.018
41. Prag R. Tracing and fingerprinting the potential sources of mineral aerosol emissions in Verlorenvlei, using (QEMSCAN)[Hons report]. Cape Town: University of Cape Town; 2021.
42. Stager JC, Mayewski PA, White J, Chase BM, Neumann FH, Meadows ME, et al. Precipitation variability in the winter rainfall zone of South Africa during the last 1400 yr linked to the austral westerlies. Clim Past. 2012;8(3):877–887. https://doi.org/10.5194/cp-8-877-2012
43. Fitzpatrick RW, Shand P, Mosley LM. Acid sulfate soil evolution models and pedogenic pathways during drought and reflooding cycles in irrigated areas and adjacent natural wetlands. Geoderma. 2017;308:270–290. https://doi.or g/10.1016/j.geoderma.2017.08.016
44. Keller W, Yan ND. Biological recovery from lake acidification: Zooplankton communities as a model of patterns and processes. Restor Ecol. 1998;6(4):364–375. https://doi.org/10.1046/j.1526-100X.1998.06407.x
45. Agricultural Reseach Council [homepage on the Internet]. No date [cited 2024 Mar 19]. Available from https://www.arc.agric.za/Pages/Home.aspx
46. Sinclair SA. The rural settlement of Verlorenvlei in historical perspective [master’s thesis]. Cape Town: University of Cape Town; 1980.
47. South African Weather Service [homepage on the Internet]. No date [cited 2024 Mar 19]. Available from: https://www.weathersa.co.za/
48. Veldkornet DA, Potts AJ, Adams JB. The distribution of salt marsh macrophyte species in relation to physicochemical variables. S Afr J Bot. 2016;107:84–90. https://doi.org/10.1016/j.sajb.2016.08.008
AUTHORS:
Phikolomzi Matikinca1,2
Balbina Nyamakura1 3
Sheona Shackleton1 4
AFFILIATIONS:
1Department of Environmental Science, Rhodes University, Makhanda, South Africa
2Department of Environmental and Geographical Science, University of Cape Town, Cape Town, South Africa
3Water Resources and Ecosystems Department, IHE Delft Institute for Water Education, Delft, the Netherlands
4African Climate and Development Initiative, University of Cape Town, Cape Town, South Africa
CORRESPONDENCE TO:
Phikolomzi Matikinca
EMAIL:
phikolomzimatikinca@gmail.com
DATES:
Received: 15 Mar. 2023
Revised: 22 Apr. 2024
Accepted: 09 May 2024
Published: 31 July 2024
HOW TO CITE:
Matikinca P, Nyamakura B, Shackleton S. Climate change adaptation and disaster risk reduction in South Africa’s local municipal plans. S Afr J Sci. 2024;120(7/8), Art. #15797. https://doi.org/10.1715 9/sajs.2024/15797
ARTICLE INCLUDES:
☒ Peer review
☒ Supplementary material
DATA AVAILABILITY:
☐ Open data set
☐ All data included
☐ On request from author(s)
☐ Not available
☒ Not applicable
EDITOR: Jennifer Fitchett
KEYWORDS:
climate change adaptation, disaster risk reduction, social vulnerability reduction, resilience building, municipal plans
FUNDING:
South African National Research Foundation
Climate change adaptation and disaster risk reduction in South Africa’s local municipal plans
Climate change adaptation (CCA) and disaster risk reduction (DRR) agendas converge in their priorities to reduce social vulnerability and enhance resilience in the face of climate change. However, they are often treated separately in practice and in local government plans. In South Africa, while municipalities are legally mandated to develop Integrated Development Plans (IDPs) and Disaster Management Plans (DMPs), this is not the case for CCA. In this study, we assessed the engagement with, and linkages between, CCA and DRR in 20 local municipalities from contrasting socio-economic contexts in the Eastern Cape Province of South Africa by conducting an analysis of their IDPs, DMPs and any plans or strategies pertaining to CCA. Our results show that none of the municipalities had separate CCA strategies, with only two municipalities complying with the mandate to have DMPs. While municipalities mostly included CCA- and DRR-related activities in their IDPs, there were no explicit linkages made between the two approaches. Apparent was the prioritisation of bolstering infrastructure with little attention towards addressing social vulnerability and building resilience. Overall, little has been done to prioritise or link CCA and DRR at the local government level, especially in the context of addressing social vulnerability and building resilience. These findings suggest the need for South Africa to implement and promulgate legal instruments, policies and resources to capacitate local municipalities in mainstreaming and integrating CCA and DRR.
Significance:
• This study highlights that, while CCA and DRR converge in theoretical frameworks and international and national policies, little has been done to link the two at the local government level in South Africa.
• Overall, findings indicate that social vulnerability reduction and resilience building are still not recognised as important aspects of CCA and DRR.
• Local municipalities prioritise technical solutions and infrastructure maintenance, with little attention to development and structural causes of vulnerability.
• Support, in terms of resources, is needed to capacitate local municipalities in (1) linking CCA and DRR and (2) reducing social vulnerability and building resilience.
Introduction
In tackling the impacts of climate change, a coherent integration of climate change adaptation (CCA) and disaster risk reduction (DRR) into a combined approach is essential.1-9 CCA refers to the development of strategies that enable the anticipation of climate change effects, the implementation of practices that prevent damage from such effects, and adjustments in ways of life to deal with or take advantage of the effects of climate change.3 10 DRR and disaster management form two related, but distinct, components that contribute to better preparation for disasters.1 3 Disaster management refers to the processes established to design, implement and evaluate various strategies, policies and measures that will serve as tools for promoting practices that focus on disaster preparedness, response and recovery at different levels.10,11 It is centred on the phase when the disaster threat becomes evident.1 In contrast, DRR focuses on the development of policies, strategies and practices that aim to anticipate and minimise disaster risks, and reduce existing exposure and vulnerability, while improving resilience to prevent and adapt to the impacts of extreme events within a sustainable development context.10 11
Both CCA and DRR share similar goals oriented towards reducing exposure and underlying vulnerability to climaterelated risks, as well as increasing the resilience of assets and affected people, although often treated separately in practice and policy.1-4,7,12,13 Resilience focuses on the ability of a group or community to withstand and recover from external shocks and stressors, from the impacts of climate change, as well as from economic, social, and political neglect and upheaval.11,14 In the context of DRR and CCA, the enhancement of resilience should be based on the reduction of exposure and vulnerability and on building adaptive capacity.3 12 Examples include effective communication between government and the public, increased community cohesion, and better understanding of disaster risks.3 12 In contrast, a system or person is deemed vulnerable when there is a propensity to be affected.10 11 Vulnerability is defined as the characteristics that influence the capacity of people to prepare for, cope with, resist, and recover from the impact of extreme climate events and other impacts.11 15 It is strongly influenced by underlying structural issues such as poverty and inequality, lack of access to insurance, marginalisation and poor housing quality (termed social vulnerability).10,13
In recognition of the commonalities between CCA and DRR, there is a growing advocacy for the need to integrate these two measures in policy and practice.3 16-19 This integration can result in practical benefits such as optimising resource use, knowledge sharing, and increased access to a broader range of expertise in efforts to reduce vulnerability and build resilience.20 Moreover, because climate-related risks are complex and intractable, cutting across boundaries of separate departments, agencies, authorities and jurisdictions16,17, integrating CCA and DRR requires establishing institutional linkages, thereby providing avenues to converge policies, planning, and programmes21
In South Africa, evidence for climate extreme events is well documented.22-26 Vulnerability and exposure to these events is underpinned by different socio-economic contexts created through apartheid policies, which residentially segregated people based on race.27 In provinces such as the Eastern Cape, these policies created less-serviced and systematically neglected homelands to which black South Africans were forcefully moved, and whites-only towns and private farmlands, which were well serviced.28,29 Despite the formal end of the apartheid government, the present-day landscape of South Africa is still largely shaped by the consequences of apartheid policies.27,30,31
As a signatory to the United Nations Framework Convention on Climate Change (UNFCCC), South Africa has made efforts to develop and implement, as well as update policies, measures and programmes to address climate change and extreme events.32 Municipalities – which are entities that deal with the planning and implementation of, in the context of this study, CCA, DRR and mitigation strategies and actions suitable for a given geographical and social context22,33,34 – are under a legal mandate to develop Integrated Development Plans (IDPs) and make updated versions of these documents available in public platforms for viewing35. The IDPs are planning tools developed to identify and address development issues, and are reviewed every 5 years.36 Moreover, municipalities are legally mandated to develop Disaster Management Plans (DMPs).37,38 However, whether and how climate change responses have been included in the IDPs of rural municipalities in South Africa has been little explored. Similarly, limited work has been done on the extent and content of DMPs for such municipalities. This is also the case when it comes to the integration of CCA and DRR, particularly in terms of reducing social vulnerability and building resilience.
We assessed the engagement of 20 South African local municipalities with CCA and DRR across two different socio-economic contexts. We explored how municipalities in the former ‘white’ parts of the Eastern Cape Province and those in the former ‘homelands’ engaged with CCA and DRR, and integration thereof, and where they placed emphasis in terms of reducing social vulnerability and building resilience to climate change. We undertook a thematic analysis of publicly available IDPs
(from municipal websites) to answer the following broad questions: (1) Do municipalities have DMPs or CCA strategies, and if so, what actions are mentioned in these? (2) Do municipal IDPs contain sections on CCA and DRR? (3) What types of CCA and DRR actions are mentioned in each of the relevant sections in the IDPs, and how do these relate to social vulnerability reduction and resilience building? And lastly, (4) is there any reference to the linkages between CCA and DRR in the documents?
South Africa’s instruments for addressing climate change and extreme events
For DRR, South Africa has a legal mandate for the management of disasters as outlined in the South African constitution.39 Specifically, the constitution legally mandates South African municipalities to develop and implement DMPs.39 Other instruments include the Disaster Management Act No. 57 of 200238, the Disaster Management Amendment Act No. 16 of 2015 (DMAA)37 and, at the local level, the Municipal Systems Act No. 32 of 200035 (Supplementary figure 1A).
The country presently has no legal mandate for local governments to have separate CCA strategies or plans. However, the Climate Change Bill40, the National Climate Change Response White Paper (NCCRWP)32 and the National Climate Change Adaptation Strategy (NCCAS)41 encourage the inclusion of CCA in IDPs (Supplementary figure 1B). While many better resourced city and district municipalities have developed separate CCA strategies or plans, little attention has been given to this amongst local municipalities.23 Using the NCCAS, the Department of Environmental Affairs (DEA) states that a unified CCA strategy will encourage the synergising of CCA efforts at all government levels (national, provincial, and local), while presenting an opportunity for collaboration between different sectors.42
Study area context
The study was conducted in 2017 in the Eastern Cape Province of South Africa (Figure 1) – the fourth most highly populated province in the country with approximately 7 230 204 people according to the latest census of
Figure 1: Map of the Eastern Cape Province showing the local municipalities for which documents were analysed in this study. Black and white circles represent local municipalities in former ‘white’ South Africa and former ‘homeland’ areas, respectively. Sarah Baartman, Amathole, Chris Hani, Joe Gqabi, OR Tambo and Alfred Nzo are district municipalities, and Nelson Mandela Bay and Buffalo City are metropolitan municipalities. (Map adapted from Htonl45 under a CC-BY-SA licence.)
2022.43 The Province is characterised by high vulnerability to climate change and disasters due to high poverty and unemployment rates. For example, only 62.5% of the population between the ages of 15 and 64 is economically active.43 There is a major dependence on agriculture and natural resources for livelihoods and economic activity.28 44
The Province is expected to experience high temperature increases in the northwestern part and lower increases along the coastal areas.46 These increases in temperatures will result in higher evaporation rates which will increase the frequency and intensity of droughts.46-48 In the eastern parts, precipitation levels are expected to be higher, resulting in increased frequency and intensity of floods and storms.47 Overall, the Province faces major threats in existing commercial and subsistence farming areas, social services and food security.46
The Province has 39 municipalities (2 metropolitan, 6 district and 31 local municipalities).49 The metropolitan municipalities are self-standing and operate under exclusive authority as they are usually more equipped with resources to perform their duties.36 Conversely, district and local municipalities share power and functions, and hence, operate on a broad scale.36 Importantly, local municipalities are meant to be in direct communication with local communities22,33,34 and, therefore, need to address the issues of vulnerability and resilience directly.
For this study, to understand if climate response actions reflected the socio-economic context of the different municipalities, we divided the Province into two main parts.29 The first, eastern, part consists primarily of the former homelands to which black South Africans were forcefully moved during apartheid.28 These areas, characterised by communal tenure systems, were systematically neglected and underdeveloped with respect to housing, electricity, sanitation, social services (such as education and health), recreational spaces and economic opportunities.50 While the homelands were re-incorporated into South Africa in 1994, the legacies of past neglect are still visible in the Eastern Cape today.27 30 31 The second, western, part of the Province falls within the former white areas and consists mainly of well-serviced towns and private farmland.29 Given these disparities, municipalities in the former homelands are battling to deliver services and development, which increases the vulnerability of residents to climate extreme events compared to those in former white South African towns.29
Approach and methods
Our method followed a four-step procedure outlined in Figure 2 . First, we randomly selected 20 out of the 31 local municipalities: 10 in the previous homelands and 10 in the former white part of the Province.
Second, we visited each municipality’s website and downloaded their most recent documents, particularly IDPs and any other plans relating to disasters and CCA. The number of municipalities that had either one, both or neither of the two document types was recorded. Third, the documents were read page by page for information relating to CCA, DRR, social vulnerability reduction and resilience building. Finally, a thematic analysis of the actions in municipal documents was carried out based on prior developed themes from the literature ( Supplementary table 1 ).
Results
Do municipalities have DMPs and CCA strategies or plans?
While all municipalities included in this study had IDPs, none had a separate CCA strategy. Only two municipalities had developed a DMP; one from a former homeland area (King Sabata Dalindyebo Local Municipality), and the other from former white South Africa (Kouga Local Municipality).
Most of the 10 DRR-related actions mentioned across the two DMPs were related to bolstering infrastructure against damage (Figure 3). These included enforcing building codes to ensure buildings can withstand severe weather conditions; maintenance of electrical and civil engineering services such as sewage networks; maintenance and improvement of roads and bridges; and making provisions for uninterrupted electricity supply. Other actions mentioned were capacity building, disaster relief funds, educational programmes, and awareness raising campaigns, as well as providing financial support for smallholder farmers. Such actions, we argue, can equip communities to be better prepared for and to recover from disasters and thus help address social vulnerability. The latter actions were mostly mentioned in the DMP from a municipality in a former homeland area.
Mainstreaming of CCA and DRR in municipal IDPs
Are CCA and DRR mentioned in municipal IDPs and how often?
Overall, 13 municipalities mentioned actions related to either both CCA and DRR, CCA only or DRR only in their IDPs (Figure 4). Of these municipalities, more mentioned DRR- (7) than CCA-related (3) actions and only 3 mentioned both CCA and DRR actions. The remaining seven municipalities, including the two that had DMPs, did not mention any CCA- or DRR-related actions in their IDPs. The mention of climate change was mostly about effects thereof, with no discussion of the
Figure 2: Data collection and analysis procedure with explanatory notes for each step.
Figure 3: Types of disaster risk reduction (DRR) actions mentioned in municipal Disaster Management Plans (DMPs).
Figure 4: Mention of climate change adaptation (CCA) and disaster risk reduction (DRR) actions in municipal Integrated Development Plans (IDPs).
interventions and actions needed to adapt to the risks identified. For three municipalities, two in the former homelands and the other in former white South Africa, reference was made to plans for developing a climate change strategy:
The municipality will develop a climate change strategy on the completion of the District Climate Change Strategy. (Intsika Yethu Local Municipality)51(p.109)
…the municipality will have to develop a climate change strategy which is currently not there. (Ndlambe Local Municipality)52(p.45)
The Mbizana Local Municipality is currently developing a Climate Change Strategy which will be included in the IDP. (Mbizana Local Municipality)53(p.84)
One municipality in a former homeland (Engcobo Local Municipality) asserted that they use their district municipality’s environmental plan and the provincial climate change strategy for climate change related issues.54
What types of CCA actions are mentioned in the IDPs?
Similar to the DMPs, most of the five CCA-related actions mentioned in the IDPs were technical and mainly related to making infrastructure more resilient (Figure 5). These actions included the insulation of houses against rising temperatures, installation of rainwater tanks, and maintenance of roads and bridges. The two former actions also provide health benefits, through reducing the impacts of heat waves and water contamination during flood events. Therefore, these actions can contribute to the resilience of communities. In terms of social vulnerability, actions that build adaptive capacity such as economic development, collaboration and participation, and capacity building were mentioned only by municipalities in former homelands. For example, one municipality mentioned economic development and promotion of drought-resistant crops as a plan for CCA:
…proactive role in local economic development thus means that drought resistant crops may need to be investigated in mitigation of the potential effects of climate change. (Intsika Yethu Local Municipality).51(p.109)
Although vulnerability assessments have the potential to identify the most vulnerable communities and should be the basis of any adaptation strategy, only one municipality in the former white South Africa part of the province (Dr Beyers Naudé Local Municipality) mentioned a need for these, but with no elaboration on the type of vulnerability that would be assessed.
What types of DRR actions are mentioned in the IDPs?
Amongst the various DRR-related actions mentioned in IDPs, awareness raising campaigns were the most mentioned at six times, particularly by municipalities in the former homeland areas (Figure 6). Actions towards reducing social vulnerability such as capacity building, collaboration and participation, and community engagement were mentioned only by municipalities serving former white South Africa. In comparison to the DRR actions in DMPs, IDPs did not make mention of actions relating to infrastructure. However, two municipalities in the former homelands (Senqu Local Municipality and Engcobo Local Municipality) mentioned the need to avoid settlement of communities in low-lying and flood-prone areas. This, along with actions such as early warning systems, can help bolster the resilience of communities. The reference to emergency services was mainly about being prepared for disasters when they occur.
Are there linkages between CCA and DRR actions?
Of the IDPs and two DMPs reviewed, none of the municipalities made explicit links between CCA and DRR in terms of their dual goals of reducing social vulnerability and building resilience to extreme events. However, of the three that had both CCA and DRR actions in their IDPs, one municipality in the former homeland area of the province highlighted the importance of awareness raising campaigns for tackling both CCA and DRR.
Figure 5: Types of climate change adaptation (CCA) actions in municipal Integrated Development Plans (IDPs).
…number of disaster awareness campaign [sic] conducted. The municipality does conduct disaster awareness campaigns yearly. (Engcobo Local Municipality).54(p.137)
…include developing educational posters to raise awareness about climate change both with staff and scholars throughout the area. Awareness campaigns will assist both with mitigation and adaptation to a phenomenon which will affect us and generations to come. (Engcobo Local Municipality).54(p.34)
Discussion
In the face of climate change and resulting extreme events, there is a recognition of the importance of integrating CCA and DRR in government planning to address social vulnerability and build resilience to climate risks.3 6 7 We sought to explore whether and how this integration is mainstreamed in local municipal plans in the Eastern Cape Province of South Africa. Overall, our findings indicate that, regardless of the different socio-economic contexts, little has been done to integrate CCA and DRR in local government planning in the province, particularly in addressing social vulnerability and building resilience.
We found that only 2 of the 20 local municipalities included in this study had developed and published their DMPs. This is despite the fact that municipalities servicing former white South Africa areas may be better capacitated with resources to develop and implement DMPs, while those from the previously disadvantaged homeland areas are still catching up in terms of resources and capacity. Nevertheless, the lack of DMPs in both socio-economic contexts is a cause for concern, particularly because the DMAA37 legally binds South African municipalities to develop and coordinate DMPs while implementing the disaster management function. Therefore, these results suggest a broad lack of compliance with the legal
mandate for addressing climate-induced extreme events and reducing disaster risk in South Africa. The fact that the Disaster Management Act was amended only in 2015 to include local municipal DMPs could arguably explain the cause for non-compliance with this legal mandate.
Regardless of the different socio-economic contexts, our results show that no municipality has developed and published their own CCA strategy or plan. This was not unexpected because South Africa has no legal requirement for these to be developed at the local municipal level. However, it does suggest that, regardless of the absence of a legal mandate, rural local municipalities may not have the motivation, resources and/or capacity to develop specific CCA strategies or plans, unlike at the metropolitan level.23 Moreover, South Africa does not have a national audit to check and monitor CCA strategies. A study conducted in Zambia attributed the lack of CCA strategies at the local level to the lack of a clear CCA mandate.1 Therefore, considering their results and the findings of the current study, it could be argued that the absence of a clear legal mandate for local governments to develop CCA strategies may, to a certain extent, be the reason for the lack of such strategies at the local municipal level. The South African government regards climate change as one of the principal threats to sustainable development and recognises that, if unmitigated, it could potentially delay the country’s achievement of the Sustainable Development Goals.32 40 However, the national government does not finance the development of local-level CCA strategies.33 These strategies, therefore, are a luxury for municipalities that can afford to develop and implement them, sometimes with external development aid, which is usually the case for metropolitan municipalities.23
Despite the lack of CCA strategies and DMPs, most municipalities made an effort to include CCA- and DRR-related actions in their IDPs. Specifically, all but seven municipalities mentioned actions related to either both CCA and DRR, CCA only or DRR only in their IDPs. The most mentioned actions were those related to DRR and were about increasing
Figure 6: Types of disaster risk reduction (DRR) actions in municipal Integrated Development Plans (IDPs).
the resilience of infrastructure. However, it is concerning that more than a third of the municipalities did not have any plans or actions to address climate change, especially considering the increasing frequency of extreme events in South Africa. The lack of proactive DRR actions in some IDPs may be attributed to the recent shift away from disaster risk management towards DRR when dealing with disasters.55 56 The poor engagement with climate risks is reflected in a similar study in the Limpopo Province of South Africa, which also found limited discussion of adaptation mechanisms in local municipal IDPs.22 Overall, considering our results and those from the study in the Limpopo Province, it is evident that more work is needed at the local municipal level to mainstream CCA and DRR in the IDPs.
In terms of the types of actions for CCA and DRR, most municipalities prioritised securing infrastructural facilities and buildings while paying little attention to addressing underlying social vulnerability. However, there are some municipalities that have highlighted that they are making efforts to include capacity building, economic development, insurance, and financial incentives for farmers in the areas they serve –actions which help to address social vulnerability. These actions are essential because the repercussions of the apartheid government left former homelands under-capacitated, including smallholder farmers. Furthermore, we found more CCA actions addressing social vulnerability in the former homeland areas of the Province, while in former white South Africa, these were mainly linked to DRR actions, reflecting the context somewhat. For example, economic development, capacity building, collaboration and participation, and awareness raising campaigns were only mentioned by municipalities in former homelands in relation to CCA. On the other hand, municipalities from the former white South Africa areas mentioned capacity building, collaboration and participation, and community engagement only in relation to DRR. Overall, most of the CCA- and DRR-related actions found in the IDPs and DMPs have been found in other studies. In Zambia, it was found that capacity building and awareness raising in communities were mentioned as important actions for engaging with CCA.1
Finally, we found no evidence of CCA and DRR integration in the reviewed IDPs. This suggests that the necessity for linking these two approaches may not have been fully realised by various municipal departments. Consequently, these approaches are still treated separately by local municipalities, despite the call for integration due to their synergies in terms of addressing social vulnerability and building resilience to climate risk. Moreover, the DRR function may be split between, or planned and implemented by, different departments working separately within a municipality. These findings reflect those found in Nicaraguan policies and regulations where the integration of CCA and DRR was almost nonexistent due to the lack of official instruments and policy.2 Overall, it is clear that South Africa needs to promulgate legal instruments and policies to capacitate local municipalities in mainstreaming and integrating CCA and DRR in order to reduce social vulnerability and build resilience in the face of climate change and resulting extreme events.
While this study provides novel insights into the ways in which local rural municipalities in two different socio-economic contexts in the Eastern Cape Province deal with CCA and DRR, it is not without limitations. First, not all local municipalities from the Eastern Cape Province were included in the study due to a lack of relevant documents on their websites. Second, some of the municipal websites were outdated, which limited the information we could access. Third, because municipalities are legally mandated to review and update their IDPs every 5 years, there were some variations in the years of the IDPs available. Finally, we acknowledge that, in analysing documents obtained from municipal websites, such documents may not provide a complete reflection of municipal actions on the ground in terms of CCA and DRR, particularly when the documents are only reviewed and updated every 5 years.
Conclusions
Using a social vulnerability reduction and resilience building lens, this study has provided an analysis of how 20 local municipalities from two contrasting socio-economic contexts in the Eastern Cape Province of South Africa engage with CCA and DRR in their plans and strategies.
Our results demonstrate that, regardless of the differences in socioeconomic contexts, the mainstreaming of CCA and DRR integration in Eastern Cape local municipalities leaves a lot of space for improvement. Specifically, there is a need for the South African government to support and motivate local municipalities to develop their CCA strategies and DMPs, and improve the integration of CCA and DRR in their IDPs. An important focus of such plans and strategies should be actions that address the underlying developmental and structural causes of social vulnerability, especially in the former homelands, and how resilience could be enhanced in the face of climate risk. Importantly, the effective CCA and DRR integration requires an integrated and collaborative effort between all stakeholders, and government levels, and their agencies.5 As such, for local municipal plans and strategies to be effective in integrating CCA and DRR, support in terms of resources and guidelines from the higher tiers of government and relevant stakeholders will be paramount.
Acknowledgements
We acknowledge the local municipalities whose documents were analysed in this study. The two anonymous reviewers are thanked for their insightful comments that served to strengthen this work.
Funding
The bursary for this work was provided by the South African Research Chairs Initiative of the South African Department of Science and Innovation and the National Research Foundation (NRF) of South Africa. Any opinion, finding, conclusion or recommendation expressed in this material is that of the authors and the NRF does not accept any liability in this regard.
Data
availability
Not applicable.
Declaration of AI use
No AI tools were used in this study.
Authors’ contributions
P.M.: Data collection, data analysis. B.N.: Data collection, data analysis. S.S.: Conceptualisation. All authors contributed to the written manuscript and read and approved the final manuscript.
Competing interests
We have no competing interests to declare.
References
1. Pilli-Sihvola K, Väätäinen-Chimpuku S. Defining climate change adaptation and disaster risk reduction policy integration: Evidence and recommendations from Zambia. Int J Disaster Risk Reduct. 2016;19:461–473. https://doi.org/ 10.1016/j.ijdrr.2016.07.010
2. Rivera C, Wamsler C. Integrating climate change adaptation, disaster risk reduction and urban planning: A review of Nicaraguan policies and regulations. Int J Disaster Risk Reduct. 2014;7:78–90. https://doi.org/10.1 016/j.ijdrr.2013.12.008
3. Begum RA, Sarkar MSK, Jaafar AH, Pereira JJ. Toward conceptual frameworks for linking disaster risk reduction and climate change adaptation. Int J Disaster Risk Reduct. 2014;10(PA):362–373. https://doi.org/10.1016/ j.ijdrr.2014.10.011
4. Djalante R, Thomalla F. Disaster risk reduction and climate change adaptation in Indonesia. Int J Disaster Resil Built Environ. 2012;3(2):166–180. https://d oi.org/10.1108/17595901211245260
5. Forino G, Von Meding J, Brewer G, Van Niekerk D. Climate change adaptation and disaster risk reduction integration: Strategies, policies, and plans in three Australian Local Governments. Int J Disaster Risk Reduct. 2017;24:100–108. https://doi.org/10.1016/j.ijdrr.2017.05.021
6. Thomalla F, Downing T, Spanger-Siegfried E, Han G, Rockström J. Reducing hazard vulnerability: Towards a common approach between disaster risk reduction and climate adaptation. Disasters. 2006;30(1):39–48. https://doi .org/10.1111/j.1467-9523.2006.00305.x
7. Birkmann J, von Teichman K. Integrating disaster risk reduction and climate change adaptation: Key challenges-scales, knowledge, and norms. Sustain Sci. 2010;5(2):171–184. https://doi.org/10.1007/s11625-010-0108-y
8. Seidler R, Dietrich K, Schweizer S, Bawa KS, Chopde S, Zaman F, et al. Progress on integrating climate change adaptation and disaster risk reduction for sustainable development pathways in South Asia: Evidence from six research projects. Int J Disaster Risk Reduct. 2018;31:92–101. https://doi.o rg/10.1016/j.ijdrr.2018.04.023
9. United Nations Office for Disaster Risk Reduction (UNDRR). Integrating disaster risk reduction and climate change adaptation in the UN sustainable development cooperation framework. Geneva: UNDRR; 2020.
10. Intergovernmental Panel on Climate Change (IPCC). Managing the risks of extreme events and disasters to advance climate change adaptation – SREX summary for policymakers. In: Field C, Barros V, Stocker T, Qin D, Dokken D, Ebi K, et al., editors. A special report of Working Groups I and II of the Intergovernmental Panel on Climate Change. Cambridge, UK: Cambridge University Press; 2012.
11. Pörtner HO, Roberts D, Tignor M, Poloczanska E, Mintenbeck K, Alegría A, et al., editors. Climate change 2022: Impacts, adaptation, and vulnerability. Cambridge, UK: Cambridge University Press; 2022.
12. Kelman I, Gaillard JC, Mercer J. Climate change’s role in disaster risk reduction’s future: Beyond vulnerability and resilience. Int J Disaster Risk Sci. 2015;6(1):21–27. https://doi.org/10.1007/s13753-015-0038-5
13. Busayo ET, Kalumba AM. Coastal climate change adaptation and disaster risk reduction: A review of policy, programme and practice for sustainable planning outcomes. Sustainability. 2020;16(12), Art. #6450. https://doi.or g/10.3390/su12166450
14. Adger WN. Social and ecological resilience: Are they related? Prog Hum Geogr. 2000;3(24):347–364. https://doi.org/10.1191/0309132007015404 65
15. Lee JY, Van Zandt S. Housing tenure and social vulnerability to disasters: A review of the evidence. J Plan Lit. 2019;34(2):156–170. https://doi.org/10.1 177/0885412218812080
16. Nemakonde LD, Van Niekerk D. Enabling conditions for integrating government institutions for disaster risk reduction and climate change adaptation in the SADC region and beyond. Risk Hazards Crisis Public Policy. 2023;14:6–26. https://doi.org/10.1002/rhc3.12246
17. Nemakonde LD, Van Niekerk D, Becker P, Khoza S. Perceived adverse effects of separating government institutions for disaster risk reduction and climate change adaptation within the Southern African Development Community member states. Int J Disaster Risk Sci. 2021;12:1–12. https://doi.org/10.10 07/s13753-020-00303-9
18. Becker P, Hagelsteen M, Abrahamsson M. ‘Too many mice make no lining for their nest’ – Reasons and effects of parallel governmental structures for disaster risk reduction and climate change adaptation in southern Africa. Jamba J Disaster Risk Stud. 2021;13(1), Art. #a1041. https://doi.org/10. 4102/jamba.v13i1.1041
19. Nemakonde LD, Van Niekerk D. A normative model for integrating organisations for disaster risk reduction and climate change adaptation within SADC member states. Disaster Prev Manag An Int J. 2017;26:361–376. http s://doi.org/10.1108/DPM-03-2017-0066
20. Nalau J, Handmer J, Dalesa M, Foster H, Edwards J, Kauhiona H, et al. The practice of integrating adaptation and disaster risk reduction in the south-west Pacific. Clim Dev. 2016;8:365–375. https://doi.org/10.1080/17565529.201 5.1064809
21. Mall RK, Srivastava RK, Banerjee T, Mishra OP, Bhatt D, Sonkar G. Disaster risk reduction including climate change adaptation over South Asia: Challenges and ways forward. Int J Disaster Risk Sci. 2019;10:14–27. https://doi.org/1 0.1007/s13753-018-0210-9
22. Lethoko M. Inclusion of climate change strategies in municipal integrated development plans: A case from seven municipalities in Limpopo Province, South Africa. Jamba. 2015;8(3), Art. #a245. https://doi.org/10.4102/jamb a.v8i3.245
23. Pasquini L, Ziervogel G, Cowling RM, Shearing C. What enables local governments to mainstream climate change adaptation? Lessons learned from two municipal case studies in the Western Cape, South Africa. Clim Dev. 2015;7(1):60–70. https://doi.org/10.1080/17565529.2014.886994
24. Matikinca P, Ziervogel G, Enqvist JP. Drought response impacts on household water use practices in Cape Town, South Africa. Water Policy. 2020;22(3):483–500. https://doi.org/10.2166/wp.2020.169
25. Ziervogel G. Unpacking the Cape Town drought: Lessons learned. Cape Town: African Centre for Cities; 2019. Available from: https://www.africancentrefo rcities.net/wp-content/uploads/2019/02/Ziervogel-2019-Lessons-from-Cap e-Town-Drought_A.pdf
26. Pamla A, Thondhlana G, Ruwanza S. Persistent droughts and water scarcity: Households’ perceptions and practices in Makhanda, South Africa. Land. 2021;10(6), Art. #593. https://doi.org/10.3390/land10060593
27. South African History Online. Apartheid and reactions to it [webpage on the Internet]. c2016 [cited 2017 Oct 02]. Available from: http://www.sahistory.o rg.za/article/apartheid-and-reactions-it
28. Hamann M, Tuinder V. Introducing the Eastern Cape: A quick guide to its history, diversity and future challenges. Stockholm: Stockholm University; 2012. Available from: http://www.sapecs.org/wp-content/uploads/2013/11/ Eastern-Cape-Background-Report.pdf
29. Westaway A. Rural poverty in the Eastern Cape Province: Legacy of apartheid or consequence of contemporary segregationism? Dev South Afr. 2012;29(1):115–125. https://doi.org/10.1080/0376835x.2012.645646
30. Shackleton S, Luckert M. Changing livelihoods and landscapes in the rural Eastern Cape, South Africa: Past influences and future trajectories. Land. 2015;4(4):1060–1089. https://doi.org/10.3390/land4041060
31. Kepe T, Tessaro D. Trading-off: Rural food security and land rights in South Africa. Land Use Policy. 2014;36:267–274. https://doi.org/10.1016/j.landus epol.2013.08.013
32. Government of the Republic of South Africa. National climate change response white paper. Pretoria: Government Printer; 2011. Available from: https://www.gov.za/sites/www.gov.za/files/national_climatechange_respons e_whitepaper0.pdf
33. Spires MH. Barriers to and enablers of climate change adaptation in four South African municipalities, and implications for community based adaptation [PhD thesis]. Grahamstown: Rhodes University; 2015. http://hd l.handle.net/10962/d1018913
34. Santhia D, Shackleton S, Pereira T. Mainstreaming sustainable adaptation to climate change into municipal planning: An analysis from the Eastern Cape, South Africa. Dev South Afr. 2018;35(4):589–608. https://doi.org/10.1080/ 0376835x.2018.1488583
35. Municipal Systems Act No. 32 of 2000. Pretoria: Government of the Republic of South Africa; 2000. Available from: https://www.preventionweb.net/public ation/south-africa-national-climate-change-adaptation-strategy-2019
36. Ruwanza S, Shackleton CM. Incorporation of environmental issues in South Africa’s municipal Integrated Development Plans. Int J Sustain Dev World Ecol. 2016;23(1):28–39. https://doi.org/10.1080/13504509.2015.1062161
37. Disaster Management Amendment Act No. 16 of 2015. Pretoria: Government of the Republic of South Africa; 2015. Available from: https://www.gov.za/ sites/default/files/gcis_document/201512/39520act16of2015disastermana mendact.pdf
38. Disaster Management Act No. 57 of 2002. Pretoria: Government of the Republic of South Africa; 2002. Available from: https://www.cogta.gov.za/c gta_2016/wp-content/uploads/2016/06/DISASTER-MANAGEMENT-ACT.pdf
39. The Constitution of the Republic of South Africa [document on the Internet]. c1996 [cited 2023 Jul 24]. Available from: https://www.justice.gov.za/legisla tion/constitution/saconstitution-web-eng.pdf
40. The Government of the Republic of South Africa. Climate change bill [webpage on the Internet]. c2022 [cited 2024 Mar 10]. Available from: https://www.parli ament.gov.za/bill/2300773
41. South African Department of Environmental Affairs. South Africa National Adaptation Strategy [webpage on the Internet]. c2019 [cited 2022 Apr 12]. Available from: https://www.preventionweb.net/publication/south-africa-nati onal-climate-change-adaptation-strategy-2019
42. South African Department of Environmental Affairs. South Africa National Adaptation Strategy: Draft for comments [document on the Internet]. c2015 [cited 2017 Oct 14]. Available from: https://www.environment.gov.za/sites/d efault/files/docs/nas2016.pdf
https://doi.org/10.17159/sajs.2024/15797
43. Statistics South Africa. Census 2022 [webpage on the Internet]. c2022 [cited 2024 Jan 22]. Available from: https://census.statssa.gov.za/#/province/2/2
44. Le Roux A, Van Huyssteen E. The South African socio-economic and settlement landscape. In: South African vulnerability atlas. Pretoria: Department of Science and Technology; 2013. Available from: https://www.d ffe.gov.za/sites/default/files/docs/sarva_atlas.pdf
45. Htonl. Map of the municipalities in the Eastern Cape province of South Africa, with all municipalities named and district municipalities shaded different colours [image on the Internet]. c2016 [cited 2024 Jul 25]. Available from: https://en.wikipedia.org/wiki/List_of_municipalities_in_the_Eastern_Cape#/ media/File:Map_of_the_Eastern_Cape_with_municipalities_named_and_dis tricts_shaded_(2021).svg
46. Eastern Cape Department of Economic Development and Environmental Affairs. Eastern Cape climate change response strategy [webpage on the Internet]. c2011 [cited 2017 Oct 02]. Available from: https://www.cityenergy. org.za/uploads/resource_182.pdf
47. Midgley G, Chapman R, Mukheibir P, Tadross M, Hewitson B, Wand S, et al. Impacts, vulnerability and adaptation in key South African sectors: An input into the Long Term Mitigation Scenarios Process. Cape Town: Energy Research Centre; 2007. http://hdl.handle.net/11427/16760
48. Mahlalela PT, Blamey RC, Hart NCG, Reason CJC. Drought in the Eastern Cape region of South Africa and trends in rainfall characteristics. Clim Dyn. 2020;55(9):2743–2759. https://doi.org/10.1007/s00382-020-05413-0
49. Municipal Demarcation Board. Section 21 maps and notices: EC – municipal demarcation board [webpage on the Internet]. c2017 [cited 2017 Oct 02]. Available from: http://www.demarcation.org.za/site/section-26-dems-ec-4
50. Shackleton CM, Gwedla N. The legacy effects of colonial and apartheid imprints on urban greening in South Africa: Spaces, species, and suitability. Front Ecol Evol. 2021;8, Art. #579813. https://doi.org/10.3389/fevo.2020. 579813
51. Intsika Yethu Local Municipality. Intsika Yethu local municipality integrated development plan 2015-2016 [webpage on the Internet]. c2015 [cited 2017 Oct 20]. Available from: http://www.intsikayethu.gov.za/sites/default/files/file picker/1/IYM_IDP_Draft 2015-2016.pdf
52. Ndlambe Municipality. Integrated Development Plan (IDP) 2017-2022 [webpage on the Internet]. c2017 [cited 2017 Oct 20]. Available from: https ://www.ndlambe.gov.za/index.php?option=com_docman&task=doc_view& gid=1764&tmpl=component&format=raw&Itemid=
53. Mbizana Local Municipality. Integrated Development Plan 2015–2016 review [webpage on the Internet]. c2016 [cited 2017 Oct 20]. Available from: http s://www.winniemmlm.gov.za/wp-content/uploads/2022/06/WMM-LM-FINA L-IDP-2022-27.pdf
54. Engcobo Local Municipality. Engcobo local municipality: Revised Integrated Development Plan 2013-2014 [webpage on the Internet]. c2014 [cited 2017 Oct 20]. Available from: https://slideblast.com/engcobo-local-municipality-r evised-integrated-development-plan-for-_596ccf941723ddcf122bbb80.html
55. Vermaak J, Van Niekerk D. Disaster risk reduction initiatives in South Africa. Dev South Afr. 2004;21(3):555–574. https://doi.org/10.1080/0376835042 000265487
56. United Nations Office for Disaster Risk Reduction (UNDRR). UNISDR terminology on disaster risk reduction. Geneva: UNDRR; 2009.
AUTHORS:
Chantal Tribolo1
Nicholas J. Conard2 3
Matthias Blessing3 4
Gregor D. Bader2 5
AFFILIATIONS:
1Archeosciences Bordeaux, CNRS, Bordeaux Montaigne University, Pessac, France
2Senckenberg Centre for Human Evolution and Palaeoenvironment, Tübingen, Germany
3Department of Geoscience, Early Prehistory and Quaternary Ecology, University of Tübingen, Tübingen, Germany
4Department of Anthropology, University of Connecticut, Storrs, Connecticut, USA
5Palaeo-Research Institute, University of Johannesburg, Johannesburg, South Africa
CORRESPONDENCE TO:
Chantal Tribolo
EMAIL:
ctribolo@u-bordeaux-montaigne.fr
DATES:
Received: 05 Sep. 2023
Revised: 08 Apr. 2024
Accepted: 17 Apr. 2024
Published: 31 July 2024
HOW TO CITE:
Tribolo C, Conard NJ, Blessing M, Bader GD. An updated chronology for Umbeli Belli and its implications for the Middle and Later Stone Ages.
S Afr J Sci. 2024;120(7/8), Art. #16799. https://doi.org/10.17159/sa js.2024/16799
ARTICLE INCLUDES:
☒ Peer review
☐ Supplementary material
DATA AVAILABILITY:
☐ Open data set
☐ All data included
☒ On request from author(s)
☐ Not available
☐ Not applicable
EDITORS:
Jemma Finch
Tim Forssman
KEYWORDS: luminescence dating, Middle Stone Age, Later Stone Age, lithic technology
FUNDING: French National Research Agency (ANR-21-CE27-0030-001)
An updated chronology for Umbeli Belli and its implications for the Middle and Later Stone Ages
2024. The Author(s). Published under a Creative Commons Attribution Licence.
We present a series of 12 OSL/IRSL dates that revise and complete the chronology of the important Middle (MSA) and Later Stone Age (LSA) site Umbeli Belli in KwaZulu-Natal, South Africa. These dates shift the previous radiometric ages thousands of years older than earlier measurements and play a key role in revising the cultural stratigraphy of KwaZulu-Natal. We also discuss how these dates bring the chrono- and cultural stratigraphy of southern Africa into clearer focus. The Robberg sequence of Umbeli Belli is now firmly dated to 21 ± 2 ka, whereas the preceding Early LSA assemblage dates to ~32 ka, representing one of the earliest dates for this cultural expression in the broader region. The final MSA assemblages from Layer 7 to 9 now date to between 35 ka and 40 ka, overlapping more tightly with comparable assemblages from Sibhudu, Umhlatuzana and other sites. Layer 10, which was previously also assigned to the final MSA, now dates to ~47–54 ka, placing the assemblage within the temporal range of the Late MSA. The new dates provide a good explanation for the clear differences in material culture between Layer 10 and the younger layers. We also present two new ages for the deeper horizons 11b and 12 at Umbeli Belli, dating to 76 ± 9 ka and 80 ± 9 ka, respectively.
Significance:
• Revised and new age estimates are given for the Middle and Later Stone Age sequence of Umbeli Belli.
• These age changes allow new comparisons with nearby prehistoric sites.
• They change our view of the regional variability of technologies and cultures between ca. 80 and 20 ka on the east coast of South Africa.
Introduction
The Middle (MSA) and Later Stone Age (LSA) site of Umbeli Belli is a sandstone rock shelter situated on the east coast of South Africa, approximately 7 km inland from Scottburgh in KwaZulu-Natal. Charles Cable1 (1984) initially excavated the site in 1979, with a research focus on the youngest occupation phase in Layer 1, 2BE and 2AL at the top of the sequence. Cable found a late expression of the LSA in those horizons associated with pottery and radiocarbon dates on charcoal falling between 200 ± 50 BP (Pta-2824) and 1140 ± 50 BP (Pta-2825).2 Cable excavated the deeper deposits in four square metres, revealing a homogeneous orange-brown, compact sand with typical MSA tools. The assemblages in between the MSA and the Holocene LSA, later found during the Bader and Conard excavations, were not mentioned in Cable’s 1984 publication. Due to Cable’s research focus on later periods, he did not publish those assemblages until 2016 in connection with Bader’s techno-typological study of this material. This research attributed the assemblage to the final MSA based on a regional comparison. Between 2016 and 2020, Bader and Conard, from the University of Tübingen, dug the site down to bedrock, revealing an unexpectedly long archaeological sequence encompassing a total of 15 geological horizons (GH).2,3 These were subdivided by higher or lower amounts of sandstone roof spalls as well as by differences in texture, colour, and clast size. In the absence of organic material below Cable’s Layer 2BE and 2AL, we conducted luminescence dating in the IRAMAT Laboratory (now renamed Archéosciences Bordeaux) of the University of Bordeaux Montaigne on single quartz grains and feldspar grains from nine samples (UBB1 to UBB9) for the GHs 3, 5, 7, 8, 9 and 10.2 Table 8 of Bader et al.2 presents the results of this first episode of luminescence dating. While the quartz and feldspar ages fell within one or two sigma uncertainties, we noticed that, except for one sample, the ages on feldspar were younger than the ages on quartz grains. We suspected that this may originate from an overestimate of the internal potassium (K) content of the feldspar grains.
According to those original dates, Umbeli Belli contains two Late Pleistocene LSA horizons, GH3 and GH5. GH3 was dated to 17.8 ± 1.5 ka. Blessing and colleagues4 recently published the lithic assemblage from GH3 and assigned it to the Robberg technocomplex. While our study on GH5 is still in progress, we originally assigned GH7–GH10 to the Final MSA, dating at that time to between 29 ka and 40 ka.2 In our recent study5 we showed that the final MSA of GHs 7 and 8 at Umbeli Belli, dating between 29 ka and 32 ka, have strong affinities with the final MSA assemblages at Sibhudu dating to ~38 ka. The quartz ages from GHs 9 and 10 at Umbeli Belli previously fell between 32 ka and 40 ka and overlapped with the dates for the Final MSA from Sibhudu. However, GHs 9 and 10 from Umbeli Belli differ in their tool production, tool morphology and raw material economy from the Final MSA assemblages of Sibhudu. Based on these results, we concluded that the final MSA exhibits more regional and chronological variation than expected.5
In this paper we provide an updated chronology for Umbeli Belli. Based on a correction made on the beta source calibrations6-9 for the artificial sources used to determine the equivalent doses, we show here that the quartz ages are 18% older than previously estimated, and that the consistency between the quartz and feldspar ages is improved. The hypothesis of internal K overestimation is no longer considered. This development has several important archaeological implications. Additionally, in 2019, we sampled three stratigraphic units – GH10, 11b and 12, which correspond to UBB10, 11 and 12 – in order to extend the chronology to the base of the sequence. We followed the same protocols as those employed for samples UBB1 to 9.
Research Article
https://doi.org/10.17159/sajs.2024/16799
Old and new samples
Table 1 and Figure 1 display the locations for samples UBB1 to 9, previously published 2, and for samples UBB10 to 12, taken in 2019. They were taken at night, under subdued orange light, after discarding the surface of the section previously exposed to natural sunlight. The description of the geological horizons in which samples UBB1 to 9 were taken (GH3 to 10) can be found in Bader et al. 2 and will not be repeated here. UBB10, 11 and 12 come respectively from GH10 (as UBB 6), GH11b and 12. These layers are characterised as indicated below.
GH10: Munsell 5YR, 3/4. Dark reddish brown. Silty sand with a significant increase in quartzite spalls larger than 3 cm, mostly sharp edged and irregularly oriented in the sediment. Increase in artefact density.
GH11b: Munsell 7.5YR, 3/4. Dark brown. Silty sand. Well sorted without inclusion. Large amounts of flat oriented quartzite spall. Very high artefact density.
GH12: Munsell 5YR, 3/4. Dark reddish brown. Silty sand. Not well sorted with several inclusions. Considerably less quartzite spall compared to GH11b. High artefact density.
Methods
The luminescence dating method was applied to quartz and feldspar grains extracted from the sediment samples. This method exploits the ability of these minerals to act as rechargeable batteries: when submitted to radiative energy (from natural uranium series, thorium series, potassium content in the ground and from cosmic radiations), they can store it until they are exposed to light. This exposure frees the energy in the form of light, so that the amount of light is directly related to the amount of absorbed energy. The age of the sediment deposit, i.e. the age of the last exposure of the grains to sunlight, is the ratio of the equivalent dose (total amount of energy absorbed during burial) measured in the laboratory thanks to light stimulation to the dose rate (the rate at which the energy was absorbed), related mainly to the radioisotopic content in the ground and to the burial depth.
Revision of beta source calibration
The ages for UBB1 to 9 have been revised due to an improvement in the beta source calibration. The equivalent dose of a quartz or feldspar mineral is obtained by comparing the natural luminescence of the sample to the one induced by an artificial beta (or gamma) source. Therefore,
Table 1: Location of all luminescence dating samples from the site
Figure 1: Photographs of the stratigraphic sections displaying the location of the luminescence dating sediment samples.
what is measured is actually first an equivalent time of irradiation. The equivalent dose in gray (Gy) is the following product:
Equivalent dose (Gy) = (equivalent time of irradiation for the sample, s) x (source dose rate, Gy/s).
In order to determine the source dose rate, laboratories use quartz grains whose absorbed dose is certified, and look for the corresponding equivalent time of irradiation:
Source dose rate (Gy/s) = (certified equivalent dose, Gy) / (equivalent time of irradiation for the certified quartz, s).
Therefore, any mistake on the certified equivalent dose will be directly reported on the sample equivalent dose, and on the age.
In 2019, Tribolo et al.6, using quartz irradiated with three different gamma sources (i.e. different certified calibration quartz), observed a significant 14% difference between the estimated beta source calibrations for the same beta source. Additional work performed by the calibration quartz providers showed that the dose for the Risø calibration quartz had actually been miscalculated. It was shown that: (1) the equation for calculating the dose was incomplete (neither the contribution from build-up of scattered photon in the irradiation cell, nor the contribution from build-up in air, or backscattering from the support material had been taken into account), and (2) the distance between the gamma source and the calibration sample had not been perfectly controlled, inducing variabilities from batch to batch.7,9
In our laboratory, over the years, we have used several batches of Risø calibration quartz (RCQ) together with several batches of Lexcal quartz (LCQ) in order to calibrate our readers. The mean beta source calibration for each reader was not necessarily calculated from the same sets of batches. In some cases, instead of applying the beta source calibration from RCQ or LCQ, we applied the beta source calibration calculated using the sample to be dated, bleached and gamma irradiated at the Laboratoire des Sciences du Climat et de l’Environnement (LSCE, Gifsur Yvette, France)e.g.10. However, this was not the case for Umbeli Belli: quartz and feldspar single-grain equivalent doses were measured on two different devices, calibrated with different RCQ and LCQ batches, inducing dispersions within the ages. As it is clear now that the RCQ absorbed dose was miscalculated, we have been able to correct the calibration dose rate for each reader, based on the LSCE-irradiated quartz and LCQ, and then correct the ages for the samples from Umbeli Belli.
Dating of additional samples
Quartz grains were extracted using mechanical and chemical processes: wet sieving in order to extract the 100–140-µm grain size, HCl (10%) and H2O2 (30%) for carbonate and organic material removal, followed by heavy liquid separation with heteropolytungstate of sodium at 2.72 g/cm3 and 2.62 g/cm3. Quartz grains were then HF etched (40% for 1 h, followed by HCl).
The extracted 100–140- µ m quartz grains were then mounted on single-grain discs with 100 cylindrical holes, 150 µ m diameter and 150 µ m deep. Infrared-stimulated luminescence (IRSL) tests following Duller 11 were performed in order to check the absence of any contaminant feldspar grain. Measurements for the equivalent dose (De) determination were performed on a single-grain Risø reader (the same as the one used for UBB1 to UBB9). This TL-DA 20 Risø reader is equipped with a EMI ET 9107 PM tube (erroneously called Q9235 in the previous paper 2) preceded by a 7.5 mm Hoya U340 filter for detection in the UV (280–380 nm) while excitation is performed with a green laser (532 nm). 12 13 Analyst v.4.57 14 was used for analyses.
The single-aliquot regenerative-dose protocol (SAR15) was performed (Figure 2), with the same preheat parameters as those applied to UBB1 to 9. The efficiency of the protocol (i.e. its suitability to recover at least a known laboratory-given dose) was checked with dose recovery tests (Table 2). Growth curves were fitted with saturating exponential (y = a[1 exp[[x+b] / D0]]], where y is the sensitivity corrected signal, x is the dose, and a, b and D0 are fitting parameters). The criteria for grain selection were, again, the same as the ones applied to samples UBB1 to UBB9: (1) natural test dose signal >3 sigma of the mean background signal, (2) recuperation [0 Gy dose] signal <5% of natural signal, (3) natural test dose relative uncertainty <10%, (4) natural signal under the saturation level (i.e. a De can be calculated with a finite uncertainty), and (5) application of a D0 threshold, following Thomsen et al.16 These authors have shown that the De values for grains with early saturation (i.e. low D0 values) are systematically underestimated and must be excluded before calculating the final CAM (Central Age Model17) De (or any other statistical model). The De values are then ranked by increasing D0 value, and the CAM is calculated after progressively discarding the De s below the D0 threshold. Typically, an increase in the CAM De value is observed until a plateau is reached. In our case, we also observed the percentage of grains that passed selection criteria 1–3 but were rejected
Figure 2: Single-aliquot regenerative-protocol applied to the 100–140-µm quartz grains. (a) The first 0.05 s and last 0.10 s were used for signal and background, respectively. (b) The test dose was 43 Gy for UBB10 and 11 and 73 Gy for UBB12. (c) D was 43 Gy for UBB10 and UBB11, and 73 Gy for UBB12.
because of saturation as a function of the D0 threshold. The D0 threshold (and corresponding CAM De) is chosen where the plateau is reached and the percentage of rejected grains is below 5%.
The total dose rate is the sum of the contributions from the cosmic, gamma, beta and alpha dose rates. The cosmic dose rates (Dr) were based, as for UBB1 to 9, on the equation of Prescott and Hutton18, taking into account the burial depth, geographic coordinates, and geometry of the shelter. The gamma dose rates were measured with Al203:C dosimeters, following Kreutzer et al.19 20 The beta dose rates were calculated from the radioisotopic contents of the samples, using the conversion factors and attenuation factors of Guérin et al.21 22 For the previous analysis of samples UBB 1 to 9, the radioisotopic contents had been measured with high-resolution gamma spectrometry on ca. 20 g of the sample, dried, finely crushed and sealed with wax in a plastic box. This was done separately on fractions <2 mm and 2 mm–1 cm, in order to calculate beta dose rate from the ‘fine fraction’ (<2 mm) and from the ‘total’ (actually <1 cm) fraction. It has been shown that, in theory, because of the ca. 2 mm travel range of beta particles and the resulting auto-absorption for various grain sizes, the true beta dose rate must be bracketed by these two beta dose rate estimates.23,24 However, we observed that, in the case of UBB1 to 9, there was little (negligible) variation between the two beta dose rate estimates. Therefore, for samples UBB10 to 12, the radioisotopic contents were measured on the <2 mm fraction only. The alpha dose rate was assumed to be negligible due to the HF etching. The same correction for water content was applied (mean moisture 5.0% ± 1.5%) as for the previous series of samples.
Results
Revision of ages for UBB1–9
Table 3 presents the previous and revised ages based on the revised calibration dose rates. For the quartz samples, the beta source calibration was estimated, at the time of measurement, for 300-µm-hole SG discs, as 0.126 Gy/s instead of 0.107 Gy/s. For the feldspar grains, measured on a second device, it was estimated as 0.144 Gy/s instead of 0.107 Gy/s. With the previous calibration estimates, the ratio of feldspar to quartz ages was within one or two sigma, but between 0.99 and 1.30 (with a mean of 1.13). Now the ratios are between 0.87 and 1.14 (with a mean of 0.99), showing that we still have good agreement but no longer a systematic trend.
Additional age estimates for UBB10–12
The cosmic, gamma and beta dose rates for samples UBB10, 11 and 12 are shown in Table 4. Table 5 displays the corresponding K, U and Th activities or contents. Note that the K, Th and bottom of U chain (210Pb) contents or activities for UBB10 are within 5% of those for UBB6, from the same unit (the head and middle of the chain are slightly different, within 21 and 8% of those for UBB6, although consistent at two sigma). No significant disequilibrium in the U chain is observed for the three samples. The total dose rates for samples UBB10 to UBB12 are between 2.69 ± 0.18 Gy/ka and 3.21 ± 0.21 Gy/ka for the 100–140 µm quartz grains, which is similar or slightly higher than the dose rates for samples UBB1 to UBB9.
Table 2: Results for the dose recovery tests. The samples were bleached for 1 min in a solar simulator (Holne UVACube 400, left in the dark for at least 10 000 s and bleached for 200 s in the reader (blue stimulation) at room temperature). N measured: total number of measured grains; Pass crit 1–3 or crit1–4: number of selected grains that pass criteria 1 to 3 or 1 to 4, as described in the main text; After D0: number of selected grains that pass criteria 1–5; DRT-CAM: ratio of measured to given equivalent dose after the central age model18; OD: overdispersion.
Table 3: In chrono-stratigraphic order from the top to the bottom of the sequence, previously published2 and recalculated ages for samples UBB1 to UBB9 based on revised beta source calibrations. The last rows present the additional ages for UBB10 to UBB12, based on the data presented in Tables 4–6.
Table 4: Dose rate data for the previously published data and for the new samples. Water content: mean mass of water over the mass of dry sediment; Coarse: mass of 2 mm–1 cm material over the mass of <1 cm dry sediment; Beta 1: beta dose rate calculated from the content in the <2 mm fraction; Beta 2: beta dose rate calculated from the content in the 2 mm–1 cm fraction.
Table 5: Radioisotope activities (for U and Th series) or contents (for K) of samples UBB10 to 12. All data were calculated from high-resolution gamma spectrometry measurements.
Sample
Figure 3 displays the De-D0 plots for samples UBB10–12. The overdispersion (54 ± 6% to 60 ± 5%) is as high or slightly higher than that observed for UBB1–9 (32 ± 3% to 53 ± 4%). For these samples, the average dose model (ADM, Guérin et al.25) had been applied, assuming well-bleached, undisturbed samples (note that the debate about the accuracy of the statistical models is still pending; choosing the CAM (Central Age Model)18 would give slightly lower equivalent doses and ages). For sample UBB9 in particular (OD 53 ± 4%), there is a good agreement between quartz and feldspar ages, and no chronostratigraphic reversal, suggesting that this higher OD might be due to microdosimetric effects. While this finding will be investigated further in the near future, we have assumed it is also the case for samples UBB10–12. Therefore, we have applied the same statistical model. The equivalent dose is 145.0 ± 7.8 Gy for UBB10 and is significantly higher for UBB11 and UBB12 from the lower layers (242.9 ± 20.1 Gy and 257.3 ± 21.1 Gy, respectively) (Table 6).
The quartz ages are 54 ± 5 ka for UBB10, 76 ± 9 ka for UBB11, and 80 ± 9 ka for UBB12. We note that the quartz age of UBB10 is slightly higher than the quartz and feldspar ages of UBB6, from the same horizon (47 ± 4 ka and 44 ± 4 ka, respectively), although consistent at 2 sigma. All ages are displayed in Figure 4
Discussion and conclusion
The corrected age model for Umbeli Belli leads to several changes in our understanding of the chrono-cultural sequence of the MSA and LSA in the eastern part of southern Africa.
Table 3 provides the old and new dates for the quartz and feldspar grains. These results show that GH3, formerly dated to 17.8 ± 1.5 ka, now dates to 21 ± 2 ka. The assemblage from GH3 was recently published by Blessing et al.4 and assigned to the Robberg technocomplex. Considering the new age for GH3, the Robberg assemblage from Umbeli Belli now counts among the oldest in southern Africa, together with, for example, Heuningneskrans26, Elands Bay27 and Boomplaas28 This does not affect the designation of the GH3 lithic assemblage as belonging to the Robberg technocomplex, but shows that an early onset of this technocomplex might have been more widespread than previously thought.
GH5 dates now to between 28 ± 2 ka and 32 ± 3 ka. The assemblage from this horizon was recently analysed and those results published in a separate article.3 The lithic assemblages of GH4 and GH6, which are not dated, also form part of this study. These assemblages show features of Early LSA or MSA/LSA transitional industries, the likes of which were also found at Rose Cottage Cave and Umhlatuzana.29,30 While undated, GH4 and GH6 are stratigraphically bracketed between the dated Layers 3 and 5, and 5 and 7, respectively. Blessing et al.3 observed gradual changes rather than abrupt breaks in lithic technology between those GHs. Despite this continuity reflected in lithic technology, the luminescence dates indicate a chronological gap between the GH7–5 assemblages and the Robberg assemblage of GH3, which may reflect a hiatus in the site’s occupation. However, this question must remain unresolved at the moment, due to the absence of dating results from GH4.
Figure 3: De-D0 plot for UBB10 (top), UBB11 (middle), UBB12 (bottom). Black diamonds: equivalent doses plotted against the corresponding D0 value. White squares: Central Age Model (CAM) value in function of the lowest D0 included in the selection (i.e. only the De values corresponding to the black diamonds above the D0 threshold are considered in the distribution for calculating the CAM De). Grey triangles represent the percentage of saturated grains (secondary y-axis) which pass selection criteria 1–3 after exclusion of grains below a Do threshold (x-axis).
Table 6: Data for the equivalent doses of samples UBB10 to UBB12. N measured: total number of measured grains; Pass crit 1–3 or crit 1–4: number of selected grains that pass criteria 1 to 3 or 1 to 4, as described in the main text; After D0: number of selected grains that pass criteria 1–5; De (Gy)-CAM: equivalent dose after the Central Age Model; OD: overdispersion; De (Gy)-ADM: equivalent dose after the Average Dose Model; Sigma D: overdispersion associated with ADM De, after taking into account the sigma_m dispersion due to the measurement in addition to the statistical dispersion. The ADM is calculated for an assumed sigma_m value of 15%. However, the ADM De is insensitive to sigma-m in the range 5–15%.
Figure 4: Summary of the ages for Umbeli Belli in relation to the elevation of the sample. Black dots: quartz ages; white dots: feldspar ages. The grey lines are arbitrarily drawn in order to highlight the geological horizon (GH) attribution of each sample. Variability in elevation is due to both GH thickness and slope at the site.
The assemblages of GH7–10 were formally assigned to the final MSA. In our recent comparative study between Sibhudu5 and Umbeli Belli2, we observed considerable differences in GH7 and GH8 compared to GH9 and GH10 at Umbeli Belli. We attributed these differences to natural interand intra-site variability, potentially linked to changes in raw material availability related to changes in sea level stand, insolation and river erosional processes. However, with respect to the new dating results, we must step back from those earlier conclusions. In fact, GH7 and GH8 now overlap well with the final MSA assemblages from Sibhudu31 and Umhlatuzana32-34, both in lithic artefact composition and dating. They include bifacial technology, basal thinning, a high number of shaping flakes and the presence of hollow-based points and segments (the latter two only in GH7 of Umbeli Belli) – all attributes that were recently described as characteristics of the Eastern final MSA.5 GH9 and GH10 showed the biggest differences from the Sibhudu final MSA, namely: an absence of basal thinning, hollow-based points, shaping technology, segments and a completely different signal in raw material economy (sandstone vs hornfels). The new dating results push GH9 and GH10 back several millennia, offering a decent explanation for differences observed in the archaeological signal. Layer 10, in particular, now overlaps more in time with the assemblages assigned to the Late MSA at Sibhudu.35 36 According to Villa and colleagues36, the Late MSA assemblage from Layer RSP contains mostly unifacial pointed forms and only occasional bifacial components. No hollow-based points or segments were found in those layers, but several scrapers were found. Those are features which were also found in GH10 at Umbeli Belli.
Notably, the description of several cores in Layer RSP reflects exactly the definition of the final MSA cores we published in Bader et al.2(p.18) Villa et al.36(p.405) write:
Cores with recurrent unidirectional or bidirectional flaking on a relatively flat surface with simply prepared striking platforms (n = 6). Sometimes the debitage surface and the striking platform are inverted during debitage. With one exception (Fig. 6 (1)) there are no traces of core surface shaping, prior to removal; the lateral convexities are maintained by the removal of flakes with a cortical back from the core margins
We identified such cores within GH7–10 at Umbeli Belli and within the final MSA layers Coffee to Espresso at Sibhudu. In the light of the new dating results presented above, we now have clear indication that this tradition of core reduction observed in the final MSA might have its roots several millennia earlier. The tool description of the Late MSA of Sibhudu also overlaps well with GH10 at Umbeli Belli. Thus, both our updated chronology and similarities in technology and typology, clearly indicate that GH10 needs to be assigned to an earlier phase of the MSA, and we tend to use Wadley’s term ‘Late MSA’ at this stage of research. Ultimately, the two new ages for GH11b and GH12 at the bottom of the sequence fall within an interesting time frame, overlapping with dating results for Still Bay and Howiesons Poort assemblages
in different parts of the subcontinent. No detailed observations on the lithic assemblages of those horizons have been published yet, but preliminary observations indicate a picture different from what conventionally would be expected.
The revised chronology of Umbeli Belli proves once more the importance of the site in the light of constant attempts to further structure and sharpen our understanding of spatio-temporal expressions of human material culture and behaviour, now reaching back to 80 000 years.
Acknowledgements
We are grateful to Chief Cele and the members of the Cele tribal council for allowing our team to conduct research at Umbeli Belli, which is on their land. We thank all the members of the field and laboratory crew; Dr Gavin Whitelaw and the staff of the KwaZulu-Natal Museum for generously providing storage and laboratory space and logistical support; and Amafa for providing the research permits for Umbeli Belli.
Funding
The OSL analyses were funded by the ANR project ‘The MileStone Age’ (ANR-21-CE27-0030-001).
Data availability
Data are available upon request to the corresponding author.
Declaration of AI use
AI was not used in the preparation of this paper.
Authors’ contributions
C.T.: Data collection, data analysis, writing – initial draft, funding acquisition. N.J.C: Project leadership, funding acquisition, writing – initial draft. M.B.: Writing – initial draft. G.D.B.: Project leadership, writing –initial draft. All authors read and approved the final manuscript.
Competing interests
We have no competing interests to declare.
References
1. Cable C. Economy and technology in the late Stone Age of southern Natal. Cambridge Monographs in African Archaeology. Oxford: BAR Publishing; 1984. https://doi.org/10.30861/9780860542582
2. Bader G, Tribolo C, Conard N. A return to Umbeli Belli: New insights of recent excavations and implications for the final MSA of eastern South Africa. J Archaeol Sci Rep. 2018;21:733–757. https://doi.org/10.1016/j.jasrep.20 18.08.043
3. Blessing MA, Conard, NJ, Bader, GD. Cultural developements between the Final MSA and the Robbergat Umbeli Belli, South Africa. J Paleo Arch. 2023;6–31. https://doi.org/10.1007/s41982-023-00161-z
4. Blessing MA, Conard NJ, Bader GD. Investigating the MIS2 microlithic assemblage of Umbeli Belli rockshelter and its place within the chronocultural sequence of the LSA along the East Coast of southern Africa. Afr Archaeol Rev. 2023;40:145–167. https://doi.org/10.1007/s10437-022-094 97-3
5. Bader GD, Sommer C, Conard NJ, Wadley L. The final MSA of eastern South Africa: A comparative study between Umbeli Belli and Sibhudu. AZANIA. 2022;57(2):197–238. https://doi.org/10.1080/0067270X.2022.2078553
6. Tribolo C, Kreutzer S, Mercier N. How reliable are our beta-source calibrations? Ancient TL. 2019;37:1–10.
7. Hansen V, Murray A, Buylaert JP, Yeo EY, Thomsen K. A new irradiated quartz for beta source calibration. Radiat Meas. 2015;81:123–127. https://doi.org/1 0.1016/j.radmeas.2015.02.017
8. Richter D, Woda C, Dornich K. A new quartz for γ-transfer calibration of radiation sources. Geochronometria. 2020;47(1):23–34. https://doi.org/10. 2478/geochr-2020-0020
9. Autzen M, Andersen CE, Bailey M, Murray AS. Calibration quartz: An update on dose calculations for luminescence dating. Radiat Meas. 2022;157, Art. #106828. https://doi.org/10.1016/j.radmeas.2022.106828
10. Tribolo C, Mercier N, Douville E, Joron J-L, Reyss J-L, Rufer D, et al. OSL and TL dating of the Middle Stone Age sequence of Diepkloof Rock Shelter (Western Cape, South Africa): A clarification. J Archaeol Sci. 2013;40(9):3401–3411. https://doi.org/10.1016/j.jas.2012.12.001
11. Duller GAT. Distinguishing quartz and feldspar in single grain luminescence measurements. Radiat Meas. 2003;37:161–165. https://doi.org/10.1016/S1 350-4487(02)00170-1
12. Bøtter-Jensen L, Bulur E, Duller GAT, Murray AS. Advances in luminescence instrument systems. Radiat Meas. 2000;32:523–528. https://doi.org/10.101 6/S1350-4487(00)00039-1
13. Bøtter-Jensen L, Andersen CE, Duller GAT, Murray AS. Developments in radiation, stimulation and observation facilities in luminescence measurements. Radiat Meas. 2003;37:535–541. https://doi.org/10.1016/S1350-4487(03)00020-9
14. Duller GAT. The Analyst software package for luminescence data: Overview and recent improvements. Ancient TL. 2015;33(1):35–42.
15. Murray AS, Wintle AG. Luminescence dating of quartz using an improved single-aliquot regenerative-dose protocol. Radiat Meas. 2000;32:57–73. http s://doi.org/10.1016/S1350-4487(99)00253-X
16. Thomsen K, Murray AS, Buylaert JP, Jain M, Hansen JH, Aubry T. Testing single-grain quartz OSL methods using sediment samples with independent age control from the Bordes-Fitterockshelter (Roches d’Abilly site, Central France). Quat Geochronol. 2016;31:77–96. https://doi.org/10.1016/j.quage o.2015.11.002
17. Galbraith RF, Roberts RG, Laslett GM, Yoshida H, Olley JM. Optical dating of single and multiple grains of quartz from Jinmium rock shelter, northern Australia, Part I: Experimental design and statistical models. Archaeometry. 1999;41(2):339–364. https://doi.org/10.1111/j.1475-4754.1999.tb00987.x
18. Prescott JR, Hutton JT. Cosmic ray contributions to dose rates for luminescence and ESR dating: Large depths and long-term time variations. Radiat Meas. 1994;23:497–500. https://doi.org/10.1016/1350-4487(94)90 086-8
19. Kreutzer S, Tribolo C, Martin L, Mercier N. Dose-rate estimation using α-Al2O3:C chips: Aftermath. Ancient TL. 2020;38:1–10.
20. Kreutzer S, Martin L, Tribolo C, Selva P, Mercier N. Environmental dose rate determination using a passive dosimeter: Techniques and workflow for α-Al2O3:C chips. Geochronometria. 2018;45:56–67. https://doi.org/10.15 15/geochr-2015-0086
21. Guérin G, Mercier N, Adamiec G. Dose rate conversion factors: Update. Ancient TL. 2011;29:5–8.
22. Guérin G, Mercier N, Nathan R, Adamiec G, Lefrais Y. On the use of the infinite matrix assumption and associated concepts: A critical review. Radiat Meas. 2012;47:778–785. https://doi.org/10.1016/j.radmeas.2012.04.004
23. Martin L. Caractérisation et modélisation d’objets archéologiques en vue de leur datation par des méthodes paléo-dosimétriques. Simulation des paramètres dosimétriques sous Geant4 [Characterization and modeling of archaeological objects with a view to their dating using paleo-dosimetric methods. Simulation of dosimetric parameters under Geant4] [unpublished PhD thesis].Pessac: University of Bordeaux Montaigne; 2015.
24. Tribolo C, Asrat A, Bahain J-J, Chapon C, Douville E, Fragnol C, et al. Across the gap: Geochronological and sedimentological analyses from the late Pleistocene-Holocene sequence of Goda Buticha, southeastern Ethiopia. PLoS ONE. 2017;12(1), e0169418. https://doi.org/10.1371/journal.pone.0 169418
25. Guérin G, Christophe C, Philippe A, Murray AS, Thomsen KJ, Tribolo C, et al. Absorbed dose, equivalent dose, measured dose rates, and implications for OSL age estimates: Introducing the Average Dose Model. Quat Geochronol. 2017;41:163–173. https://doi.org/10.1016/j.quageo.2017.04.002
26. Beaumont P. The Heuningneskrans Shelter. In: Voigt EA, editor. Guide to archaeological sites in the Northern and Eastern Transvaal. Pretoria: Transvaal Museum; 1981. p. 132–145.
27. Porraz G, Igreja M, Schmidt P, Parkington JE. A shape to the microlithic Robberg from Elands Bay Cave (South Africa). South Afr Humanit. 2016;29(1):203–247.
28. Pargeter J, Loftus E, Mackay A, Mitchell P, Stewart B. New ages from Boomplaas Cave, South Africa, provide increased resolution on late/terminal Pleistocene human behavioural variability. AZANIA. 2018;53(2):156–184. https://doi.org/10.1080/0067270X.2018.1436740
29. Clark AMB. The MSA/LSA transition in Southern Africa: New technological evidence from Rose Cottage Cave. S Afr Archaeol Bull. 1997;52:113–121. https://doi.org/10.2307/3889076
30. McCall GS, Thomas JT. Re-examining the South African Middle-to-Later Stone Age transition: Multivariate analysis of the Umhlatuzana and Rose Cottage Cave stone tool assemblages. AZANIA. 2009;44:311–330. https:// doi.org/10.1080/00672700903337519
31. Wadley L. A typological study of the final Middle Stone Age stone tools from Sibudu Cave, KwaZulu-Natal. S Afr Archaeol Bull. 2005;60(182):51–63.
32. Kaplan J. The Umhlatuzana rock shelter sequence: 100 000 years of Stone Age history. South Afr Humanit. 1990;2:1–94.
33. Mohapi M. The Middle Stone Age point assemblage from Umhlatuzana rock shelter: A morphometric study. South Afr Humanit. 2013;25:25–51.
34. Sifogeorgaki I, Klinkenberg V, Esteban I, Murungi M, Carr AS, van den Brink VB. New excavations at Umhlatuzana Rockshelter, KwaZulu-Natal, South Africa: A stratigraphic and taphonomic evaluation. Afr Archaeol Rev. 2020;37:551–578. https://doi.org/10.1007/s10437-020-09410-w
35. Jacobs Z, Wintle AG, Duller GAT, Roberts RG, Wadley L. New ages for the post-Howiesons Poort, late and final Middle Stone Age at Sibudu, South Africa. J Archaeol Sci. 2008;35(7):1790–1807. https://doi.org/10.1016/j.ja s.2007.11.028
36. Villa P, Delagnes A, Wadley L. A late Middle Stone Age artifact assemblage from Sibudu (KwaZulu-Natal): Comparisons with the European Middle Paleolithic. J Archaeol Sci. 2005;32(3):399–422. https://doi.org/10.1016/j. jas.2004.11.007
AuthorS: Andiswa
Mfengu1
Jaya Raju1
AFFILIAtIoN:
1Department of Knowledge and Information Stewardship, University of Cape Town, Cape Town, South Africa
CorrESPoNDENCE to: Andiswa Mfengu
EMAIL: andiswa.mfengu@uct.ac.za
DAtES:
r eceived: 06 Oct. 2022
r evised: 12 Apr. 2024
Accepted: 29 Apr. 2024
Published: 31 July 2024
hoW to CItE:
Mfengu A, Raju J. Challenges with measures used for assessing research impact in higher education institutions. S Afr J Sci. 2024;120(7/8), Art. #14934. https:// doi.org/10.17159/sajs.2024/14934
ArtICLE INCLuDES:
☒ Peer review
☐ Supplementary material
DAtA AVAILABILItY:
☐ Open data set
☐ All data included
☒ On request from author(s)
☐ Not available
☐ Not applicable
EDItorS:
Chrissie Boughey
Nkosinathi Madondo
KEYWorDS: research impact, research assessment, research evaluation, higher education, impact
FuNDING:
None
Challenges with measures used for assessing research impact in higher education institutions
Internationally, there has been a push for the prioritisation of research impact beyond its scholarly contribution. Traditionally, research impact assessments have focused on academic impact and quantitative measures, at the expense of researchers for whom research impact cannot be quantified. Bibliometric indicators and other quantitative measures are still the most widely used method for evaluating research impact because these measures are easy to use and provide a quick solution for evaluators. Conversely, metric indicators fail to capture important dimensions of high-quality research. Hence, in this study, we explored challenges with metric indicators. We adopted a case study of the University of Cape Town and used document analysis, a questionnaire survey to collect data from academics and researchers, as well as semi-structured interviews with a sample of academic and research staff. The findings highlight common challenges with quantitative measures, such as bias and discipline coverage, and the ability of measures to drive researchers’ behaviour in another direction. We propose the adoption of responsible research metrics and assessment in South African higher education institutions for more inclusive and equitable research impact assessments.
Significance:
• The study highlights the importance of understanding the challenges and influence of current measures used for assessing research impact in higher education institutions.
• There is a need for higher education leaders, policymakers and funders to advocate and support responsible metrics.
• Higher education leaders, funders and policymakers need to collaborate at the national level to initiate and support research assessment reform.
Introduction and background
Universities are increasingly called on to “maximise public benefits arising from publicly funded research”1 and thus focus has turned towards methods for assessing and incentivising public benefits of research. The state of research impact beyond scholarly contribution is shaping how research is supported financially, undertaken and eventually assessed.2 Research impact is a convoluted, multifaceted and rapidly growing field of inquiry, and, by highlighting how research funding and time are being used, impact assessment can inform strategy and decisionmaking by both funding bodies and research institutions.3 Research impact refers to the benefits that result from research. Academic or scientific impact is the intellectual contribution to one’s field of study, while societal impact is the impact of research on various levels and areas of society (social, cultural, environmental, and more). Societal impact is seen as the impact beyond academia or the intended audience.
Recent literature has shown that a “dynamic and inclusive research system is profoundly important for both science and society”2, and it can advance the fundamental knowledge and understanding necessary to address the increasingly urgent global challenges. But higher education institutions (HEIs) are under pressure due to increasing expectations from funders, the government, and the publishing industry. The expectations from the key actors in research re-enforce tensions between researchers, which results in many researchers competing for limited resources.2 Because of these individual pressures to show productivity using metrics in the ‘publish or perish’ environment, researchers in this context are more inclined to compete for various academic opportunities than collaborate. In the context of this study, the University of Cape Town (UCT)’s research impact (academic and societal impact) assessments are used for ad-hominem promotion and academic excellence awards, while researcher rating by the South African National Research Foundation (NRF) and academic appointments focus more on academic impact. This is because in the South African context, research impact assessment is still predominately focused on bibliometrics and government subsidy (for publications in journals on the Department of Higher Education and Training’s list of accredited journals and in the six Department-approved international journal lists (Directory of Open Access Journals, International Bibliography of the Social Sciences, Norwegian, SciELO SA, Scopus and Web of Science), which pushes researchers to publish more and quickly, creating perverse and unintended consequences, as noted by De Rijcke et al.2
As the national project becomes the university project, the university has to ensure its success by imposing practices, expectations and standards by which scholars are judged, which are fashioned around countable items such as peer-reviewed publications.3 These metrics are crude and are often routinely used even though they fail to capture important additional dimensions of high-quality research, such as those found in mentoring, data sharing, engaging in public discourse, nurturing the next generation of scholars, and identifying and giving opportunities to under-represented groups.2
Research impact assessment is critical in higher education as there is an increasing scarcity of resources and a greater need for productivity. Thus, researchers are under severe pressure to distinguish themselves from their peers with quantifiable evidence because research impact is tightly tied to funding, promotion, and tenure. Although assessment can be broad and extend to departments and institutions, in this paper, we focus on the assessment of individual researchers and their research.
r esearch problem
Globally, there is a growing recognition that metrics are narrow and simple in nature and thus are limited in how they capture the quality and diversity of research.2 However, in the search for accountability and research excellence, easily available research metrics from scientific citation indexes such as Web of Science, Scopus and Google Scholar have been used as they provide a quick, easy solution to evaluate research.4 Bibliometrics have traditionally provided a useful complement to the peer review process, yet these metrics are used inappropriately and without any consideration for context.5 Similarly, concerns have been raised about the validity and reliability of bibliometric measurement in assessing the benefits emanating from research.6 Metrics provide data and evidence to support decision-making, yet some aspects of academia and scholarship cannot be quantified through using simple metrics as they fail to capture the richness and plurality of research.7
Reward systems in HEIs like UCT to some extent rely on proxy measures of quality (such as citations and journal impact factors) to assess researchers in academic performance and promotion reviews and excellence awards; these proxy measures are also utilised in NRF rating applications. Therefore, research impact assessment is part of formal processes used for academic advancement at UCT and in other HEIs in South Africa. The use of proxy measures can demoralise researchers and deter them from working on other activities (such as teaching, mentorship and work that has societal impact) that are also important to the mission of most research institutions.8 While the use of metrics may vary from discipline to discipline, most disciplines utilise bibliometrics to ascertain quantity (publication count) and ‘quality’ of research outputs, especially in the natural sciences. These proxy measures fall short of recognising and rewarding the many aspects on which a healthy scholarly ecosystem depends9 and are not robust for new forms of digital scholarship processes, nor are they meaningful for specific audiences such as the general public.10 Hence, a growing number of research leaders believe that the current system of higher education incentives and rewards is misaligned with the needs of society.11 Therefore, the problem explored in this paper is the challenges with methods used in HEIs for research impact assessment, with the aim of suggesting principles that can inform holistic methods for assessing research impact.
Literature
Traditionally, the total number of publications has been used to derive the productivity of researchers and their institution; however, the total number of publications does not provide an indication of the quality and significance of a research publication, nor does it indicate the impact of the research or the researcher.12 Bibliometric indicators are increasingly applied by governments and funders, mainly because of their large-scale applicability, lower costs and time requirements, and their perceived objectivity.13 However, recent developments in the area of research impact assessment have shown that traditional methods of assessing the impacts of research are driving scholarship in an opposite direction; hence the support globally for research assessment reform and adoption of responsible metrics.
Research impact assessment
Throughout, academic research impact is traditionally measured using, among others, the number of publications and citation counts, the h-index, journal impact factor and article-level metrics. Traditional measures need to be supplemented with other metrics and non-citation metrics that represent social or academic engagement of scholarly processes by scholarly and non-scholarly audiences.10 Citations reflect the usage of a scholarly product; however, citations take time to reflect, which may affect research assessment. Thelwall and others14 claim that citations need time to accrue, and they are not the best indicators of important recent work as users may cite the work for different reasons. Haustein15 adds that the audience for scientific researchers is not confined to those who cite, as many readers are not producers of research and thus evaluating a journal based on its citations does not give the full picture. The journal impact factor, developed in the 1960s by Eugene Garfield and Irving Sher during their time at the Institute for Scientific Information, has for many years been regarded as the best tool to determine the prestige and quality of a journal.16 The
journal impact factor was originally created as a tool to assist librarians in determining which journals to purchase, and not as a measure of the scientific quality of research articles.13,17 Such metrics have evoked mixed emotions from the research community, which has resulted in various declarations such as the 2012 San Francisco Declaration on Research Assessment (DORA), the Metric Tide and the Leiden Manifesto for research metrics.18 DORA recommends that journal metrics should be avoided when trying to judge individual papers or individuals for hiring, promotion and funding decisions. Institutions and funders should judge the content of individual papers and take into account other research outputs, as well as a researcher’s influence on policy and practice.17
Bibliometrics have been criticised for the homogenisation of the sciences, a lack of true objectivity and bias.19 Concerns have been raised in the scientific community about the validity and reliability of bibliometric measurement, coupled with an increased desire from funders (public and private) to show a return on money invested in research in terms of societal impacts.20 Steele et al.6 explain that policymakers are often unaware of the problems with the use of the data – such as inherent bias with language and country, the differences in citation patterns between disciplines, lack of coverage of certain disciplines and bias in journal indexing, thus under-representing some areas of the world in their coverage. Hence, scholarly output from Africa remains under the radar, making it largely inaccessible and unavailable for comprehensive and strategic studies of research performance because ‘local’ publications are often not captured by international bibliographical databases. Similarly, Raftery and others21 also noted the disciplinary bias in indicators used, which tends to privilege ‘hard’ research over humanities and social sciences research. Nevertheless, bibliometric analysis is still the most widely used method for evaluating research impact. Therefore, Wilsdon and others7 assert that leaders in HEIs ought to develop a clear statement of principles regarding their approach to research assessment, including the role of quantitative indicators.
Research assessment reform
Since 2010, reform movements advocating for the use of ‘responsible metrics’ in research assessment and ‘responsible research assessment’ have emerged; these movements have been more focused on ensuring that bibliometrics is used appropriately rather than calling for these metrics to be abandoned.22,23 These movements came about as a result of limitations and biases with quantitative indicators. Quantitative indicators provide a good source of evidence for tracking research outputs, but alone they are not enough. So more recently, calls for reforming assessment practices have been extended to emphasise “values promoted by parallel reform agendas including movements for open science, research integrity, and diversity, equity and inclusion”22,23 These movements overall have had two primary foci: raising awareness of the challenges around bibliometrics and the development of good and responsible practices globally.
Research reform has received significant attention in research evaluation and assessment in the past 10 years, but these debates have been more on a global scale and mostly in the Global North. The recent year’s research assessment reform conversations have been gathering momentum in the Global South, especially in Latin America, Asia and more recently in South Africa. Global actors like UNESCO and the Global Young Academy, and regional actors like the Latin American Forum for Research Assessment (FOLEC), have championed research assessment reform, even though much momentum has come from Europe.23 Countries in Europe, such as the Netherlands, Norway and Finland, have national policies to endorse research assessment reform practices, and the UK has also been leading in this area with a greater focus on understanding “what a healthy, thriving research system looks like and how an assessment model can best form its foundation”23
In contrast, the responsible metrics movement has had seemingly less impact in North America22, although Canada is making reasonable progress; likewise, this movement has had less impact in Africa, including South Africa. This lack of progress is also evidenced by the number of HEIs in Africa that are DORA signatories: by 31 May 2023, not a single African research-intensive HEI had signed DORA, a 10-yearold declaration. However, there is a sizeable number of African institutes,
associations, publishers, and individuals that have signed the declaration. Cozzens24 argues that it is not unusual for countries like the USA and South Africa to have gone in this direction, that is, of not having a concerted national conversation or efforts on the role of metrics in evaluation. Unlike other countries – like those in Europe, the UK, and others – South Africa and countries in North America do not have a government-led national assessment exercise. Mitchell25 adds that, in countries like South Africa where there is no national assessment or reform, efforts tend to fail because of lack of support in terms of funding and legislation from the national government. Therefore, a change in research assessment will require a significant level of resources from universities and funders to adopt research assessment reforms, making it a challenge if the government is not working with these actors. Hatch and Curry8 note that changing how institutions, governments and funders evaluate research is difficult, but it is not impossible.
Methodology
In this paper, we report on an aspect of a study that was conducted in 2020/2021 among academics and researchers at the University of Cape Town (UCT), South Africa. We used a pragmatist paradigm and a mixed-methods approach to explore the challenges in research impact assessment. We undertook a questionnaire survey using SurveyMonkey in the first quantitative phase, followed by semistructured interviews, via Zoom and Microsoft Teams, in the second qualitative phase, which allowed for greater insight into the challenges in research impact assessment practices at UCT. In the first phase, the survey was completed by 119 UCT academics and researchers, and 30 academics and researchers were interviewed in the follow-up phase across the eight faculty structures, namely: Commerce; Engineering and the Built Environment; Health Sciences; Humanities; Law; Science; the Graduate School of Business; and the Centre for Higher Education Development. ‘Researchers at UCT' refers to individuals whose job involves a higher research component as opposed to academics who have relatively high teaching and research components in their role. Hence, researchers in this context includes postdoctoral fellows. To triangulate data collected via questionnaires and interviews, we also analysed documents related to research impact assessment: UCT faculties’ ad-hominem promotion guidelines, NRF evaluation and rating guidelines, NRF funding guidelines, and Wellcome Trust funding guidelines. The study received ethical clearance from UCT’s Humanities Faculty (Ref. no.: UCTLIS202004-02). Among the critical questions we interrogated in the study were:
1. How are metrics used in research impact assessment?
2. What are the common challenges experienced with metric indicators used in research impact assessment?
3. What underlying principles should inform the indicators used in research impact assessment?
Findings and discussion
In this section, we present and discuss findings from academics and researchers at UCT on what they perceive as common challenges with metric indicators and what they consider as underlying principles that should inform indicators used in research impact assessment to lessen the challenges experienced with metric indicators. Similarly, the challenges and underlying principles were also explored in the document analysis process.
Use of metrics in research impact assessment
We asked academics and researchers about the use of metrics and other indicators in their disciplinary spaces at UCT in order to contextualise the challenges with metrics. Academics and researchers use metrics for different career milestones; metrics are used mostly for research funding applications (29.2%) and ad-hominem promotion applications (26.2%). Other uses included NRF rating, performance review, and job and fellowship applications. Some respondents commented that they had not used metrics as they either had not yet published or had only recently published. This finding was also reflected in the reviewed documents. UCT faculties’ ad-hominem promotion, academic excellence and merit awards guidelines as well as the NRF evaluation and rating (UCT)
Table 1 presents common challenges with current metrics for assessing research impact as shared by academics and researchers. Academics and researchers agree on common metric challenges – bias and discipline coverage (73.1%); behavioural impact (72.3%); and interpretation (65.5%) – with the mean score for these challenges leaning towards ‘agree’ (3 on the Likert scale). Table 1 also shows a relatively high internal consistency for challenges encountered with current metrics for assessing research impact, as shown by Cronbach’s alpha coefficient of 0.850. When it comes to research assessment, ‘bias and discipline coverage’ is a common challenge internationally, as has been noted by others2 6. Bias and discipline coverage is a serious challenge for the Global South as the metric indicators can be biased against certain countries, particularly those from the Global South. The Global South tends to be excluded from the knowledge production ecosystem and therefore scholarship from the Global South is partly invisible and inaccessible. Moreover, language bias has also been noted in knowledge creation as the English language, and more specifically Western English, is favoured more than other languages, which leads to the call for the adoption of ‘world Englishes’ (a concept that embraces the diversity that exists worldwide about the English language) to adopt a more inclusive approach to the use of English in scholarship. Similarly, discipline bias is a key challenge in bibliometrics as these indicators tend to cover applied sciences better than social sciences and humanities, leading to social science and humanities researchers calling for equitable discipline coverage. Biases in metric indicators tend to drive researchers’ behaviour in a particular direction and make researchers focus more on ‘what counts’ rather than what is important, driving scholarship away from its intended purpose, which is to address community and societal needs, and to advance fundamental knowledge. This is mainly because the bias in these indicators, while a separate challenge, is interlinked with behavioural impact, which is why these challenges emerged as the top challenges in this study. Hatch and Curry8 highlight that the use of surrogate measures also preserves biases against scholars who still feel the force of historical and geographical exclusion from the research community.
The document analysis in relation to common challenges with databases used to retrieve metrics showed that Scopus, Web of Science and Google Scholar are the most used bibliographic databases. Scopus and Web of Science databases tend to limit researchers to what is available in the respective database, neither of which index the majority of local and regional journals. Another challenge in the use of databases that are developed in the Global North is their language and geographic biases against the Global South. Many regional publications are not indexed in these databases. Google Scholar, however, indexes more local publications, but data quality may be a challenge as there are no quality criteria for inclusion; nevertheless, it provides more breadth to complement the Scopus and Web of Science databases. Further, these databases use ‘Western standards’ (a generally accepted standard originating from the Global North which is assumed as the world standard) to measure the local and global impact of research, and the databases do not recognise local context and differences between the Global South and the rest of the world in terms of research impact.
We found misinterpretation (65.7%) of metric indicators to be a challenge, especially journal impact factor. Another study also found this to be the case despite many declarations like DORA warning against the use of the journal impact factor for assessing journals and individual researchers for research impact assessment. In a study26 involving US and Canadian universities, it was found that the journal impact factor was associated with quality (63% of institutions’ reappointment promotion tenure documents) and the impact or importance of faculty research or publications (40% of institutions’ reappointment promotion tenure documents). Consequently, researchers considered it necessary to have publications in journals with high journal impact factors to succeed and be promoted27, which speaks to the behavioural influence of bibliometrics. Moreover, in some countries, institutions are financially rewarded for publishing in journals with high journal impact factors,
table 1: Academics’ and researchers’ challenges with current metrics for assessing research impact
Challenges with current metrics for assessing research impact
language, and
Interpretation – data are open to misinterpretation and misuse, e.g. journal impact factor
Relevance – the metric does not relate directly to a critical aspect of the research produced
Prone to gaming – the metric provides scope for special interest groups or individuals to intentionally exploit the system, e.g. paying for tweets, views, etc.
Limited coverage of output from research
Validity – the metric does not reasonably reflect the underlying concept that it is intended to measure
Lack of a clear and unambiguous definition for consistency
Attribution – metric data cannot be discretely ascribed to the unit being assessed
Data availability – limited access to metric data for evaluators and researchers
Cost of data – challenge of purchasing metric data outright or obtaining a license
Methodological soundness – that is, the calculation of the metric lacks sound and robust methodology
Replicability and comparability – the metric is not easily reproduced or compared 36.1%
demonstrating an extreme but important example of how this metric may be distorting academic incentives and behaviour.26
The challenges related to metric indicators were also explored via semi-structured interviews and one academic/researcher commented: “These metrics tend to be very biased and push academics to behave like a corporation with a big divide between established researchers and ECRs [early career researchers]” A majority of the academics and researchers interviewed reacted to challenges around bibliometric indicators such as systemic bias against individuals in or from the Global South, biases against younger researchers or those who have not been involved in research for long. Academics and researchers also noted the biases which are embedded in current assessment systems which tend to privilege certain groupings. Related to this, one academic/researcher commented:
Metrics and evaluation systems privilege researchers that have no responsibility outside themselves and their institution… it privileges researchers and not people (who are also researchers) trying to change unjust systems or think about alternative systems.
In an earlier study8, for which the findings are in agreement with this notion, it was pointed out that current incentives often discourage researchers and academics from engaging in ‘other’ work such as mentorship and social responsiveness, as these kinds of work do not lend themselves towards the incentive structures. A common critique from the interviewed academics and researchers was that quantitative indicators tend to fuel the ‘publish or perish’ principle in that researchers tend to aim for quantity, which can compromise the quality of research. The International Alliance of Research Universities advocates that metrics alone are not sufficient for assessing the impact of isolated research and therefore should be used in conjunction with other indicators.15 An interviewed researcher in the study shared:
The one cardinal rule that I was told, quite unequivocally, when I came to UCT is that the
university, institution and government don’t care about what we do practically as researchers. They care only about publications.
This point supports the challenge noted by researchers on behavioural impact. Similarly, another academic/researcher:
Research assessment practice privileges dominant views, not paradigm-shifting thinking; polemic or controversial pieces e.g., Nattrass 2020 article published in South African Journal of Science will be hugely cited but is awful scholarship
Another researcher also shared their views on the issue of the interpretation of metric indicators:
Metrics may be misinterpreted as an absolute measure of value, without taking contextual factors into account. The problem with this kind of approach is that it drives undesirable behaviour from researchers, publishers and bureaucrats which should not be underestimated.
This view was also argued by Agate and others, when they observed that bibliometrics and altmetrics quantify the impact, thus resulting in a flattening and alienating effect because the assigning of scores as proxies of quality does not effectively account for nuances of context, depth of engagement and integrity of the process.5 Hence DORA developed a checklist for a balanced, broad, and responsible research assessment which suggests that evaluators need to be clear about the limitations and context of metrics used and to complement metrics with qualitative indicators, as well as be aware of unintended biases that arise from scientific and cultural stereotypes such as gender, ethnicity, seniority, affiliation and discipline.28 Higher education leaders, policymakers and funders need to review the current indicators used and how fit they are for purpose, and to what extent they help researchers and research from the Global South contribute towards addressing local challenges.
Underlying principles that need to inform indicators
We also asked the surveyed academics and researchers about the underlying principles that they regarded as important for assessing research impact. Table 2 indicates that 43% of the participants regarded ‘responsible research practices’ (24%) and ‘open science’ (19%) to be important principles for metric indicator use. The underlying principles were cross tabulated with the faculty of the academics and researchers to see if there were any differences across the eight faculty structures at UCT. Some differences were evident because of disciplinary differences: those from the Science Faculty rated ‘transparent reporting’ second to ‘responsible research practices’, while those from the Faculty of Health Sciences rated ‘open science’ most highly, and for those from the Humanities Faculty ‘diversity of types of research is valued’ was most important. In the discipline of health sciences, ‘open science’ is promoted and encouraged more than in the other disciplines at UCT. Humanities disciplines tend to have diverse research outputs such as creative works which are as valuable as articles, which explains this principle being rated highly. Similarly, transparent reporting is important for reproducibility of science and is more valued for disciplines like science compared to others. The underlying principles, specifically the top three, imply that researchers are aware of the challenges with metrics and potential solutions to these challenges, such as the adoption of responsible research practices in assessment, which can lessen the issue of misinterpretation of metric indicators and related biases. Responsible research practices advocate for an open, inclusive, and impactful research culture that recognises the plural characteristics of high-quality research.
As stated earlier, Humanities Faculty participants regarded recognition of diverse research outputs to be an important principle, while respondents in the Science Faculty rated ‘transparent reporting’ high, which speaks to the disciplinary differences and preferences of these faculties. This result came as no surprise as humanities disciplines have the most diverse outputs which include creative works which traditionally were not appropriately recognised as valuable scholarly outputs comparable to traditional outputs. This was noted in the challenges but also relates to the recognition of diverse types of outputs and recognition of all contributions to research and scholarly activity. A participant in this study acknowledged: “Metrics are crude for research assessment and very output-focused while disciplines engage in public discourse which is regarded as a significant contribution in other disciplines.” This notion was also discussed by de Rijcke and others2 who stated that metrics which are routinely used fail to capture important additional aspects of high-quality research. Similarly, open science practices like transparent reporting of methods is a well-established practice in the applied sciences.
A few academics and researchers commented on ‘other’ underlying principles that are important for assessing research impact (but not captured by the question); these included: contribution to equity and transformation; reproducibility of research through supporting and recognising replication studies; and software and data as research outputs. These principles relate to that identified earlier on open science,
as reproducibility is one of the practices in open science but also relates to recognition of all contributions to research.
One of the key underlying principles identified in the document analysis was open science and open access. Both institutions and funders in the South African context have created policies to guide and mandate open science for researchers. But there is a misalignment, as open science principles do not feature in research assessment practices, as evident in the documents reviewed, even though there are policies. A similar trend was reflected in an Australian study by Diong et al.29 who assessed funding scheme instructions against nine criteria to determine to what extent they incentivised responsible research and reporting practices (such as open data, conducting quality research, discouraging use of publication metrics, etc.). This Australian study found that the funders incentivised some of the responsible research practices, but there was no mention of others and applicants addressed only those that were required (four out of the nine) rather than what was encouraged.29 The authors argued, quite correctly, that simply encouraging or recommending responsible research practices seems unlikely to substantially change researcher behaviour.29 This observation is similar to what was observed in our study on the role of metrics and behavioural impact, and the same is true in terms of rewards and incentives. Researchers are inclined to do what is mandated, required, recognised and rewarded more than what is encouraged and advised. The underlying principles identified by this study have the potential to offer guidance towards a solution to address the challenges presented in this study.
Conclusion and recommendations
While challenges related to measures used for assessing research impact are not unfamiliar, they have not been explored in a decolonising South African higher education context. Assessing research impact is a multidimensional and complex phenomenon and solutions to this wicked problem are in progress. We have reported on the challenges with quantitative indicators used to evidence the impact of research using UCT as a case study. Bias and discipline coverage were the most prominent challenges noted by researchers and academics in this study. These are challenges that have been noted globally in the literature on research assessment, and many leaders are calling for the adoption of responsible research practices and research assessment reform as current systems of evaluation are neither equitable nor inclusive. While this is a global challenge, researchers from Africa and the broader Global South tend to be particularly affected by the biases embedded in metric indicators. Similarly, the problematic but undisputed focus on journals from the Global North and applied sciences further re-enforces these biases on researchers who already feel excluded from the knowledge production system. The use of metric indicators tends to exert pressure on researchers to change their behaviour and research agendas to conform to these norms at the expense of locally relevant scholarship. Embracing responsible research practices and open science in theory, policy and practice may move HEIs like UCT in South Africa, and other related contexts, closer to addressing some of the challenges with quantitative indicators generally and how they are applied in HEIs like UCT.
table 2: Underlying principles that academics and researchers regard as being important for assessing research impact, in relation to faculty: Centre for Higher Education Development (CHED), Commerce, Engineering and the Built Environment (EBE), Graduate School of Business (GSB), Health Sciences, Humanities, Law and Science
We recommend the adoption of responsible research practices that complement quantitative metrics with qualitative metrics. Moreover, there needs to be a concerted national conversation on research assessment reform in South Africa among higher education leaders, funders and policymakers. Key actors in research need to lead in the adoption of responsible research practices and responsible metrics. At an institutional level, there is a need for alignment of policy and practices around research assessment, especially with open science practices and institutional values.
Acknowledgements
We acknowledge the NRF Black Academics Advancement Programme (Ref.: BAAP200303507864) for PhD-track funding, of which this study is an outcome.
Funding
We received no funding to declare.
Data availability
The data supporting the results of this study are available upon request to the corresponding author.
Declaration of AI use
AI was not used in the preparation of this paper.
Authors’ contributions
A.M.: Conceptualisation, methodology, data collection, data analysis, writing – the initial draft, writing – revisions, project management. J.R.: Writing – revisions, student supervision, project management. This paper is a result of a PhD study by A.M. supervised by J.R.
Competing interests
We have no competing interests to declare.
r eferences
1. Upton S, Vallance P, Goddard J. From outcomes to process: Evidence for a new approach to research impact assessment. Res Eval. 2014;23(4):352–365. https://doi.org/10.1093/reseval/rvu021
2. De Rijcke S, Cosentino C, Crewe R, D’Ippolit C, Motala-Timol S, Rahman NBA, et al. The future of research evaluation: A synthesis of current debates and developments. IAP, GYA, ISC; 2023. Available from: https://www.intera cademies.org/sites/default/files/2023-05/2023-05-11%2BEvaluation%2B-% 2BWEB.pdf
3. Terämä E, Smallman M, Lock SJ, Johnson C, Austwick MZ. Beyond academia: Interrogating research impact in the research excellence framework. PLoS ONE. 2016;11(12), e0168533. https://doi.org/10.1371/journal.pone.0172817
4. Braun S. Supporting research impact metrics in academic libraries: A case study. Portal. 2017;17(1):111–127. https://doi.org/10.1353/pla.2017.0007
5. Agate N, Kennison R, Konkiel S, Long CP, Rhody J, Sacchi S, et al. The transformative power of values-enacted scholarship. Humanit Soc Sci. 2020;7(1):1–2. https://doi.org/10.1057/s41599-020-00647-z
6. Steele C, Butler L, Kingsley D. The publishing imperative: The pervasive influence of publication metrics. Learn Publ. 2006;19(4):277–290. https:// doi.org/10.2304/eerj.2011.10.1.64
7. Wilsdon J, Allen L, Belfiore E, Campbell P, Curry S, Hill S, et al. The metric tide: Independent review of the role of metrics in research assessment and management. Washington: HEFCE; 2016. https://doi.org/10.13140/RG.2.1.4929.1363
8. Hatch A, Curry S. Research culture: Changing how we evaluate research is difficult, but not impossible. eLife. 2020;9, e58654. https://doi.org/10.7554 /eLife.58654
9. D’Este P, Ramos-Vielba I, Woolley R, Amara N. How do researchers generate scientific and societal impacts: Toward an analytical and operational framework. Sci Public Policy. 2018;45(6):752–763. https://doi.org/10.109 3/scipol/scy023
10. Lewis R, Sarli CC, Suiter AM. Scholarly output assessment activities. SPEC Kit 346. Washington DC: Association of Research Libraries; 2015. https://do i.org/10.29242/spec.346
11. Stelmach BL, Von Wolff SD. A challenge to metrics as evidence of scholarity. Eur Educ Res J. 2011 March;10(1):64–82. https://doi.org/10.2304/eerj.2011.10.1.64
12. Agarwal A, Durairajanayagam D, Tatagari S, Esteves SC, Harlev A, Henkel R, et al. Bibliometrics: Tracking research impact by selecting the appropriate metrics. Asian J Androl. 2016;18(2):296–309. https://doi.org/10.4103/100 8-682X.171582
13. Haustein S, Larivière V. The use of bibliometrics for assessing research: Possibilities, limitations and adverse effects [document on the Internet]. 2015 [cited 2023 May 02]. Available from: https://unesco.ebsi.umontreal.ca/files/s ites/60/2015/10/HausteinLariviere_revised2.pdf
14. Thelwall M, Haustein S, Larivière V, Sugimoto CR. Do altmetrics work: Twitter and ten other social web services. PLoS ONE. 2013;8(5), e64841. https://doi.org/10.1371/journal.pone.0064841
15. Haustein S. Readership metrics. In: Cronin B, Sugimoto CR, editors. Beyond bibliometrics: Harnessing multidimensional indicators of scholarly impact. Cambridge: MIT Press; 2014. p. 327–344. https://doi.org/10.7551/mitpres s/9445.003.0022
16. Heinemann MK. On metrics. Thorac Cardiovasc Surg. 2013;61:377–378. https://doi.org/10.1055/s-0033-1351655
17. DORA. San Francisco Declaration on Research Assessment [webpage on the Internet]. c2013 [cited 2023 Jun 02]. Available from: https://sfdora.org/read/
18. Hicks D, Wouters P, Waltman L, De Rijcke S, Rafols I. Bibliometrics: The Leiden Manifesto for research metrics. Nature. 2015;520(7548):429–433. https://doi.org/10.1038/520429a
19. Beyond bibliometrics: Identifying the best: Proceedings of the 8th Forum on the Internationalization of the Sciences and Humanities; 2014 November 06–07; Berlin, Germany. Bonn: Alexander von Humboldt Foundation; 2014. Available from: https://www.humboldt-foundation.de/fileadmin/Entdecken/Or ganisation/International_Advisory_Board/2014_duzSpecial.pdf
20. McLean R, Sen K. Making a difference in the real world: A meta-analysis of the quality of use-oriented research using the Research Quality Plus approach. Res Eval. 2019;28(2):123–135. https://doi.org/10.1093/reseval/rvy026
21. Raftery J, Hanney S, Greenhalgh T, Glover M, Blatch-Jones A. Models and applications for measuring the impact of health research: Update of a systematic review for the health technology assessment programme. Health Tech Assess. 2016;20(76). https://doi.org/10.3310/hta20760
22. Rushforth A, De Rijcke S. Practicing responsible research assessment: Qualitative study of faculty hiring, promotion, and tenure assessments in the United States. Res Eval. 2024; Art. #rvae007. https://doi.org/10.1093/reseva l/rvae007
23. Curry S, De Rijcke S, Hatch A, Pillay D, Van der Weijden I, Wilsdon J. The changing role of funders in responsible research assessment: Progress, obstacles and the way ahead. RoRI Working Paper No. 3. Research on Research Institute report; 2020 https://doi.org/10.6084/m9.figshare.13227914.v2 https://doi.org/10.6084/m9.figshare.13227914
24. Cozzens SE. Death by peer review? In: Whitley R, Gläser J, editors. The changing governance of the sciences. Sociology of the Sciences Yearbook, vol 26. Dordrecht: Springer; 2007. p. 225–242. https://doi.org/10.1007/97 8-1-4020-6746-4_11
25. Mitchell N. Research assessment reform efforts poised for breakthrough. University World News. 2022 September 24 [cited 2023 Jun 1]. Available from: https://www.universityworldnews.com/post.php?story=20220924135652373
26. McKiernan EC, Schimanski LA, Muñoz Nieves C, Matthias L, Niles MT, Alperin JP. Use of the journal impact factor in academic review, promotion, and tenure evaluations. eLife. 2019;8, e47338. https://doi.org/10.7554/eLife.47338
27. Schimanski LA, Alperin JP. The evaluation of scholarship in academic promotion and tenure processes: Past, present, and future [version 1; peer review: 2 approved]. F1000Research. 2018;7, Art. #1605. https://doi.org/1 0.12688/f1000research.16493.1
28. DORA. Balanced, broad, responsible: A practical guide for research evaluators [webpage on the Internet]. c2021 [cited 2023 Jun 02]. Available from: http s://sfdora.org/resource/balanced-broad-responsible-a-practical-guide-for-re search-evaluators/
29. Diong J, Kroeger CM, Reynolds KJ, Barnett A, Bero LA. Strengthening the incentives for responsible research practices in Australian health and medical research funding. Res Integr Peer Rev. 2021;6(1), Art. #11. https://doi.org/1 0.1186/s41073-021-00113-7
AuThorS:
Ingrid Lynch1,2
Lyn E. Middleton1 3
Lorenza Fluks1
Nazeema Isaacs1
Roshin Essop1
Heidi van Rooyen1 4
AFFILIATIoNS:
1Human Sciences Research Council, Cape Town, South Africa
2Critical Studies in Sexualities and Reproduction Programme, Rhodes University, Makhanda, South Africa
3Antimicrobial Research Unit, Discipline of Pharmaceutical Sciences, School of Health Sciences, University of KwaZulu-Natal, Durban, South Africa
4SAMRC-Wits Developmental Pathways for Health Research Unit, Faculty of Health Sciences, University of the Witwatersrand, Johannesburg, South Africa
CorrESPoNDENCE To: Ingrid Lynch
EMAIL: ingridlynchresearch@gmail.com
DATES:
r eceived: 11 Dec. 2023
r evised: 17 Apr. 2024
Accepted: 27 Apr. 2024
Published: 31 July 2024
hoW To CITE:
Lynch I, Middleton LE, Fluks L, Isaacs N, Essop R, van Rooyen H.
Catalysing gender transformation in research through engaging African science granting councils. S Afr J Sci. 2024;120(7/8), Art. #17434. https://doi.org/10.17159/sajs.202 4/17434
ArTICLE INCLuDES:
☒ Peer review
☐ Supplementary material
DATA AVAILABILITY:
☐ Open data set
☐ All data included
☒ On request from author(s)
☐ Not available
☐ Not applicable
EDITor: Floretta Boonzaier
KEYWorDS: gender equality, intersectionality, women in science, public funding agencies
FuNDING: International Development Research Centre
Catalysing gender transformation in research through engaging African science granting councils
Science investments should benefit everyone; however, research still predominantly lacks gender integration, resulting in incomplete findings and inequitable outcomes. Moreover, despite some progress, gender disparities persist in the research workforce. Research funders, including science granting councils, are pivotal in driving gender transformation through shaping knowledge production and research infrastructure. We report on key findings from the Science Granting Councils Initiative (SGCI) in Sub-Saharan Africa (SSA) Gender Equality and Inclusivity (GEI) Project – a multi-year participatory intervention aimed at strengthening the capacities of councils to integrate GEI across their functions. Participating councils were located in 13 African countries, and their actions spanned four domains: building organisational GEI infrastructure; reshaping norms, practices, and power relations that perpetuate gender inequality; implementing targeted measures to address women’s unequal access to resources and research opportunities; and promoting collective ownership of efforts to advance GEI in the research and innovation ecosystem.
Significance:
• Achieving gender transformation in research and innovation hinges on addressing two intertwined challenges: structural gender inequality in higher education and research institutions, and a lack of gender integration in research content and design.
• Grant-makers influence decisions about who conducts and participates in research, the types of research approaches and topics prioritised, and the populations that benefit from research findings. Adopting a GEI lens in these decisions enhances research quality and promotes equity.
• Our findings pinpoint entry points for leveraging grant-making practices to advance gender transformation and underscore the importance of rooting such interventions in context.
Gender disparities in education and research systems
Progress toward gender equality in Africa is slow and limited in scale.1 Socio-cultural barriers, including increased household responsibilities for girls, gender-based violence in schools, a lack of support for school-age pregnancy, and child marriage, all contribute to widening gender disparities in education systems.2,3 Once in research careers, gender disparities persist, with women comprising only 30% of researchers on the continent and with gender parity notably lacking in leadership and decision-making roles.4-6 Overwhelmingly, social norms assigning disproportionate caregiving responsibilities to women remain the most common structural barrier to women’s career progression.7-9 Other factors hindering women’s advancement include workplace sexual harassment, gender-based pay disparities, and precarious job security for young women scientists often employed on contract terms.7 10 11
The gender dimension in research content and design
The lack of attention to gender considerations in research and innovation extends beyond the workforce. Research methods and content still lack adequate integration of a gender lens, leading to incomplete or inaccurate findings.12 For example, a review of 1.6 million publications on the Sustainable Development Goals (SDGs) found that, despite consensus on the cross-cutting relevance of gender to all SDGs, a gender dimension in research related to these goals is visibly absent.13 Only 21% of publications include sex and gender keywords. Of these, research on only six SDGs is gender-sensitive, with the remaining categorised as ‘gender-sparse’ or ‘gender-blind’. Knowledge production and research funding are inextricably interwoven, and the grant-making cycle offers opportunities to promote gender and equity considerations in research teams, content and design. While funding agencies’ engagement with gender is growing, these efforts remain predominantly concentrated in the Global North.14 Additionally, attention to intersecting marginalised identities beyond gender is limited.15 These gaps and the strategic role of public funding agencies in national innovation systems motivated the development of the Science Granting Councils Initiative (SGCI) Gender Equality and Inclusivity (GEI) Project.
A participatory action learning approach
The SGCI GEI Project provided action learning opportunities for science granting councils to strengthen their capacity to address women’s and other underrepresented groups’ participation in research, transform inequitable institutional cultures, and stimulate gender integration in research and innovation. The project was nested in the SGCI, an initiative focused on supporting the development of research and evidence-based policies that contribute to socio-economic development. Councils in 13 countries participated: Botswana, Burkina Faso, Côte d’Ivoire, Ghana, Kenya, Malawi, Mozambique, Namibia, Senegal, Tanzania, Uganda, Zambia, and Zimbabwe. The three-year project (2020–2023) involved participatory action learning principles and encouraged experimentation, reflection,
and peer learning. Councils formed GEI change teams and participated in virtual and in-person activities to conceptualise and implement tailored action plans. Councils could opt into one of two parallel streams based on their capacity and interest. The Gender Action Learning stream was a peer-learning methodology that co-created strategies for individual and structural change.16 The Targeted Technical Assistance stream offered strategic support to enhance GEI integration in councils’ existing initiatives. The project received ethical clearance from the Human Sciences Research Council Research Ethics Committee (REC 2/25/11/20) and followed the principles of the Declaration of Helsinki, including obtaining informed consent from participants.
GEI actions implemented by science granting councils
The GEI actions developed and implemented by councils spanned four domains:
1. Building organisational GEI infrastructure: This domain included establishing gender committees or units, remedying gender disparities in decision-making spaces such as grant review panels and executive boards, and developing gender policies. This domain was essential to lending institutional legitimacy to gender equality concerns and supporting the adequate resourcing of GEI initiatives.
2. Reshaping informal organisational norms, practices and power dynamics that perpetuate gender inequality: Actions in this realm, although demanding, were essential to the adoption, effectiveness and sustainability of formal GEI infrastructure.17 Further, by addressing bias and unequal practices within their organisations, councils were better equipped to promote similar changes through their grant-making policies and practices. This sphere included actions such as identifying gender champions to advocate for transforming organisational norms and providing GEI training to all organisational staff. GEI training included workplace protections, such as maternity and childcare programmes, gender bias and stereotyping, and inclusive decision-making processes.
3. Addressing disparities in access to research opportunities and resources through targeted measures: Actions in this domain included developing guidelines that address gender inequalities in grant-making processes, issuing funding calls that prioritise female principal investigators, and implementing capacity development and mentorship programmes for emerging researchers. Some actions addressed intersections between gender and location, such as establishing regional gender committees to tackle the marginalisation of female researchers outside urban areas.
4. Promoting collective ownership of the need to advance gender transformation in broader research and innovation ecosystems: Councils’ actions included awareness-raising, advocacy and stakeholder mobilisation in support of regional GEI initiatives and partnership building among strategic actors (the private sector; industry; higher education; government ministries, departments and agencies). Over time, these actions pave the way for meaningful and lasting change by going beyond ‘symptoms’ of gender inequality to address underlying root causes.17
r ecommendations
Insights from the SGCI GEI Project offer five recommendations for using grant-making to catalyse gender transformation in research and innovation. First, councils’ efforts to advance GEI highlight the importance of a dual approach that includes specific measures aimed at reversing historical inequalities and actions aimed at transforming the structures, norms and power relations that create and perpetuate exclusion. This approach aligns with a multiple-track gender mainstreaming strategy that combines gender-targeted interventions that increase access to resources and opportunities for specific groups with gender-integrated interventions that mainstream a gender perspective across institutional policies, programmes and practices.1
Second, the project illustrates the value of strategic partnerships in advancing GEI in resource-limited settings. Success of GEI actions depends on well-resourced organisational gender infrastructure, backed by expertise.18 Yet, many public funding agencies face resource constraints. Several councils leveraged existing partnerships or forged new ones to address internal capacity gaps and amplify the impact and sustainability of actions. Collaborators ranged from national academies of science to university gender departments and national gender ministries.
Third, while limited in scale, the project offers an example of how an intersectional focus on social stratifiers overlapping with gender can be incorporated into GEI actions. An intersectional lens illuminates mutually compounding forms of marginalisation, yielding a more complete understanding of how diverse factors, including but not limited to gender, overlap to create distinct experiences of disadvantage.19 There is, however, little practical guidance on integrating such a lens in grantmaking.20 Participating councils adopted a ‘bottom-up’ approach to identifying salient social stratifiers relevant to their functions and country settings – notably intersections between gender, rurality, age and career level. Future interventions can include developing tailored, contextually embedded intersectionality resources for grant-makers.
Fourth, the project underscores the need to establish monitoring and evaluation plans to assess the impact of GEI actions (including unintended negative consequences). Few councils implemented such plans – a global oversight in public funding agencies’ GEI efforts.14 An essential first step is ensuring that research and innovation data are disaggregated according to gender identity and other intersecting factors. Alongside quantitative measures, innovative qualitative methodologies can capture valuable insights into the complex processes that facilitate or impede gender transformation.
Finally, the gender dimension in research remained under-explored in councils’ actions. Science granting councils can leverage their influence to improve research accuracy, social relevance and rigour by developing clear guidelines for applicants and reviewers on best practices in integrating gender and equity considerations in research content and design.
Acknowledgements
Implementation partners included Gender at Work, the Council for the Development of Social Science Research in Africa (CODESRIA), and Jive Media Africa.
Funding
This project was led by the Human Sciences Research Council (HSRC) as part of the Science Granting Councils Initiative (SGCI) in sub-Saharan Africa. This work was carried out with the aid of a grant from the International Development Research Centre (IDRC), Ottawa, Canada. We acknowledge and thank Canada’s IDRC, the UK's Foreign Commonwealth Development Office (FCDO), the Norwegian Agency for Development Cooperation (Norad) and the Swedish International Development Cooperation Agency (Sida) for their support of the SGCI, which made this publication possible.
Data availability
The data supporting the results of this study are available upon request to the corresponding author.
Declaration of AI use
We did not use AI in the preparation of this paper.
Authors’ contributions
I.L.: Conceptualisation, analysis, writing – the initial draft. L.E.M.: Analysis, writing – revisions. L.F.: Analysis, writing – revisions. N.I.: Analysis, writing – revisions. R.E.: Analysis, writing – revisions. H.v.R.: Writing – revisions, project leadership. All authors read and approved the final manuscript.
Competing interests
We have no competing interests to declare.
r eferences
1. UN Women. Gender mainstreaming: A global strategy for achieving gender equality and the empowerment of women and girls. New York: UN Women; 2020.
2. Human Rights Watch. A brighter future: Empowering pregnant girls and adolescent mothers to stay in school. Education access across the African Union: A Human Rights Watch Index [webpage on the Internet]. c2022 [cited 2023 Dec 11]. Available from: https://www.hrw.org/video-photos/interactive/ 2022/08/29/brighter-future-empowering-pregnant-girls-and-adolescent
3. Muhanguzi FK. Women and girls’ education in Africa. In: Yacob-Haliso O, Falola T, editors. The Palgrave handbook of African women’s studies. Cham: Springer International Publishing; 2019. p. 1–18. https://doi.org/10.1007/97 8-3-319-77030-7_34-1
4. GenderInSITE, IAP, ISC. Gender equality in science: Inclusion and participation of women in global science organizations [document on the Internet]. c2021 [cited 2023 Dec 11]. Available from: https://www.interacademies.org/sites/d efault/files/2021-10/Gender%20Equality%20in%20Science.pdf
5. Huyer S. Is the gender gap narrowing in science and technology? In: UNESCO Science Report. Paris: UNESCO; 2019. p. 85–103.
6. UNESCO. UNESCO science report: The race against time for smarter development. Paris: UNESCO; 2021.
7. Beaudry C, Prozesky H, St-Pierre C, Mirnezami SR. Factors that affect scientific publication in Africa: A gender perspective. Front Res Metr Anal. 2023;8, Art. #1040823. https://doi.org/10.3389/frma.2023.1040823
8. Fisher M, Nyabaro V, Mendum R, Osiru M. Making it to the PhD: Gender and student performance in sub-Saharan Africa. PLoS ONE. 2020;15(12), e0241915. https://doi.org/10.1371/journal.pone.0241915
9. Walters C, Bam A, Tumubweinee P. The precarity of women’s academic work and careers during the COVID-19 pandemic. S Afr J Sci. 2022;118(5/6), Art. #13176. https://doi.org/10.17159/sajs.2022/13176
10. Mukhwana AM, Matanda D, Omumbo J, Mabuka J. Factors which contribute to or inhibit women in science, technology, engineering, and mathematics in Africa. Nairobi: The African Academy of Sciences; 2020.
11. Prozesky H, Mouton J. A gender perspective on career challenges experienced by African scientists. S Afr J Sci. 2019;115(3–4), Art. #5515. https://dx.doi .org/10.17159/sajs.2019/5515
12. Pollitzer E. Why gender is relevant to materials science and engineering. MRS Commun. 2021;11(5):656–661. https://doi.org/10.1557/s43579-02 1-00093-1
13. Herbert R, Falk-Krzesinski HJ, James K, Plume A. Sustainability through a gender lens: The extent to which research on UN Sustainable Development Goals includes sex and gender consideration. PLoS ONE. 2022;17(10), e0275657. https://dx.plos.org/10.1371/journal.pone.0275657
14. Hunt L, Nielsen MW, Schiebinger L. A framework for sex, gender, and diversity analysis in research. Science. 2022;377(6614):1492–1495. https://doi.org/ 10.1126/science.abp9775
15. Global Research Council. Gender-disaggregated data at the participating organisations of the Global Research Council: Results of a global survey. Global Research Council; 2021.
16. Gender at Work. Gender action learning [webpage on the Internet]. c2018 [cited 2023 Dec 11]. Available from: https://genderatwork.org/gender-action-learning/
17. Roa A, Kelleher D. Institutions, organisations and gender equality in an era of globalisation. Gend Dev. 2003;11(1):142–149. https://doi.org/10.1080/7 41954264
18. Van Eerdewijk A. Gender mainstreaming: Views of a post-Beijing feminist. In: The Palgrave handbook of gender and development. London: Palgrave Macmillan; 2016. p. 117–131. https://doi.org/10.1007/978-1-137-38273-3_9
19. Crenshaw K. Mapping the margins: Intersectionality, identity politics, and violence against women of color. Stanford Law Rev. 1991;43:1241–1299. https://doi.org/10.2307/1229039
20. Hankivsky O, Springer KW, Hunting G. Beyond sex and gender difference in funding and reporting of health research. Res Integr Peer Rev. 2018;3(1), Art. #6. https://doi.org/10.1186/s41073-018-0050-6
AuthorS:
Walter Neves1
Leticia Valota1
Clovis Monteiro1
AFFILIAtIoN:
1Institute of Advanced Studies, University of São Paulo, São Paulo, Brazil
CorrESPoNDENCE to: Walter Neves
EMAIL: waneves@ib.usp.br
DAtES:
r eceived: 22 June 2023
r evised: 13 May 2024
Accepted: 31 May 2024
Published: 31 July 2024
hoW to CItE:
Neves W, Valota L, Monteiro C. Dental metrics of Sahelanthropus tchadensis: A comparative analysis with apes and Plio-Pleistocene hominins. S Afr J Sci. 2024;120(7/8), Art. #16362. https://doi.org/10.1715 9/sajs.2024/16362
ArtICLE INCLuDES:
☒ Peer review
☒ Supplementary material
DAtA AVAILABILItY:
☐ Open data set
☒ All data included
☐ On request from author(s)
☐ Not available
☐ Not applicable
EDItorS:
Jemma Finch
Tim Forssman
KEYWorDS:
Chad, early hominins, Miocene, multivariate analysis, teeth
FuNDING:
São Paulo Research Foundation (FAPESP) (2023/06224-0,2023/15632-4)
Dental metrics of Sahelanthropus tchadensis: A comparative analysis with apes and PlioPleistocene hominins
Since discovery and description of the species, Sahelanthropus tchadensis has been at the centre of a great discussion around its classification as a hominin – the first of our lineage – or an ape. Many studies have been conducted in order to clarify this question, especially studies based on the morphology of the cranium and the post-cranial remains. In this study, we analysed the posterior dentition of S. tchadensis in relation to those of other hominins and chimpanzees, using a multivariate comparative metric analysis. Our results suggest that the posterior dentition of the Chad material lies in the range of well-established early Plio-Pleistocene hominins, supporting its classification as part of the hominin lineage.
Significance:
• The subject investigated in this study is important to the understanding of the first steps of human evolution.
• Much has been discussed about this Chadian species. Some believe it is the first hominin, others believe it is an ape.
• This study shows that the posterior dentition of S. tchadensis does not preclude it from being a hominin.
Introduction
Research carried out by the Mission Paleoanthropologique Franco-Tchadienne in the Toros Menalla region in Chad, has contributed significantly to the understanding of the evolution of hominins.1 The main discoveries have occurred in stratigraphic levels dated to the Upper Miocene (7–6 Ma). This chronology was initially based on biostratigraphic correlations with well-dated sites of East Africa2, and was recently confirmed using the cosmogenic nuclide method3 and the authigenic beryllium method4
The most important contribution of Brunet and associates2 was the finding of hominin fossils ascribed to a new species, Sahelanthropus tchadensis, considered by them to be the first representative of our evolutionary lineage. The fossils, including an almost complete cranium (TM 266-01-060), were discovered in 2001 and nicknamed Toumaï. A mandible and isolated teeth assigned to the same species were found in the same locality. More recently, Brunet and collaborators5 described new material found in the same area, which was also ascribed to S. tchadensis
Since the discovery and description of the cranium, its hominin status has been strongly questioned6, mainly because the specimen was significantly distorted by taphonomic processes. Among other things, this distortion impeded a clear observation of the position of the foramen magnum, whose anterior orientation is a diagnostic trait for the hominin clade.7 However, a virtual reconstruction of the cranium8 confirmed the anterior position of the foramen magnum, and most palaeoanthropologists now accept that S. tchadensis was a biped, reinforcing the original suggestion2
Other traits also support the idea that S. tchadensis was a hominin, such as a face with an anteroposteriorly short premaxilla, a short basioccipital, a sub-horizontal nuchal plane, a downward lipping of the nuchal crest, a short canine crown, a non-honing C/P3 complex, and, consequently, an absence of a diastema.5 However, the derived characters observed in this species are associated with apes, like the size and number of the teeth roots5, and a small neurocranium, thus it shows a unique combination of traits.
As to the post-cranial skeleton, little was known until recently. Machiarelli and associates9 analysed a partial femur (TM 266-01-063), recovered in 2001 at the same location and stratigraphic level as the holotype of S. tchadensis, and concluded that it belongs to an individual that was not habitually bipedal, questioning its hominin status. However, Daver and co-authors10 challenged this interpretation. They analysed the same femur, as well as two ulnae associated with S. tchadensis. According to the authors, the morphology of the femur is most parsimonious with habitual bipedality, while the ulnae preserve evidence of arboreal behaviour. Their final conclusion was: “Taken together, these findings suggest that hominins were already bipeds at around 7 Ma.”10(p.94) Also, recently, SevimErol et al.11, relying on a cladistic analysis of the late Miocene hominids, proposed that S. tchadensis is a stem hominid.
As mentioned before, not much has been said about the dentition of S. tchadensis, although few complete dental pieces belonging to the species have been found so far. In this study, we undertook a comparative metric analysis of the dentition of the species with those of living apes and Plio-Pleistocene hominins. Our analysis was restricted to the upper posterior dentition because of the limited preservation in the analysed species. Our main goal was to explore the position of Sahelanthropus’ dentition in relation to apes and other hominins, considering its metric characteristics under a multivariate perspective. As far as we are aware, this is the first time that this kind of exploratory approach has been carried out toward the discussion on S. tchadensis
table 1: Species and specimens of hominins included in this study
table 2: Average hominin values for each of the dental metrics used in the analyses
MD, mesiodistal length; BL, buccolingual width
Missing values were estimated using multiple linear regressions of the average mean of each variable, following Hubbe et al.19 The final data matrix was submitted to a principal component analysis (PCA) conducted on the original data (size and shape), performed in R.20
Material and methods
The comparison of Sahelanthropus’ dentition with those of Pleistocene hominins was carried out based on the mesiodistal and buccolingual diameters of the upper posterior dentition, considering specimens with a minimum of 40% of the variables present. In the case of chimpanzees and Orrorin tugenensis, the data used in the analysis are expressed in mean values, as there are just a few dental pieces representing different individuals from the species.
The dental metrics of Sahelanthropus were compared to similar measurements of the species shown in Table 1, which also contains the source of the data. Table 2 presents the means of the dental dimensions for each species included in the study. Supplementary table 1 presents the original values for each specimen included in the study.
r esults
Table 3 presents the correlations between the first two principal components (PCs) and the original variables, used to build the plot
table 3: Correlations between the first two principal components and the original variables (size and shape)
Figure 1: Distribution of the species and specimens included in the study along the morphospace defined by PC1xPC2.
in Figure 1. Accordingly, the differentiation between species occurs primarily along the horizontal axis (PC1), which expresses mainly the size of the dentition, and concentrates 76.59% of the original variance. PC2 is residual in nature and does not allow for any interpretation.
The left side of the graph is occupied by hominins with large dentition (Paranthropus boisei, Paranthropus robustus, and Australopithecus africanus). The right side of the morphospace is occupied by Pan troglodytes, with small posterior dentition, while the centre of the graph is mainly occupied by hominins with teeth of moderate size (Homo erectus, O. tugenensis, Australopithecus afarensis, Homo habilis, and Ardipithecus ramidus).
The two specimens of S. tchadensis are integrated within the range of hominin variation, with special proximity to Ar. ramidus, in the transition between the left and the right clusters, with moderate dental size. In summary, S. tchadensis presents a moderate upper posterior dentition, confirming what was inferred originally2, based on univariate analysis. There is no remarkable association between S. tchadensis and P. troglodytes
Discussion and final remarks
As we emphasised in the introduction, the taxonomic position of S. tchadensis has been discussed since its discovery, and most of these discussions have relied on the cranial characteristics of the holotype.2 5 6 In terms of dental metrics, not much has been explored thus far.
This study contributes to the understanding of this aspect of the species. For the first time, the morphology of the posterior upper dentition of S. tchadensis as a whole was compared using multivariate analysis with an ape and early hominins. Our results indicate that the dentition of the species fits the range of dental variation of our remote ancestors, reinforcing its hominin status.
In general, it can be said that the cheek teeth of S. tchadensis are moderate to small, within the range of Ar. ramidus and Au. afarensis.2 For the same reason, the size of the dentition of S. tchadensis also aligns with those of H. habilis and H. erectus in the morphospace, species known to display small cheek teeth.
In a nutshell, the moderate to small size of the upper posterior dentition of S. tchadensis reinforces its proposed hominin status.2,5,8,10 Even though the species retain some primitive traits, the derived characteristics described in the cranium and post-cranium, cited in the introduction of this study, corroborate the initial suggestion of S. tchadensis as the first representative of our evolutionary lineage.2
Acknowledgements
We are indebted to Mark Hubbe for his help in the statistics processing and for revising our English. We are also indebted to Maria Senger and Gabriel Rocha for their support during the research.
Funding
This work was supported by the São Paulo Research Foundation (FAPESP) [grant numbers 2023/06224-0 and 2023/15632-4].
Data availability
All the data supporting the results of this study are included in the article itself.
Declaration of AI use
No AI was used in this study.
Authors’ contributions
W.N.: Conceptualisation; data analysis; validation; writing – the initial draft; writing – revisions; student supervision; project leadership; project management; funding acquisition. L.V.: Data collection; data analysis; data curation; writing – the initial draft; writing – revisions. C.M.: Data collection; writing – the initial draft. All authors read and approved the final version.
Competing interests
We have no competing interests to declare.
r eferences
1. Brunet M. Sahelanthropus tchadensis dit Toumaï: le plus ancien membre connu de notre tribu [Sahelanthropus tchadensis known as Toumaï: The oldest known member of our tribe]. Bull Acad Nat i Med. 2020;204(3):251–257. French. https://doi.org/10.1016/j.banm.2019.12.017
2. Brunet M, Guy F, Pilbeam D, Mackaye HT, Likius A, Ahounta D, et al. A new hominid from the Upper Miocene of Chad, Central Africa. Nature. 2002;418:145–151. https://doi.org/10.1038/nature00879
3. Lebatard A, Bourlès DL, Duringer P, Jolivet M, Braucher R, Carcaillet J, et al. Cosmogenic nuclide dating of Sahelanthropus tchadensis and Australopithecus bahrelghazali: Mio-Pliocene hominids from Chad. Proc Natl Acad Sci USA. 2008;105(9):3226–3231. https://doi.org/10.1073/pnas.0708015105
4. Lebatard A, Bourlès D, Braucher R, Arnold M, Duringer P, Jolivet M, et al. Application of the authigenic 10Be/9Be dating method to continental sediments: Reconstruction of the Mio-Pleistocene sedimentary sequence in the early hominid fossiliferous areas of the northern Chad Basin. Earth Planet Sci Lett. 2010;297(1–2):57–70. https://doi.org/10.1016/j.epsl.2010.06.003
5. Brunet M, Guy F, Pilbeam D, Lieberman DE, Likius A, Mackaye HT, et al. New material of the earliest hominid from the Upper Miocene of Chad. Nature. 2005;434:752–755. https://doi.org/10.1038/nature03392
6. Wolpoff M, Senut B, Pickford M, Hawks J. Sahelanthropus or “Sahelpithecus”? Nature. 2002;419:581–582. https://doi.org/10.1038/419581a
7. Russo GA, Kirk EC. Foramen magnum position in bipedal mammals. J Hum Evol. 2013;65(5):656–670. https://doi.org/10.1016/j.jhevol.2013.07.007
8. Zollikofer C, Ponce de León MS, Lieberman DE, Guy F, Pilbeam D, Likius A, et al. Virtual cranial reconstruction of Sahelanthropus tchadensis. Nature. 2005;434:755–759. https://doi.org/10.1038/nature03397
9. Machiarelli R, Bergeret-Medina A, Marchi D, Wood B. Nature and relationships of Sahelanthropus tchadensis. J Hum Evol. 2020;149, Art. #102898. https:// doi.org/10.1016/j.jhevol.2020.102898
10. Daver G, Guy F, Mackaye HT, Likius A, Boisserie JR, Moussa A, et al. Postcranial evidence of late Miocene hominin bipedalism in Chad. Nature. 2022;609:94–100. https://doi.org/10.1038/s41586-022-04901-z
11. Sevim-Erol A, Begun DR, Yavuz A, Tarhan E, Sözer CS, Mayda S, et al. A new ape from Türkiye and the radiation of late Miocene hominines. Commun Biol. 2023;6, Art. #842. https://doi.org/10.1038/s42003-023-05210-5
12. Swindler DR, Emel LM, Anemone RL. Dental variability of the Liberian chimpanzee, Pan troglodytes verus. Hum Evol. 1998;13:235–249. https:// doi.org/10.1007/BF02436508
13. Senut B, Pickford M, Gommery D. Dental anatomy of the early hominid, Orrorin tugenensis, from the Lukeino Formation, Tugen Hills, Kenya. Rev Paléobiol. 2018;37(2):577–591.
14. White T, Suwa G, Asfaw B. Australopithecus ramidus, a new species of early hominid from Aramis, Ethiopia. Nature. 1994;371:306–312. https://doi.org/ 10.1038/371306a0
15. Kimbel WH, Rak Y, Johansson DC. The skull of Australopithecus afarensis New York: Oxford University Press; 2004. p. 201–209. https://doi.org/10.10 93/oso/9780195157062.001.0001
16. Wood B. Koobi Fora research project: Hominid cranial remains. Oxford: Oxford University Press; 1991.
17. Keyser AW. The Drimolen skull: The most complete australopithecine cranium and mandible to date. S Afr J Sci. 2000;96:189–193.
18. Ni X, Ji Q, Wu W, Shao Q, Ji Y, Zhang C, et al. Massive cranium from Harbin in northeastern China establishes a new Middle Pleistocene human lineage. Innovation. 2021;2(3), Art. #100130. https://doi.org/10.1016/j.xinn.2021.1 00130
19. Hubbe M, Harvati K, Neves W. Paleoamerican morphology in the context of European and East Asian late Pleistocene variation: Implications for human dispersion into the new world. Am J Biol Anthropol. 2011;144:442–453. http s://doi.org/10.1002/ajpa.21425
20. R Core Team. R: A language and environment for statistical computing. Vienna: R Foundation for Statistical Computing; 2022.
AuthorS:
Adeyemi D. Adetimehin1
Calvin G. Mole1
Devin A. Finaughty2 3
Marise Heyns1 4
AFFILIAtIoNS:
1Division of Forensic Medicine and Toxicology, Department of Pathology, University of Cape Town, Cape Town, South Africa
2Division of Natural Sciences, School of Chemistry and Forensic Science, University of Kent, Canterbury, United Kingdom
3Division of Clinical Anatomy and Biological Anthropology, Department of Human Biology, University of Cape Town, Cape Town, South Africa
4School of Medicine, Faculty of Life and Health Sciences, Ulster University, Derry~Londonderry, United Kingdom
*Current: Human Variation and Identification Research Unit, School of Anatomical Sciences, Faculty of Health Sciences, University of the Witwatersrand, Johannesburg, South Africa
CorrESPoNDENCE to:
Adeyemi Adetimehin
EMAIL: yemiadetimehin@gmail.com
DAtES:
r eceived: 11 Jan. 2024
r evised: 11 Apr. 2024
Accepted: 04 June 2024
Published: 31 July 2024
hoW to CItE:
Adetimehin AD, Mole CG, Finaughty DA, Heyns M. Unidirectional dispersal of blow fly larvae following decomposition fluids from a pig carcass. S Afr J Sci. 2024;120(7/8), Art. #17589. https://doi.org/10.1715 9/sajs.2024/17589
South African National Research Foundation (CSUR116299), University of Cape Town
Unidirectional dispersal of blow fly larvae following decomposition fluids from a pig carcass
The decomposition of a body, and the associated gaseous and liquid discharges emanating from it, attract gravid female blow flies which lay their eggs in or on the body. After the eggs have hatched, the emerging larvae start feeding on the body. As decomposition progresses, the blow fly larvae often migrate away, typically in a random manner in search of favourable conditions for pupation. In this paper, we report on a rarely described phenomenon of unidirectional mass migration of blow fly larvae and postulate on the factors which may drive this process. A decomposition trial utilising a 60-kg pig carcass, deployed in the summer months in Table Mountain National Park, Cape Town, South Africa, was conducted in 2022. On the fifth day of the trial, simultaneous unidirectional mass dispersal of blow fly larvae was observed. The larvae moved downhill in a southeasterly direction, following the flow of decomposition fluids oozing out from the pig carcass. The ‘larval migration stream’ had a length of approximately 1.5 m with a width of 40 cm, tapering to 17 cm at the terminal point. The larval migration stream consisted of the larvae of Chrysomya albiceps and Chrysomya chloropyga. This study demonstrates the importance of understanding the timing and pattern of dispersal of post-feeding blow fly larvae in each geographical region. This is crucial as the minimum post-mortem interval can be miscalculated if older immature insects dispersing from the corpse are not considered and collected during crime scene investigations.
Significance:
• Understanding the timing and pattern of dispersal of blow fly larvae from decomposing vertebrate remains in each geographical region is important in time-since-death estimations when using entomological evidence.
• In the summer season of the Western Cape Province, Chrysomya albiceps and Chrysomya chloropyga are among the blow fly species of forensic importance as they deposit their eggs on vertebrate remains.
• When a decomposing body is found within the Table Mountain region, we suggest that crime scene investigators should examine the downhill area of the scene for larval/pupal entomological evidence that can assist in time and season of death estimations.
Introduction
In December 2022, during a summer decomposition and insect successional trial of a 60-kg adult-sized pig carcass within Table Mountain National Park, intense blow fly larval activity and feeding was observed on the fifth day in the head and neck regions (Video 11). A close observation of the carcass revealed substantial loss of soft tissues in these regions (Figure 1a). Massive larval activity and feeding were further observed on and in the upper region of the abdomen and forelimbs (Figure 1a). Unexpectedly, a unidirectional mass dispersal of the blow fly larvae was observed in the area directly behind the head and neck regions (Figures 1b, 2a and 2b). The blow fly larvae moved downhill in a southeasterly direction following the flow of the decomposition fluids oozing out from the carcass (Figures 1b, 2a, 2b and Video 22). The ‘larval migration stream’ had a length of approximately 1.5 m with a width of 40 cm, tapering to 17 cm at the terminal point (Figure 1b). The predominant wind direction and average wind speed from the previous sampling time (i.e. 12:00) on the fourth day until the time the observation was made on the fifth day were south-southwest and 4.82 m/s, respectively.
Composition of the ‘larval migration stream’
The ‘larval migration stream’ consisted of the larvae of Chrysomya albiceps Weidemann 1819 (Diptera: Calliphoridae) and Chrysomya chloropyga Weidemann 1818 (Diptera: Calliphoridae). Their identities were established in situ and by the collection of a subsample of 5–10 eggs and larvae on and around the decomposing pig carcass, after which they were taken to the Forensic Entomology Laboratory at the University of Cape Town for further processing. The larvae of Ch. albiceps were identified by the presence of fleshy protuberances on their abdominal segments.3 The eggs/larvae of Ch. chloropyga were reared to adulthood on minced pig liver in a climate chamber.4 After the emergence of the adult flies, the insects were killed by gassing in a killing jar containing paper towels dampened with ethyl acetate.4 Thereafter, species identity was confirmed using the identification keys in Lutz et al.5 The immature stages of these two blow flies have been reported on decomposing human cadavers and animal carcasses during the summer in South Africa.4 6 7
Discussion
Shortly after death, a vertebrate’s body undergoes a series of physicochemical changes known as decomposition.8 As these changes progress, dipterous insects belonging to the family Calliphoridae become attracted to the body as first colonisers, arriving within minutes, hours, or days.4,9-12 These insects are attracted to the vertebrate remains by the volatile organic compounds associated with the gases and decomposition fluids emanating from the body. After their arrival, gravid female flies oviposit in or close to natural body openings or skin lesions, between the limbs and/or
Dispersal of blow fly larvae from a decomposing pig carcass
Page 2 of 4
1: (a) Larval activity and feeding on the soft tissues in the head, neck, forelimbs, and upper abdominal regions of the pig carcass. (b) Downhill dispersal of blow fly larvae together with the decomposition fluids in a southeasterly direction on the fifth day of the experimental trial in summer.
Figure
Figure 2: Close-up views of some larvae (a) at the starting point and (b) further down the stream of the decomposition fluids oozing out from the pig carcass.
underneath the vertebrate remains, after which the emerging larvae start feeding on the body.9,11,13
Upon reaching the transition from third instar feeding to third instar postfeeding stage, the larvae begin to disperse individually or en masse from the decomposing carcass into the surrounding environment in random and sometimes specific directions.10 12 14 15 This characteristic movement –termed post-feeding larval dispersal – has been hypothesised to be due to the depletion in food resources by vertebrate and invertebrate scavengers, competition with other larvae, completion of the larval stage, saturation of the surrounding soil by rainfall and decomposition fluids, movement triggered by other larvae, and/or avoidance of predation or parasitism.10 12,14-16 Consequently, the larvae disperse in search of either another food source in the absence of enough food reserves needed for the next stage called pupariation, or suitable pupariation sites.14,17
Other factors such as temperature, humidity, wind, moisture availability, luminosity, photoperiod, and soil compactness play important roles in the dispersal pattern of fly larvae.10 14 There are at least four published reports on the unidirectional dispersal of significant numbers of blow fly larvae from vertebrate remains under natural conditions.10 12 15 17
However, we are not aware of any decomposition studies within Africa that have documented the unidirectional dispersal of blow fly larvae from decomposing vertebrate remains. Also, studies documenting the coordinated dispersal of blow fly larvae in the direction of the flow of the decomposition fluids oozing out from vertebrate remains are scarce. Thus, we report here a rarely described phenomenon of unidirectional mass migration of blow fly larvae in the direction of the flow of the decomposition fluids from a pig carcass within the Table Mountain National Park of the Western Cape Province of South Africa.
In this study, the observed synchronised and unidirectional migration of blow fly larvae in the direction of the flow of decomposition fluids was unusual as we had not observed it in all our previous trials on neonate (n = 12) and adult pig carcasses (n = 1) in different seasons within the same study area.4 As with Goddard et al.15, it is important that we highlight the possibility of missing out on the timing of the mass dispersal of blow fly larvae during our previous decomposition trials within the study location by virtue of our sampling time, which was variable and at most ~2 hours for every sampling day.
We attribute the downhill mass migration of blow fly larvae together with the decomposition fluids in a southeasterly direction to the topography of the study site and associated force of gravity.12,14 While it was not categorically stated, it seems that in Lashley et al.’s12 study, the millions of blow fly larvae from a location containing a 725-kg carrion biomass, dispersed downhill in a synchronised manner and in a unified direction. Secondly, we speculate that the coordinated dispersal of blow fly larvae in the direction of flow of the decomposition fluids may be one of the mechanisms employed by blow fly larvae to escape the saturated environment, to reduce the rate of desiccation and to enable them to travel easily and further away from the food source during their postfeeding migratory period.10 14 15
The downhill mass dispersal of blow fly larvae together with the flow of the decomposition fluids emanating from a carcass, increases the area of the cadaver decomposition island, which in turn can complicate the location of clandestine cadaver deposition sites, especially when human cadaver detection dogs are utilised.12,18,19 In fact, a follow-up study revealed that the electrical conductivity in the soil within the dispersal trail of the blow fly larvae and decomposition fluids (mean ± standard deviation: 220.4 ± 102.4 µS/ cm) was significantly higher than those of the control soils (mean ± standard deviation: 117.6 ± 30.8 µS/cm).20 While the design of the study from which this observation was made excluded vertebrate scavengers from interacting with the pig carcass, the southeasterly directional flow of the decomposition fluids from the carcass might be misconstrued as scavenger-induced dispersal of the carcass appendages and soft tissues.21-23 Furthermore, this can potentially be misinterpreted as the dragging trail of a body on or around the scene of death.21
In conclusion, understanding the timing and pattern of dispersal of post-feeding fly larvae in each geographical region is important,
especially if the oldest immature insects (i.e. larvae or pupae) found on or around a corpse are to be employed in minimum post-mortem interval estimations.24 25 This is attributed to the fact that different locations, regions and/or countries have different weather conditions (e.g. temperature, rainfall, humidity, and photoperiod), landscape and habitat types (e.g. vegetation, forest types, soil types and conditions), all of which exert a considerable influence on the decomposition rate/ pattern of vertebrate remains and vertebrate scavenger assemblage, alongside the development, breeding behaviour, assemblage, and activities of carcass-associated insects.4 10 14 17 26-31
Equally important, documenting the dispersal patterns of post-feeding blow fly larvae under natural conditions is crucial as the minimum post-mortem interval can be miscalculated if older immature insects dispersing from the corpse are not considered and collected.17 The reasons for the unidirectional en masse dispersal of blow fly larvae from the food source are still not well understood in the literature.10,15 Thus, further studies incorporating a 24-h camera surveillance system, together with an increase in the frequency of sample collection, are needed to improve our understanding of the timing and ecological factors triggering this unique behaviour in blow fly larvae under natural conditions.15
Ethical declarations
Ethical approval for the decomposition and carcass entomofauna successional studies in the Table Mountain National Park was granted by the University of Cape Town, Faculty of Health Sciences Animal Ethics Committee (UCT FHS AEC Reference number: 021_021; valid until 30 December 2024). Approval to conduct the decomposition and carcass entomofauna successional studies in the Table Mountain National Park was also obtained from the authorities of the South African National Park/Table Mountain National Park (permit number: CRC/20222023/024--2019/V1; valid until 31 December 2023). This work is based on research conducted for a PhD thesis by A.D.A. on ‘Insect succession and changes in the soil pH and electrical conductivity associated with decomposing pig carcasses on the Table Mountain National Park of the Western Cape Province of South Africa’ at the University of Cape Town. This work was previously presented at the Royal Entomological Society 2023 Student Forum.
Acknowledgements
We thank the authorities of the South African National Parks and Table Mountain National Park for granting us access and hosting the summer decomposition and carcass entomofauna successional study on their premises. We thank Mr John Morris (Farm Manager: Mariendahl Experimental Farm, Stellenbosch University) for providing the adult pig carcass used in the summer decomposition and carcass entomofauna successional study. We thank Prof. Susan Cunningham of the FitzPatrick Institute of Ornithology, Department of Biological Sciences, University of Cape Town, for granting us access to their weather data.
Funding
We are grateful to the South African National Research Foundation (NRF) for funding this study through a research grant awarded to M.H. (grant number CSUR116299). We are thankful to the NRF and the University of Cape Town for providing a Grantholder Student-Linked Bursary, International Students’ Scholarship, JW Jagger Centenary Gift Scholarship, and Postgraduate Research Training Grant to A.D.A. The financial assistance of the NRF towards this research is hereby acknowledged. Opinions expressed and conclusions arrived at, are those of the authors and are not necessarily to be attributed to the NRF.
Data availability
All the data supporting the results of this study are included in the article itself. Furthermore, supplementary materials supporting the results of this study have been deposited in a recognised repository (Figshare) and are openly accessible via the links included.
Dispersal
Declaration of AI use
We declare that we did not use any AI or large language models in the conceptualisation of the study and in preparing, editing, and revising the manuscript throughout the entire submission or publication process.
1. Adetimehin A, Mole C, Finaughty DA, Heyns M. Supplementary video 1: Intense blow fly larval activity and feeding in the head, neck, forelimbs, and upper abdominal regions of the pig carcass [media]. figshare. 2024. https:// doi.org/10.6084/m9.figshare.26028766.v1
2. Adetimehin A, Mole C, Finaughty DA, Heyns M. Supplementary video 2: Downhill dispersal of blow fly larvae together with the decomposition fluids in the southeastern direction [media]. figshare. 2024. https://doi.org/10.608 4/m9.figshare.26028805.v2
3. Szpila K, Williams K, Soszyńska A, Ekanem M, Heyns M, Dinka MD, et al. Key for the identification of third instar larvae of African blowflies (Diptera: Calliphoridae) of forensic importance in death investigations. Forensic Sci Int. 2023; Art. #111889. https://doi.org/10.1016/j.forsciint.2023.111889
4. Adetimehin AD. Insect succession and changes in the soil pH and electrical conductivity associated with decomposing pig carcasses on the Table Mountain National Park of the Western Cape Province of South Africa [dissertation]. Cape Town: University of Cape Town; 2023.
5. Lutz L, Williams KA, Villet MH, Ekanem M, Szpila K. Species identification of adult African blowflies (Diptera: Calliphoridae) of forensic importance. Int J Legal Med. 2018;132(3):831–842. https://doi.org/10.1007/s00414-017-16 54-y
6. Hill L. Insect colonisation of bodies brought into the Johannesburg Forensic Pathology Service: Implications for accurate time of death estimations [dissertation]. Johannesburg: University of the Witwatersrand; 2019.
7. Kelly JA. The influence of clothing, wrapping and physical trauma on carcass decomposition and arthropod succession in central South Africa [dissertation]. Bloemfontein: University of the Free State; 2006.
8. Anderson GS, VanLaerhoven SL. Initial studies on insect succession on carrion in southwestern British Columbia. J Forensic Sci. 1996;41(4):617–625. https://doi.org/10.1520/JFS13964J
9. Byrd J, Castner JL. Forensic entomology the utility of arthropods in legal investigations. 2nd ed. Boca Raton FL: CRC Press; 2010.
10. Heinrich B. Coordinated mass movements of blow fly larvae (Diptera: Calliphoridae). Northeast Nat. 2013; 20(4):N23–N27. https://doi.org/10.16 56/045.020.0417
11. Verheggen F, Perrault KA, Megido RC, Dubois LM, Francis F, Haubruge E, et al. The odor of death: An overview of current knowledge on characterization and applications. BioScience. 2017;67(7):600–613. https://doi.org/10.1093 /biosci/bix046
12. Lashley MA, Jordan HR, Tomberlin JK, Barton BT. Indirect effects of larval dispersal following mass mortality events. Ecology. 2018;99(2):491–493. https://doi.org/10.1002/ecy.2027
13. Adetimehin AD, Mole CG, Finaughty DA, Heyns M. Caught in the act: Impact of Crematogaster cf. liengmei (Hymenoptera: Formicidae) necrophagous behavior on neonate pigs (Sus scrofa domesticus L.) in the Western Cape Province of South Africa. Int J Legal Med. 2024;138:259–266. https://doi.or g/10.1007/s00414-022-02835-9
14. Gomes L, Godoy WAC, Von Zuben CJ. A review of postfeeding larval dispersal in blowflies: Implications for forensic entomology. Naturwissenschaften. 2006;93(5):207–215. https://doi.org/10.1007/s00114-006-0082-5
15. Goddard J, De Jong G, Meyer F. Unidirectional en masse larval dispersal of blow flies (Diptera: Calliphoridae). Food Webs. 2020;23, e00137. https://doi. org/10.1016/j.fooweb.2019.e00137
16. Cammack JA, Adler PH, Tomberlin JK, Arai Y, Bridges JWC. Influence of parasitism and soil compaction on pupation of the green bottle fly, Lucilia sericata. Entomol Exp Appl. 2010;136:134–141. https://doi.org/10.1111/j. 1570-7458.2010.01019.x
17. Lewis AJ, Benbow ME. When entomological evidence crawls away: Phormia regina en masse larval dispersal. J Med Entomol. 2011;48(6):1112–1119. https://doi.org/10.1603/me11093
18. Aitkenhead-Peterson JA, Owings CG, Alexander MB, Larison N, Bytheway JA. Mapping the lateral extent of human cadaver decomposition with soil chemistry. Forensic Sci Int. 2012;216:127–134. https://doi.org/10.1016/j.f orsciint.2011.09.007
19. Glavaš V, Pintar A. Human remains detection dogs as a new prospecting method in archaeology. J Archaeol Method Theory. 2019;26(3):1106–1124. https://doi.org/10.1007/s10816-018-9406-y
20. Ndima, N-K. Cadaver decomposition island: Changes in carrion-associated soil chemistry post-skeletonization and carrion removal [dissertation]. Cape Town: University of Cape Town; 2023.
21. Haglund WD, Sorg, MH. Forensic taphonomy: The postmortem fate of human remains. Boca Raton, FL: CRC Press; 1996.
22. Barton PS, Reboldi A, Dawson BM, Ueland M, Strong C, Wallman JF. Soil chemical markers distinguishing human and pig decomposition islands: A preliminary study. Forensic Sci Med Pathol. 2020;16:605–612. https://doi. org/10.1007/s12024-020-00297-2
23. Indra L, Errickson D, Young A, Lösch S. Uncovering forensic taphonomic agents: Animal scavenging in the European context. Biology. 2022;11(4):601. https://doi.org/10.3390/biology11040601
24. Buchan MJ, Anderson GS. Time since death: A review of the current status of methods used in the later postmortem interval. Can Soc Forensic Sci. 2001;34(1):1–22. https://doi.org/10.1080/00085030.2001.10757514
25. Amendt J, Richards CS, Campobasso CP, Zehner R, Hall MJR. Forensic entomology: Applications and limitations. Forensic Sci Med Pathol. 2011;7:379–392. https://doi.org/10.1007/s12024-010-9209-2
26. Gomes L, Von Zuben CJ. Postfeeding radial dispersal in larvae of Chrysomya albiceps (Diptera: Calliphoridae): Implications for forensic entomology. Forensic Sci Int. 2005;155(1):61–64. https://doi.org/10.1016/j.forsciint.20 04.11.019
27. Matuszewski S, Bajerlein D, Konwerski S, Szpila K. An initial study of insect succession and carrion decomposition in various forest habitats of Central Europe. Forensic Sci Int. 2008;180(2–3):61–69. https://doi.org/10.1016/j.f orsciint.2008.06.015
28. Gallagher MB, Sandhu S, Kimsey R. Variation in developmental time for geographically distinct populations of the common green bottle fly, Lucilia sericata (Meigen). J Forensic Sci. 2010;55(2):438–442. https://doi.org/10.1 111/j.1556-4029.2009.01285.x
29. Cruise A, Watson DW, Schal C. Ecological succession of adult necrophilous insects on neonate Sus scrofa domesticus in central North Carolina. PLoS ONE. 2018;13(4), e0195785. https://doi.org/10.1371/journal.pone.0195785
30. Finaughty DA. The establishment of baseline data on the rates and processes of soft-tissue decomposition in two terrestrial habitats of the Western Cape, South Africa [dissertation]. Cape Town: University of Cape Town; 2019.
31. Thümmel L, Degoutrie C, Fonseca-Muñoz A, Amendt J. Developmental differences in spatially distinct populations of the forensically relevant blow fly Lucilia sericata – About the comparability of developmental studies (and case work application). Forensic Sci Int. 2024;357, Art. #111972. https://d oi.org/10.1016/j.forsciint.2024.111972