9 minute read
A. Solar Radiation Studies
Solar Energy Density (SED) I - Surface Comparison
Advertisement


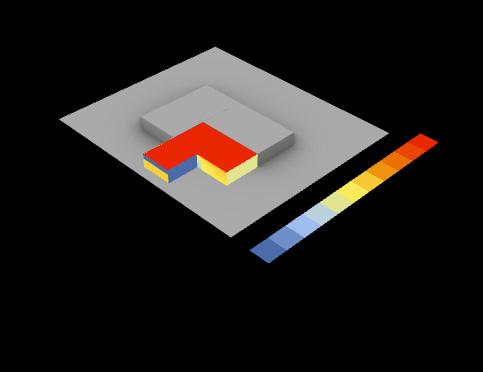



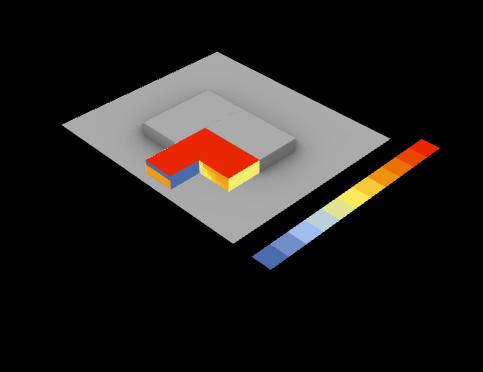



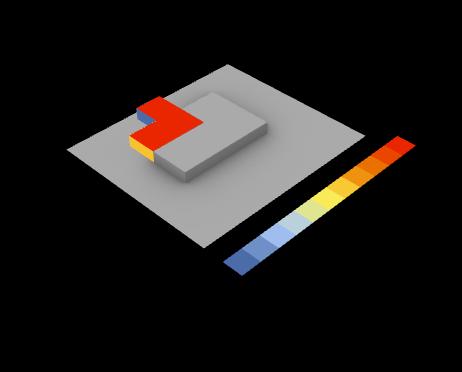
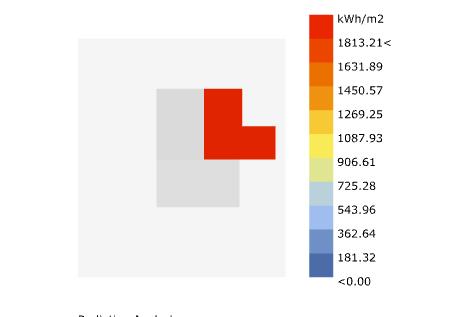
SED I - Surface Comparisons (Annual):
Total annual SED (Eastern facade):746.94 kWh/m2
Total annual SED (Southern facade):1,002.07 kWh/m2
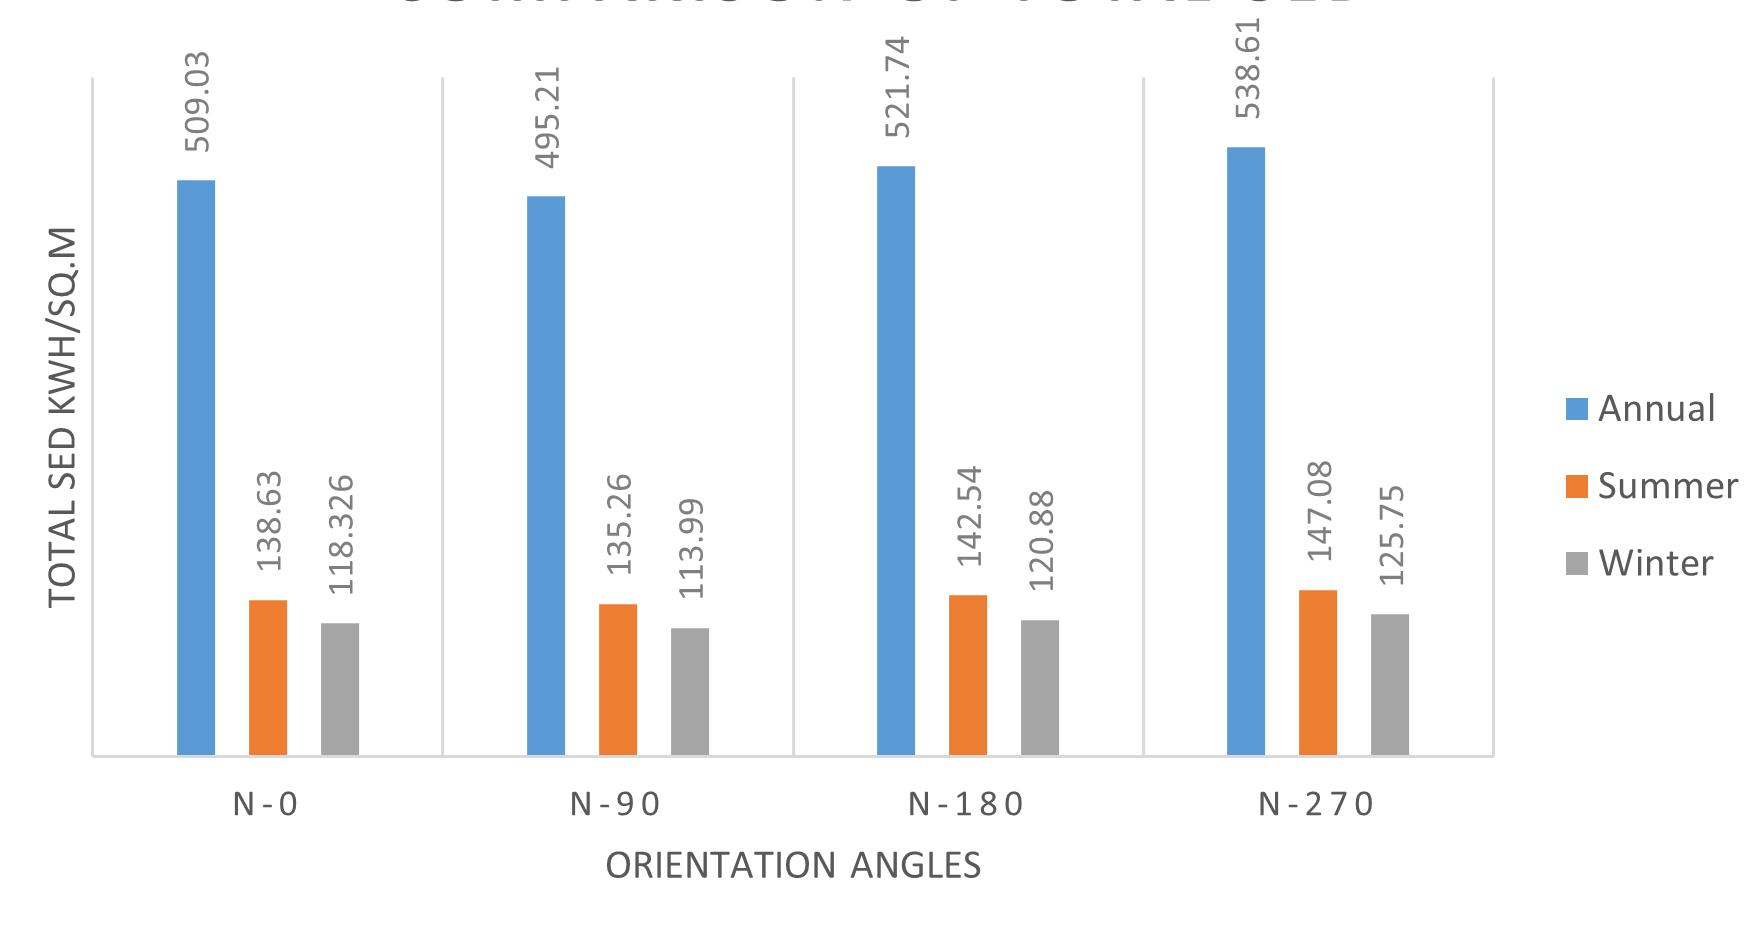
Solar Energy Density (SED) SED II - Effect of Building Orientation
II - Orientation (Annual):
Total SED on roof : 1813.21kWh/m2
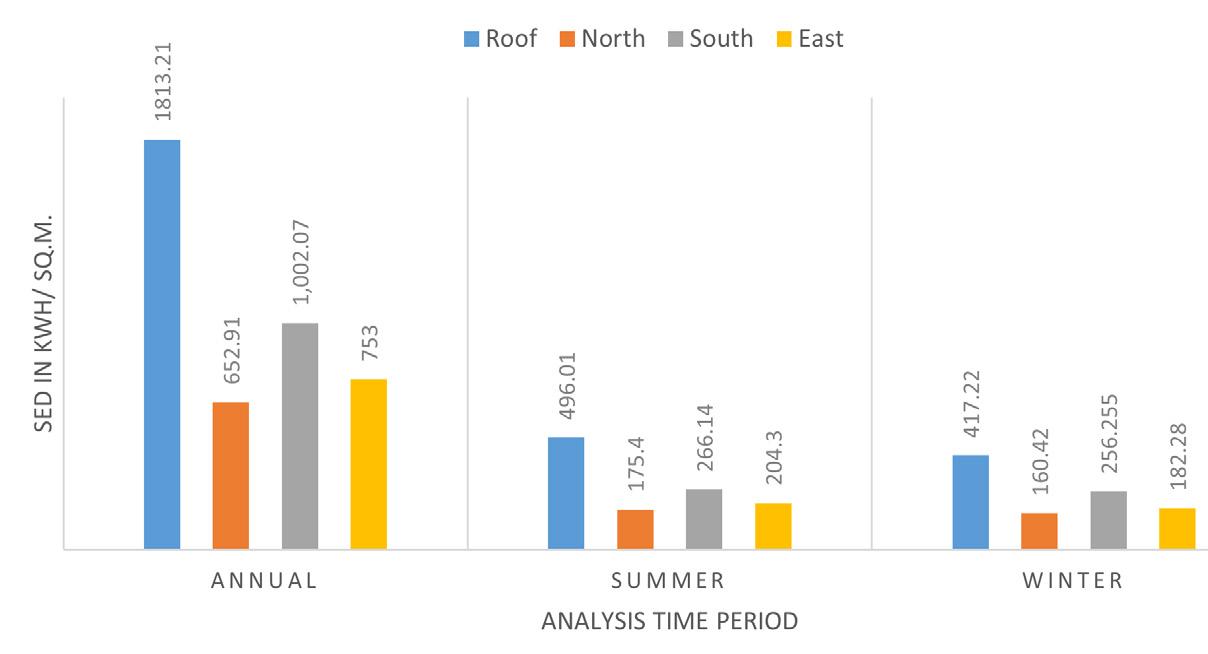
SED I - Surface Comparisons (Summer):
Total annual SED Northern facade: 652.91 kWh/m2
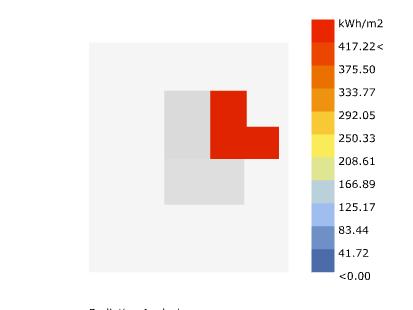
Total SED on the Eastern facade (Summer)- 204.30
Total SED on the Southern facade (Summer)- 266.14
Total SED on the roof : 496.01 kWh/m2

Total SED on the Northern facade (Summer)- 175.40
SED I - Surface Comparisons (Winter):
Total SED on the Eastern facade (Winter)- 182.280
Total SED on the Southern facade (Winter)- 182.280
Total SED on the roof : 417.22 kWh/m2
Total SED on the Northern facade (Winter) - 160.42
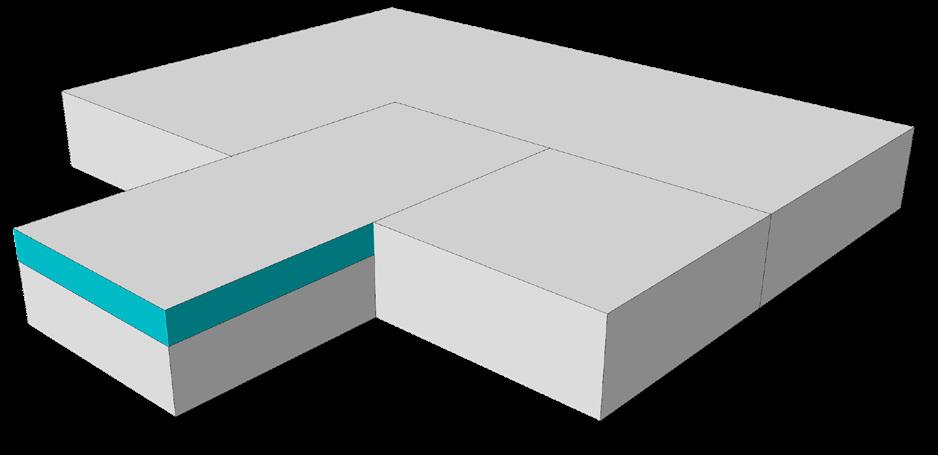
Comparison of Total SED on different surfaces
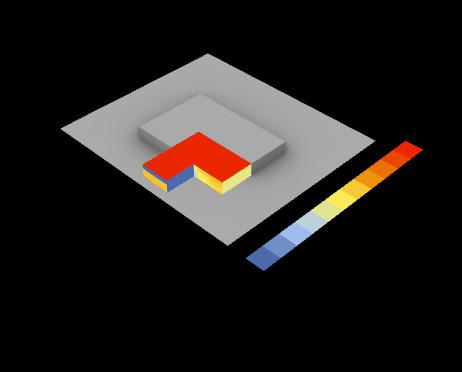
Above comparison suggests roof followed by South facade received the most solar radiation. Based on SED analysis we can propose the passive design strategies to reduce, eliminate, or utilize the solar gain.
Comparison of Total SED with different building orientations
Above comparison suggests N-90 is giving lowest incident solar radiation. This study helps understand the optimum orientation to reduce solar gain, thus heating & cooling loads for the building.
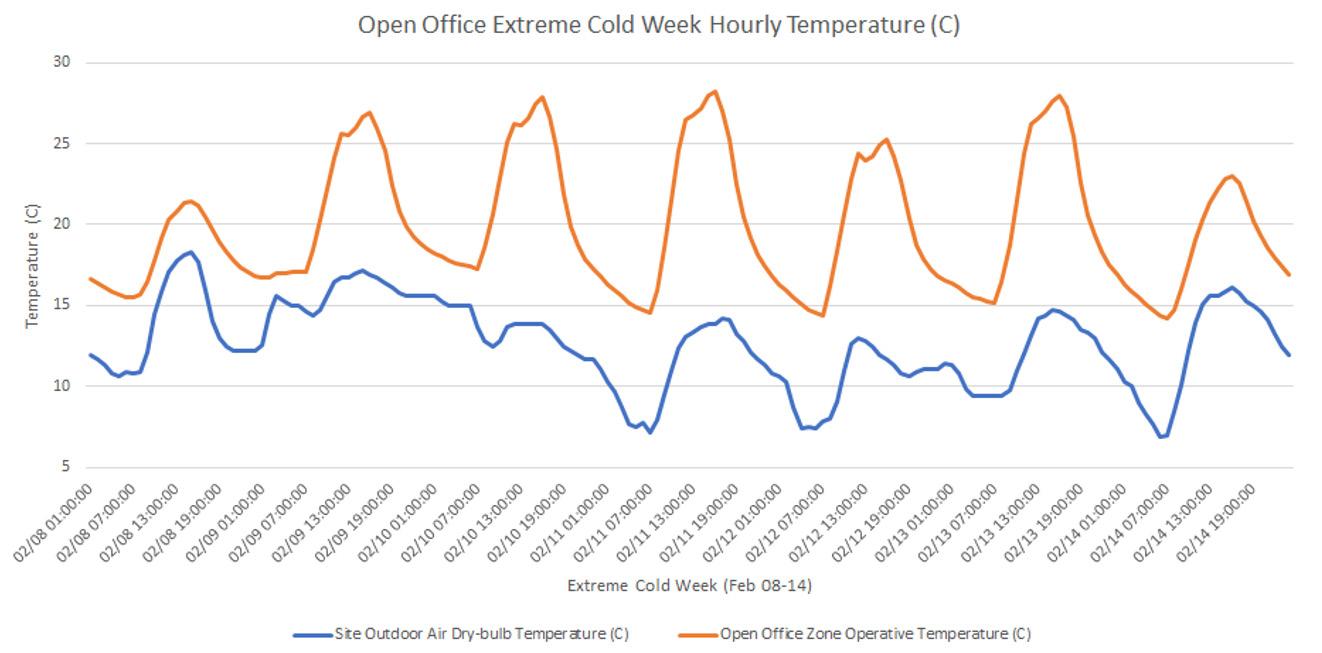
Hourly Temperature Analysis
The graph shows that indoor zone temp. is higher compared to site temp. due to internal loads & lag in heat transfer caused by building envelope in the absence of HVAC system.
Hourly Temperature Analysis
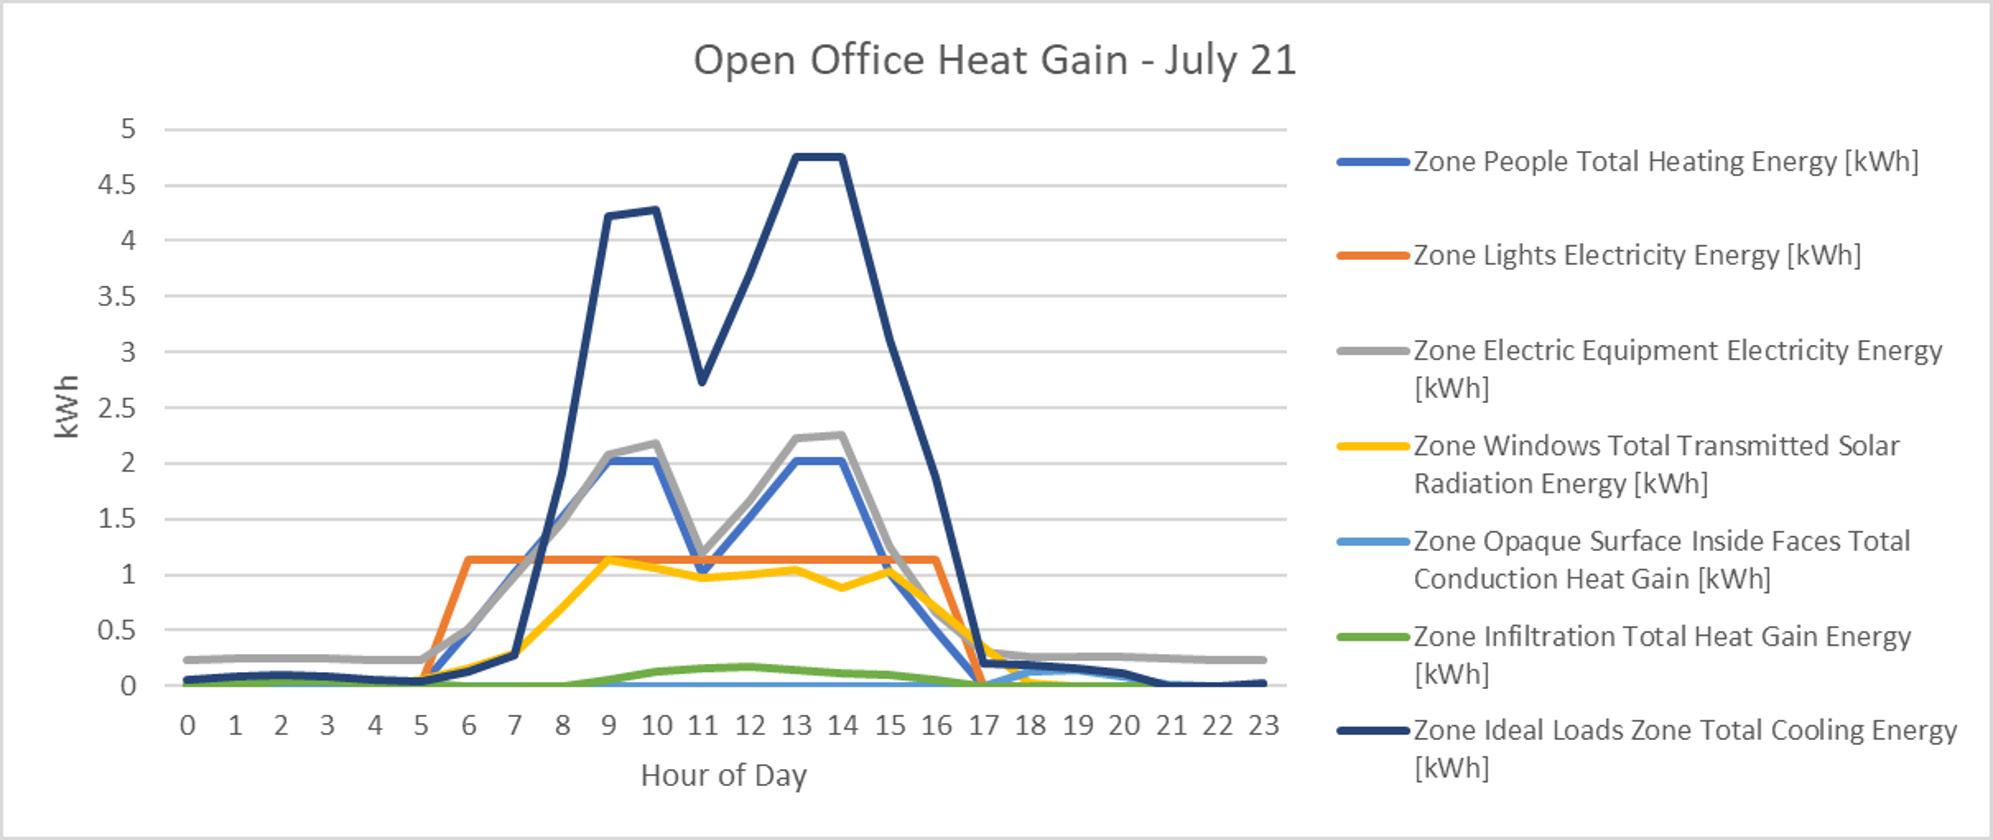
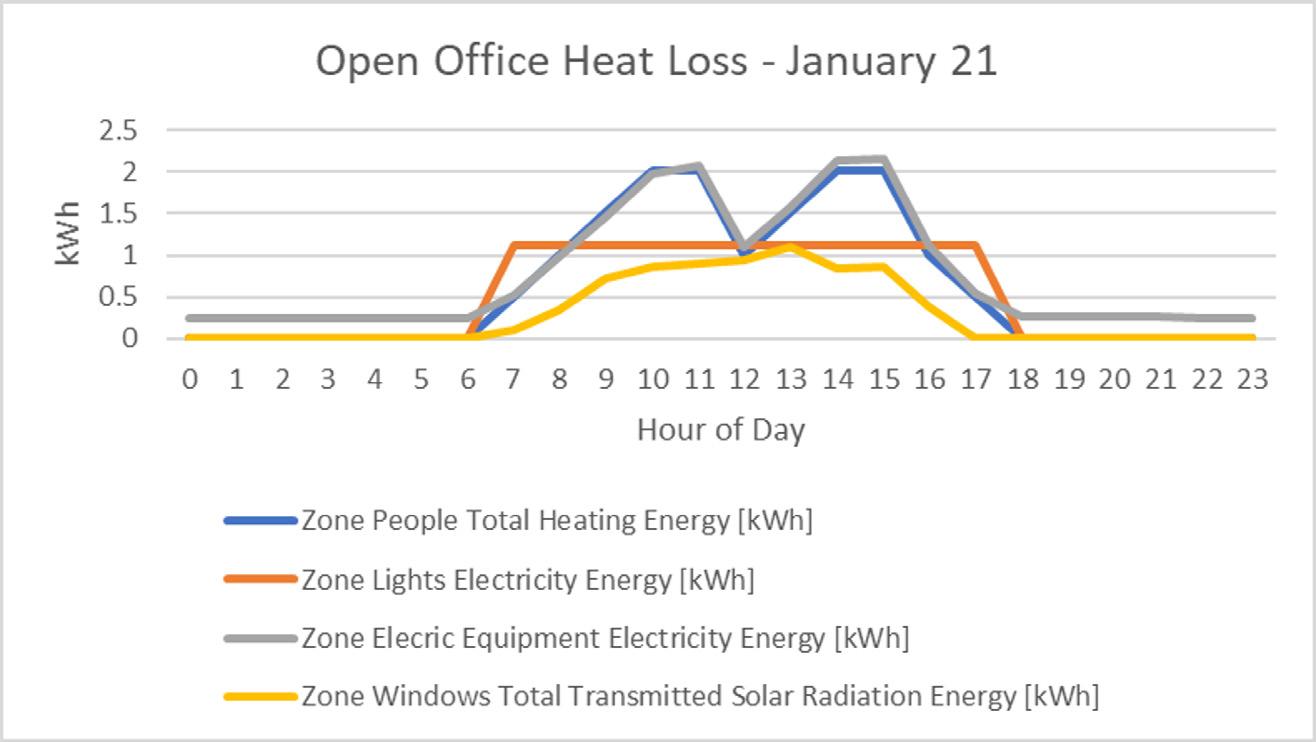
The results of the heat loss & heat gain simulation have a direct relationship with the occupancy of the building. Zone infiltration total heat gain energy and zone windows total transmitted solar radiation energy is due presence of glazing,
Summary of PMV & PPD for Open Office
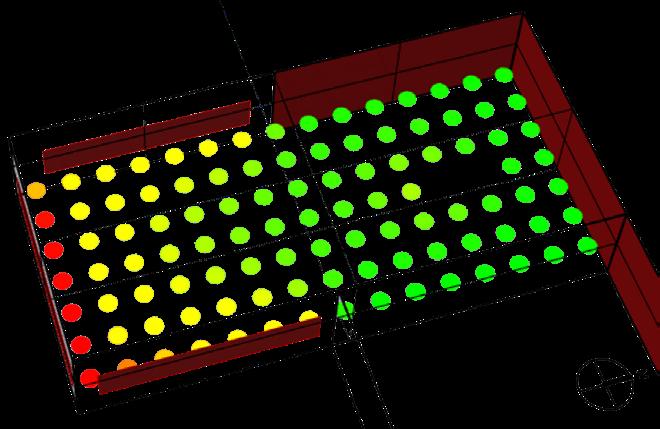
Spatial Thermal Comfort Analysis
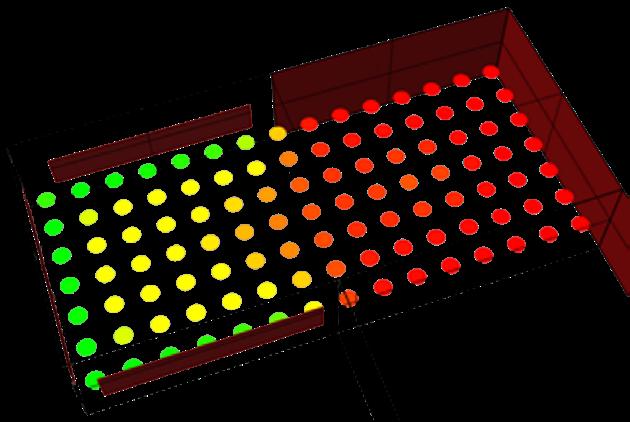
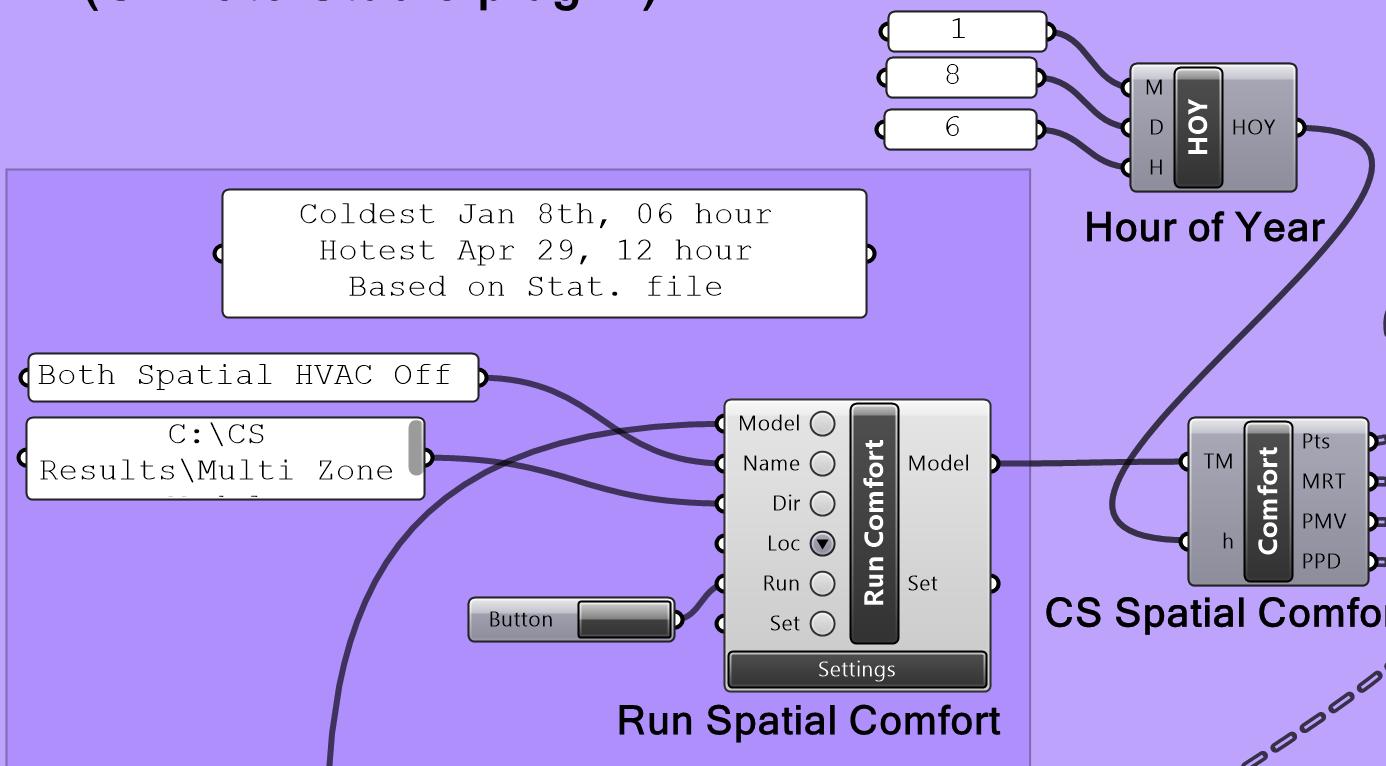
The simulation output show distribution of Mean Radiant Temperature throughout the zone for open office without HVAC. The results from MRT, PMV, & PPD suggest that on the coldest day (refer 1) employees working near the glazing may experience a cooler environment than working on the north side, where as on the hottest (refer 2) employees seating near windows felt warmer compared to rest of the room.
Heating and Cooling Energy Consumption Analysis
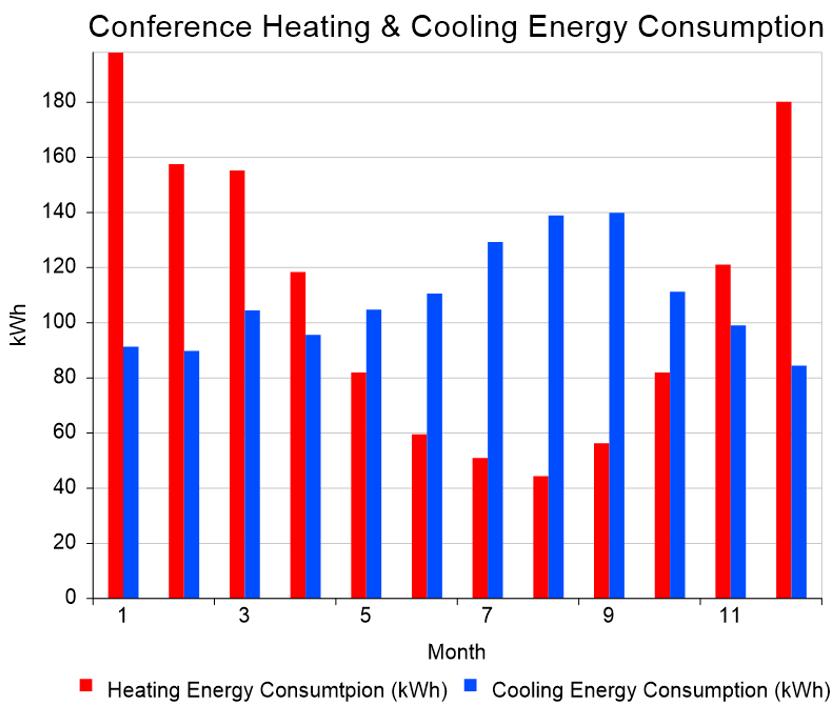

The open office space uses more energy to cool the space than heat the space during all months of the year. The conference room uses less energy to heat and cool the space due to lack of glazing.
Variations of Heat Pump systems used compared to baseline system
Whole-Building Environmental Performance Analysis
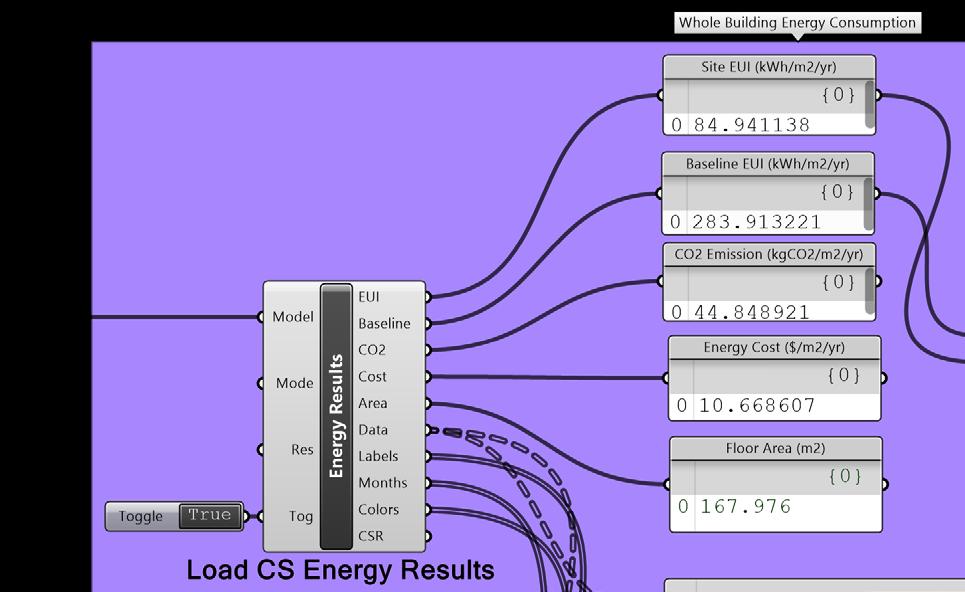
The “Load CS Energy Results” component is used to calculate the three metrics Whole Building EUI, Carbon Emissions, and Operational Costs.
Comparison of overall building performance for proposed iterations in HVAC systems with the baseline
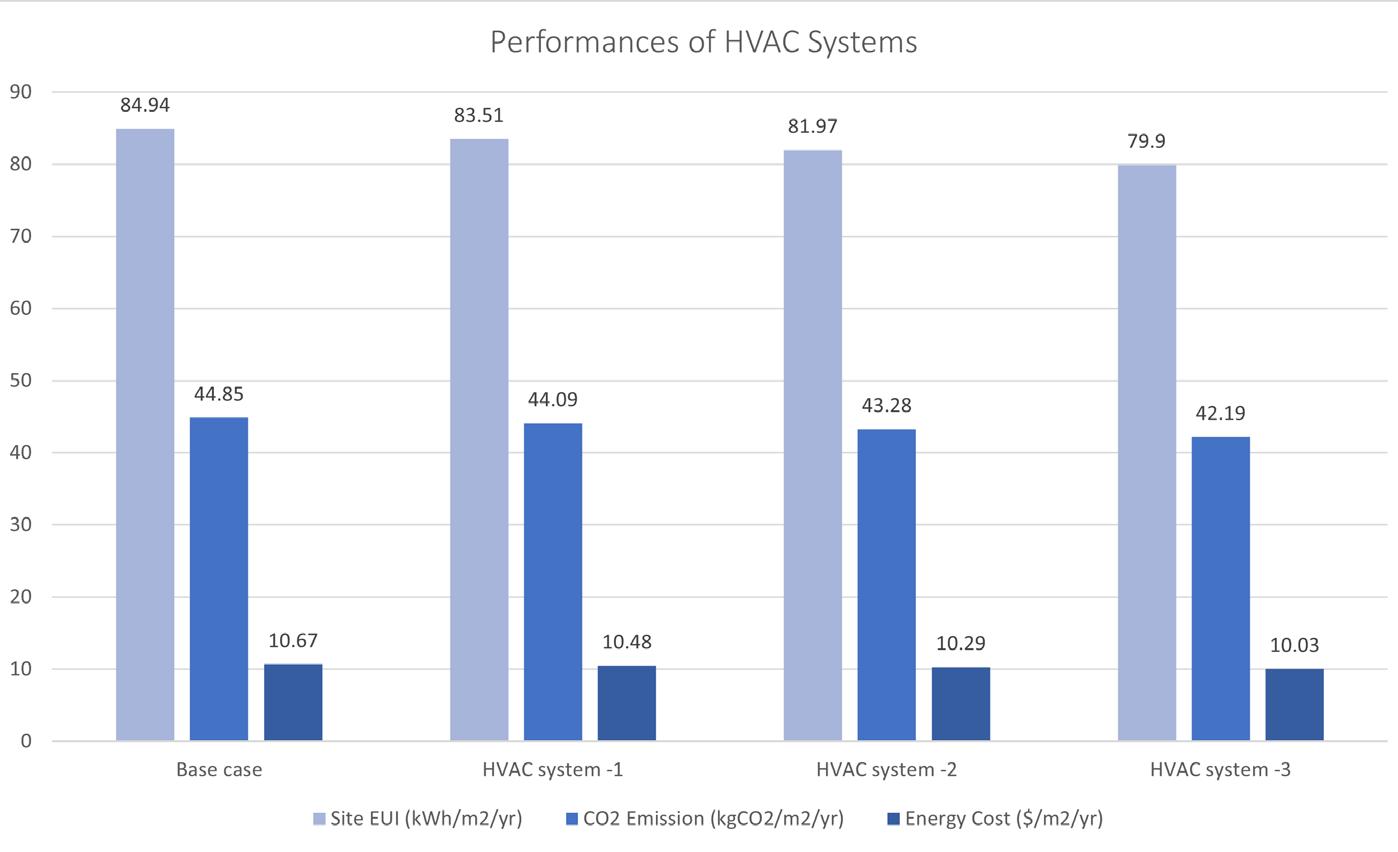
Results suggests GSHP is the most suitable system for the building
Design Iterations: Changes in Heating-Cooling Mechanical System Types
To increase the efficiency of the mechanical system & reduce EUI without compromising with occupant’s thermal comfort we opted for three different ‘Heat Pump Systems’ options by increasing their COPs & analyzed the ‘Overall Building Performance’.
04
Building Performance Modeling (BPM)
Application of Energy Modeling
Instructor: Wei Liang
Master in Sustainable Design | Carnegie Mellon University, PA | 2023
Tools: eQUEST, IESVE, Design Builder, & EnergyPlus
Type of Work: Team
The BPM course focuses on conceptual foundations and practical applications of advanced and integrated whole-building energy simulation programs with emphasis on architectural building envelope systems, mechanical electrical building systems and their controls (electric lighting and HVAC systems) and building-integrated solar photo voltaic power systems. Building Information Modeling (BIM) concept and its connectivity to Building Energy Modeling (BIM).
The assignment aimed to familiarize me with the IES-VE 2021 software and analyze the energy performance of a specific building design case. By considering factors like site data, building materials, systems, operations, and loads, I gained insights into the synergistic impacts on energy efficiency during the design development phase. For this team project I worked on creating baseline building model, thermal templates & thermal zoning.
Several
Baseline Model

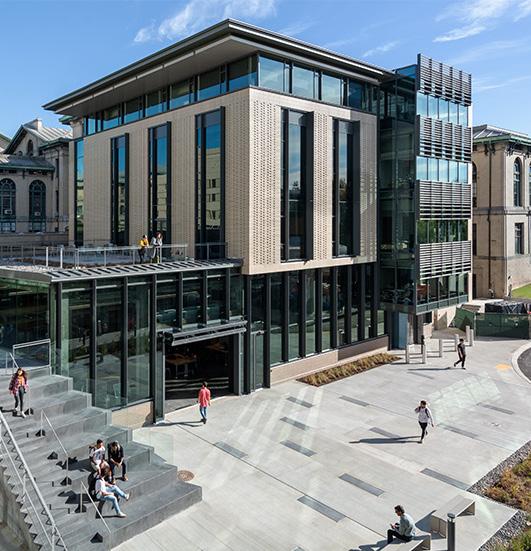
Ansys Hall is a six story building located in Pittsburgh, PA. We used EnergyPlus (TMY3) weather data file for energy modeling using IESVE. For construction of our baseline model we selected materials, which are compliant with requirements in the ASHRAE 90.1 2016 for climate zone 5A & created a baseline modeling following the outlines for building envelope, internal gains, & Operational schedules.
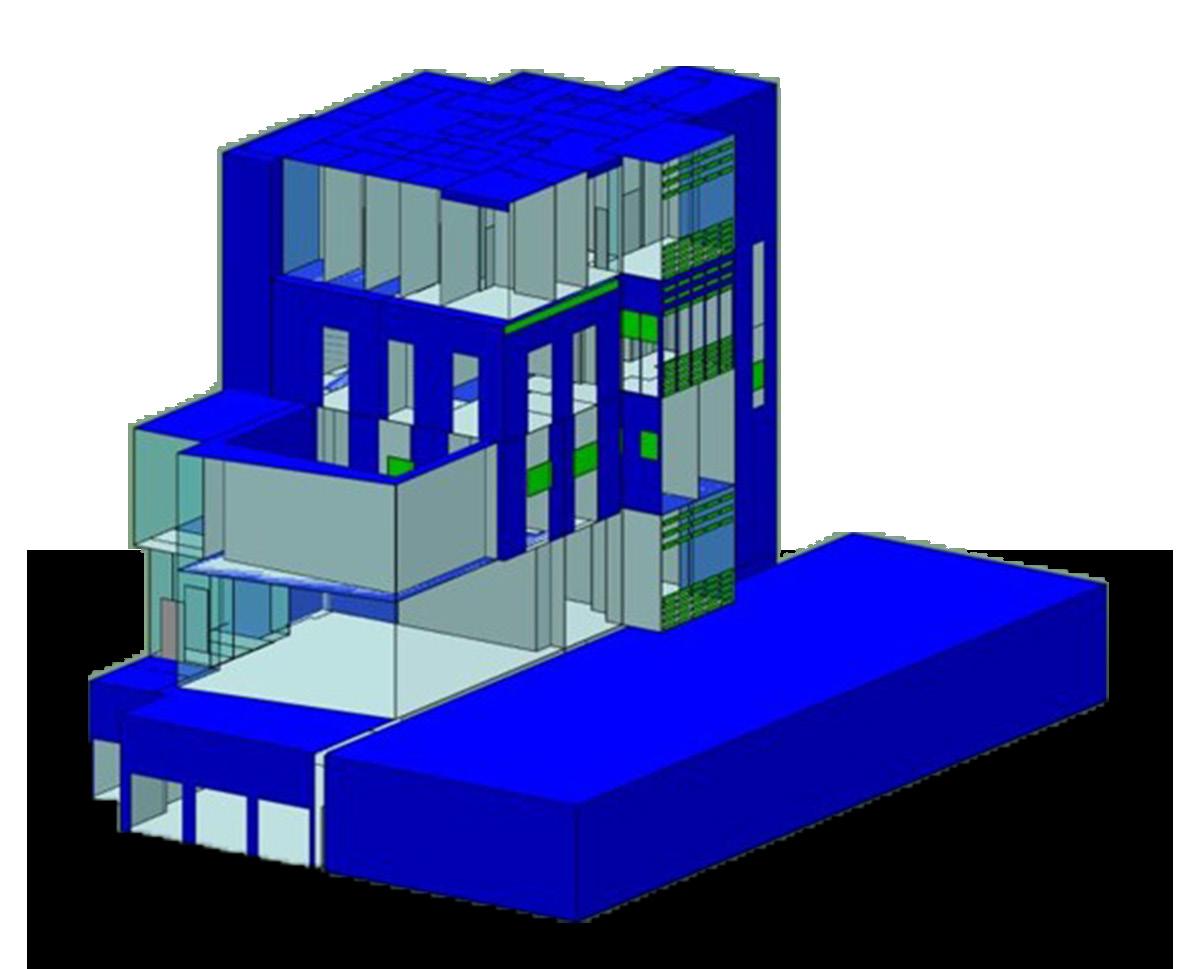
Solar shading analysis suggests that the roof and southern facade of the building receive maximum solar energy compared rest of the building.
Solar Shading Analysis
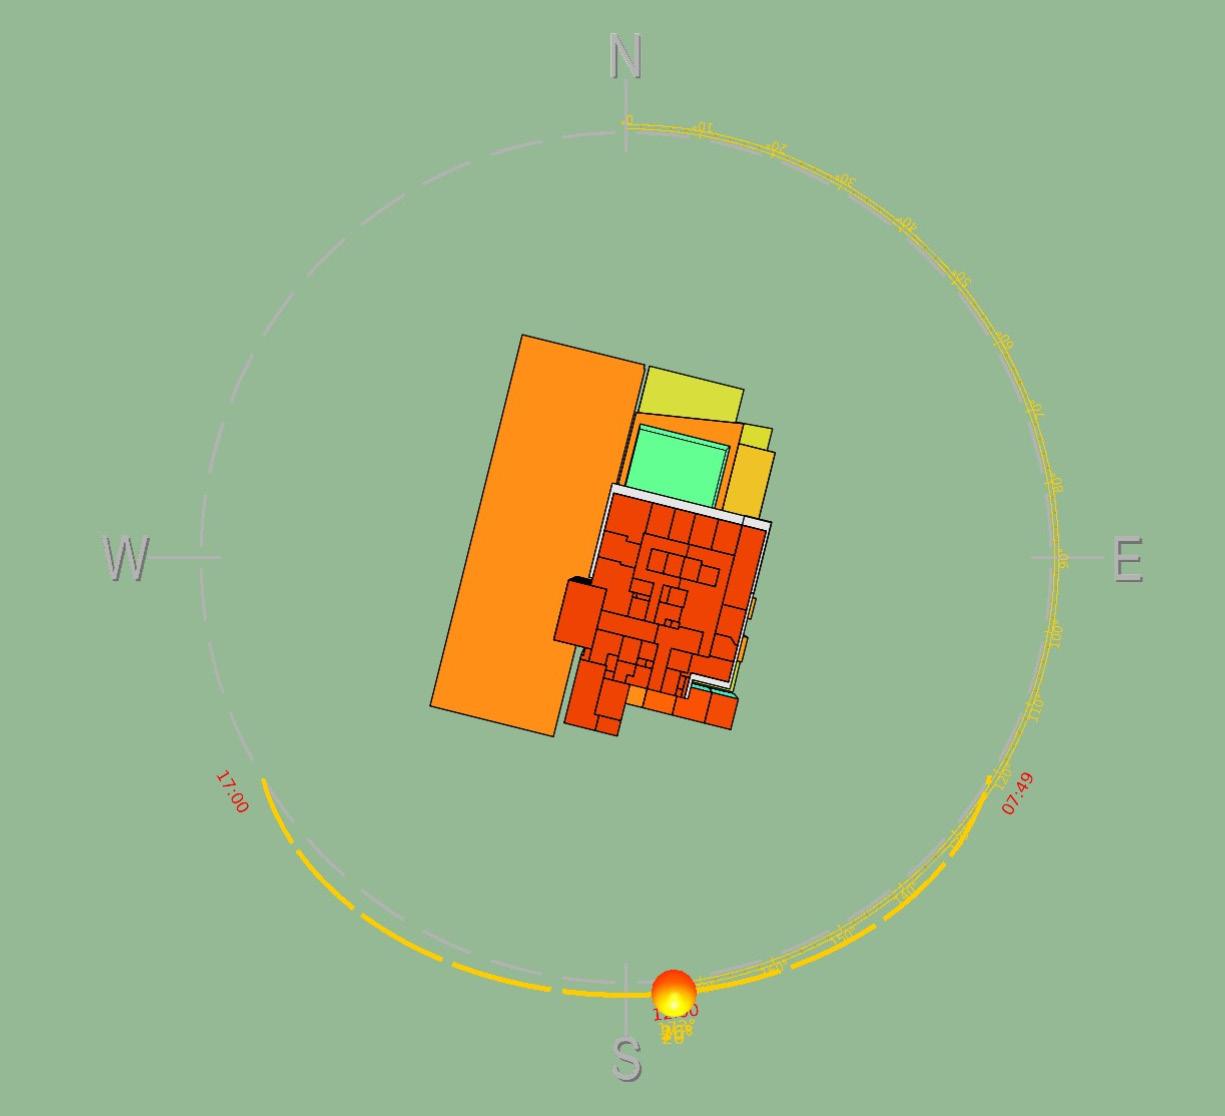
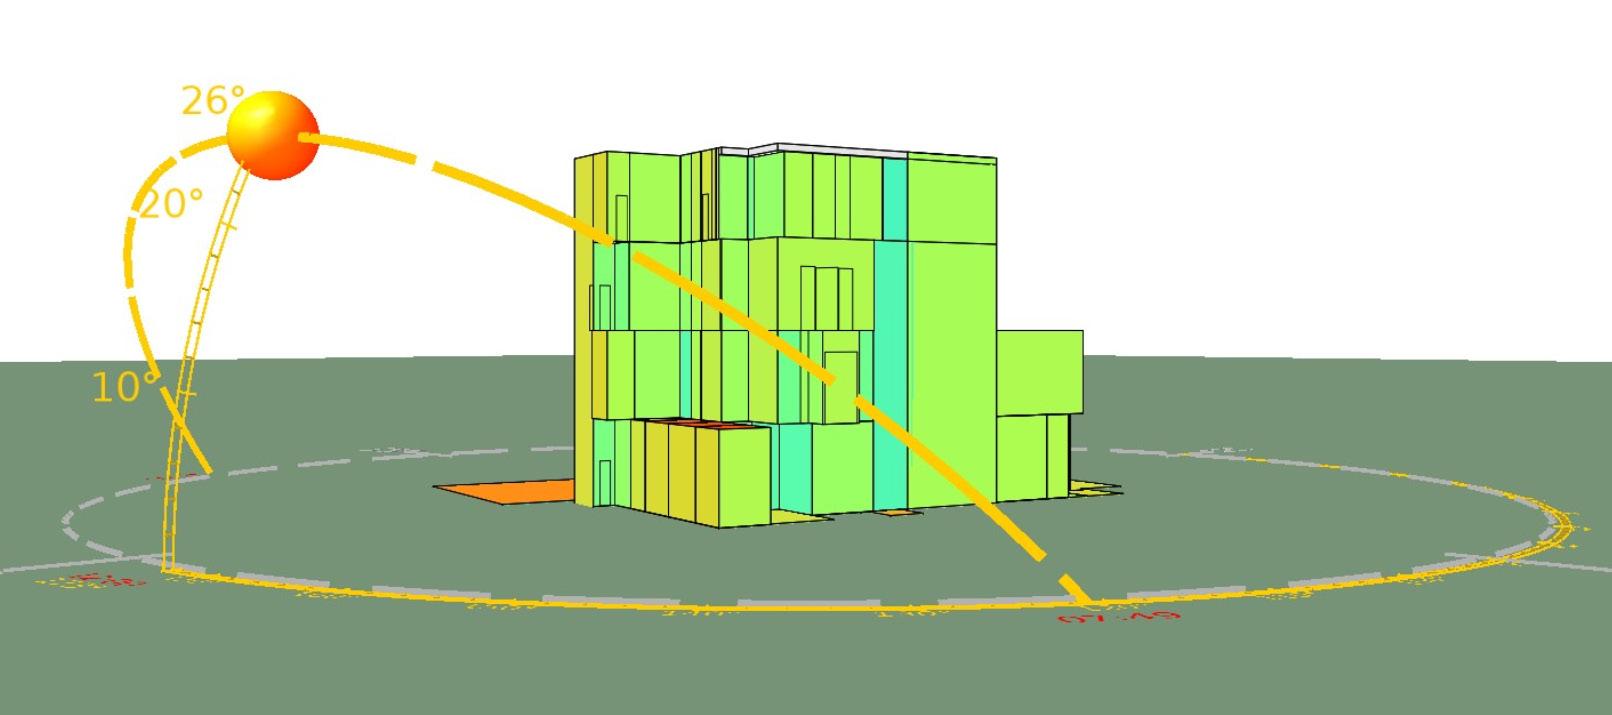
In case of installing PV panels it is important to analyze the shading casted on the building by surrounding objects/vegetation, and energy received on each surface to leverage the maximum energy.
‘Solar shading calculations’ suggests that the roof and southern facade of the building receive maximum solar energy up to 300 - 437.23 kBtu/ ft2. Whereas the western facade receives the least due to adjacent buildings casting shadows.
a. Baseline internal load (People, Lighting, Computer (Equipment)) values for each thermal template.
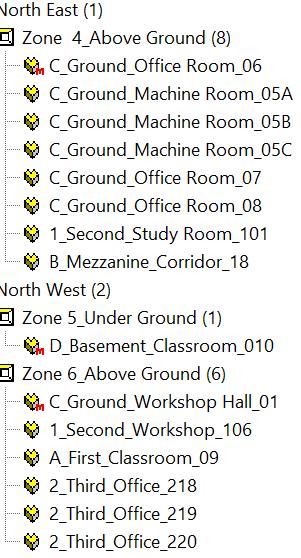
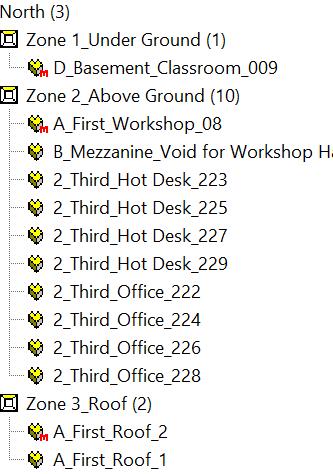
Each space is divided to create HVAC zones by ‘space by space’ zoning method & the entire floor plate at each level is divided into 11 groups based on the geographic directions, interior area, and building cores.
b. Baseline Auxiliary Ventilation Values for each thermal template
Thermal Profile

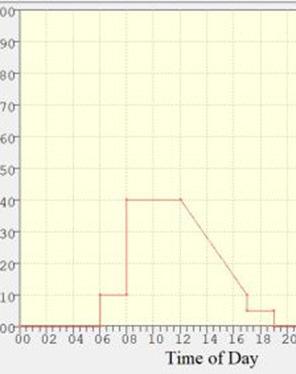

Based on the types of usage and common thermal comfort requirements, we have created 14 thermal templates for Ansys Hall. Each template has a defined internal loads (refer a) and air exchanges (refer b) according to ASHRAE 62.1 - 2016 addendum for ‘Ventilation for Acceptable Indoor Air Quality’.
The default building office occupancy schedule was used with slight modifications.
Baseline Whole-Building Performance
Compared to median EUI per building type in the U.S., our baseline model for Ansys Hall have a relatively high EUI of 236 kBTU/sf.
Parametric Analysis
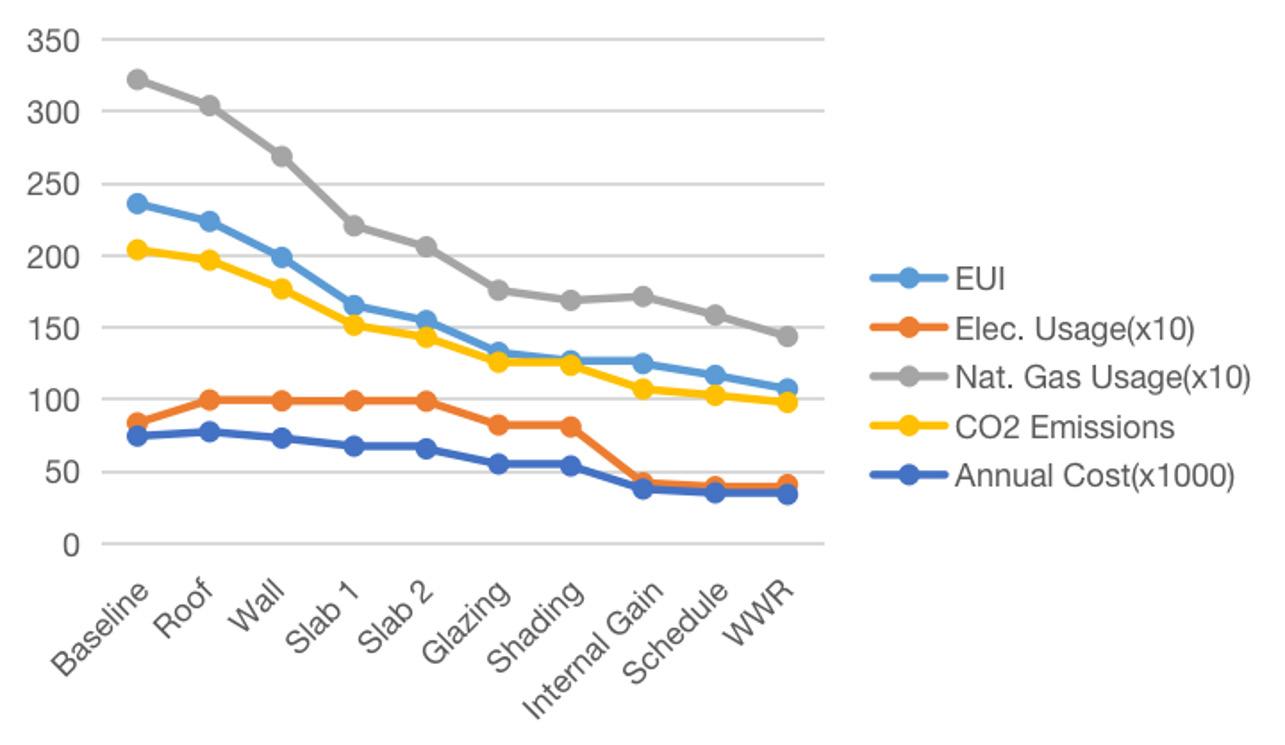
Parametric analysis helped to reduce EUI of the building with emphasis on building envelope thermal properties, solar shading, occupancy features, and building geometric properties.
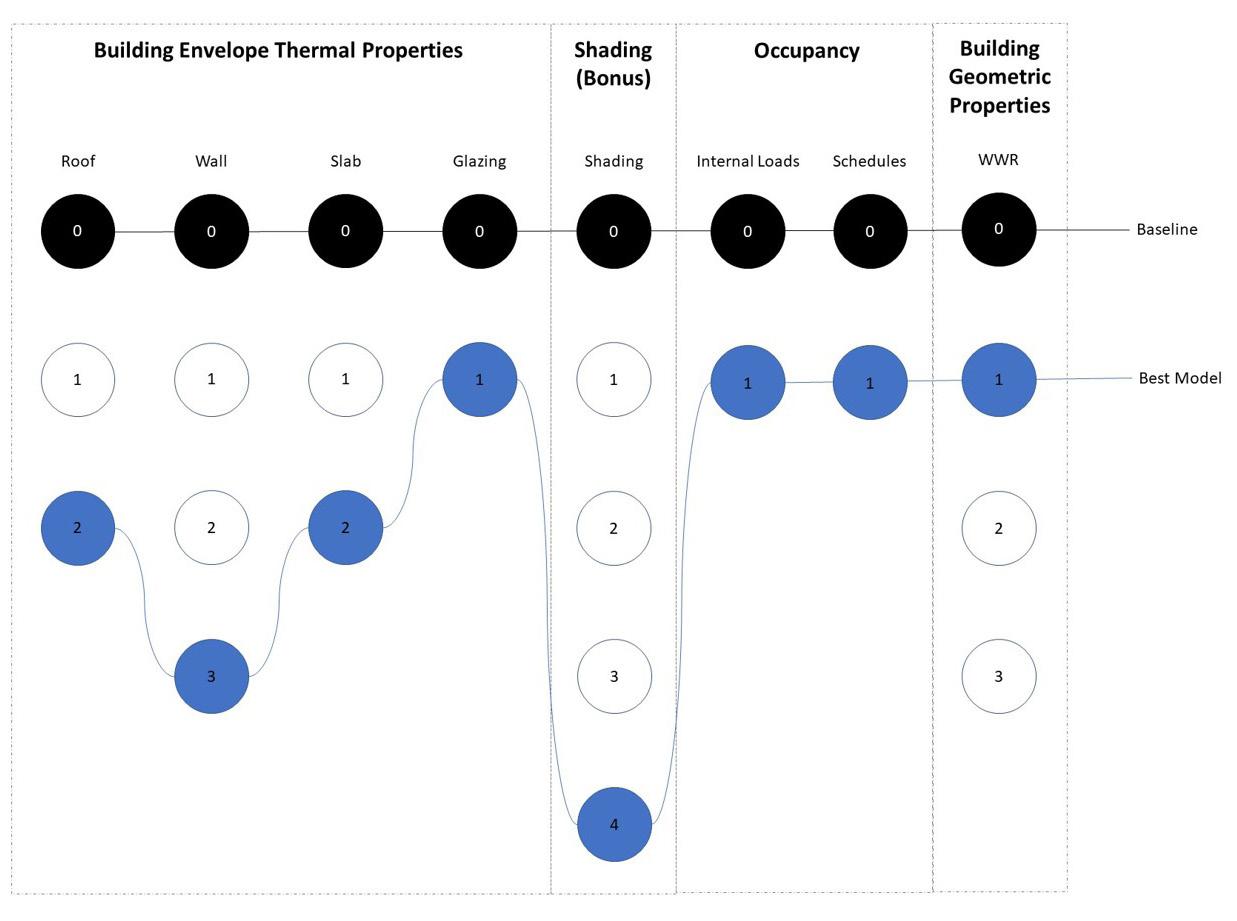
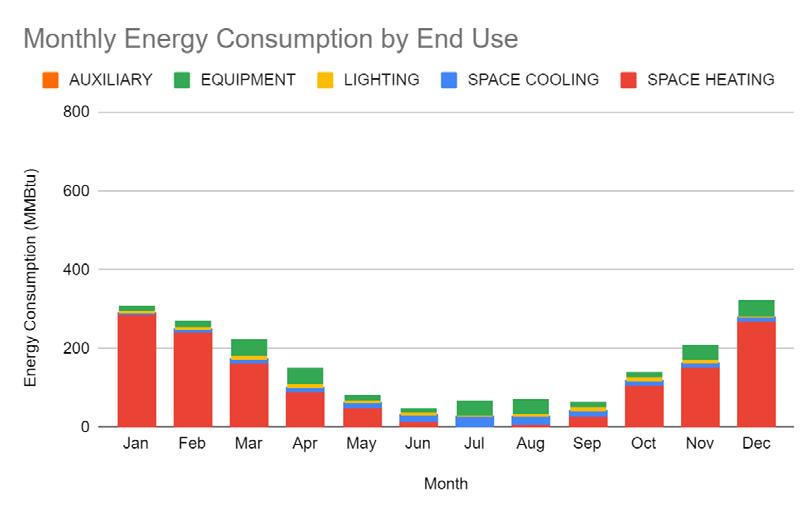
All the key variables decreased during the iterations
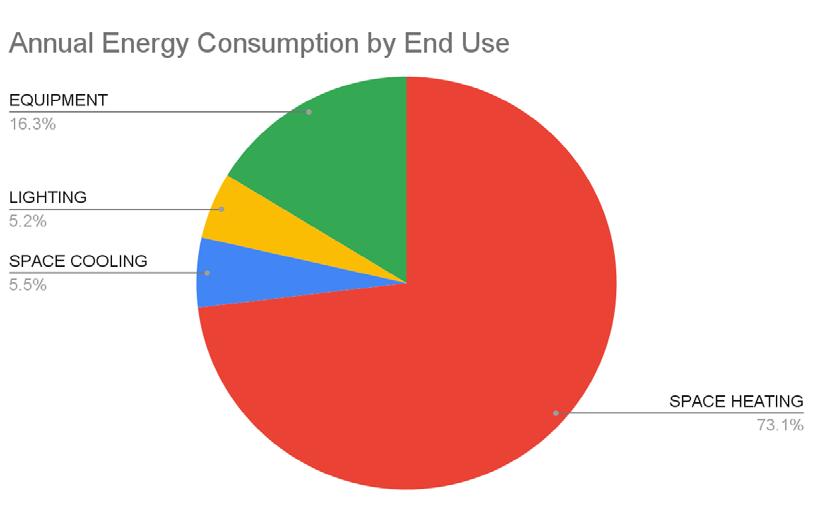
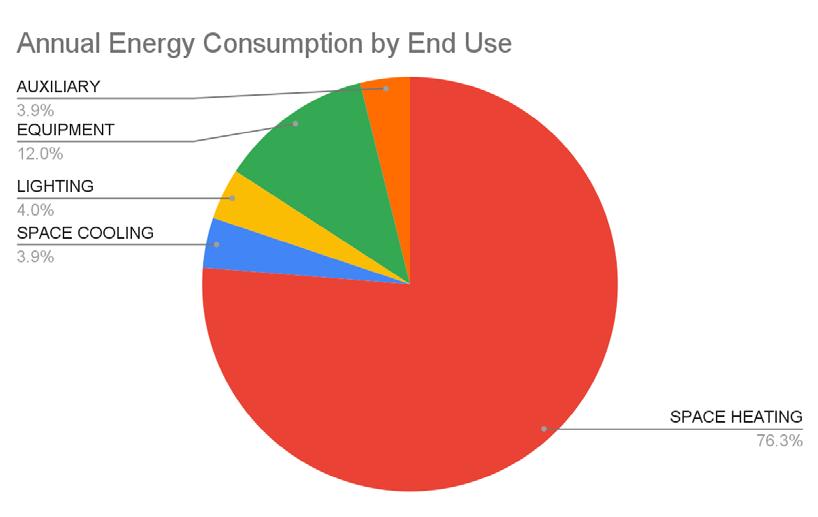
Conclusion & Recommendations
To prioritize retrofits and renovations in Ansys Hall, we recommend focusing on increasing insulation for the slab and improving the thermal properties of glazing, if feasible. Following a targeted approach to thermal zoning is recommended. Prioritizing HVAC and lighting upgrades in high-traffic areas such as classrooms and lounges, while implementing energysaving measures like smart sensors in less frequently used spaces like corridors, can yield additional energy efficiency benefits.
05
Salsette-27
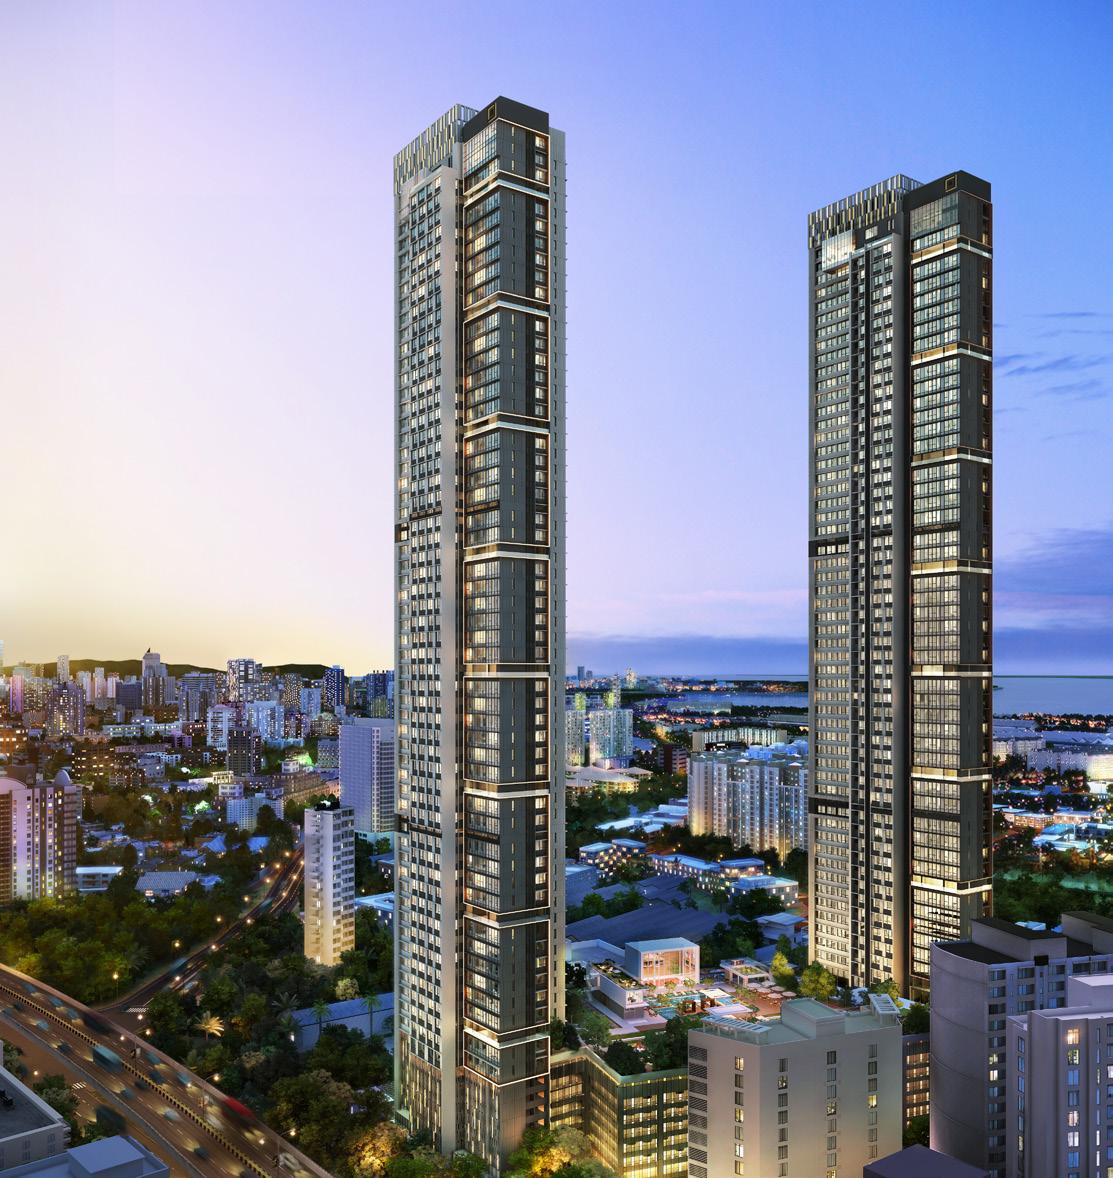
IGBC Platinum Pre-Certified Green Building
Professional Practice
Professional Practice: Samir Chinai Associates | 2019-2021
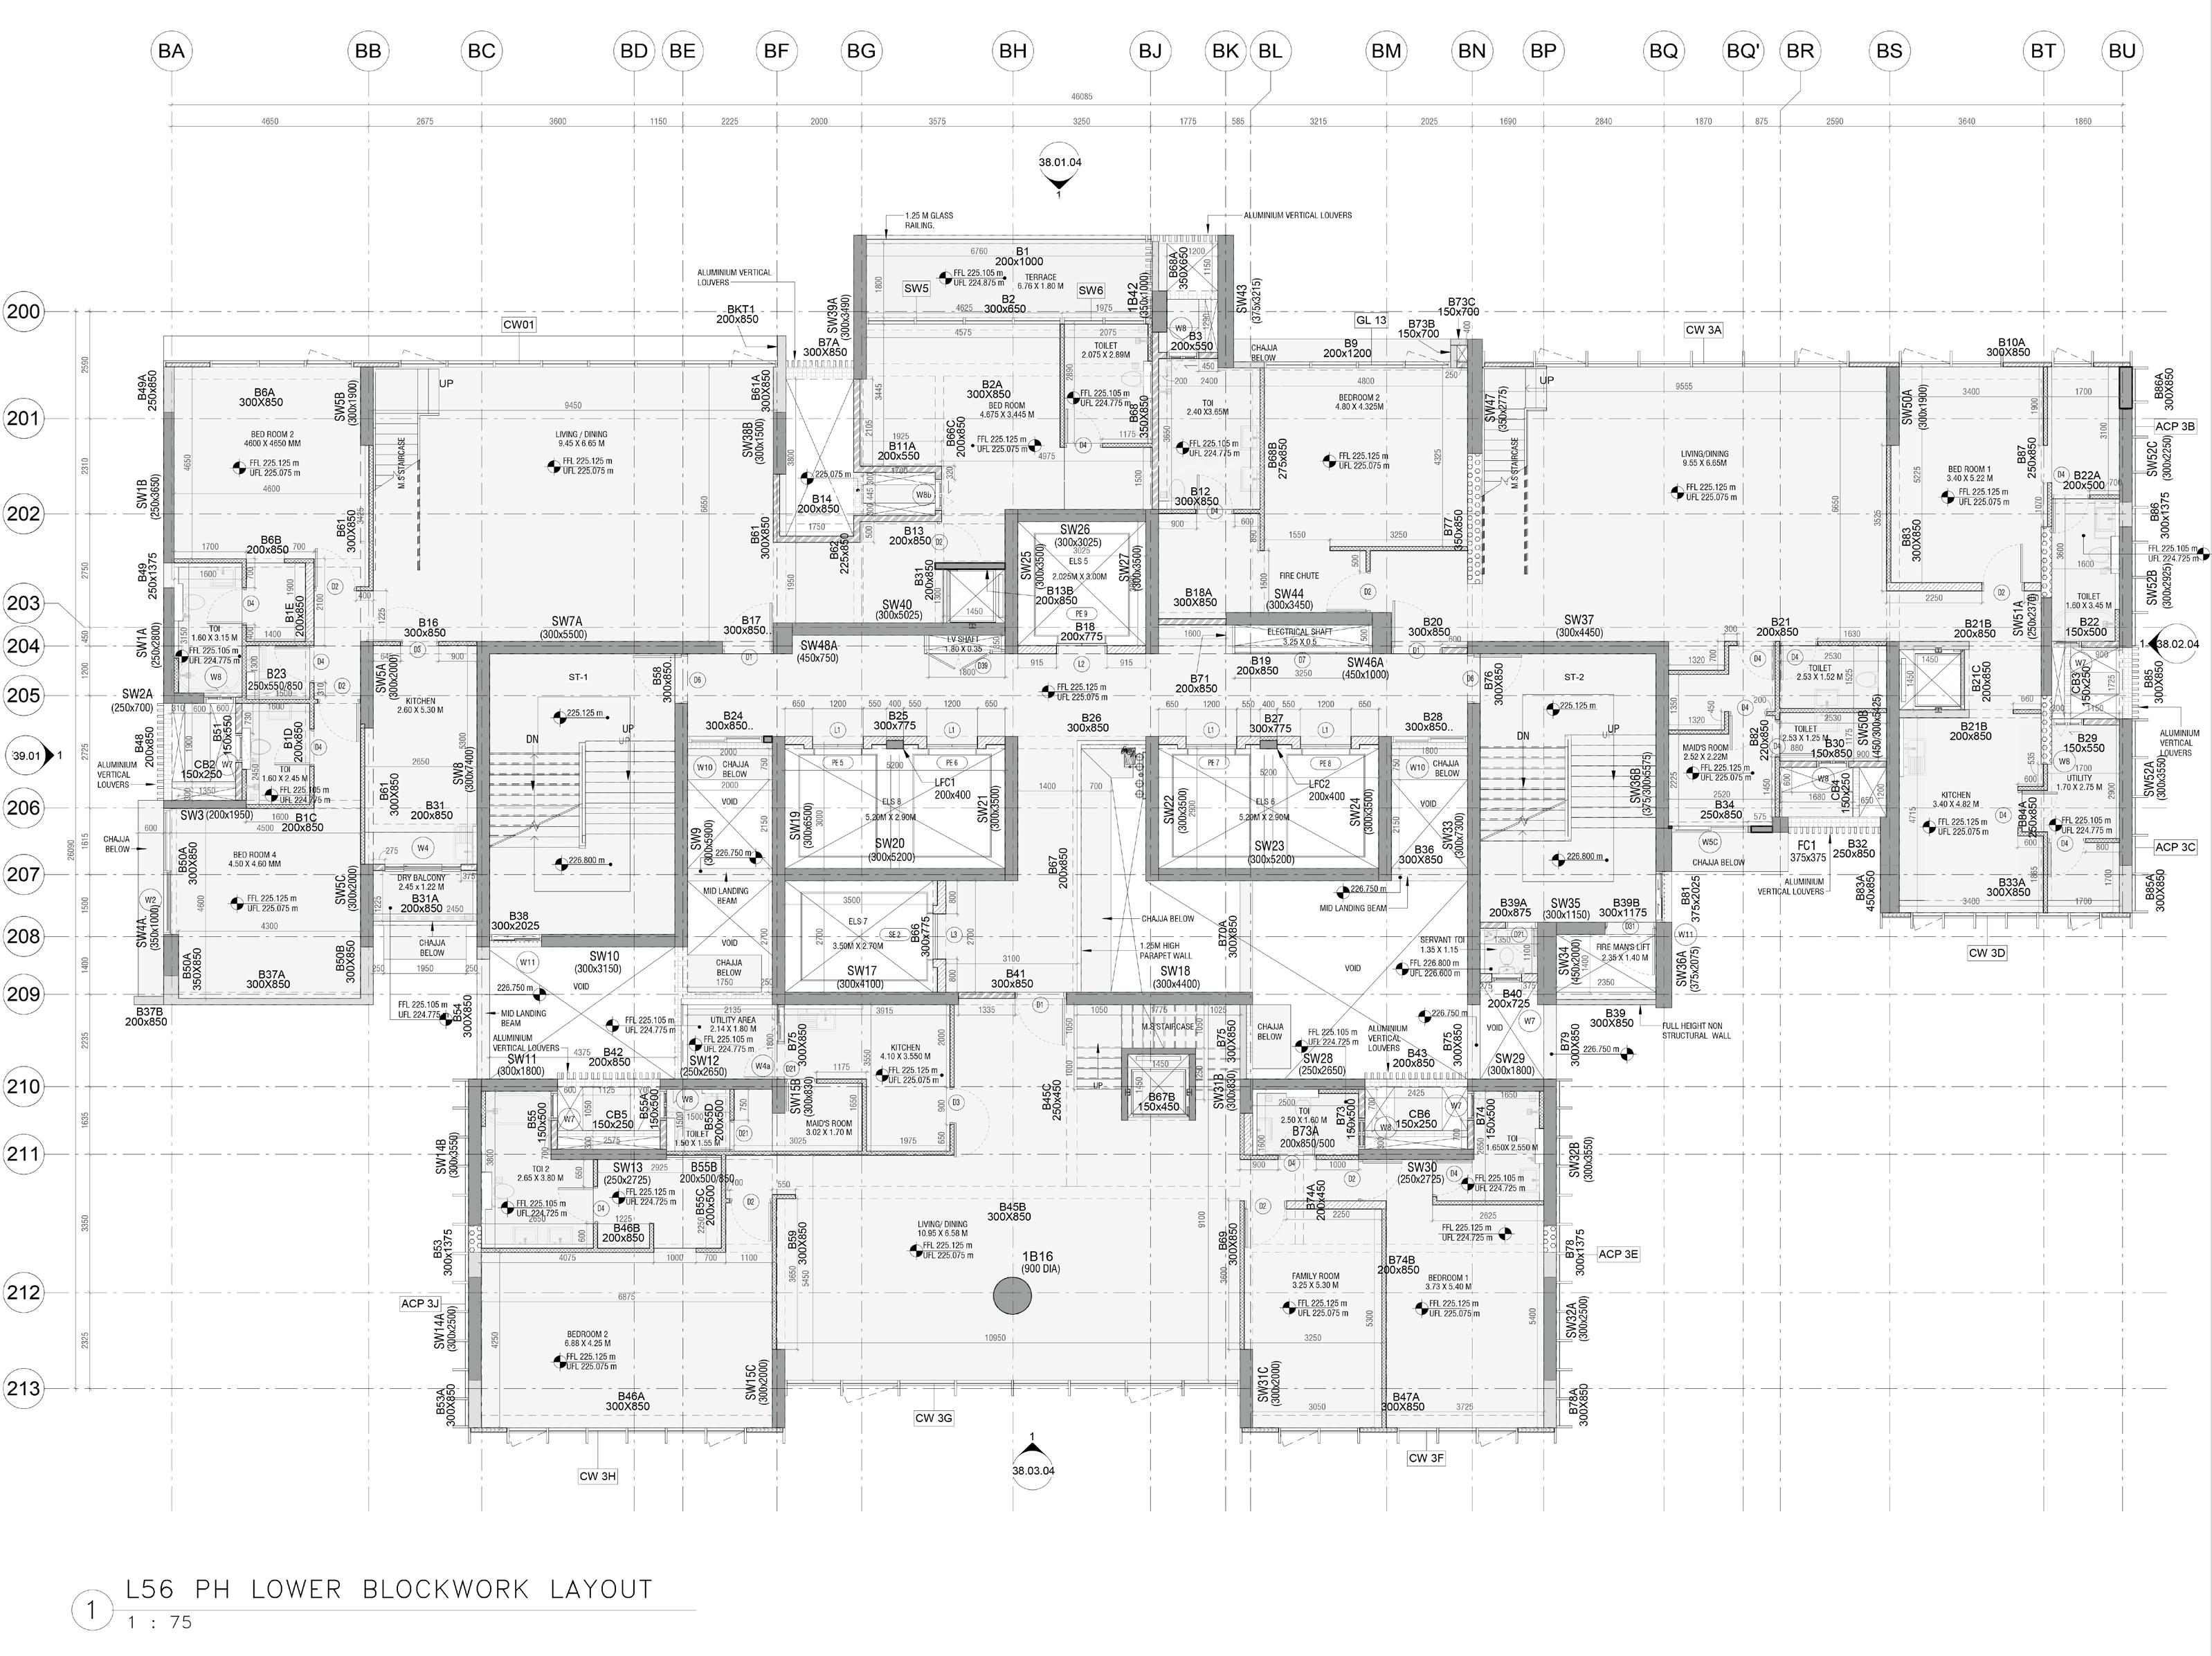
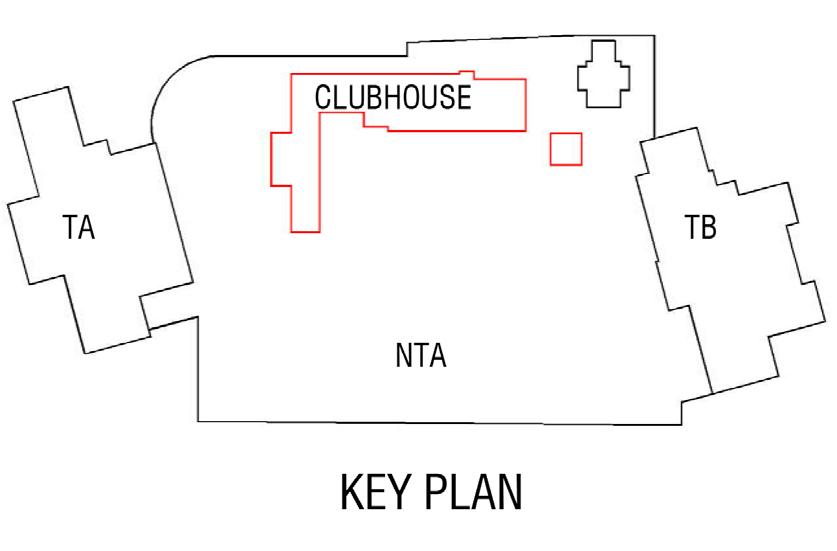
Location: Byculla, Mumbai | Project Type: Residential | Built-up Area: 544,523.40 sq. ft
Tools: Revit, Naviswork, Google Sketchup, AutoCAD
Type of Work: Team
My Role: Assistant Architect
Samir Chinai Associates (SCA) is a Mumbai-based multi-disciplinary firm providing comprehensive services in Architecture, Urban Planning, Interior Design, and Value engineering.
As an assistant architect I contributed to following services:
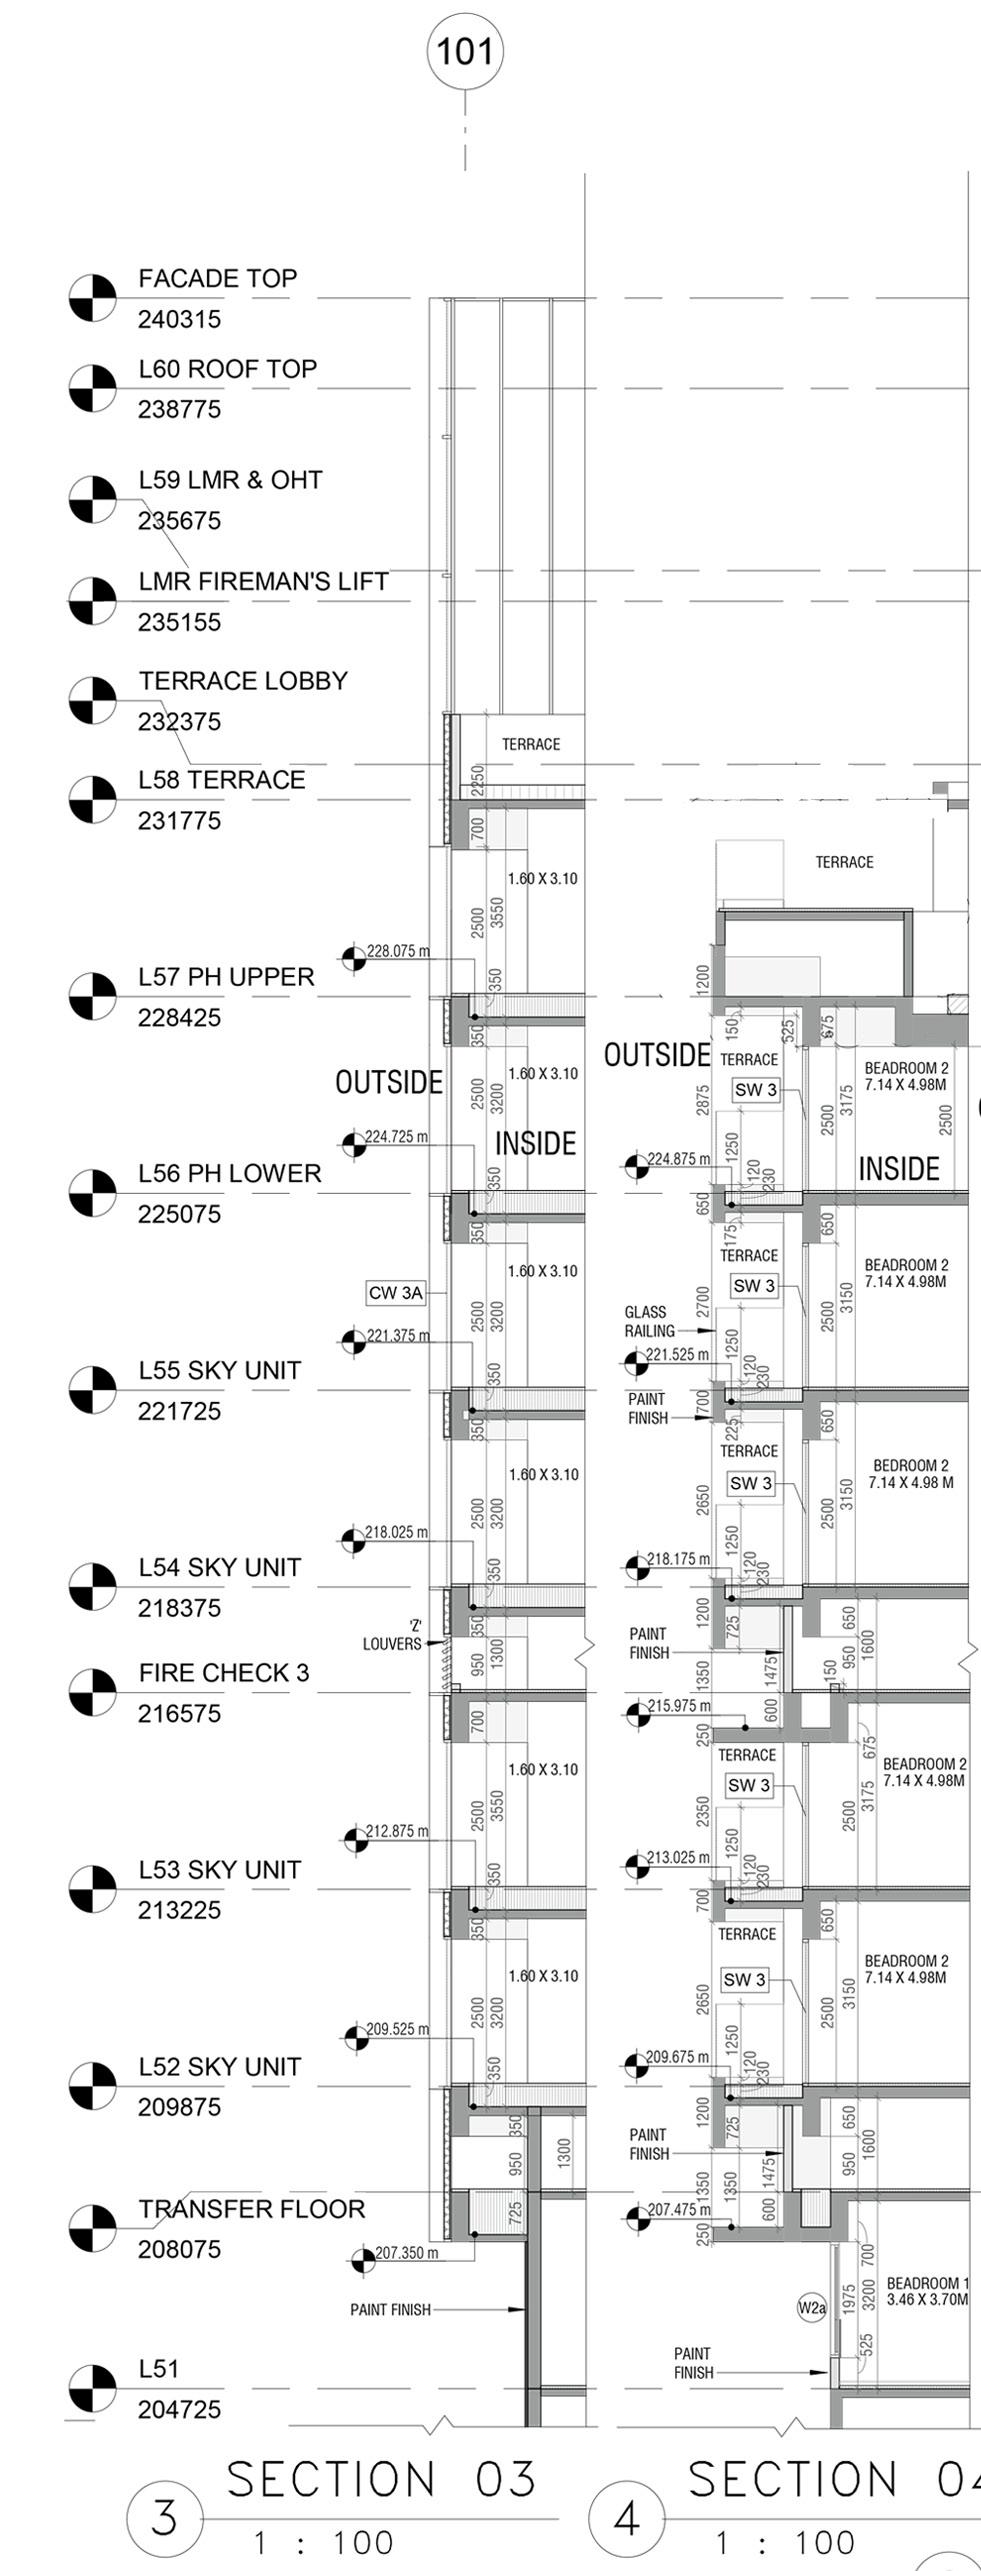
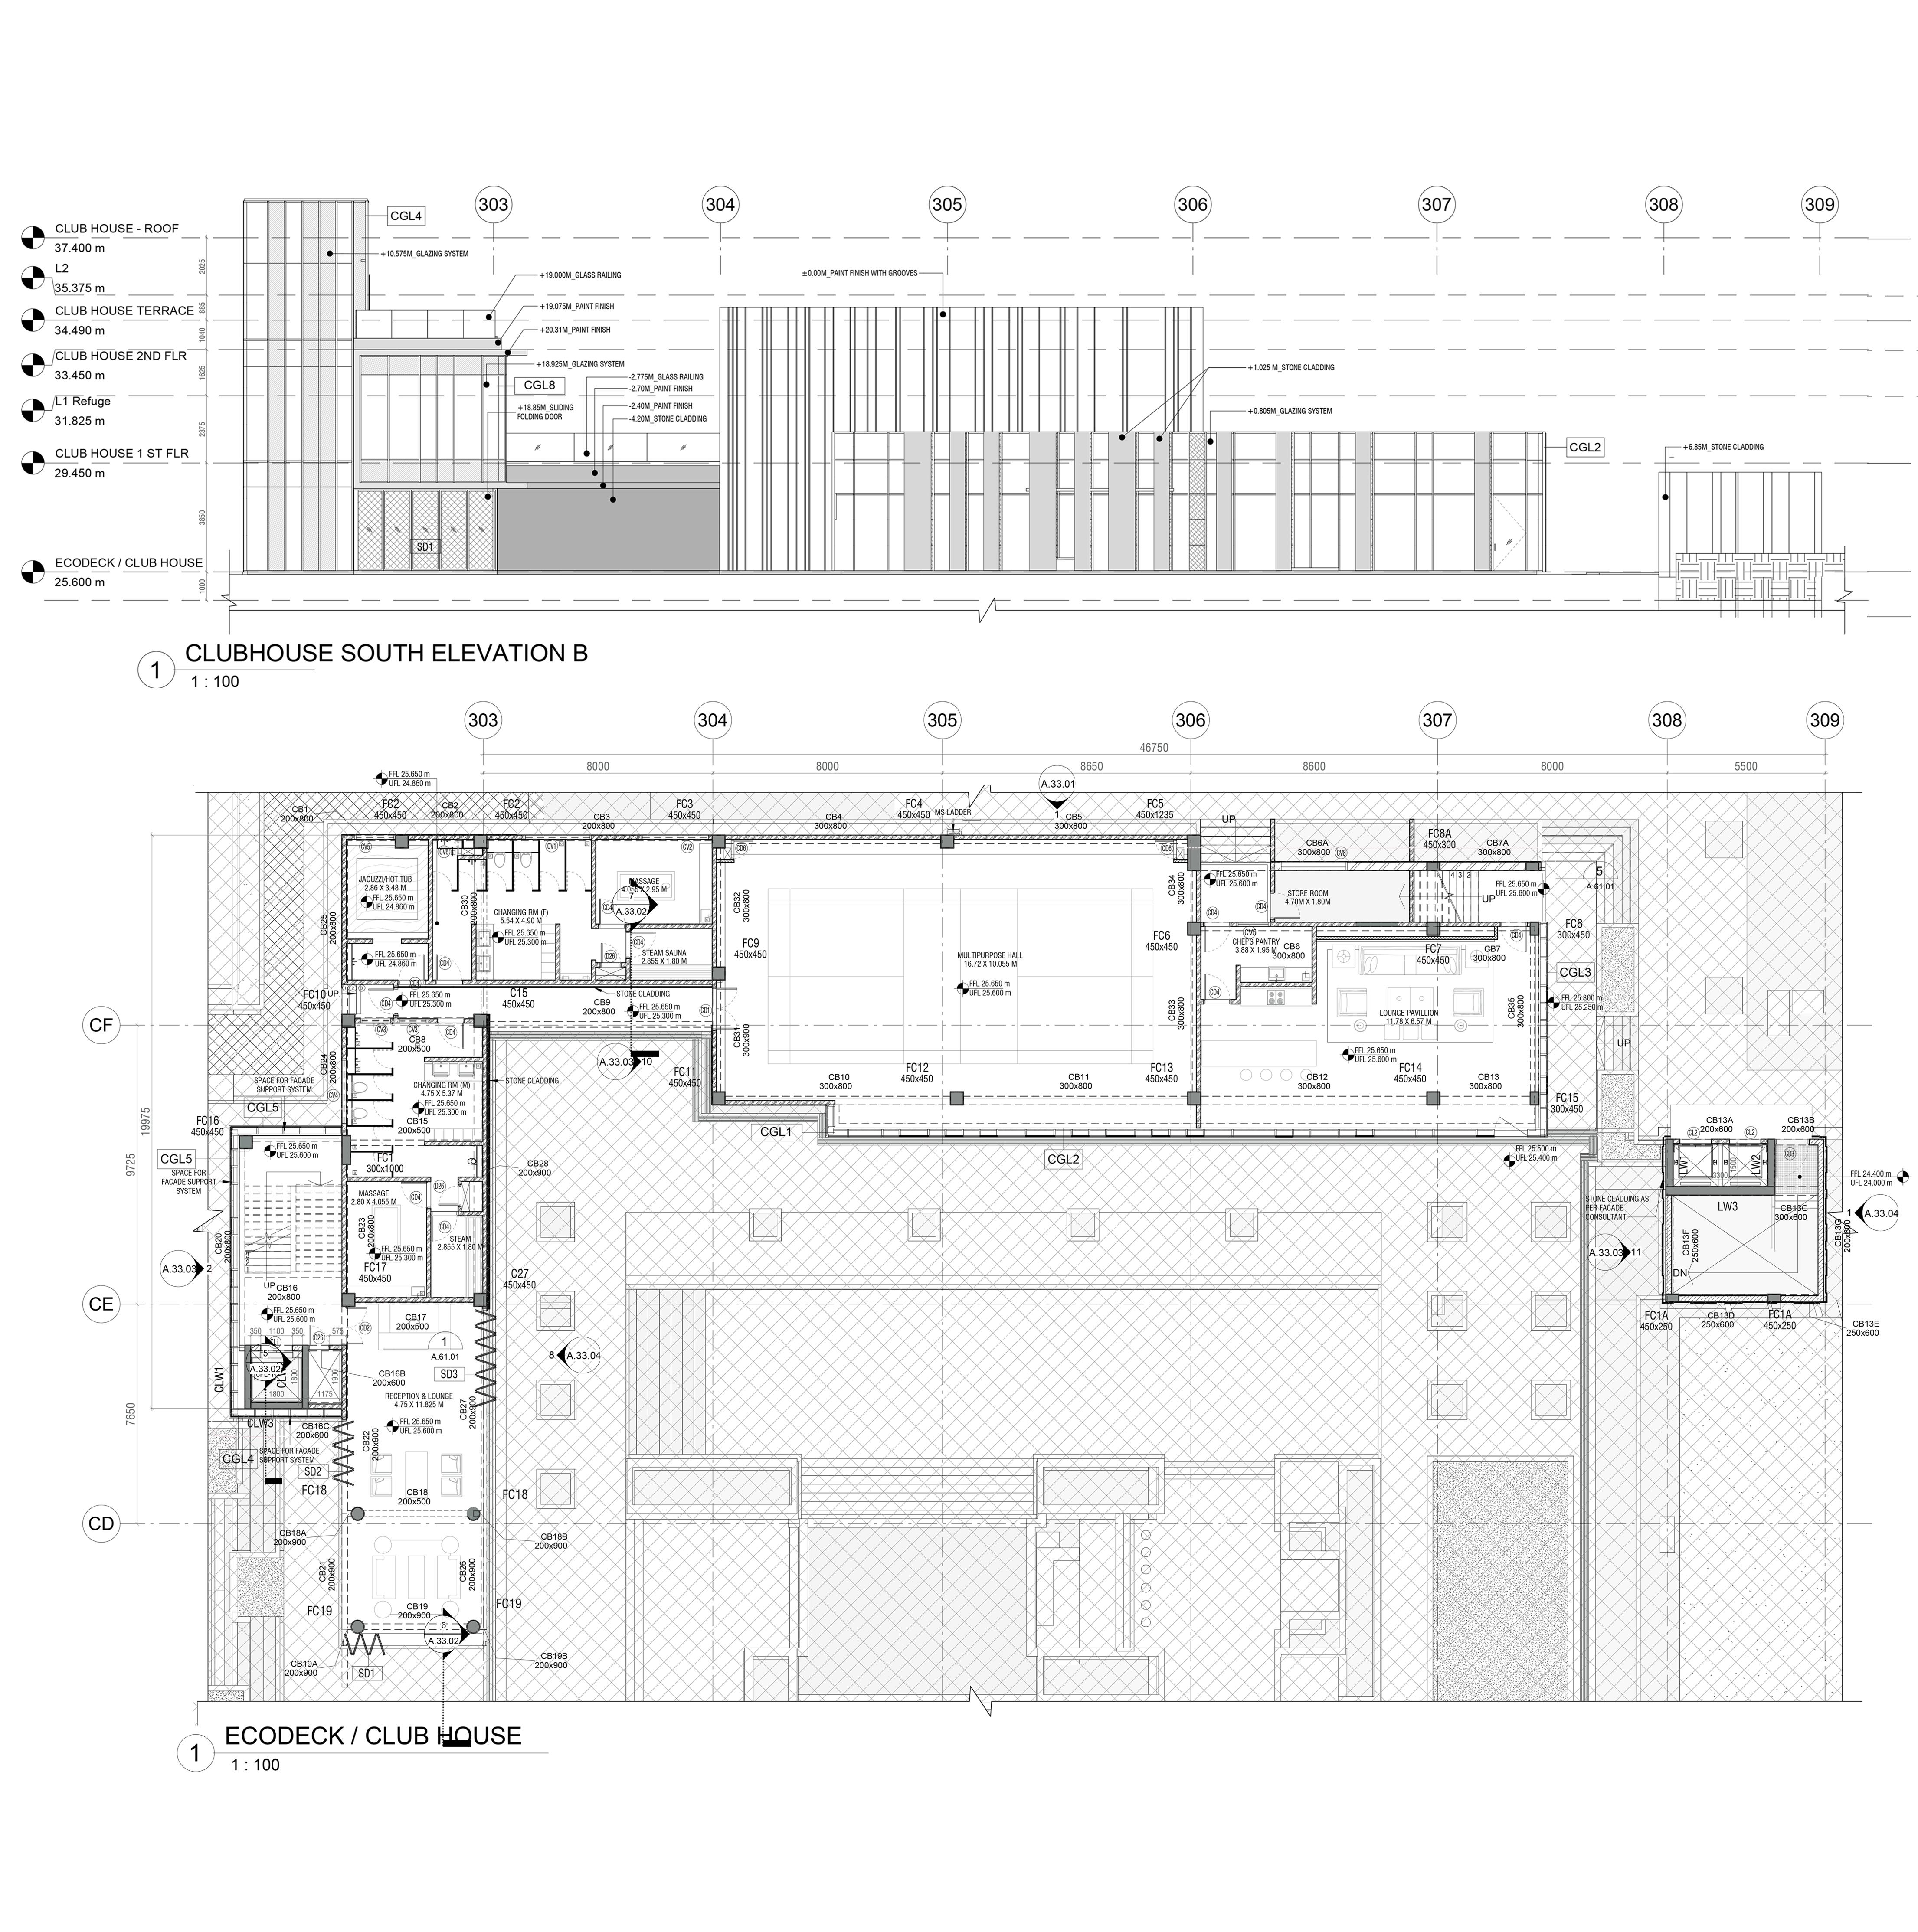
• Constructed G.F.C., technical details, and working drawings for Salsette-27 a high-rise residential project entirely developed using platform of BIM (LOD -3).
• Initiated paint scheme for entire Project.
• Produced 3-D visualizations & presentations, generated Clash Detection Reports using Navisworks and managed integrated models.
• Coordinated with site & consultants. Collaborated with team on BIM 360.
• Brainstormed massing strategies and shaped building block options for Palm Beach, Mumbai, a high-rise residential project.
• Drafted interior design layouts for a pet shop in Mumbai, revamped BOQs, & flooring layouts for turnkey projects.
• Conceptualized & developed facade and lobby Designs.



06
Rebrick Lay

A Custom Plug-in for Circular Economy
Application of Computational Design for Sustainability
Instructor: Jinmo Rhee
Scripting & Parametric Design | (MSSD) Carnegie Mellon University | 2022
Tools: Rhino, Grasshopper, & Gh Python
Type of Work: Teamwork with Sanjana Nagaraj
The project goal was to design and develop a custom Grasshopper Plugin, a toolkit that can support complex, repeated, or laborious design processes and helps designers explore diverse design solutions.
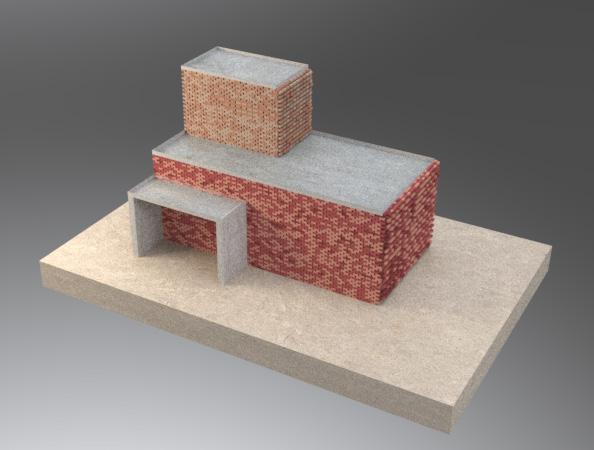
For this assignment, we focused on the circular economy. Almost 20% of C & D waste comprises bricks and more than 75% goes to landfills. There are many limitations in reusing these reclaimed bricks, which makes it difficult to use them. Thus, we created a customized plugin using ghPython, which can take the data of these reclaimed bricks and help designers, architects, and engineers to visualize n number of patterns and return an exact number of bricks used from each batch of bricks for it. This can reduce construction waste & encourage a circular economy in the building industry.
Algorithm
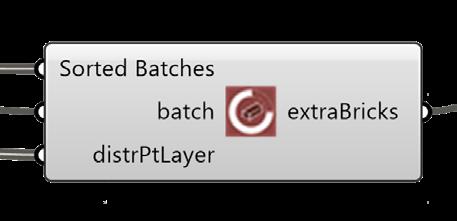
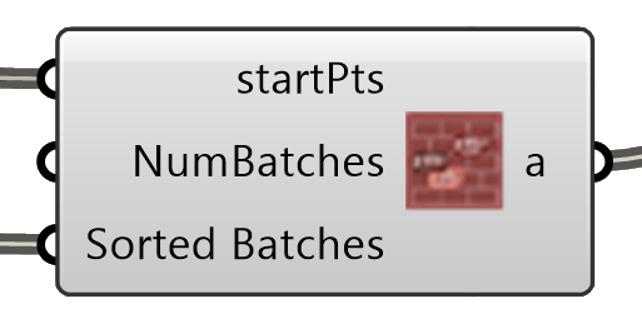
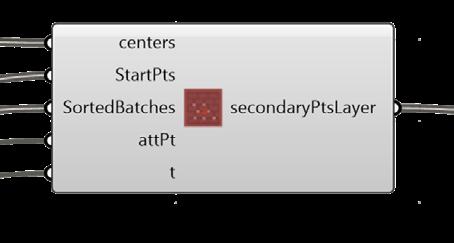
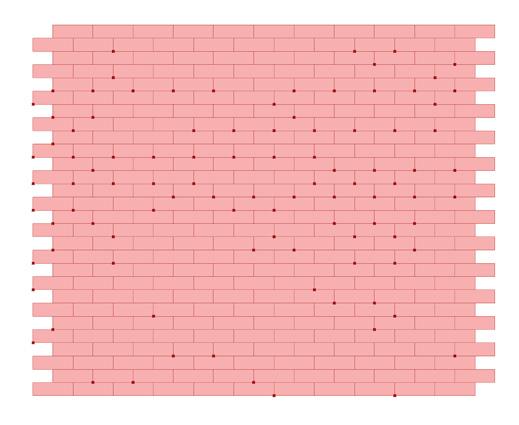
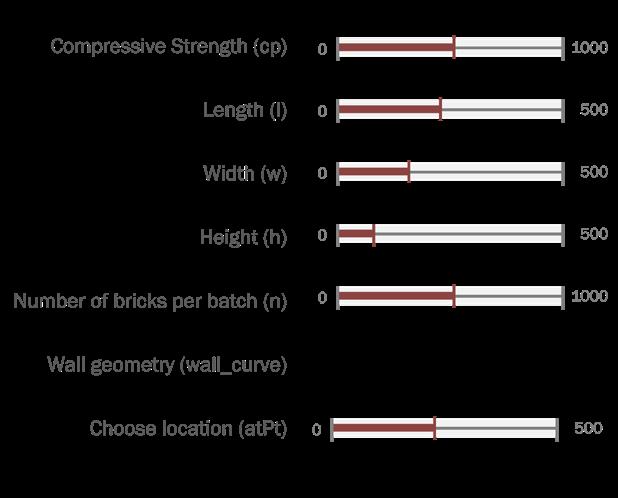
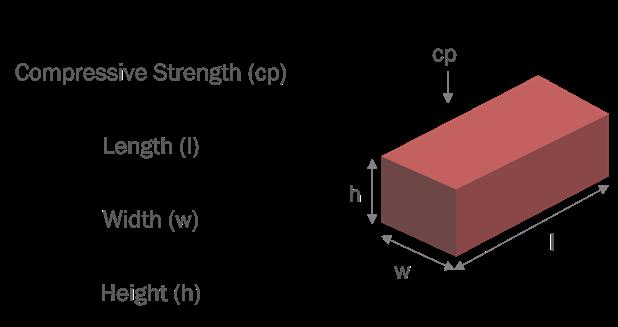
The algorithm for the plugin is divided into 6 parts from input to output. For input a brick batch parameter will take these parameters to create a 1-D list. Combine data will combine data from these lists to give a 2-D list. Apart from these users must select a wall geometry and an attractor point. These batches will get sorted based on their compressive strengths. Next it will access starting points of each panel, which will get divided in primary and secondary distribution to add bricks based on the given dimensions. At the end it will provide number of remaining bricks from each batch after their use for constructing the wall & create patterns. Users can select their preference through attractor point system.


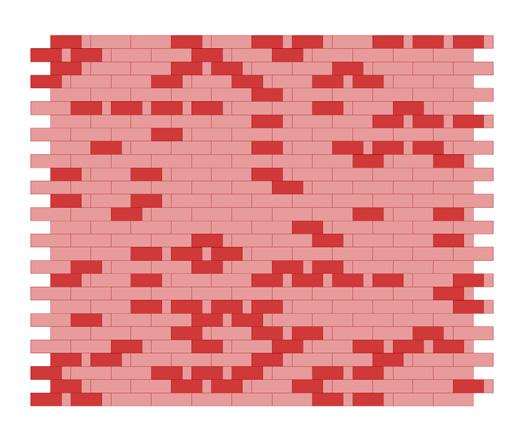
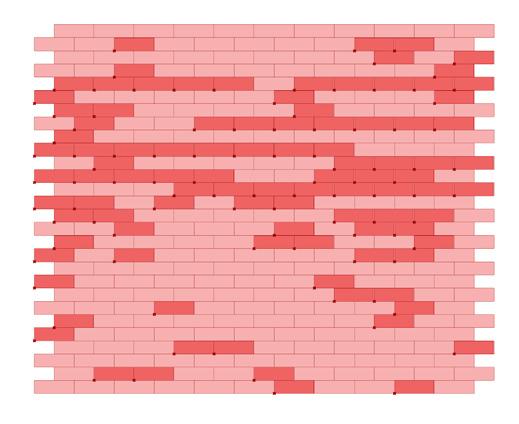


3.

Users can create n number of patterns from the reclaimed bricks through ‘Attractor Point System‘ & visualize them on the building geometry




The attached YouTube video here will demonstrate the geometric logic and the custom plugin components in detail

07
Passive Strategies for a Sustainable House
Application of Passive Design Strategies & Energy Modeling
Instructor: Vivian Loftness
Environmental Systems: Climates & Energy in Buildings | (MSSD) Carnegie Mellon University, PA | 2021
Tools: REM/Rate
Type of Work: Individual
The course explored architectural design strategies to enhance energy conservation and natural conditioning for improved human comfort across diverse climates by integrating comfort principles, heat flow, and local climate variables.
The course focused on the latest advancements in building energy conservation, passive heating and cooling technologies, and their integration into comprehensive design specifications. The objective of this projects was to create a professional energy consultant’s report outlining specific retrofit measures, including siting, massing, organization, enclosure detailing, opening control, and passive system integration.
For one assignment, I selected a 3-Bed & 2-Bath residence located in Torrance, California, housing a family of four. The detailed steps can be listed as follows:

• Performed site analysis including climate analysis through ClimateConsultant
• Analyzed existing building forms & organizations
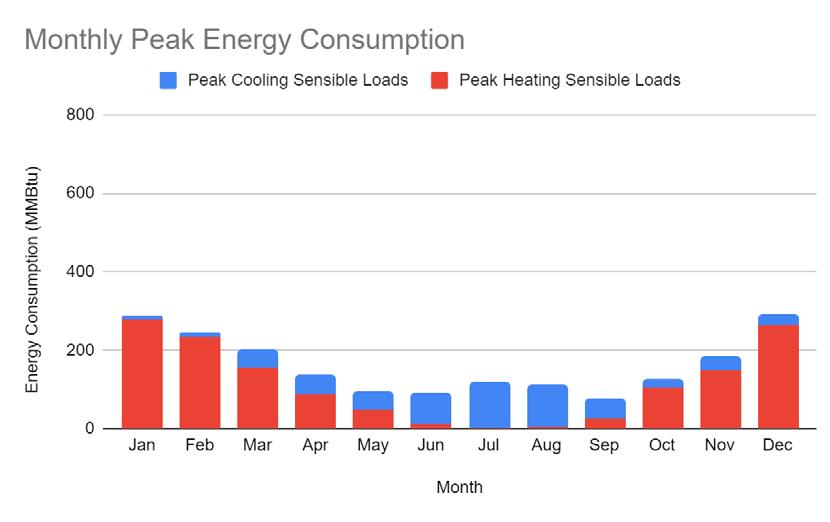
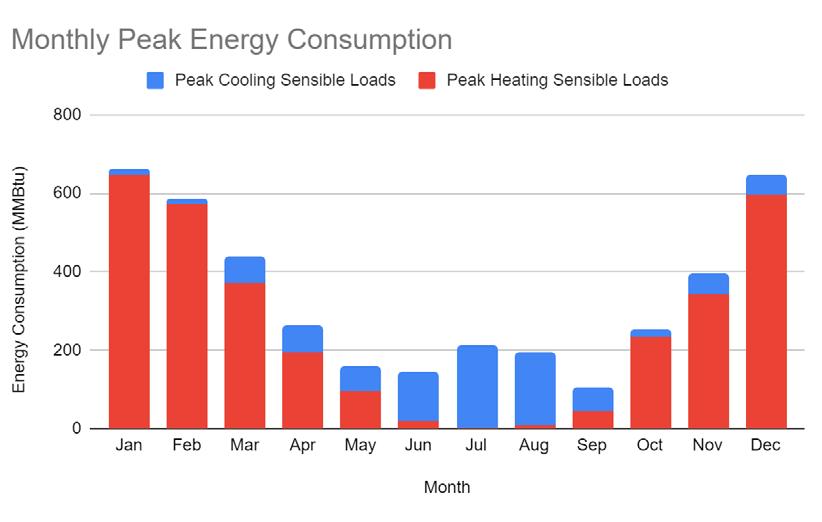
• Studied building details & Peak+ Annual Heat Loss Calculations for heat loss
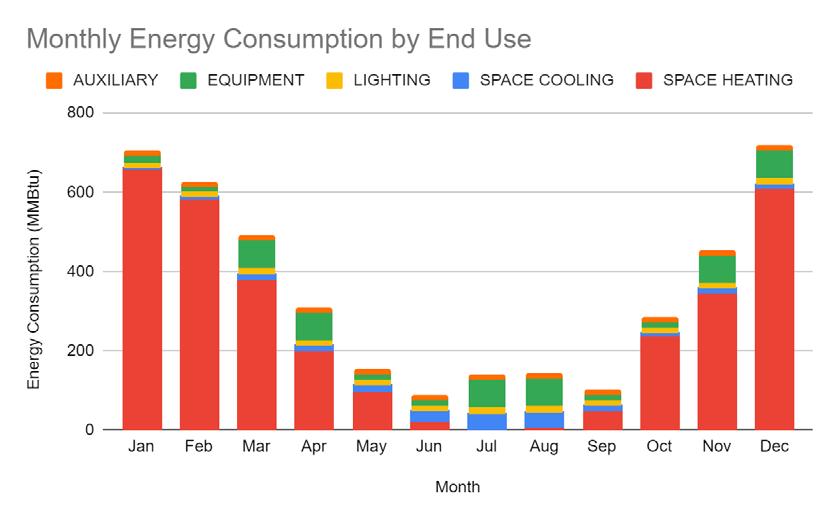
• Evaluated energy bills & systems for energy consumption study
• Conducted energy consumption analysis using REM/Rate for energy modeling
• Suggested strategies for passive heating & cooling along with improved outdoor living
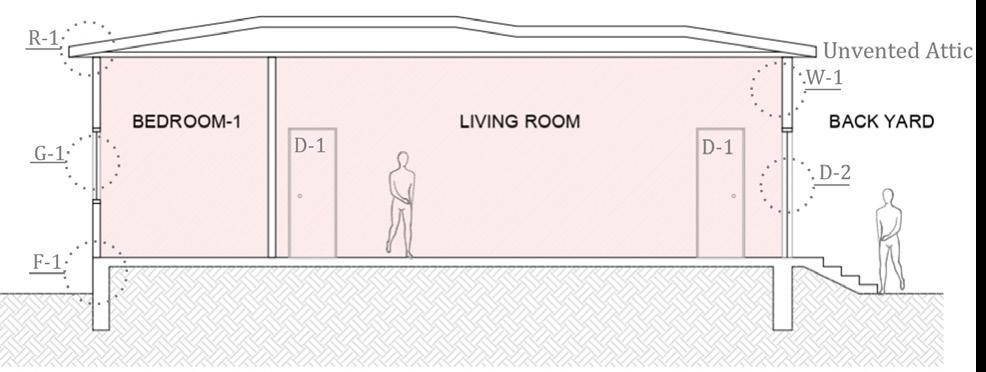
Section AA’
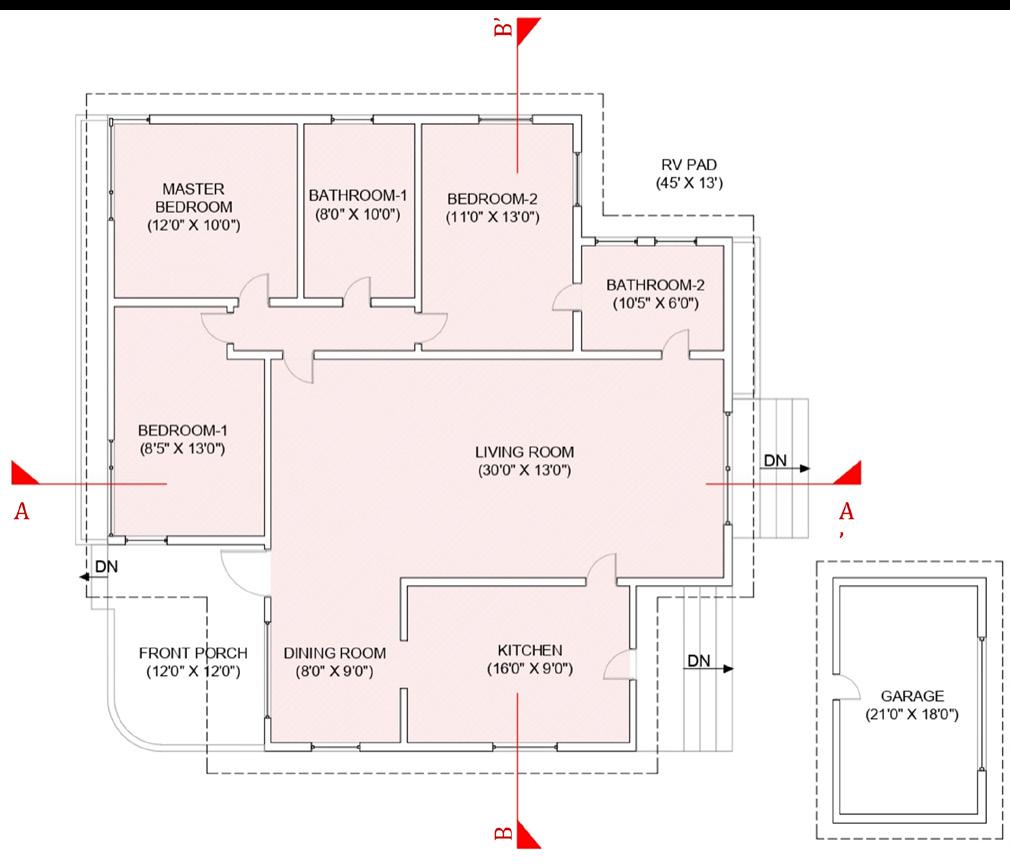
Section BB’
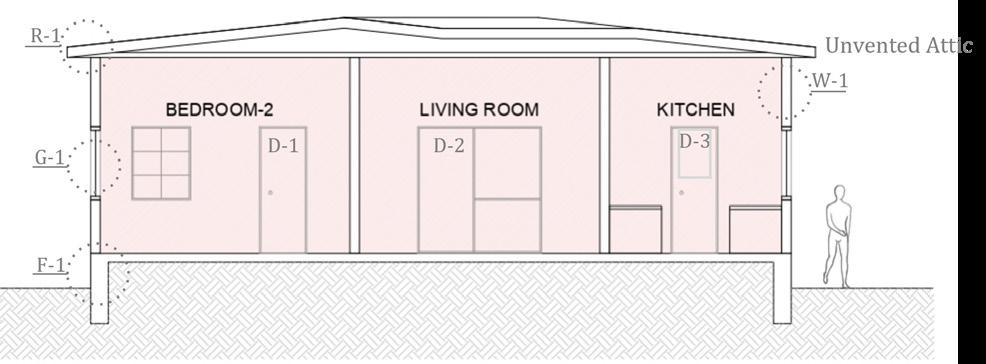
Plan (Left) & Sections (Right) representing Mechanically Heated Zones in the Home
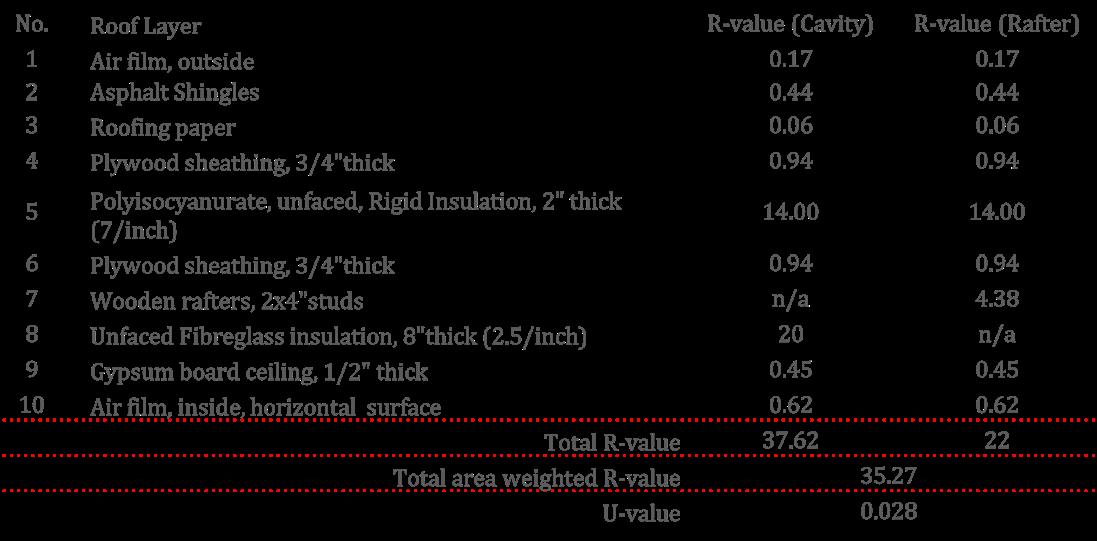
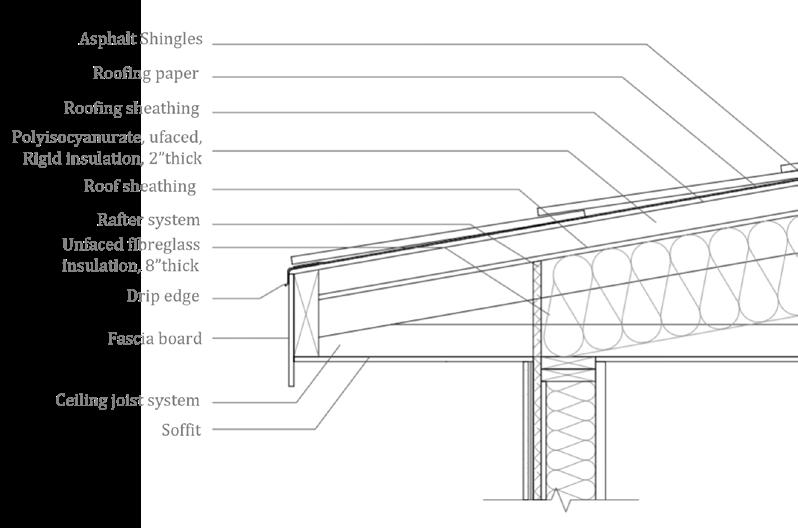
Detail R-1 (Roof to wall Junction)
Detail W-1(External wall assembly)

Detail G-1 (Window assembly)
Estimated Envelope Assembly Details for the Existing Home


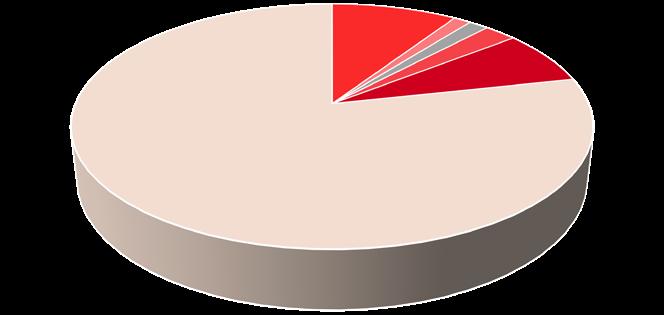
Breakdown of Heat Loss Sources

Breakdown of Energy Consumption Sources
Conclusion:
The provided pie chart (see reference a) illustrates that a significant proportion of heat loss occurs through infiltration, followed by flooring. Additionally, heating constitutes the main contributor to energy consumption (refer to b). Therefore, it is crucial to enhance the building’s insulation, improve energy efficiency, and minimize energy usage.

Recommendations
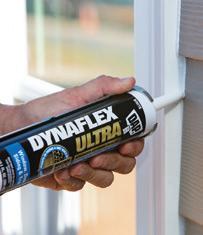
1. Caulking Infiltration Reduction Dynaflex Ultra 10.1 Oz Clear
$ 6.98, of Units : 6,10
Cost: 111.58/-
Previous Infiltration UA : 1,370.34 Btu/hr°F
New Infiltration UA : 1,096.28 Btu/hr°F
Previous Annual Energy Cost: $3,024/-
New Annual Energy Cost: $2,420/-
Annual Money Saved: $604.80/-
Payback: 2 months Weatherstripping Infiltration Reduction MOPMS Draft Stopper Sweep, Door Weatherproofing Stripping

2. Light Bulbs Energy Efficiency LED Bulbs

$ 5.23/- of Units : 2
Previous Annual Energy : 1024 kWh (Lighting)
New Annual Energy: 1,008.4 kWh
Previous Annual Energy Cost: $3,024/-
New Annual Energy Cost: $2,978/-
Annual Money Saved: $46.00/-
Payback: 2 months
3. Power Strip Energy Efficiency Trickle Star 7 Outlet Advanced Power Strip

$ 25.99/-
Previous Annual Energy : 4600 kWh (Appliance)
New Annual Energy: 2,392 kWh
Annual Energy Saved: 2,208 kWh

Previous Annual Energy Cost: $3,024/-
New Annual Energy Cost: $2,472/-
Annual Money Saved: (2,208) x (0.25)= $552/Payback: 9 months
Before adoption of Retrofits & Recommendations
4
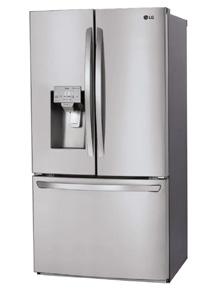
5. Refrigerator Energy Efficiency Smart wifi Enabled
$
Previous Annual Energy Cost: $3,024/New Annual Energy Cost: $2,897/-
1.5 year
Previous Annual Energy : 4600 kWh (Appliance)
New Annual Energy: 3,935 kWh
Previous Annual Energy Cost: $3,024/-
New Annual Energy Cost: $2,828/-
Annual Money Saved: $196.00/Payback: 1.4years
Previous Monthly Use : 160 Gallons (Appliance)
After adoption of Retrofits & Recommendations
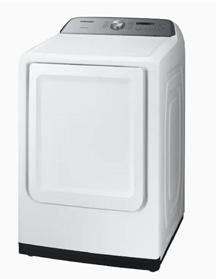
7. Dryer Energy + Water Reduction
Samsung Top Load Electric Dryer with Sensor Dry DVE50R5200W

8. Shower head Water Reduction High Sierra’s All Metal 1.5 GPM High Efficiency Low Flow Shower head

1
New Monthly Use : 95 Gallons
Previous Annual Energy Cost: $3,024/-
New Annual Energy Cost: $2,800/-
Annual Money Saved: $7.00/Payback: 1.5 years
Cost/Unit: $ 777.00/No. of Units : 1 Total Cost: $777.00/-
Previous Annual Energy : 4600 kWh (Appliance)
New Annual Energy: 3,956 kWh
Previous Annual Energy Cost: $3,024/-
New Annual Energy Cost: $3,000/-
Annual Money Saved: $14.00/Payback: 5 years
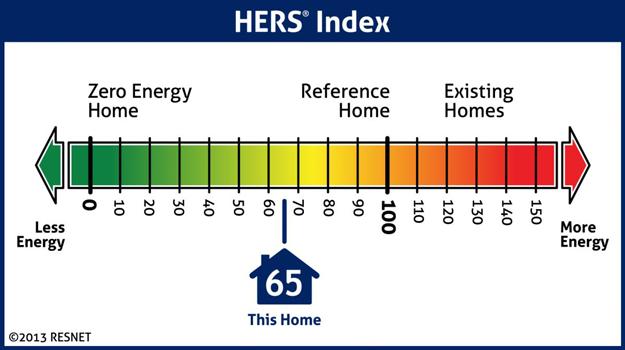
The above illustration suggests that this home stands on 65th level on the HERS© Performance Index, thus making it 35% more efficient than the standard house on the scale after adoption of retrofits & recommendations

Cost/Unit: $ 49.95/-
No. of Units : 2
Total Cost: $99.99/-
Previous Monthly Use : 2400 Gallons
New Monthly Use : 1440 Gallons
Previous Annual Energy Cost: $3,024/-
New Annual Energy Cost: $2,896/-
Annual Money Saved: $128.00/-
Payback: 1.1 years
Panels
Cost/Unit: $ 384.70/-
Area covered: 120 sq ft.
No. of Panels : 12
Total Cost: $3,847/-
Previous Annual Energy : 5,624kWh (Total)
New Annual Energy: 2,067 kWh
Annual Energy Produced: 3,557 kWh
Previous Annual Energy Cost: $3,024/-
New Annual Energy Cost: $2,161/-
Annual Money Saved: $863.00/-
Payback: 4 years

