9 minute read
Latin American RAC Activities Calendar
Jan
Activities
Advertisement
5 SEG Latin America RAC January Meeting
LARAC Survey
Feb
2 SEG Latin America RAC February Meeting
21-25 Webinars "A seismic attribute based case study on Penobscot, Nova Scotia", in English / Spanish / Portuguese
2 SEG Latin America RAC March Meeting
Mar
9 – 10 3
rd Virtual Student Conference
23 Webinar Exploracion en Peru, Federico Seminario
30 4th Newsletter 2021
Apr
6 SEG Latin America RAC April Meeting
13 Webpanel 'Urban geophysics'
25-29 Webinar "Introduction to seismic attributes" - spanish
SEG Scholarships
Applications accepted up to 01 March 2022 for the 2022-2023 academic year!
Access https://seg.org/ Scholarships
SEG LARAC 1st Virtual Student Conference 2020: Top 3 Abstracts Winners
By Terrell Dhanpaul
Carbonate reservoirs in the Brazilian pre-salt are responsible for more than 70% of all the country's hydrocarbons production. These reservoirs are complex due to their great heterogeneity. The fact also that they do not have modern analogues make them more interesting with respect to uncertainties regarding their lacustrine sedimentation dynamics. In addition, these reservoirs are located at depths greater than 5,000 m usually below a thick evaporitic layer that has complex geometries, such as, salt domes and mini -basins with stratifications of different types of salts.
Hello folks and welcome again to the SEG LARAC Technical Corner in this edition. In this article, we apologize for belatedly highlighting the three best abstracts of the 1st SEG LARAC Virtual Student Conference (VSC) that was held back in November 2020. As you may recall, the 1st VSC was a very successful event that was coordinated entirely by a very hardworking committee of students. Student presenters from across the LARAC region also took advantage of the opportunity to showcase ongoing and completed projects to a wide audience. Thanks to all the winners as well as all who submitted abstracts and all the members of the organizing committee which was very capably led by Isabela Dantas de Albuquerque for a truly fantastic job. The 2nd VSC held last month in November 2021 was also an equal success. The top three abstracts selected were Raquel Macedo Dias (1st), Thiago Rebeque Carvalho dos Santos (2nd) and Lidia Waltz Calonio (3rd). All three awardees were from the Universidade Federal Fluminense in Brazil.
1st Place: PRE-CONDITIONING OF PRE-SALT SEISMIC DATA
by Raquel Macedo Dias, Universidade Federal Fluminense, Brazil
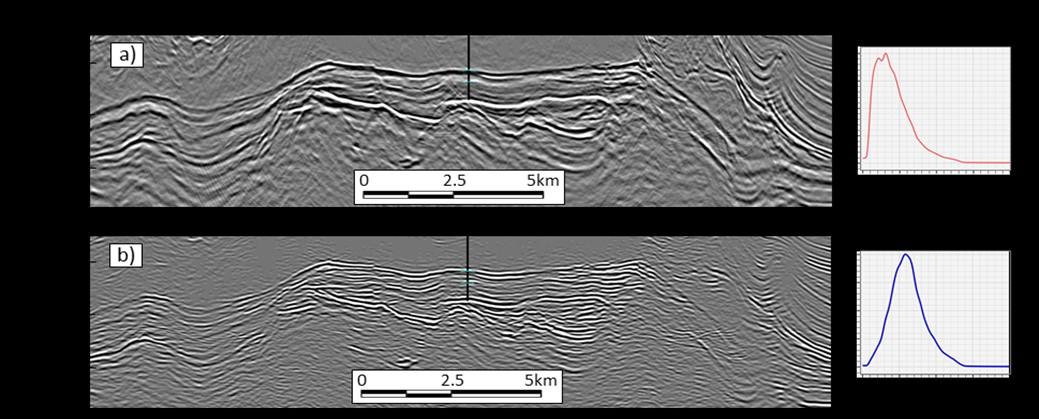
Figure 1. a) Original seismic section and frequency spectrum in the pre-salt area. b) Pre-conditioned seismic section and frequency spectrum in the pre-salt area showing reduction of migration smiles and increase in resolution.
These characteristics are challenging for seismic imaging due to several factors related to the propagation of seismic waves, such as diffraction and seismic attenuation effects, that directly impact signal-tonoise ratio. This work aims to propose a preconditioning workflow for poststack seismic data to remove noise known as “migration smiles” and increase the seismic resolution within an interval of the pre-salt reservoirs. The data used are from the Buzios Field, which is considered the largest oil field in Brazil.
To achieve these objectives, our method consisted in the application of a structural-oriented filter followed by an inverse Q filter in the wavelet transform domain. The results show that the structural smoothing filter was able to reduce migration noise with a negligible loss of frequency content. With the inverse Q filtering, the peak frequency increased from 16.8 Hz to 30.0 Hz. The seismic resolution was therefore substantially enhanced making it possible to better define thin layers and address the heterogeneity of the
2nd Place: ANALYSIS OF TUNING THICKNESS FROM ACOUSTIC IMPEDANCE USING A WEDGE MODEL
by Thiago R. C. dos Santos, Universidade Federal Fluminense, Brazil
Seismic inversion has been the subject of many studies and is an important step in reservoir characterization as it provides information on layer properties from seismic data. The vertical resolution of seismic data refers to the minimum thickness capable of defining a layer, ideally identifying the interval between the top and base of the layer. Depending on the acoustic seismic inversion method, it can increase the seismic resolution from the addition of low and high frequencies, thus managing to solve thinner layers. Knowing the minimum layer thickness is important in the feasibility study for the exploration, characterization and monitoring of reservoirs from seismic attributes. This type of understanding becomes even more necessary and challenging in complex reservoirs in knowing whether the reservoir is thick enough to assist with exploitation opportunities.
This work describes how the thickness of a layer computed from acoustic impedance using a transition window of the smoothed model varies with the cutoff frequency.
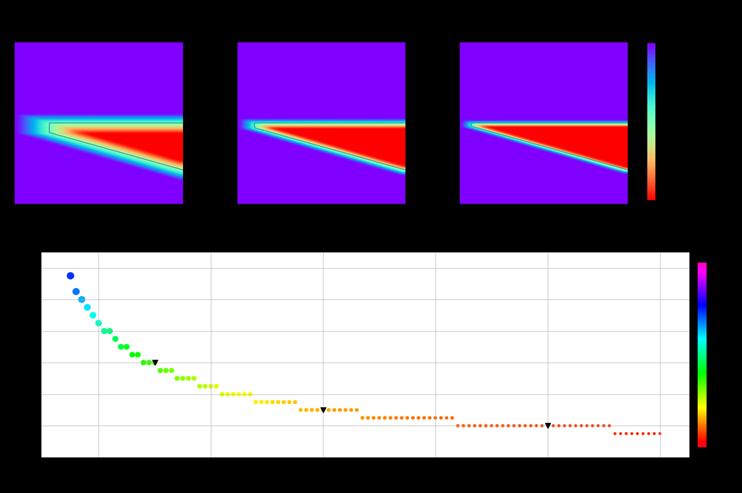
Figure 2. Smoothed models with main frequencies and below the minimum inversion thickness for different cut-off frequencies showing an inverse proportional pattern. Black triangles highlight the cut-off frequencies for each model above at 30 Hz, 60 Hz and 100 Hz respectively .
We adopted high values of acoustic impedance corresponding to pre-salt carbonate reservoirs for the wedge model. Then, we smooth it out to evaluate different scenarios. Using the convolutional model and a Ricker wavelet of a peak frequency of 17 Hz, the tuning thickness was found to be 58 meters. On the other hand, for acoustic impedance data, this thickness decreases considerably, depending on the cutoff frequency. Results show a decrease of approximately 70 % in the minimum thickness varying the cutoff frequency from 30 Hz (30.0 m) to 100 Hz (10.0 m). In addition, there is a rapid increase in tuning thickness with a decrease in the cutoff frequency from 40 Hz.
3rd Place: INFLUENCE OF PYRITE AND CLAY MINERALS IN SATURATION CALCULATIONS AT THE POTI FORMATION, PARNAIBA BASIN: A CASE STUDY IN WELL 3-PGN-5-MA
by Lidia Waltz Calonio, Universidade Federal Fluminense, Brazil
This work presents a case study of Well 3-PGN-5MA for the petrophysical characterization of the reservoir of the Poti Formation, in the area known as Parque dos Gaviões, Parnaiba Basin. The reservoir in focus presents a problem of low resistivities related to the presence of clay minerals and other conductive minerals which is a common problem in the evaluation of well logs worldwide and directly impacts the water saturation calculations thus leading to underestimations of the hydrocarbon volumes available.
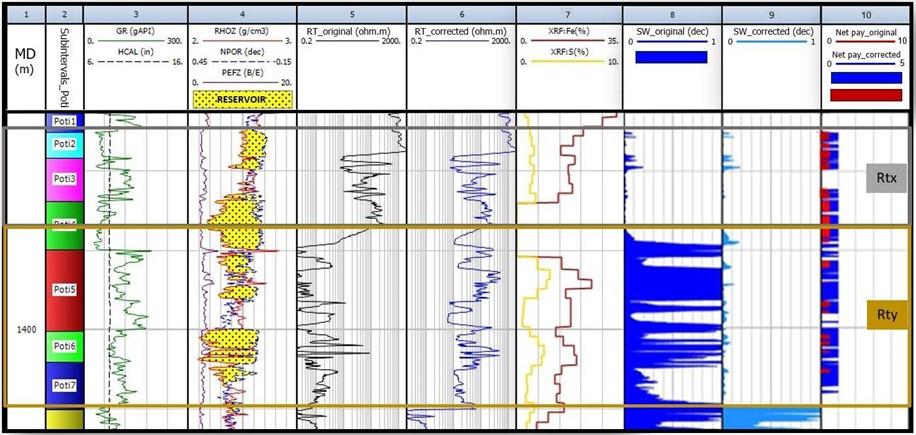
In order to mitigate this problem in gas-charged reservoirs, a workflow is proposed to characterize the main issue and correct the resistivity log to generate more realistic results in the reservoir evaluation. Well 3 PGN-5 shows a clear gas-water contact however when interpreted based solely on the resistivity log it underestimates the reservoir by as much as 49 meters. This was evident in the pressure gradient graph and the sharp separation of the density and neutron curves, suggesting a gas saturate interval, despite low resistivity values.
Integrated studies of X-ray fluorescence, gammaspectrometry and profile evaluation, accompanied by a detailed description of cutting samples identified pyritization and the presence of smectite and kaolinite in the interval where the resistivity decreases. The study proposes an alternative work methodology for the evaluation of the Poti reservoir using alternative techniques that try to reduce the influence of these minerals on the resistivity log thus improving the accuracy of water saturation and net pay calculations resulting in a better reliability of gas volumes in place. This workflow can be applied at reservoirs with similar characteristics thereby reducing costs and increasing the possibility of exploratory success.
Generating canopy height maps with Convolutional Neural Networks for Wind Energy Applications
Théotime Cano, Gibran Jalil Gibran Sulvaran Alpuche, Markus S. Gross, Vanesa Magar Universidad del Golfo de México
An important input of wind energy computational models is the roughness map, describing the interactions between air flows and earth’s surface at low altitude depending on, among others, the type of vegetation and the height of the canopy. Through the Objective Roughness Approach (ORA, Floors et al, 2018), the roughness map can be computed from a canopy height map.
The aim of this work is to compute those canopy height maps, using spaceborne LIDAR-based datasets and machine learning techniques, more specifically a Convolutional Neural Network (CNN). Indeed, these datasets are open source and much more accessible than airborne LIDAR-based datasets – which are often constructed from expensive missions – and Neural Networks have now been proven to be effective at finding the mapping function to compute a given target based on a given input, even in highly non-linear cases.
The data used as inputs are from ICESAT-2 and Landsat 8. 19 complex products, such as the Normalized Difference Greenness Index for instance, are computed by combining some of the 11 initial bands of Landsat-8, they are then added as inputs. Next, the features in the computation of the outputs are analysed and the most important ones are selected. The goal of this step is both to enhance the computational efficiency of the algorithm by working on a lighter input dataset, and to prevent overfitting.
The chosen target dataset is the 2019 Global Forest Canopy Height from GLAD using the NASA GEDI satellite. All datasets have a spatial resolution of 30m and the area of interest is the state of Puebla in México, containing pine forests in temperate and cold areas, tropical rainforests, grasslands and dry mountainous areas.
The CNN, made of 4 blocks of Separable Depthwise 2D Convolution, Batch Normalization and Activation layers (using LeakyReLU and a final Linear function) outputs directly the canopy height maps by bypassing the commonly used final Dense layer from most CNNs architectures. Figure 1 shows an example

Figure 1: (From left to right) (1) RGB image of the chosen area, (2) Tree height from the target dataset, (3) Tree height computed by the CNN, (4) Difference between target and computed values
Thanks to the canopy height model computed like so, we were able to compute roughness maps shown in Fig. 2, using an external land use map from the North American Land Change Monitoring System to deal with water pixels and the ORA equation.
Thus, we have proved the feasibility of combining spaceborne LIDAR dataset and CNNs to compute canopy height maps in a small region in the state of Puebla. Finally, we tested the algorithm on data from the state of Tamaulipas, México, giving satisfying results given the rather small training dataset used leading to a change of distribution in the datasets from Puebla to Tamaulipas. We also compared CNNs to another machine learning technique called Random Forest (RF).
Future analyses may include a thorough comparison of the results obtained with CNN and RF, and the addition of a temporal dimension of canopy height maps, which would evolve through leaf-on and leafoff seasons, using a LSTM-based architecture for example.
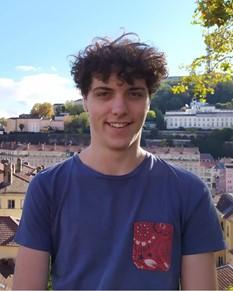
My name is Théotime Cano, I am a 21 years old French student and I joined the engineering school Ecole Nationale Supérieure des Mines de SaintEtienne in September 2019 after 2 years of preparation for the exam while I studied Mathematics, Physics and Computer Sciences. Then, I specialized in Fluid Dynamics and Numerical Simulation at school, Machine Learning and Deep Learning by following an online class from Stanford University and Mathematics at the Jean Monnet university, in Saint-Etienne. During the summer of 2021, I did a 3 month-long internship in the Physical Oceanography department of the CICESE in Ensenada, México, under the supervision of Dr. Vanesa Magar, whom I thank most deeply for the unique opportunity. The following abstract presents the results of this internship.
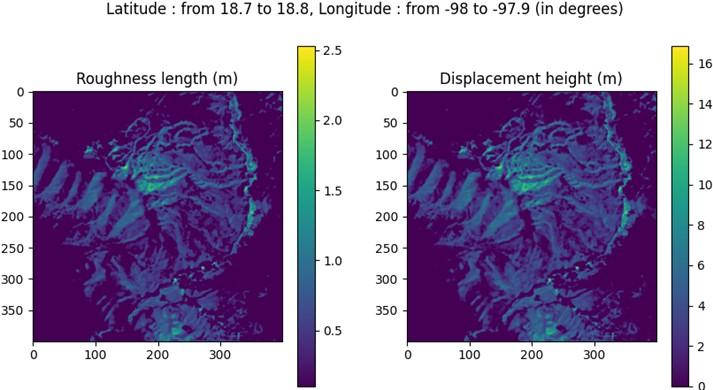
Figure 2: Roughness maps for the same area as Figure 1.
REFERENCES Floors R., et al. “From LiDAR scans to roughness maps for wind resource modelling in forested areas”. In: Wind Energy Science Discussions (Feb. 2018), pp. 1–29. DOI:10.5194/wes-2018
