
6 minute read
The Z-Code Oscillator


By Stefanos Pallas
Most people are familiar with stock market line graphs that track the progress of a particular stock’s value, much like the image below:
Advertisement

The Z-Code Oscillator is a successful tool for sports investing that serves a similar purpose to a stock market graph. The oscillator is a visual display of a team’s performance, which helps explain and predict performance trends. The Z-Code Oscillator helps make accurate predictions when used properly.
You can access the Zcode Oscillator for MLB and other sports here http://zcodesystem.com/mlb_oscillator/
The Z-Code Oscillator is a key parameter in sports predictions due to its simplicity. The oscillator line for a given team moves up and down with every win and loss. The progress of a given team in the Z-Code Oscillator depends exclusively on their performance. While the success and failure of a stock is dictated by volatile external factors (economy, politics, wars etc.), current trends in sports investing can often be explained through visual analysis because internal factors dictate performance. The performance of star players, injuries, and chemistry can directly impact the success of a team over time. If a roster must deal with injuries, poor performance, coaching changes, or a difficult schedule, the team is less likely to succeed. If a team is playing well, they can over-perform for a stretch of time. Because trends tend to last for multiple games, the oscillator can successfully predict outcomes based on visual analysis of recent performance.
The following example displays how the oscillator works:

The first step to using the oscillator is identifying the Delta number, which represents the overall difference in performance between the two teams through the season. Before considering the chart, the Delta number can give an indication as to whether there is value in a given line. After identifying the gap between the two teams, we consider each team’s oscillation chart. The winning performance peaks represent resistance levels for a team, while losing valleys form support levels. Resistance and support levels are key to interpreting the oscillator correctly. Resistance peaks represent the highest levels of success a team has achieved, and can sometimes depict a ceiling for their performance. Support levels represent a crucial point where a team desperately fights off a freefall effect from reaching a new low. You can expect a team to perform better as they hit support levels, but fall short at their resistance points. If a team breaks through their support levels, they are in a deep slump and may continue to lose. If a team breaks through their resistance levels, they set a new ceiling for their successes. In this way, the oscillator helps predict the beginning and end of performance streaks. Essentially, this is the basic value to the Z-Code Oscillator.
Let’s take a closer look at how the Z-Code Oscillator works:
When a team is winning, we can trace a straight line over all recent resistance points to the most recent peak to determine if they have broken resistance levels with their winning streak. If the projected end of the line crosses the chart line, the team has broken resistance is due for another win. If they are approaching the resistance level, they may be due for a loss. This process also works when a team approaches their support level. If a team has broken support level, they are likely due to continue a lengthy losing streak. If they are approaching support level, their losing streak may be coming to an end.
This process is outlined in the diagram below:
Interpreting the Example:

The first step shows a Delta differential of 10 units, which heavily favors the Chicago Cubs (Blue). Next, we see that the Chicago Cubs have reached their support level, which means their next game is extremely important. The Cubs are due to either break through their support level and continue their losing streak, or rebound with a victory. More often than not, teams end small winning and losing streaks at their support and resistance levels. The Cubs have rebounded at their support level twice in a row. On the other hand, the Philadelphia Phillies are at their resistance level. We see from the Z-Code Oscillator that the
Phillies have reached their resistance level four times but have failed to break through. Each time a small winning streak leads to the resistance level, the Phillies lose.
The Z-Code Oscillator suggests that the Cubs will again rebound from their support level, while the Phillies will fail to break through their resistance peak. The Oscillator predicts a comfortable Chicago Cubs win as a result. The Z-Code Oscillator got this game right with a 5-1 Cubs victory!
Let’s look at a more volatile example:

The first step is identifying the Delta differential between the two teams, which is three units in favor of the Arizona Diamondbacks.
The Arizona Diamondbacks (blue line) have reached their support level, which is a very strong signal. Arizona is likely to rebound from their support level for the third consecutive time. The Miami Marlins (red line) reached their support level at the previous game and bounced back. Comparatively, the Marlins have a much weaker signal than Arizona because this game is neither at resistance or support for Miami. Because Arizona is at support level and has a positive Delta differential, the Diamondbacks are predicted to win. The game does not have a strong signal for the Marlins, which gives Arizona an advantage. The Z-Code Oscillator again got this game right with an 8-4 Diamondbacks victory.
Let’s look at one final example:
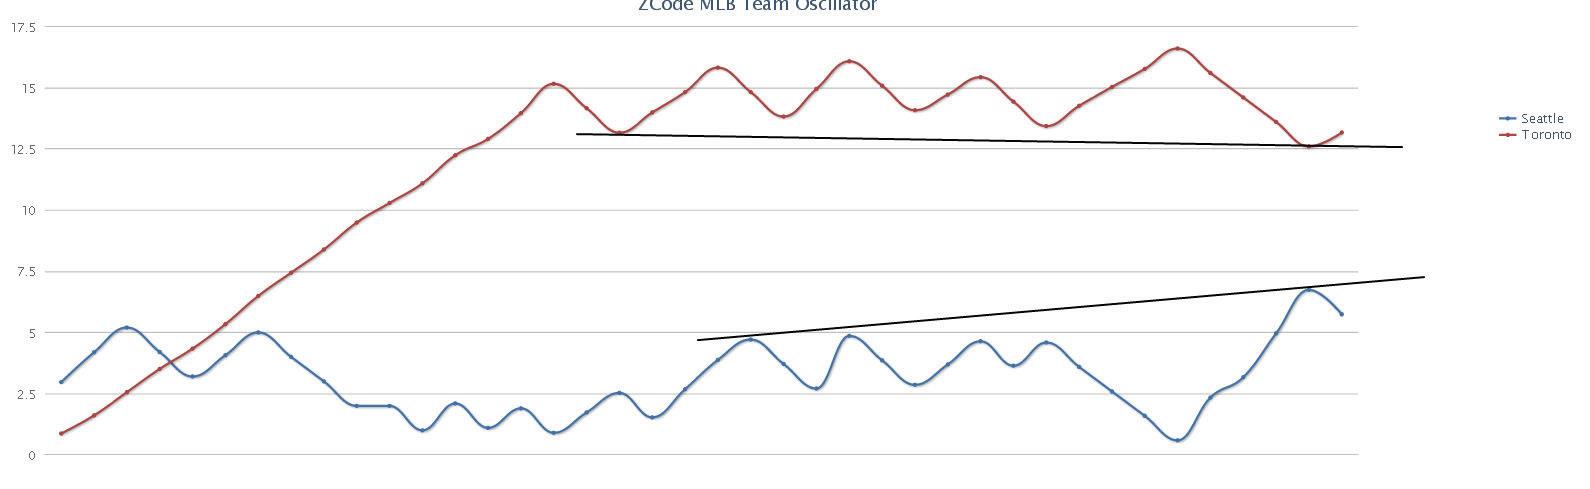
Again, the first step is to identify the Delta differential. For this game, the Toronto Blue Jays have a Delta differential of seven units, which is a rather strong signal. The Toronto Blue Jays (red line) reached their support level in the previous game. They won, and are probably due to win again after avoiding a lengthy losing streak. On the other hand, the Seattle Mariners (blue line) reached their resistance level in their las game, lost, and are probably due to continue losing. Because the strong Delta differential and opposing trends both favor Toronto, the prediction is a strong signal for the Toronto Blue Jays. The Z-Code Oscillator got this one right again with a 7-2 Blue Jays victory.
Z-Code Oscillator Analysis:
The Z-Code Oscillator is a powerful tool for sports predictions. The signal is not always strong, but it can be relied on consistently when it gives a clear prediction. It is best used as one tool in a multi-parameter system. When all parameters align, the Z-Code Oscillator can help evaluate confidence in a pick. If expert opinions, Z-Code predictions, and the Z-Code Oscillator align, we know we have a strong pick. If all parameters do not align, the Z-Code Oscillator can help determine if it is best to stay away from a wager on a given game. At the very least, the Z-Code Oscillator provides one more highly successful parameter to consider as part of the winning Z-Code System.


