New Brunswick's 2024
Child & Family Poverty Report Card
November 2024


November 2024


2022 tax filer data reveals that roughly 1 in 5 Canadian children lived in poverty.
The child poverty rate in Canada increased from 15.6% in 2021 to 18.1% in 2022.
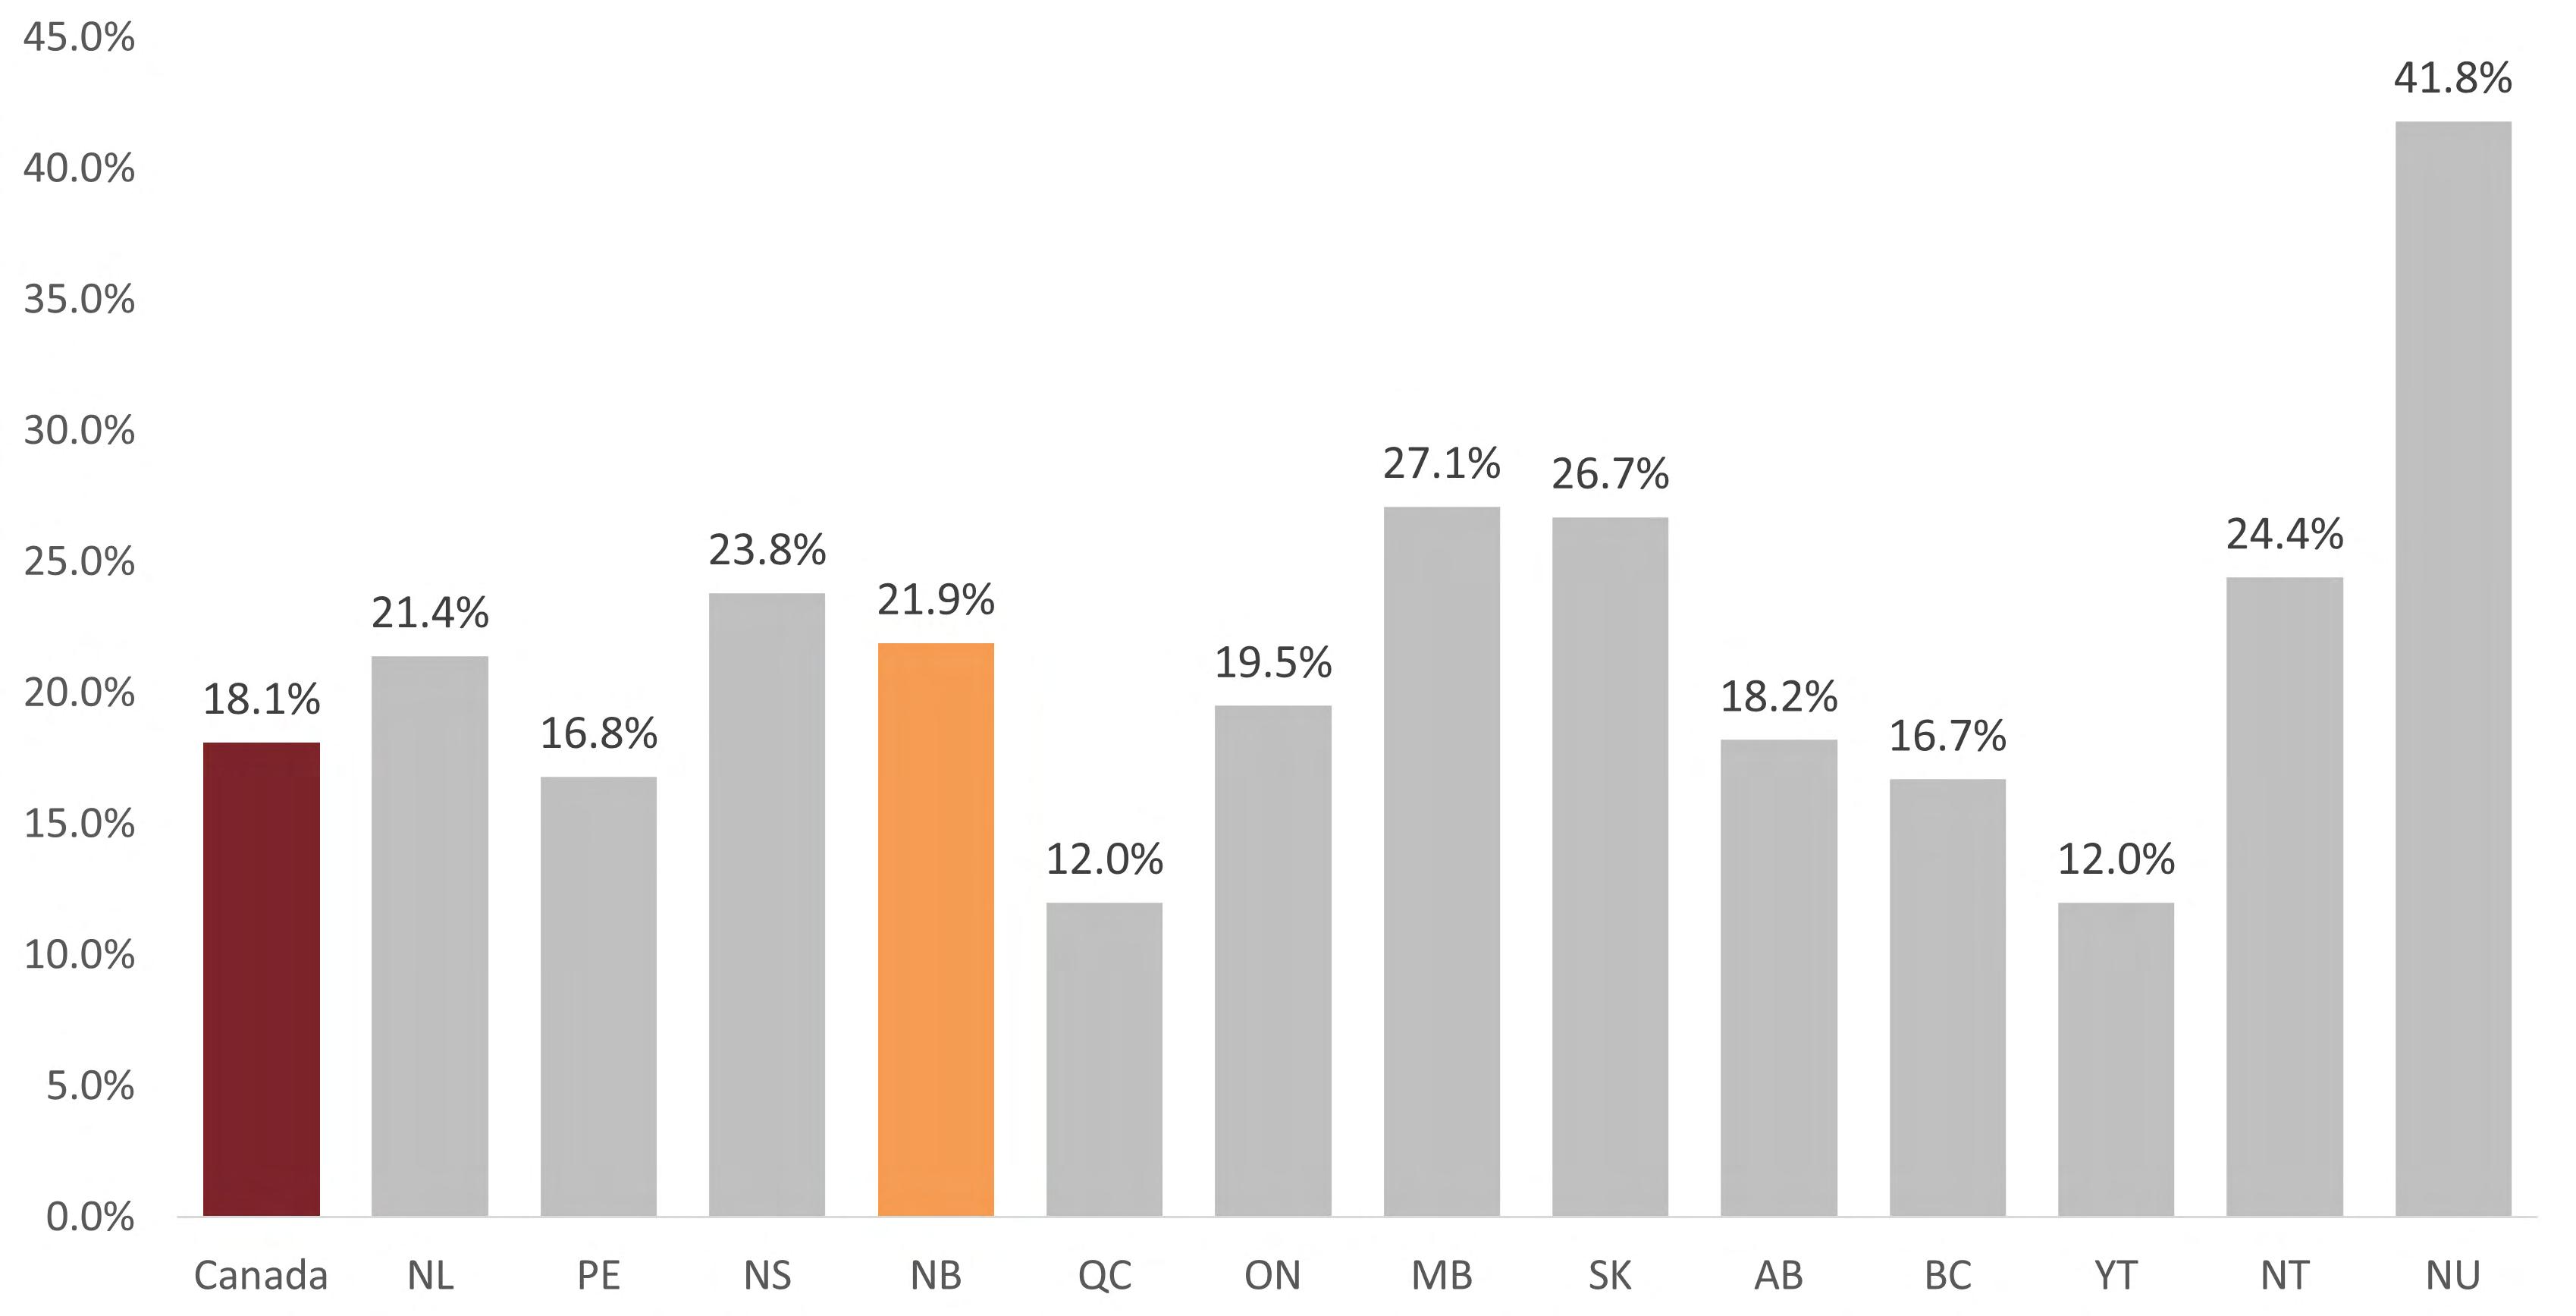
New Brunswick had the country’s sixth-highest child poverty rate (fourth if only considering the provinces and not the territories).
The number of children living in poverty in New Brunswick rose from 26,360 (18.7%) in 2021 to 31,430 (21.9%) in 2022.
Child poverty rates in New Brunswick are unevenly distributed across its eight cities, from highs above 29% in Campbellton, Saint John, and Bathurst, to a low of 14.4% in Dieppe.
The highest decile of New Brunswick families with children held 25.7% of total income, while the lowest decile held 1.6%.
Nearly 1 in 4 children under age 6 (24.44%) are living in poverty in New Brunswick.
47.9% of children in one-parent families lived in poverty, compared to 11.2% of children in couple families.
Government transfers reduced New Brunswick's child poverty rate from 38.8% to 21.9%.
The Canada Child Benefit lifted 14,580 children out of poverty.
It has been 35 years since the Canadian House of Commons unanimously resolved to eliminate child poverty by the year 2000.[1] This commitment remains unfulfilled, with detrimental effects on children and families living in poverty. In a nation rich in resources and opportunities, the persistence of child poverty in Canada is a policy problem that requires renewed dedication and urgent collective action.
The Human Development Council is a member of Campaign 2000, a cross-Canada coalition working to end child and family poverty. Campaign 2000 coordinates the annual release of national and subnational report cards tracking poverty reduction trends, like this one for New Brunswick. Child and Family Poverty Report Cards are a stark reminder of the government’s failure to achieve the target it set in 1989. Considerable work is required to lift children and families out of poverty and create a society where every child can thrive.
For many years, poverty reduction progress in New Brunswick was slow or altogether stalled. The child poverty rate dropped in 2020 with the onset of the COVID-19 pandemic and its income support programs. The pandemic presented an opportunity to demonstrate how investment in income support programs can effectively lift people out of poverty by increasing their financial security, socioeconomic well-being, and quality of life. Unfortunately, the COVID-19 government transfers were discontinued by 2021. Child poverty rates have since seen sharp annual increases due to high and sustained price
"This
House seek(s) to achieve the goal of eliminating poverty among Canadian children by the year 2000."
inflation. Low-income families struggle to meet their basic needs because employment earnings and government transfers are not keeping pace with the cost of living.
Affordability is a pressing concern for households in New Brunswick, especially those living below the poverty line. Many individuals and families are struggling to access essential resources like housing and food due to insufficient disposable income. This often forces them to make tough financial choices, prioritizing certain expenses over others. The United Nations’ Convention on the Rights of the Child states that an adequate standard of living—with access to shelter and good nutrition—is not just an ideal, but a fundamental human right.[2] With record-breaking child poverty rates, it is clear that social policies are failing those in greatest need of support.[3]
Poverty is the condition of a person who lacks the resources, means, opportunities, and power necessary to acquire and maintain economic self-sufficiency or to integrate into and participate in society.
- House of Commons, November 24, 1989 [4]
The Market Basket Measure (MBM) and the LowIncome Measure (LIM) are two poverty measurement tools used in Canada.
The federal government recognizes the MBM as Canada’s official poverty line.[5] The MBM is a consumption-based, absolute measure of poverty. It is based on a basket of goods that reflects the income a family requires to afford basic needs, such as food, shelter, and clothing. Its data is obtained from the Canadian Income Survey. The data from the Canadian Income Survey comes from a limited sample of the New Brunswick population. Therefore, the data is not reliable for small geographies.
The Campaign 2000 coalition uses the LIM as the primary poverty measure in annual child poverty reporting for Canada and its provinces and territories. The LIM is a relative measure of poverty. It defines poverty as below the median (50%) income of all tax filers, adjusted for family size. One data source for the LIM is tax filer data from the T1 Family
File (T1FF). Tax filer data paints a more reliable picture of Canadian realities than income survey data.
This report card primarily uses statistics from the 2022 T1FF’s Census Family Low Income Measure, After Tax (CFLIM-AT). This is the most recent tax filer data available. Disaggregated demographic data, like child poverty for Indigenous and racialized children, is sourced from the national Census, administered once every 5 years.
According to the MBM, 11.3% (16,000) of children lived in poverty in New Brunswick in 2022. The CFLIM-AT reported 21.9% (31,430) of children living in poverty that same year. The MBM reported 15,430 less children living in poverty than the CFLIMAT. Such an underestimation means that many children and families experiencing poverty are falling through the cracks instead of receiving adequate socioeconomic support to help them out of hardship.
=
Source: Statistics Canada. (2024). T1 Family File. Table 11-10-0018-01; Statistics Canada. (2024). Canadian Income Survey, 2022. Table 11-10-0135-01.
Tax filer data from 2022 reveals that nearly 1 in 5, (approximately 1.4 million) Canadian children lived in poverty.[6] The child poverty rate increased by 2.5 percentage points from 2021 to 2022, marking the highest annual rise in child poverty ever recorded.
In 2022, a greater number of children were living in poverty compared to 2019, prior to the COVID-19 pandemic. While child poverty rates initially fell in 2020 with the implementation of COVID-19 income support programs, the subsequent removal of these benefits, coupled with rising inflation, led to a sharp increase in child poverty across the country. This trend represents a concerning reversal of the progress made in 2015, when the federal poverty reduction strategy started showing positive results.
The national reduction in child poverty observed in 2020 highlights the effectiveness of social transfers in enhancing the quality of life for individuals and families. According to UNICEF, however, the
adequacy of social transfers like the Canada Child Benefit, has declined in relation to the average worker's wage over the last decade.[7] To create a lasting positive impact, social transfers must be increased and sustainable.
Figure 2 shows that New Brunswick had the sixthhighest child poverty rate (fourth if only considering the provinces and not the territories). New Brunswick’s overall child poverty rate surpasses the national average.
Source: Statistics Canada. (2024). T1 Family File. Table 11-10-0018-01.
At 21.9%, New Brunswick’s child poverty rate in 2022 was 3.8 percentage points higher than the national rate.[8] Both rates increased from 2021 when the provincial child poverty rate was 18.7% and the national rate was 15.6%.
The number of children in poverty in New Brunswick rose from 26,360 in 2021 to 31,430 in 2022.[9] As anticipated, the child poverty rate rose to prepandemic levels. The number of children living in poverty in 2022 is only 10 fewer than in 2016. Poverty reduction progress is being undone. Child poverty rates are likely to increase if the cost of living remains high. To combat hardship caused by inflation, greater income supports ought to be promptly distributed to households in need.
The incidence of poverty among Indigenous and racialized children was discussed in the 2021 report card.[10] This data was sourced from the 2021 Census and is found on pages 19 and 36 of this report. The next census will occur in May 2026.
Figure 3: Number of persons in low income in NB, aged 0-17, 2016-2022, CFLIM-AT
Source: Statistics Canada. (2024). T1 Family File. Table 11-100018-01.
Figure 4: Percentage of persons in low income, aged 0-17, 2016-2022, CFLIM-AT
Source: Statistics Canada. (2024). T1 Family File. Table 11-10-0018-01.
Child poverty rates are unevenly distributed across New Brunswick’s eight cities. Campbellton has the highest child poverty rate at 40.6%. Saint John and Bathurst follow with rates of 31.2% and 29.9% respectively. Dieppe has the lowest child poverty rate at 14.4%.[11]
Figure 5 presents child poverty rates in New Brunswick cities. It shows that child poverty is most prevalent in the northern and southern parts of the province. The figure also includes population data from the 2021 Census,[12] and overall and senior poverty rates.[13]
Campbellton Population: 7,047
Child Poverty: 40.6%
Overall Poverty: 29.3% Senior Poverty: 27.6%
Edmundston
Population: 16,437
Child Poverty: 21.5%
Overall Poverty: 20.2%
Senior Poverty: 22.6%
Fredericton
Population: 63,116
Child Poverty: 23.9%
Overall Poverty: 19.7%
Senior Poverty: 13%
Saint John
Bathurst Population: 12,157
Child Poverty: 29.9%
Overall Poverty: 25.1% Senior Poverty: 23.7%
Miramichi Population: 17,692 Child Poverty: 21.6%
18%
Dieppe Population: 28,114 Child Poverty: 14.4%
Moncton Population: 79,470
Child Poverty: 26.9%
Overall Poverty: 22.6%
Senior Poverty: 17.1%
12.9%
12.5%

Population: 69,895
Child Poverty: 31.2%
Overall Poverty: 23.6%
Senior Poverty: 19.6%
Source: Statistics Canada. (2024). T1 Family File Table I-13 - Individual data - After-tax low income status of tax filers and dependents (census family low income measure, CFLIM-AT) for couple and lone parent families by family composition, 2022; Statistics Canada. (2023). Census Profile. 2021 Census of Population. Statistics Canada Catalogue no.98-316-X2021001.
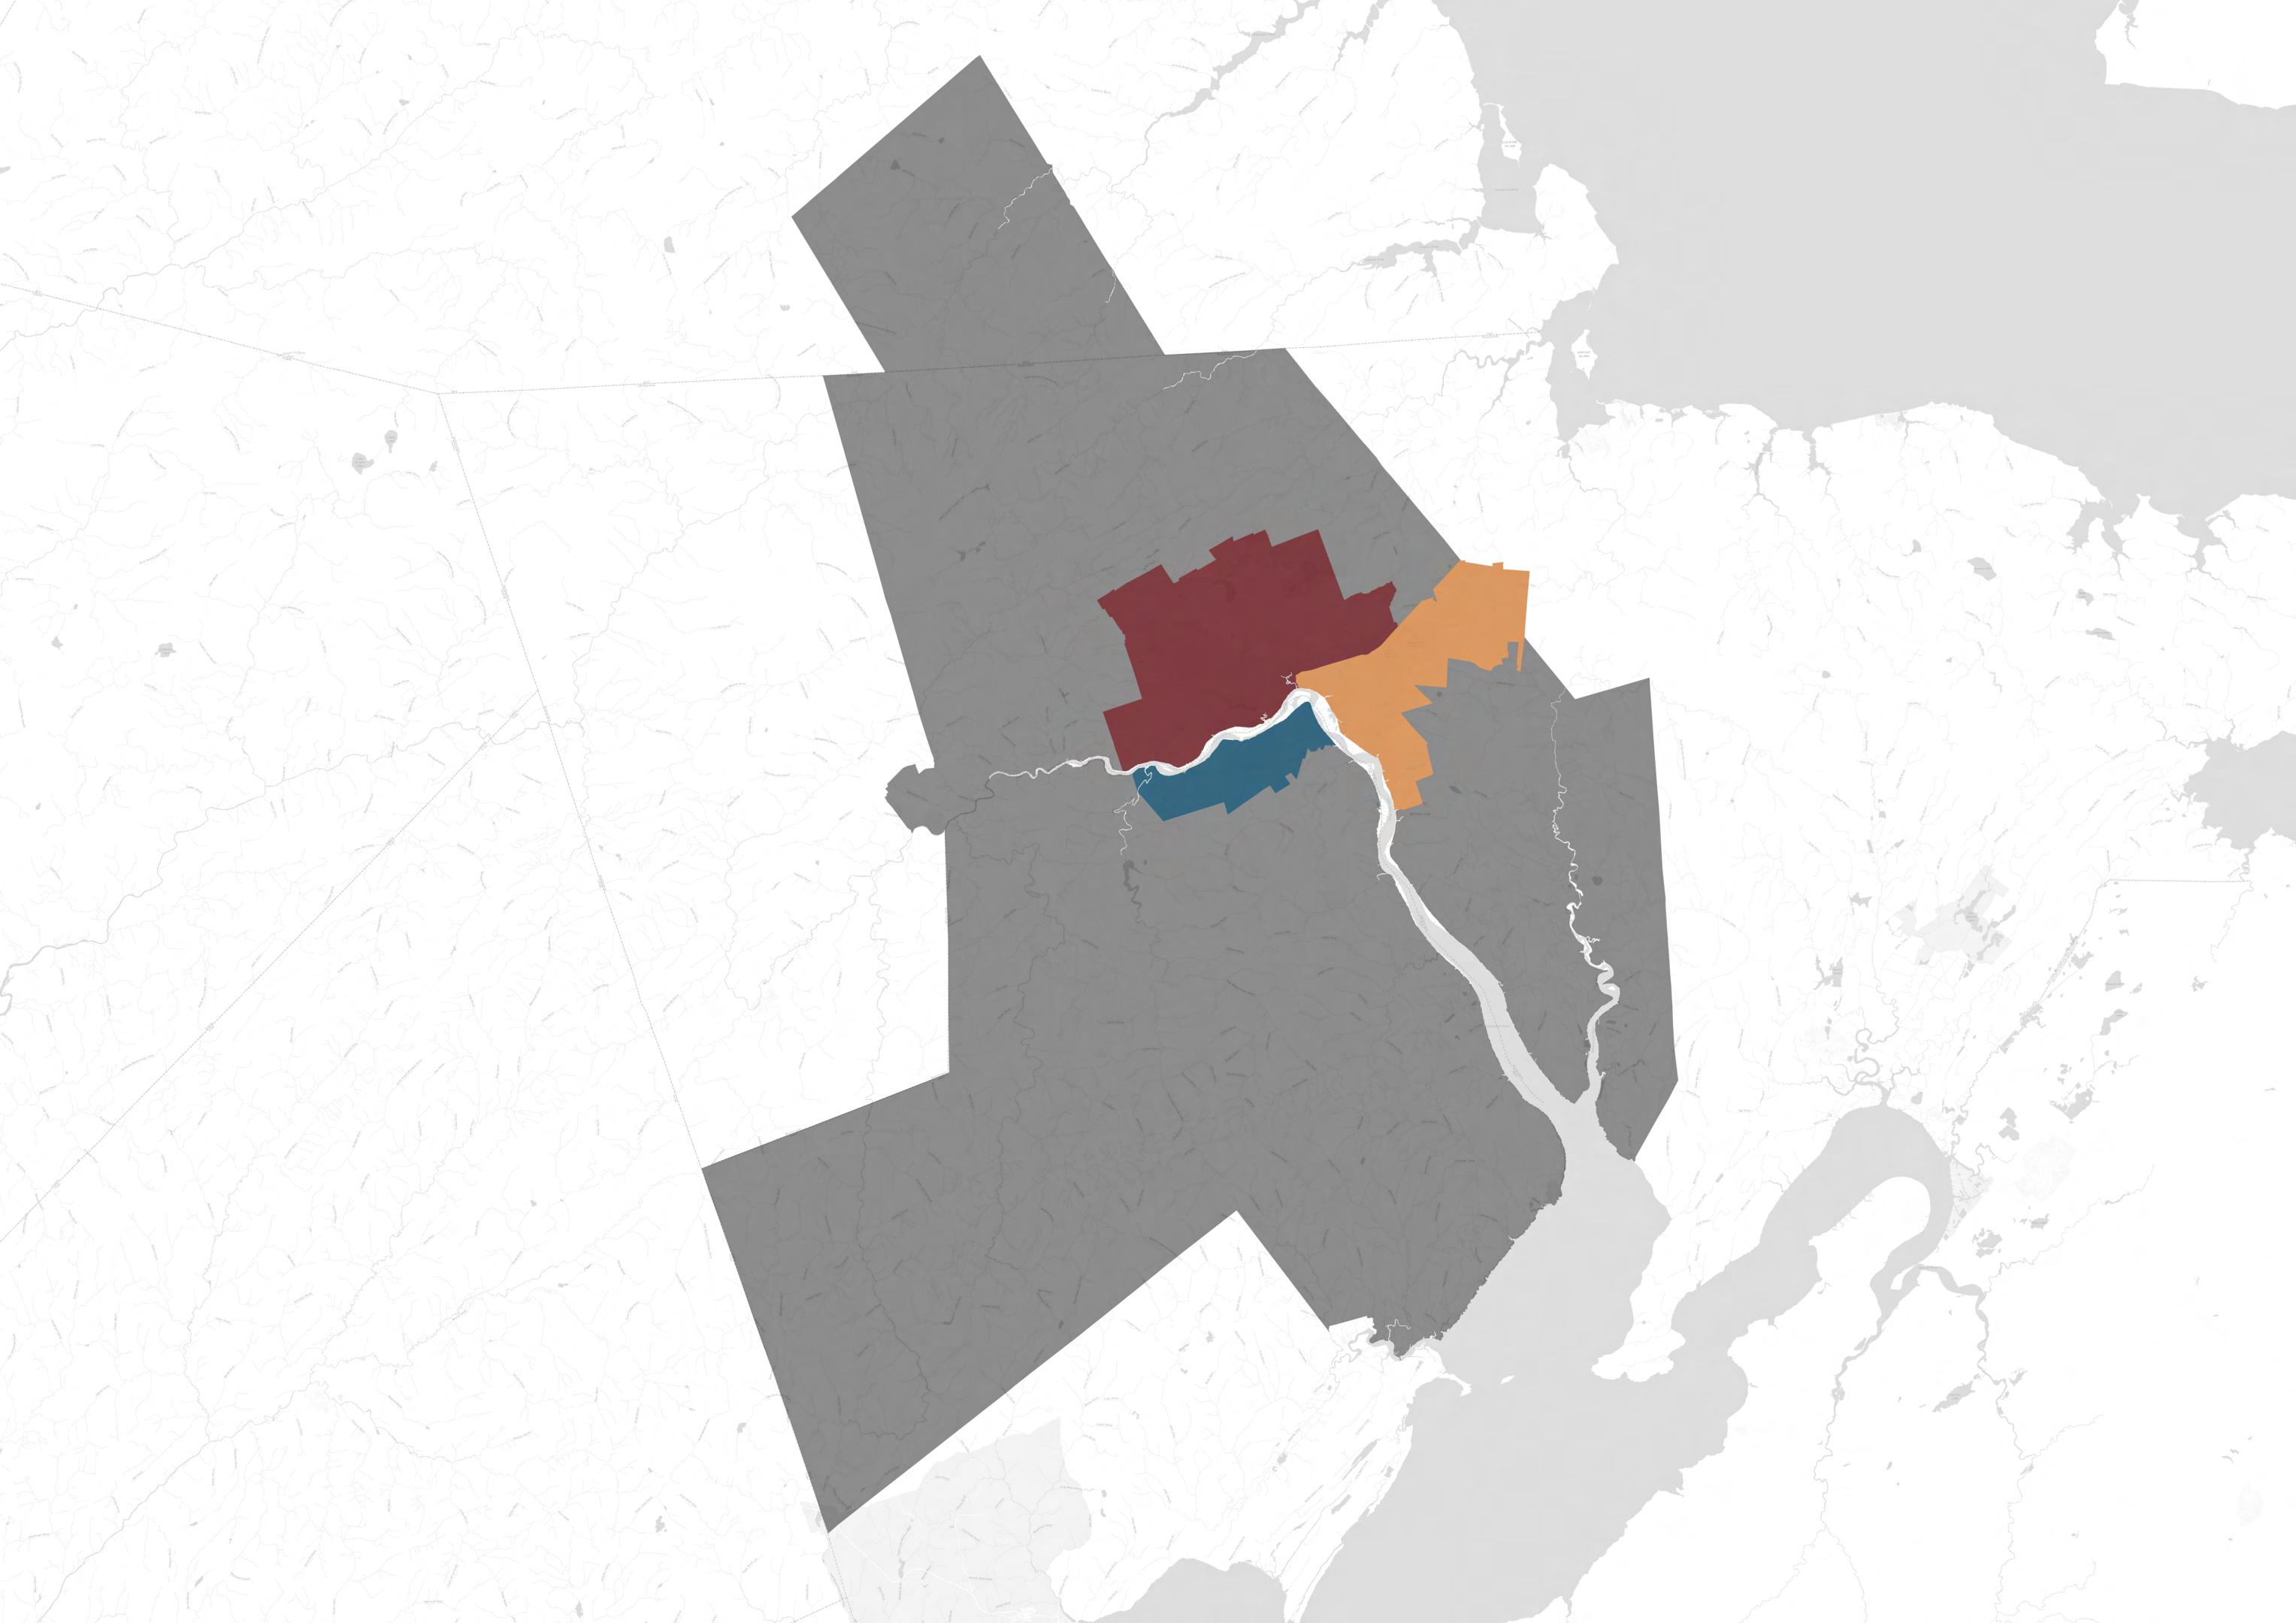
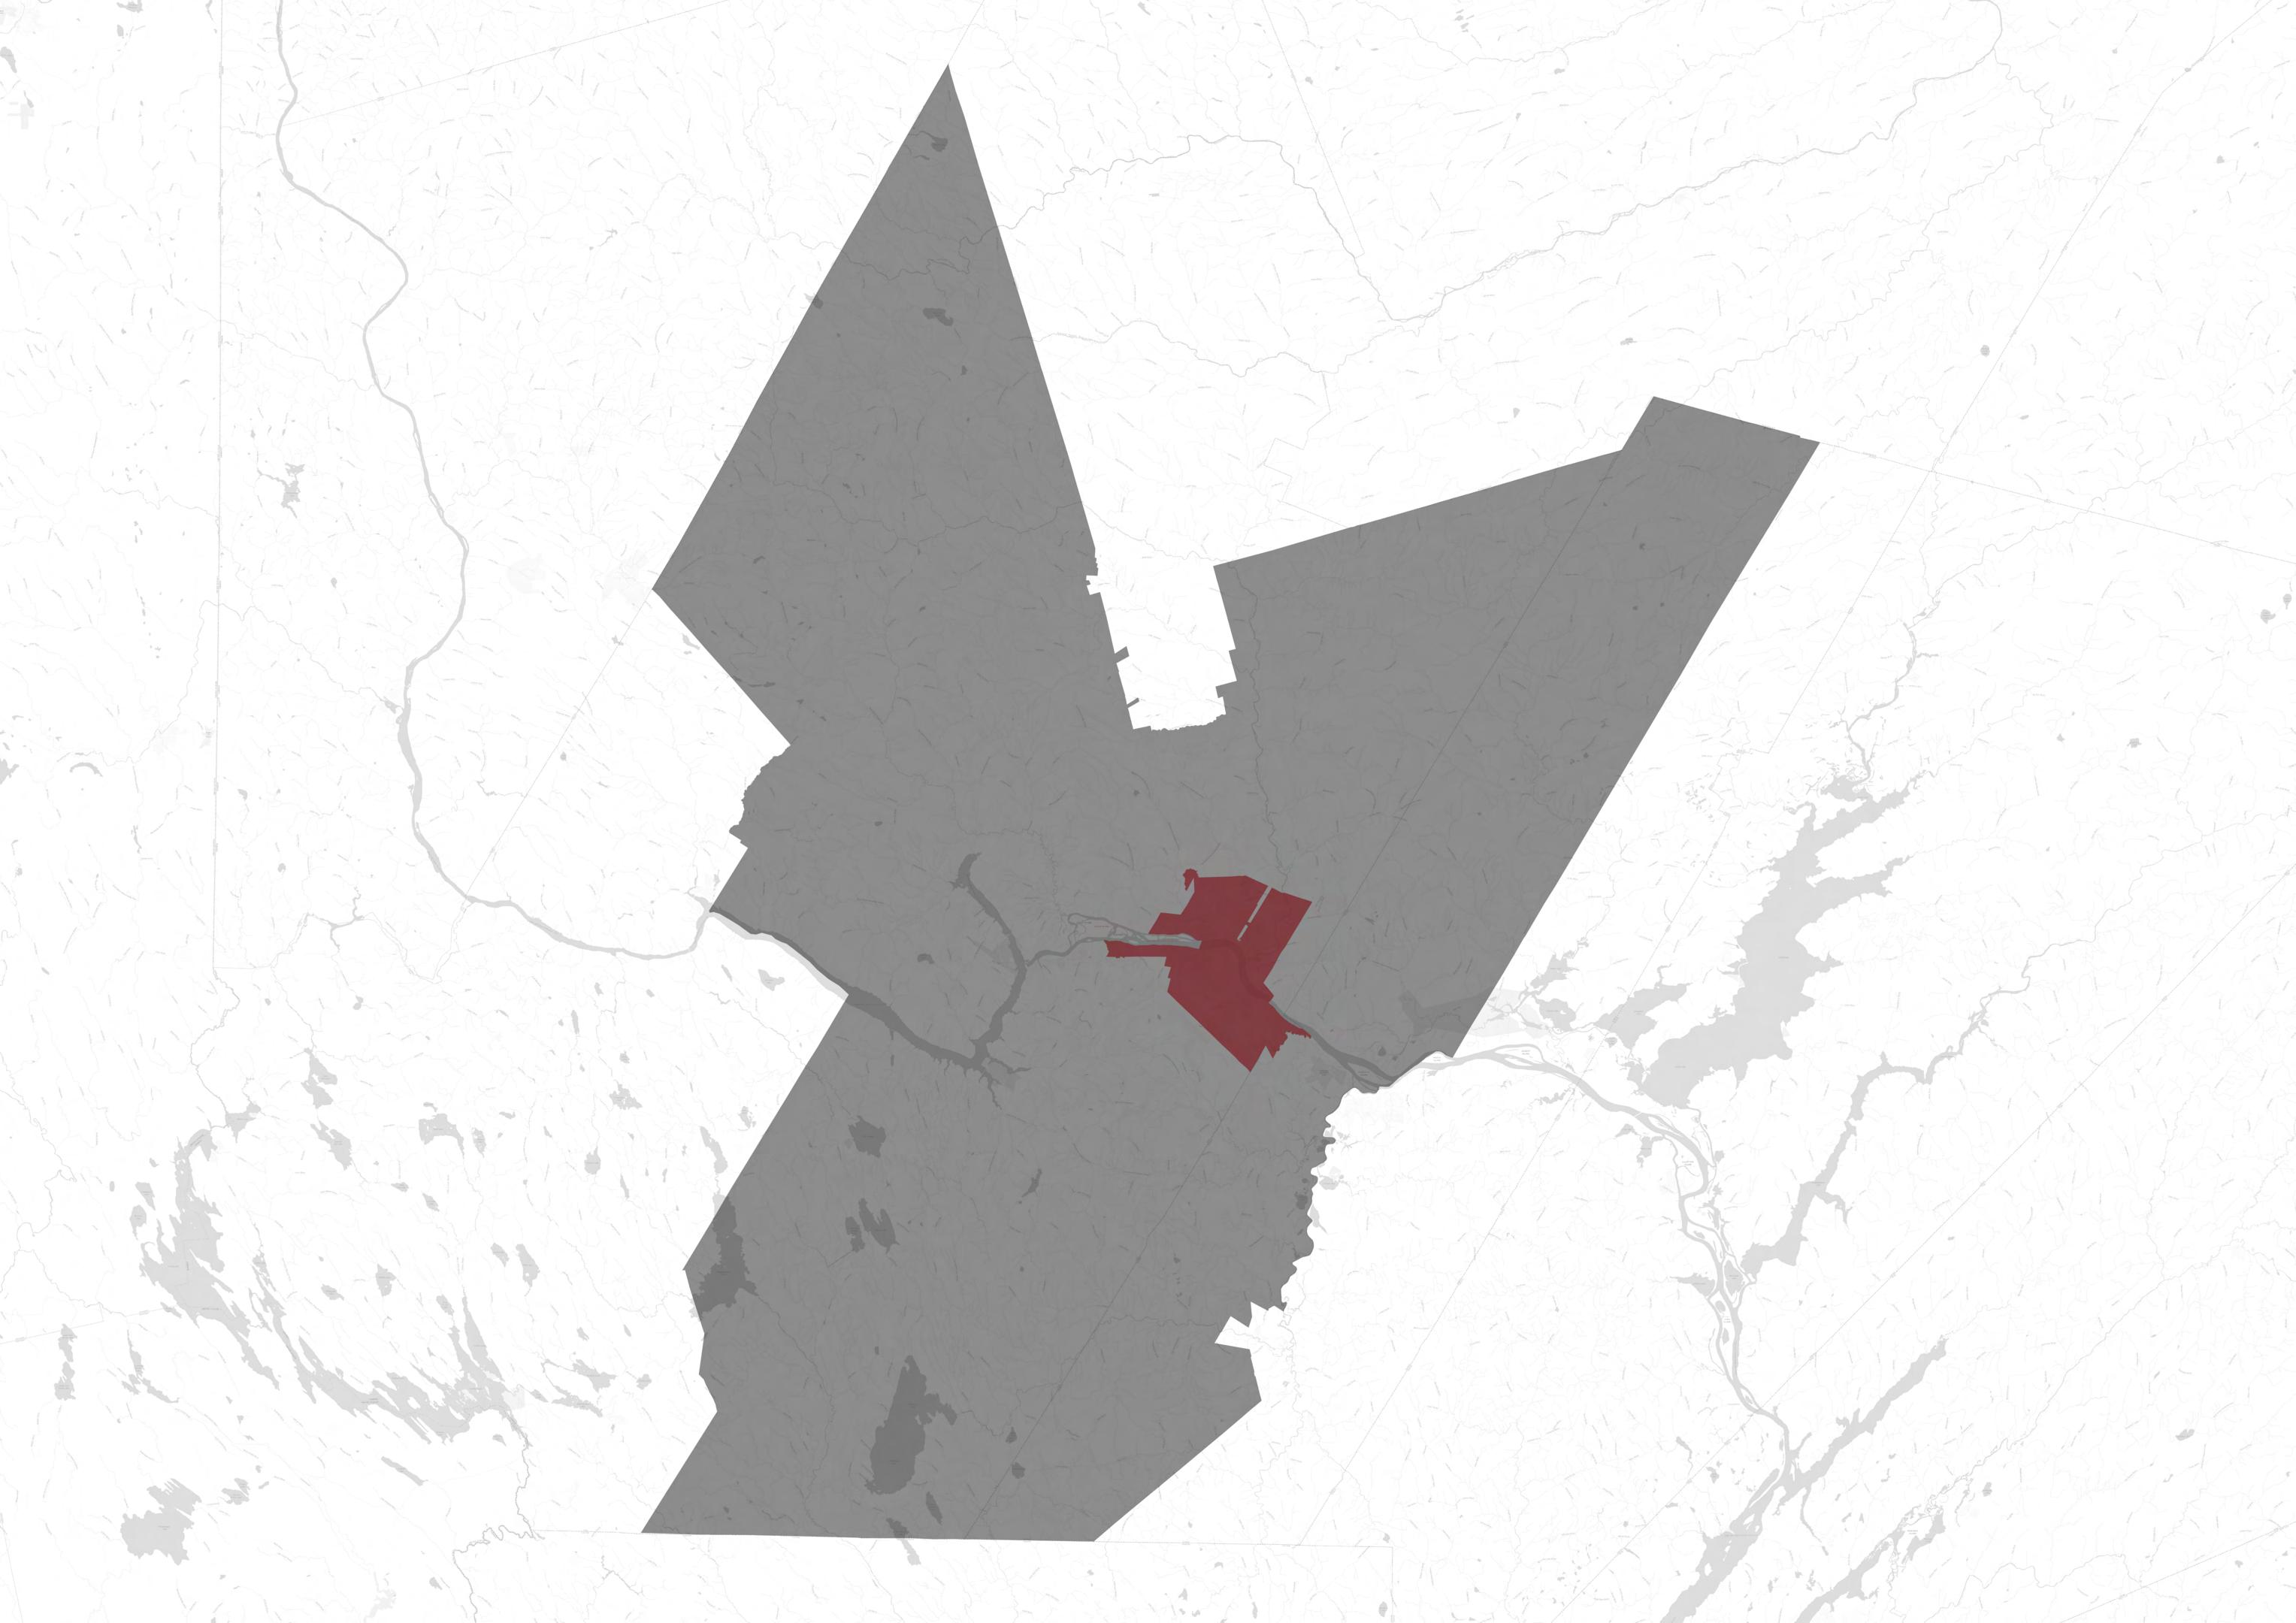
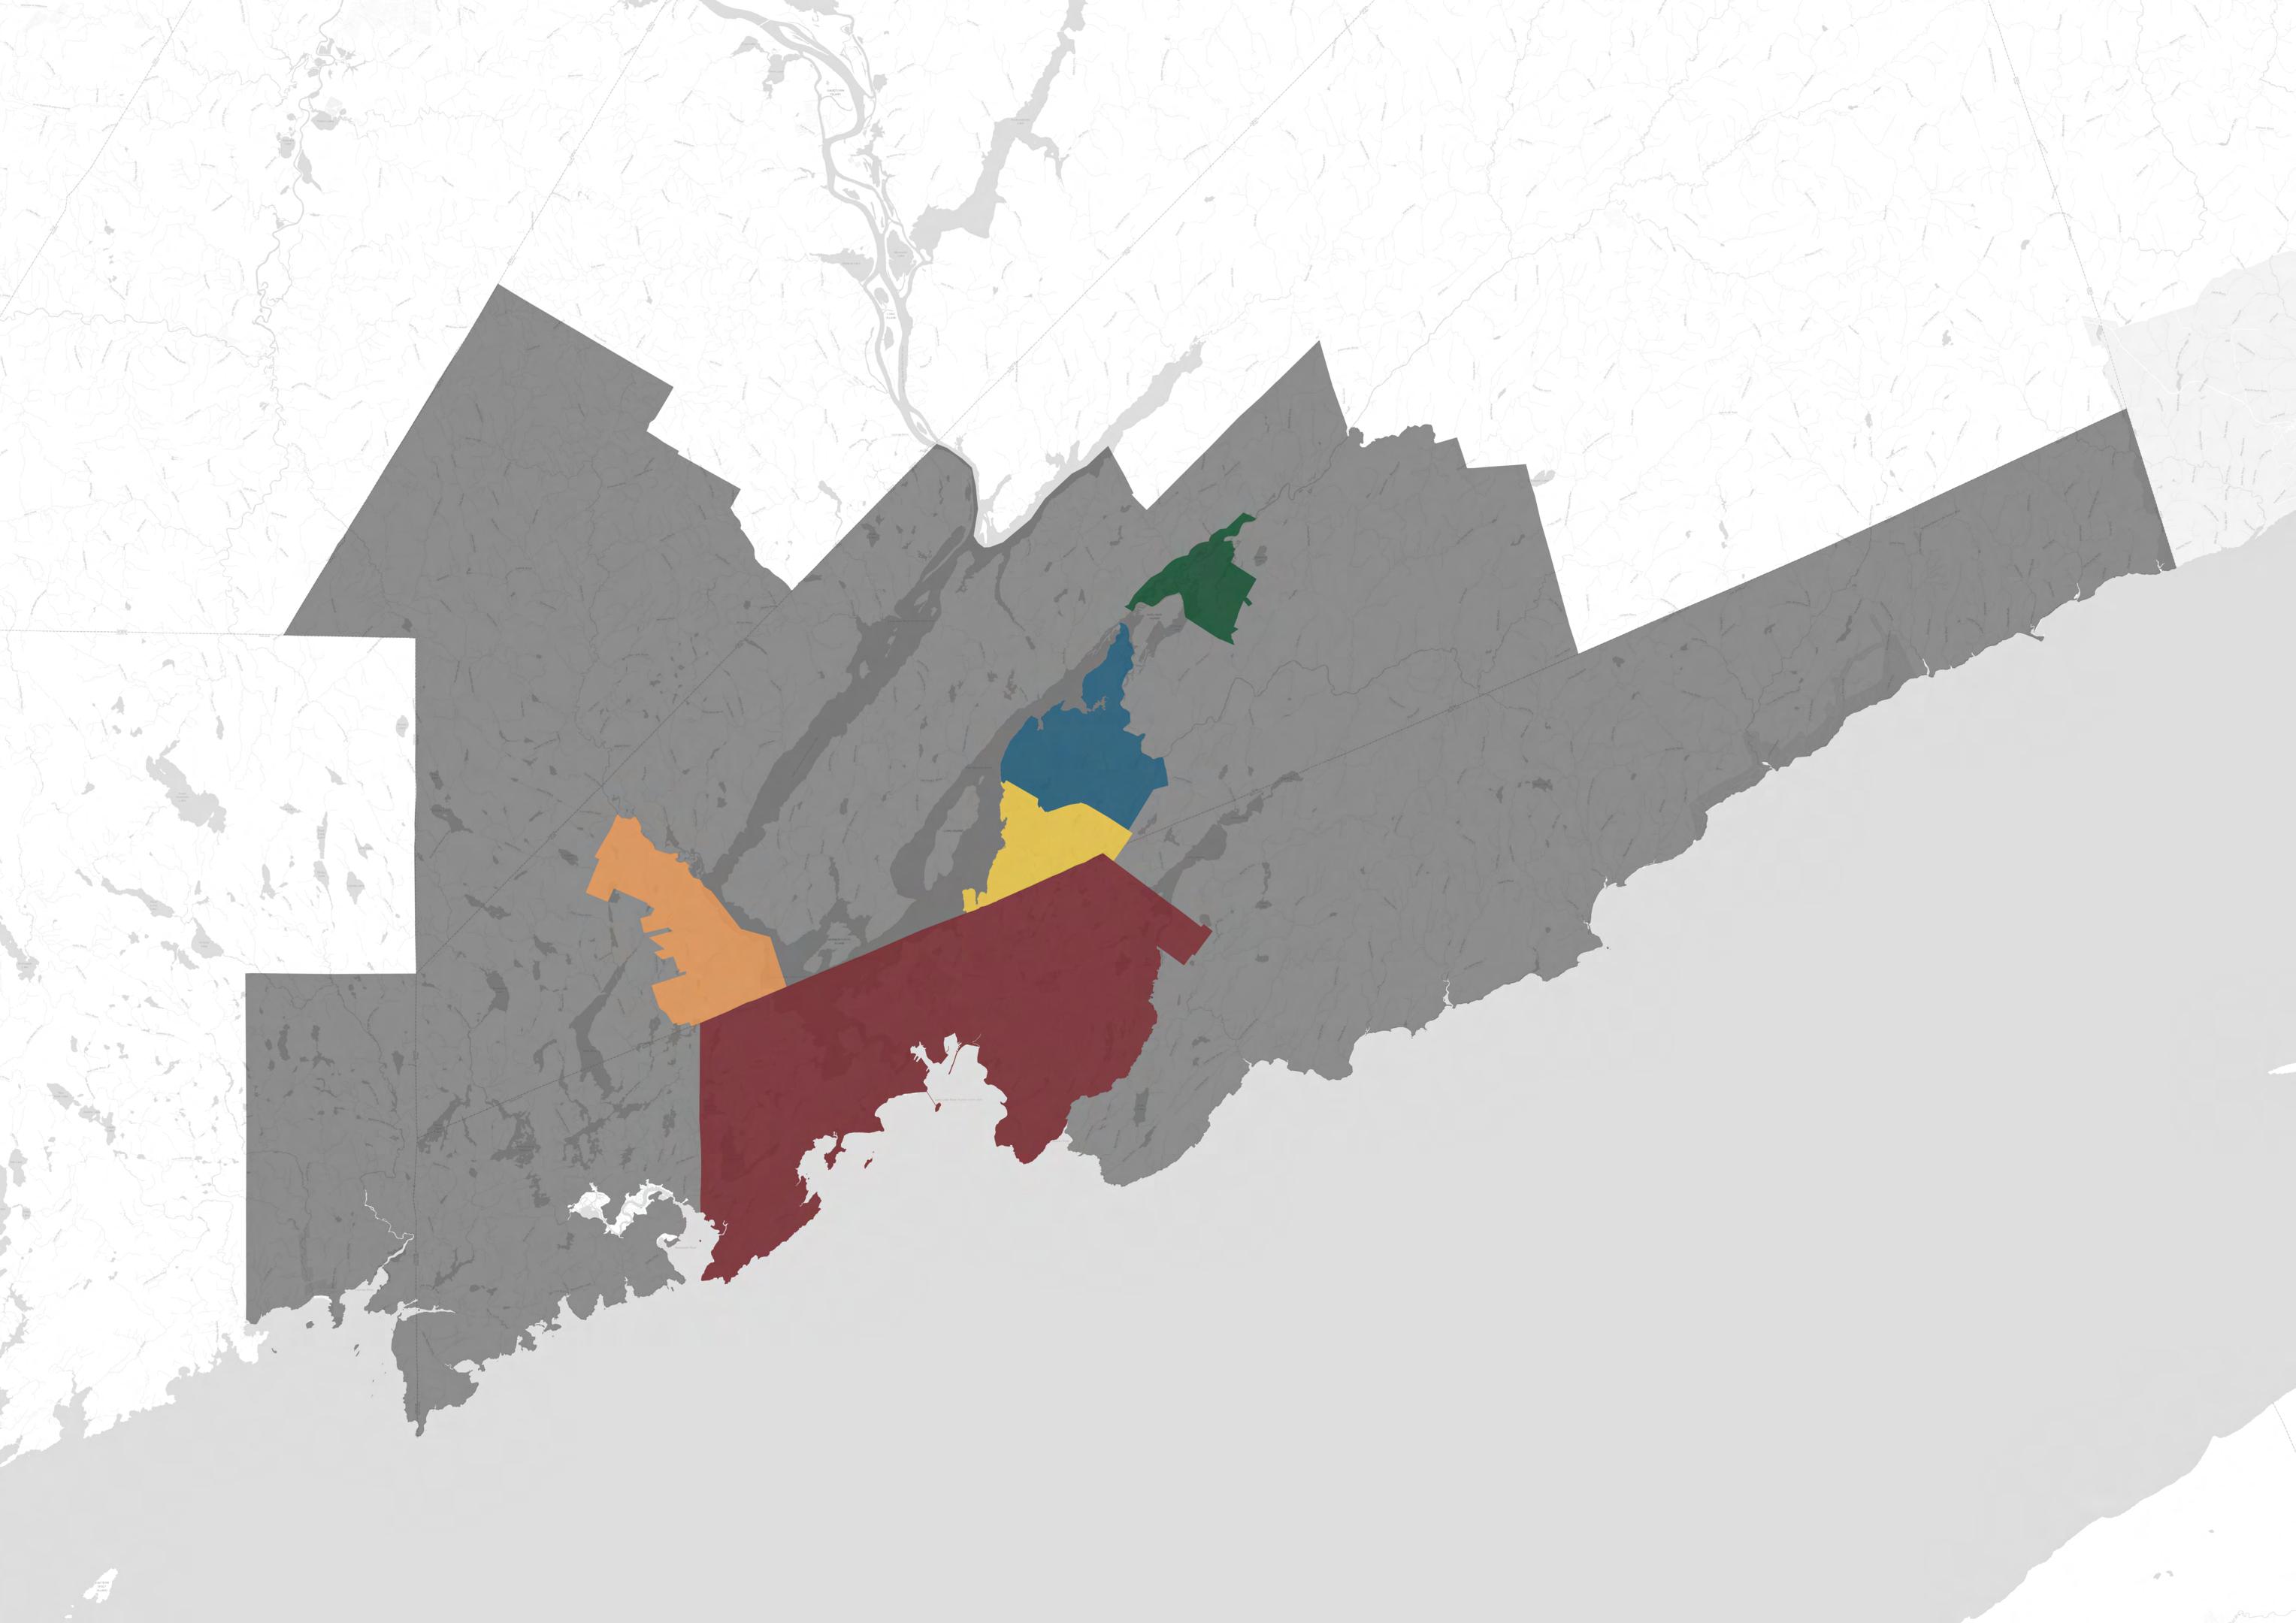
The Census Metropolitan Areas (CMAs) of Moncton, Fredericton, and Saint John see differences in child poverty rates between the central city and neighbouring suburban municipalities. For example, the child poverty rate in Dieppe is nearly half that of
the city of Moncton. Variances in child poverty are even greater between the city of Saint John and its adjacent suburban towns. Saint John’s poverty rate is over three times higher than the rate in Quispamsis!
Source: Statistics Canada. (2024). T1 Family File Table I-13 - Individual data - After-tax low income status of tax filers and dependents (census family low income measure, CFLIM-AT) for couple and lone parent families by family composition, 2022.
Child: 19.7%
Overall: 16.4%
Senior: 12.9%
Child: 23.9%
Overall: 19.7%
Senior: 13%
Child: 9.2%
Overall: 7.7%
Senior: 8.1% Quispamsis
Grand BayWestfield
Child: 11.9%
Overall: 9%
Senior: 9.2%
John
Child: 31.2%
Overall: 23.6%
Senior: 19.6% Source:
Child: 13.4%
Overall: 11.2%
Senior: 10.6%
Child: 13%
Overall: 9.5%
Senior: 7.8%
Child: 22.2% Overall: 17.4% Senior: 15.4%
Within Saint John city limits, there are notable differences in the spatial distribution of child poverty. In 2022, the child poverty rates in all four wards surpassed the national average. While Ward 4 had a child poverty rate below the provincial
average, Wards 2 and 3 had child poverty rates that exceeded it. The percentages of children in poverty in Wards 2 and 3 were approximately double New Brunswick’s overall rate!
Ward 2
Child:

Ward 1
Child: 17.3%
Overall: 12.9% Senior: 12.7%
Ward 4
Ward 3
Child: 45.6%
Overall: 35.8% Senior: 33.1%
Source: Statistics Canada. (2024). T1 Family File Table I-13 - Individual data - After-tax low income status of tax filers and dependents (census family low income measure, CFLIM-AT) for couple and lone parent families by family composition, 2022.
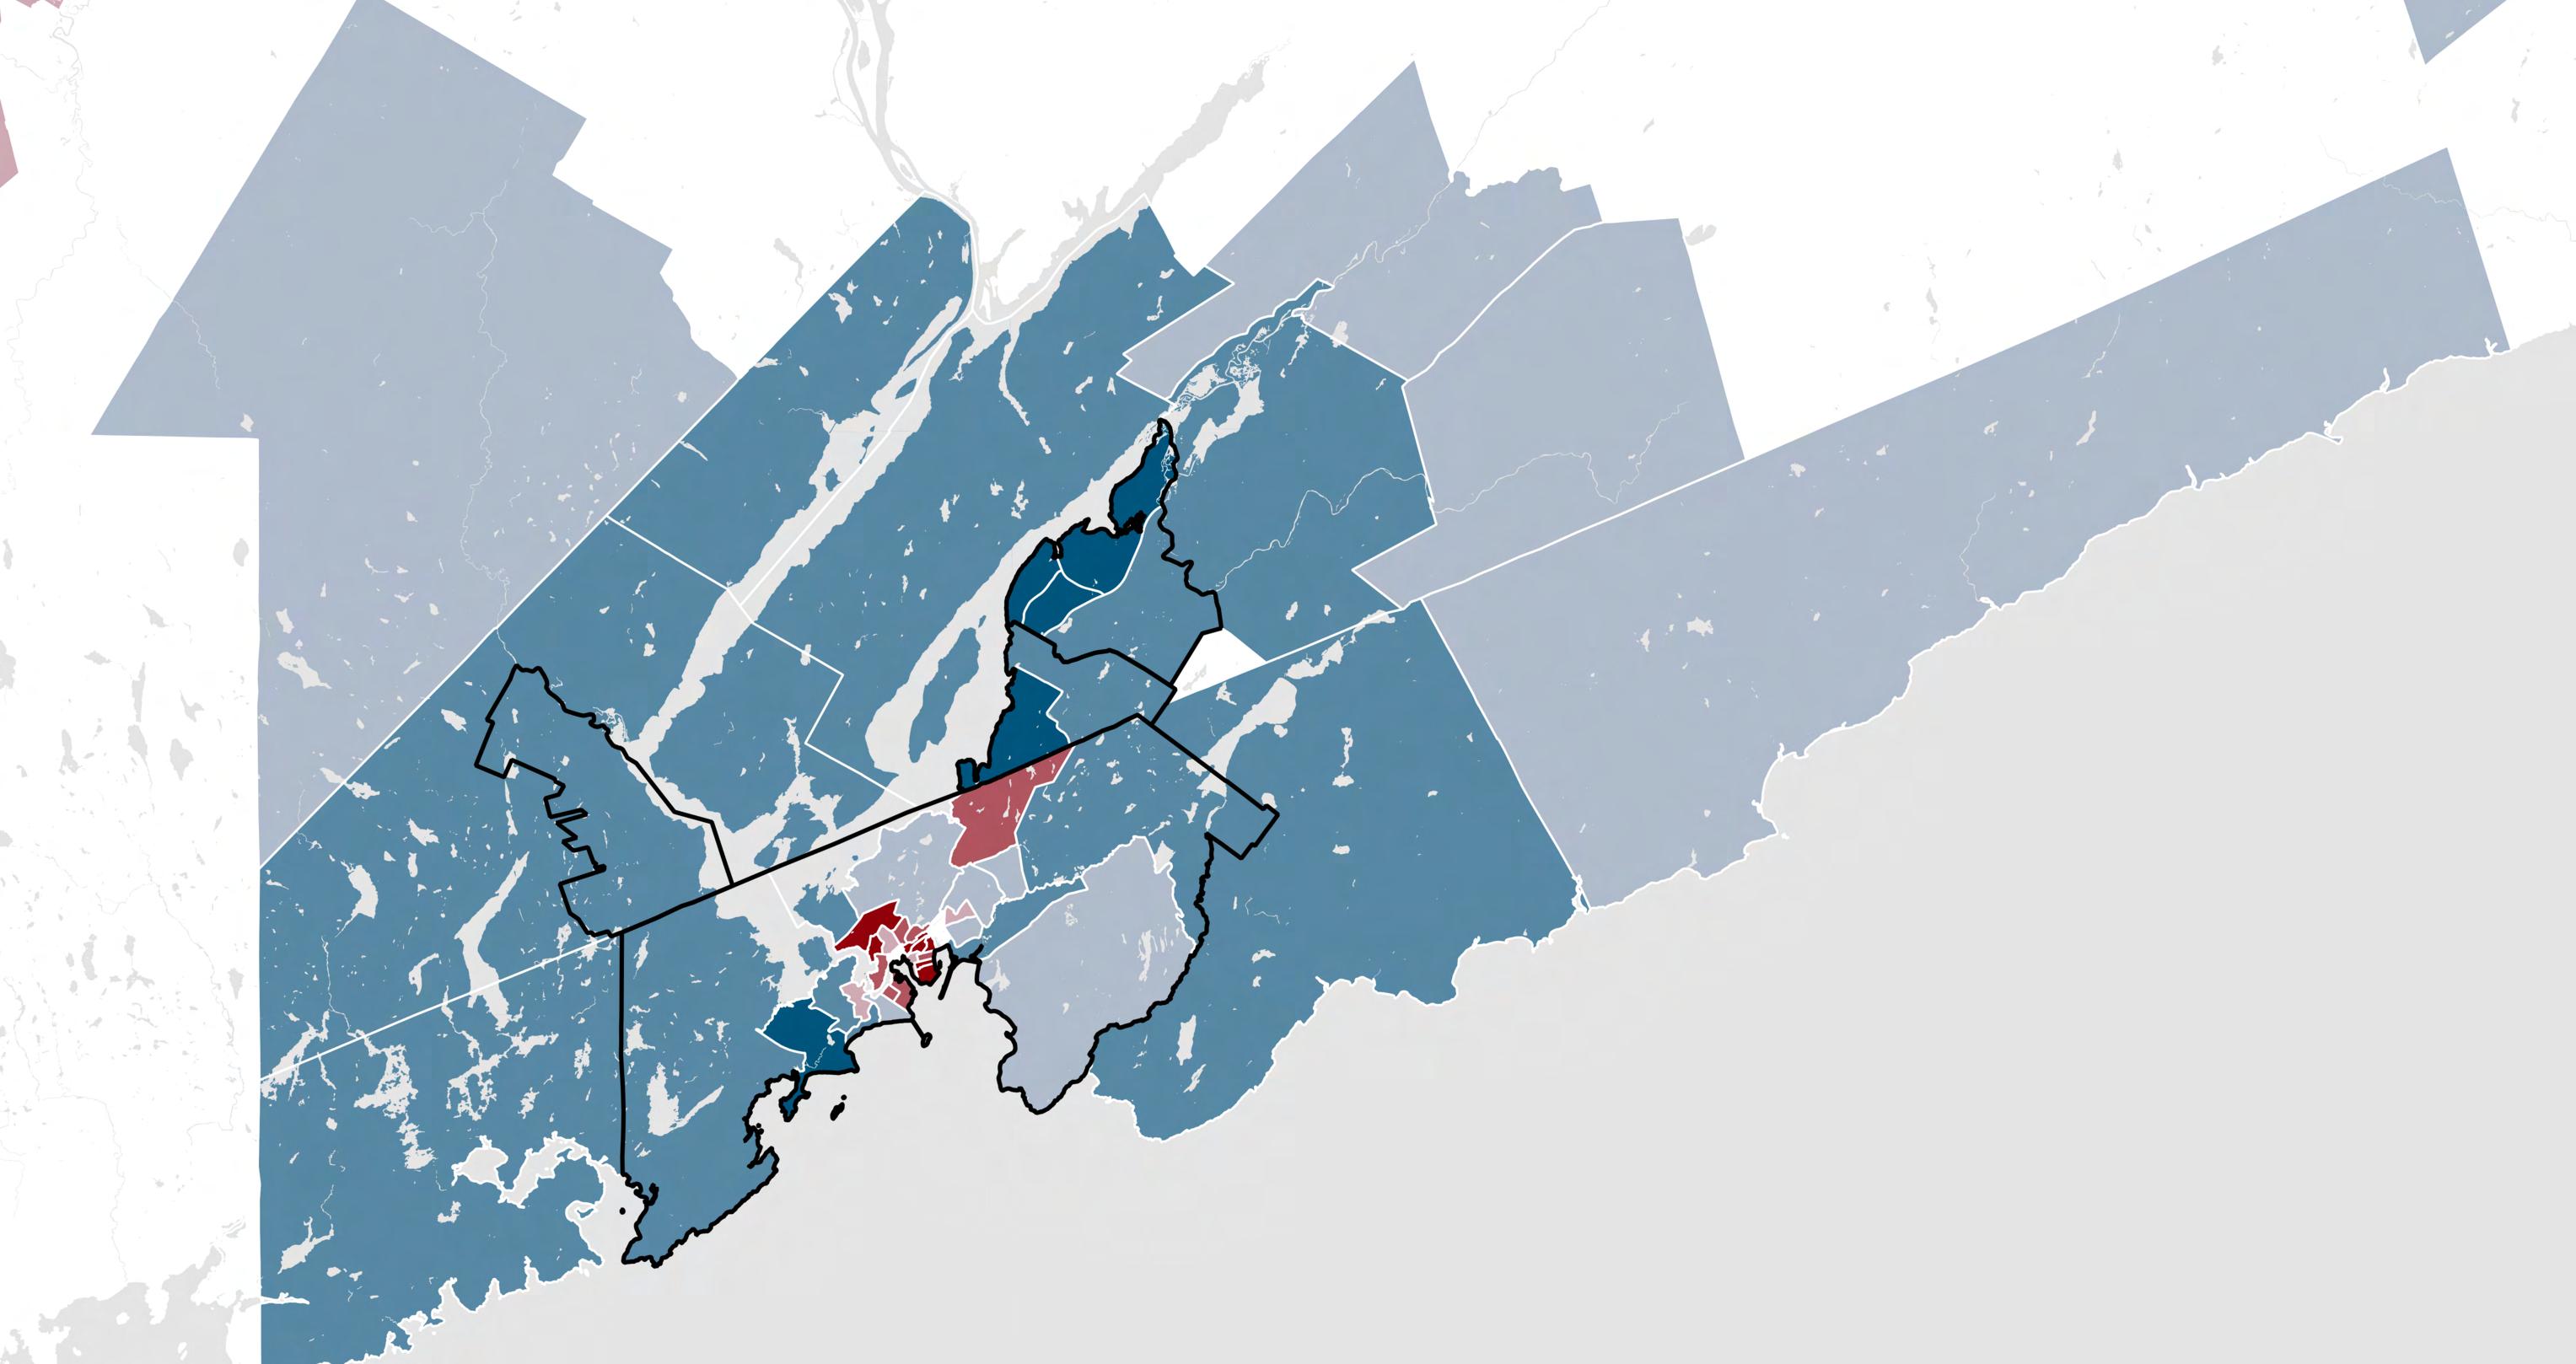
Figure 10: Child Poverty Rates by Census Tract the Saint John CMA
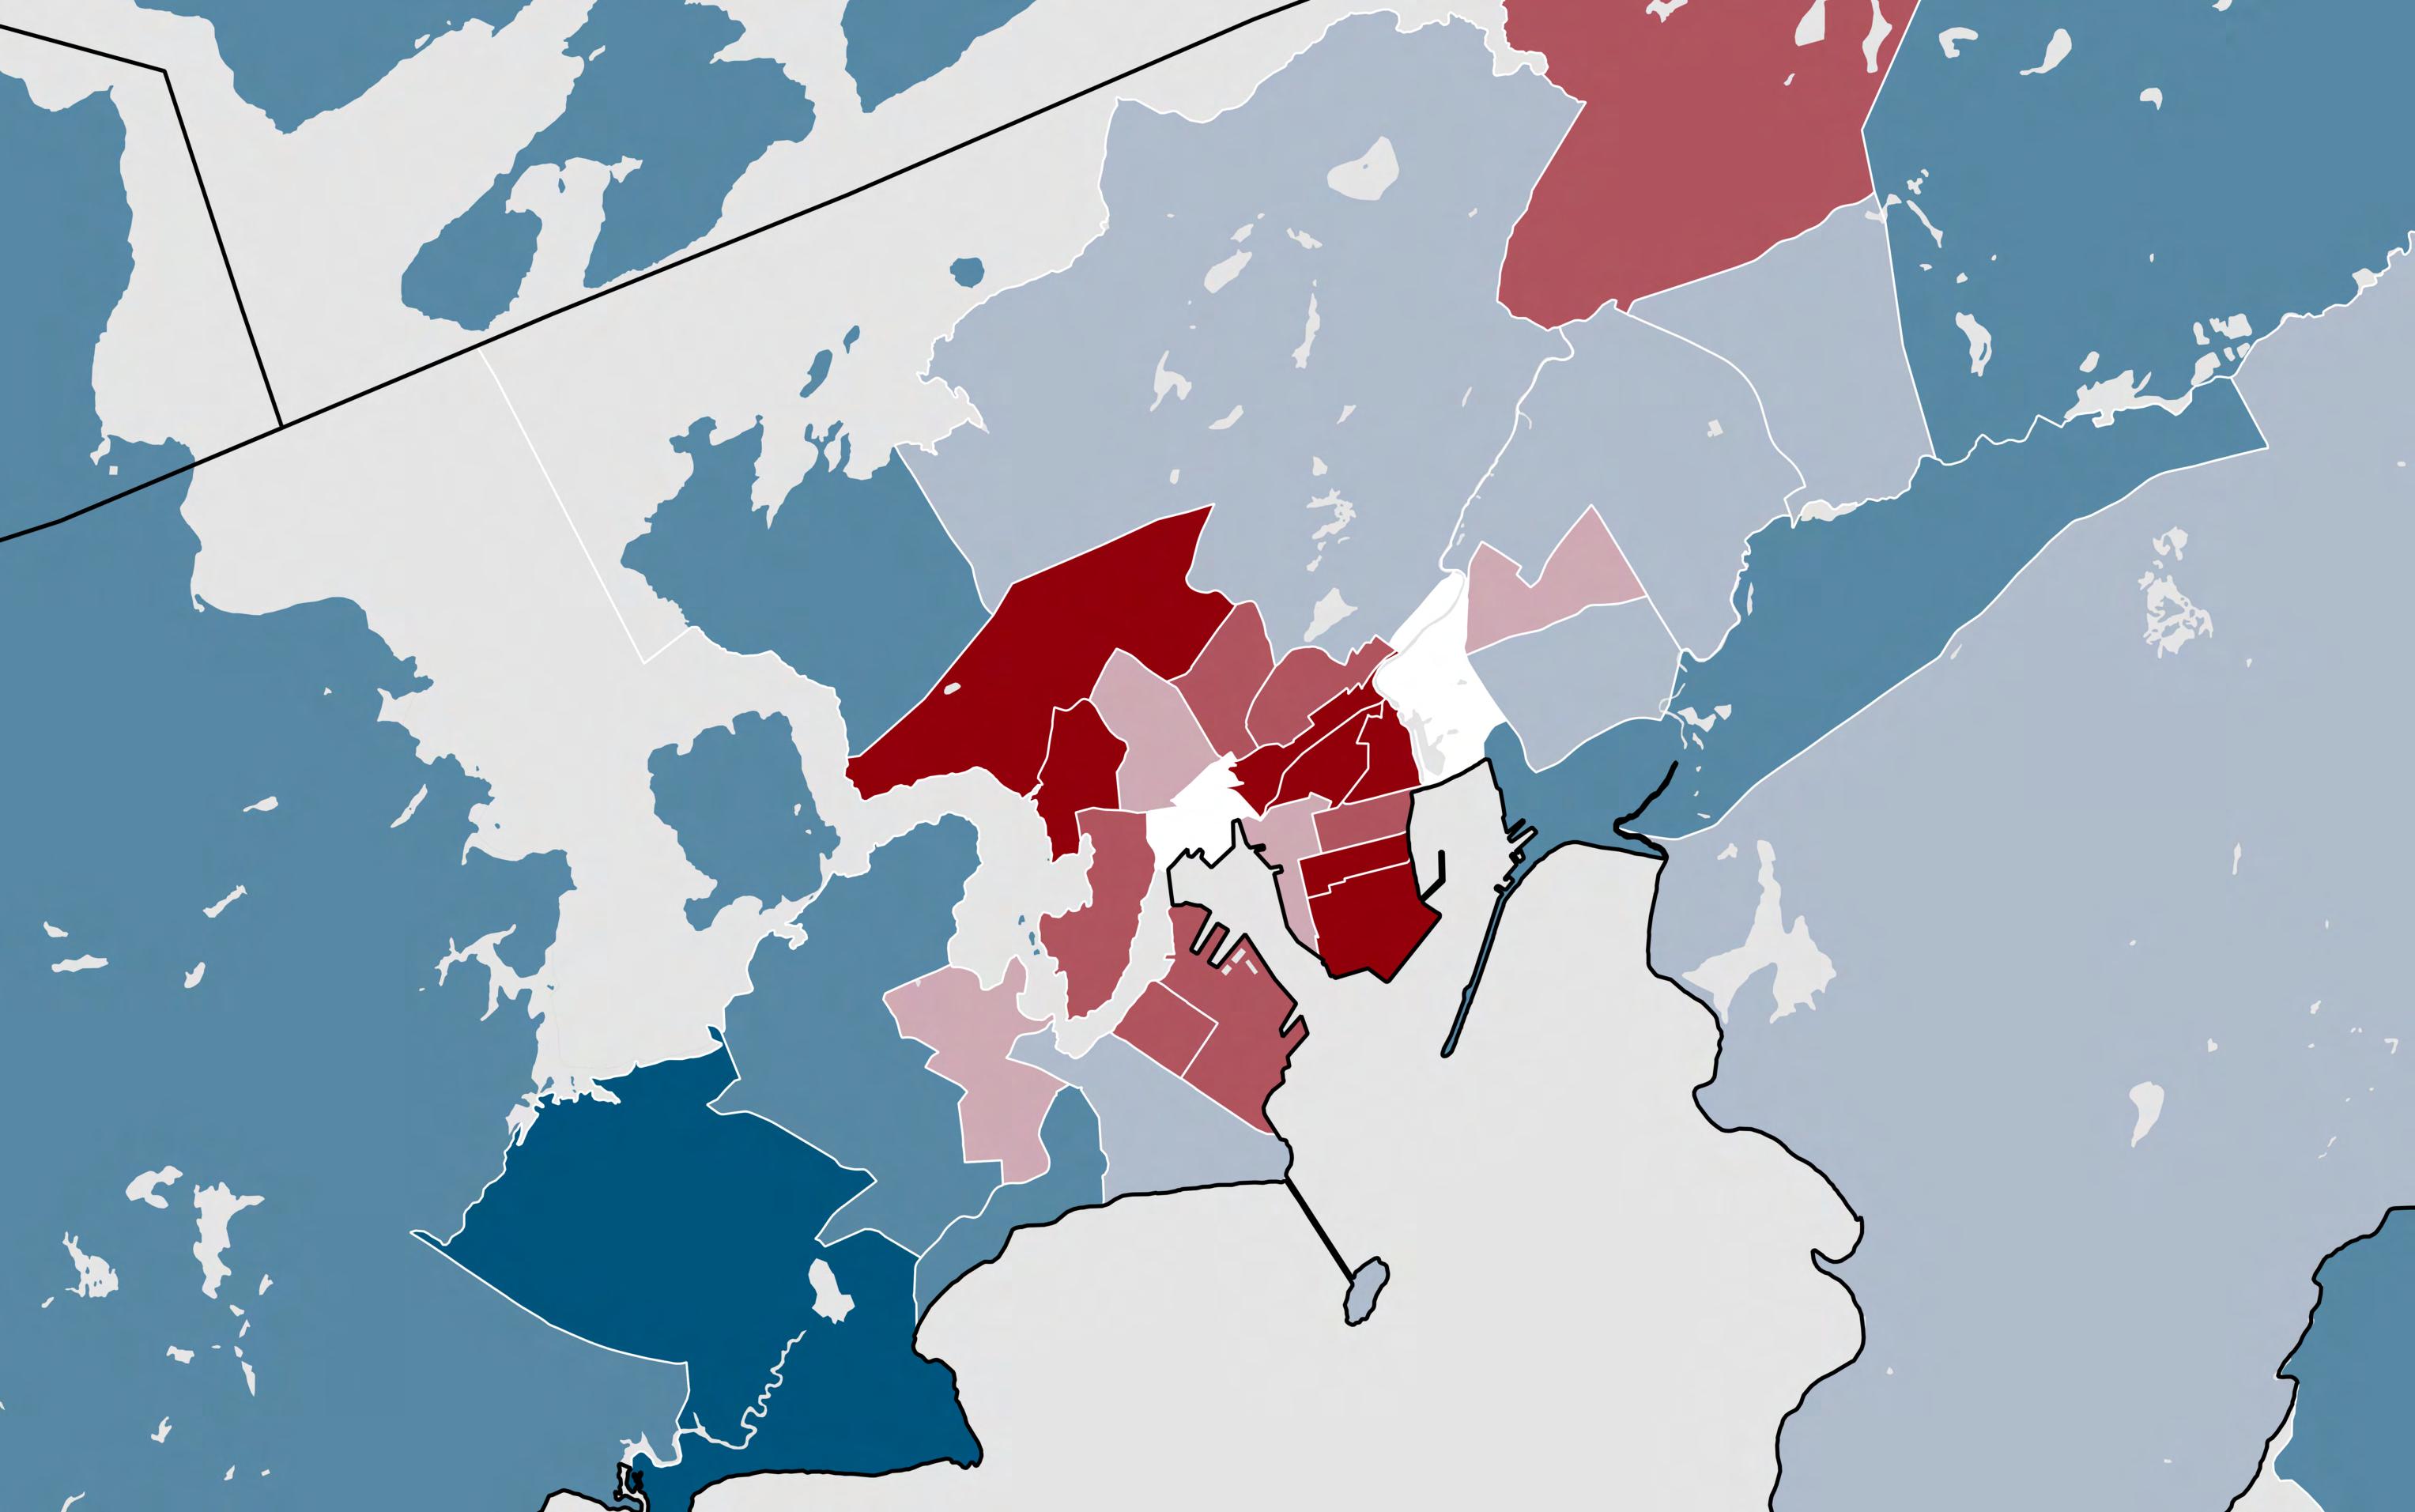
11: Zoom In of Child Poverty Rates by Census Tract the Saint John CMA
Source: Statistics Canada. (2024). T1 Family File Table I-13 - Individual data - After-tax low income status of tax filers and dependents (census family low income measure, CFLIM-AT) for couple and lone parent families by family composition, 2022.
12: Child Poverty Rates by Census Tract the Moncton CMA
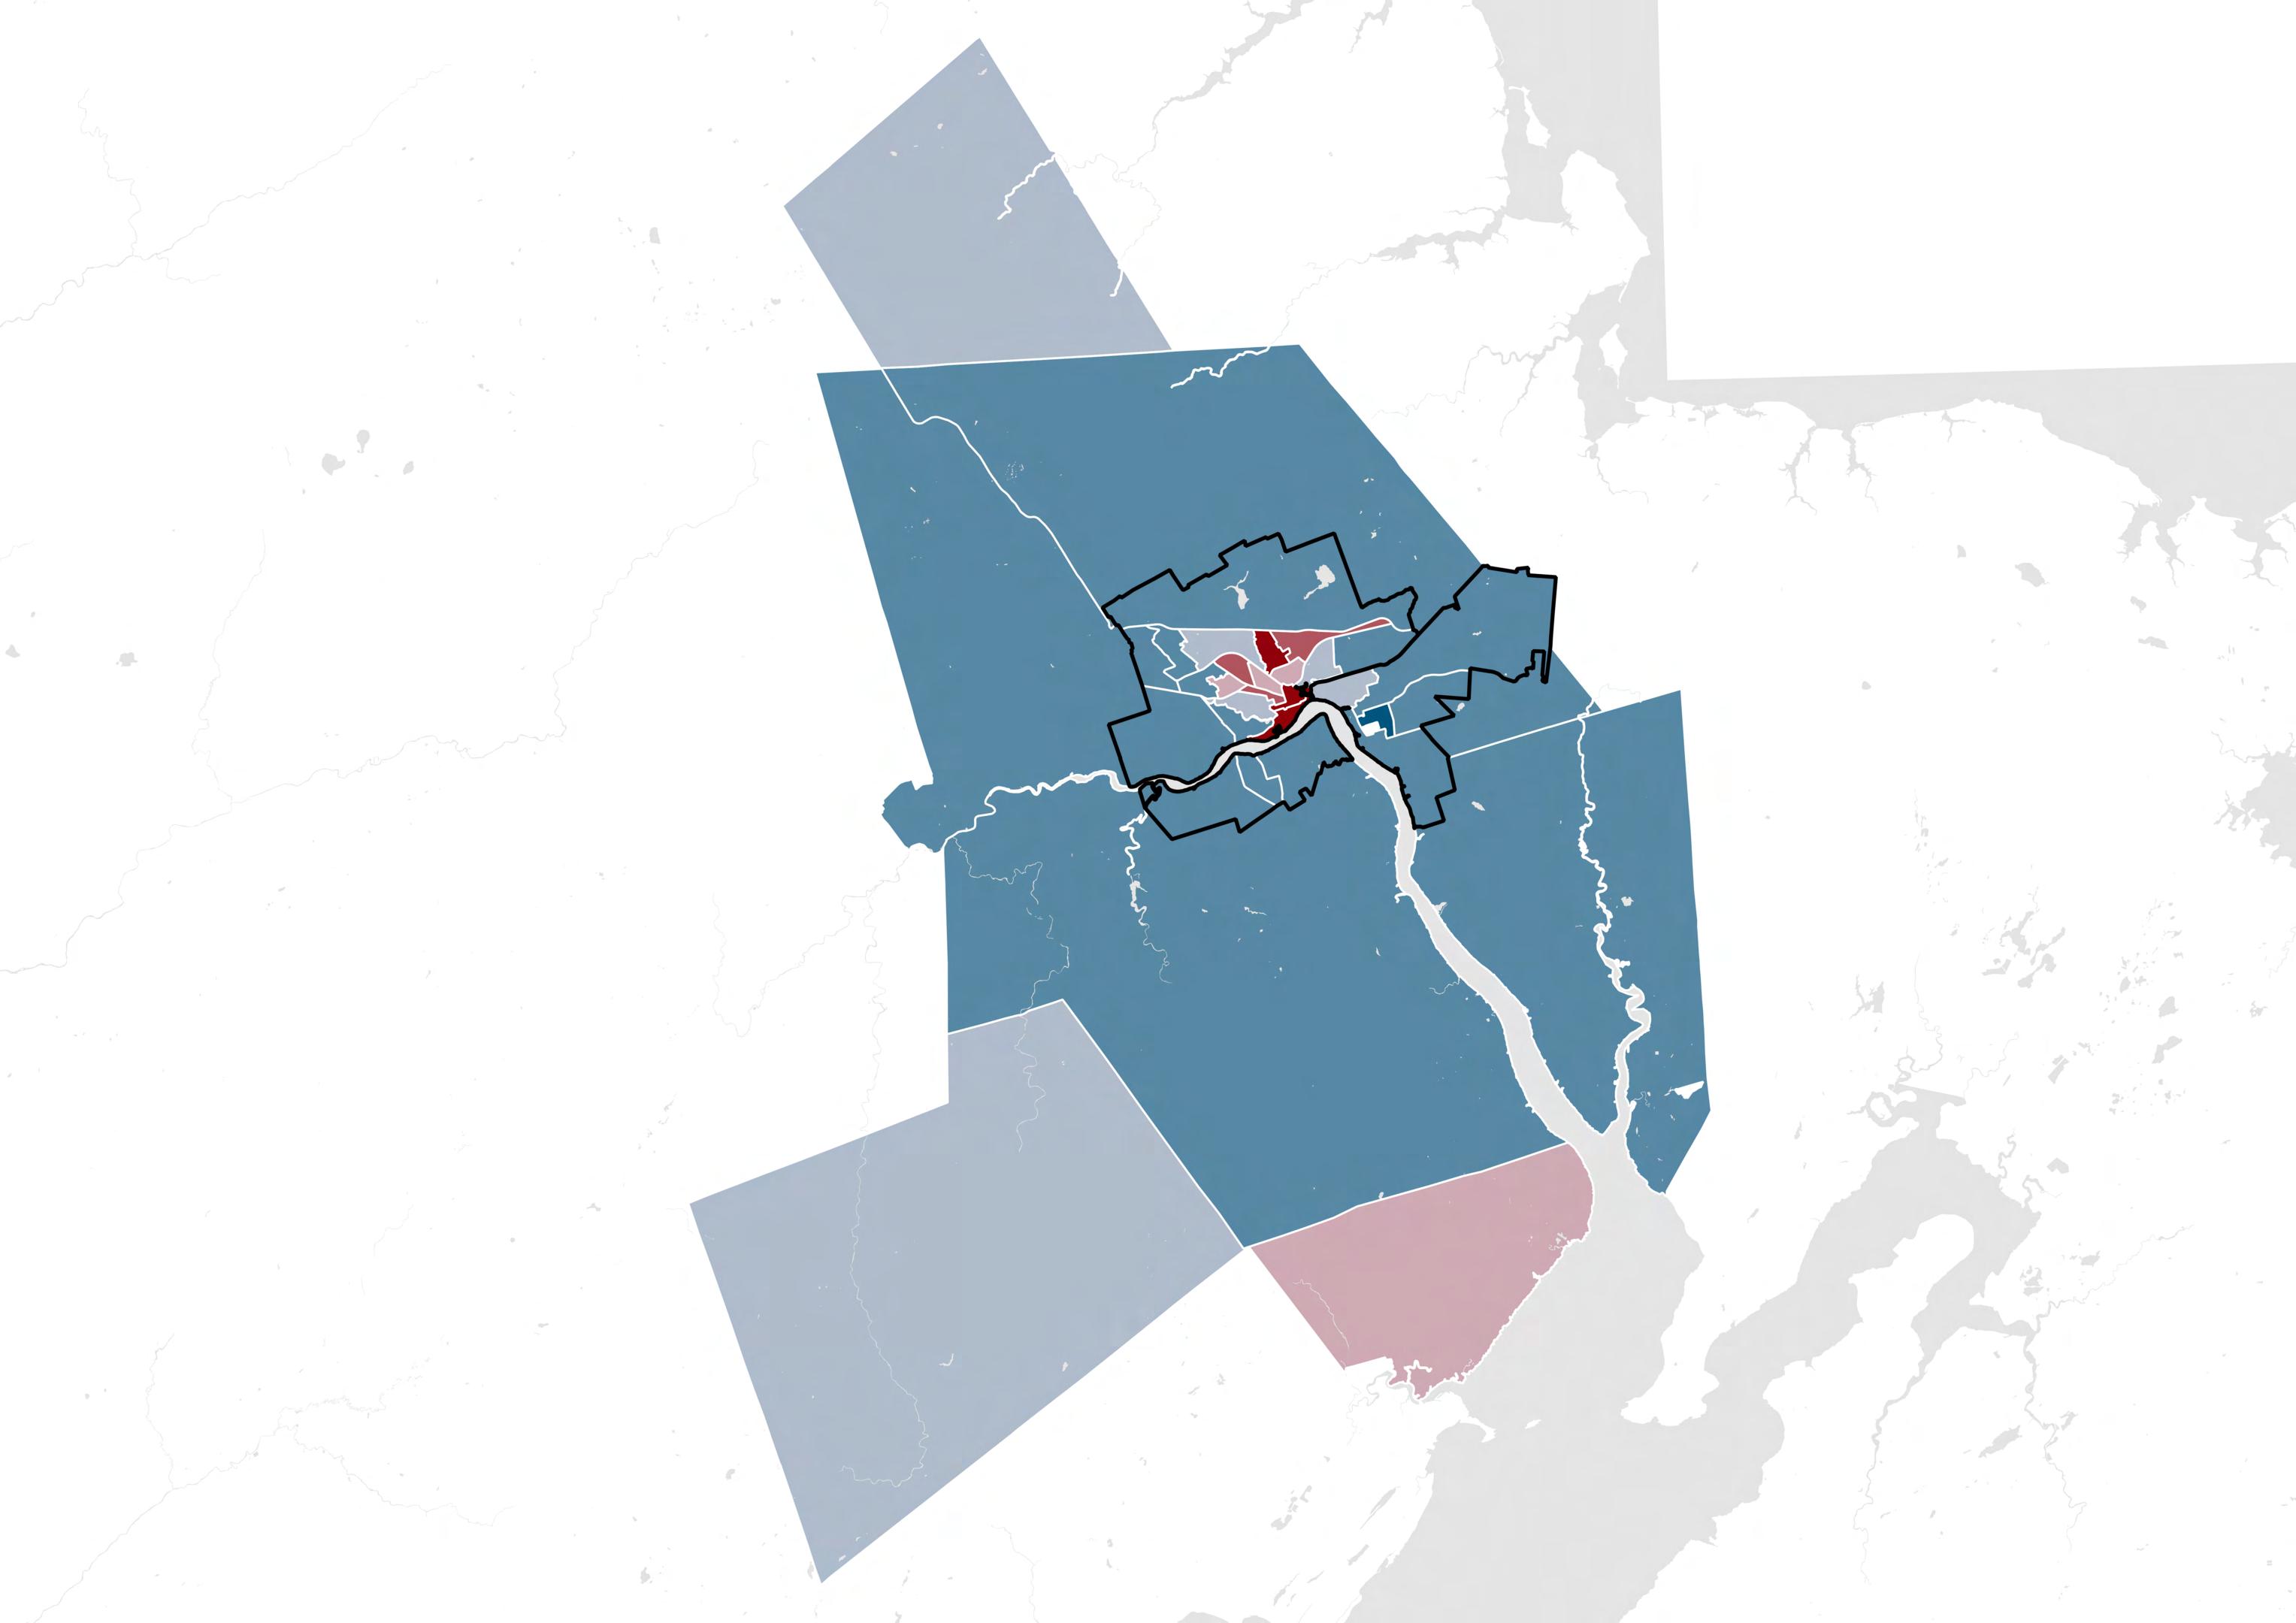
Child Poverty Rate, 2022, CFLIM-AT
< 10%
10% - 20%
20% - 30%
30% - 40% > 50%
40% - 50%
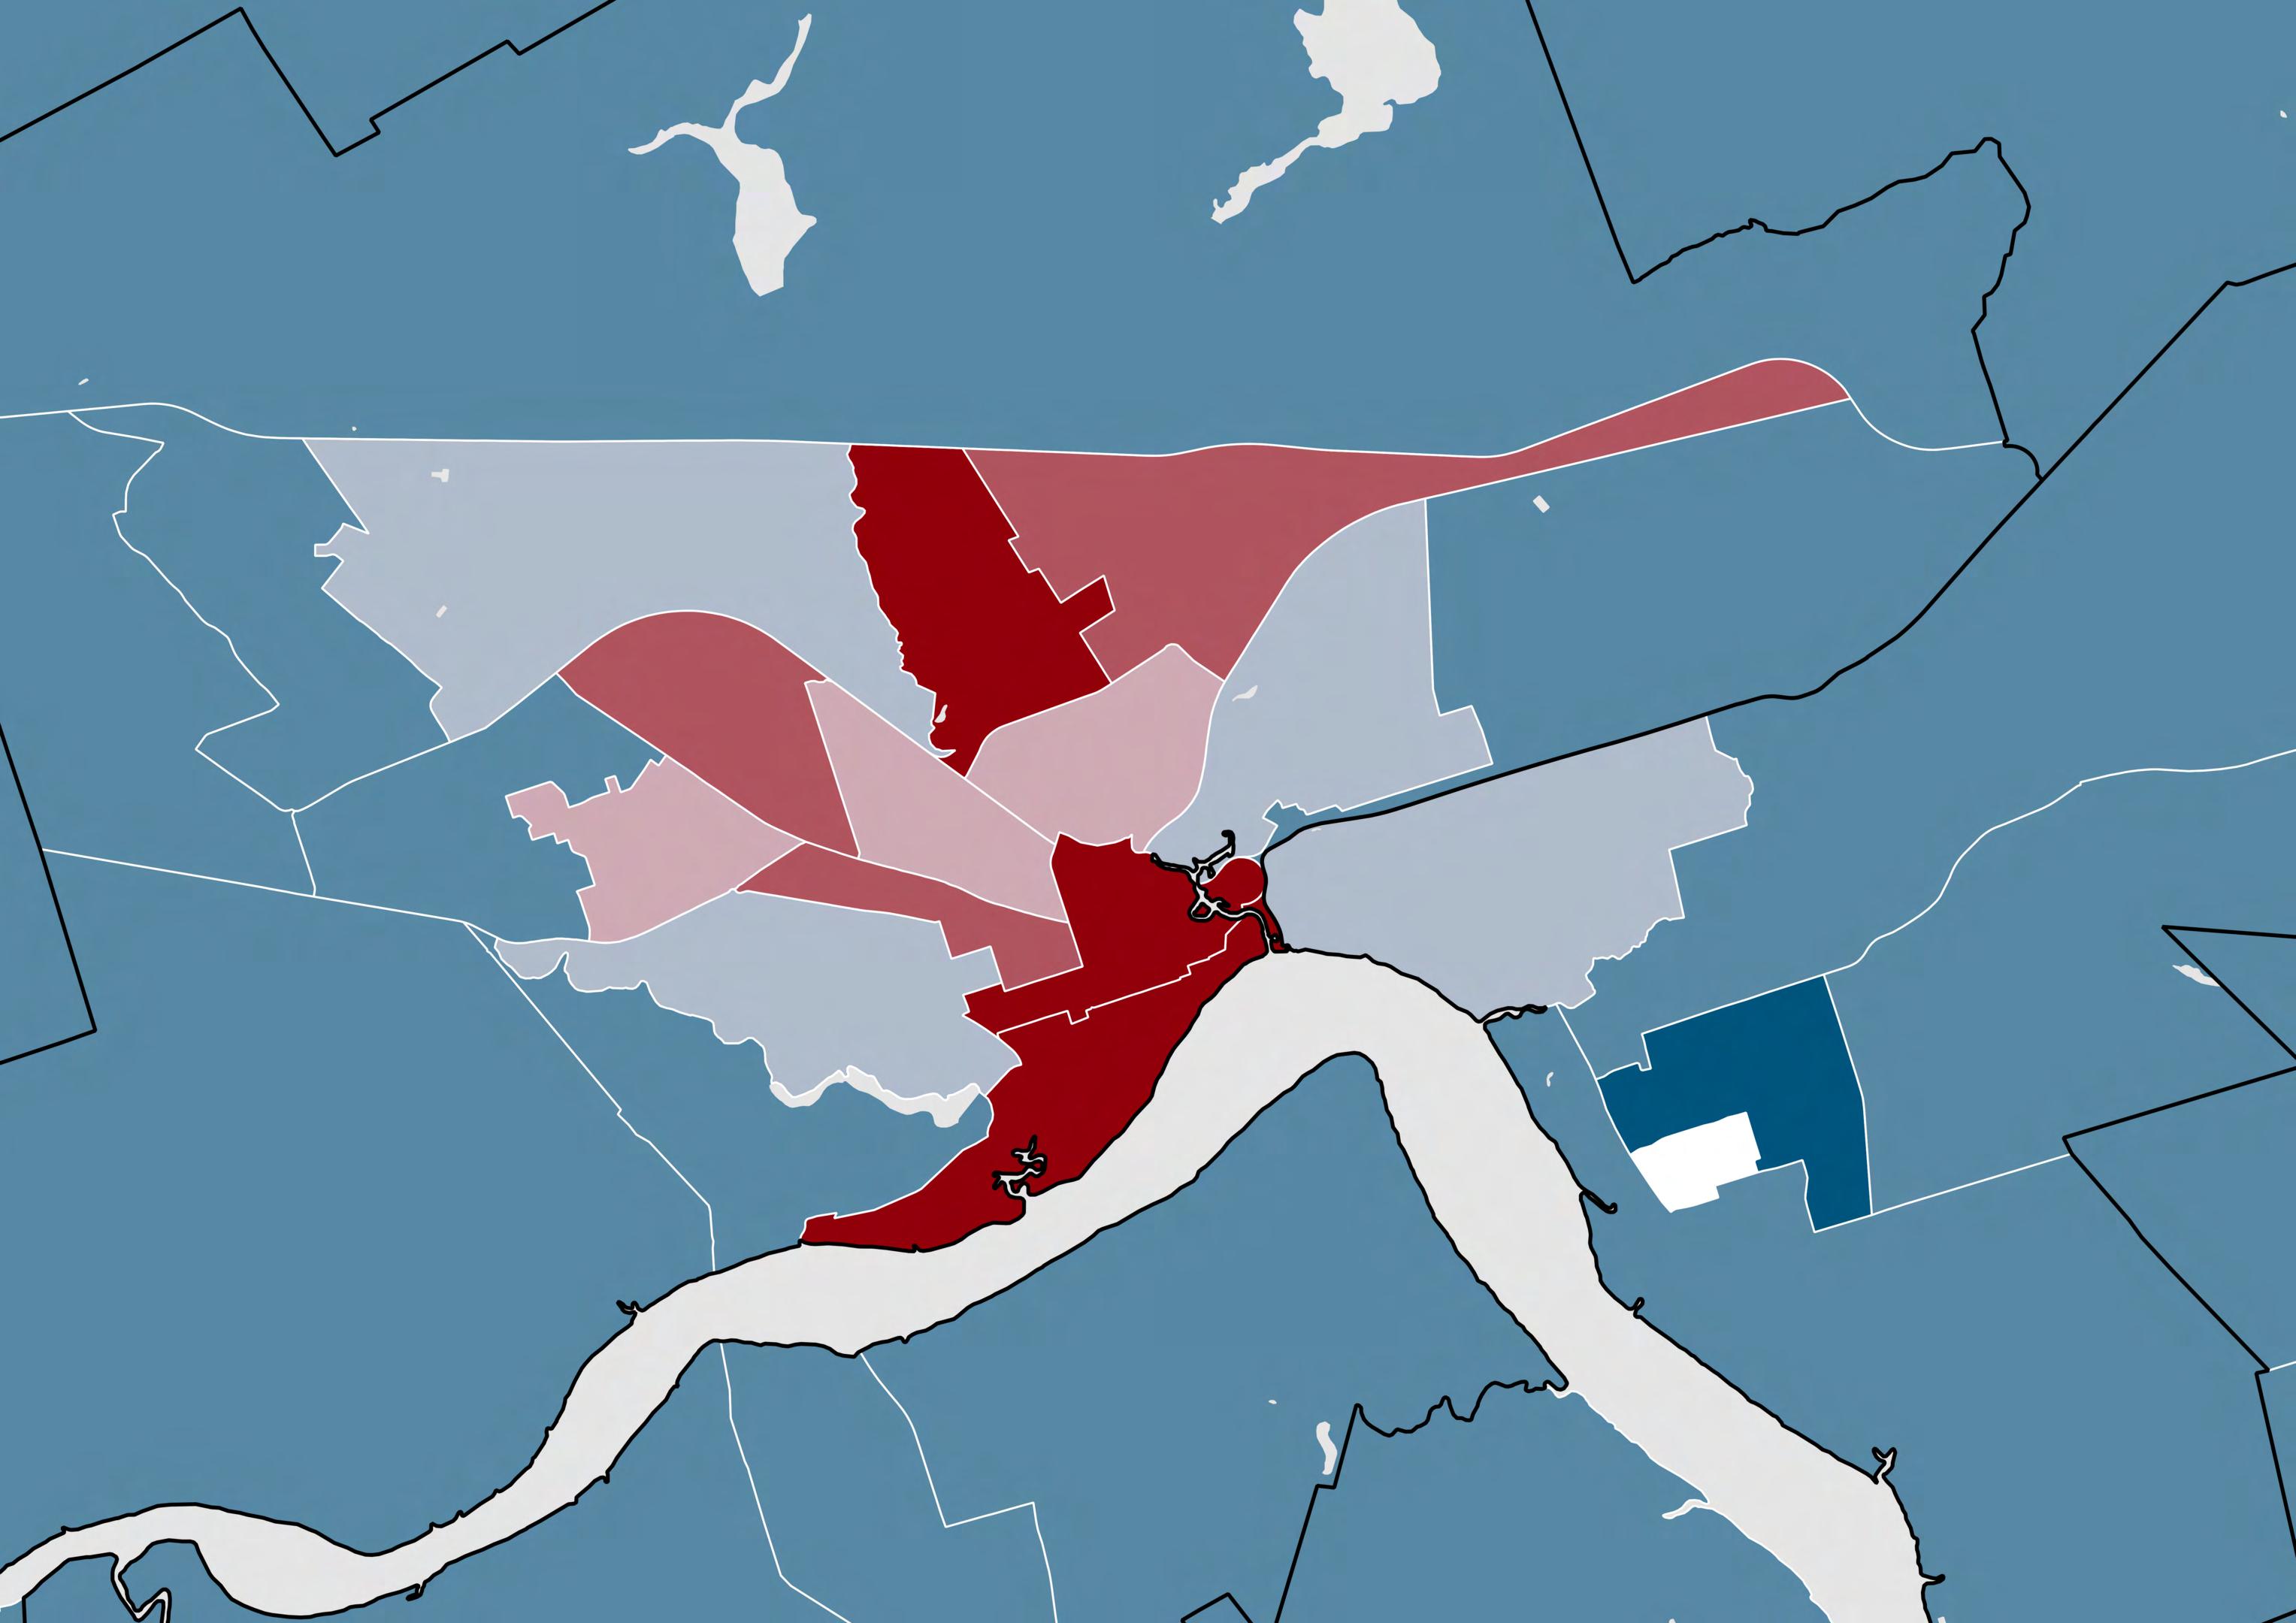
13: Zoom In of Child Poverty Rates by Census Tract the Moncton CMA
Child Poverty Rate, 2022, CFLIM-AT
< 10%
10% - 20%
20% - 30%
30% - 40% > 50%
40% - 50%
Source: Statistics Canada. (2024). T1 Family File Table I-13 - Individual data - After-tax low income status of tax filers and dependents (census family low income measure, CFLIM-AT) for couple and lone parent families by family composition, 2022.
14: Child Poverty Rates by Census Tract the Fredericton CMA

15: Zoom In of Child Poverty Rates by Census Tract the Fredericton CMA
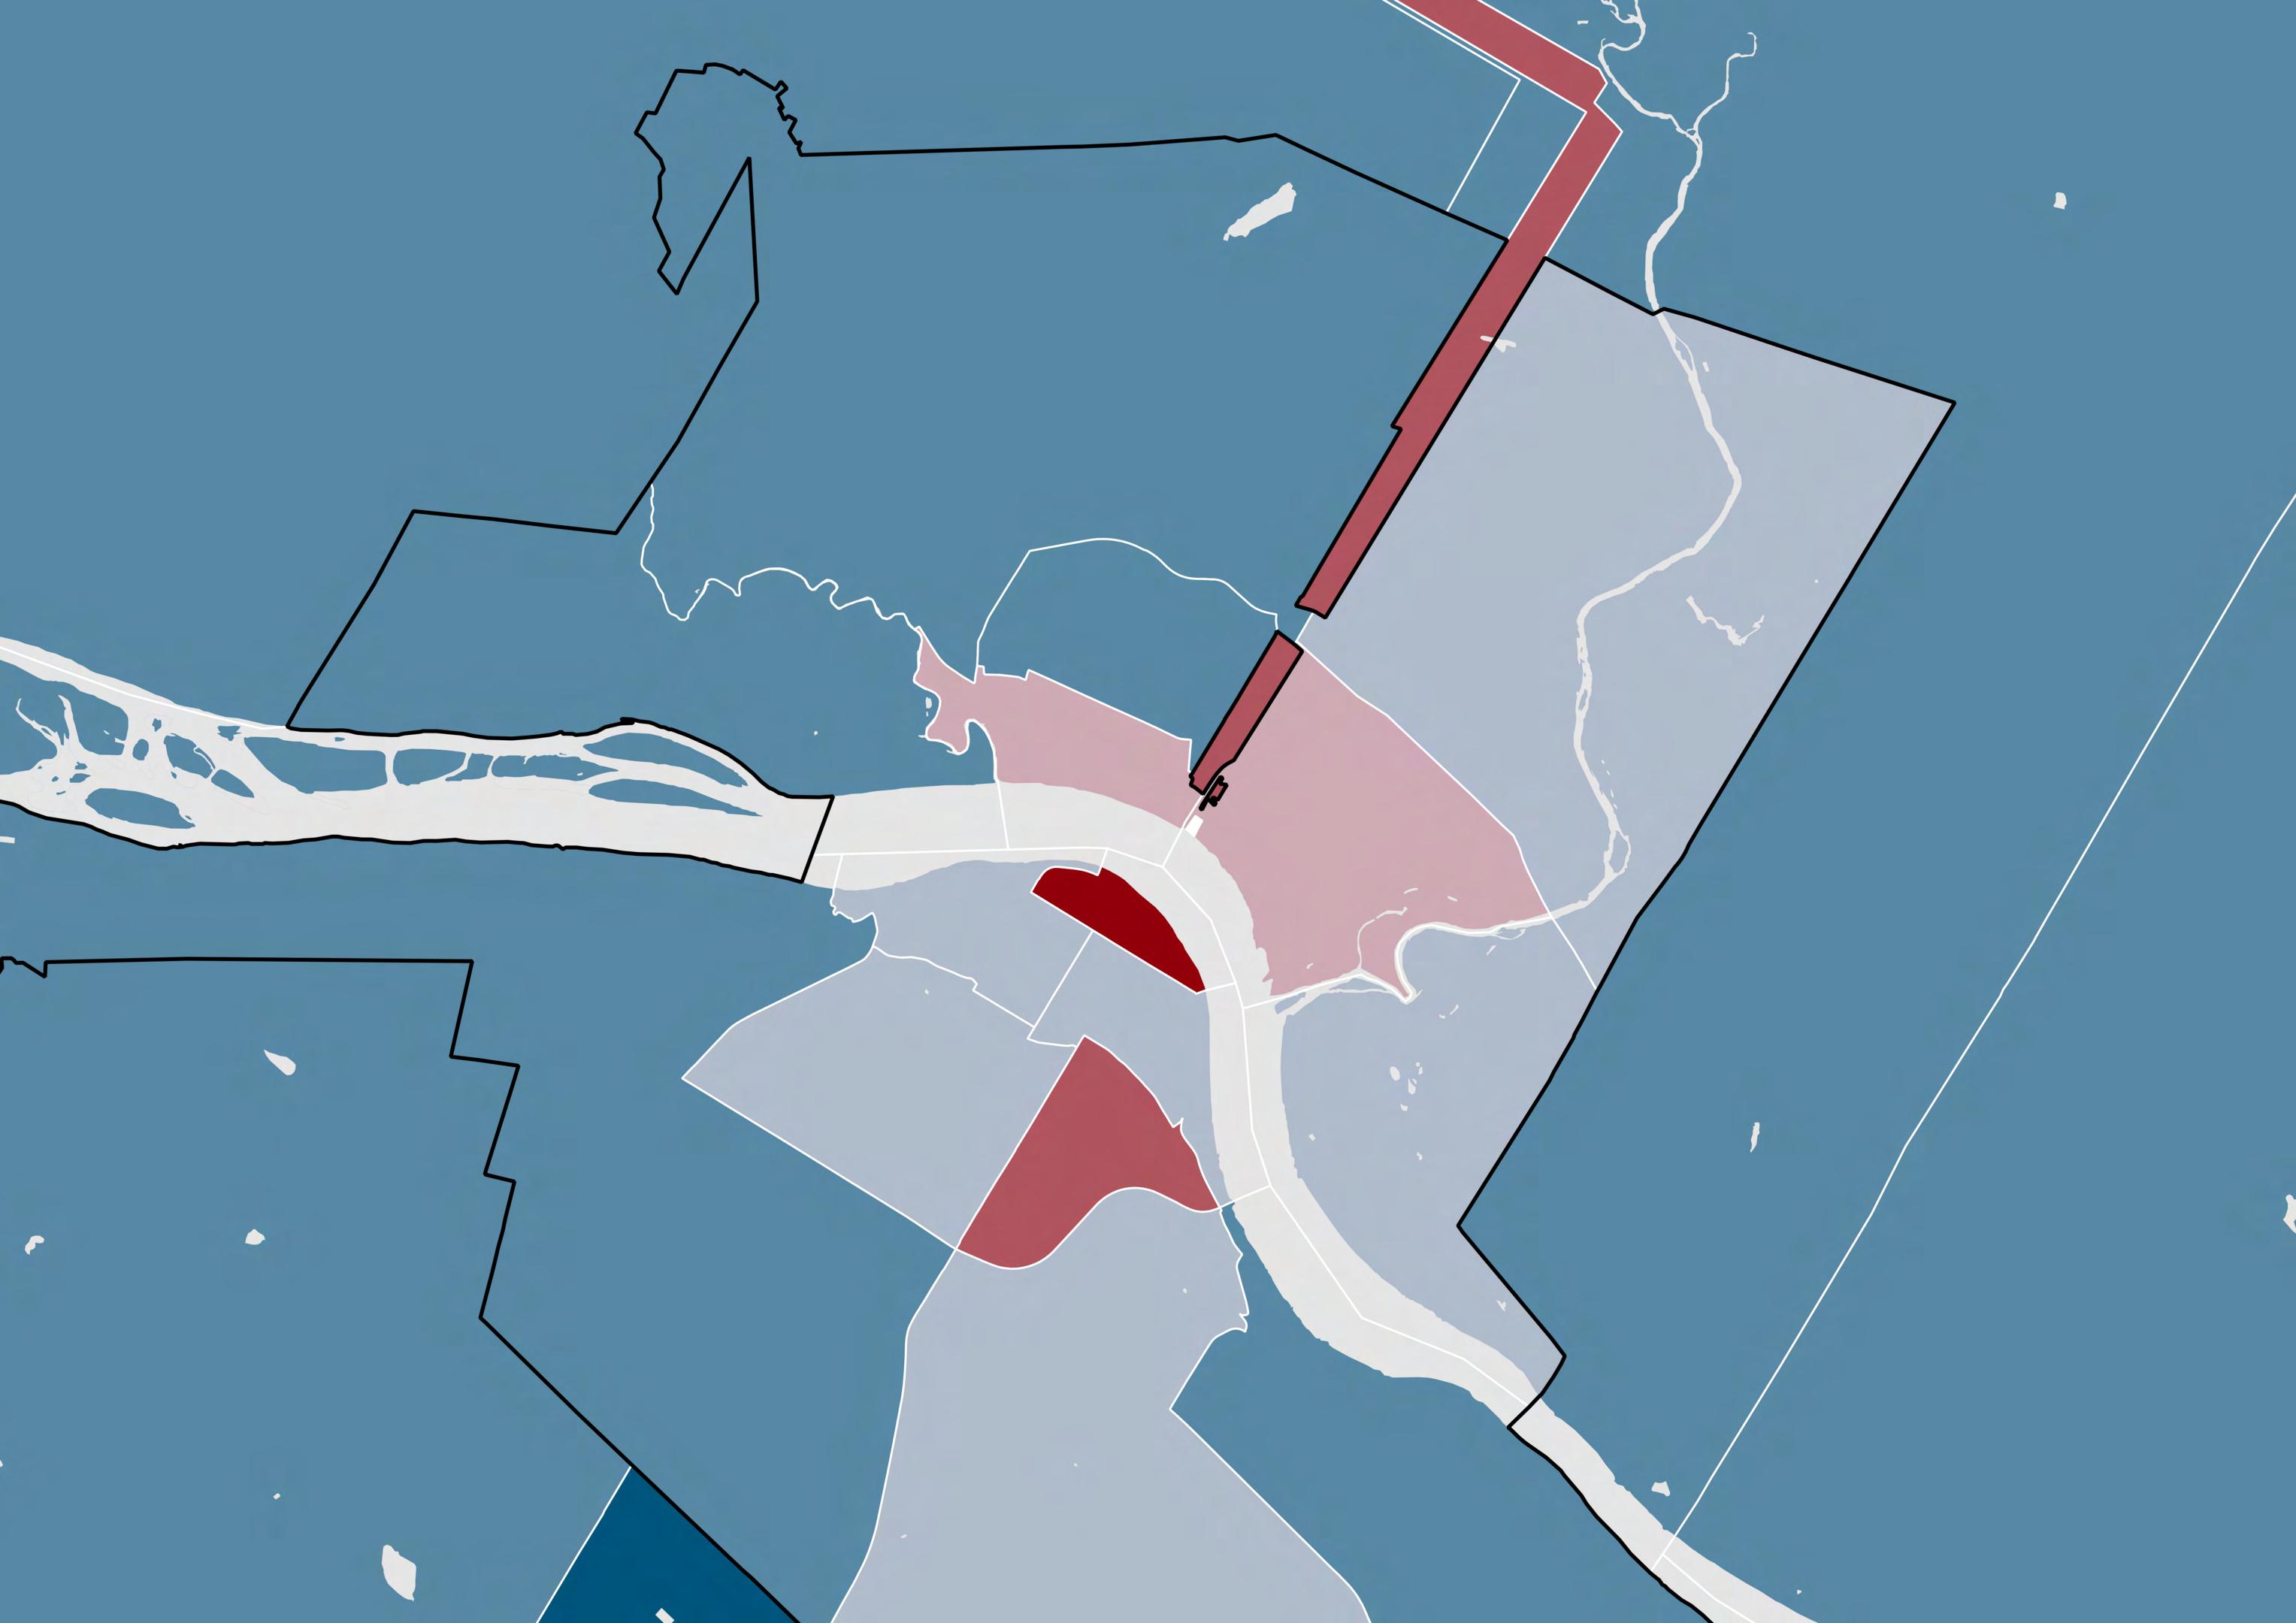
Source: Statistics Canada. (2024). T1 Family File Table I-13 - Individual data - After-tax low income status of tax filers and dependents (census family low income measure, CFLIM-AT) for couple and lone parent families by family composition, 2022.
Child poverty rates exhibit considerable variation within smaller geographic areas across New Brunswick's Census Metropolitan Areas (CMAs). Generally, higher poverty rates are concentrated in central city areas, while suburban neighborhoods tend to have lower rates.
In the Moncton CMA, the lowest child poverty rate was in the suburbs around Parc Centrale in Dieppe. Otherwise, most of Dieppe, along with Riverview and Moncton’s suburban areas, had child poverty rates between 10% and 20%. The exception was the census tract in Dieppe nearest downtown Moncton with a higher rate.
Three census tracts in Moncton had child poverty rates above 50%. The first encompasses downtown Moncton, including parts of Main Street. The second census tract is adjacent to the first and covers George Street and King Street. The third is located further north near the Community Hub on Joyce Avenue.
Saint John shows the greatest range in child poverty among the three CMAs, with rates from 84.6% to 5.7%. The lowest child poverty rates were in places along the Kennebecasis River in Rothesay and Quispamsis, as well as parts of West Saint John. Higher rates were concentrated in the South End, Waterloo Village, Crescent Valley, and areas in the North End near Metcalf and Victoria Street.
The Saint John CMA contained the four census tracts with the highest child poverty across all three CMAs. It also had the two census tracts with the lowest rates, indicating a substantial disparity in child poverty within this region.
In Fredericton, the suburbs had the lowest rates. New Maryland had the lowest child poverty rate within the Fredericton region, and a lower rate than all census tracts except low-poverty areas in Rothesay and Quispamsis. The highest rate in Fredericton was in Bilijk (Kingsclear) First Nation, followed by downtown Fredericton along Kings and Queens Street. Other areas with relatively high child poverty rates include Sitansisk (Saint Mary's) First Nation in the North End, residential neighborhoods near the University of New Brunswick, such as Hanson, Graham, and Windsor Streets, and residential communities in the North End.
New Brunswick has an unequal distribution of income across deciles. The top 10% of incomeearning families with children held a greater share of income than the bottom 5 deciles combined.[14] The highest decile of New Brunswick families with children held 25.7% of total income, while the lowest decile held 1.6%. Year over year, families with children in the 10th decile are getting richer while those in the 1st decile are getting poorer.
In dollar amounts, the bottom decile held an average after-tax income of $15,740, the fifth (median) decile held $75,661, and the top decile held $210,275. The average after-tax income of a family in the highest decile was roughly 13 times higher than that of a family in the lowest. While the total income shares for the top and median deciles increased between 2021 and 2022, the average after-tax income of the bottom decile decreased by more than $2,000.
Policies that seek to redistribute income and improve social policy are essential to address income inequality and end poverty.
Source: Statistics Canada. (2024). T1 Family File, Custom Tabulation.
The rate of child poverty in New Brunswick for children under 6 years of age is 24.4%. The national rate is 18.9%.[15]
Poverty experienced at any age is difficult, but when it is present in the early ages and stages of a child’s development, it can be especially detrimental. Poverty is a social problem created and sustained by structural barriers and systemic inequality. It is an adverse childhood experience and a risk factor for many health conditions. Poverty can impose chronic and toxic stress, which alters a child’s brain architecture and sense of well-being.[16] Children living in poverty are at risk of poor physical and mental health outcomes, including depression and anxiety.[17] The earlier a child experiences poverty, the more likely they are to get caught in its vicious cycle throughout their lifespan.[18] Poverty negatively affects a child’s ability to thrive.
Raising children is expensive, especially in the early years of a child's life. New Brunswick achieved a 50% reduction in child care fees and committed to implementing $10-a-day child care by March 2026. [19] However, barriers to access affordable child care remain for many families. Child care is one of the costliest items for New Brunswick families with children that have not yet received reduced rates for regulated child care.[20] 29% of New Brunswick children live in child care deserts, meaning that there are "more than three children who are not yet in Kindergarten for every licensed full-time space." [21] The province is investing over $20 million dollars to create 3,400 new regulated child care spots in urban and rural areas by March 2026.[22] Enhancing the affordability and accessibility of quality child care services will greatly support children in families experiencing poverty.
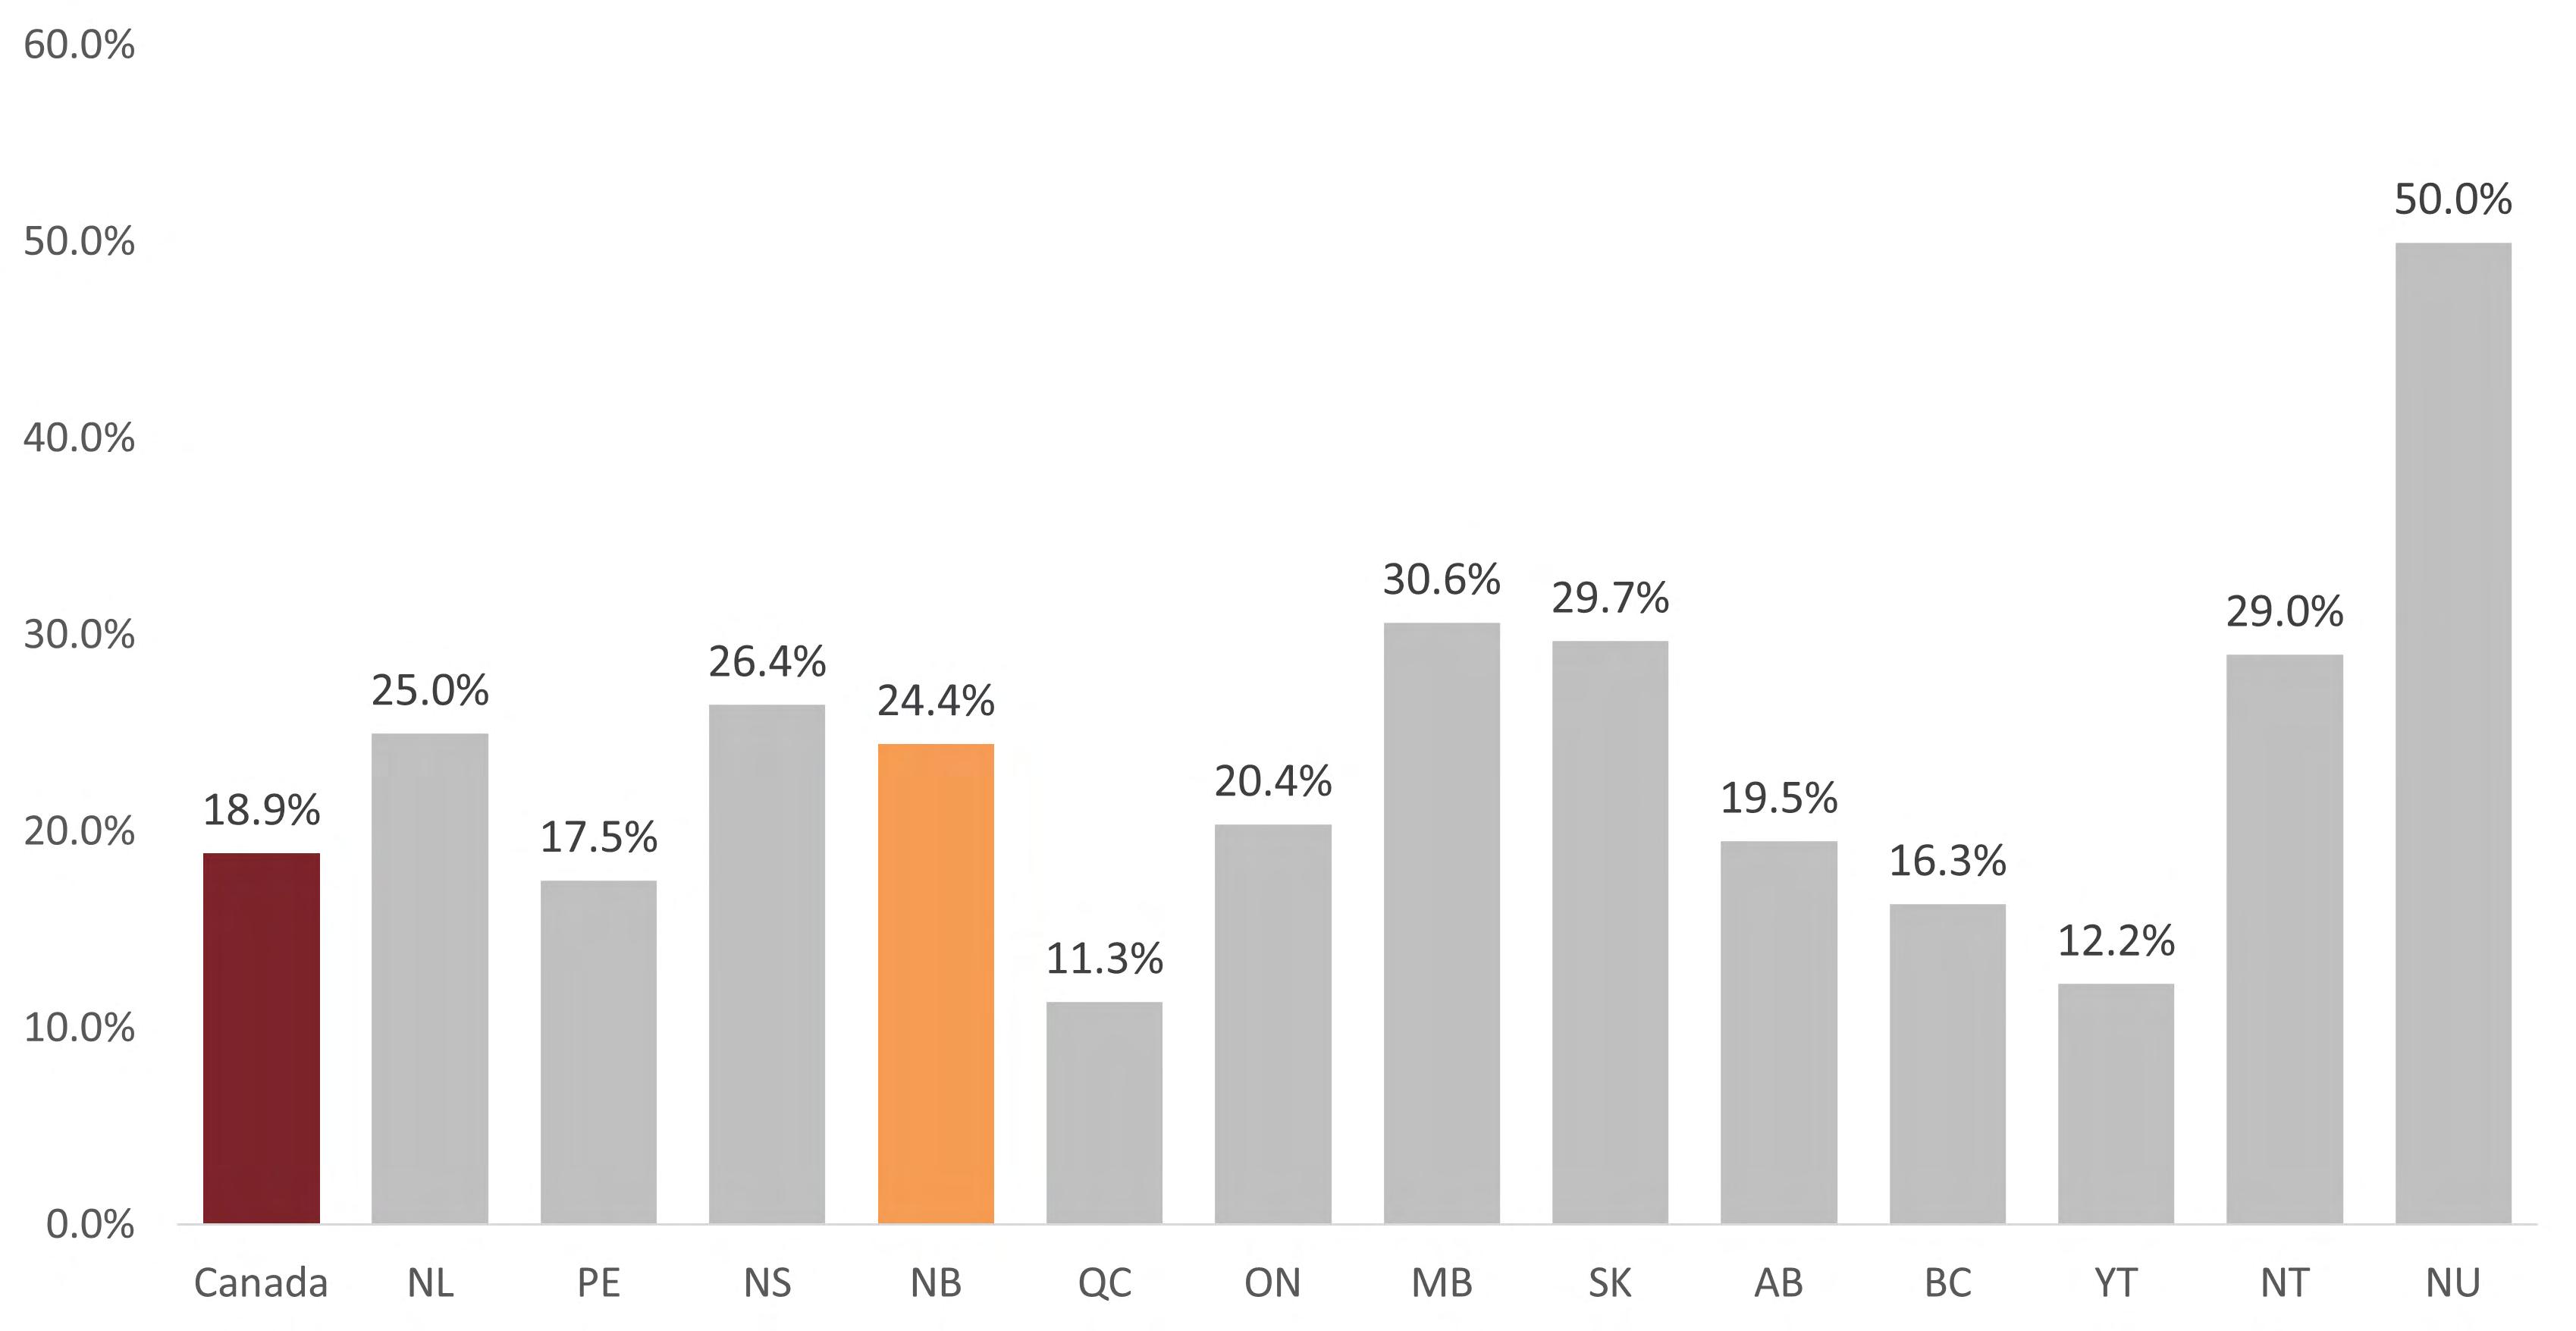
Source: Statistics Canada. (2024). T1 Family File, Custom Tabulation.
Child poverty rates are higher in households headed by one parent. In 2022, the poverty rate for children in one-parent families in New Brunswick was 47.9% (18,510), compared to 11.2% (11,560) for children in couple families. The provincial poverty rate for children in one-parent families is greater than the national average of 45.3%.[23]
Income inequality by family type is apparent across deciles. Female-led families tend to have the most severe experiences of income poverty. They face systemic oppression and inequity which contribute to issues like the gender pay gap. Sometimes female lone parents must work multiple jobs to satisfy their household’s basic needs, with little to no leftover disposable income. Their employment opportunities tend to be lower-wage work in labour force sectors like retail, food service, and hospitality. Female lone parents carry the double burden of providing for their family financially while simultaneously being the sole caregiver at home.
One-parent families headed by a female have the lowest average incomes in the 1st (lowest), 5th (median), and 10th (highest) deciles.[24] Female oneparent families in the highest decile brought home a little over $99,600, while couple families had an average income above $227,000. The average income for a female one-parent family in the lowest decile was just over $7,900, while couple families in the same decile had an average income of approximately $32,000. Single-income earners in the lowest decile have inadequate wages that make it difficult to make ends meet, let alone have a good quality of life.
Figure 19: Average after-tax incomes of couple, female one-parent, and male one-parent families in the lowest, fifth, and highest deciles, 2022
Children from Indigenous communities experience high poverty rates. The 2021 Census reports that 23.9% (2,040) of Indigenous children lived in poverty in New Brunswick, compared to 15.3% (19,215) of children of non-Indigenous identity.[25] Of children living on reserves in New Brunswick, 49.2% lived in poverty in 2022. The province has a total Indigenous population of 33,300 and total Indigenous child population of 6,985.[26]
The lasting effects of colonialism, racism and intergenerational trauma exacerbate child poverty for Indigenous children. They create additional obstacles for children seeking to reach their potential because they restrict access to resources, opportunities, and power.
Indigenous children are overrepresented in the Canadian child welfare system.[27] Many Indigenous children in care are removed from their families and communities, which leads to a loss of culture, language, and identity. This perpetuates harm caused by residential schools and the Sixties Scoop. The latter refers to the large-scale removal of Indigenous children from their birth families and communities from the 1960s to 1980s, which occurred without consent from their families and bands.
Children living on First Nation reserves have some of the highest poverty rates in Canada. Their experience of poverty goes well beyond a low family income. They face added challenges like substandard housing, unsafe drinking water, poorer health, and high suicide rates.
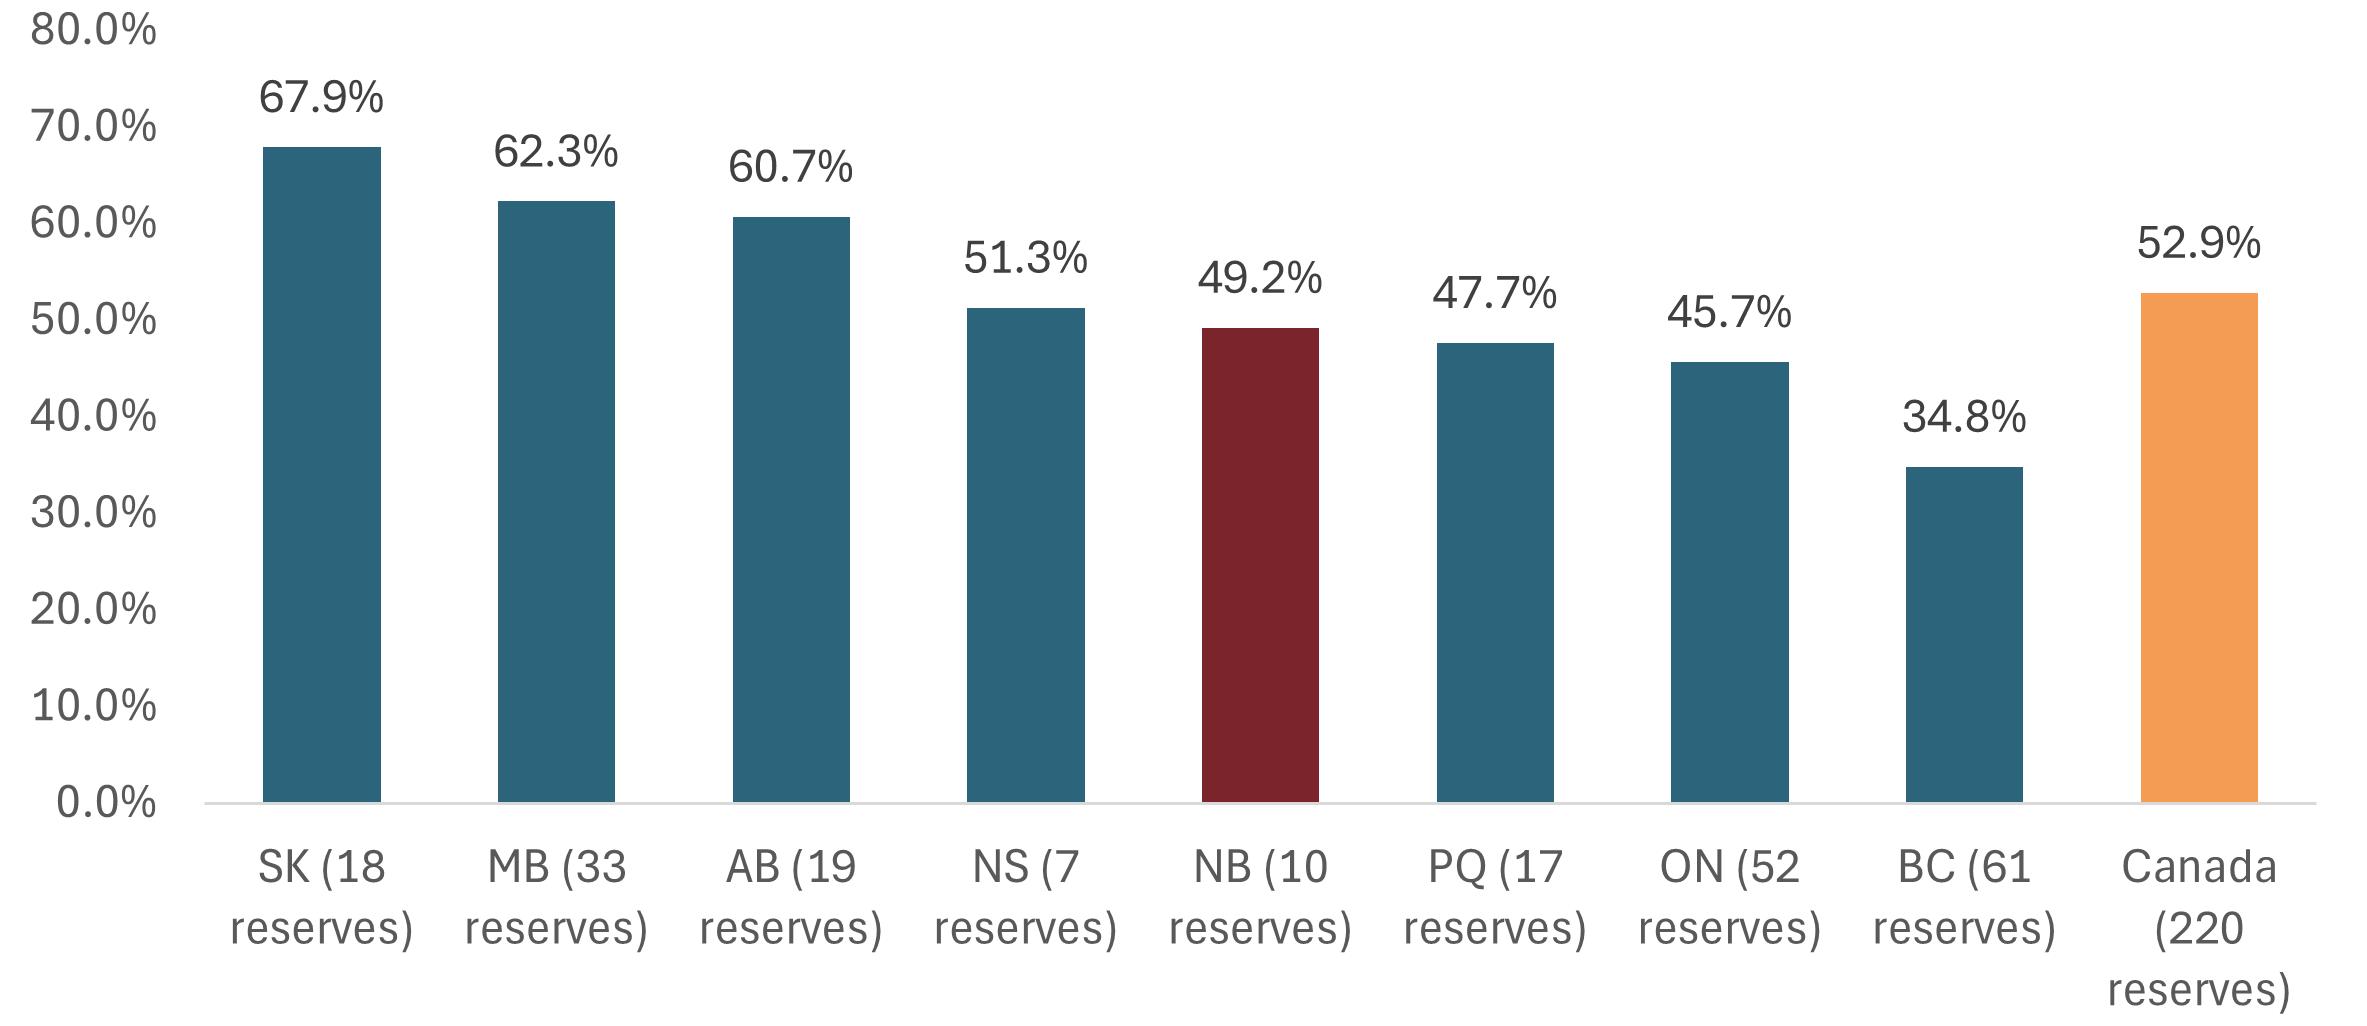
Source: Statistics Canada. (2024). T1 Family File. Table I-13 - Individual data - After-tax low income status of tax filers and dependants (census family low income measure, CFLIM-AT) for couple and lone parent families by family composition, 2022. Note: Figure 20 includes the number of reserves for which data was available. In New Brunswick 10 reserves had data available.
Government transfers are a highly effective poverty reduction tool. They provide individuals and families with supplemental income, which reduces overall low-income rates. Government transfers like the Canada Child Benefit, Employment Insurance, GST/HST credits, and the Canada Workers’ Benefit can lift families out of poverty and prevent them from experiencing it altogether. Without government transfers, the provincial child poverty rate would be 38.8%.[28]
Child Poverty Rate With Government Transfers
(31,430 children)
Child Poverty Rate Without Government Transfers
(55,650 children)
Child poverty would be 2X as much without government transfers.
The Canada Child Benefit (CCB) is a tax-free monthly payment to help eligible families cover the cost of raising children under 18. The data demonstrate that this government transfer, much like the temporary income support programs introduced in the first year of the COVID-19 pandemic, is instrumental in poverty reduction.
The CCB lifted 14,580 New Brunswick children out of poverty.[29] This government transfer alone reduces the provincial child poverty rate by approximately 10 percentage points. However, the CCB is losing its effectiveness over time. In 2021, it reduced the child poverty rate by 12 percentage points.
NB Child Poverty Rates With and Without Canada Child Benefit (CCB)
The Government of New Brunswick’s Department of Social Development provides financial assistance to individuals and families in need via its Social Assistance Program. Rates are determined by the provincial government and indexed to inflation annually. Eligibility for the income assistance rate and program offerings depends on household composition and employability. Despite year-overyear rate increases, Social Assistance rates remain woefully inadequate. Table 1 displays current Social Assistance rates for different household types.
Rental Market Survey data from the Canada Mortgage and Housing Corporation indicates that the median rent for a 3-bedroom accommodation in Moncton is $1,269.[30] A couple receiving social assistance cannot afford to live in a market rental unit at that cost. The rent amount alone exceeds rates for the Transitional Assistance and Extended Benefits Programs. The couple would have no funds
left over for additional living expenses. The escalating cost of living is exacerbating housing insecurity and homelessness among low-income households. Increased investment in affordable and subsidized housing programs can alleviate the financial strain and stress many people are facing.
In February 2024, the Government of New Brunswick introduced a new affordability measure for eligible social assistance recipients called the “Household Supplement.” This special benefit of $200 monthly is intended to help cover rising shelter and food costs.[31] While it is a positive step toward supporting low-income households, it is only a temporary solution. To improve the well-being of Social Assistance recipients, basic rates must be increased to reflect the realities of today's economy. We need comprehensive social policies and programs to help people get ahead, not just get by.
Rates effective April 2024
Source: Government of New Brunswick's Department of Social Development Policy Manual.
In 2023, New Brunswick and Nova Scotia had the lowest welfare incomes in Canada.[32] Welfare incomes include provincial social assistance payments, plus federal and provincial child benefits (if applicable), and federal and provincial tax credits or benefits.[33] The total welfare income of a reference family in Moncton with one parent and
one child was $22,985.[34] A reference family with a couple and two children had a total welfare income of $30,395.[35] Individuals and families with welfare incomes receive far less than the income standards of MBM and LIM poverty thresholds.
Table 2: Adequacy of Welfare Incomes in New Brunswick Total welfare income
Adequacy Indicator
MBM threshold (Moncton)
Welfare income minus MBM threshold
Welfare income as % of MBM
LIM threshold (Canada)
Welfare income minus LIM threshold
Welfare income as % of LIM
Unattached single considered employable Couple, two children
Unattached single with a disability Single parent, one child
Source: Laidley, J., & Tabbara, M. D. (2024). Welfare in Canada, 2023. Maytree.
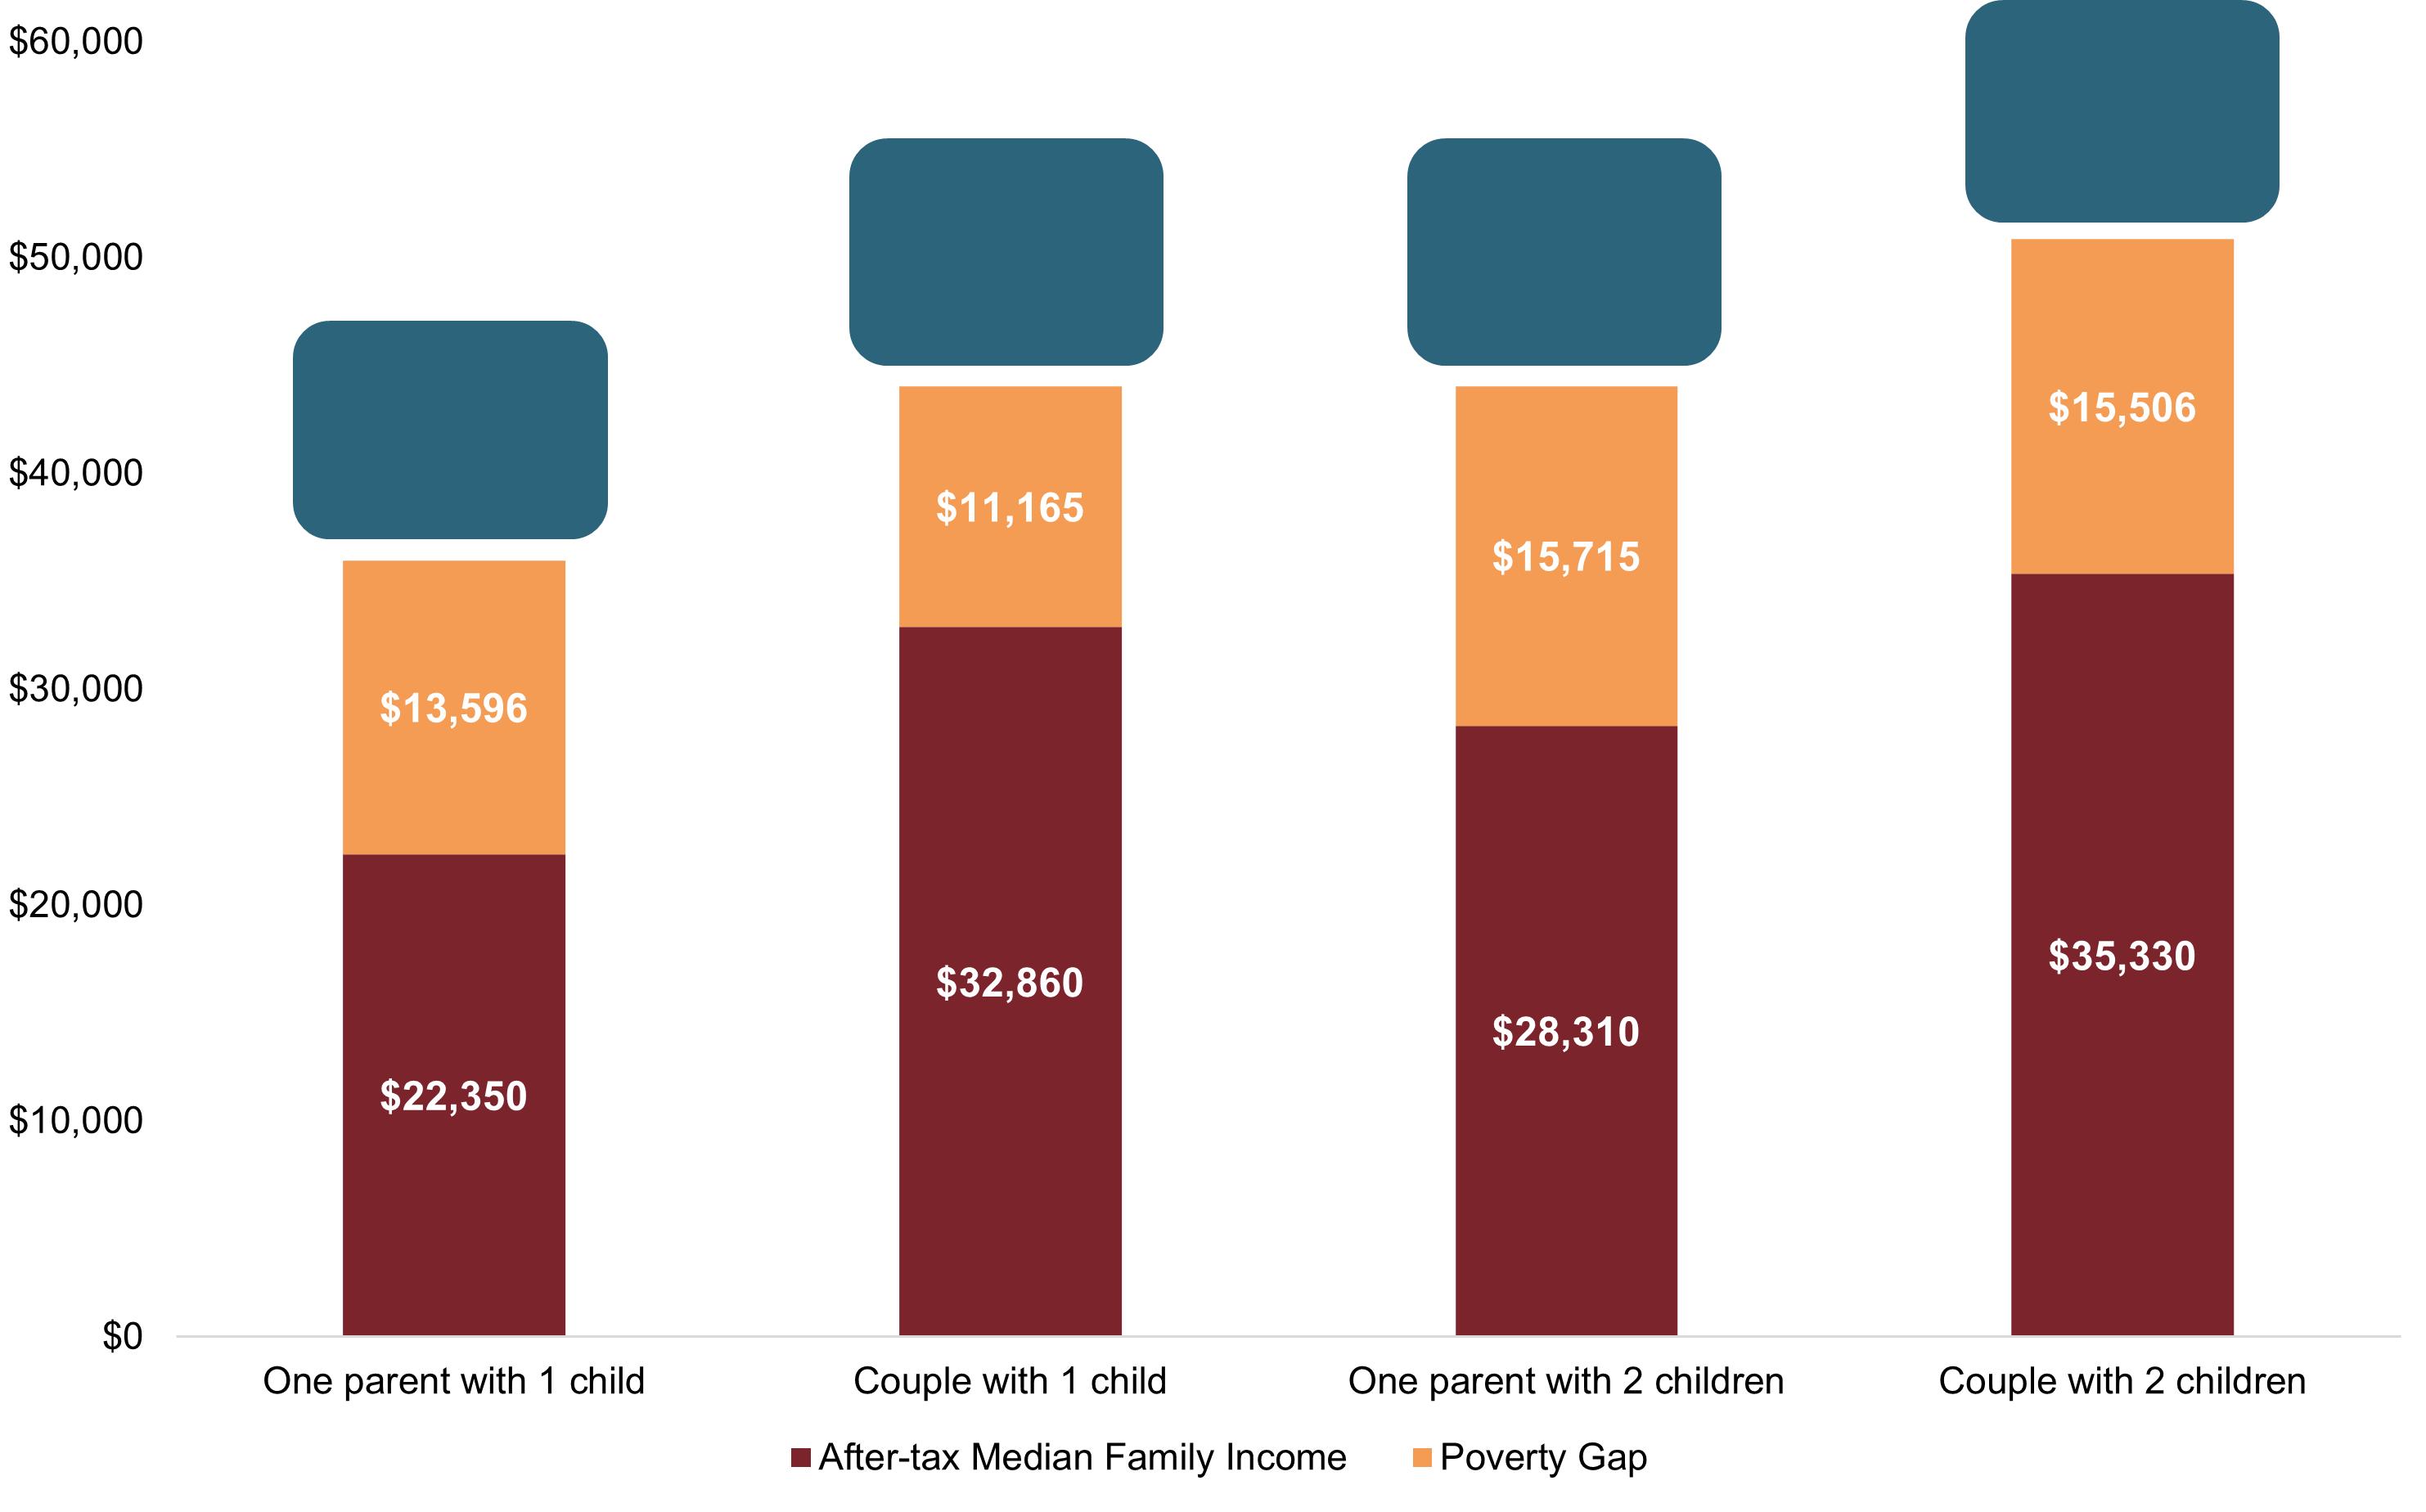
The depth of poverty is the difference between the poverty line and a family’s after-tax median income. It is the amount of money required to lift a family out of poverty. In 2022, the after-tax median income for a low-income family of four grew to $15,506 below the poverty line (see Figure 21).[36] In 2020, the gap between a four-person family’s after-tax median income and the poverty line was $9,642.[37]
Pandemic income support programs reduced the depth of poverty for families that year. The gap between the poverty line and a family’s after-tax median income widened once those income supports were discontinued. The depth of poverty intensifies the more inflation and living costs outpace income.
21: Depth of Poverty for Low-Income Families in New Brunswick, CFLIM-AT, 2022
Source: Statistics Canada. (2024). T1 Family File. Table 11-10-0020-0; Statistics Canada. (2024). Technical Reference Guide for the Annual Income Estimates for Census Families, Individuals and Seniors. T1 Family File, Final Estimates, 2022.
For two decades, from 2000 to 2019, New Brunswick saw an average annual rent increase of no more than 1.4%, with the average yearly rise at just 1.0%, according to the Consumer Price Index.[38] During this period, New Brunswick consistently experienced lower rent increases than the national average, with annual rent hikes staying below Canada’s rate in 17 out of the 20 years.[39] Despite some issues with core housing needs and substandard housing, New Brunswick showed better trends in housing affordability compared to the rest of Canada.
However, the last four years have marked a drastic change. Rent prices in New Brunswick have surged, erasing two decades of relatively stable increases. From September 2020 to September 2024, rent rose by 36.3%, according to the Consumer Price Index. [40] From 2019 to 2023, New Brunswick’s average annual rent increases surpassed the national average.[41]
In 2023, New Brunswick’s rental wage—defined as the minimum hourly wage needed to afford adequate housing without spending more than 30% of total income on rent—was calculated at $17.96 for a one-bedroom apartment and $22.50 for a twobedroom. Since 2018, the rental wage has increased by 41% for a one-bedroom and 46% for a twobedroom apartment.[42]
This spike in rent has also increased the number of hours that minimum-wage workers need to work to cover their housing costs. By 2023, minimum-wage workers had to work 48.7 hours per week to afford a one-bedroom apartment, up 3.5 hours from 2018, and 61 hours per week for a two-bedroom, an increase of 6.2 hours. Wages for low-income workers are not keeping pace with these rising rent costs, further intensifying housing challenges.[43]
The National Housing Strategy Act, passed by Parliament in 2019, acknowledges housing as a human right.[44] However, the increasing incidence of homelessness indicates this right is not universally upheld. The rising cost of living makes the housing market more competitive. Affordable housing is increasingly difficult to find, forcing many low-income households to pay more in rent than they can afford. With soaring prices of basic goods like shelter and food, household budgets are stretched thin, making it even more challenging to maintain housing.
At the time of writing, there are weak rent controls and tenant protections in New Brunswick. Many residents are struggling to afford rising rental prices, which have outpaced wage growth, increasing the risk of displacement for low- and even middleincome earning individuals and families. There is an urgent need for more comprehensive tenant protections to ensure housing stability.
The province's new Liberal majority government has promised to put a 3% rent cap in place to help tenants manage rising rental costs by as early as 2025.[45] The cap will be reviewed annually and adjusted as needed based on inflation and vacancy rates. This effort is designed to increase housing affordability for renters.
Housing insecurity can be particularly devastating for families. If they experience or are at risk of homelessness, child protection services will intervene due to welfare concerns, potentially resulting in a breakdown of the family unit. Family reunification is possible if the children are provided a safe, stable, and suitable home. Appropriate affordable housing is out of reach for many due to high rents and low vacancy rates. Without increased investment in affordable housing, families will continue to experience or be at risk of housing precarity, inadequacy, and insecurity.
Low-income households experience high rates of food insecurity. This issue is defined as “inadequate or insecure access to food due to financial constraints.”[46] In 2024, national food insecurity rates reached their highest levels ever, exceeding the record set in the previous year. Nearly 9 million people (23%) are living in food insecure households in Canada.[47] The demand for food bank services is unprecedented.[48] Insufficient income leads people to worry about when, where, and how they will secure their next meal. Some individuals skip meals to ensure their children have enough to eat, while others do so to stretch their food supply for as long as possible. Unless Canada strengthens its social safety net and offers greater income support to households in need, food insecurity rates are likely to rise with inflation, intensifying economic hardship.
According to the 2022 Canadian Income Survey, 34.2% of New Brunswick children (48,000) lived in food insecure households.[49] This rate ranks fourth highest in the country. Food insecurity rates are disproportionately higher among marginalized populations in the province. 33.8% of the racialized population live in food insecure households, compared to 24.9% of the non-racialized population. [50] 41.1% of the Indigenous population live in foodinsecure households, compared to 25.3% of the non-Indigenous population.[51]
In 2024, New Brunswick food banks saw 32,167 visits, including 11,722 made by families with children.[52] This marks a 7.77% increase from the previous year and a staggering 44.5% rise since 2019. Children who experience food insecurity are vulnerable to delayed cognitive skill development, resulting in a learning gap that can follow them into adulthood.[53] Provincial funding for school food programs started in 2021, with an annual investment of $2 million since 2023.[54]
Among food bank users, 39% rely on Social Assistance, while 17% report employment as their main source of income.[55] The proportion of service users with job income increased by 3.5% year-over-year. Like the rest of Canada, New Brunswick is grappling with an affordability crisis, as the high cost of living and limited financial resources strain family budgets. These trends highlight the urgent need for effective support measures to address rising food insecurity and help families make ends meet.
34.2% of New Brunswick children lived in food insecure households.
We are seeing a steady increase of new clients each month... [due to the] increase in living expenses including housing, food, gas and other basic necessities.
- 2024 HungerCount survey respondent, New Brunswick
Our clients are not making a living wage and are 'the working poor.' People who have to work 2 or 3 jobs just to get by and...that is still not enough.
- 2024 HungerCount survey respondent, New Brunswick
New Brunswick’s child poverty rate rose from 18.7% in 2021 to 21.9% in 2022. The increase is driven by inflation and affordability issues.
The cost of living in New Brunswick is on the rise, leaving many families struggling to get by. The province's child poverty rate surpassed the national average and returned to pre-pandemic levels, reversing previous gains in poverty reduction. Lowincome household earnings and government transfers are failing to keep pace with inflation.
There is a critical need for increased investment in income support programs that can help families escape poverty, boost financial stability, and enhance their overall quality of life. Children's health and development is at stake.
Ending child and family poverty must remain a priority and collaborative effort by federal, provincial, and municipal governments in the coming year. In keeping with previous report cards, we offer the following recommendations:
Replace the Market Basket Measure with the Census Family Low Income Measure After Tax (CFLIM-AT), calculated with annual tax filer data.
The CFLIM-AT is a broad, comprehensive and relative measure of poverty. It is designed to measure what the PRS seeks to achieve by way of its three pillars: dignity, opportunity and resilience.
Targets and programs must explicitly aim to reduce poverty by 50% and deep poverty by one third by 2027 and eliminate poverty by 2031 for marginalized children, families and adults who experience higher rates of poverty including First Nations, Inuit and Métis Peoples, urban and rural Indigenous Peoples, Black and racialized people, people with disabilities, immigrants and migrants and female-led lone parent families.
Invest $5.9B to create a non-taxable Canada Child Benefit End of Poverty Supplement (CCB-EndPov) targeted to families in deep poverty, which would provide an additional $8,500 per year to a family with an earned income of less than $19,000 with scaled reductions for additional children irrespective of age.
Retire CERB and CRB debt and implement a full CERB Repayment Amnesty for everyone living below or near the CFLIM-AT.
Implement a Canadian Livable Income for working age individuals to replace the Canada Worker’s Benefit, untying income security eligibility from earned income for adults.
Collaborate with First Nations, Inuit and Métis governments and organizations, including women’s and 2SLGBTQQI+ organizations, to develop plans to prevent and eradicate child and family poverty.
All levels of government should fully and properly implement Jordan’s Principle, in accordance with Canadian Human Rights Tribunal orders, to ensure that First Nations children and youth have timely access to the services and supports they need to thrive. Fully implement The Spirit Bear Plan to end inequities across public services.
Take immediate action to implement the Truth and Reconciliation Commission of Canada’s (TRC) 94 calls to action and the National Inquiry into Missing and Murdered Indigenous Women and Girls (MMIWG) 231 Calls for Justice. The federal government must release clear timelines and budgets for the implementations of the Calls to Action and Calls for Justice.
Create an Anti-Racism Act for Canada that provides a legislative foundation for the AntiRacism Secretariat and a National Action Plan Against Racism that is well-funded, resultsoriented and produces structural and systemic change to identify and eliminate all forms of racism. The current and future Anti-Racism Strategies would be developed and implemented within the framework provided by the Action Plan.
Expand funding for community-based mental health and wellness programs accessible to youth, with funding reserved to provide culturally responsible supports for First Nations, Inuit and Métis Peoples, Black, racialized, 2SLGBTQQI+ and marginalized youth.
Reduce inflows into homelessness by implementing a targeted national housing strategy and establishing a national framework for extended care and support for youth in child welfare, in collaboration with First Voice Advocates, territories and provinces.
Follow through on the commitment to expand beyond the initial coverage of Bill C-64 to include all essential medications, not just diabetes and contraceptive medications.
Implement a universal, single-payer pharmacare system with a coherent national formulary. Develop a standardized list of covered medications based on clinical effectiveness and cost-efficiency to replace the current fragmented system. This will reduce the cost of medicines by
leveraging bulk purchasing power and eliminating administrative inefficiencies.
Adapt the National Housing Strategy to ensure it meets Canada’s obligations to realizing children’s rights to housing outlined in the UN Convention on the Rights of the Child and the National Housing Strategy Act.
Recognize the human rights violations resulting from the financialization of purpose-built rental housing in Canada. Ensure the Canada’s Renter’s Bill of Rights complements Canada’s housing rights obligations and includes mechanisms to prevent unfair evictions, rent increases and service decreases. Federal funding related to housing should be binding and require that conditions be met and reported on by provinces and territories.
Address the financialization of purpose-built rental housing and ensure the progressive realization of the right to adequate housing, including targeted action for low-income and marginalized children and families who experience disproportionate rates of poverty and housing insecurity.
Ensure federal minimum wages are adequate and at a minimum, bring employment incomes up to the CFLIM-AT. Attach standards to federal/provincial/territorial transfer agreements to legislate and enforce compliance of equal pay for equal value and access to benefits for all workers regardless of employment status (parttime, temporary), gender, racialization, or immigration status.
Implementing Canada-Wide Early Learning and Child Care must include public expansion strategies to ensure sufficient public and nonprofit service expansion with equitable coverage in low income, high need and less densely populated communities. This must be accompanied by public funding through capital funding mechanisms.
For a full list of key recommendations at the federal level, please see Campaign 2000's 2024 Report Card on Child and Family Poverty in Canada [56]
Provide sustained funding for poverty reduction programs to achieve the targets set out in the Economic and Social Inclusion Act.
Ensure that the income thresholds for programs available for low income households (for example, New Brunswick Drug Plan and Healthy Smiles, Clear Vision) align with the Census Family Low Income Measure After Tax (CFLIM-AT). Thresholds should also account for household size.
Approve annual increases to the minimum wage that move it closer to a living wage. Periodically evaluate the cost of living outside the CPI to ensure that the adjustments to the minimum wage reflect the reality of low-wage workers.
Create more licensed child care spaces and bring the province’s child care coverage rate up to 60%, at minimum, as soon as possible. This would ensure more families have access to affordable, accessible, and inclusive child care.
Update the Employment Standards Act to better protect workers in an economy with more parttime, precarious and gig work, including the provision of ten paid sick days.
Build more affordable housing and introduce greater protections for tenants, including the reinstatement of a rent cap.
Create a new and distinct disability income support program and update the definition of "disability" to a modern one, in line with the United Nations Convention on the Rights of Persons with a Disability.
Prioritize the support of newcomers through settlement programs, language classes, and workplace attachment initiatives. Where available, support Local Immigration Partnerships.
Work with Indigenous communities to support poverty reduction. Ensure that Indigenous people are represented in poverty reduction and housing strategies.
Work with Statistics Canada, the federal government, and Indigenous communities to improve how poverty on reserves is measured.
Incorporate a poverty lens in policy design, service delivery, and engagement work.
Increase subsidies and incentives to non-profit housing developers to create affordable housing, and implement as-of-right zoning by-laws.
Invest in public transportation infrastructure, offer discounted transit passes for low-income residents, and implement programs to improve transportation accessibility for people with disabilities.
[1] House of Commons Canada. (n.d.). Huma Committee Report. Parliament of Canada. https://www.ourcommons.ca/documentviewer/en/40-3/HUMA/report-7/page-18
[2] UNICEF Canada. (2023). UNICEF Report Card 18: Canadian Companion, Child Poverty in Canada: Let’s Finish This. UNICEF Canada. https://www.unicef.ca/sites/default/files/202312/UNICEFReportCard18CanadianCompanion.pdf
[3] Food Banks Canada. (2024). HungerCount 2024: Buckling under the strain. Food Banks Canada. https://foodbankscanada.ca/hungercount/
[4] Government of Canada. (n.d.). Opportunity for All – Canada’s First Poverty Reduction Strategy. https://www.canada.ca/en/employment-socialdevelopment/programs/povertyreduction/reports/strategy.html
[5] Ibid.
[6] Statistics Canada. (2024). T1 Family File. Table 11-10-0018-01 After-tax low income status of tax filers and dependants based on Census Family Low Income Measure (CFLIM-AT), by family type and family type composition. https://www150.statcan.gc.ca/t1/tbl1/en/tv.action?pid=1110001801
[7] UNICEF Canada. (2023). UNICEF Report Card 18: Canadian Companion, Child Poverty in Canada: Let’s Finish This. UNICEF Canada. https://www.unicef.ca/sites/default/files/202312/UNICEFReportCard18CanadianCompanion.pdf
[8] Statistics Canada. (2024). T1 Family File. Table 11-10-0018-01 After-tax low income status of tax filers and dependants based on Census Family Low Income Measure (CFLIM-AT), by family type and family type composition. https://www150.statcan.gc.ca/t1/tbl1/en/tv.action?pid=1110001801
[9] Ibid.
[10] Atcheson, H., & Driscoll, C. (2023). New Brunswick’s 2022 Child Poverty Report Card. Human Development Council. https://sjhdc.ca/wp-content/uploads/2023/02/NB-Child-Poverty-Report-Card-2022-1.pdf
[11] Statistics Canada. (2024). Table I-13 - Individual data - After-tax low income status of tax filers and dependents (census family low income measure, CFLIM-AT) for couple and lone parent families by family composition, 2022. https://www150.statcan.gc.ca/t1/tbl1/en/tv.action?pid=1110001801
[12] Statistics Canada. (2023). Census Profile. 2021 Census of Population. Statistics Canada Catalogue no.98316-X2021001. https://www12.statcan.gc.ca/census-recensement/2021/dp-pd/prof/index.cfm?Lang=E
[13] Statistics Canada. (2024). T1 Family File Table I-13 - Individual data - After-tax low income status of tax filers and dependents (census family low income measure, CFLIM-AT) for couple and lone parent families by family composition, 2022. https://www150.statcan.gc.ca/t1/tbl1/en/tv.action?pid=1110001801
[14] Statistics Canada. (2024). T1 Family File, Custom Tabulation.
[15] Ibid.
[16] Hughes, M., & Tucker, W. (2018). Poverty as an Adverse Childhood Experience. North Carolina Medical Journal, 79(2). https://pubmed.ncbi.nlm.nih.gov/29563312/
[17] Hughes, M., & Tucker, W. (2018). Poverty as an Adverse Childhood Experience. North Carolina Medical Journal, 79(2). https://pubmed.ncbi.nlm.nih.gov/29563312/
[18] Children First Canada. (2021). Child Poverty: The Facts You Need to Know. https://childrenfirstcanada.org/blog/child-poverty-the-facts-you-need-to-know/
[19] Government of Canada, Government of New Brunswick. (2021). Canada-New Brunswick Canada-Wide Early Learning and Child Care Agreement: New Brunswick Action Plan 2021-2023. Government of New Brunswick. https://www2.gnb.ca/content/dam/gnb/Departments/ed/pdf/ ELCC/action-plan-2021-2023.pdf
[20] Atcheson, H., & Fisher, L. (2024) Living Wages in New Brunswick 2024. Human Development Council. https://sjhdc.ca/wp-content/uploads/2024/10/Living-Wages-in-New-Brunswick-2024.pdf
[21] Macdonald, D., & Friendly, M. (2023). Not Done Yet: $10-a-day child care requires addressing Canada’s child care deserts. Canadian Centre for Policy Alternatives. https://policyalternatives.ca/publications/reports/notdone-yet
[22] Employment and Social Development Canada. (2024, August 7). Governments of Canada and New Brunswick announce Early Learning and Child Care Action Plan: News Release. Government of Canada. https://www.canada.ca/en/employment-social-development/news/2024/08/governments-of-canada-and-newbrunswick-announce-early-learning-and-child-care-action-plan.html
[23] Statistics Canada. (2024). T1 Family File, Custom Tabulation.
[24] Ibid.
[25] Statistics Canada. (2021). Target group profile of the Indigenous identity population, Census, 2021. Community Data Program. https://communitydata.ca/data/target-group-profile-indigenous-identity-populationcensus-2021
[26] Ibid.
[27] Macdonald, D., & Wilson, D. (2016). Shameful Neglect: Indigenous Child Poverty in Canada. Canadian Centre for Policy Alternatives. https://policyalternatives.ca/publications/reports/shamefulneglect
[28] Statistics Canada. (2024). T1 Family File, Custom Tabulation.
[29] Ibid.
[30] CMHC. (n.d.). Housing Market Information Portal. https://www03.cmhc-schl.gc.ca/hmippimh/en#Profile/1/1/Canada
[31] Social Development. (n.d.). Policy Manual: Item Detail: Other Supplements. Government of New Brunswick. https://www2.gnb.ca/content/gnb/en/departments/social_development/policy_ manual/items.html#3.9.8
[32] Laidley, J., & Tabbara, M. D. (2024). Welfare in Canada, 2023. Maytree. https://maytree.com/wpcontent/uploads/Welfare_in_Canada_2023.pdf
[33] Ibid.
[34] Ibid.
[35] Ibid.
[36] Statistics Canada. (2024). T1 Family File. Table 11-10-0020-0; Statistics Canada. (2024). Technical Reference Guide for the Annual Income Estimates for Census Families, Individuals and Seniors. T1 Family File, Final Estimates, 2022. https://www150.statcan.gc.ca/n1/en/catalogue/72-212-X
[37] Atcheson, H., & Driscoll, C. (2023). New Brunswick’s 2022 Child Poverty Report Card. Human Development Council. https://sjhdc.ca/wp-content/uploads/2023/02/NB-Child-Poverty-Report-Card-2022-1.pdf
[38] Statistics Canada. (2024). Table 18-10-0005-01 Consumer Price Index, annual average, not seasonally adjusted. https://doi.org/10.25318/1810000501-eng
[39] Ibid.
[40] Statistics Canada. (2024). Table 18-10-0004-01 Consumer Price Index, monthly, not seasonally adjusted. https://doi.org/10.25318/1810000401-eng
[41] Statistics Canada. (2024). Table 18-10-0005-01 Consumer Price Index, annual average, not seasonally adjusted. https://doi.org/10.25318/1810000501-eng
[42] Fisher, L., & Atcheson, H. (2024). 2023 Rental Wages in New Brunswick. Human Development Council. https://sjhdc.ca/wp-content/uploads/2024/10/2023-Rental-Wages-in-NB.pdf
[43] Ibid.
[44] Canadian Human Rights Commission. (2019). Housing is a human right. https://www.chrcccdp.gc.ca/en/node/717
[45] Liberal New Brunswick. (2024, September 23). Holt Liberals to Implement 3% Rent Cap to Help Tenants with the Rising Cost of Rent. https://nbliberal.ca/holt-liberals-to-implement-3-rent-cap-to-help-tenants-with-therising-cost-of-rent/
[46] Food Banks Canada. (2023). HungerCount 2023: When is it enough? Food Banks Canada. https://fbcblobstorage.blob.core.windows.net/wordpress/2023/10/hungercount23-en.pdf
[47] Statistics Canada. (2024). Table 13-10-0835-01 Food insecurity by selected demographic characteristics. https://www150.statcan.gc.ca/t1/tbl1/en/tv.action?pid=1310083501
[48] Food Banks Canada. (2024). HungerCount 2024: Buckling under the strain. Food Banks Canada. https://foodbankscanada.ca/hungercount/
[49] Statistics Canada. (2024). Table 13-10-0835-01 Food insecurity by selected demographic characteristics. https://www150.statcan.gc.ca/t1/tbl1/en/tv.action?pid=1310083501
[50] Ibid.
[51] Ibid.
[52] Food Banks Canada. (2024). HungerCount 2024: Buckling under the strain. Food Banks Canada. https://foodbankscanada.ca/hungercount/
[53] UNICEF Canada. (2023). UNICEF Report Card 18: Canadian Companion, Child Poverty in Canada: Let’s Finish This. UNICEF Canada. https://www.unicef.ca/sites/default/files/202312/UNICEFReportCard18CanadianCompanion.pdf
[54] Education and Early Childhood Development. (2024, June 21). News Release: Students at 135 schools benefit from contract to improve access to healthy food. Service New Brunswick. https://www2.snb.ca/content/snb/en/news/news-release.2024.06.0272.html
[55] Food Banks Canada. (2024). HungerCount 2024: Buckling under the strain. Food Banks Canada https://foodbankscanada.ca/hungercount/
[56] Campaign 2000’s latest report on child poverty in Canada is available at https://campaign2000.ca/.
[57] Government of Canada. (n.d.). Opportunity for All – Canada’s First Poverty Reduction Strategy. https://www.canada.ca/en/employment-socialdevelopment/programs/povertyreduction/reports/strategy.html
[58] Hunter, G., & Sanchez, M. (2019). A Critical Review of Canada’s Official Poverty Line: The Market Basket Measure. https://campaign2000.ca/wp-content/uploads/2021/12/MBM-2021.pdf
[59] Ibid.
[60] Kneebone, R., & Wilkins, M. (2019). Measuring and Responding to Income Poverty. The School of Public Policy Publications, 12(3). https://journalhosting.ucalgary.ca/index.php/sppp/article/view/58433
[61] Djidel, S., Gustajtis, B., Heisz, A., Lam, K., Marchand, I., & McDermott, S. (2020). Report on the second comprehensive review of the Market Basket Measure. Statistics Canada. https://www150.statcan.gc.ca/n1/en/catalogue/75F0002M2020002
[62] Devin, N., Dugas, E., Gustajtis, B., McDermott, S., & Mendoza Rodriguez, J. (2023). Launch of the Third Comprehensive Review of the Market Basket Measure. Statistics Canada https://www150.statcan.gc.ca/n1/pub/75f0002m/75f0002m2023007-eng.htm
[63] Homeless Hub. (n.d.). Racialized Communities. https://homelesshub.ca/collection/populationgroups/racialized-communities/
[64] Statistics Canada. (2022). Census 2021, Custom Tabulation.
[65] Statistics Canada. (2022). Census 2021. Table 98-10-0314-01 Individual low-income status by immigrant status and period of immigration: Canada, provinces and territories, census metropolitan areas and census agglomerations with parts. https://www150.statcan.gc.ca/t1/tbl1/en/tv.action?pid=9810031401
[66] Statistics Canada. (2024). T1 Family File Table I-13 - Individual data - After-tax low income status of tax filers and dependents (census family low income measure, CFLIM-AT) for couple and lone parent families by family composition, 2022. https://www150.statcan.gc.ca/t1/tbl1/en/tv.action?pid=1110001801
[67] Postal cities are based on the mail delivery system for unique place names within a province or territory. Child poverty rates for postal cities with <50 children below the 2022 CFLIM-AT threshold are not included in the table.
The federal government adopted the Market Basket Measure (MBM) as Canada’s official poverty line in 2018.[57] The MBM, like any measure of poverty, is imperfect. Campaign 2000 and Child Poverty Report Card writers across Canada acknowledge the MBM’s shortcomings and prefer to use the Low-Income Measure (LIM) in annual reporting.
The MBM is an absolute measure of poverty. It is based on the cost of a specific, pre-determined basket of goods and services for a reference family with two adults (one male and one female, aged 2549) and two children (a girl, aged 9, and a boy, aged 13).[58] The MBM includes five expenditure categories: shelter, food, clothing and footwear, transportation, and other household needs.
The MBM is biased towards its developers’ judgments about typical Canadian family expenses and needs. It has been critiqued for inadequate consideration of diversified sociocultural norms and necessities.[59] Furthermore, the MBM does not include child care in its basket of goods and services. Child care can be very costly for families—especially those with non-school-aged children—who lack access to child care at reduced cost under the Canada-New Brunswick Early Learning and Child Care agreement. The MBM does not include noninsured health expenses like dental and vision care, prescription drugs, private health insurance, and added financial assistance for persons with disabilities and/or severe medical conditions. The MBM is not automatically adjusted to reflect changes in the cost of living.[60] Instead, it is reviewed and updated by federal government departments—a process that tends to be costly and time-consuming. The first comprehensive review of the MBM took place between 2018 and 2019. Statistics Canada and Employment and Social Development Canada conducted a second
What's included in the MBM?
comprehensive review that resulted in the “2018base MBM.”[61] The MBM’s third comprehensive review is underway and set to conclude in 2025.[62]
The Low-Income Measure (LIM), on the other hand, is a relative measure of poverty. According to the LIM, a household is considered low-income if its total income is less than 50% of median household incomes. The LIM accounts for changes in social norms, as well as income and wealth inequality. The LIM rises naturally as societies become wealthier and achieve a higher standard of living. It uses tax filer data from a large sample size, which paints a more accurate picture of people living in poverty. It allows for calculating poverty rates in cities and smaller geographies (see Appendix C).
In contrast, the MBM uses Canadian Income Survey data from a relatively small sample size. It cannot provide New Brunswick poverty rate data in geographies outside the major cities of Fredericton, Moncton, and Saint John. Finally, using the LIM promotes consistency and comparability to previous Child Poverty Report Cards. The MBM reports lower child poverty rates than the LIM (see Figure 1).
A change in methodology to use MBM data would muddle poverty reduction trends in the province. Campaign 2000 and its regional partners prefer the LIM as it accounts for systemic inequality, social exclusion, and environmental stressors that can impact a household’s relative position in the income hierarchy.
“Racialized” refers to people that are non-Caucasian or non-white. It is used increasingly to replace the term “visible minorities.”[63] Census data from 2021 reveals a high poverty rate for children in racialized populations; 30.7% (3,360) of racialized children (aged 0-14) in New Brunswick are living in poverty. The rate of racialized children in poverty in the province is twice the national rate for racialized children of 15.1%.[64]
Heightened poverty rates for children and families in racialized groups result from systemic and structural racism. These refer to racial discrimination that is pervasive and deeply embedded within systems, laws, policies, and programs. They perpetuate the marginalization and oppression of racialized people in society.
The overrepresentation of racialized children in poverty is particularly evident among subsets of this population. In 2021, Arab children had the highest poverty rates (56.1%), followed by Korean children (43.1%), Latin American children (32%), Black children (31.5%), and Chinese children (31.5%).
Many of New Brunswick’s racialized children are newcomers. According to the 2021 Census, 34.9% (2,175) of immigrant children aged 0-17 years lived in poverty.[65]
Figure 23: Percent of children in poverty by immigration status and period
Non-immigrants
Source: Statistics Canada. (2022). Census 2021. Table 98-10-0314-01.
Postal City % of children in low income
BATHURST
BELLEDUNE
BERESFORD
BLACKS HARBOUR
BLACKVILLE
BLOOMFIELD KINGS CO
BOUCTOUCHE
BURNT CHURCH FIRST NATION BURTON
BURTTS CORNER
CAMPBELLTON
CAP-PELE
CARAQUET
CHARLO
CHIPMAN
COCAGNE
Postal City % of children in low income
COLPITTS SETTLEMENT
DALHOUSIE
DIEPPE
DSL DE DRUMMOND
DURHAM BRIDGE
Postal City % of children in low income
HANWELL
HARVEY YORK CO
HILLSBOROUGH
KEDGWICK
KESWICK RIDGE
KINGSCLEAR FIRST NATION
KINGSTON
LAKEVILLE-WESTMORLAND
LINCOLN
MCADAM
MEMRAMCOOK
MINTO
MIRAMICHI
MONCTON
NEGUAC
NEW MARYLAND
NORTON
OAK BAY
Postal City % of children in low income
OROMOCTO
PERTH-ANDOVER
PETIT-ROCHER
PETITCODIAC
PLASTER ROCK
QUISPAMSIS
RED BANK RESERVE
SAINTE-ANNE-DE-KENT
SAINTE-ANNE-DE-MADAWASKA
SAINTE-MARIE-DE-KENT
SALISBURY
SHEDIAC
SHIPPAGAN
ST ANDREWS
ST GEORGE
ST STEPHEN
SUSSEX
SUSSEX CORNER
TOBIQUE FIRST NATION
TRACADIE-SHEILA
VAL-D'AMOUR
WOODSTOCK
Prepared by Heather Atcheson and Liam Fisher with the Human Development Council, a social planning council that coordinates and promotes social development in New Brunswick. Copies of the report are available from:
www.sjhdc.ca (506) 634-1673
139 Prince Edward St Saint John, N.B. Canada
E2E 3S3

