
P
P U L A T I O N A N D L A N D
Population Change From 2016
Area Square Kilometers
0-14
15-64
85 and Over Ages 65 and Over
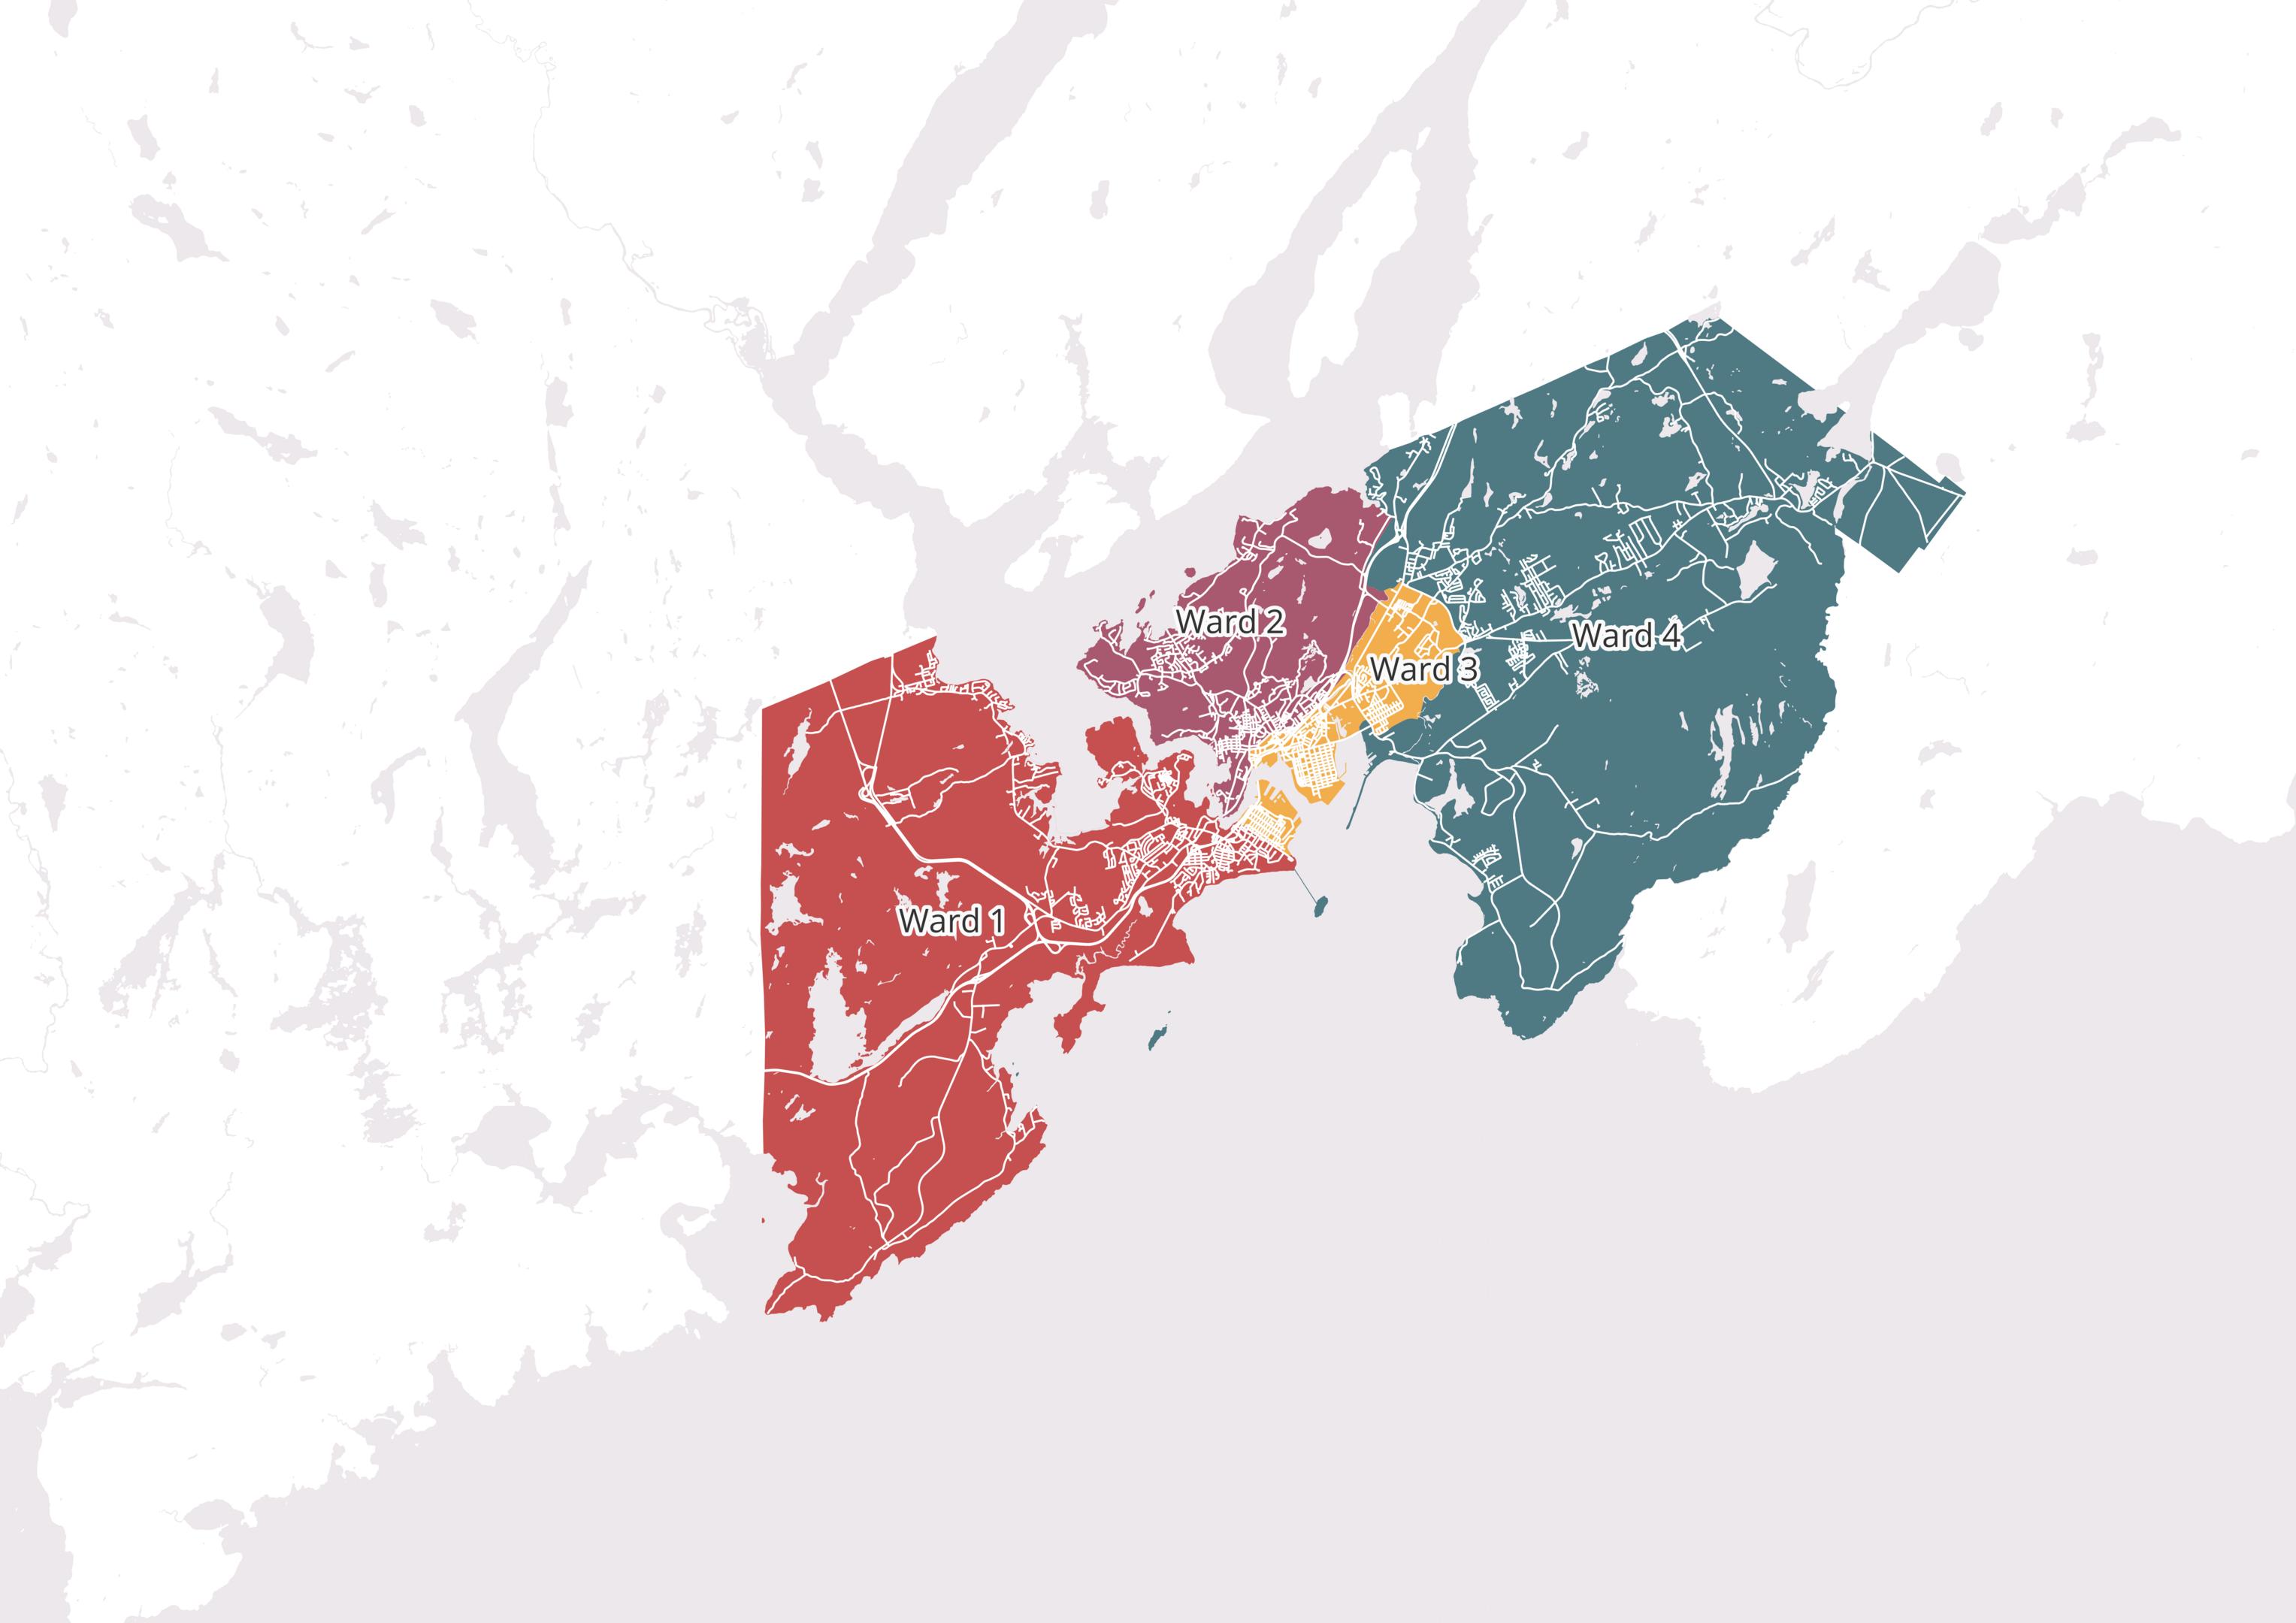
Ward 3 Has the lowest proportion of Children 0-14 at 12.4%. It also leads the wards in population density. Ward 3 encompasses the Lower West Side, Uptown Saint john, and the Waterloo Village
Saint John % of Population by Age
Census
2021 T1FF (Taxfiler Data)
LIM-AT is a low-income measure that refers to 50% of the median income after adjustment for family size. "This size-based adjustment reflects the fact that the economic needs of a unit grow with its size, although they grow at a slower pace than the number of members in that unit "
Statistics Canada
L A N G U A G E
Other Most Common Languages Spoken At Home in Saint John
There are an estimated 50 people who use sign languages.
There are an estimated 0 people who use Indigenous languages.
Counts from the census are estimations and not exact numbers. These estimates are derived from both complete and partial samples. The data is also imperfect and undergoes manipulation. Additionally, the data is often randomly rounded to multiples of five to preserve confidentiality
I M M I G R A T I O N / E T H N I C I T Y
Among the recent immigrant population in Saint John, Syria was the most common birth place. Statistics Canada defines a recent immigrant as: "an immigrant who first obtained his or her landed immigrant or permanent resident status between January 1, 2016 and May 11, 2021 "
Spending > 30% Income on Housing
Spending > 30% Income on Housing
In Need of Major Repairs
Before 1960
Moved in the Past Year
Moved in the Past 5 Years
Core housing need is when a private household's housing fails at least one indicator threshold and would have to spend 30% or more of its gross income to pay the median rent of local housing that meets all indicator thresholds.
A T I O N A N D L A B O U R
Indicator Thresholds
Adequate - not requiring any major repairs
Affordable - has shelter costs less than 30% of gross household income Suitable - has enough bedrooms according to the National Occupancy Standard (NOS)
Labour force participation is the population in the labour force divided by the population 15 years of age or older. Unemployment
are the number of
people divided by the labour force. To be
as
an individual must be without work and available for work, sought it out in the past four weeks, or be on temporary layoff, or waiting to start a job in the next four weeks.
Top Jobs in Saint John by Workforce Size (North American Industry Classification System 2017)
F A M I L Y C O M P O S I T I O N
Married Couples With Kids
Married Couples Without Kids
Families
A census family is a married or common law couple, with or without children of either parent. It is also lone-parents with children, or grandparents and grandchildren without the grandchild's parents Children can be adopted or biological but cannot have their own married or common law partners or children living with them, though they may have them. Statistics Canada
Municipal Elections Voter Turnout
Voter Turnout has been going down in all four of the wards. The Saint John voter turnout rate has dropped by more than 10% in nine years. Ward three has the lowest voter turnout at 29%. That means that less than three in ten people who were eligible to vote actually voted in 2021.
Communicating directly with your local government representatives is a great way to get involved in local government. For More Information about the Saint John City Council visit: https://saintjohn.ca/en/cityhall/council-andcommittees/mayor-andcommon-council

Gerry Lowe Councillor Ward 3
gerry lowe@saintjohn ca
506-639-0969

David Hickey Councillor Ward 3
david.hickey@saintjohn.ca
506-721-5690

Barry Ogden Councillor Ward 2
barry.ogden@saintjohn.ca
506-639-1334

Donna Noade Reardon mayor
506-658-2912 mayor@saintjohn.ca

Brent Harris Councillor At Large
brent.harris@saintjohn.ca
506-977-3853

Gary Sullivan Councillor At Large
gary.sullivan@saintjohn.ca
506-639-1603

Greg Stewart Councillor Ward 4
greg.stewart@saintjohn.ca
506-977-3854

John MacKenzie Deputy Mayor Ward 2
john.mackenzie@saintjohn.ca
506-977-3849

Greg Norton Councillor Ward 1
greg.norton@saintjohn.ca
506-977-3848

Joanna Killen Councillor Ward 1
joanna.killen@saintjohn.ca
506-639-1506

Paula Radwan Councillor Ward 4
paula.radwan@saintjohn.ca
506-977-3846
D A T A D I S C L A I M E R
The data for this report comes from the 2021 Canadian Census of the Population Census data for New Brunswick and Canada are publicly available online. For the other geographies, custom census data requests were made to Statistics Canada. The raw custom request data is available through the Community Data Program (https://communitydata.ca/).
The census has two main components: the short form and the long form The short form portion of the census uses a 100% percent sample. That means Statistics Canada attempts to sample 100% of the target population. The Long Form component of the census samples 25% of the target population. Therefore, there is inevitably more error associated with the Long Form than the Short Form. The Short Form data sections are Population, Language, and Family Composition The Long Form data sections are Immigration/Ethnicity, Income, Housing, and Education and Labour. The only exception is that income data for Canada, NB, and Saint John come from the Short form.
The Census uses multiple population definitions when calculating indicators. Example definitions include the total population, population excluding institutional residents, and the population in private households To learn which indicator refers to which population, go to the Census Dictionary (https://www12.statcan.gc.ca/censusrecensement/2021/ref/dict/az/index-eng.cfm).
Man+ and Woman+ represent gender categories in the census that include those identifying as either a man or a woman and a small proportion of those who did not identify with those categories.
Income statistics in the Census are only available for the 2020 year and not 2021.
