
15 minute read
An Updated Citizen Science State of the World’s Wetlands Survey
Matthew Simpson1,2,3, Robert J. McInnes2,4, Nick Davidson2,5, Connor Walsh6, Chris Rostron6, C. Max Finlayson2
BACKGROUND
In July 2020, we reported in Wetland Science and Practice (WSP) that a collaboration among the Ramsar Section of the Society of Wetland Scientists (SWS), the World Wetland Network (WWN), the Wildfowl & Wetlands Trust (WWT), the International Union for Conservation of Nature (IUCN), the Open University, the Institute for Land, Water and Society, (ILWS), Charles Sturt University, and the Cobra Collective was launching a second citizen science survey of the state of the world’s remaining wetlands (McInnes et al. 2020a). The 2020 survey was a follow up to a similar survey conducted in 2017 by a similar coalition (McInnes et al. 2020b).
The 2017 survey generated 500 useable responses from across the world and from a great diversity of respondents. The analysis of the results provided an insight to the global status and trends of wetlands (McInnes et al. 2020b), sadly echoing the conclusions in other assessments, such as Ramsar Convention (2018) and Davidson et al. (2020), that many of the world’s remaining wetlands are in a deteriorating state. However, significant differences were reported from different parts of the world, and with large wetlands, in Africa and Latin America and the Caribbean, being reported to be in a worse, and increasingly deteriorating, state than smaller wetlands in North America, Europe and Oceania (McInnes et al. 2020b).
The 2020 citizen science survey of the state of the world’s wetlands sought to replicate the 2017 survey through volunteer citizens completing a qualitative assessment of as many of the world’s wetlands as possible. The 2020 survey was conducted through a simple online questionnaire about the current state, and trends in that state, of wetlands. The questionnaire was available in seven different languages (French, Arabic, Spanish, Portuguese, Japanese, Chinese and English), so as to enhance accessibility. The collaborating partners distributed information about the survey through a range of networks and online media to seek widespread contributions.
This article provides a factual summary of the results of the 2020 survey, highlighting some of the key findings. A more detailed analysis of the results and trends derived from the two surveys will be published in due course in a peer-reviewed publication.
1 35percent, Stroud, Gloucestershire, UK 2 Institute for Land, Water and Society, Charles Sturt University, Albury, New South Wales, Australia 3 Cobra Collective, Egham, Surrey, UK 4 RM Wetlands & Environment Ltd, Littleworth, Oxfordshire, UK 5 Nick Davidson Environmental, Wigmore, Herefordshire, UK 6 Wildfowl & Wetlands Trust, Slimbridge, Gloucestershire, UK
RESULTS
A total of 522 responses were received for the 2020 survey. After quality control and vetting, a total of 514 responses were considered to be of sufficient quality (with regards to content and comprehensiveness) for analysis. The number of responses is similar to the 541 received in the 2017 survey. The respondents were drawn from many different backgrounds. Approximately two fifths of respondents were from non-governmental organisations (NGOs) and one fifth from academic or research institutes. Representatives from local, regional and national government accounted for approximately 15% of the responses. Consultants and students represented approximately 5% and 6% of the respondents respectively Some sites that were surveyed in 2017 were reassessed by several different people in 2020 (n=46). However, there
TABLE 1. Summary of responses to the question ‘how did you hear about this survey?
are 29 wetlands that were resurveyed by the same person for both surveys and which can be considered as a direct comparator. In total there are 75 responses in 2020 that relate to sites surveyed in 2017. However, because of multiple responses received for the same site, there are only 52 individual wetlands that have data for both 2017 and 2020.
Approximately one half of all respondents heard about the survey through the World Wetland Network (25.4%), via a personal introduction from a friend or colleague (24.2%) (Table 1), or from contact via SWS (13.5%).
Geographical spread and wetland types
In total, respondents reported on wetlands in 84 different countries, with Australia, Chile, Japan, Mexico, New Zealand, Peru and the United States all having respondents report on 20 or more wetlands (Table 2). In terms of Ramsar geopolitical Regions, respondents supplied information on 116 wetlands in Europe, 104 in Asia, 85 in North America,
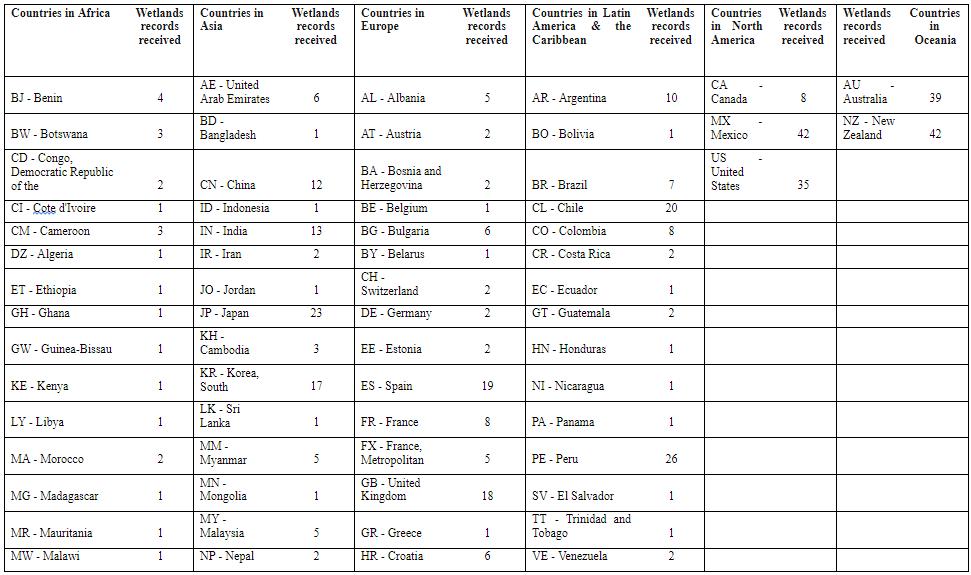


FIGURE 1. Current state of all wetlands in different Ramsar Regions reported on in 2020 based on citizen survey responses.
84 in Latin America and the Caribbean, 81 in Oceania and 44 in Africa (Table 2).
Over half of the responses received reported on inland wetlands (52.5%), with the remaining split between coastal wetlands (35.2%) and both inland and coastal wetland (12.3%).
Current state of wetlands
It is encouraging that of all wetlands reported on, one-third (32.5%) were reported to be in good state, with less than one-quarter (22.8%) being in poor state and with the other 44.7% being in fair state. By Ramsar geopolitical Regions, the most widespread reports of good state were from North America (49.4% of reports), Oceania (34.6%) and Europe (36.2%). Conversely, the most widespread reports of poor state were from Africa (38.6%), Latin America & the Caribbean (27.4%) and Asia (26.0%) (Figure 1).
For wetlands not designated as Wetlands of International Importance (Ramsar Sites), reported current state was very similar to the overall reports: 32.7% in good state, 44.0% in fair state and 23.3% in poor state. Similarly, for wetlands wholly or partially designated as Ramsar Sites 32.2% were reported as in good state and 45.9% as in fair state, with over one-fifth (22.0%) being reported as in poor state (Figure 2).
Change in wetland area
Although almost half (44.9%) of all wetlands reported on have not changed in area over the time respondents have known it, over one-third of wetlands (36.6%) were re-
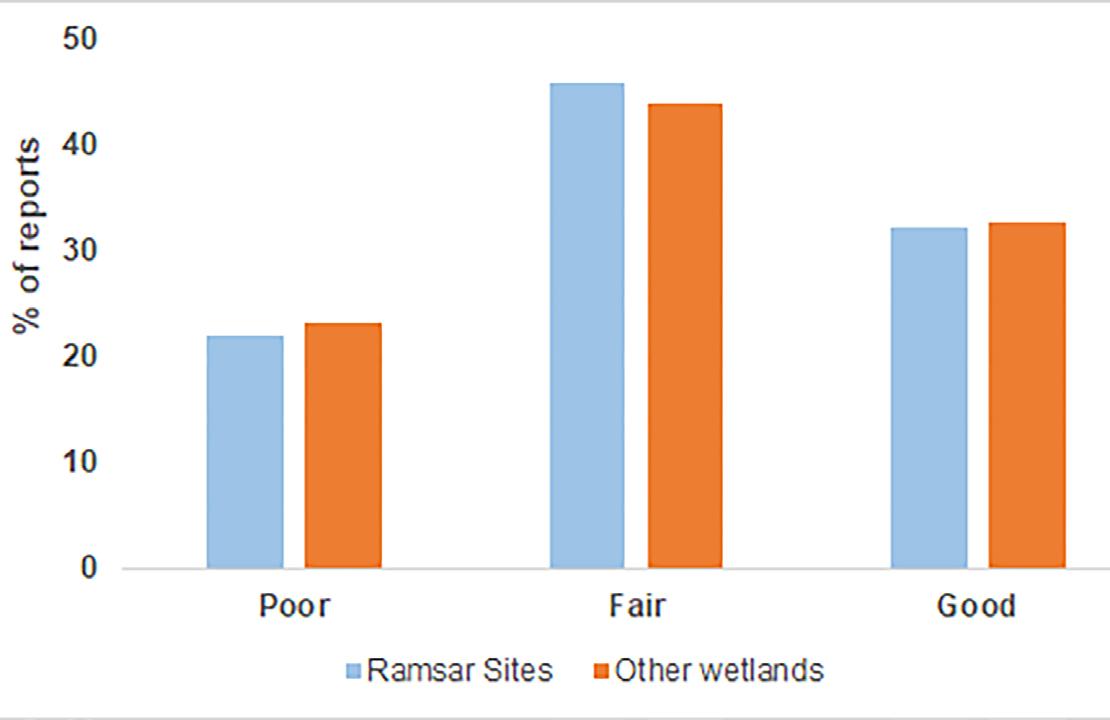
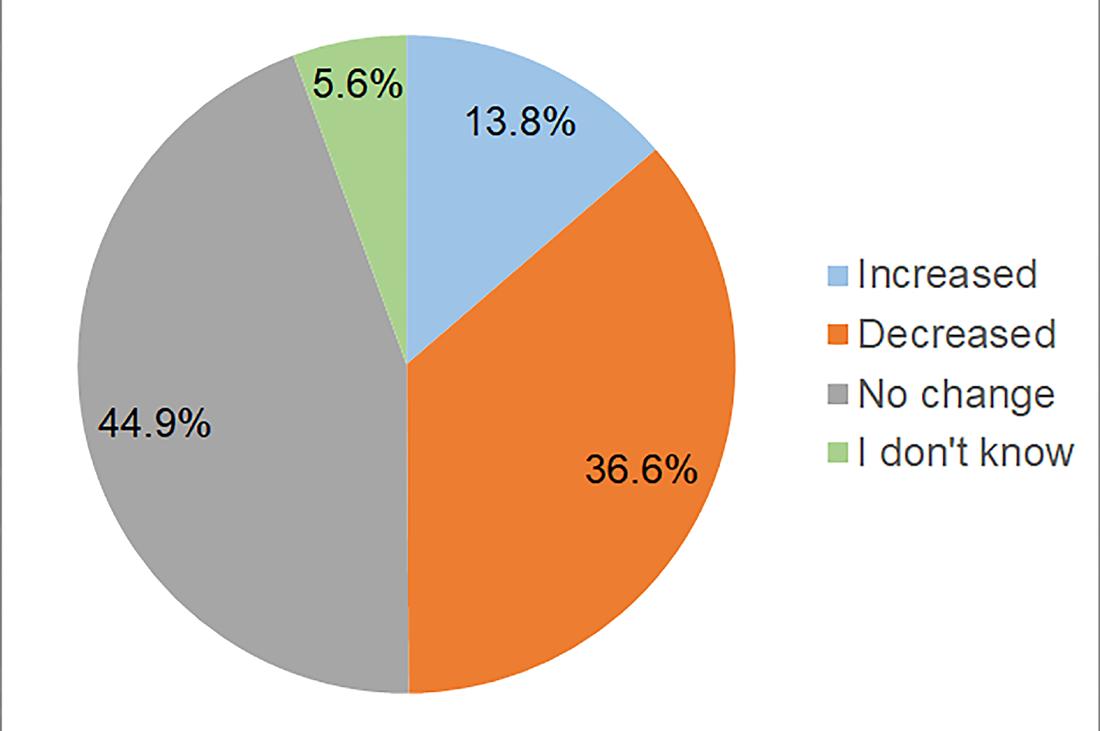
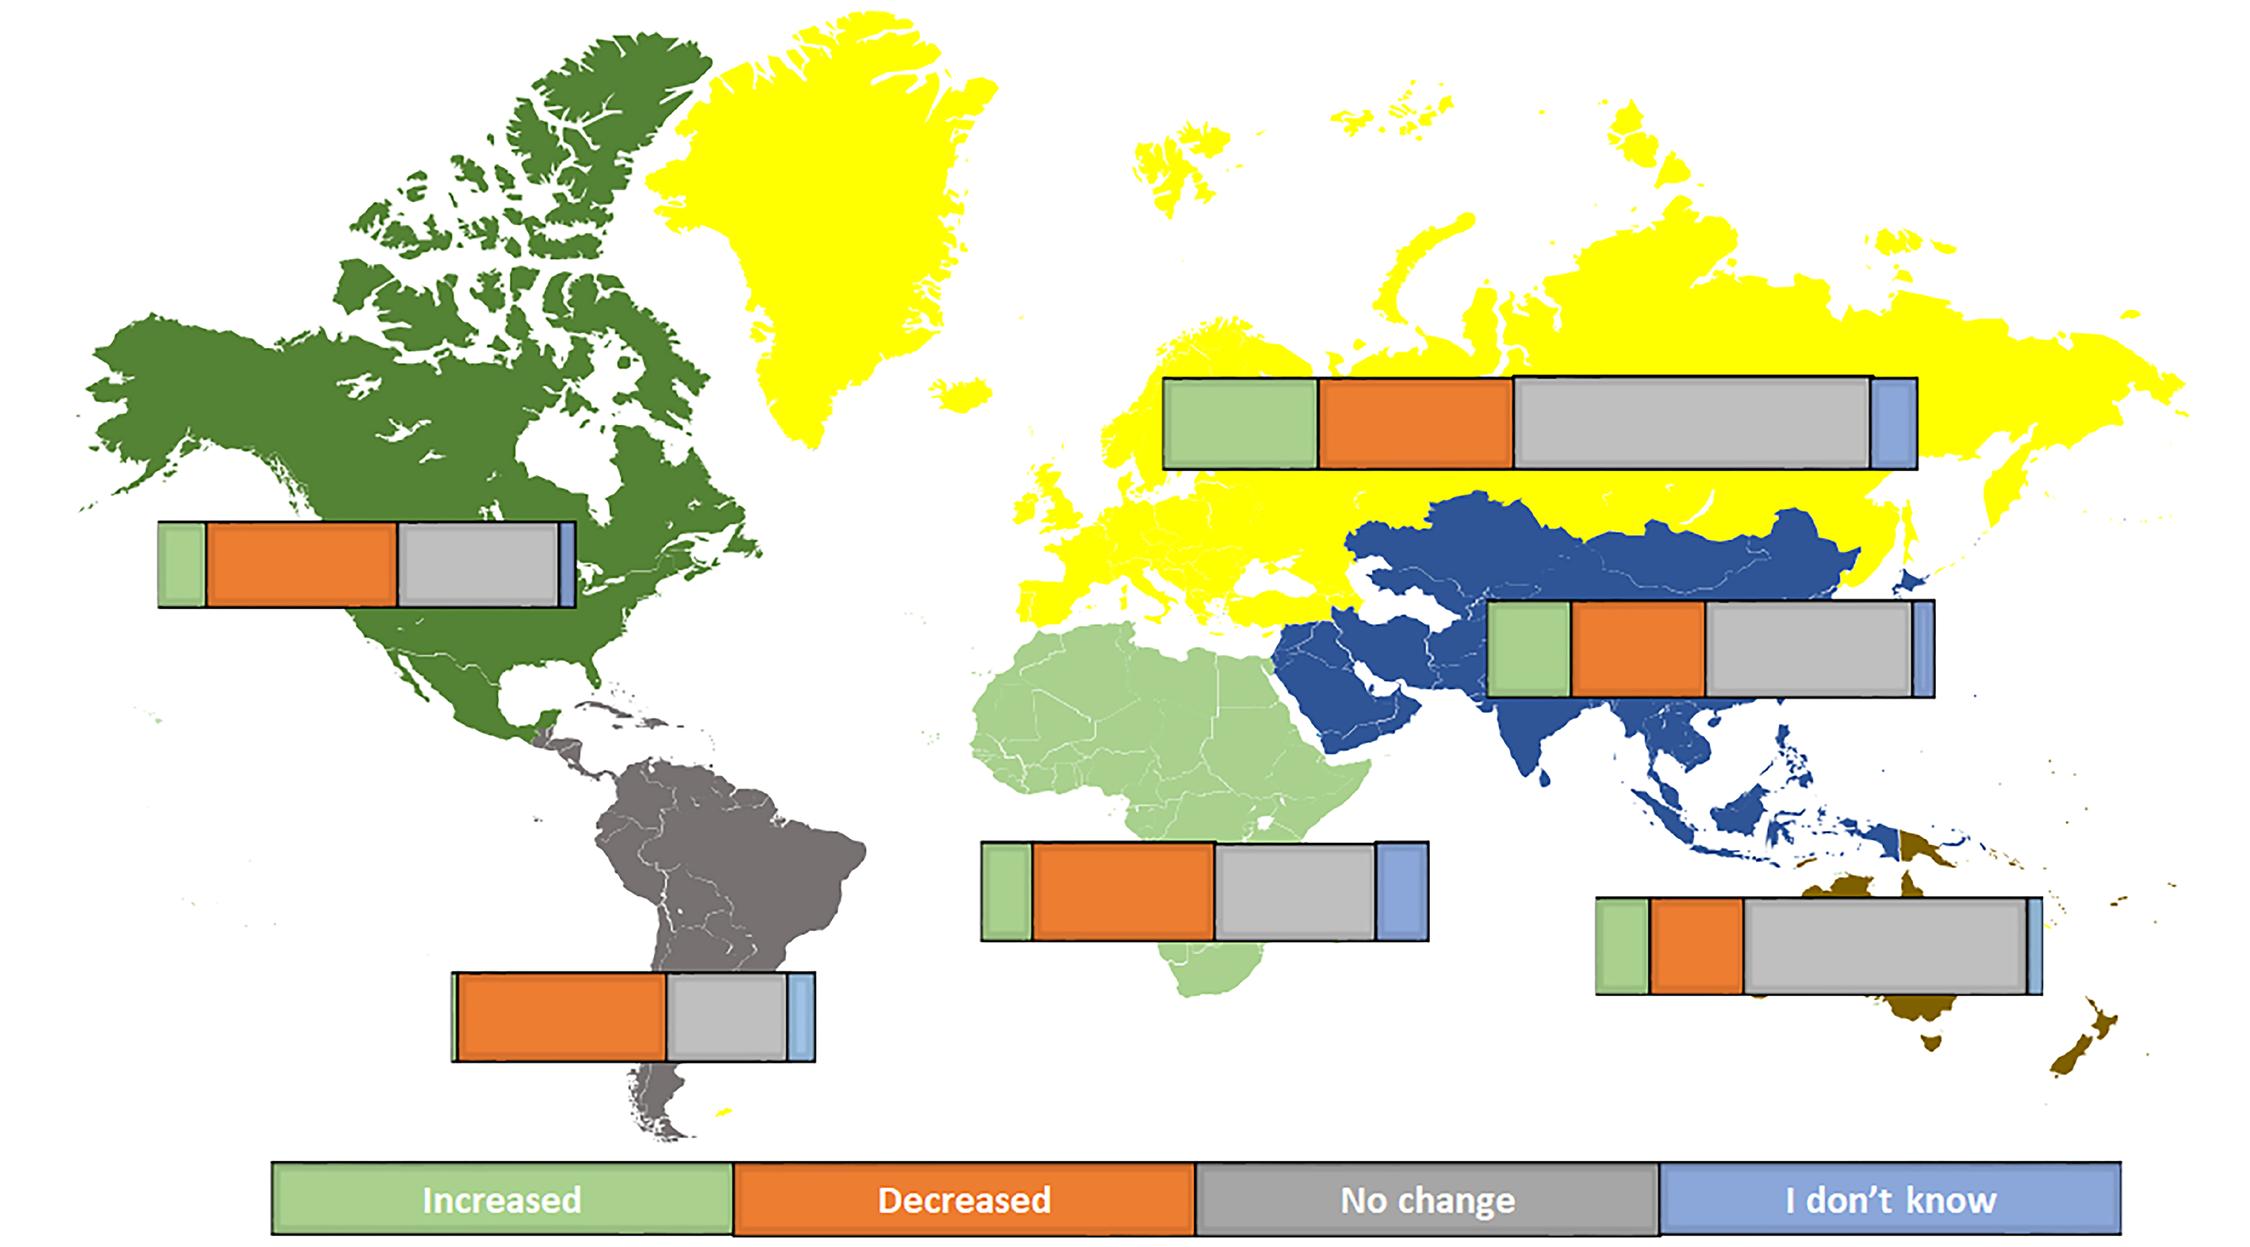
FIGURE 4. Reported change in the area of all wetlands since each respondent has known their wetland, by Ramsar Region.
FIGURE 5. Reported change in the area of wetlands partly or wholly designated as Ramsar Sites and of other wetlands since each respondent has known their wetland. FIGURE 6. Reported change in the area of all wetlands since 2018.
ported to have decreased in area with only 13.8% having increased in area (Figure 3). By Ramsar Regions, the most widespread reports of decrease in area of wetlands over the time respondents have known them were in Latin America & the Caribbean (57.1%), North America (45.9%) and Africa (40.9%). Conversely, the most widespread reports of increase in wetland area were from Europe (20.7%), Asia (19.2%) and Oceania (12.3%) (Figure 4).
For wetlands not designated as Ramsar Sites, reported trends in wetland area over the time respondents have known them was similar to the overall reports: 13.9% having increased in area and 33.0% having decreased in area, with 48.5% having not changed in area. For designated Ramsar Sites, although 39.5% were reported as not having changed in area over the time respondents have known them and 13.7% as having increased in area, it is alarming that 39.5% were reported as having decreased in area (Figure 5).
Not surprisingly, over the most recent three years (since last Conference of the Contracting Parties (COP13) to the Ramsar Convention in October 2018) a higher percentage (60.1%) of all wetlands were reported as not changing in area in comparison with no area change over the time respondents have known their wet-

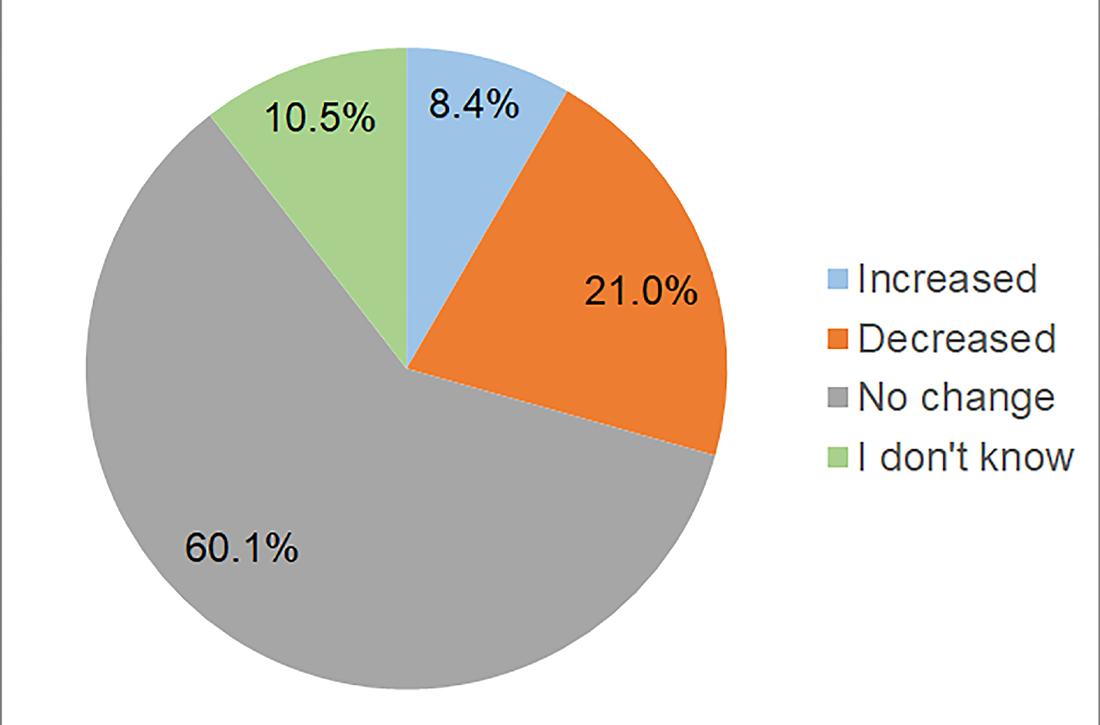

FIGURE 7. Reported change in the area of all wetlands since 2018, by Ramsar Region.
FIGURE 8. Reported change in the area of wetlands partly or wholly designated as Ramsar Sites and of other wetlands since 2018. FIGURE 9. Reported change in the state of all wetlands since each respondent has known their wetland.
land (44.9%). However, it is of considerable concern that even over this short time-period 21.0% of the wetlands reported have decreased in area and only 8.4% having increased in area (Figure 6).
By Ramsar Regions, as for changes in wetland area since the time known by respondents, the most widespread reports of decrease in area of wetlands since 2018 were in Latin America & the Caribbean (38.1%) and Africa (25.0%). The most widespread reports of an increase in wetland area since 2018 were from Asia (11.5%), Africa (11.4%) and Oceania (9.9%) (Figure 7).
For wetlands not designated as Ramsar Sites, reported trends in wetland area since 2018 were very similar to the overall reports: 8.4% having increased in area and 21.4% having decreased in area, with 60.2% having not changed in area. There was also a very similar pattern reported for wetlands wholly or partly designated as Ramsar Sites: 8.3% having increased in area and 20.5% having decreased in area, with 60.0% having not changed in area (Figure 8).
Change in wetland state
Over the time respondents have known the wetland they reported on, deterioration in state has been far more widespread (52.0%) than improvement (28.6%), with 17.1%


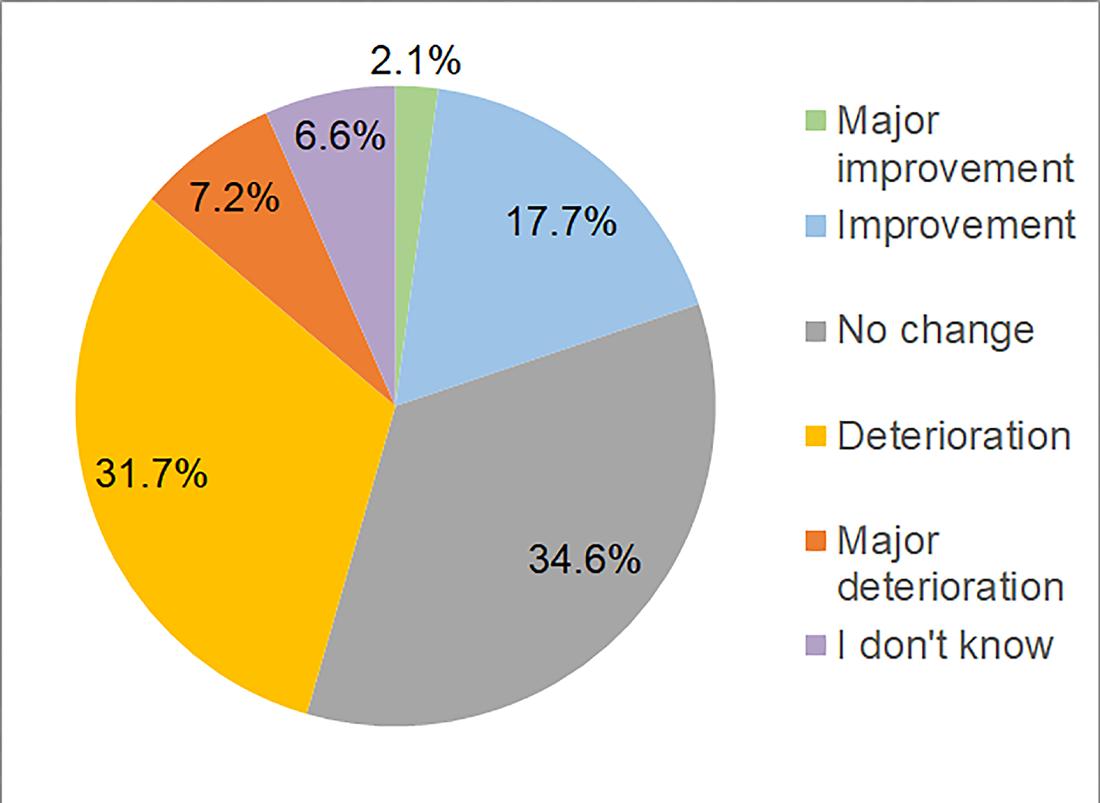
FIGURE 10. Reported change in the state of all wetlands since 2018.
FIGURE 11. Reported change in the state of all wetlands since each respondent has known their wetland, by Ramsar Regions.
reported as not changing (Figure 9). Of considerable concern is that this pattern of widespread deterioration has continued over the most recent three years since Ramsar COP13 (2018): 38.9% of wetlands were reported as having deteriorated compared with only 19.8% improving and 34.6% having not changed (Figure 10).
By Ramsar Regions, the most widespread reports of deterioration in the state of wetlands over the time respondents have known them were in Latin America & the Caribbean (73.9%), Africa (70.5%) and North America (62.3%). Conversely, the most widespread reports of improvement in the state of wetlands were from Oceania (39.5%), Europe (38.0%) and Asia (37.5%) (Figure 11).
Similarly, since 2018, the most widespread reports of deterioration in the state of all wetlands were in Latin America & the Caribbean (58.4%), Africa (54.5%) and Asia (39.4%). Conversely, the most widespread reports of improvement in the state of wetlands were from Oceania (38.3%), Europe (23.3%) and Asia (23.1%) (Figure 12).
Given that Ramsar Contracting Parties (national governments) have, since 1971, committed to maintaining the ecological character of their designated Ramsar Sites (Article 3.1 of the Ramsar Convention text (Ramsar Convention 1971)), it is of major concern that respondents have reported that deterioration in the state of Ramsar Sites is widespread, that it is as or more widespread for wetlands partly or wholly Ramsar-designated than for other wetlands, and that this deterioration has continued in recent years.
For change in the state over the time respondents have known their wetland, 56.1% of Ramsar Sites were reported


FIGURE 12. Reported change in the state of all wetlands since 2018, by Ramsar Regions.
as having deteriorated compared with 49.2% of other wetlands. This deterioration is reported as continuing in recent years (since 2018): 39.5% of Ramsar Sites reported as deteriorating compared with 38.5% of other wetlands (Figures 13 and 14).
It is also concerning that improvements in the state of Ramsar Sites were reported as less widespread than for other wetlands. For trends in the state over the time respondents have known their wetland, 23.9% of wetlands partly or wholly designated as Ramsar Sites were reported as having an improved state compared with 31.7% of other wetlands (Figure 13). Similarly, for the most recent three years, since 2018, only 16.2% of wetlands partly or wholly designated as Ramsar Sites were reported as having an improved state compared with 22.4% of other wetlands (Figure 14).
Drivers of wetland state
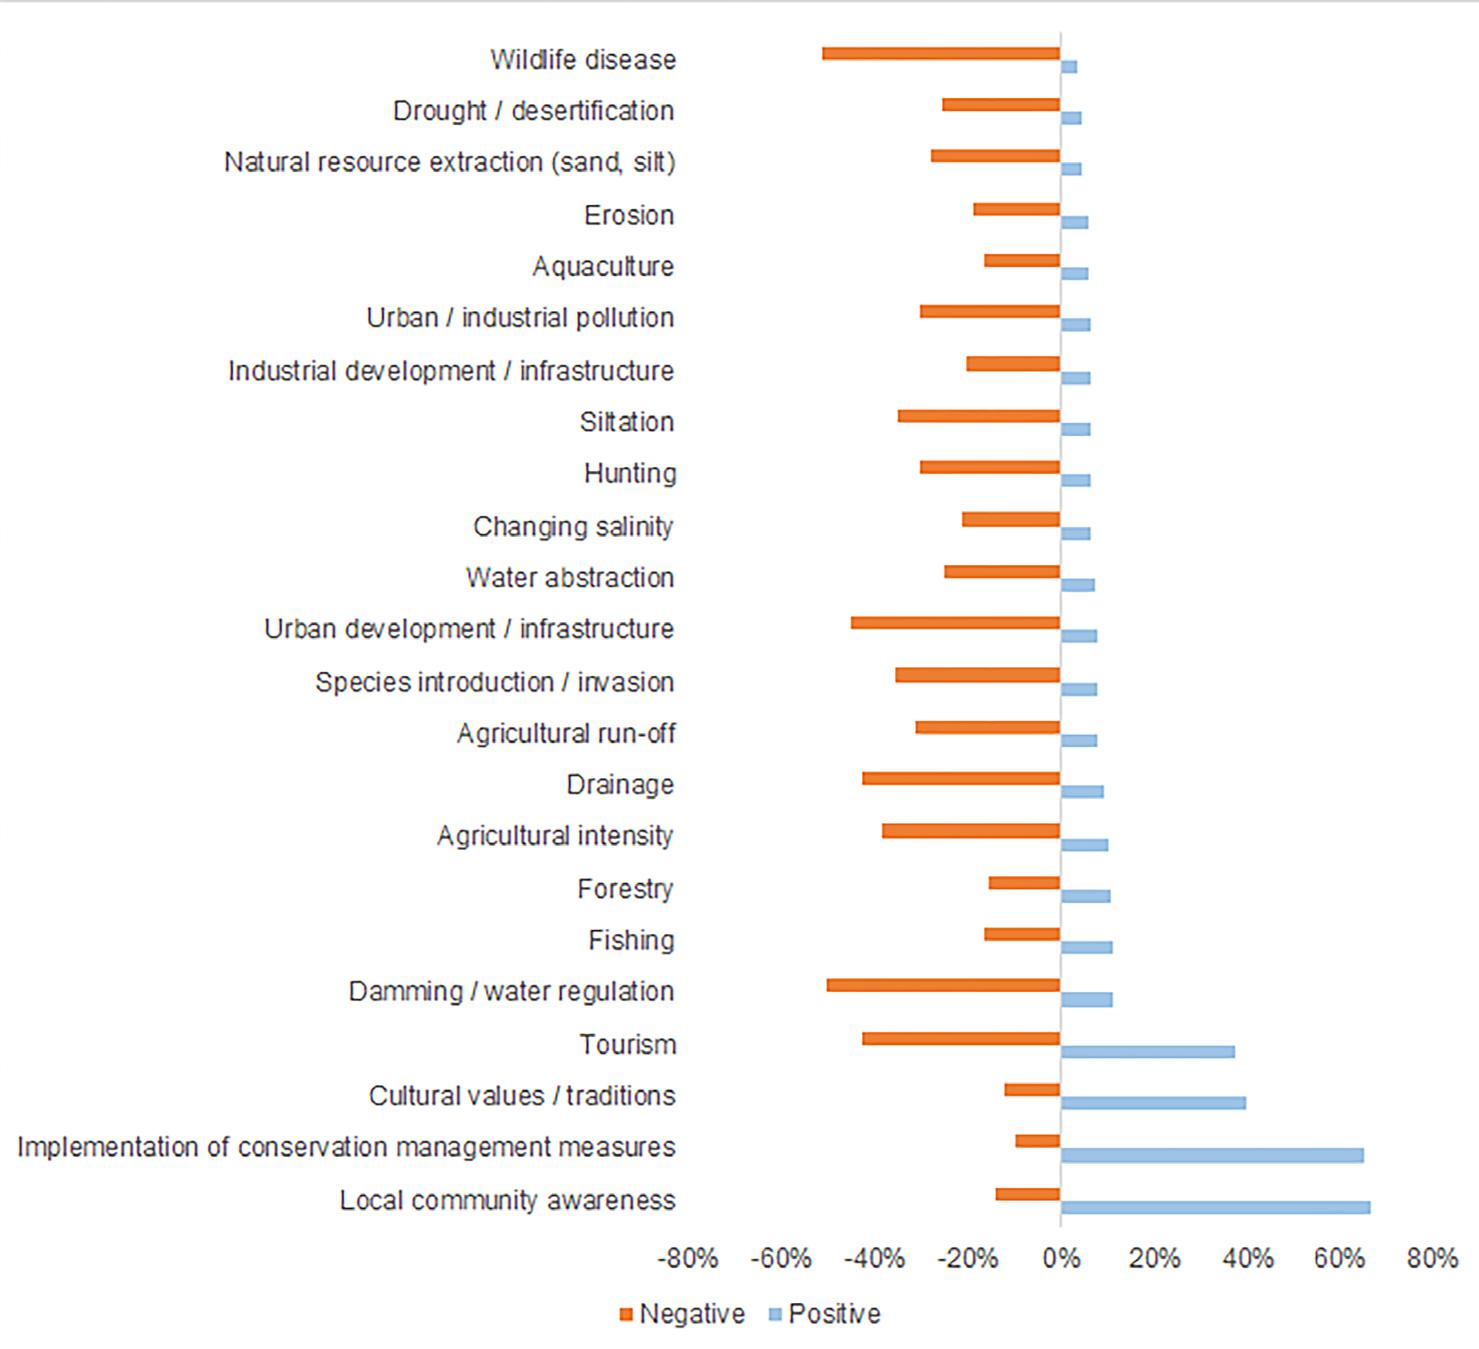
The most positive direct drivers (causes) of the state of the wetland reported are local community awareness (66% of all sites reported) and implementation of conservation measures (65%). The maintenance of cultural or traditional values (40%) and tourism (38%) are also
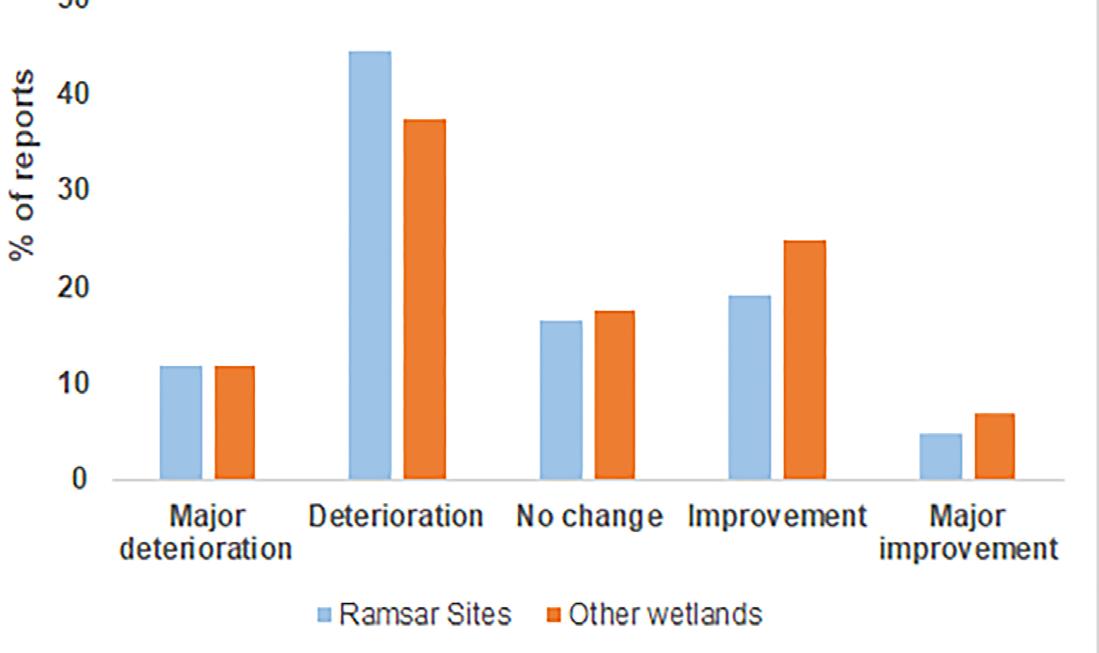
FIGURE 13. Reported change in the state of wetlands partly or wholly designated as Ramsar Sites and of other wetlands since each respondent has known their wetland. FIGURE 14. Reported change in the state of wetlands partly or wholly designated as Ramsar Sites and of other wetlands since 2018.

FIGURE 15. Negative and positive drivers of wetland state.
widely reported as being positive drivers of wetland state. Numerous other drivers are considered positive, but have been reported from less than 11% of all sites (Figure 15).
Overall, negative drivers of wetland state are more frequently reported than positive drivers (Figure 15). Wildlife disease (52% of all sites) and damming or water regulation (51%) are reported from more than half of all sites. Tourism, which has been reported as a positive driver of wetland state (at 38% of all sites), is also reported as a negative driver at 43% of sites. Development and infrastructure (46%), drainage (43%), agricultural intensity (36%), introduced and invasive species (36%), and siltation (35%) are all occurring at more than a third of all the sites reported.
DISCUSSION AND CONCLUSIONS
The results of the 2020 survey reported here are broadly similar to those reported from the 2017 survey by McInnes et al. (2020). This is despite most of the wetlands reported on, and the majority of respondents reporting, being different from those who contributed to the 2017 survey, suggesting that these citizen-science state of wetlands surveys are yielding robust and comparable results.
Although it is encouraging that more wetlands were reported in 2020 as being in good state as in poor state, over one-fifth were in poor state. However, it is far less encouraging that almost twice as many wetlands were reported as deteriorating as opposed to improving in state, and that over one-third of wetlands have decreased in area, which is over two-and-a-half times as many as the number reported as having increased in area. It is also a concern that this pattern of loss and deterioration is reported to have been continuing in the last three years - since 2018. Regionally, wetlands in Africa and Latin America & the Caribbean were reported to have the smallest proportions of wetlands in good state, (the most widespread loss of wetland area, and the most widespread deterioration in wetland state. Conversely, the best state and change in state of wetlands was reported for Oceania and Europe. It is alarming that the current state, and changes in the area and state, of designated Ramsar Sites, some of the most important wetlands on the planet, was reported as no better, or even slightly worse, than for other, non-designated, wetlands.
The reporting on positive and negative drivers of change in wetland state also broadly echoed the findings of McInnes et al. (2020). The results highlight the need to ensure local community awareness, to implement appropriate conservation measures, to maintain cultural or traditional values and to support sustainable tourism as important for maintaining wetlands in a good state. The frequency of reporting of negative drivers demonstrates the multiple pressures on wetlands at a global level, but also emphasises the point that some drivers can be both positive and negative depending on the local circumstance.
This article provides an initial insight into the factual results of the survey. Further investigations are ongoing and will be reported in due course. The focus of the ongoing analysis is on evaluating the trend in state of wetlands between the 2017 and 2020 surveys, and a comparison of the reporting on sites that have been included in both surveys. The outcome of this analysis will be used to feed into wider wetland reporting mechanisms, such as through the Memorandum of Cooperation between the Ramsar Convention and SWS, and to raise awareness on the challenges faced by the world’s remaining wetlands.
ACKNOWLEDGEMENTS
The authors would like to thank Adil Boulahia for his help in setting up the online questionnaire and translation support in difficult circumstances during the COVID-19 pandemic, Minoru Kashiwagi, Josiane Barbosa, Rafaela Nicola, Debora Byrne and Felipe Velasco for helping with translations and IUCN, SWS and the WWN committee members, among others, for distributing the questionnaire. Finally, we would like to thank everyone that took the time to complete the survey as your responses have helped us add to the global evidence of the condition of wetlands and also highlighted the positive drivers that can halt and reverse this decline and deliver positive outcomes for wetlands. n
REFERENCES
Davidson, N.C., L. Dinesen, S. Fennessy, C.M. Finlayson, P. Grillas, A. Grobicki, R.J. McInnes, and D.A. Stroud. 2020. Trends in the ecological character of the world’s wetlands. Marine and Freshwater Research 71(1): 127-138. McInnes, R.J., Davidson, N.C., Simpson, M., Finlayson, C.M. 2020a. A second citizen science state of the world’s wetlands survey: SWS members’ help needed again. Wetland Science and Practice 37(3): 162-163. McInnes, R. J., Davidson, N. C., Rostron, C. P., Simpson, M., & Finlayson, C. M. 2020b. A citizen science state of the world’s wetlands survey. Wetlands 40(5): 1577-1593. Ramsar Convention. 1971. The Convention on Wetlands text, as originally adopted in 1971. https://www.ramsar.org/document/the-convention-on-wetlands-text-as-originally-adopted-in-1971 accessed 26 May 2021. Ramsar Convention. 2018. Global wetland outlook: state of the world’s wetlands and their services to people. Ramsar Convention Secretariat, Gland, Switzerland. https://www.global-wetland-outlook.ramsar.org accessed 3 June 2021.


