
Copyright © 2023 St. Louis Community College
All rights reserved. No part of this publication may be reproduced, stored in a retrieval system, or transmitted, in any form or by any means, electronic, mechanical, photocopying, recording, or otherwise, without the prior written permission of St. Louis Community College.
Printed in the United States of America.
Published by
St. Louis Community College Workforce Solutions Group
Corporate College
3221 McKelvey Road Bridgeton, MO 63044-2551
stlcc.edu/workforce
Although every effort has been made to ensure the integrity of the information contained herein, St. Louis Community College makes no representation or warranty as to the accuracy of such information. Furthermore, St. Louis Community College hereby disclaims any liability or responsibility to any person for loss or damages, including expenses, which may arise or result from the use of any information contained herein or following the procedures described herein but not limited to, fines or penalties for the violation of any federal, state or local regulations. No patent liability is assumed with respect to the use of the information contained herein.
Most references to manufacturers or their products are registered trade names and are to be treated accordingly.
Researched and produced by St. Louis Community College Workforce Solutions Group
Visit stlcc.edu/STLworkforce for more information.
2 | 2023 State of the St. Louis Workforce
Foreword
If we thought that getting past the pandemic would allow us to return to “normal”, we were wrong. Our business models and assumptions were tossed out the window when the uncertainty of the pandemic arrived in 2020. COVID gave us an excuse for not knowing what was going to happen next.
Now, both employers and workers have stepped into the post-COVID world, and it feels anything but normal. The world didn’t stand still, and instead has handed us a different set of circumstances and challenges, both for our organizations and for our workforce.
Record low unemployment. Supply chain issues persisting. Wage increases to attract and retain workers. Inflation. Increasing interest rates. An aging workforce. Lower birth rates. Cities with flat growth rates. A future with a smaller workforce. Youth rethinking student debt. Employers contemplating how to hire, retain and train a workforce differently.
Workers laid off during the pandemic, now seeking job security. Workers that were trapped in front line jobs, now seeking careers with more choices for remote work, advancement and pay. Workers wanting flexibility. Workers choosing family time over a second job, either by choice or by necessity when child or elder care is unavailable. Workers wanting a career path instead of a job. Workers tired of living paycheck to paycheck, now seeking a better future.
It is a new day for all of us.
St. Louis Community College’s mission continues to guide our next steps through three key pillars: preparing students for transfer to four-year universities, creating lifelong education for our community, and educating students to directly enter the workforce in the core industries of the St. Louis region. We continually expand our range of partnerships to reach both high school students and adult learners, and to be that next step in training and education towards a new career and a new life.
The future of our college itself is being shaped right now through STLCC Transformed This immense effort involves the construction of six new state-of-the-art buildings within two years that will bring cutting-edge training facilities to our region’s workforce in healthcare, IT, transportation and advanced manufacturing. We are excited to bring these new resources to our four campuses across St. Louis City and County.


2023 State of the St. Louis Workforce | 3
Jeff Pittman, Ph.D. Chancellor St. Louis Community College
Phyllis Ellison, M.B.A. Associate Vice Chancellor St. Louis Community College Workforce Solutions Group
The 2023 State of the St. Louis Workforce report again focuses on the comprehensive overview of the regional economic and workforce trends. The report will add a highlight on an individual sector each year to track trends in a specific industry that is key to the region, and therefore key to STLCC’s education and training efforts. This report includes a spotlight on advanced manufacturing, a pillar of our region and gateway to future economic growth and jobs.
The St. Louis area holds 42% of Missouri’s jobs in advanced manufacturing.
The 2023 State of the St. Louis Workforce report continues to be supported by the partnership of our region’s top economic and workforce institutions. Along with the assistance of our longtime partners at the Missouri Economic Research and Information Center (MERIC), we appreciate the collaboration with the Federal Reserve Bank of St. Louis and the St. Louis Business Journal. Partnerships with MOSourceLink and TechSTL, along with research from Sarah Coffin, Ph.D., AICP, add details on specific industry sectors for our report.
The report includes labor market information from public sources such as the Bureau of Labor Statistics and the Census Bureau. Additional information is provided by analytical tools such as Chmura JobsEQ and Lightcast™ to provide insight on trends and forecasts. We also appreciate the continued support of our workforce development collaborators, including the Regional Business Council and the Missouri Chamber of Commerce and Industry, for their involvement in this report.
We would like to thank and acknowledge our employers, our research partners, and our media partner, without whom we would not be able to bring this informative report to the region. We hope that you find the report valuable and use its findings for the benefit of your organization and our community.
4 | 2023 State of the St. Louis Workforce

2023 State of the St. Louis Workforce | 5 Contents Foreword 3 Methodology 7 St. Louis Economy 9 Employer Survey 17 Spotlight on Startups 37 Spotlight on Advanced Manufacturing 43 47
6 | 2023 State of the St. Louis Workforce .
Methodology
The 2023 State of the St. Louis Workforce report includes four distinct sections: The St. Louis Economy, a compilation of labor market information using public and proprietary sources and tools; the Employer Survey; and two Spotlight sections, focusing on Startups and Advanced Manufacturing.
St. Louis Economy
This section includes an analysis of available data from public sources, such as the United States Bureau of Labor Statistics and the United Sates Census Bureau, which describes the characteristics of the labor force and correlates unemployment with various labor force demographics. Analysis of real-time labor market demand is aggregated through the proprietary Lightcast™ tool, which searches web-based job boards to discern the level of demand for certain occupations, and the skills and certifications that employers are requesting.
Employer Survey
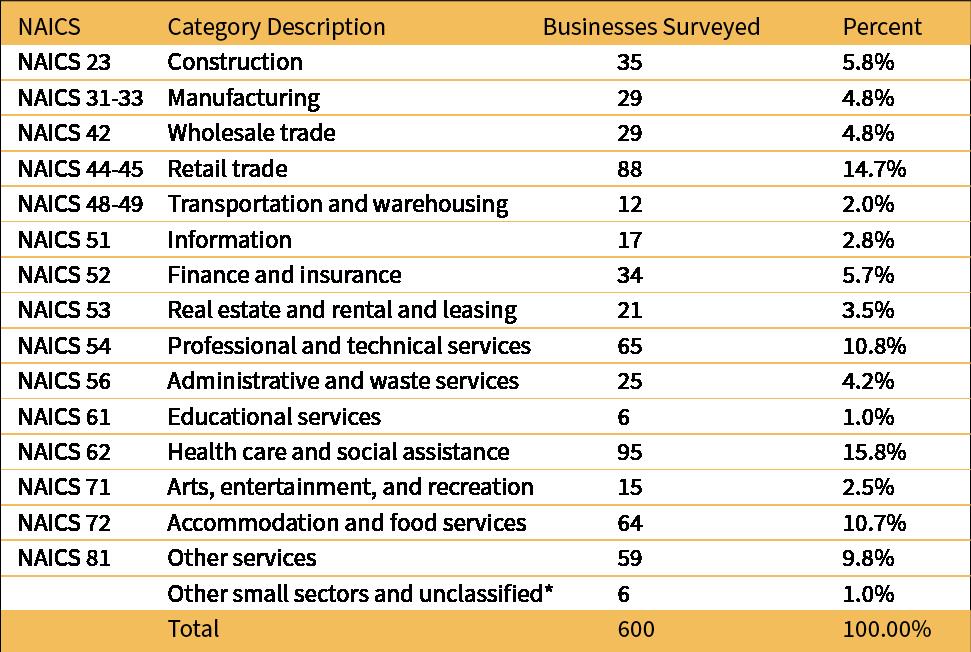
The State of the St. Louis Workforce report relies heavily on first-person telephonic interviews of regional employers. Each of the 2023 survey interviews averaged 19 minutes to complete. During May and June, 2023, 600 local companies in 16 industry categories were surveyed. These companies covered the 23 two-digit North American Industry Classification System (NAICS) codes that represent a composite picture of the St. Louis regional economy.
Survey respondents were asked 19 questions, some with multiple parts, related to hiring trends, job applicants, and skill needs. Companies interviewed for the survey were selected randomly within each of the 16 industry categories from a categorized list of the 40,430 businesses in the St. Louis Metropolitan Statistical Area (MSA) that employed five or more employees from the Reference USA employer database provided by the Missouri Economic Research and Information Center (MERIC). The survey instrument is provided in the Appendix to this report.
2023 State of the St. Louis Workforce | 7
Spotlight on…
This year’s report highlights two key aspects of our regional economy with additional data and analysis: startups and the jobs they create, and the advanced manufacturing sector.
Spotlight on Startups explores the creation of first-time jobs in the St. Louis region. Through analysis supplied by MOSourceLink, this section showcases the number of new firms and the new first-time jobs that they create on the Missouri portion of the St. Louis MSA.
For this identification of new jobs, a new startup is identified with the first appearance of firm records in the employer file in the Quarterly Census of Employment and Wages (QCEW). Individual records of wages paid for Unemployment Insurance serves as the trigger for identifying new jobs.
In this method, new startups are new establishments. Only employees that were hired for wages paid for Unemployment Insurance are counted as employees, whether full-time or part-time, and do not include those who are self-employed or contract employees.
The Spotlight on Advanced Manufacturing section focuses on the size of the industry in the region, its workforce, and the future opportunities and challenges it faces.
8 | 2023 State of the St. Louis Workforce
St. Louis Economy
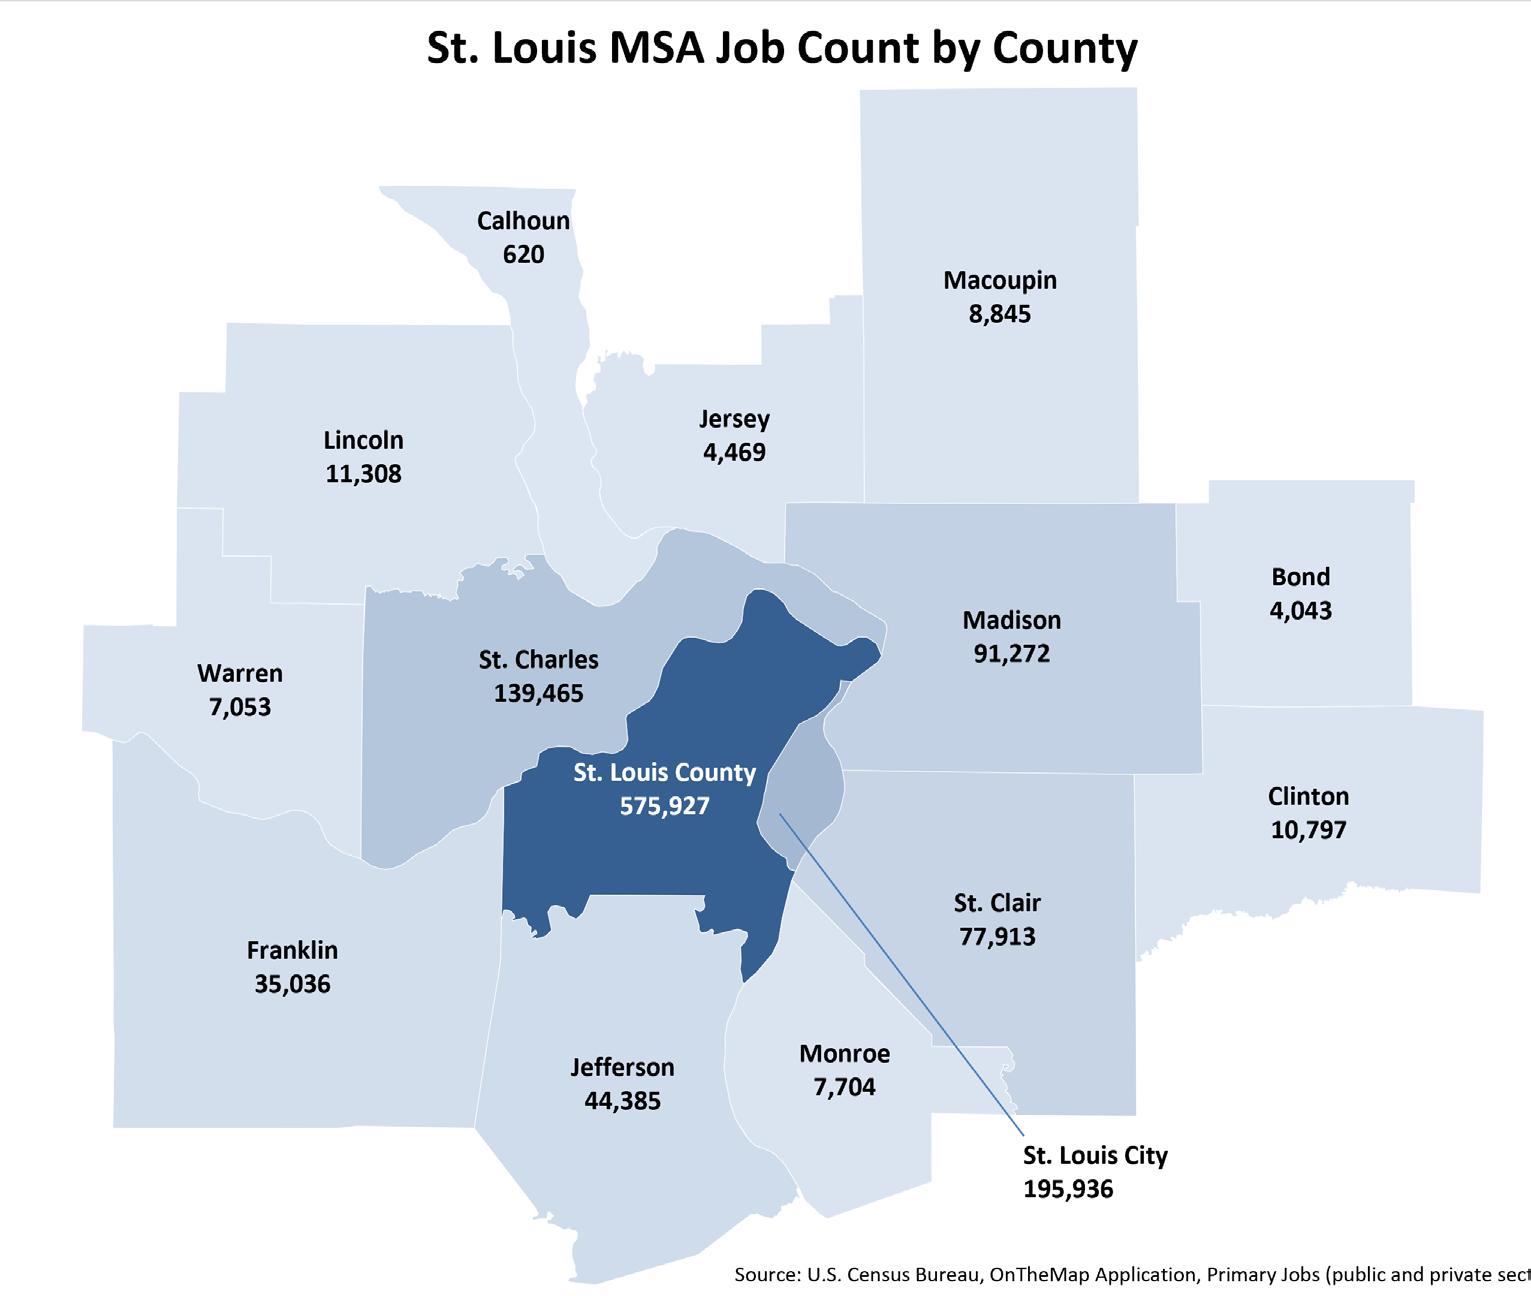
The bi-state St. Louis, Missouri-Illinois Metropolitan Statistical Area (MSA) includes 16 counties in Missouri and Illinois with an estimated population of over 2.8 million.
According to the U.S. Bureau of Economic Analysis, in 2021, the area had a Gross Domestic Product (GDP) of $187 billion in current dollars (not adjusted for inflation). This was a strong recovery from $171 billion in 2020, and a significant increase over the pre-pandemic $175 billion in 2019.
The industry with the highest GDP was Finance, Insurance, Real Estate, Rental & Leasing at $38 billion. Private Sector businesses accounted for 91% of the region’s output, while Government accounted for the remaining 9%.
Employment
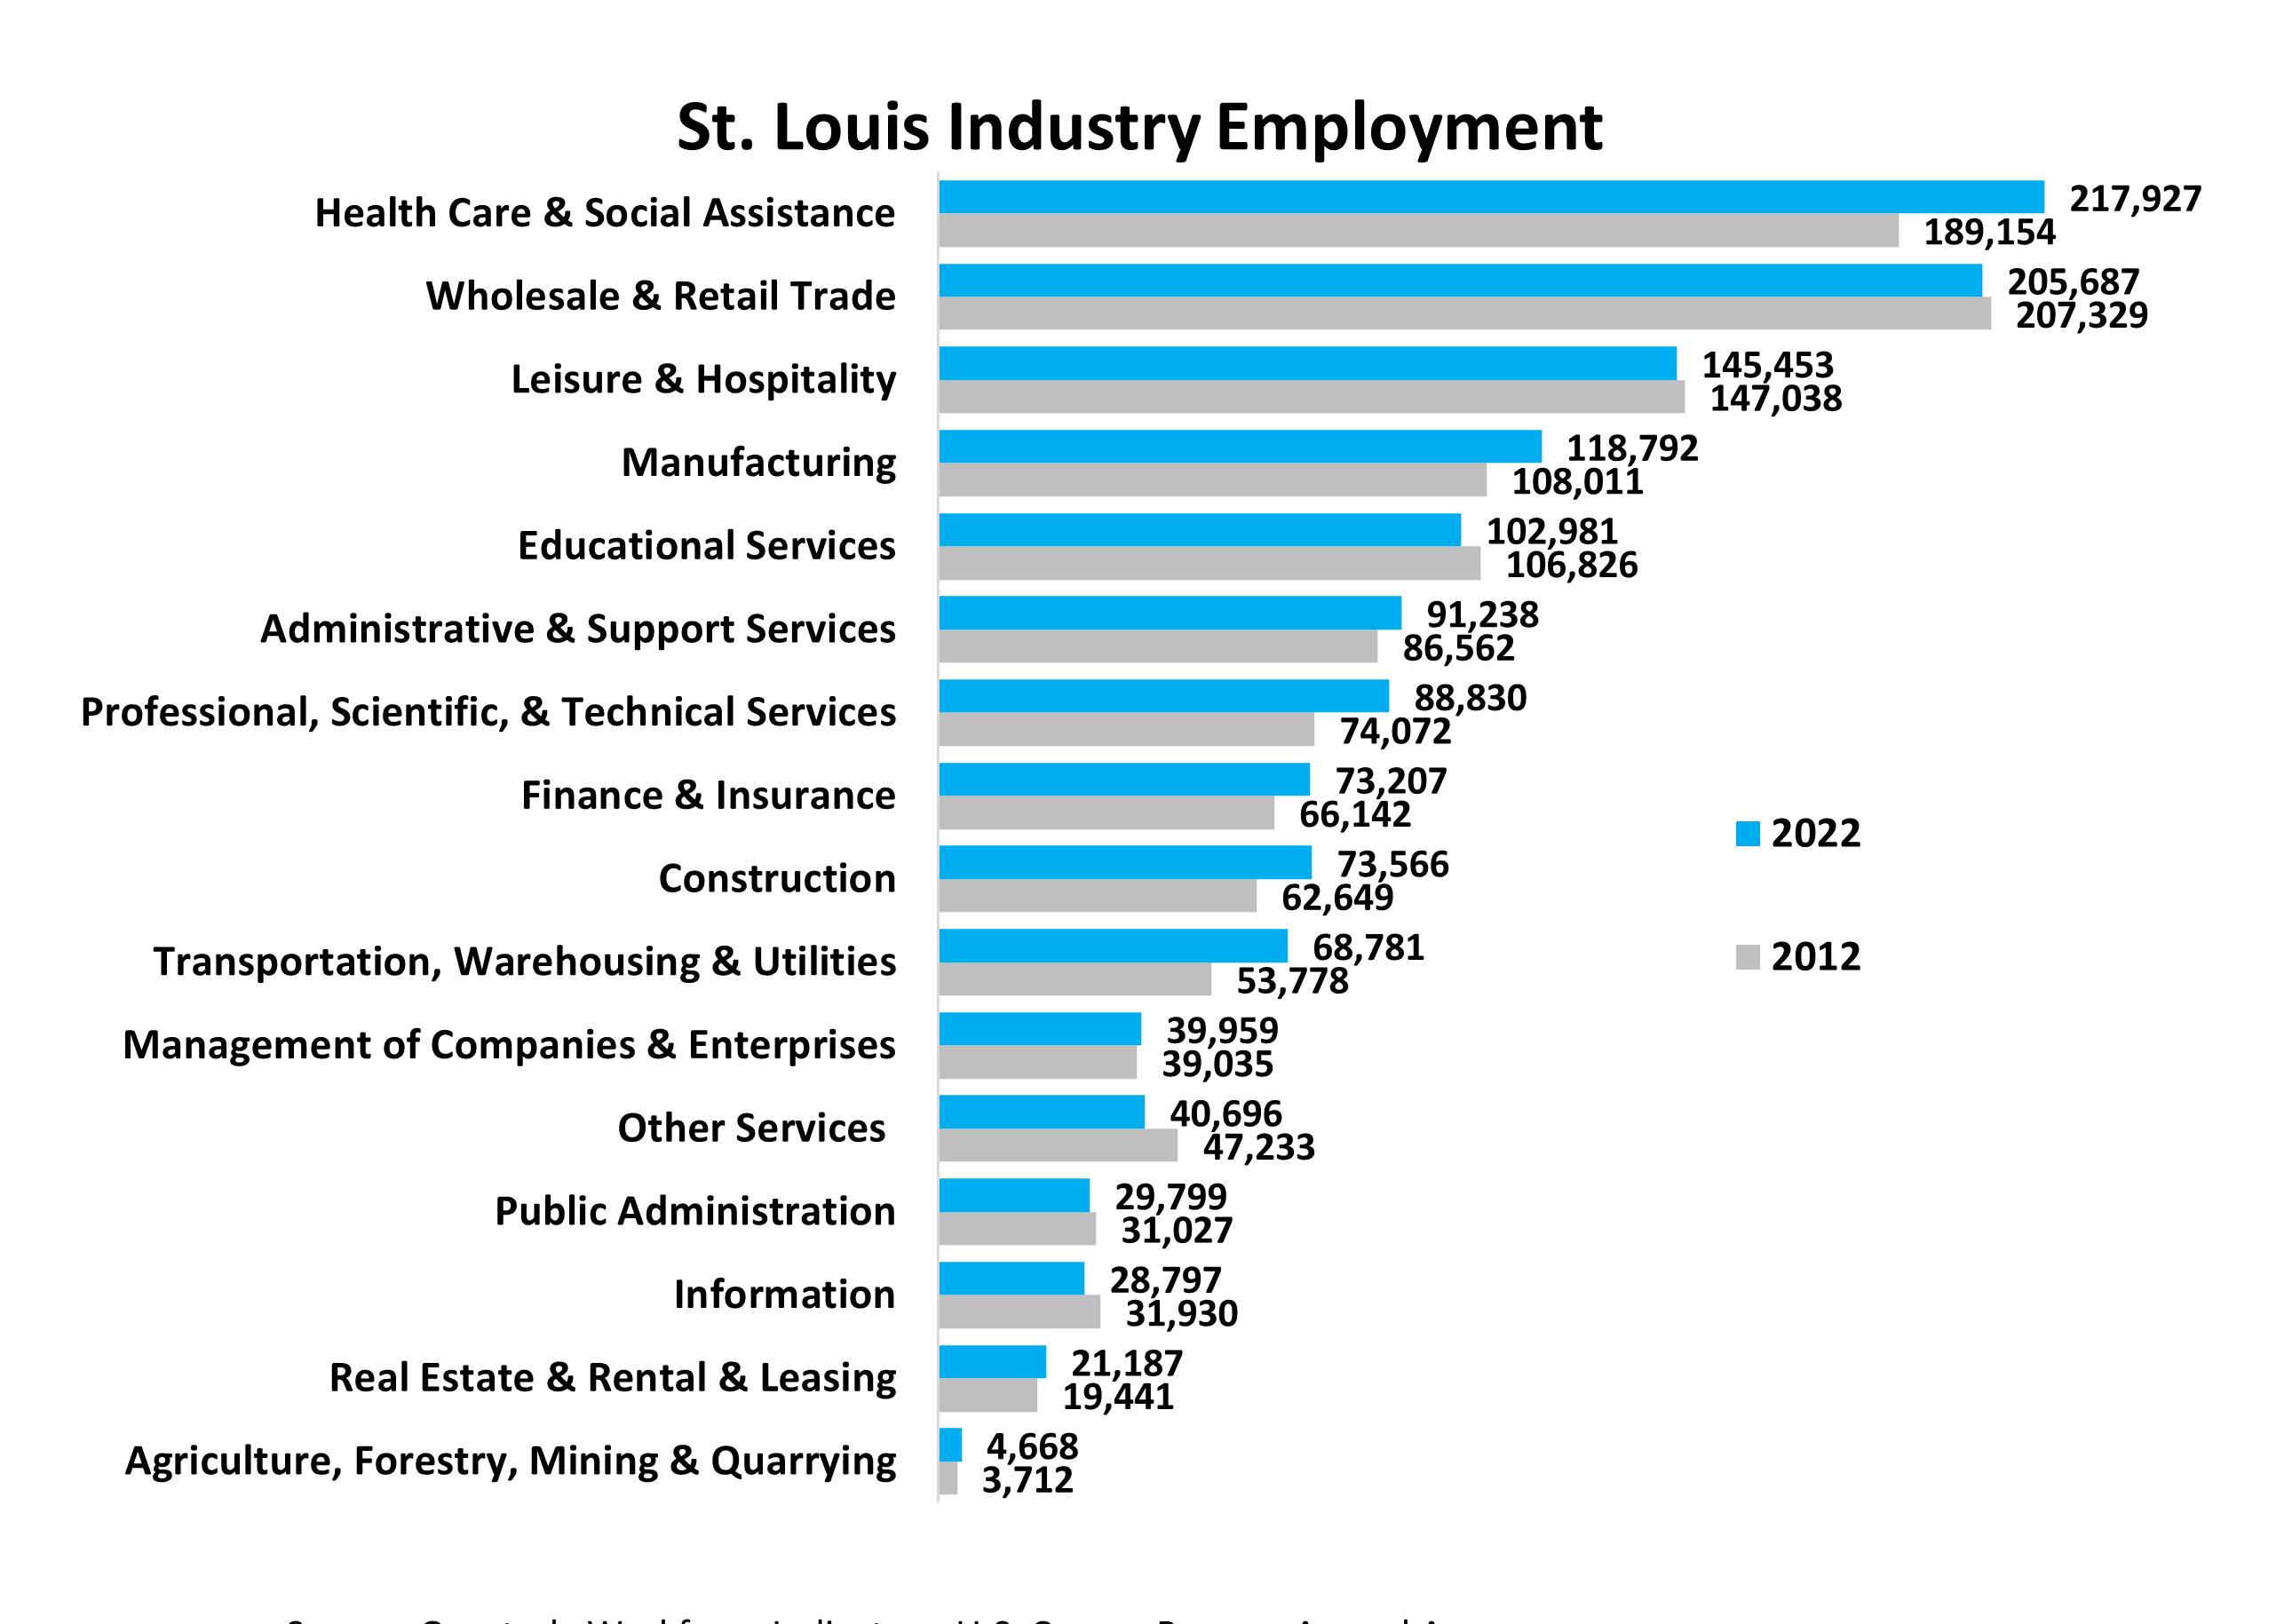
The St. Louis MSA has a diverse economy with a labor force of over 1.3 million that work in a wide range of industries. Health Care & Social Assistance makes up 16% of total employment, followed closely by Wholesale & Retail Trade, which makes up 15% of total employment. Health Care & Social Assistance has increased by over 28,000, or 15% over the last 10 years. Other Services had the largest decrease, with employment declining by over 6,000, or 14%. Overall, the St. Louis economy increased by 77,627 employees (6%) from 2012 - 2022.
St. Louis MSA labor force of 1.3 million, increasing 6% from 2012 to 2022
2023 State of the St. Louis Workforce | 9
Source: U.S. Census Bureau, OnTheMap Application, Primary Jobs (public and private sector) 2020. Powered by Bing © GeoNames, Microsoft, TomTom
Unemployment
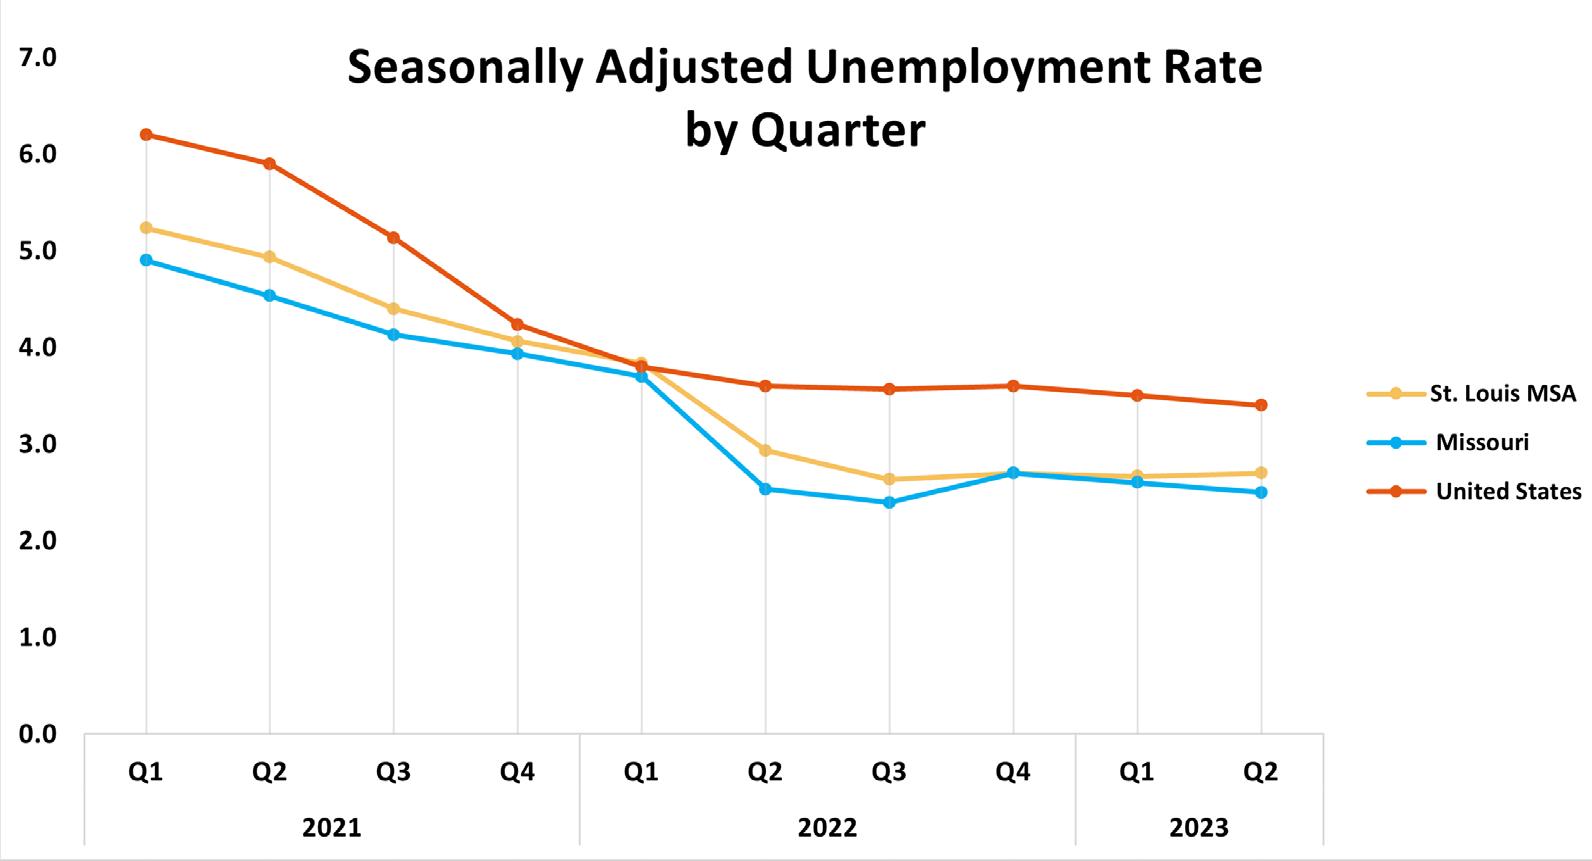
Unemployment rates have remained steady over the past year, at 2.6 - 2.7%. Over the past year, unemployment rates for the St. Louis MSA have consistently been lower than the national rate, and higher as the state.
10 | 2023 State of the St. Louis Workforce
Unemployment Demographics
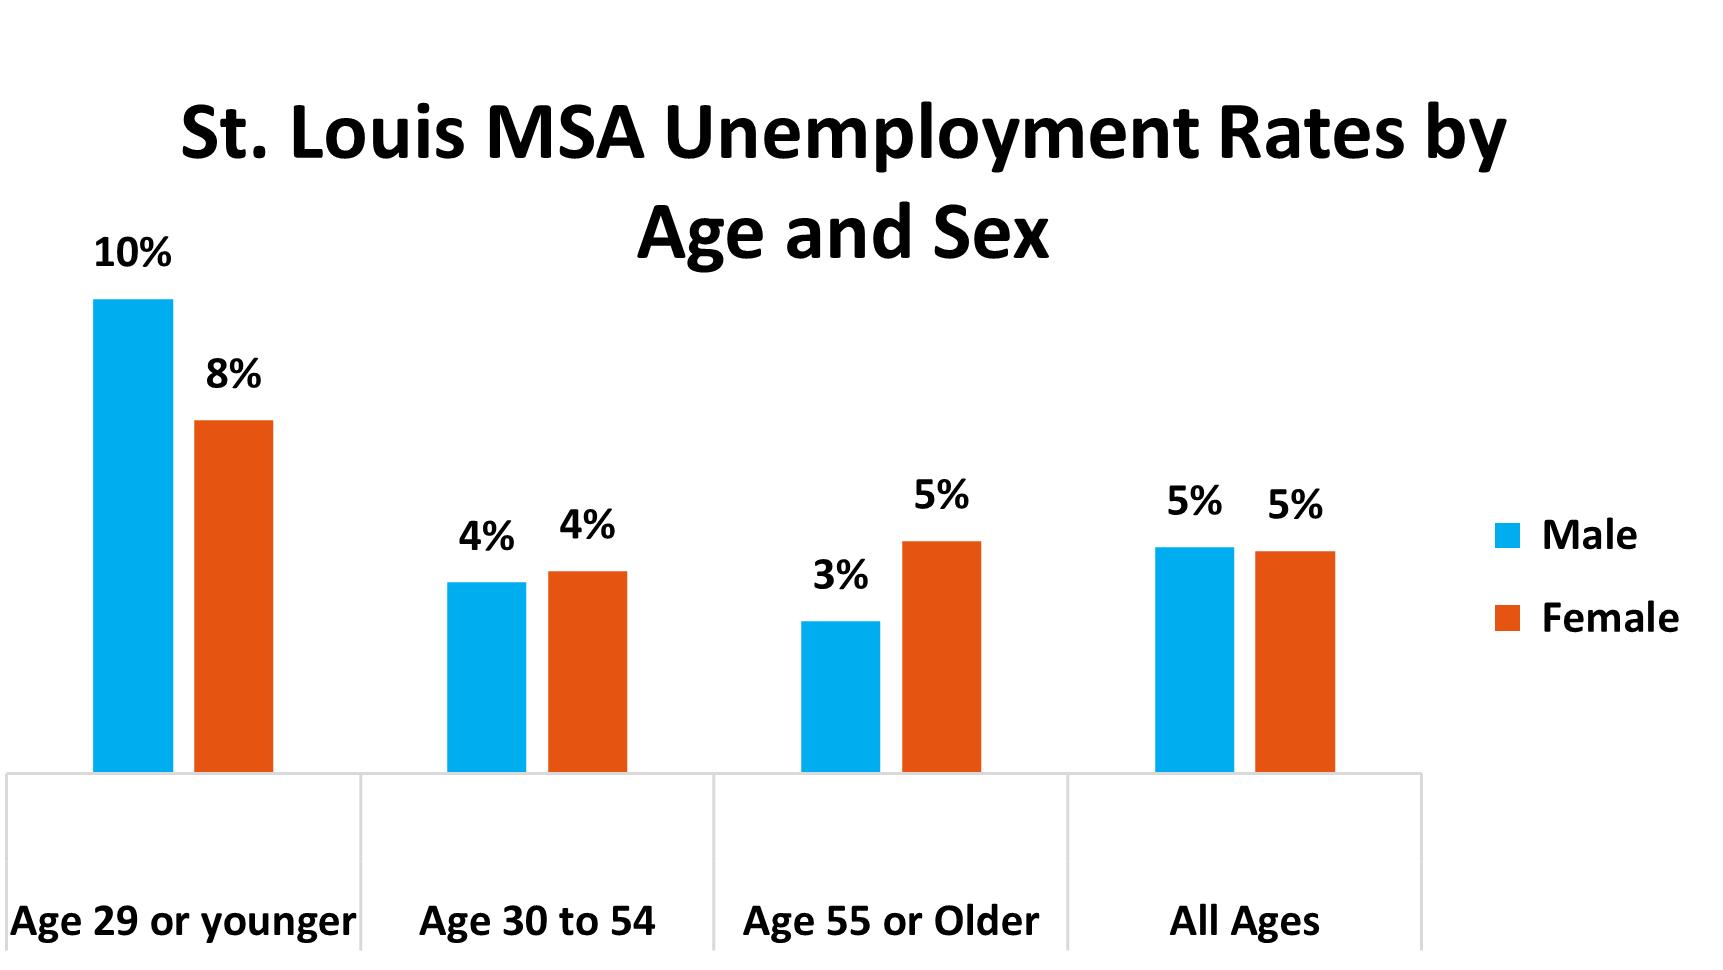
Unemployment rates vary greatly with age and sex. The largest differences in unemployment rates between males and females were in the youngest (15.3% for males vs. 11.2% in females) and oldest (3.4% for males vs. 10.1% for females) age groups. Unemployment rates between males and females were similar in the 25-29 and 35-59 age groups. In 2021, St. Louis MSA unemployment rates for all ages was 5% in males and 4.9% in females.
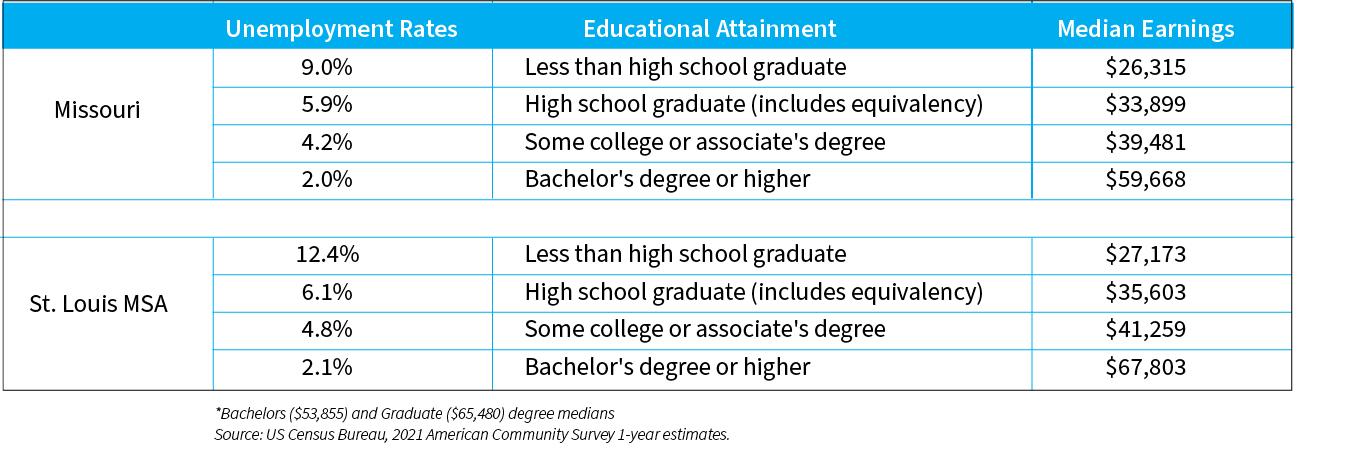
St. Louis MSA data for 2021 shows that unemployment rates decrease and income increases with additional education levels. A bachelor’s degree or higher, compared to a high school diploma, reduces the unemployment rate by 4 percentage points and increases median earnings by $32,000 on average.
Unemployment Rates and Earnings by Education Population 25 years and older
2023 State of the St. Louis Workforce | 11
The highest unemployment rates and lowest wages belong to workers with less than a high school education. Unemployment rates for those without a high school diploma or GED are two times higher than those with a high school diploma or equivalent, and nearly six times higher than individuals with a bachelor’s degree or higher. Adding training or education significantly impacts employment options. Missouri shows similar trends, with workers who do not have a high school education having an unemployment rate of 9%, and those with a bachelor’s degree or higher having a rate of 2%. Less experienced and/or less educated job seekers often have a more difficult time finding quality employment.
Workforce Demographics
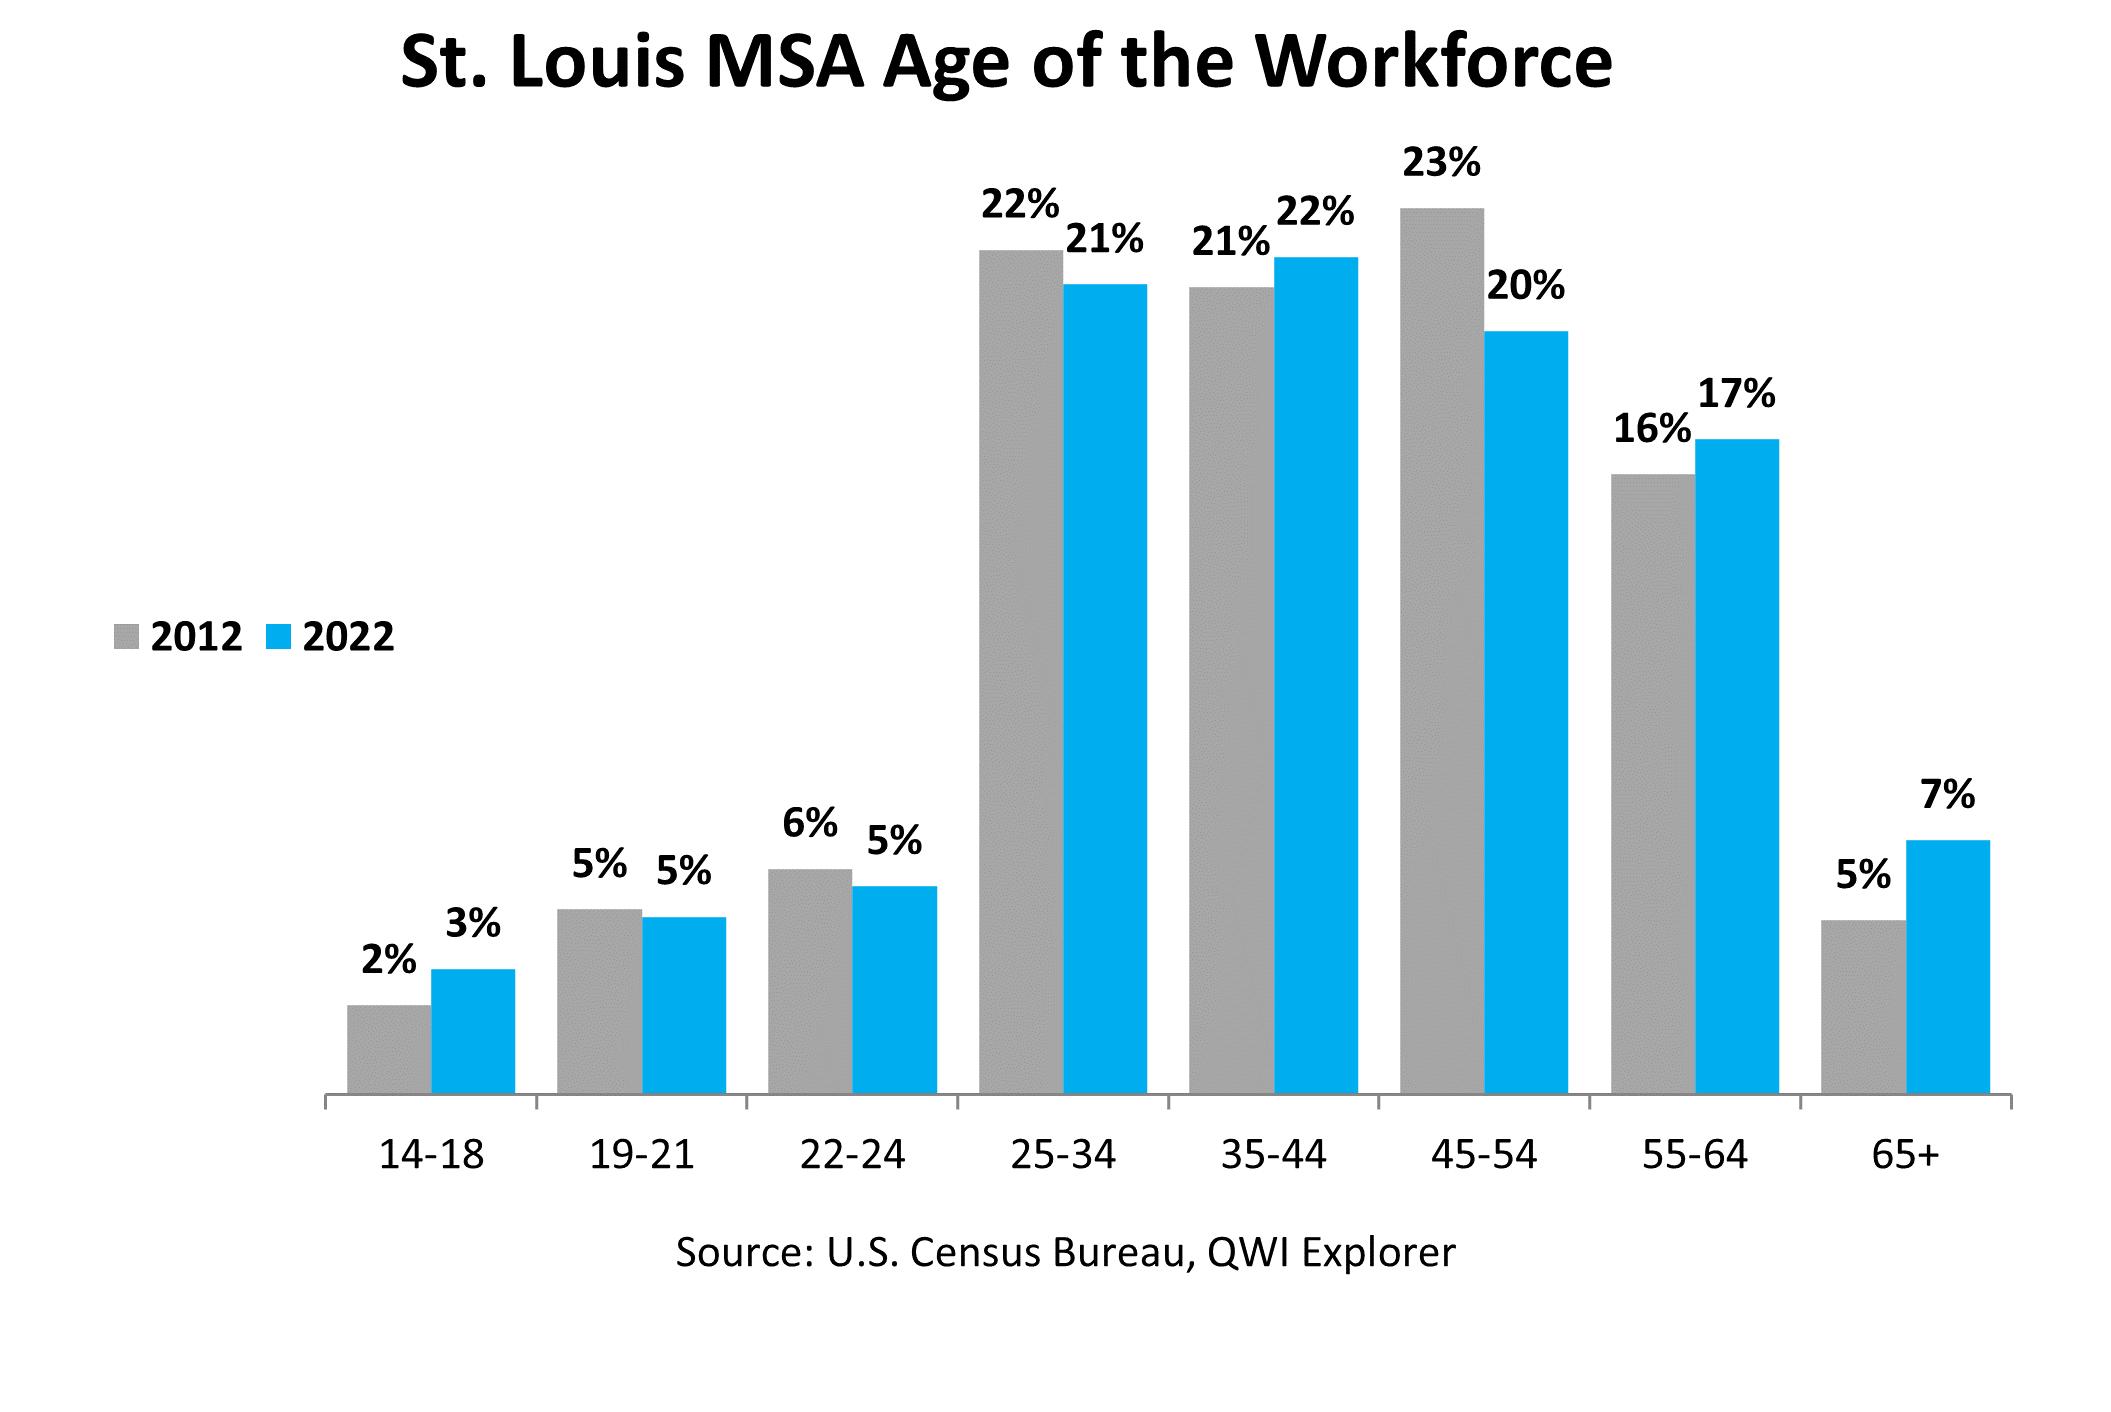
In 2022, the 35-44 age group had the largest share of the workforce at 22%. The St. Louis age profile has changed over time with the 55+ age groups increasing as a share of the workforce, while the 45-54 age group share has decreased. The 55+ age groups have grown from 21% in 2012 to 25% in 2022. With one-fourth of the workforce age 55 or older, St. Louis follows the national trend of an aging workforce.
12 | 2023 State of the St. Louis Workforce
Educational Attainment
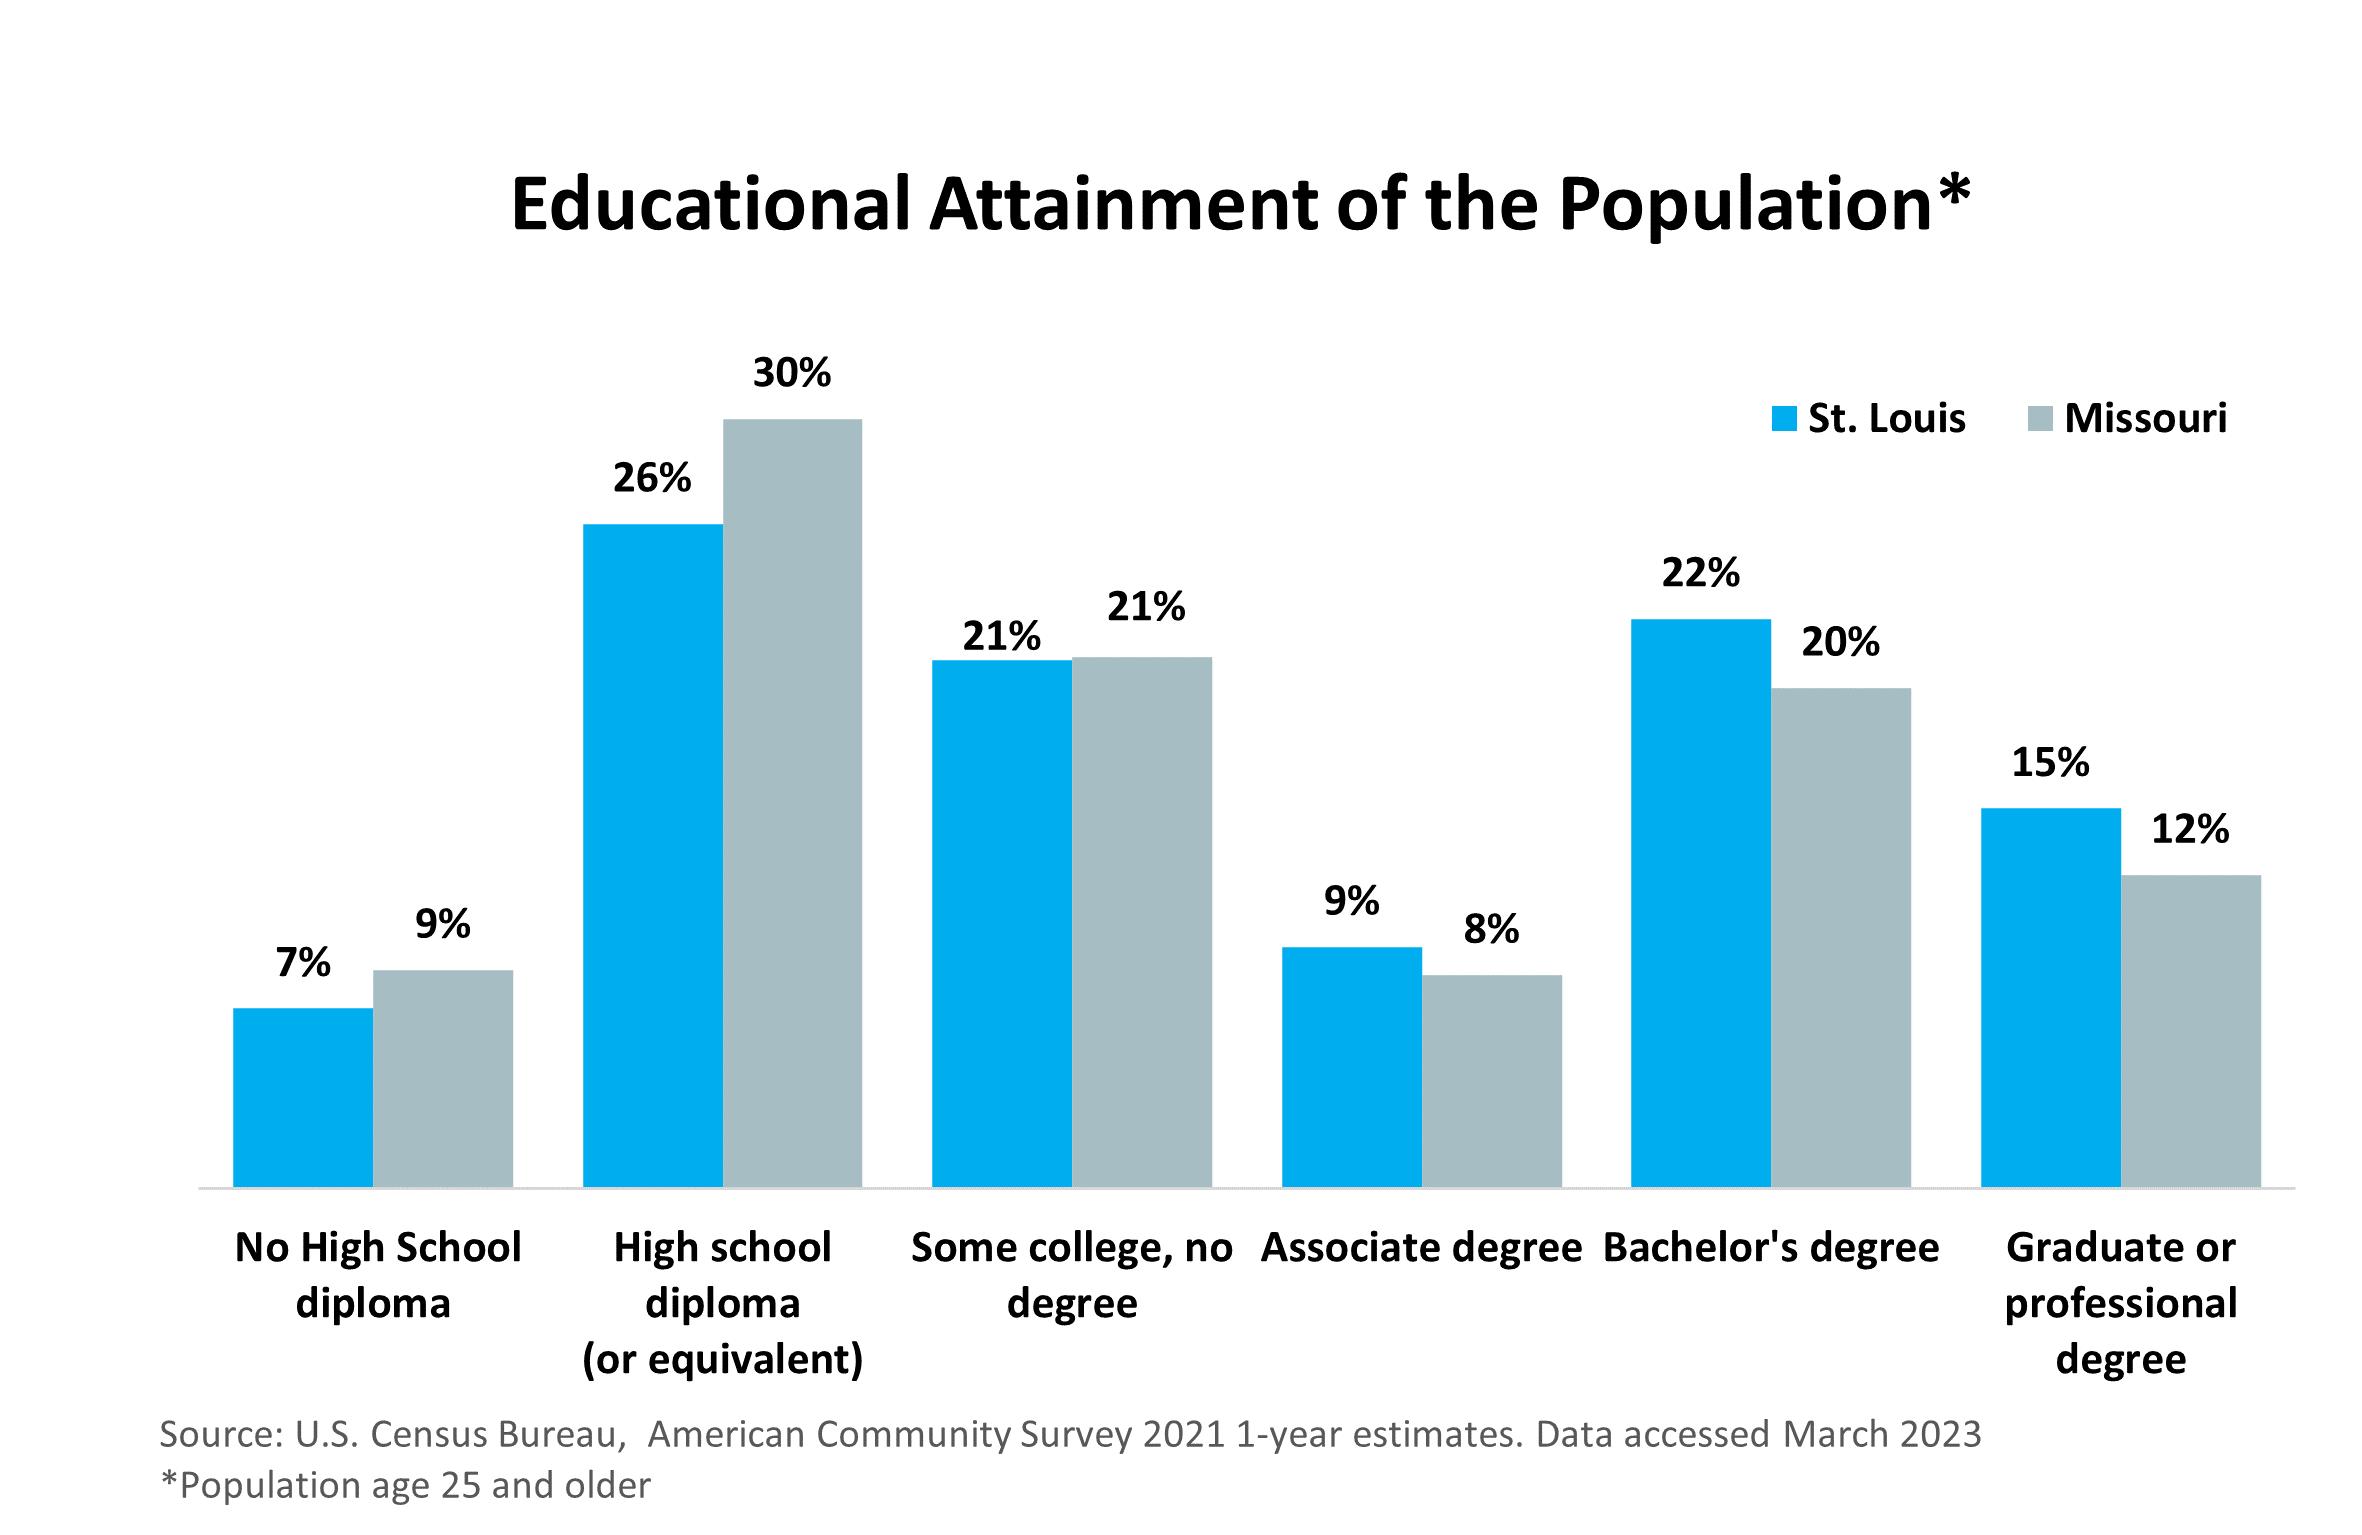
Nearly one-half (47%) of the region’s population age 25 and older have a high school diploma but no post-secondary degree. This is lower than the state rate of 52% and higher than the national rate of 45%. In St. Louis, 37% of workers hold a bachelor’s degree or greater, which is higher than both the state (32%) and national (35%) rate.
2023 State of the St. Louis Workforce | 13
Current Job Demand
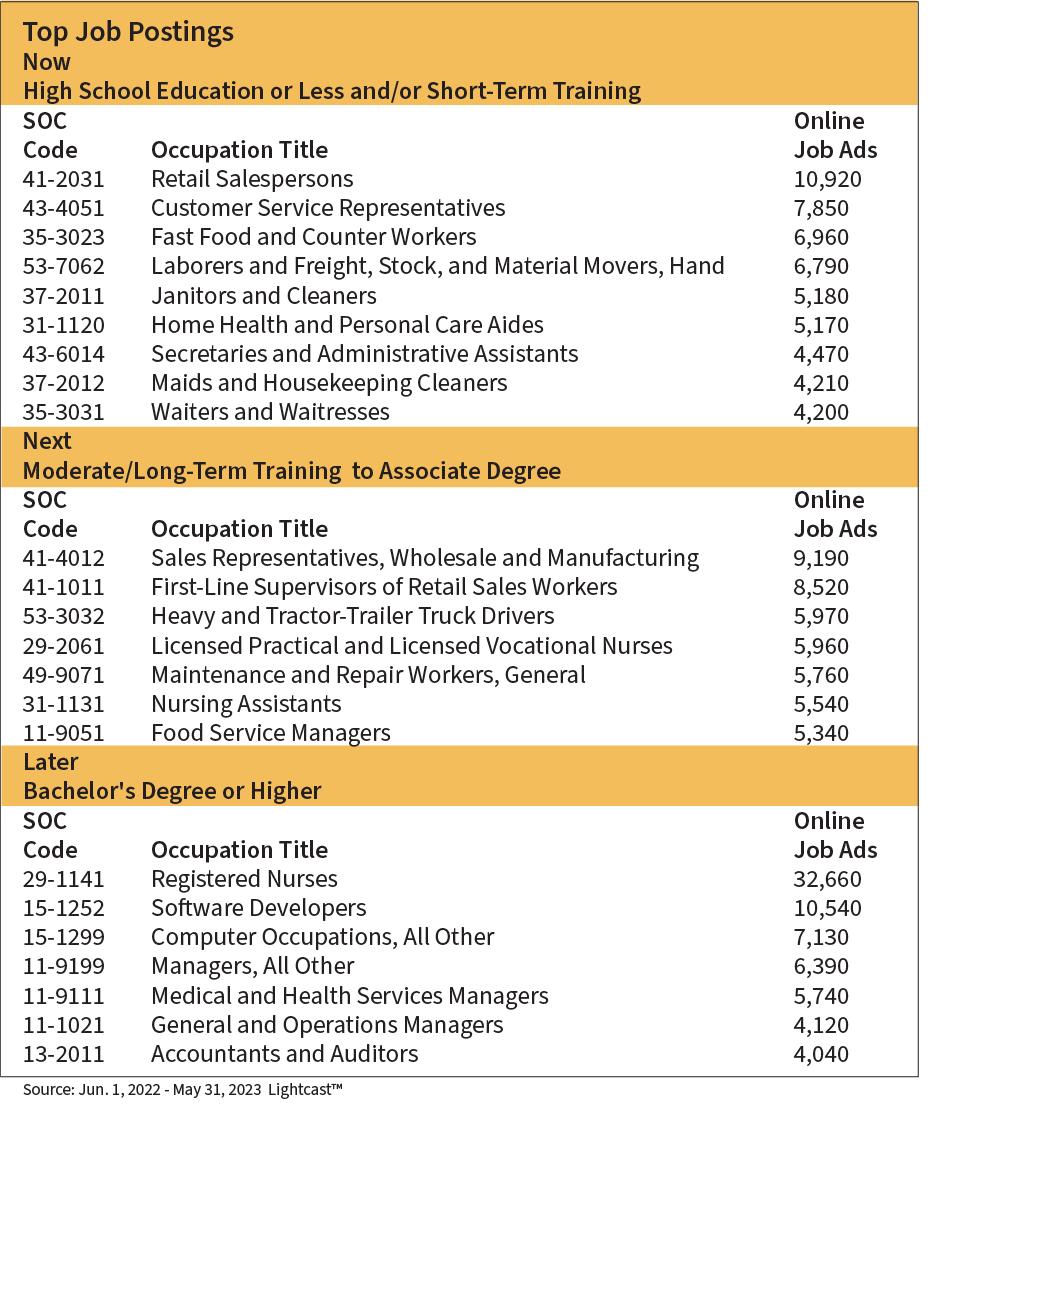
One way to measure current employment demand is to track job postings. Over the past year, there were over 450,000 online job postings in the St. Louis MSA.
Of the online job postings for the St. Louis MSA from June 2022 to May 2023, the overall top-posted job was registered nurses (32,660) followed by retail salespersons (10,920) and software developers (10,540). Six of the top occupations were management jobs, and five were healthcare practitioners and support occupations.
14 | 2023 State of the St. Louis Workforce
Skills and Qualifications
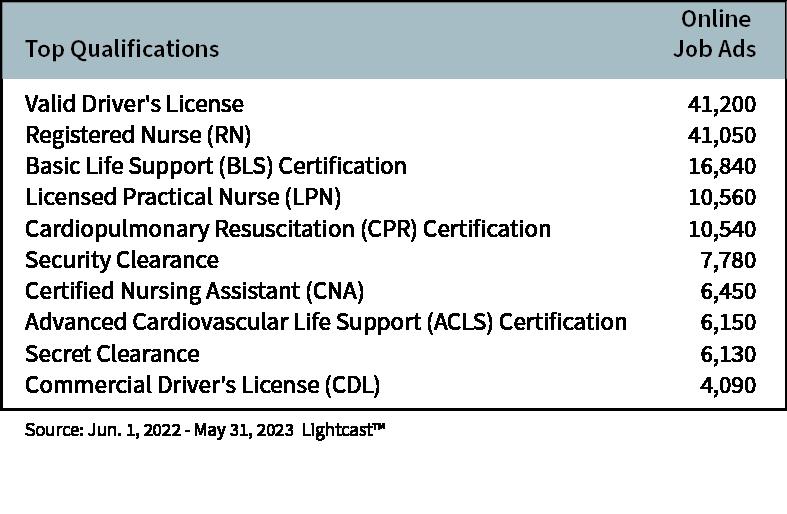
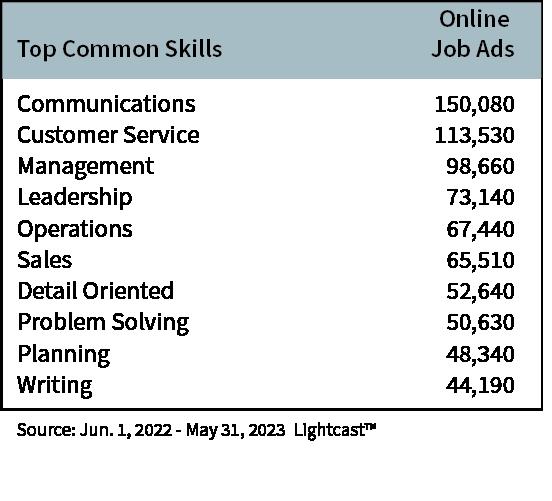
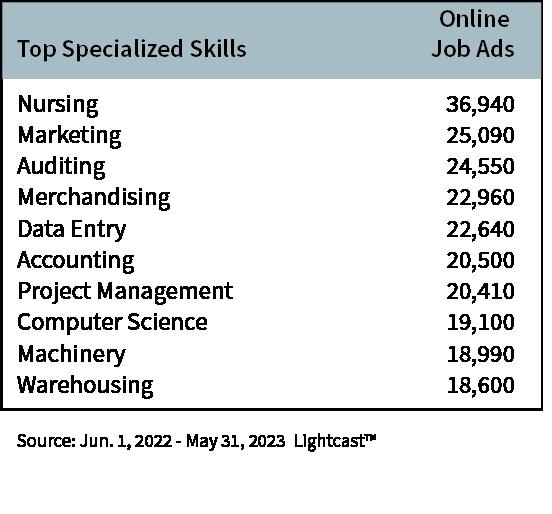
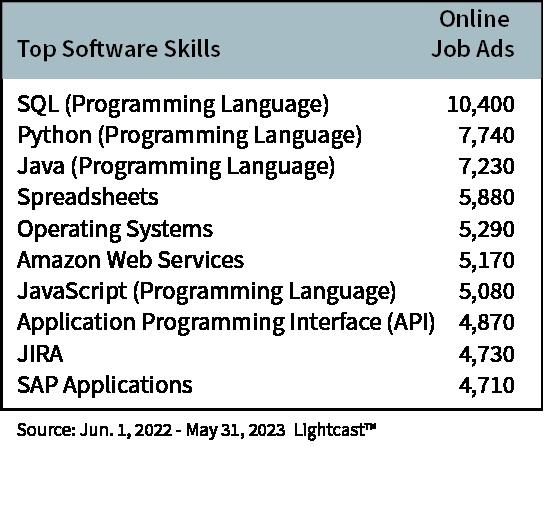
In the St. Louis MSA, communications skills was the top demand of employers, requested in one-third (33%) of total job postings. Other top-demanded common skills included customer service, management, and leadership. Registered nurse was the occupation with the most job postings, and nursing was the top requested specialized skill, followed by marketing and auditing. Microsoft Office and its products such as Word, Excel, PowerPoint, and Access are the most requested software skills across all occupations and industries. Other top requested software and programming skills included SQL, Python, and Java.
“ Retaining and growing a skilled workforce is key to overall job growth in the region.
As our population ages, it will be increasingly important to train younger workers to fill new roles so firms in the region can remain competitive.”
Charles
Gascon Federal Reserve Bank of St. Louis
2023 State of the St. Louis Workforce | 15
16 | 2023 State of the St. Louis Workforce
Employer Survey
The 2023 employer survey marks the 15th annual telephone survey of companies throughout the St. Louis metropolitan area. Our goal is to understand the hiring trends, business climate, occupational skills, and demands from businesses across the St. Louis region. This year’s survey included 600 companies in 16 employer categories across 23 industry segments as defined by the North American Industry Classification System (NAICS). These companies represent a composite picture of the regional industries and economy.
A statistically significant sample was surveyed from each of the industry categories for the St. Louis MSA. Geographically, the firms interviewed also represented the entire St. Louis MSA. The number of employers surveyed in each industry category are listed in the Methodology section.
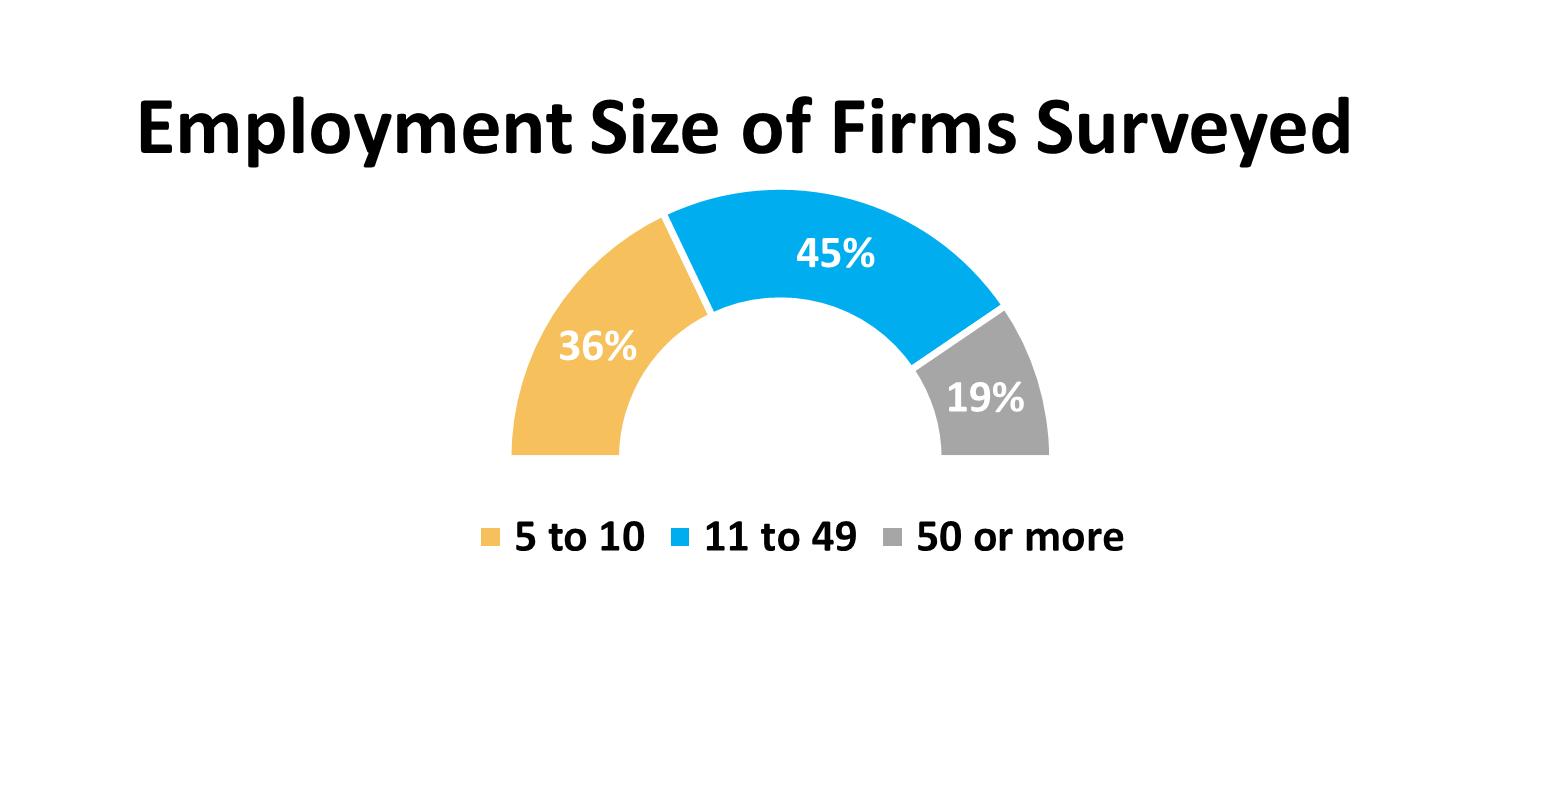
Although the companies interviewed reflect a wide range of sizes as measured by number of employees, as with past years, the majority of the respondents for this year’s survey consisted of small- and mid-sized businesses with fewer than 50 employees. Companies employing fewer than five employees were not selected for interview. (See the Spotlight on Startups section on page 37 for information on new jobs created by startups.)
Each employer was asked a series of 19 questions, several with multiple parts, to understand their hiring outlooks and challenges, as well as practices that either created barriers to, or opportunities for, employment and advancement.
This year’s survey continued to pose questions that examine partnerships to help firms source talent, work-based learning experiences for students and young adults, and Diversity, Equity and Inclusion (DEI) initiatives. The specific survey questions are provided in the Appendix.
2023 State of the St. Louis Workforce | 17
Hiring Trends
The high level of optimism we saw from employers last year in forecasting hiring for 2023 was not entirely justified, as inflation and economic uncertainty persisted.
The Past Year
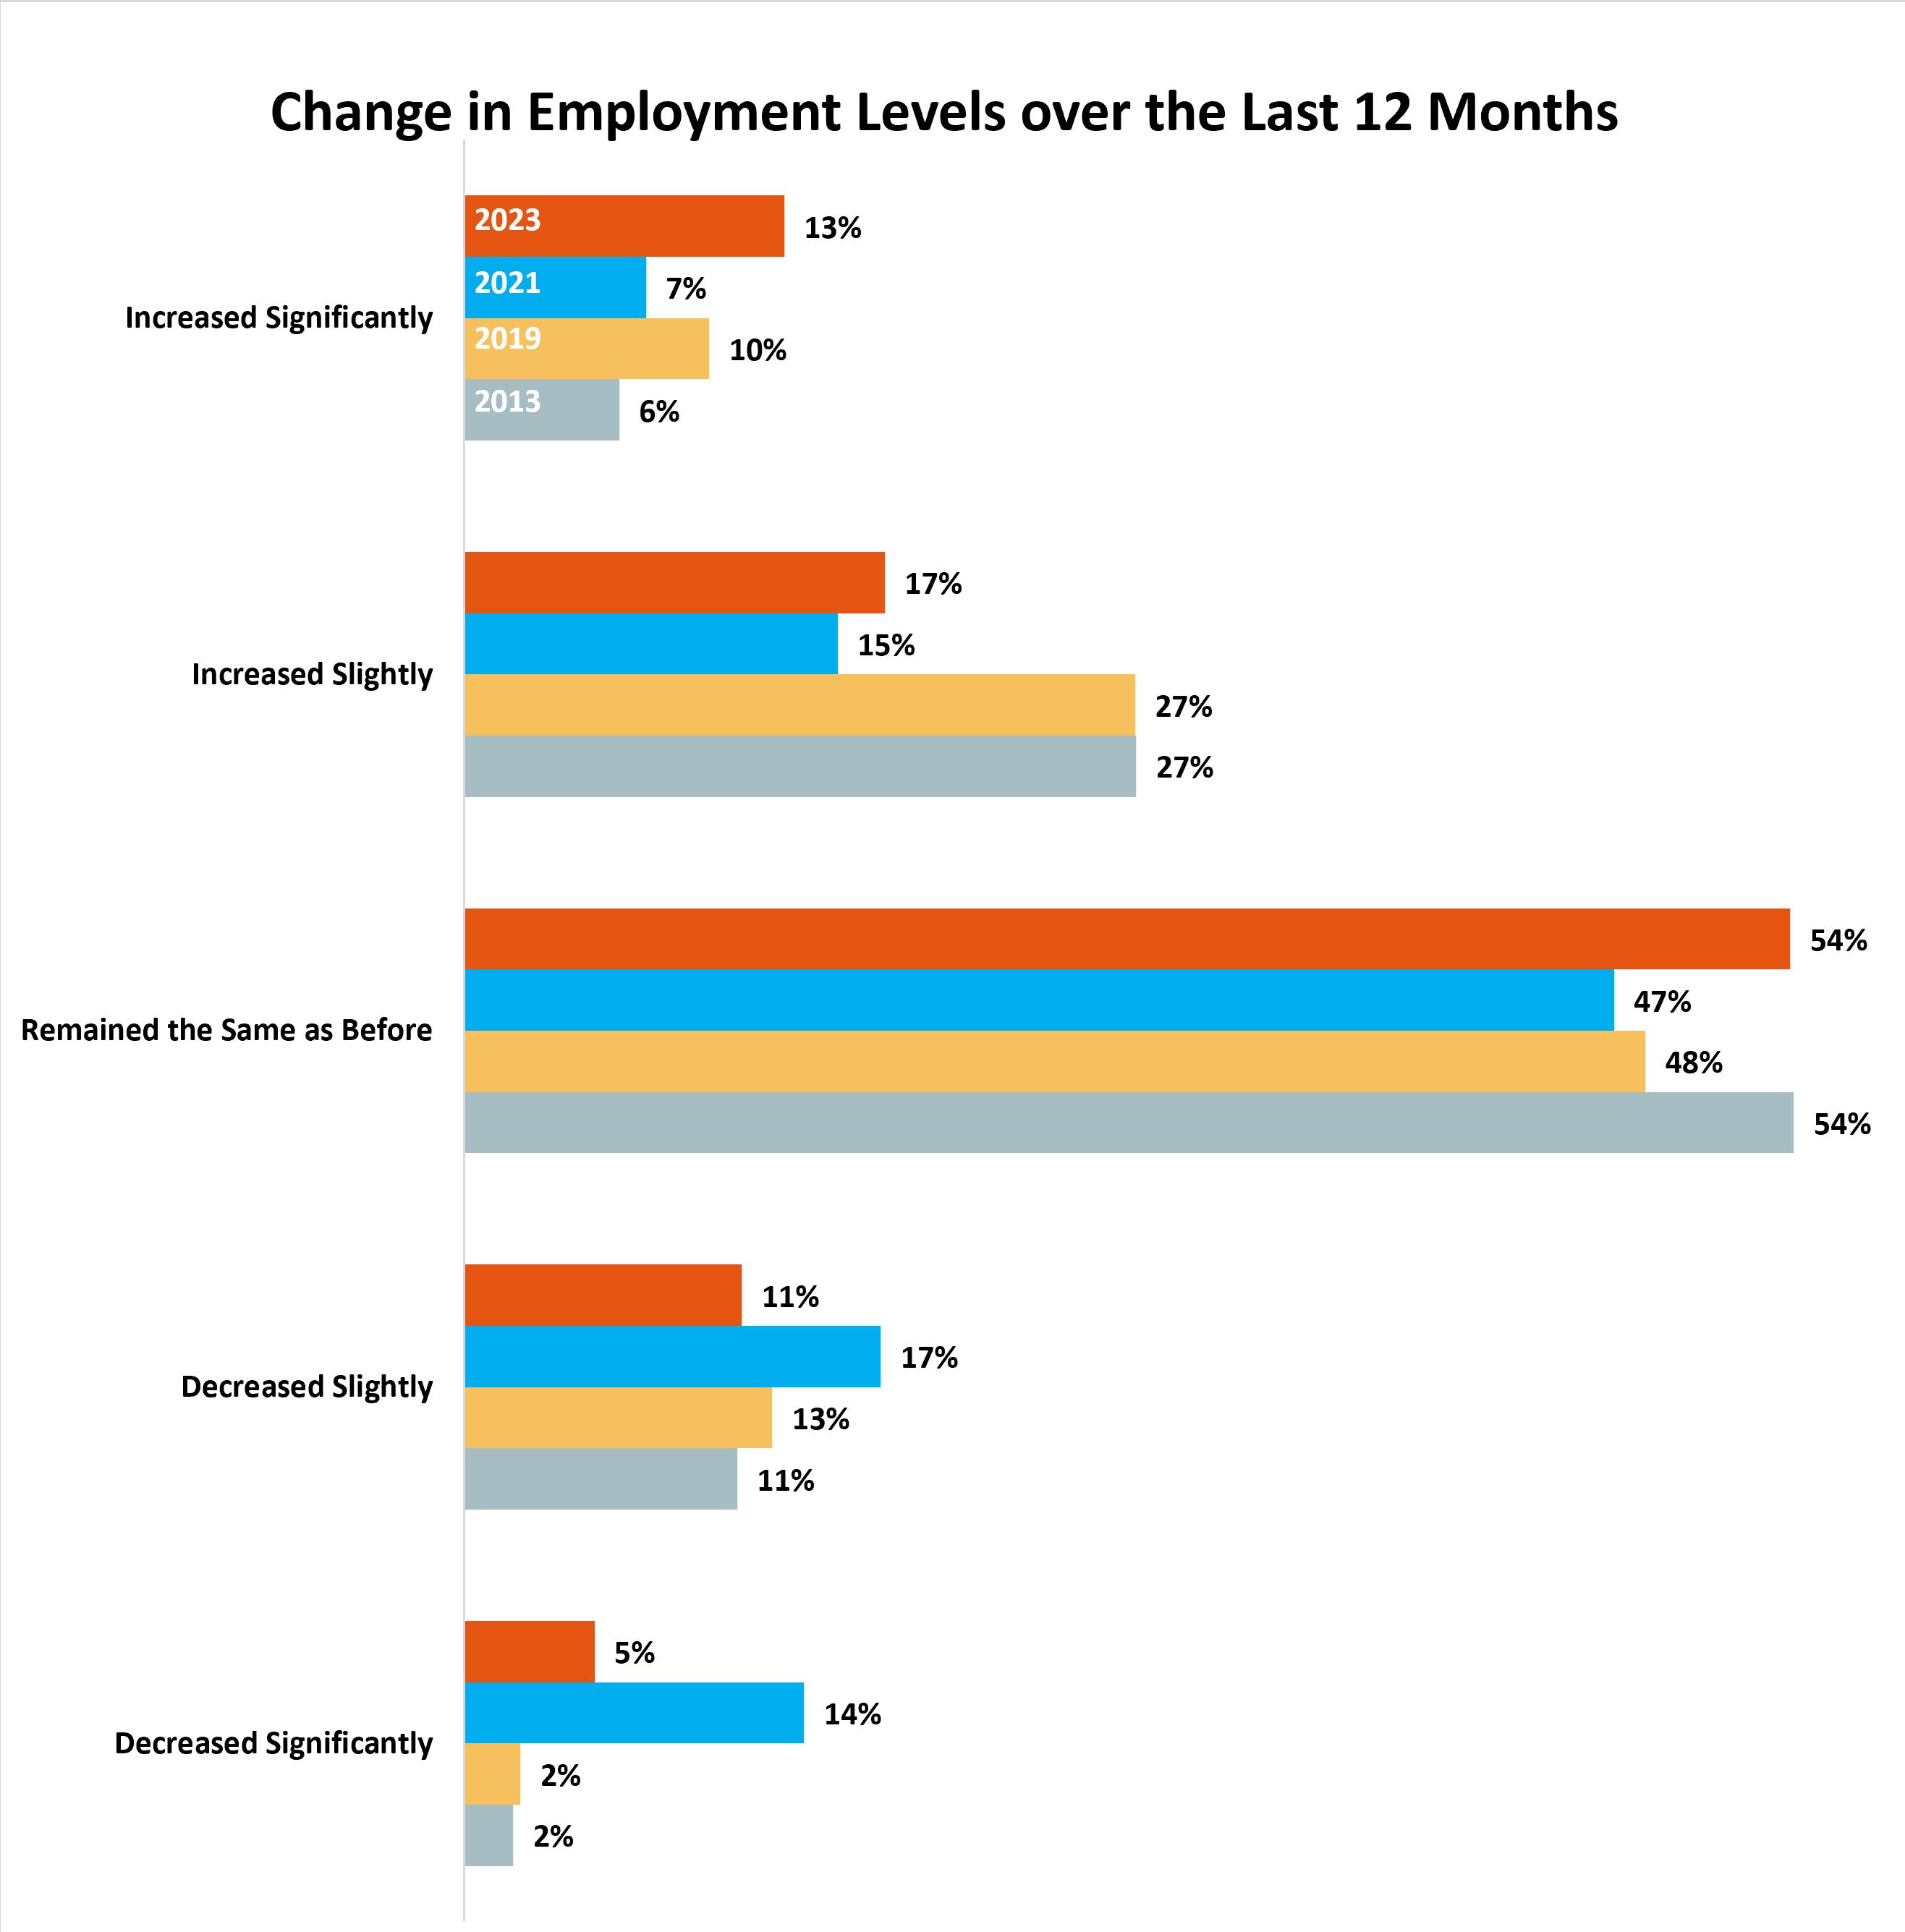
Nearly 30% of employers reported increased employment in 2023, a drop from 32.2% last year, and lower than pre-pandemic levels that approached 37%. More employers maintained the same employment levels, compared to previous years.
18 | 2023 State of the St. Louis Workforce
Looking Ahead
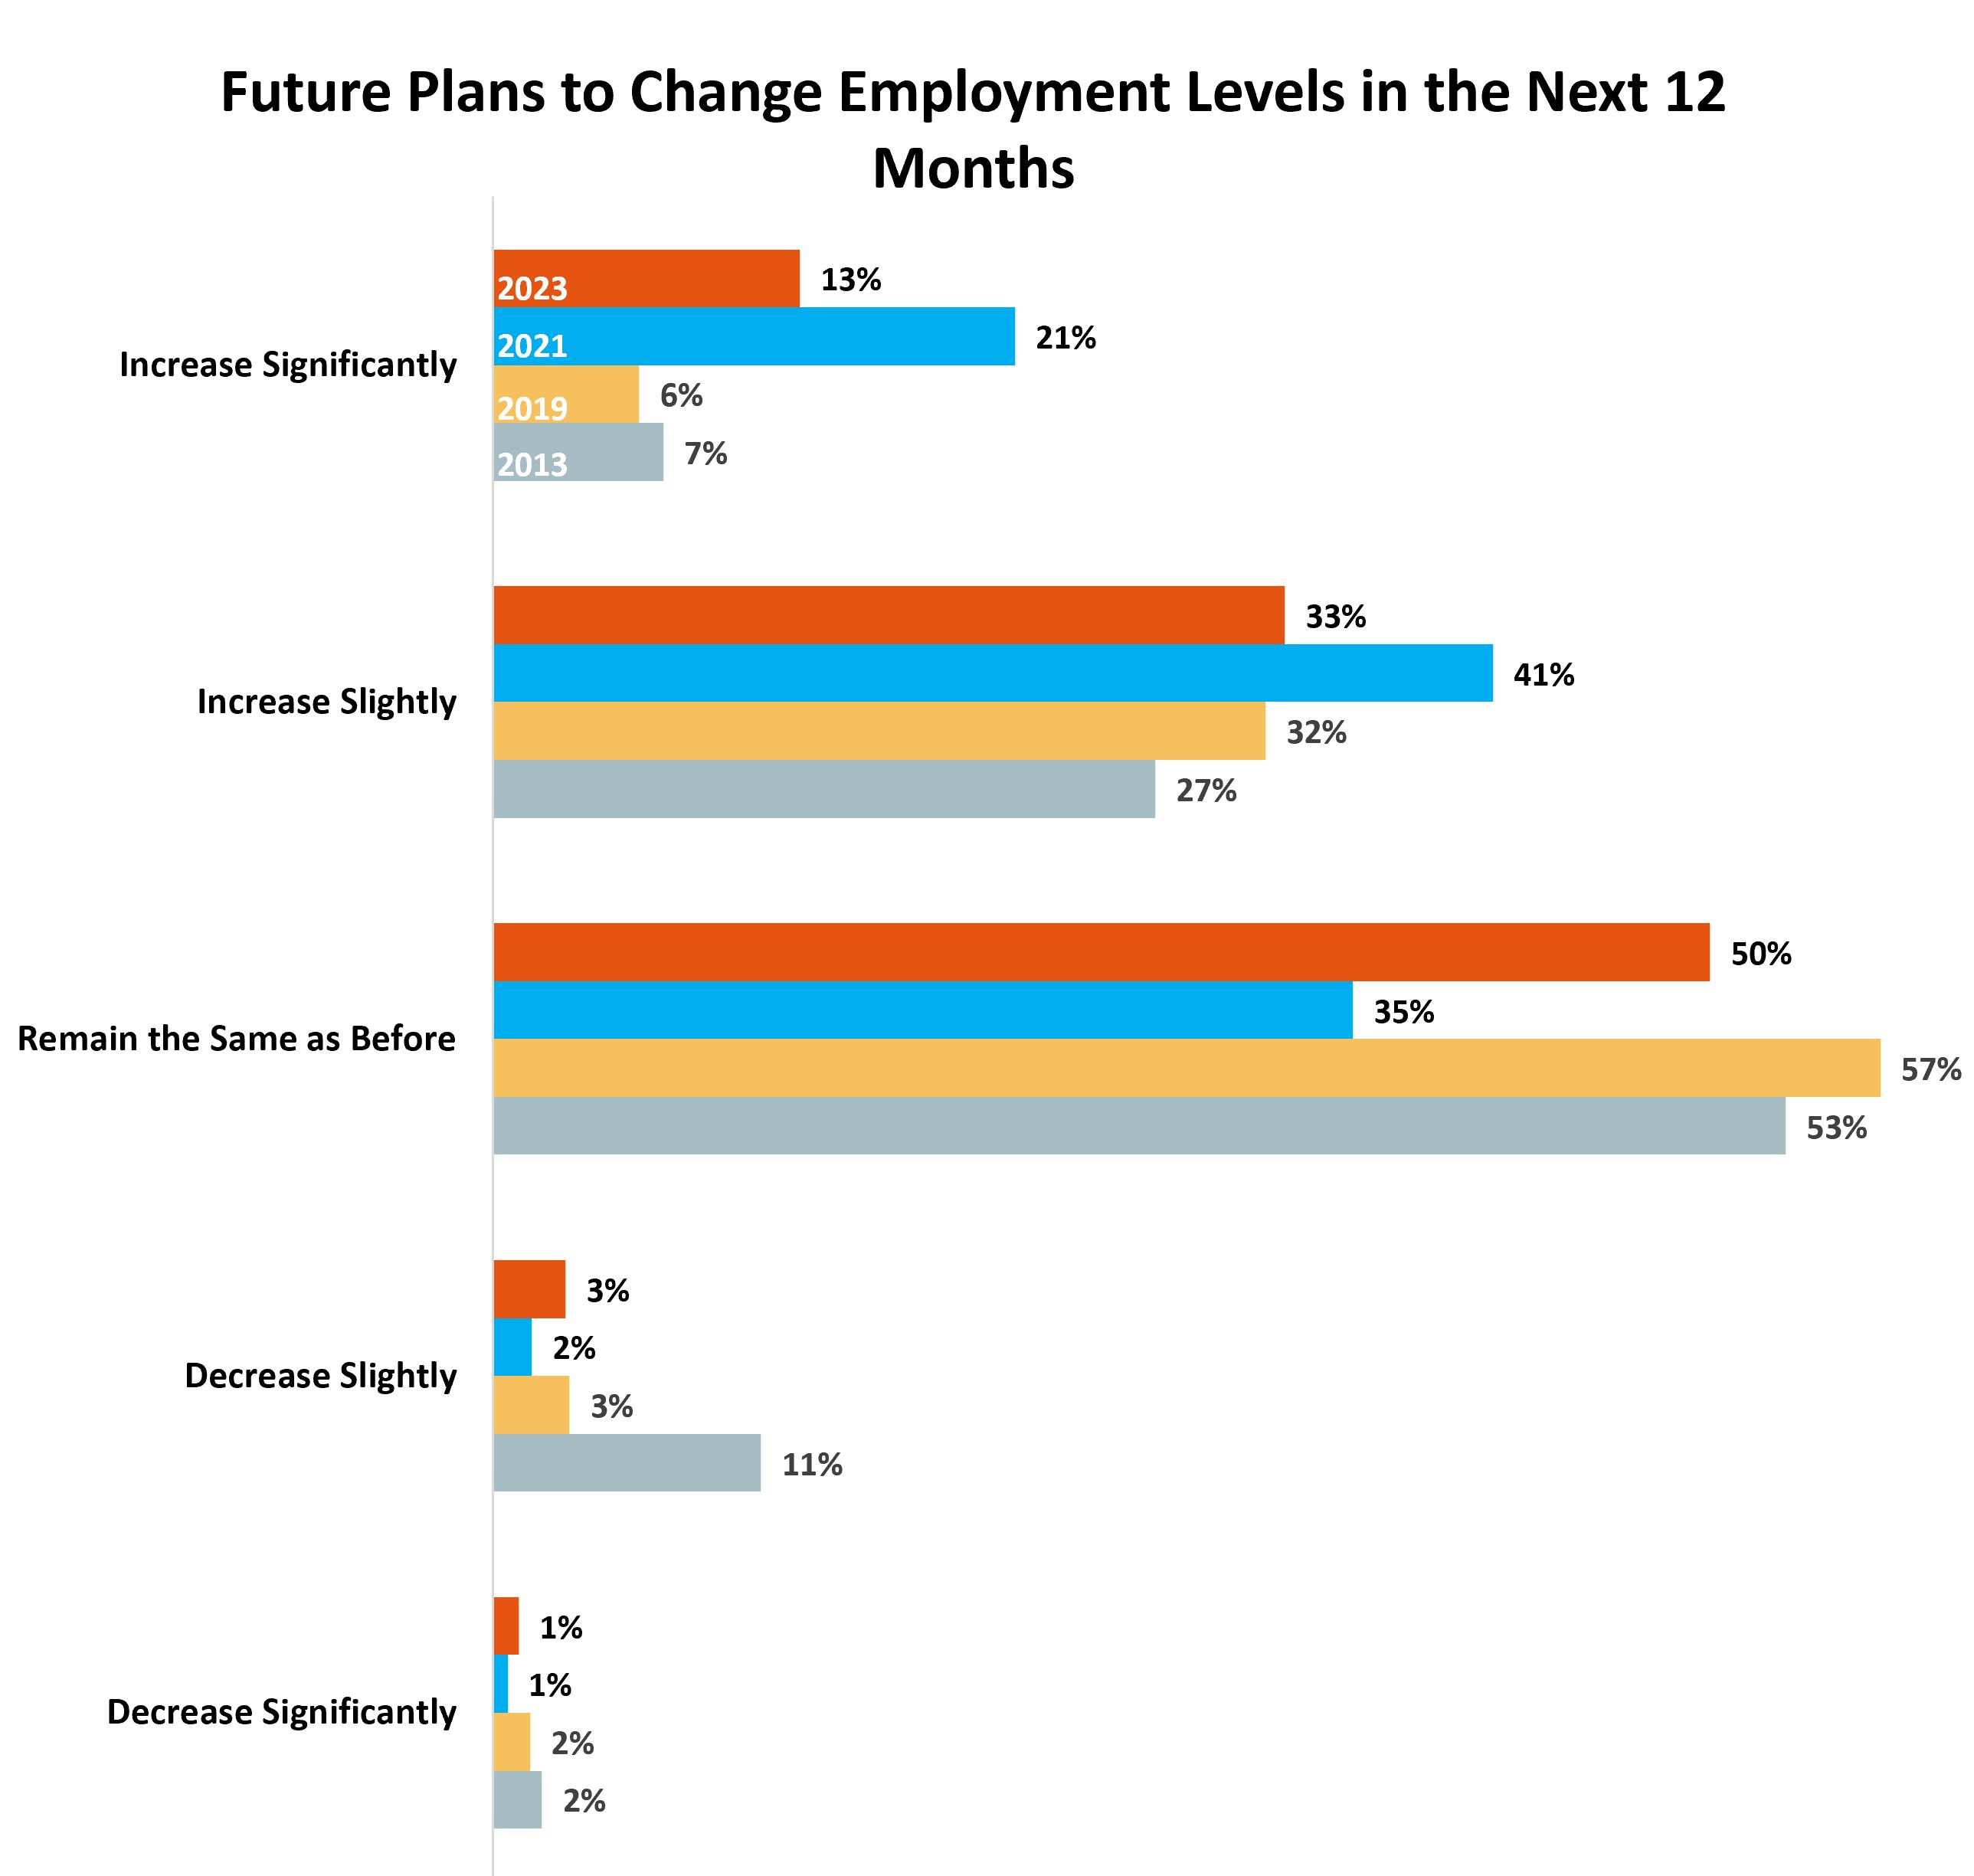
Last year, we saw more than 45% of employers reporting that they planned to increase employment levels, a significant drop from 62.5% last year. Nearly 54% of companies indicated that they plan to remain at the same employment levels, a level of inactivity that was consistently reported between the Recession and the start of the pandemic in 2020.
2023 State of the St. Louis Workforce | 19
Expanding Employment
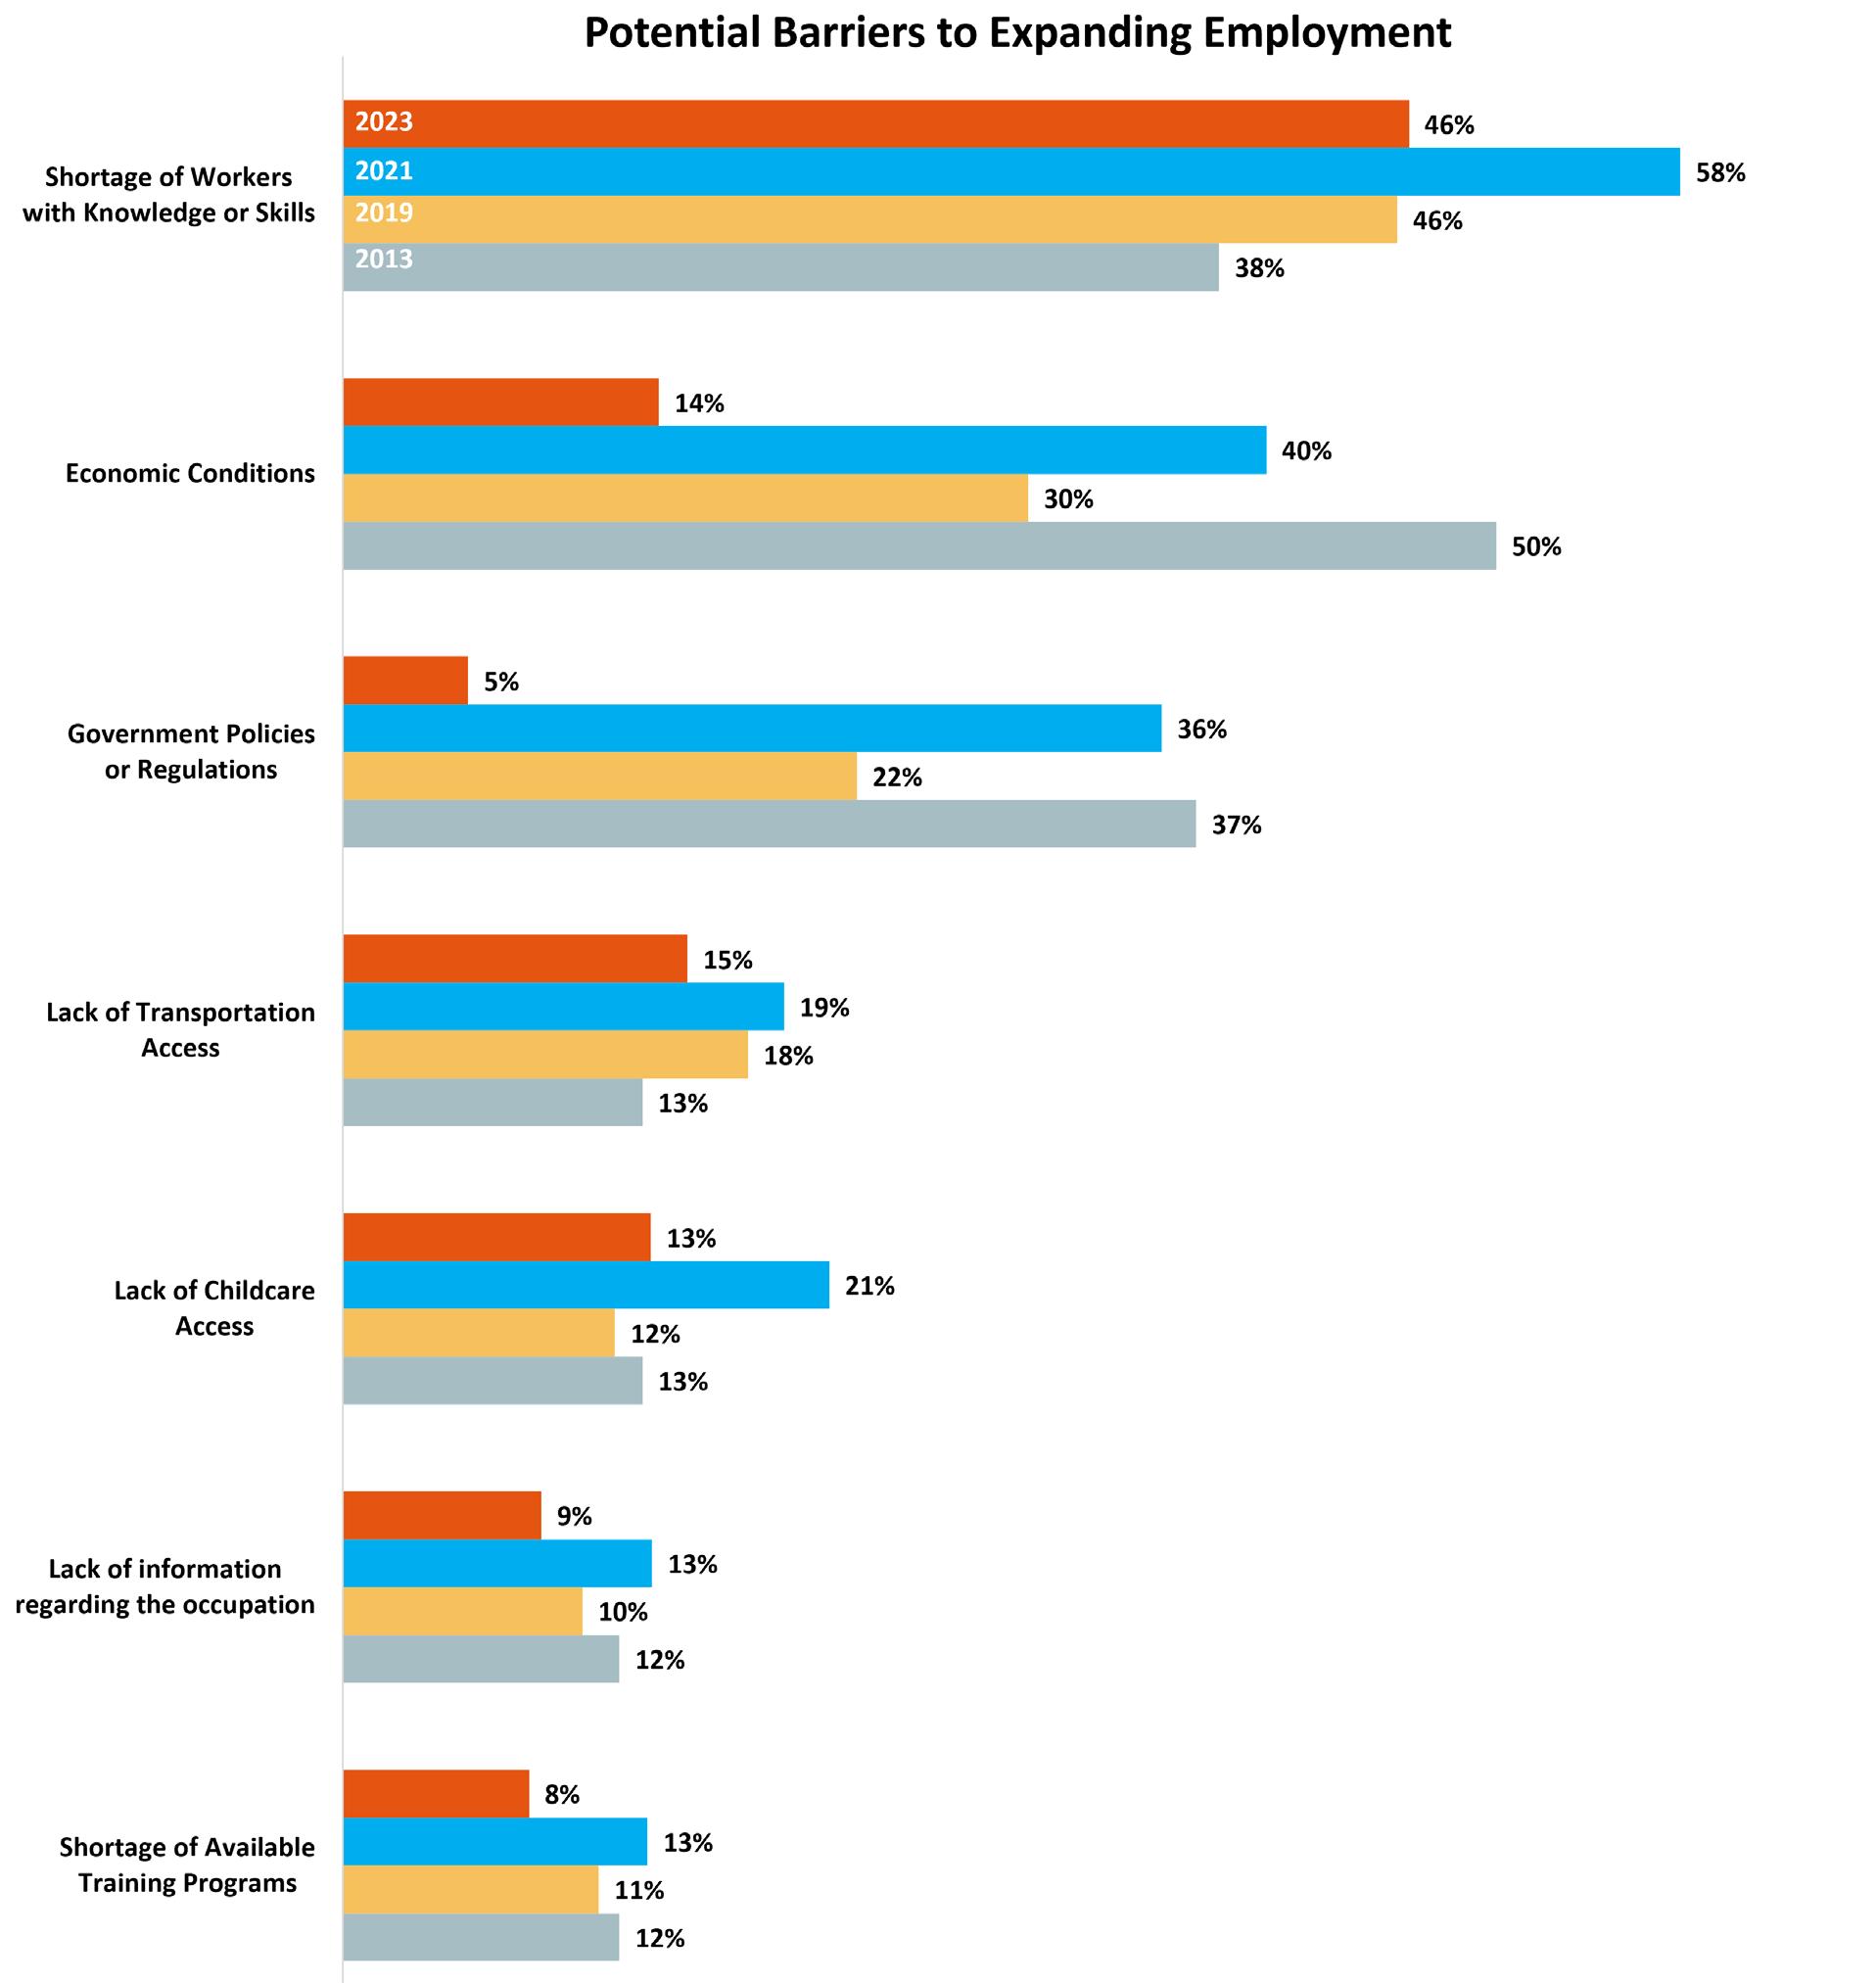
The State of the St. Louis Workforce survey asked employers about perceived barriers to expanding employment.
Barriers and Skill Gaps
Employers continued to identify shortage of workers with knowledge or skills (46%) as their top barrier to expanding employment. All other responses dropped compared to 2022 answers, though lack of transportation access and lack of childcare access remain the other strong responses. These two factors have changed very little over the last decade and remain challenges, particularly for those companies in the retail and healthcare sectors.
20 | 2023 State of the St. Louis Workforce
Adding Employees
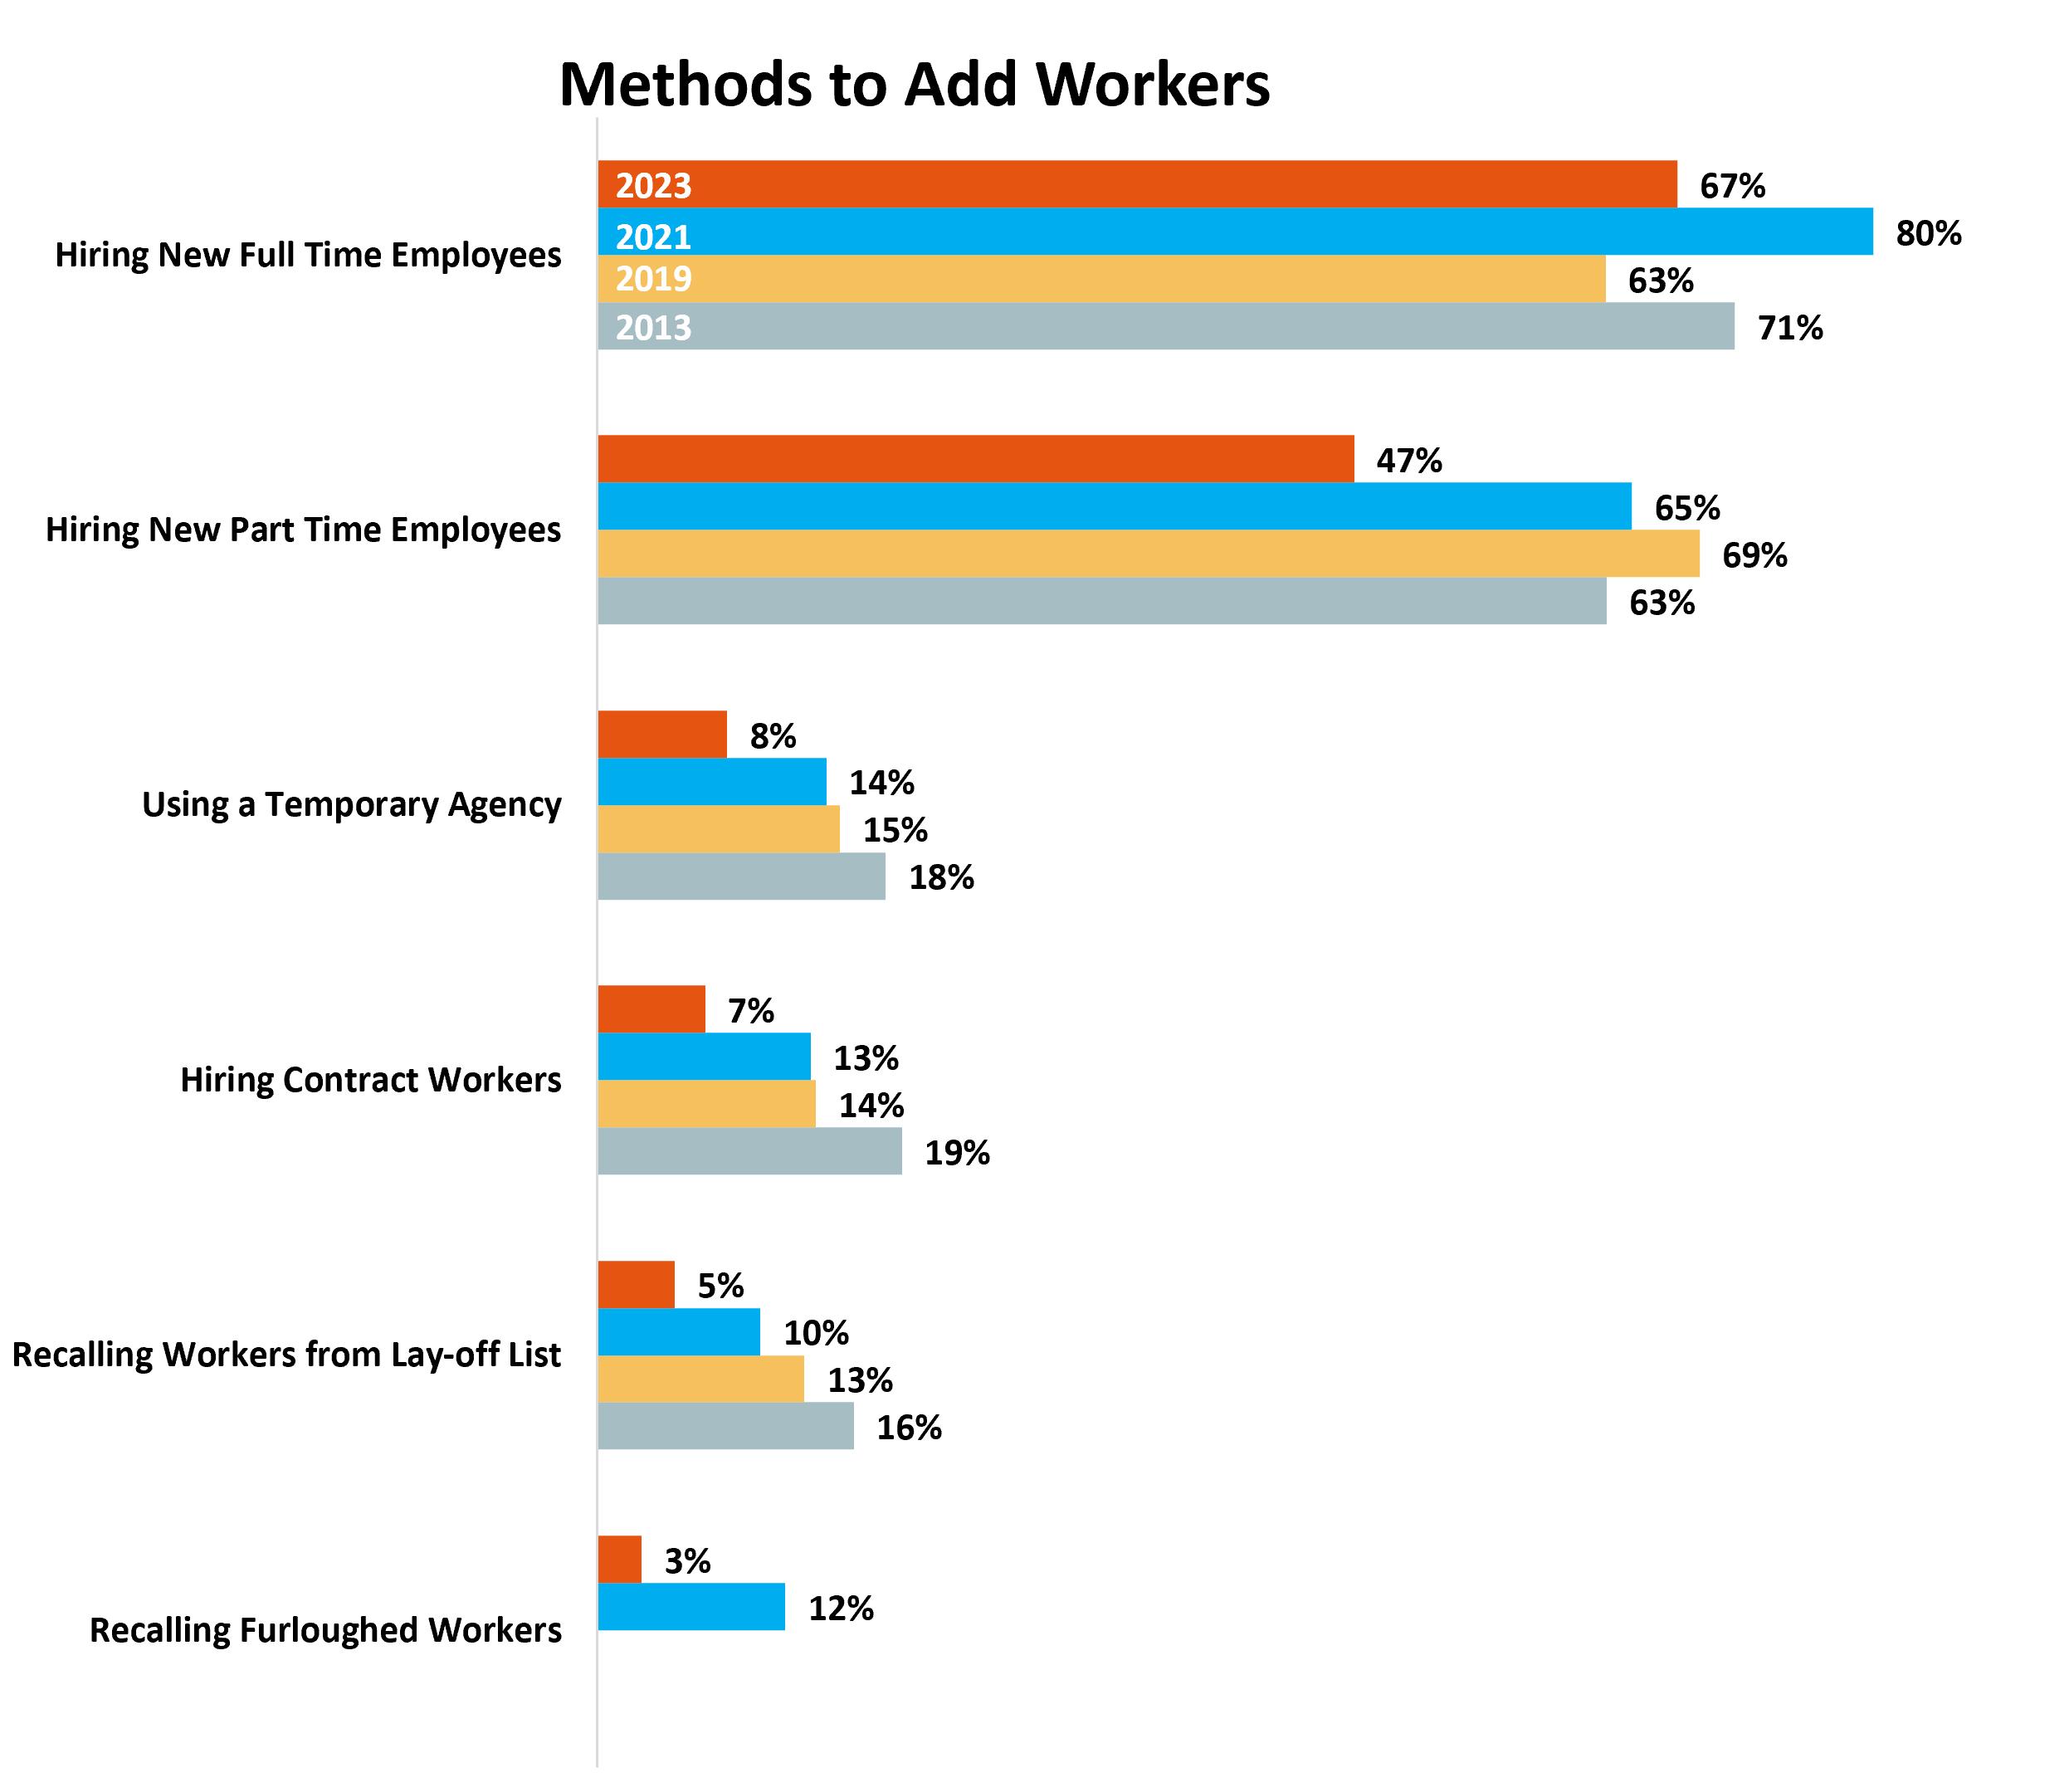
In 2022, hiring new full-time workers remained the preferred option for employers that wish to add workers, with 67.4% of companies reporting this choice. This has been the top choice for most companies over the last decade.
Hiring part-time workers continues to drop as a preferred method of adding workers, sliding 5% to 47%. All other options for hiring continue to drop compared to 2021 as well, with only Recalling workers from a lay-off list increasing by less than a percent at 4.8%.
Companies that reported decreasing their employment this year also reported higher rates of hiring contract workers (50% higher) and recalling workers from lay-off lists (100% higher).
2023 State of the St. Louis Workforce | 21
Shortcomings of Job Applicants
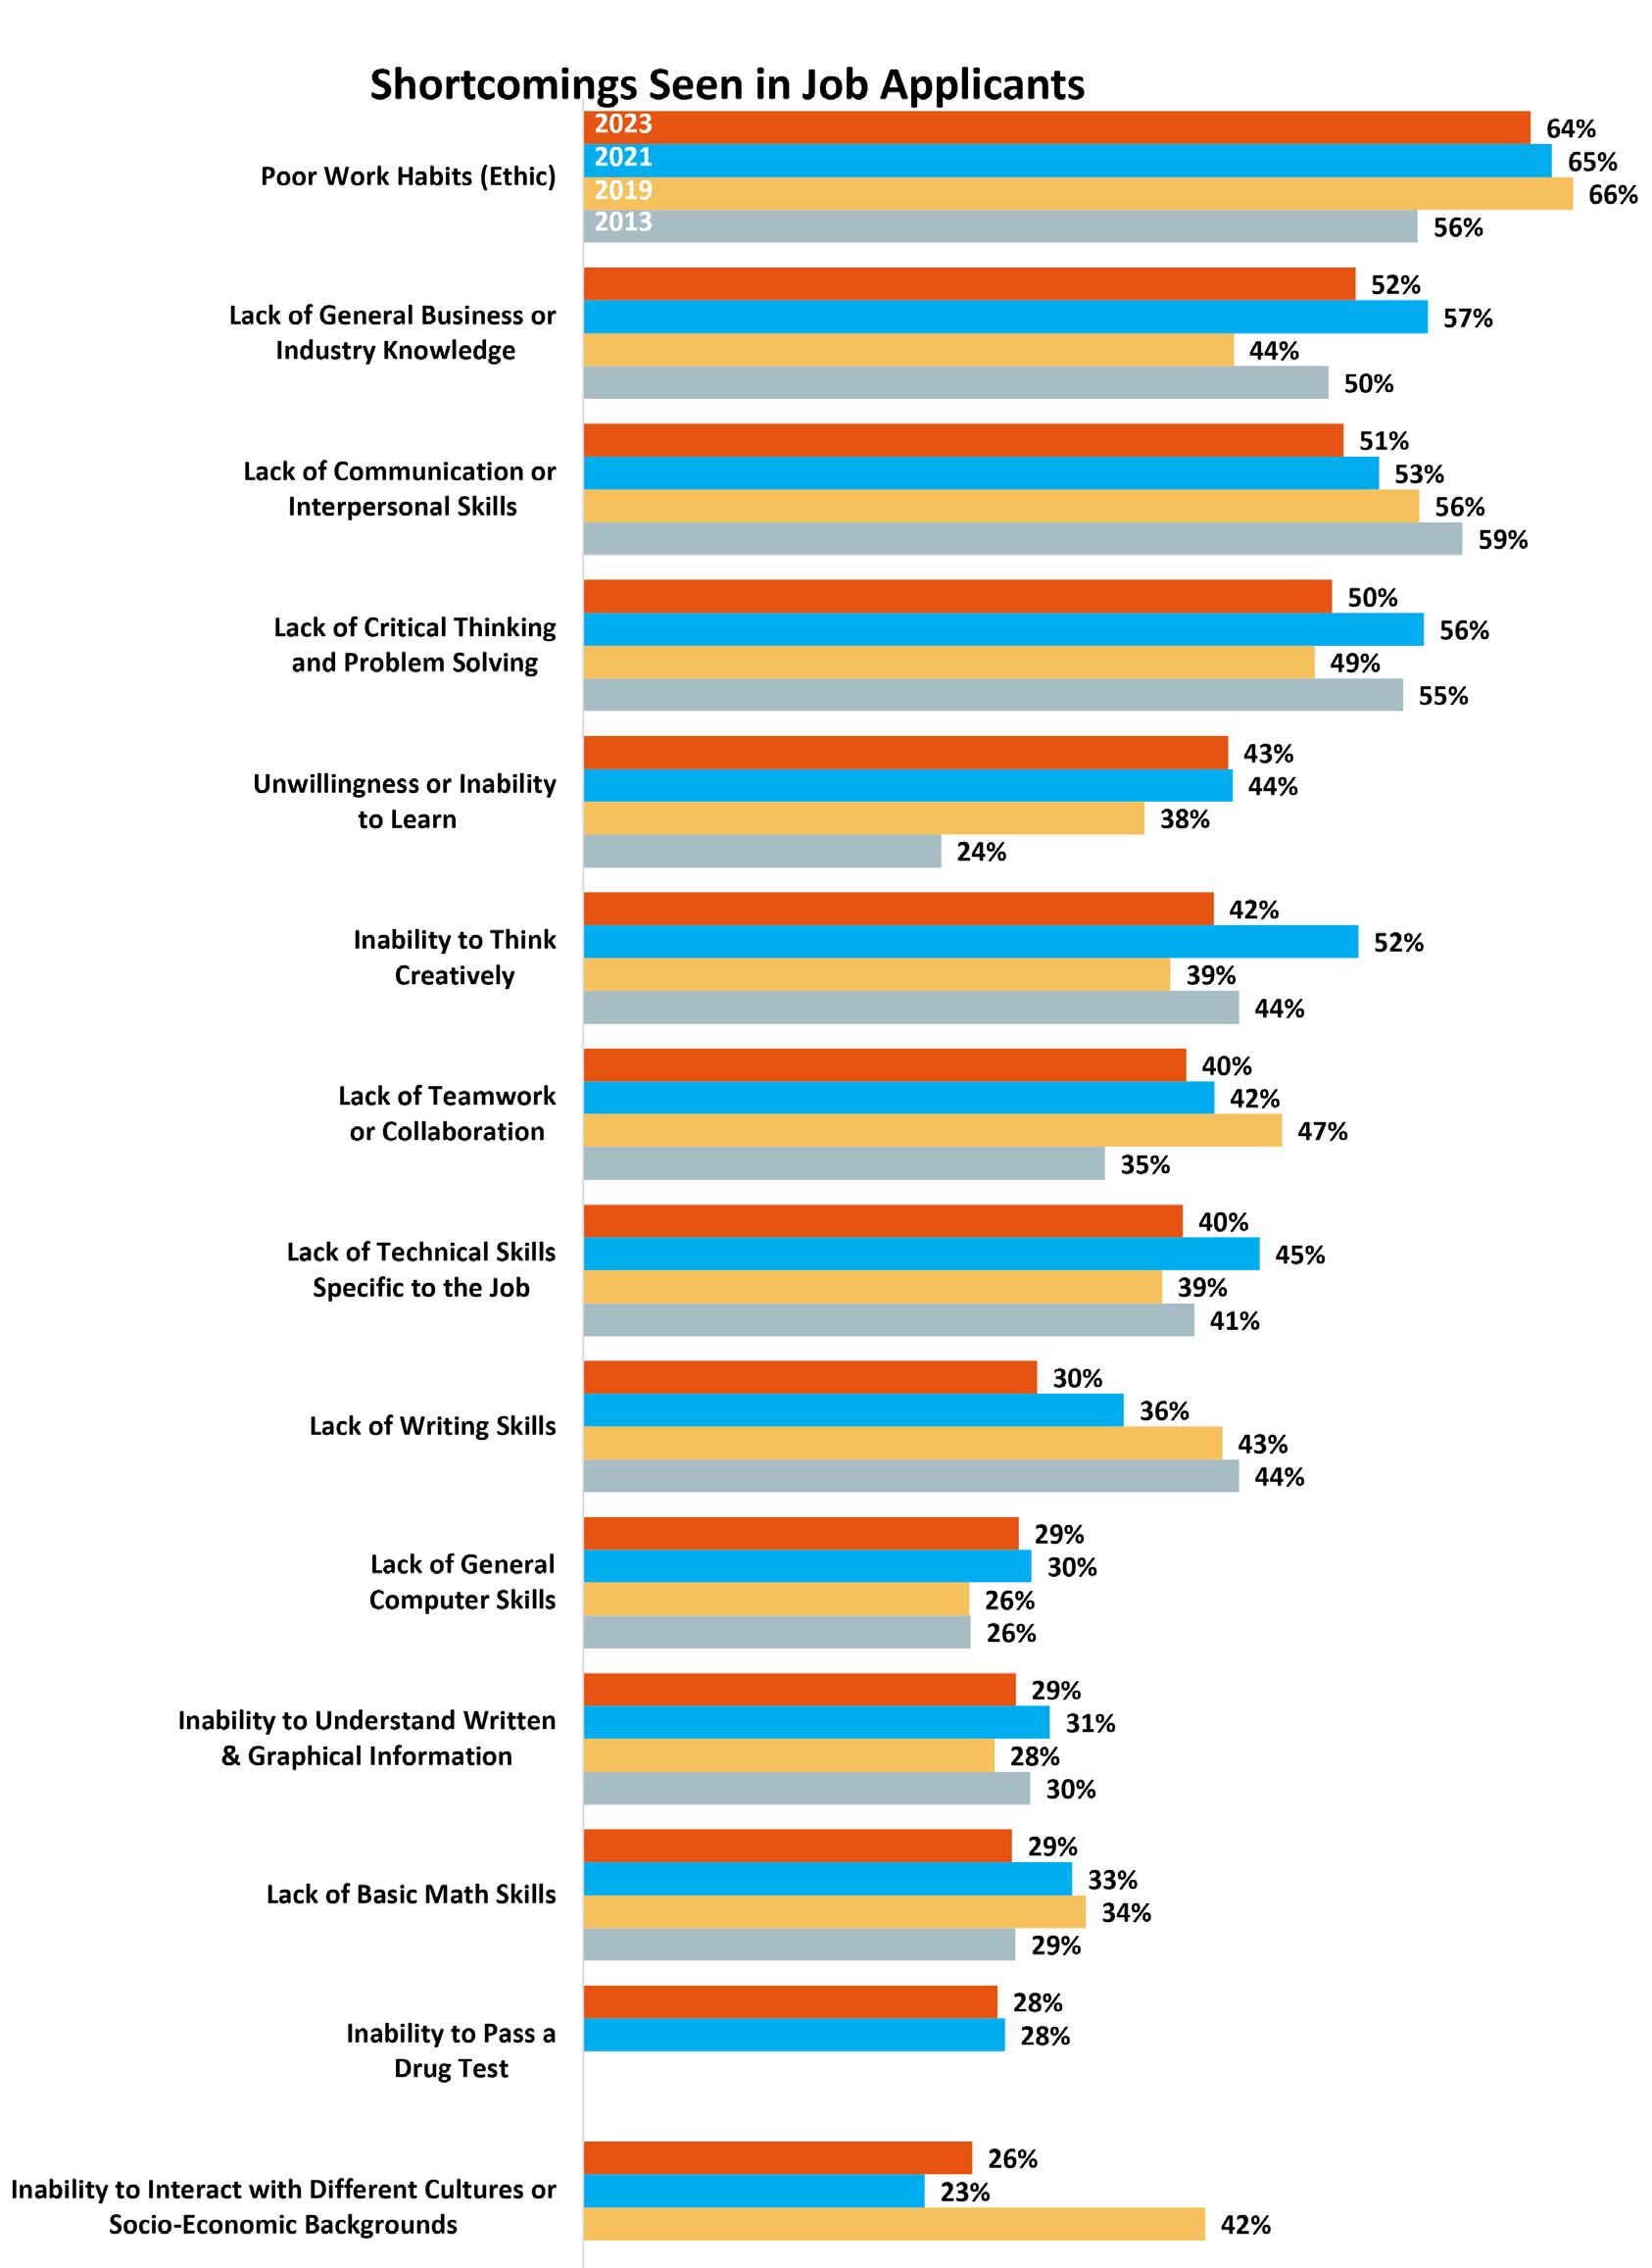
The survey queries employers each year about the possible shortcomings they see in applicants for their available jobs. Poor work habits continue to lead the list with 64% of employers noting it. Lack of general business or industry knowledge has jumped to second place, with lack of communication and lack of critical thinking and problem solving rounding out the top four responses, all with around 50% of employers reporting it.
22 | 2023 State of the St. Louis Workforce
With a shortage of workers and job applicants in most industries, a lack of industry knowledge is surfacing higher on the list than it traditionally does. The “soft skills” or “essential skills” that help employees be successful in a job are still observed to be shortcoming in applicants. Employers reported fewer shortcoming in soft skills, including communicatin, problem solving, writing skills and thinking creativity. This may indicate that employers are being less selective as they hire, and less critical of shortcomings in applicants.
Strengths Seen in Job Applicants
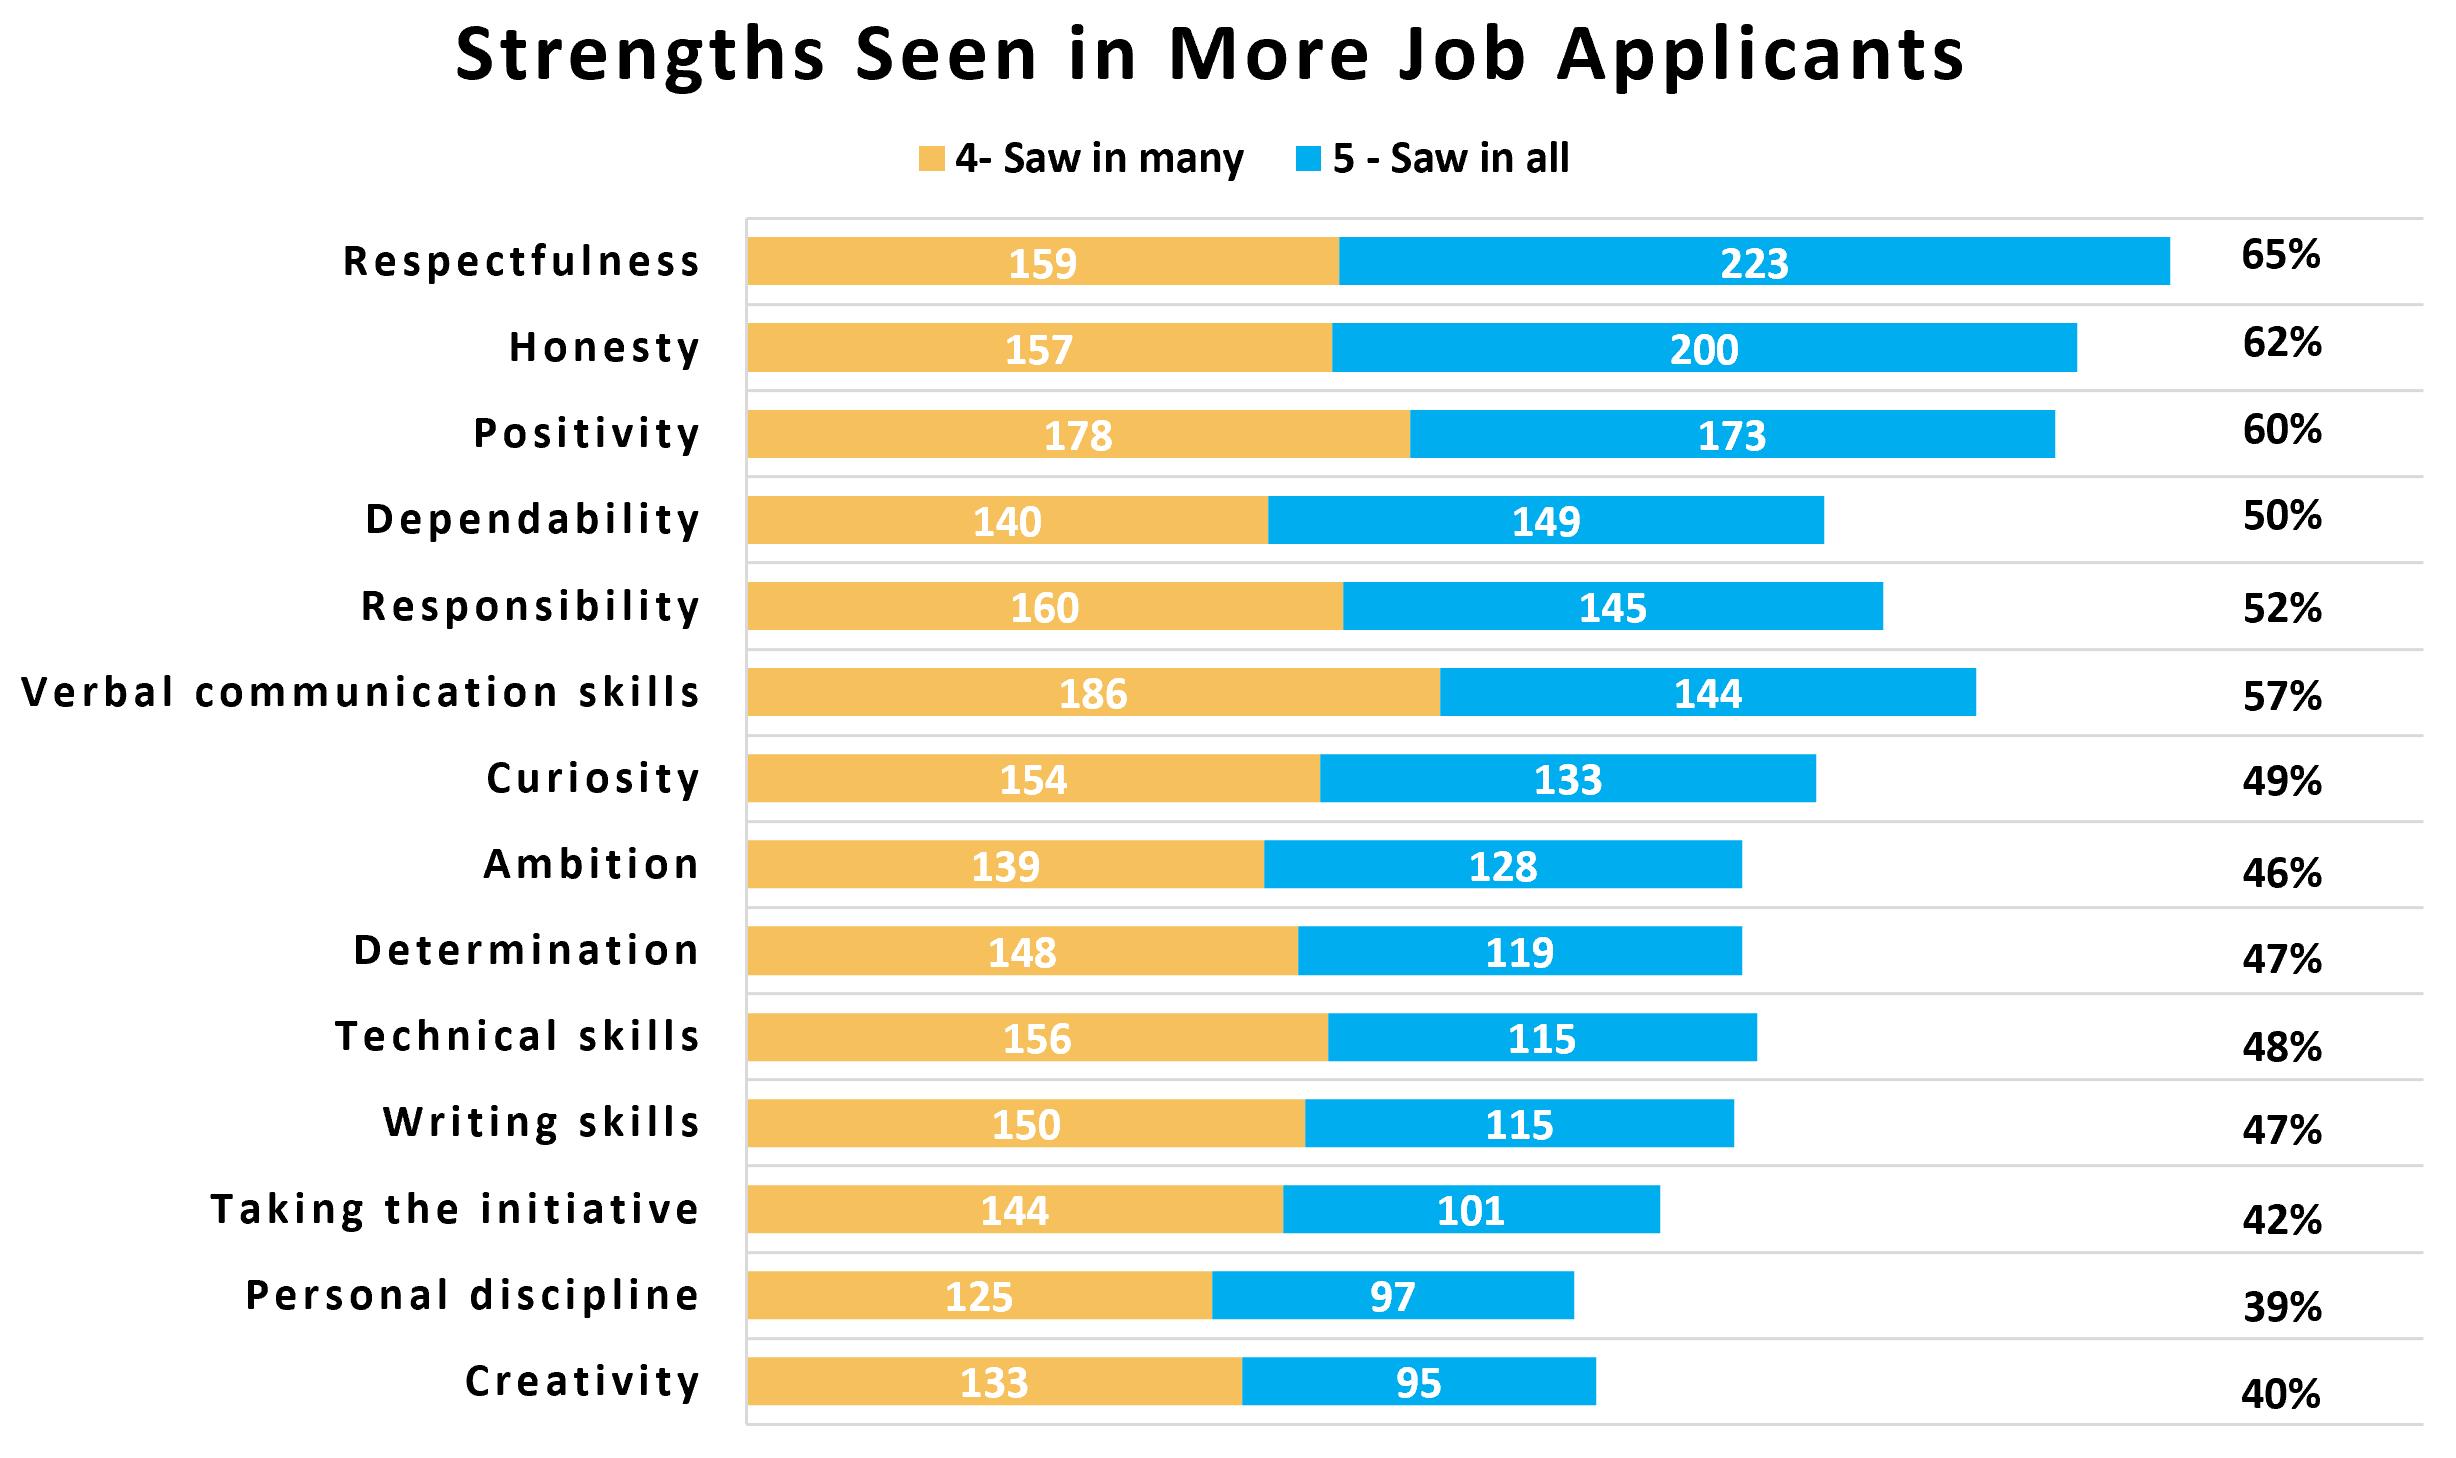
In contrast with the shortcomings seen in job applicants, we also surveyed the perceived strengths of job applicants. This is the second year of asking this question and results were very similar to last year’s results with respectfulness, honesty and positivity as the top characteristics that were seen in many or all job applicants by employers.
2023 State of the St. Louis Workforce | 23
Shortage of Applicants
The low unemployment rates in St. Louis have continued to make it difficult for employers to find candidates, though that appears to be easing. The number of businesses in the survey reporting a shortage of skilled applicants has dropped from 63% in 2022 to 46% in 2023.
The number of available job seekers is not in perfect alignment with the skill needs in the region, with some industries experiencing a larger gap in skilled workers. For instance, with thousands of job postings, the IT industry could double the size of its workforce and still have gaps. The healthcare sector is also struggling with significant hiring needs following COVID, in an industry where training takes years to prepare the next round of workers.
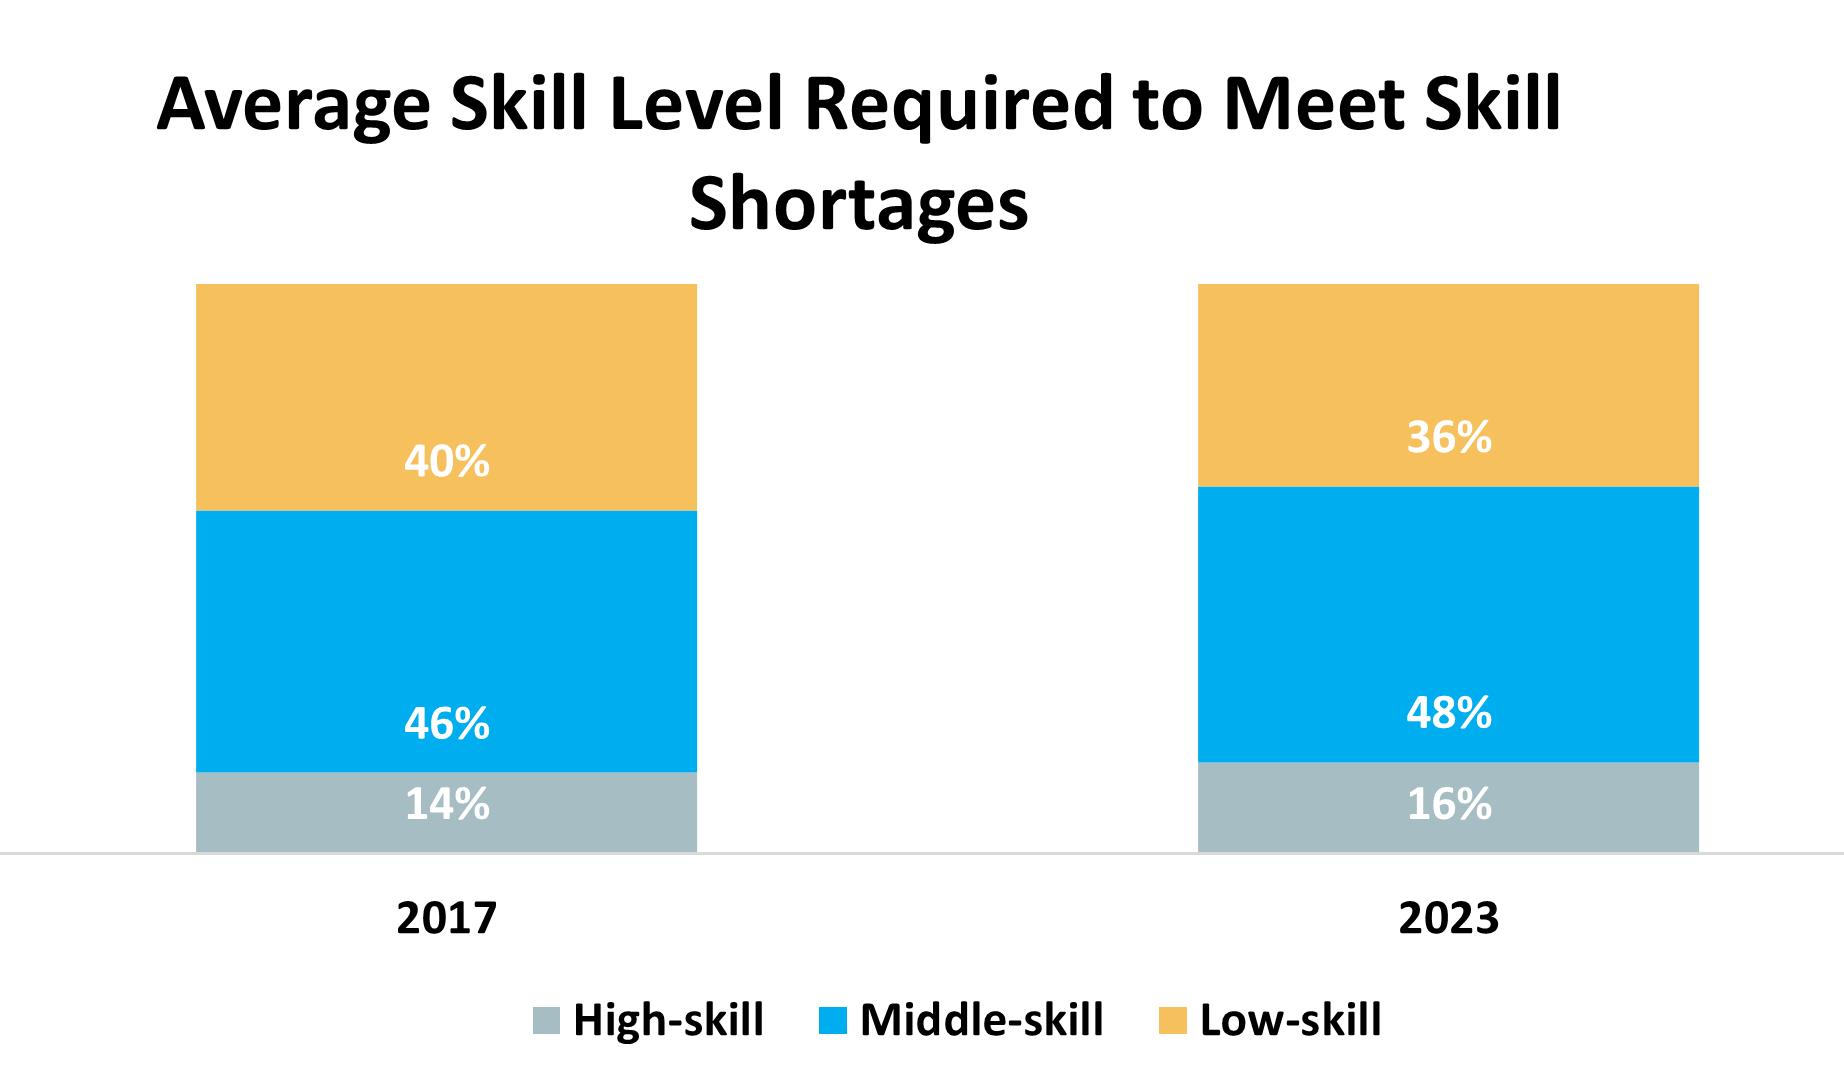
During COVID, we saw a shift to needing more high-skill and low-skill workers to meet skill shortages. This year’s results indicate a return to pre-COVID levels, with high-skills needed by 16% of employers (down from 27% in 2022), middle-skills needed by 48% of employers (up from 38%), and low-skills needed by 38% of employers (remaining the same as 2022 levels).
24 | 2023 State of the St. Louis Workforce
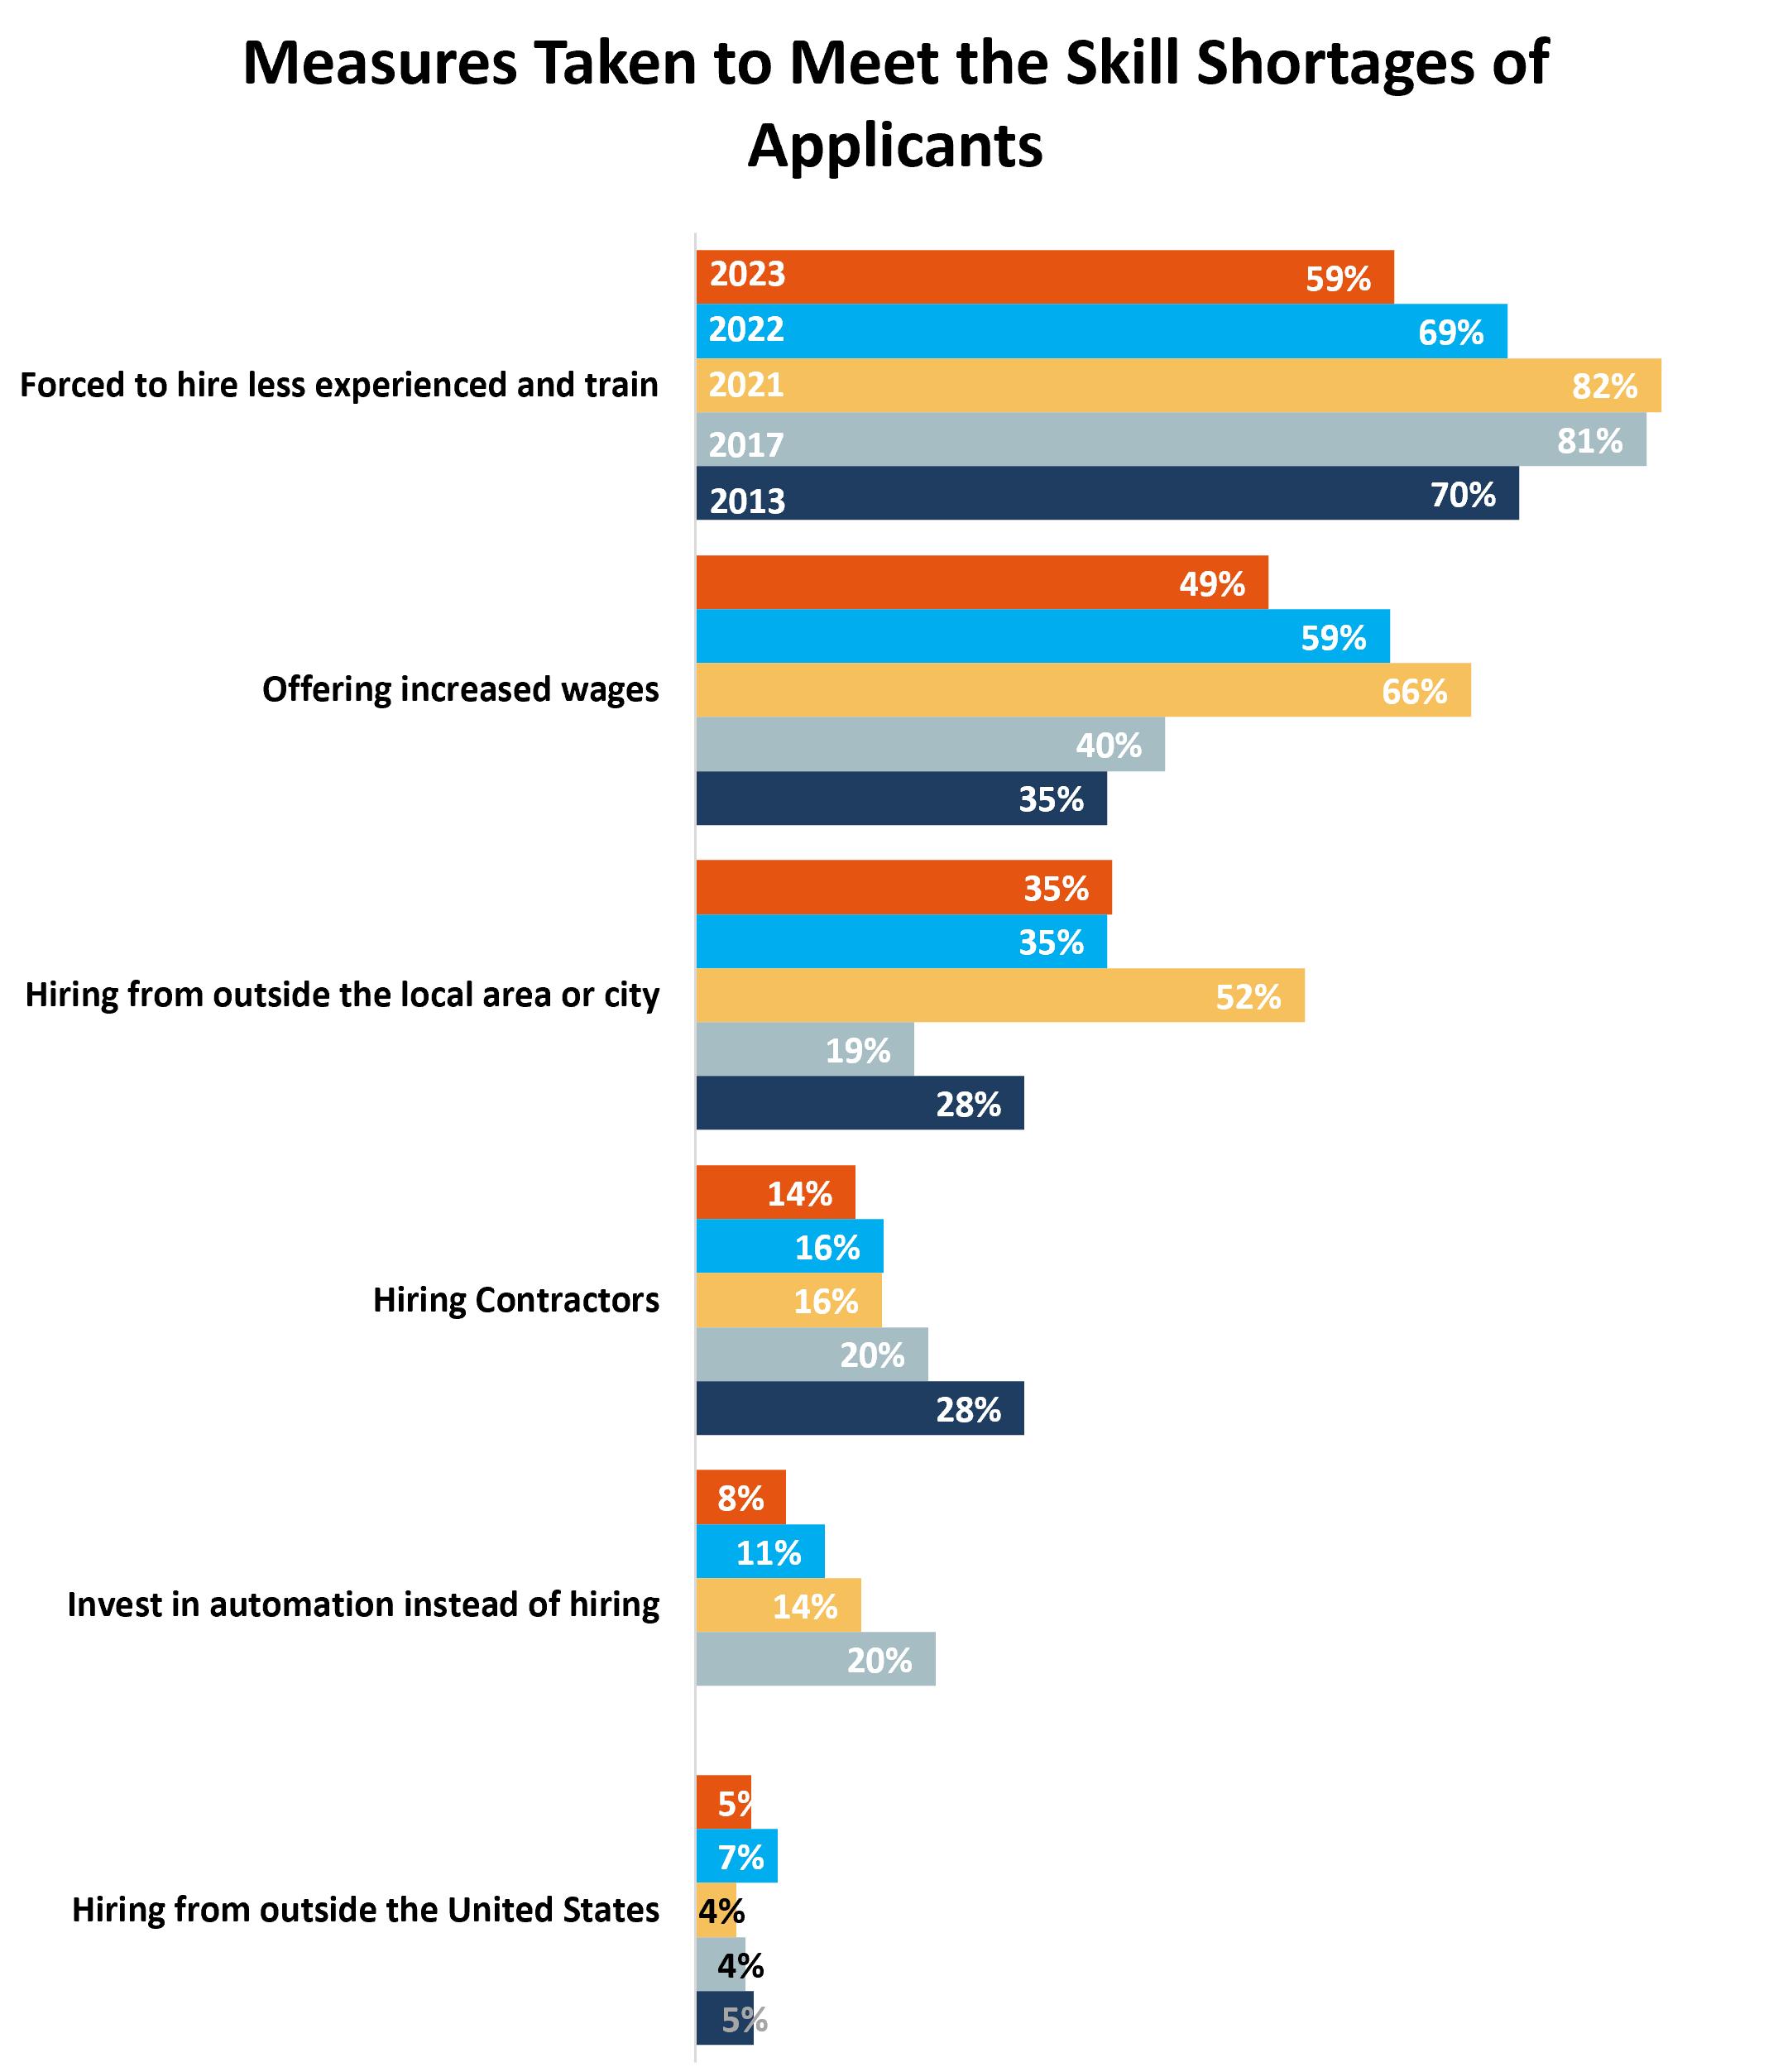
The survey asked what measures companies were taking in order to meet the skill shortages. Fifty-nine percent of employers reported they hire less experienced workers and train them, down from 69% last year. The second most common response continues to be offering increased wages at 49% of companies, also down 10% from last year’s 59%. A third of companies hire from outside the local area. All other forms of hiring follow at a distance and continue to shrink as options that employers choose.
2023 State of the St. Louis Workforce | 25
Skills Shortages in Functional Areas
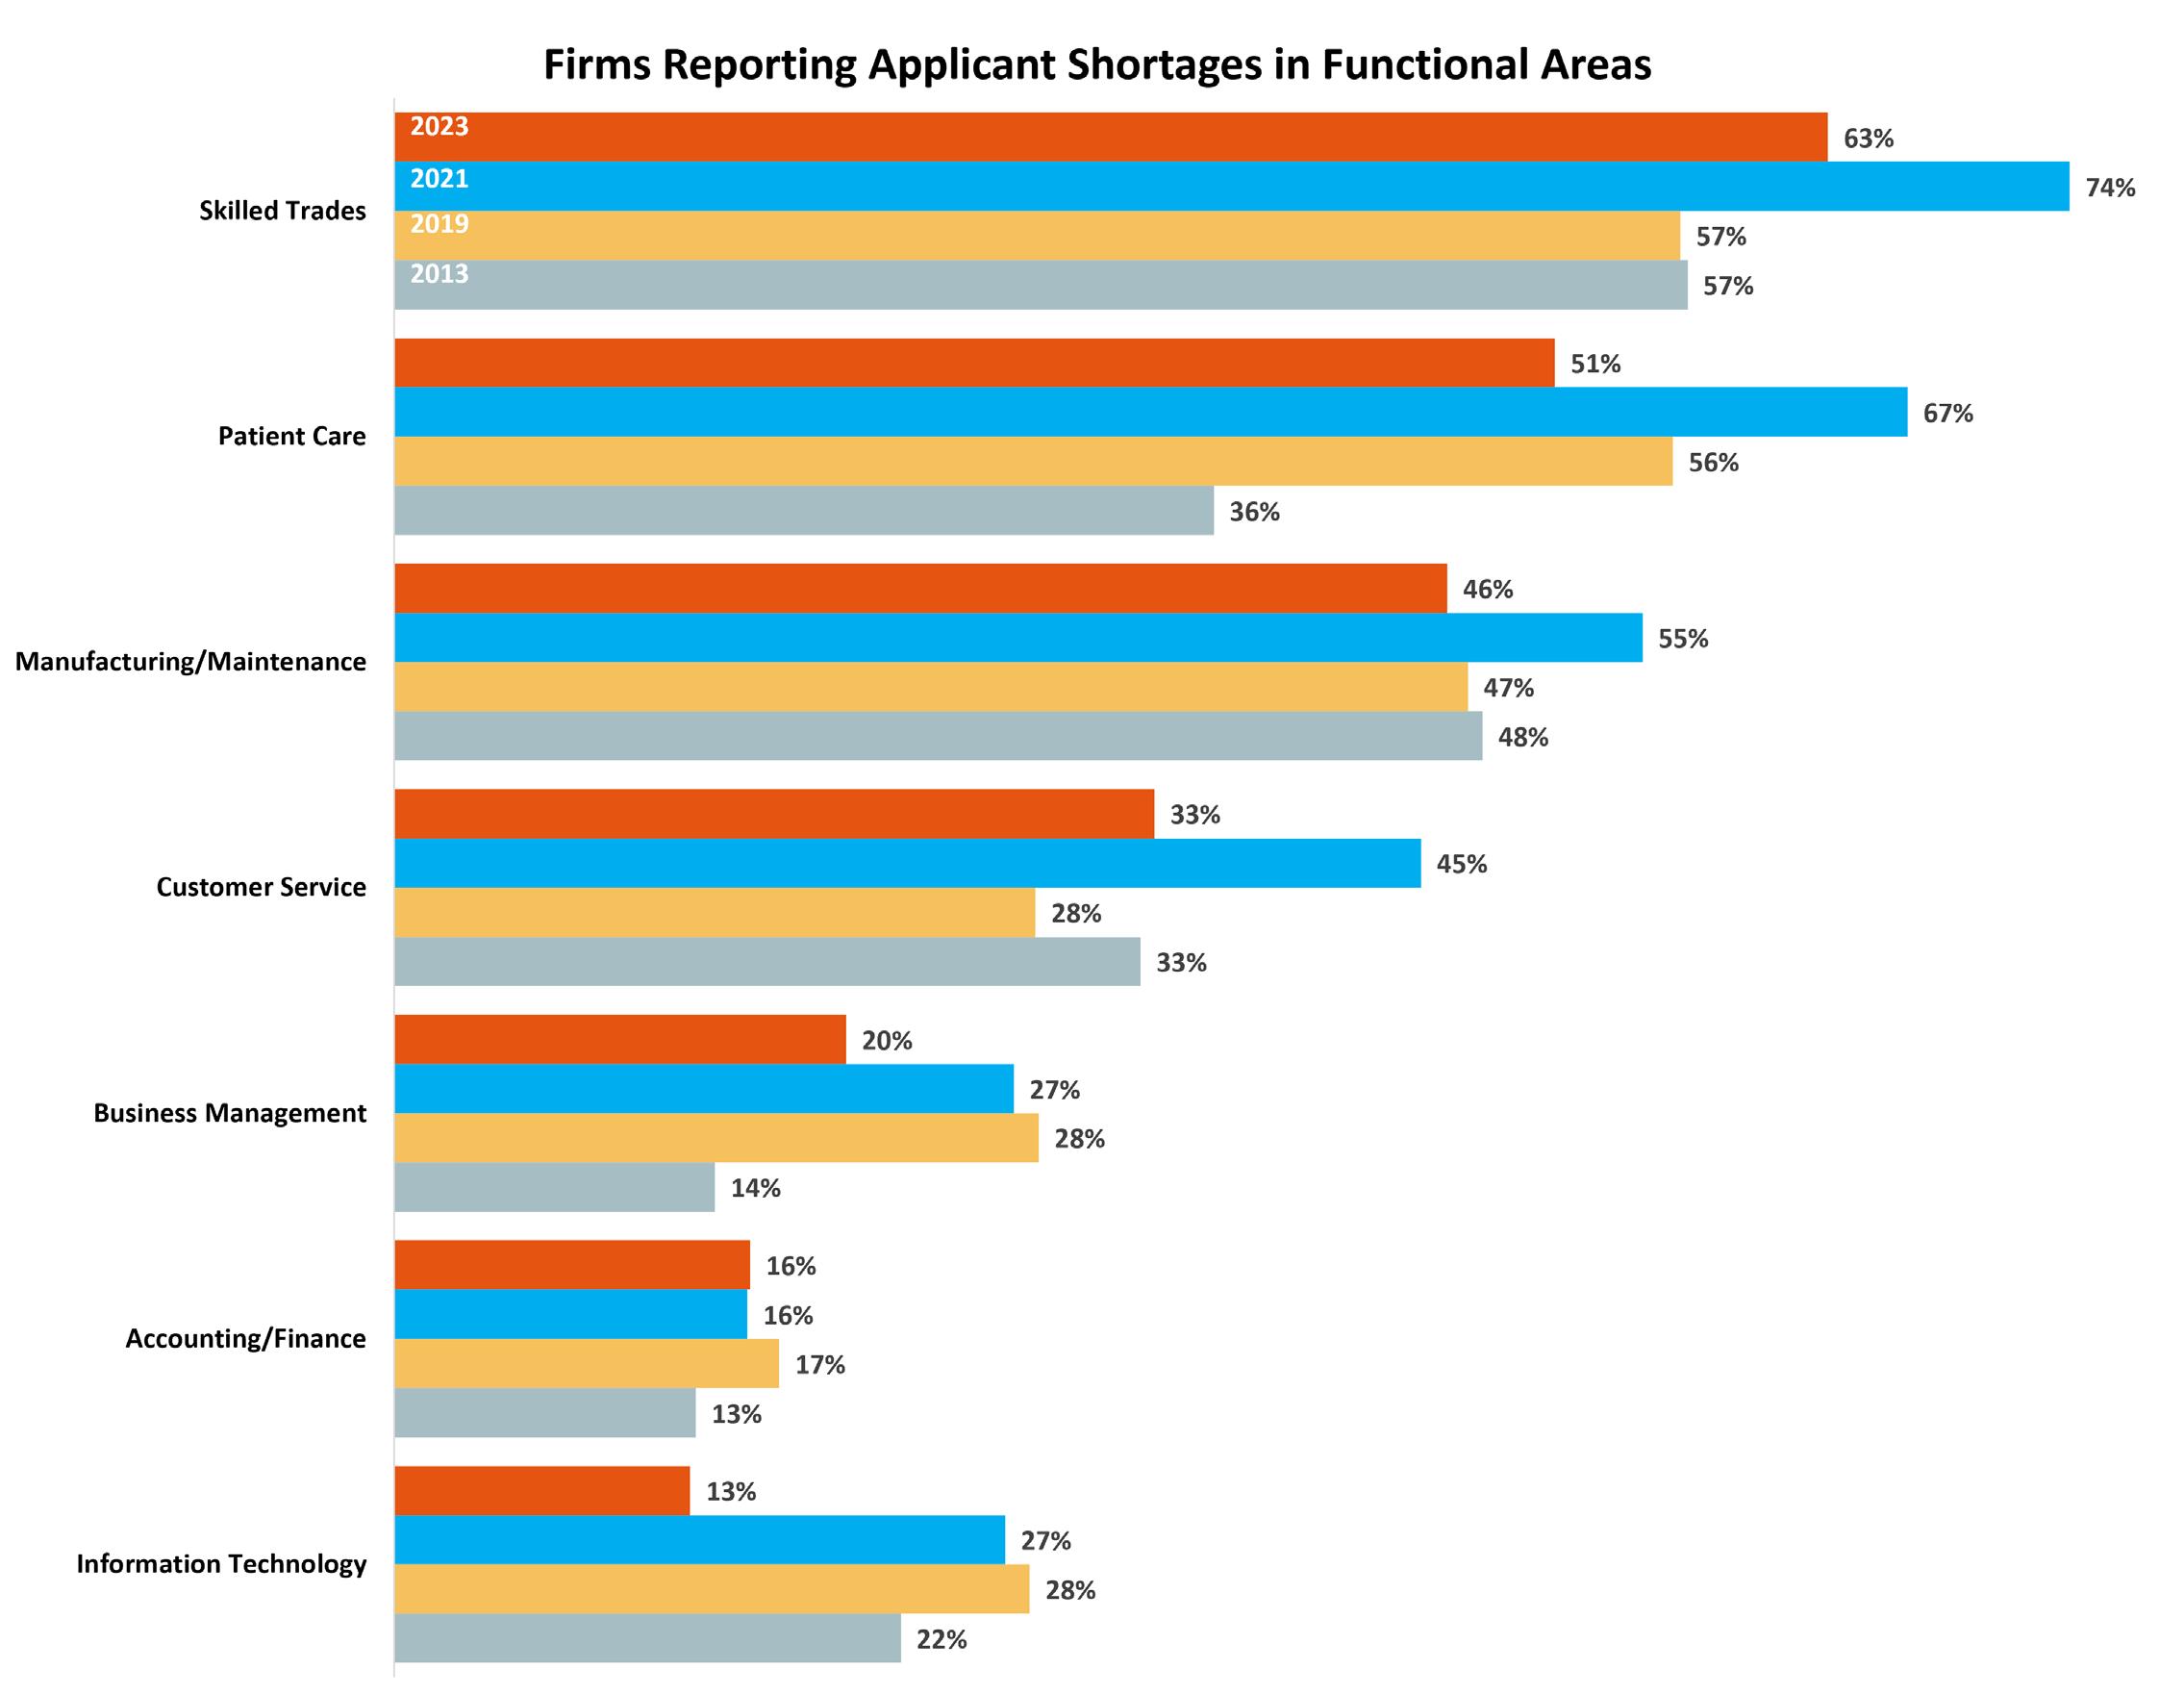
Since 2017, the survey has asked employers about their workforce in seven key functional business areas: accounting / finance, business management, customer service, information technology, manufacturing/maintenance, patient care, and skilled trades. We ask the surveyed companies if they employ workers in these functional areas and whether they are having difficulty finding skilled applicants for open positions. Every functional area indicated a decrease in the need for job applicants compared to a year ago. Skilled trades continues to have the highest number of firms reporting applicant shortages at 63%, down from 68% in 2022. Patient Care has the second highest applicant shortage, with 51% of firms in need, down from 63% in 2022.
Employers were given a choice of high-skill, middle-skill, or low-skill to gauge the skill level required to meet the shortages in each of the seven functional areas.

“ We have to plan, implement and evaluate workforce development efforts to draw from a more eclectic and inclusive population.”
Chauncey Nelson Gateway South Innovation District
26 | 2023 State of the St. Louis Workforce
All functional areas, except Patient Care and Manufacturing/Maintenance, saw an increase in the need for middle-skill applicants, with increases ranging from 2%-13%. High-skill needs were the same or lower, and the need for low-skill applicants decreased as well. Manufacturing/Maintenance skill level needs remained nearly the same as 2022. Patient Care skill needs were nearly the opposite of the other functional areas, with a 6% increase in the need for high-skill applicants, a 4% increase for low-skill applicants, and a 10% drop in the need for middle-skill applicants.
2023 State of the St. Louis Workforce | 27
Methods of Skill Acquisition
The companies in this year’s survey reported less usage of typical training options in every category. Training and employee education have remained strong over time, with little variation in company responses since the Recession. The drop in rates could either indicate that companies are narrowing their training options and focusing on formats that work for their needs, or it could mean that companies are simply putting people to work with less training.

28 | 2023 State of the St. Louis Workforce
On-the-job training remained the most common method to assist workers in obtaining new or increased skills, with 80% of employers selecting it, a drop from 86% last year. In-house classroom training is the second most popular option with 41% of companies utilizing this approach, down from 53% in 2022. The next most popular options – Flexible Schedule for Continuing Education, Online Courses, and Vendor Training – were all down 7% - 13% from 2022.
Training and reskilling of workers will continue to be a key facet of economic growth, as employers determine how to best retain and support their workers, and for workers to acquire new skills or upgrade their skills to remain employable and explore new options.
Sourcing Talent
The difficult hiring market of the last few years is starting to show in the way employers seek new workers. This year’s responses to “Do you currently have partnerships with any of the following organizations to help you source talent?” were significantly different in that 4-year colleges dropped from being a top choice to a fourth most-used option, dropping from 26% to 13%. Two-year colleges also dropped from 26% to 15%, maintaining their second place position in the survey. Partnerships with nonprofit organizations topped the list with 21% of employers reporting, up 2% from last year.
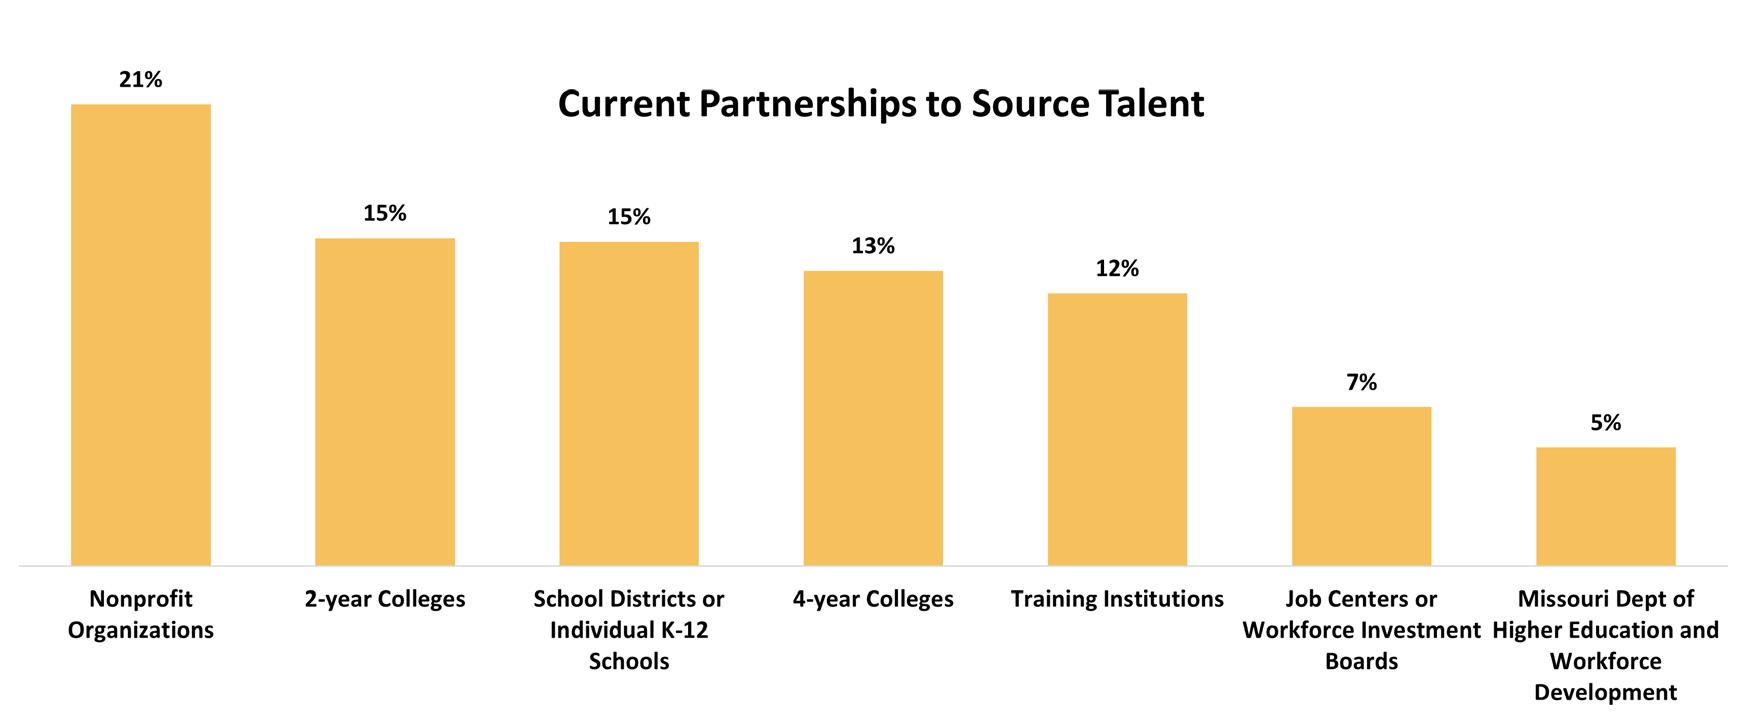
School districts or K-12 schools rose in the rankings this year, being selected more frequently than four-year colleges. This is an attractive option for many companies that are focusing on promoting their industry to younger students before they have committed to a specific career, particularly in skilled trades, manufacturing and tech. Skilled trades and manufacturing are often misunderstood with decades-old stereotypes and a lack of understanding of the family-supporting salaries and career paths available.
K-12 schools rose in the rankings this year, being selected more frequently then 4-year colleges as partnerships to source talent.
2023 State of the St. Louis Workforce | 29
Dropping even lower on the list of talent sources are the job centers and workforce investment boards and Missouri Department of Higher Education and Workforce Development. These entities are funded by state and local governments, providing employment assistance including job matching, business counseling, providing job assessments to candidates, and more. Missouri employers can find their local job center at jobs.mo.gov.
Experience and Education
Experience and education can be potential barriers for entry into the workforce. We ask employers each year to define their positions that require a specific level of experience and education. In 2020, at the start of the pandemic, employers had fewer positions available for workers with no experience or with less education or training. The needs for experience and/or education have eased since then, but employers still prefer a few years of experience.
Experience Requirements
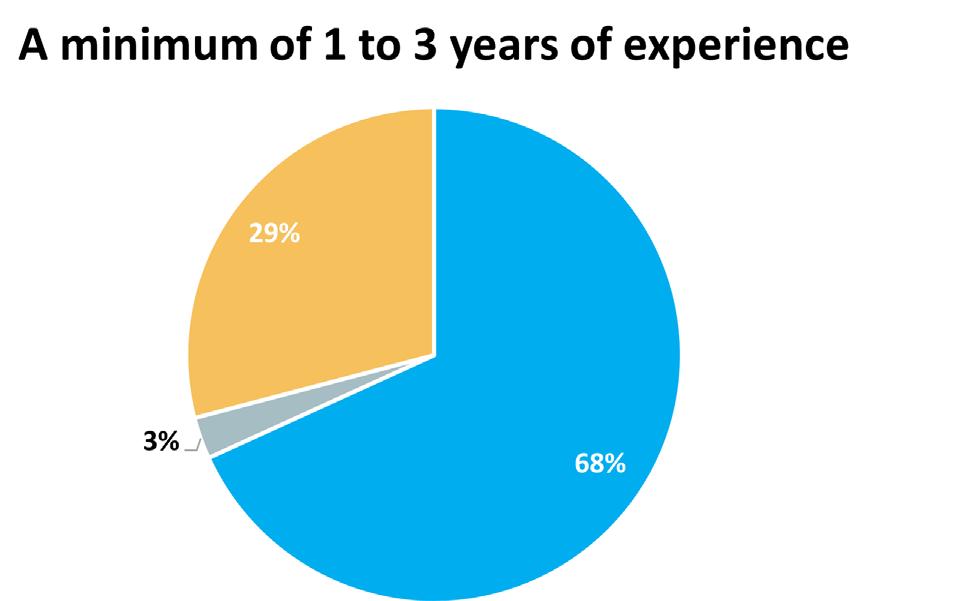
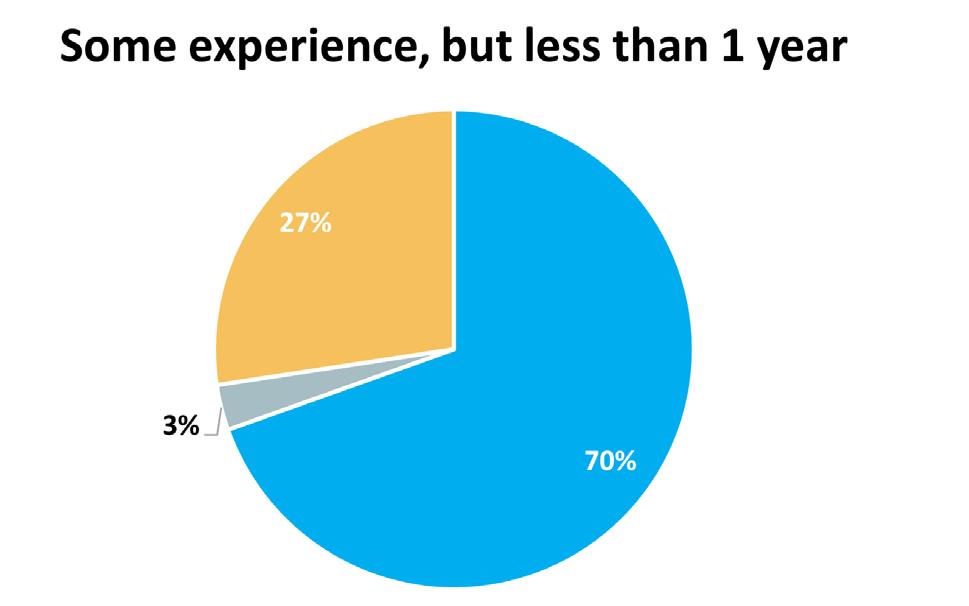
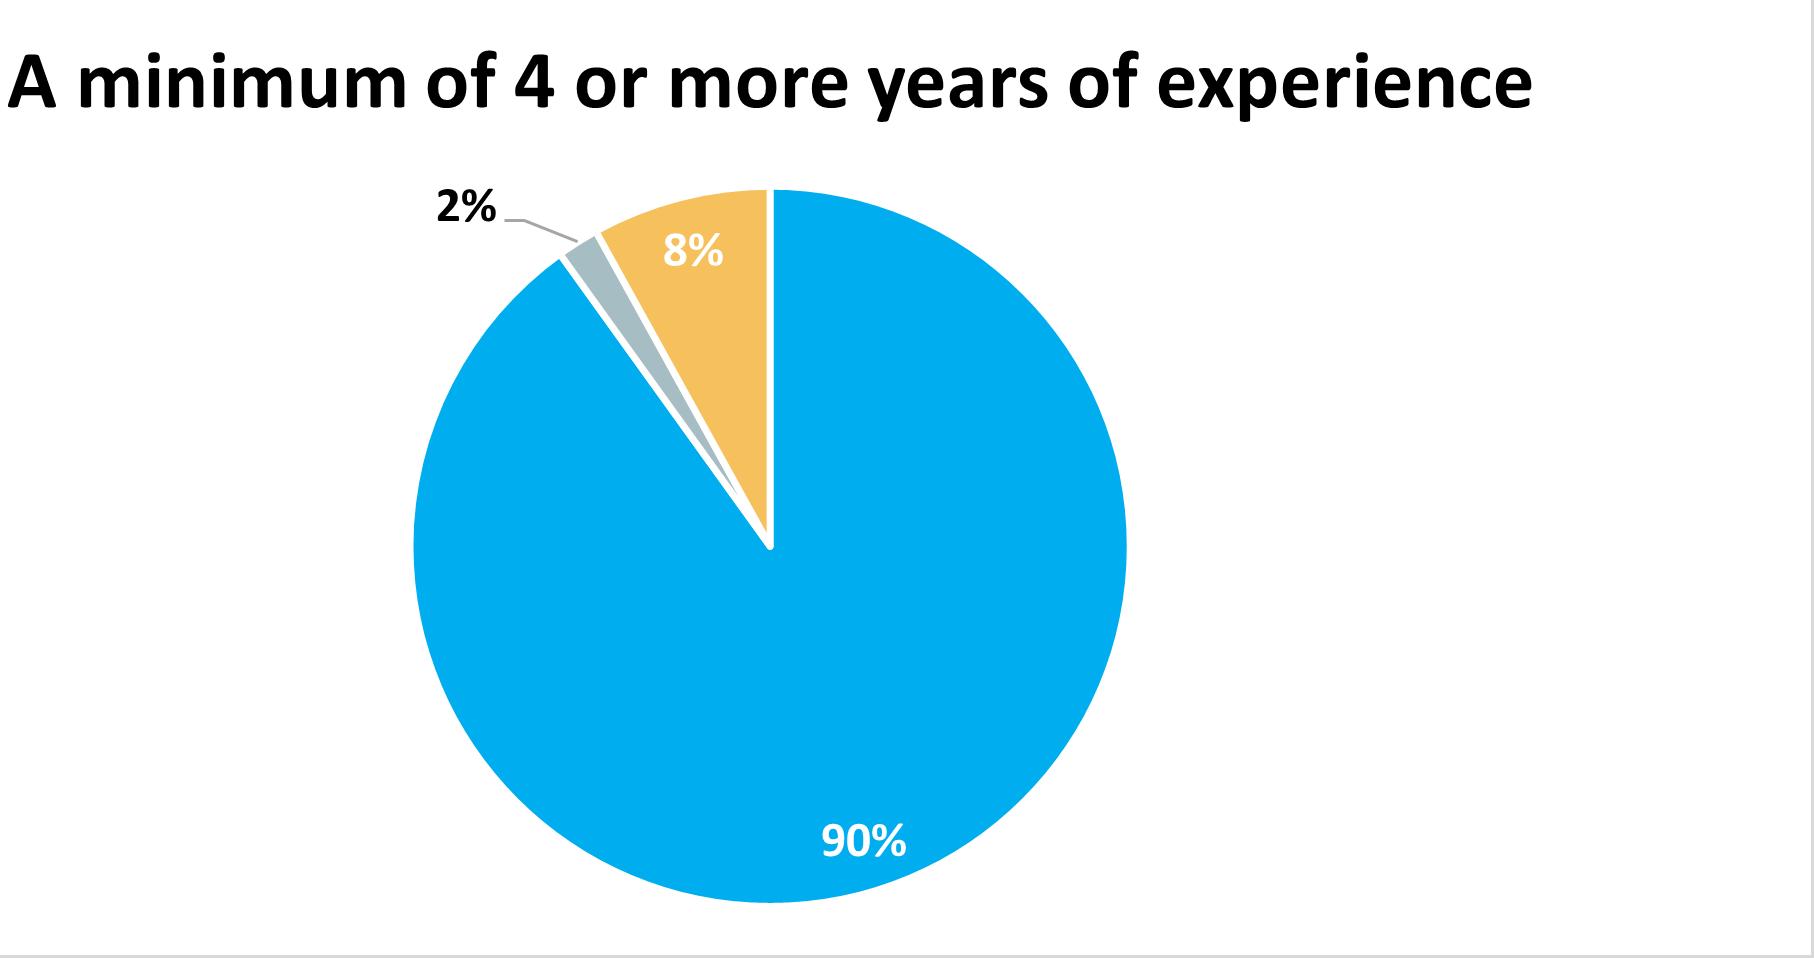
Employers often do not have positions for applicants with no experience (61%), but 36% of employers say that 50% or more of their jobs require no experience, up from 27% last year. Over a quarter of employers say that most of their jobs (50-100% of jobs) require some experience or 1-3 years of experience.
Percentage of Positions Available for the Indicated Level of Experience

30 | 2023 State of the St. Louis Workforce
No Jobs 1 to 49% 50% or more
Education Requirements
While more companies are requiring experience for most of their jobs, the requirements for education have shifted significantly in this year’s survey.
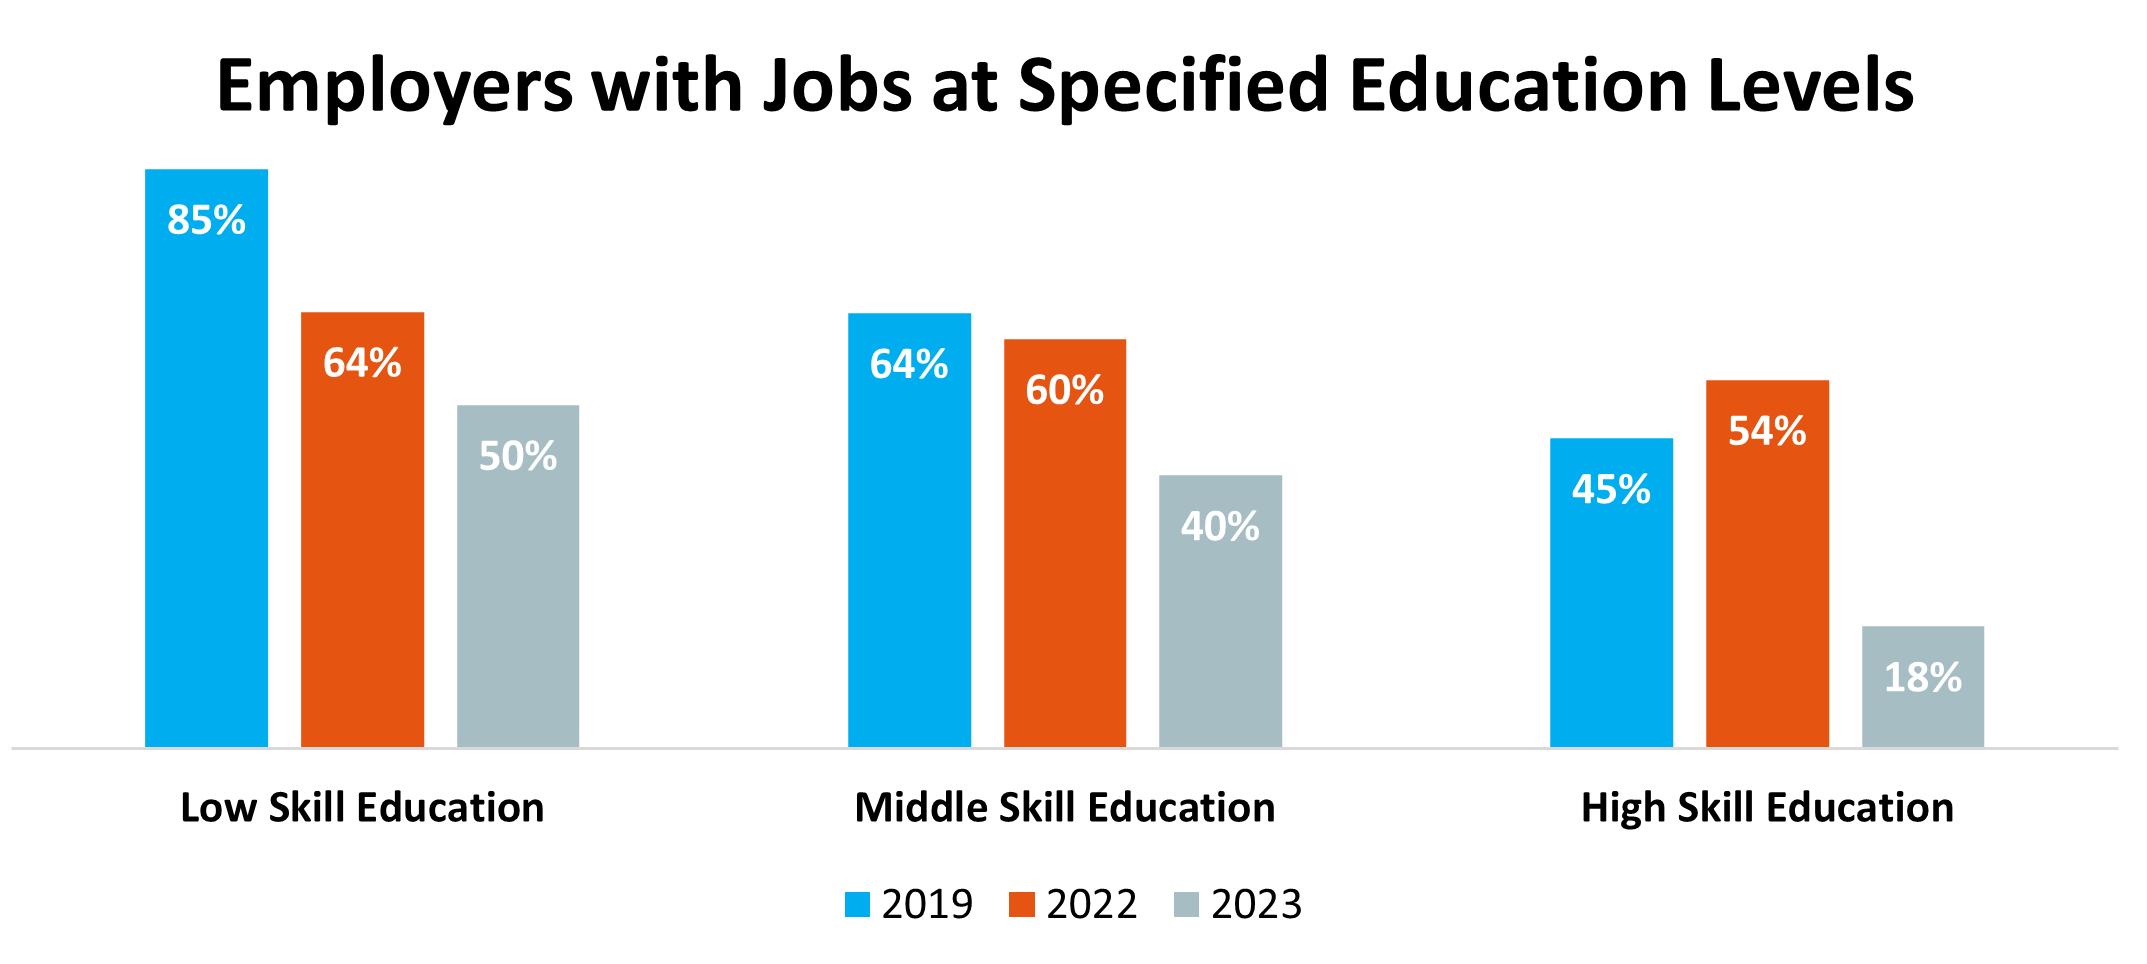
These levels are defined as high-skill (requiring a four-year degree or higher), middle-skill (requiring training or education beyond a high school diploma but less than a four-year degree), or low-skill (requiring a high school diploma or less).
The number of employers with positions for high-skill employees has trended up since 2017, leveling out in 2022 at 54%. This year, that dropped to only 18% of employers seeking high-skill employees, a dramatic 36% drop. Employers have often used a four-year degree as a screening criteria or as an indicator of perseverance, though there is a national trend to remove degrees from job postings to allow for a larger pool of candidates.
The number of employers with middle-skill education positions dropped by 20%, from 60% in 2022 to 40% in 2023. Employers even reported significantly fewer low-skill education positions, falling from 64% in 2022 to 50% of employers in 2023. This overall trend could be a combination of fewer companies hiring currently, and more companies relying on experience criteria rather than education requirements.
2023 State of the St. Louis Workforce | 31
Experience Opportunities for Young Adults
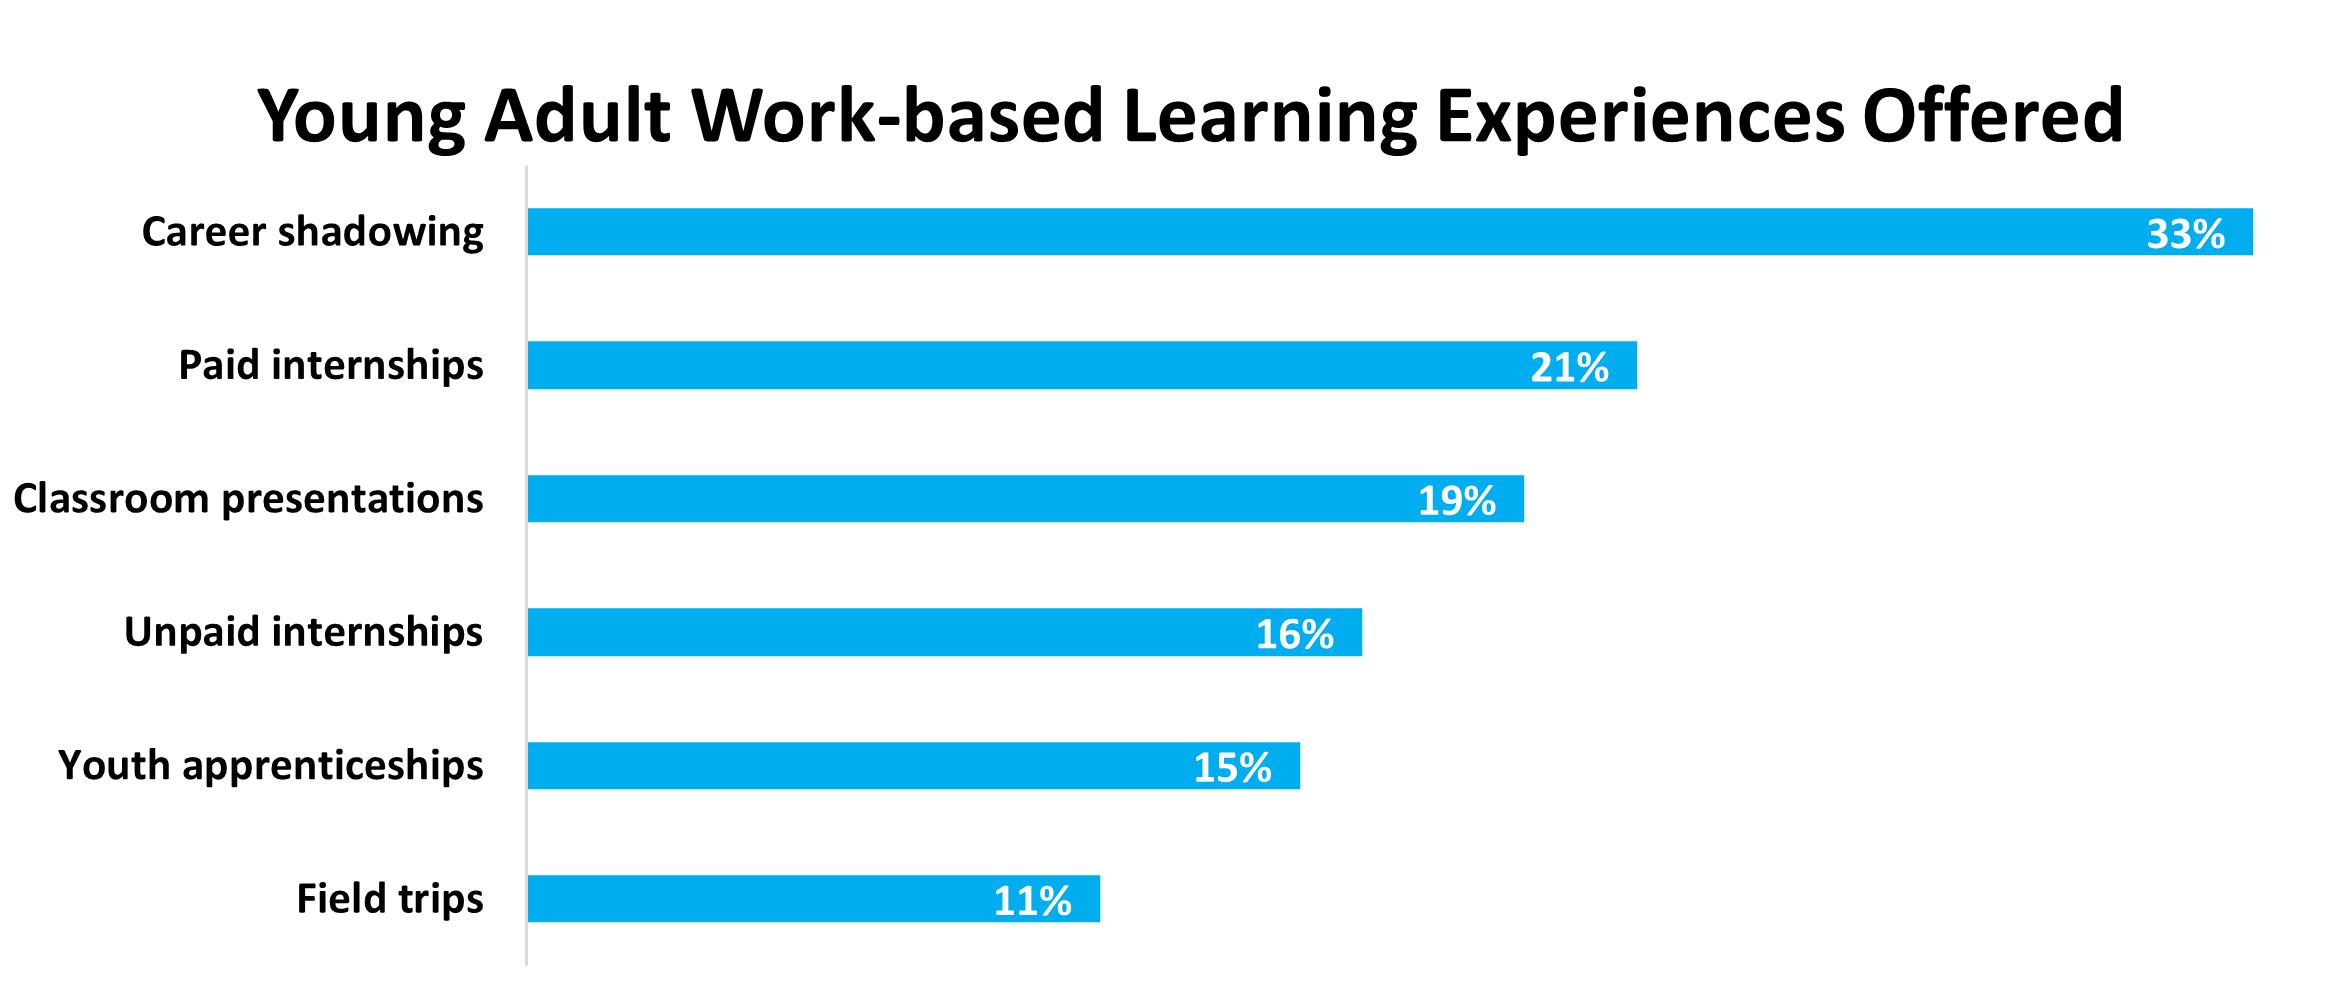
As many employers continue to broaden their recruiting efforts toward younger candidates, we asked a survey question for the second year about offering work-based learning experiences for students and young adults. More employers participated with career shadowing and youth apprenticeships, with slight increases of 3-4%. All other options had fewer employers, dropping by 3-6%, including both paid and unpaid internships. These valuable experiences can be challenging for employers to offer when they are understaffed, which many businesses are.
Employment Barriers
The survey examines barriers to employment, including background checks and criminal convictions. These screening tools may be designed to protect a company, though they are also eliminating job candidates who could be qualified and may have been convicted of lesser, non-violent offenses. This perpetuates a cycle of joblessness, under employment and poverty.
Currently, there are over 10,000 adults from the St. Louis MSA that are incarcerated. A felony conviction follows that individual for the rest of their life, permanently impacting options for employment, housing, and more. If 10,000 adults are incarcerated in our region today, the cumulative number of convicted felons is much higher and impacts our workforce and communities when they are excluded from opportunities for living wage jobs.
“ We need to work together to remove obstacles for each and every interested worker. This will be critical to building a strong and enduring regional workforce.”
Kory Mathews AMIC STL
32 | 2023 State of the St. Louis Workforce
Pre-employment Screening Checks
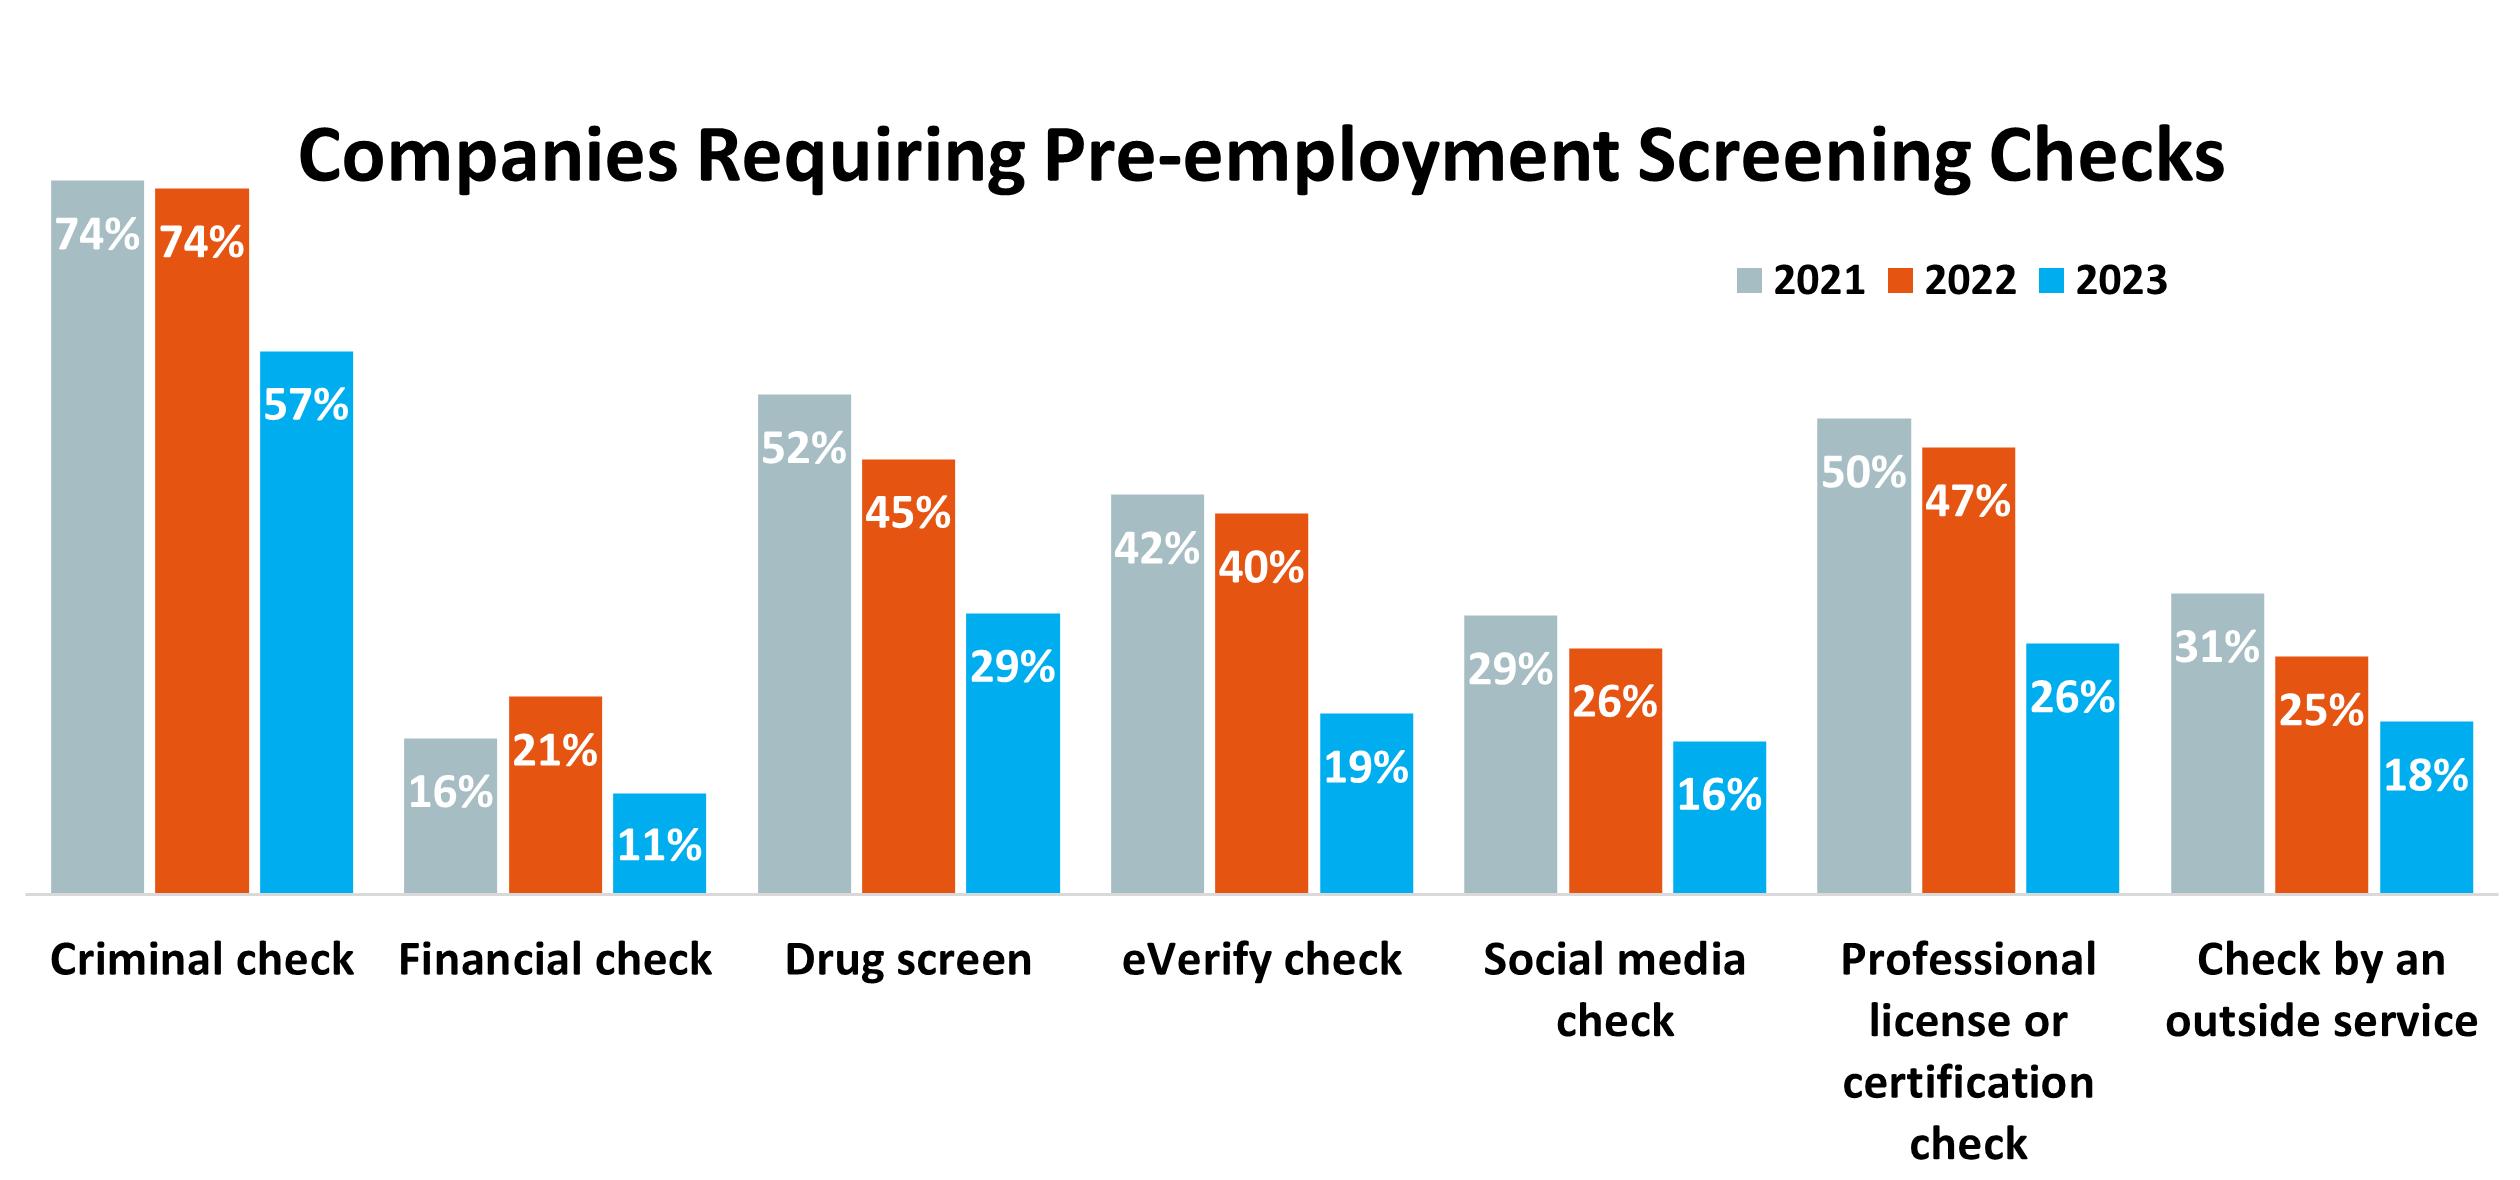
While pre-employment screening checks tend to be applied to either all or no job candidates for a company, the overall use of these screening tools has been consistently dropping since 2020. Criminal checks, drug screens, eVerify checks, and professional license or certification checks each dropped by 16% or more. Financial checks and social media checks each dropped by 10%. Time will tell if these changes are permanent due to a change in hiring practices, or if it is primarily driven by the tight labor market and fewer applicants for jobs.
Justice-Involved Individuals
Nineteen percent of respondents stated that they would not consider hiring an applicant with a felony conviction who had completed their sentence and/or probation, up slightly from 16% last year.
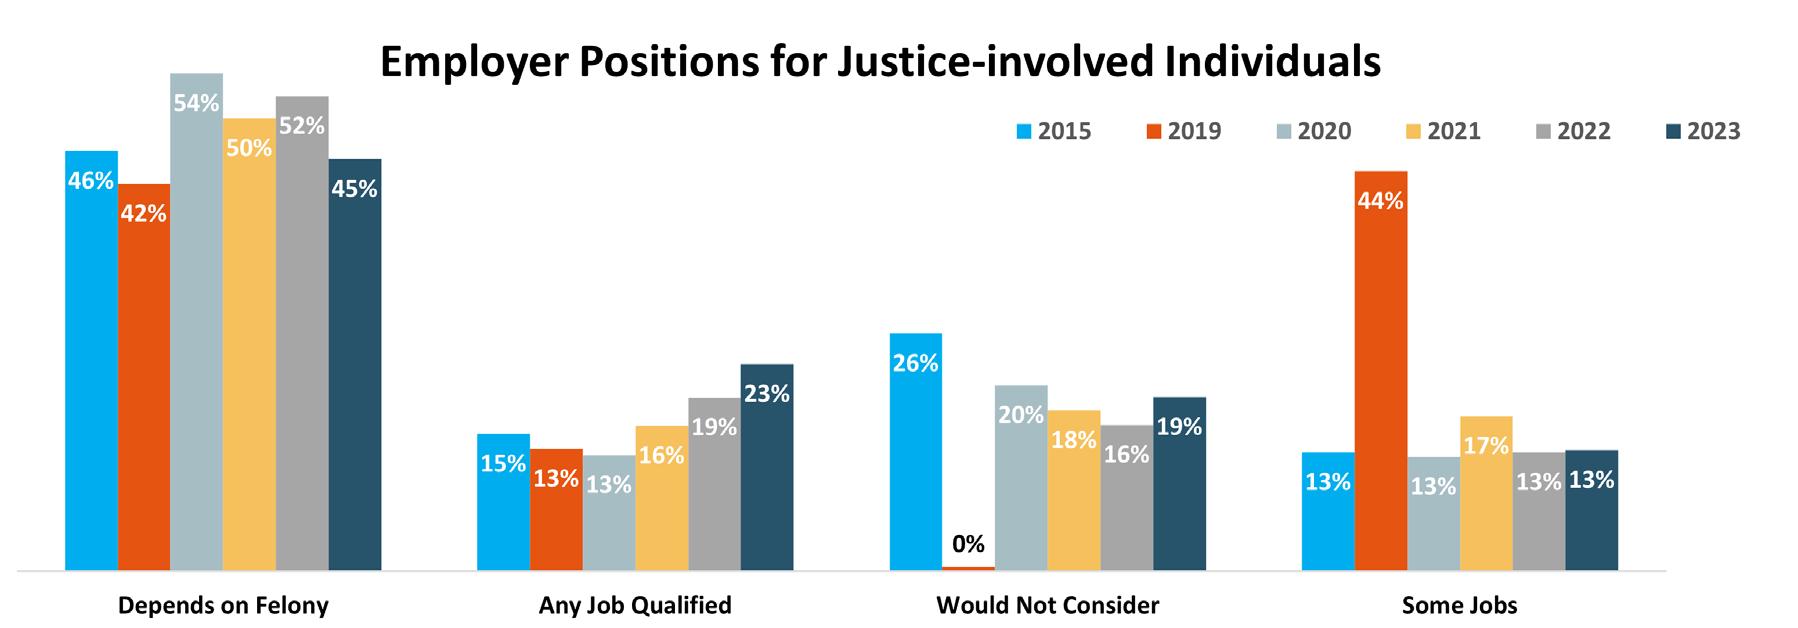
For 2023, 45% of the companies responded that it would depend on the felony, down from 52% last year. Nearly a quarter of the companies (23%) stated that they would hire an applicant that had been convicted of a felony offense for any job for which the candidate was qualified.
2023 State of the St. Louis Workforce | 33
Diversity, Equity and Inclusion Initiatives
Diversity, Equity and Inclusion (DEI) initiatives are programs and policies that aim to promote representation and encourage participation of employees from all walks of life.
The survey started to include questions about DEI efforts in 2022. For 2023, there was an increase in businesses using an Equal Opportunity Employer (EOE) notice in their job positing, increase from 76% to 78%. All other categories of DEI training, strategies and committees were about the same response rate this year, dipping slightly.

“ When you talk about the quality of a job, what everybody needs to put into consideration, is first of all the job stability.”
Worker Voices
Federal Reserve Bank
34 | 2023 State of the St. Louis Workforce
Remote Work
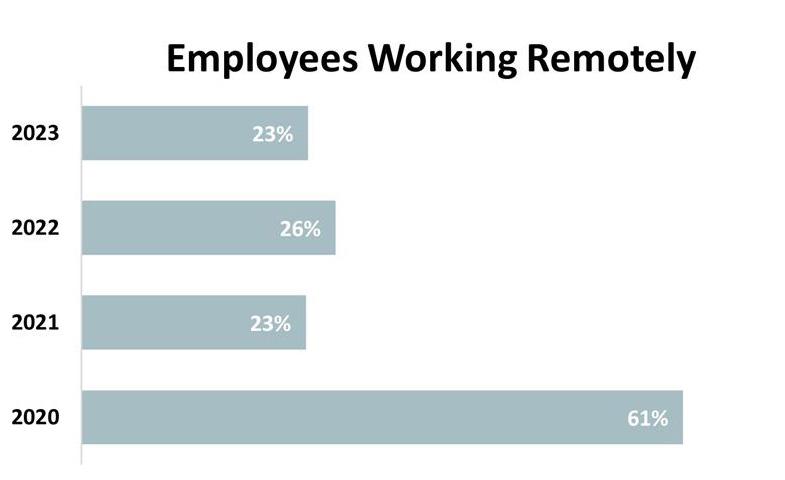
Perhaps no topic related to employees has been more at the forefront of company decisions since the start of the COVID-19 pandemic than remote work. Prior to the pandemic, it is estimated that 6% of employees worked remotely.
With the start of the pandemic in 2020, 61% of companies surveyed reported employees working remotely. Since then, that number has settled in to about one-quarter of companies with employees working offsite, or 23% for 2023.
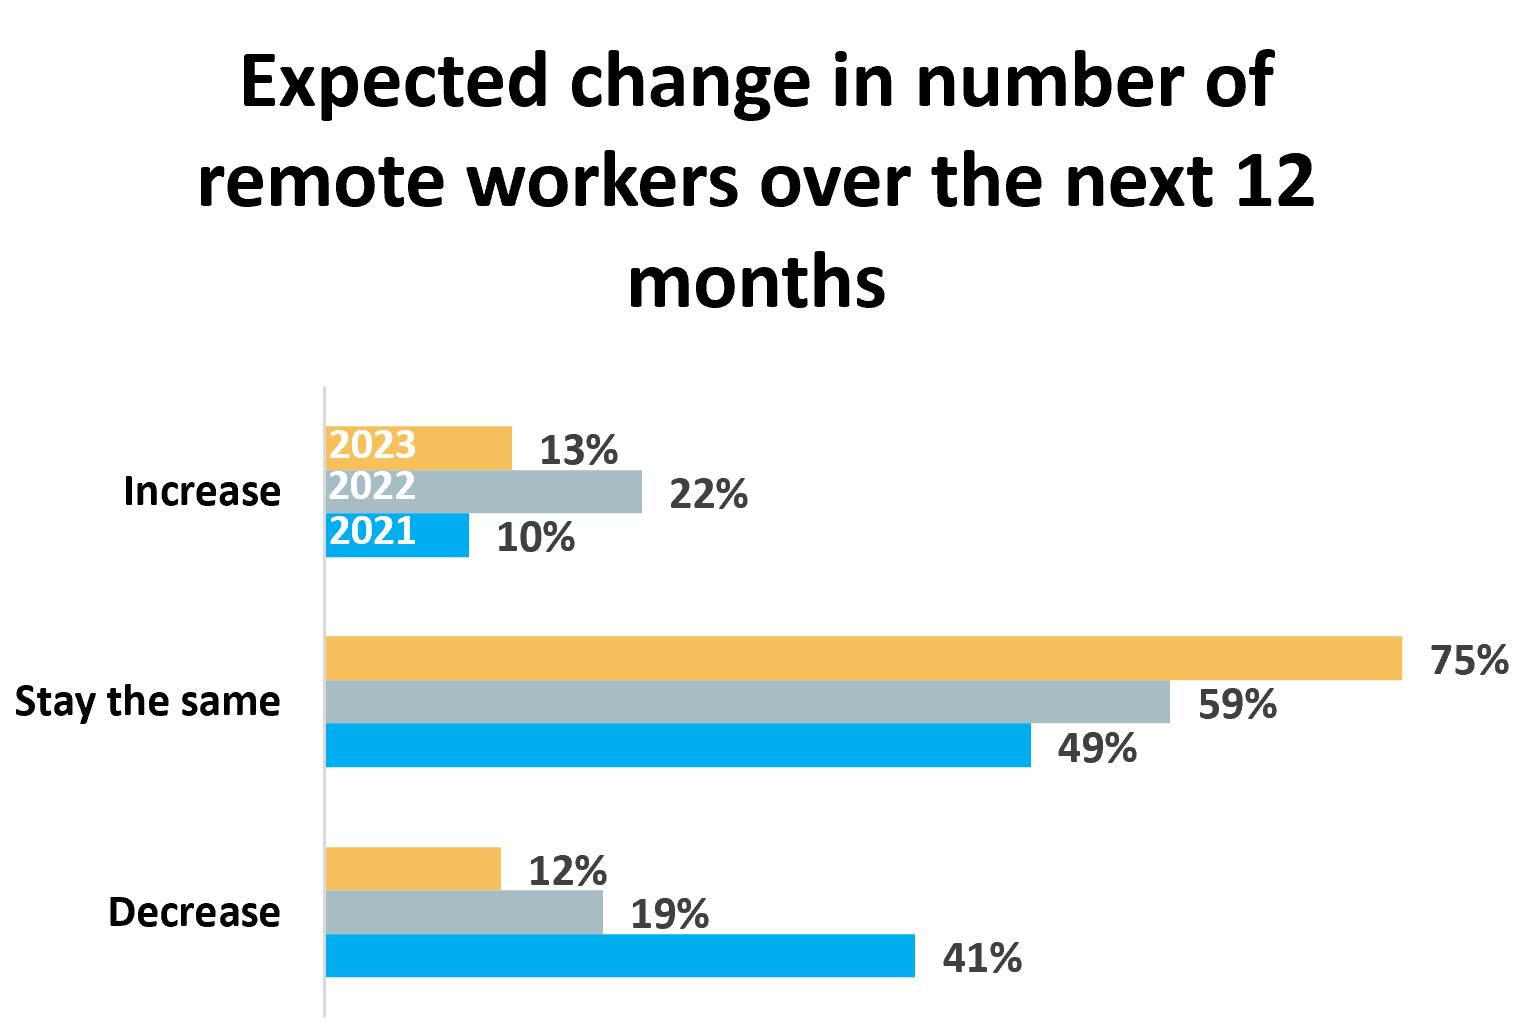
Most employers seem to have settled into a comfortable spot for remote work, with 72% of companies responding that they expect their remote work policy to stay the same over the next year. Equal number of businesses, 12%, expect to increase or decrease the number of remote workers over the next 12 months.
2023 State of the St. Louis Workforce | 35
What Makes a “Good Job?”
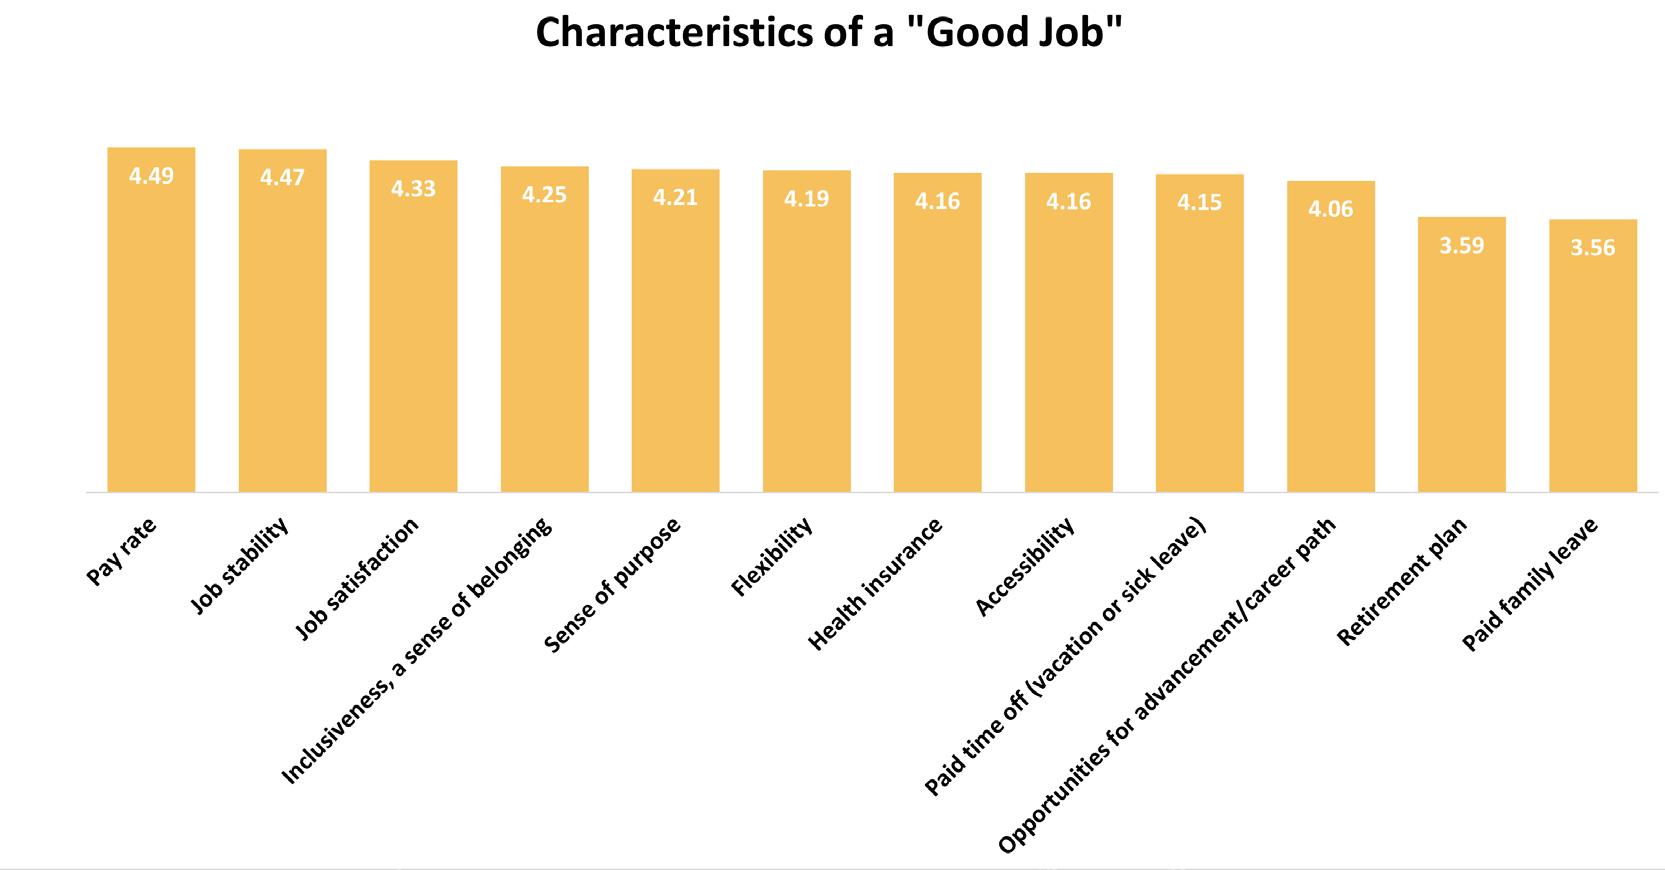
Another recently added question strives to understand the characteristics of a “good job” by asking employers to rank the importance of different benefits and facets of a job on a scale of 1 to 5, where 1 was “not at all important” and 5 was “very important”.
Compared to last year’s survey, the top three characteristics returned, with job stability and job satisfaction swapping spots as the second and third most popular options. Pay rate stays in the top spot. All other characteristics stayed in the same ratings spot, with some minor variations in average importance scores. The two characteristics that had a significant change were inclusiveness, a sense of belonging and health insurance. These two swapped the fourth and seventh spots out of the 12 characteristics, with Inclusiveness moving up to the fourth most important characteristic.
36 | 2023 State of the St. Louis Workforce
Spotlight on Startups
Entrepreneurs have been part of our community since the beginning. Over the years, the willingness to take a risk and start a new business has resulted in what we see today - 15 Fortune 1000 companies and eight of the Forbes’ largest private companies in America - and a vibrant mix of industries across our region. The largest St. Louis-based companies each started with a first sale and their first employee, in some cases over 100 years ago. That same spirit continues to be needed today, as job creation must be a key part of our economic growth.
New and young firms are the primary source of job creation in both urban and rural communities in the U.S., according to the Ewing Marion Kauffman Foundation. Large corporations may grow and add jobs, but they are more skilled at creating efficiencies in their business with the goal of producing more with fewer resources. Startups are truly the source of new job creation, and both St. Louis and Missouri continue to rely on startups as a large portion of their job growth each year.
2022 was a challenging year for startups. Supply chain issues lingered. Interest rates increased several times, changing the dynamics of borrowing money and funding debt for both the startups and their customers. Venture capital investments dropped from the previous year. Economic uncertainty has continued, impacting sectors and their startups very differently.
Startup Creation
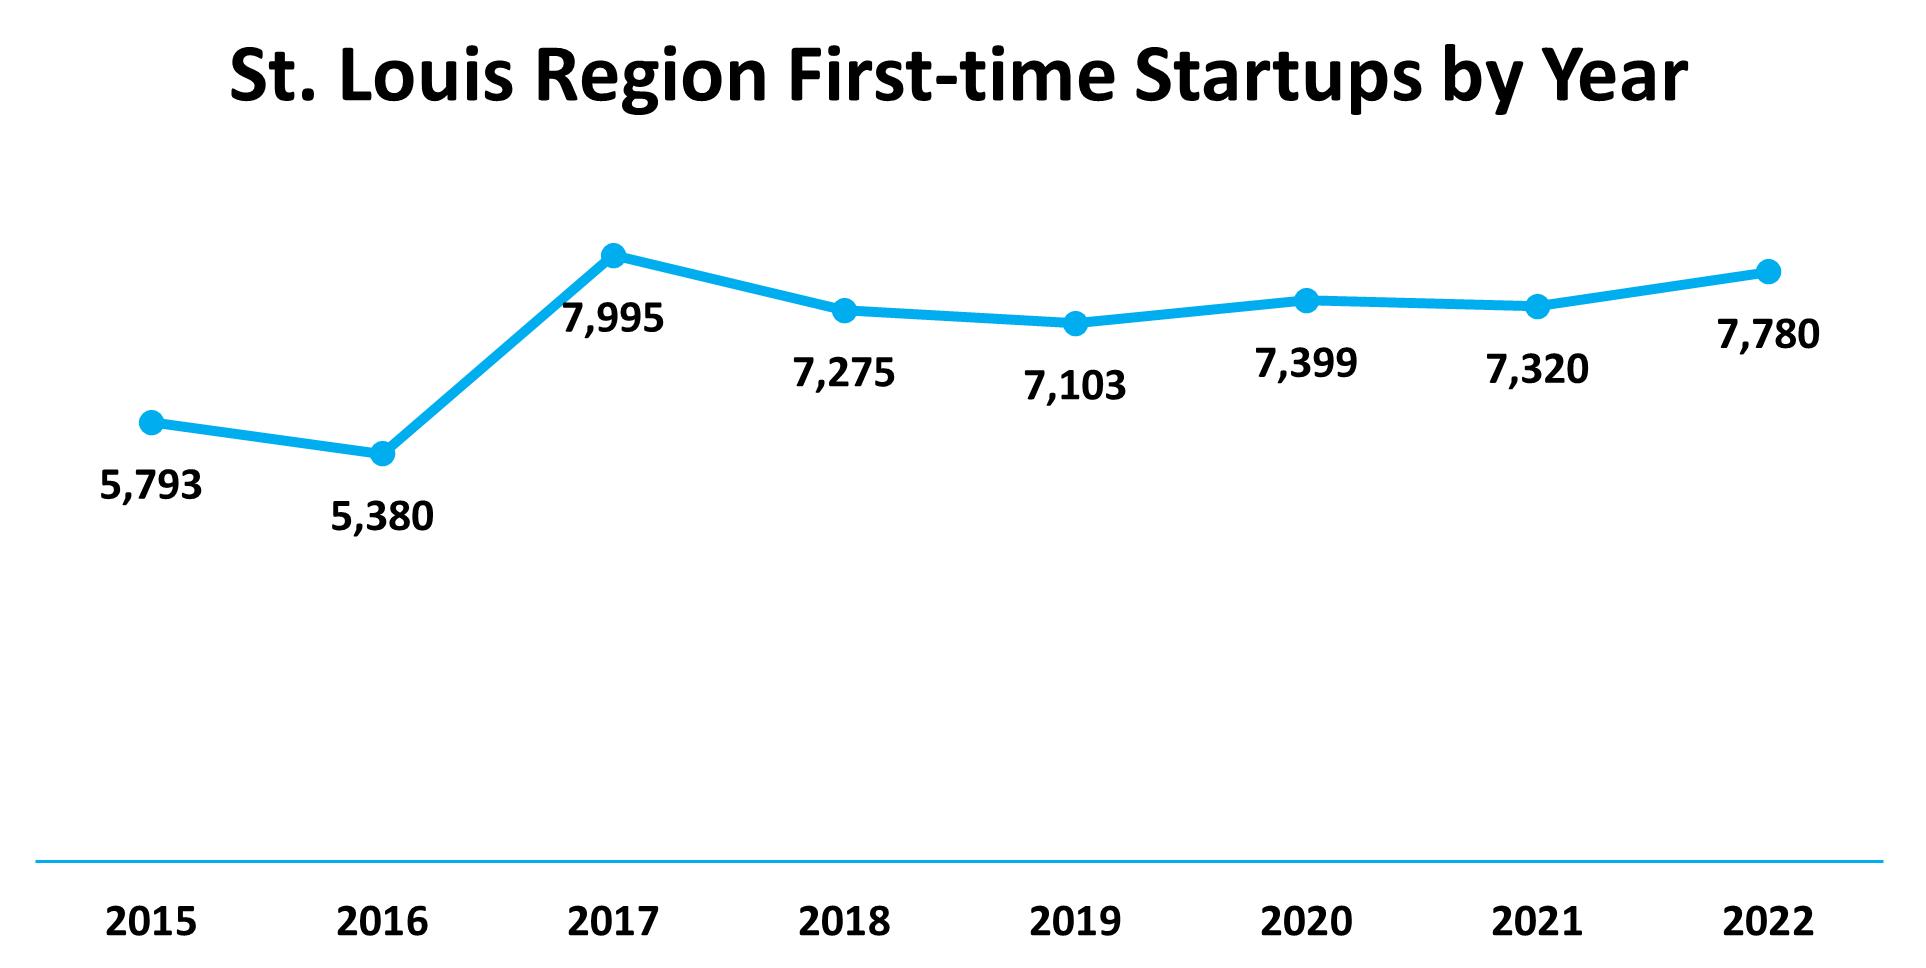
Startups, however, do not stop just because economic conditions aren’t ideal. For the St. Louis MSA, 7,780 startups hired their first employees in 2022. This is an increase of 462 startups over 2021, an increase of 6%.
New and young firms are the primary source of job creation.
2023 State of the St. Louis Workforce | 37
First-year startups created 15,313 new jobs in St. Louis in 2022.
Job Creation by First-Time Employers
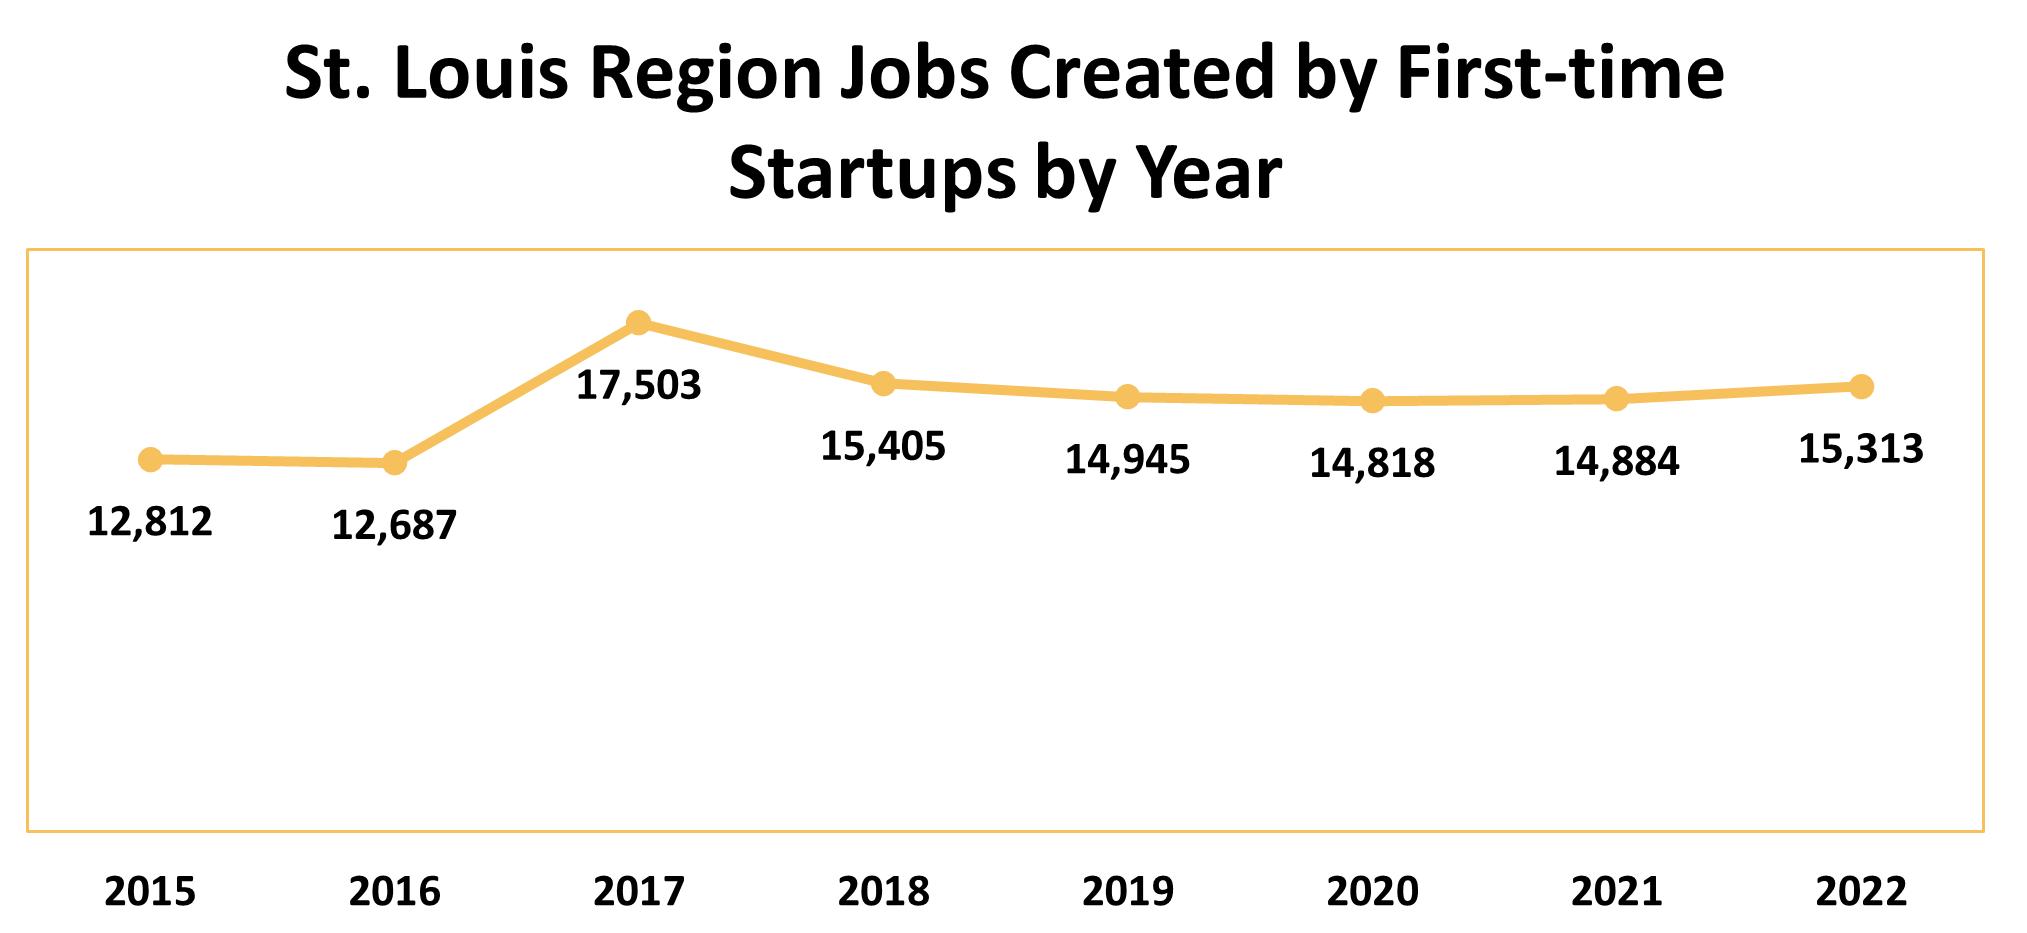
The 7,780 startups were first-time employers for our region, and those startups created 15,313 new jobs in 2022. This regional contribution is part of the 18,137 startups with 40,394 new jobs created in Missouri last year. St. Louis anchors Missouri with 44% of the new jobs created across the state in 2022, on pace with the St. Louis development area which comprises about 40% of the state’s economy.
New job creation by first-year startups has been steady since 2018, with an eight-year average of 14,795 jobs. St. Louis startups creating, on average, 14,795 brand new jobs every year is worth repeating. 2022 was the third highest year for job creation by startups since 2015, and the second highest for the number of startups created. From 2015 to 2022, first-year startups in the St. Louis region created a total of 118,367 new jobs.
As positive as job creation is, startups are high-risk and failure is part of the equation. According to the U.S. Bureau of Labor Statistics, about 20% of small businesses fail within their first year. In Missouri, 55% of first-time businesses are no longer employing anyone four years later. The companies that survive, however, continue to grow and create more jobs, making up for the jobs lost by other firms closing.
38 | 2023 State of the St. Louis Workforce
St. Louis startups founded in 2018 hired 15,453 employees that year. Since then, the number of employees at those firms has been as high as 16,272 in 2019, and as low as 13,838 in 2021. This takes into account the job losses of firms closing, as well as the increased hiring of the remaining firms that continue to grow. Given the growth trends for startups, we would expect the remaining 2018 startups to continue to increase their hiring going forward.
Startups by Geography
This report identifies a first-year startup as a firm hiring its first employee. Using this definition, St. Louis created 7,782 startups in 2022, up slightly from the 7,320 startups created in 2021. Across the state, most of the startups cluster in the state’s population centers including Kansas City, Columbia, Springfield, Joplin, Cape Girardeau and St. Louis, though there are first-time employers located in every county across the state, as depicted in this heat map from MOSourceLink’s Show Me Jobs report.
St. Louis County has the highest density of startups of any county in the state, as noted by the deep orange color.
Density of Startups by Geography

2023 State of the St. Louis Workforce | 39
Startups by Industry Sector
St. Louis startups are focused in the same industries as overall employment for the region. Health care and social assistance is the largest employer in the St. Louis MSA, and is also the largest two-digit NAICS code for both startups and job creation. In the last eight years, 32,528 startups were launched in this industry sector alone, accounting for 58% of all startups over this period, and a third of the jobs created by first-year startups since 2015.
The next largest concentration occurred in the professional, scientific and technical services NAICS code with 4,163 startups born since 2015, or 7.4% of all new startups during that time. This sector is also responsible for 7.4% of new jobs created, with 8,758 jobs.
Other key industries for startup creation include retail trade, construction, and accommodation and food service, though these significantly trail the previous two categories. These industries mirror the top sectors for startups across Missouri.
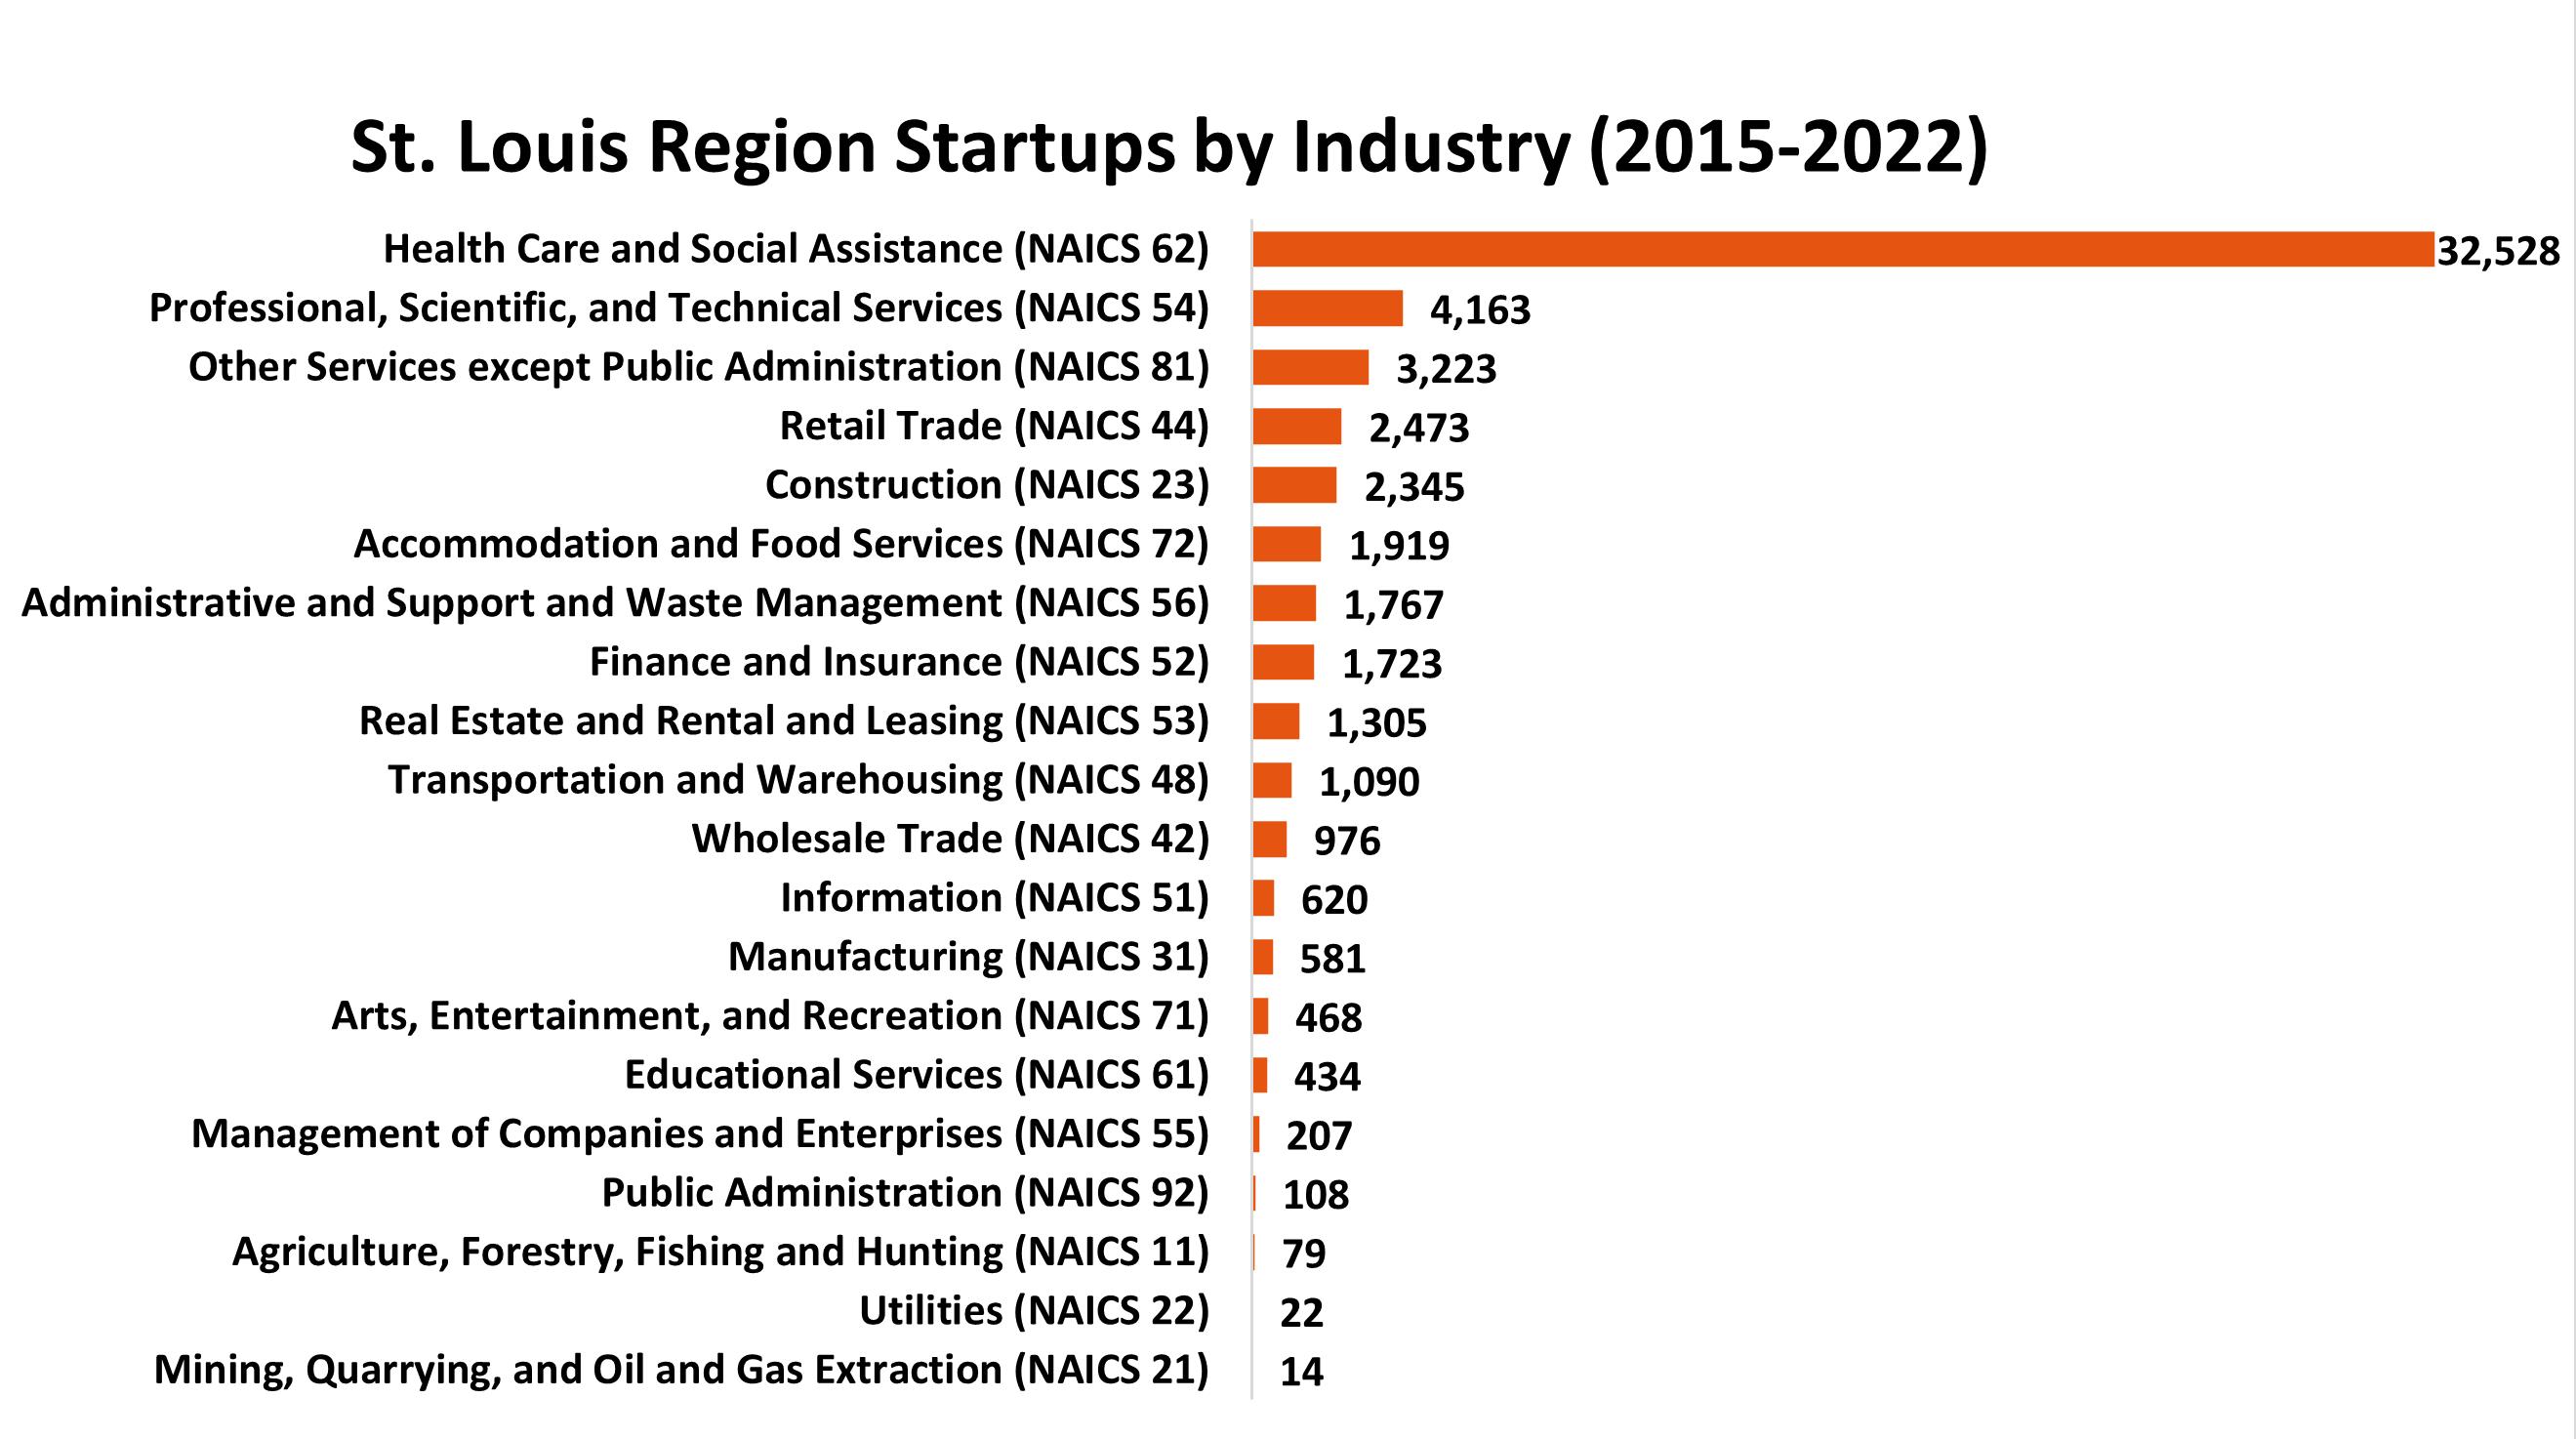
In the last eight years, 32,528 startups were launched in the health care industry.
40 | 2023 State of the St. Louis Workforce
While the jobs created by first-year startups follow in the same key industries, they are less concentrated in health care and social assistance. Jobs are more evenly distributed in the other top NAICS codes, indicating a broader range of educational needs and training is needed to support these fledgling companies.

8,758 jobs were created by scientific and technical services startups since 2015.
2023 State of the St. Louis Workforce | 41
Conclusion
The first-year startup data highlights several trends. Only 1% of startups nationally are funded by venture capital, but those companies are the ones we hear about most in the media. Venture capital funding provides for fast growth in sectors like tech and science. The jobs in these sectors often have higher pay than jobs in the average startup. Venture capital also means that those investors will want a return on their investment at some point, requiring that company to sell or have a public stock offering.
The vast majority of startups in the St. Louis region are in traditional service and product sectors. These are the other 99% of the startups that are typically funded through debt and the revenue from the sales of goods and services. While they may grow more slowly than startups funded by investors, they grow to be cornerstones in neighborhoods, stay in our community rather than moving, and are not pressured to sell by investors. They are often the companies that sponsor local celebrations, school fund raisers and youth sports leagues.
Having startups across a range of industries is as important to our region as having corporations in a variety of industries. Both startups and larger corporations contribute to a vibrant ecosystem of idea creation and commercialization. Employees often migrate between small and large companies at different points in their careers. Having a strong innovation community is also attractive to companies that are seeking to relocate to the region.
Startup Job Creation Methodology
A new startup is identified with the first appearance of firm records in the employer file with no predecessor record in the Quarterly Census of Employment and Wages (QCEW). The QCEW contains individual records of wages paid for Unemployment Insurance (UI). In this method, new startups are new establishments. The QCEW data set does not include those who are self-employed or contract employees.
Firm-level job counts average employer-reported monthly employment in the QCEW employer file for quarterly observations. The number of jobs includes any employment – full-time, part-time and multiple jobs – but does not include those who are self-employed.
This report draws from raw QCEW data, and the statistical methods used for calculating total employment differs from the methods used from QCEW data published by the U.S. Bureau of Labor Statistics. The bureau uses a six-step statistical test that MOSourceLink is unable to replicate.
The number of startups for each year counts the number of new firms with fewer than 20 employees in each quarter for a year. The number of new jobs from startups is the number of jobs in Quarter 4 from new firms identified in Quarters 1, 2, 3, and 4.
42 | 2023 State of the St. Louis Workforce
Spotlight on Advanced Manufacturing
Advanced Manufacturing in St. Louis
Manufacturing in the St. Louis MSA employees 118,792 people. It represents 8.8% of the employment in the region, ranking as the fourth largest sector just as it did a decade earlier. Only the Healthcare, Wholesale & Retail Trade, and Leisure & Hospitality sectors employ more individuals. St. Louis makes up 38.1% of the Missouri workforce, and 42% of the state’s manufacturing workforce.
Employment in the St. Louis manufacturing sector is up 10% from 2012, an increase of 10,781 workers. Overall employment was up 6% across all industries, with manufacturing outpacing that figure by 4%.
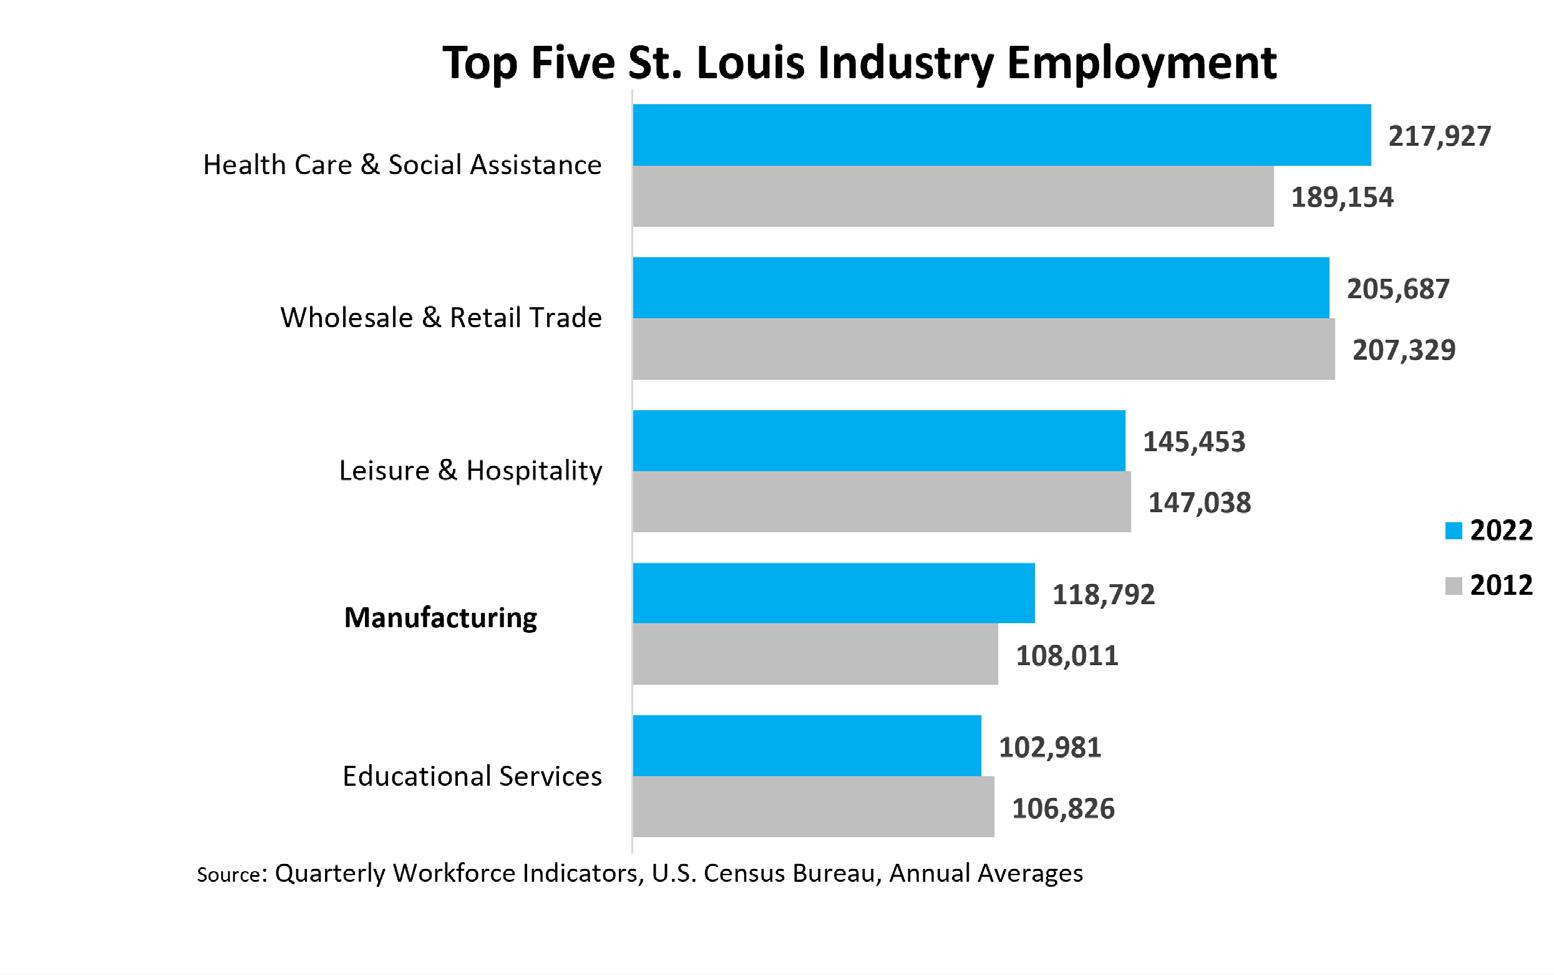
Changes in the Manufacturing Sector
“ St. Louis is a hub for advanced manufacturing in the U.S. Our vertical integration from raw material processing to finished parts and goods combined with our distribution network, makes St. Louis a hub of hubs.”
Brandon Dempsey Conflux CoLearning
Over the last 10 years, manufacturing jobs have shifted within the region. In 2012, 81.5% of the jobs were in the Missouri counties of the St. Louis MSA, with 18.5% located in the Illinois counties. By 2022, that had increased to 85% of the jobs residing in Missouri.
There are manufacturing jobs in every county in the MSA. In Missouri, those jobs are concentrated in St. Louis County (40.9% of manufacturing jobs), St. Louis City (14.3%), St. Charles County (13.7%) and Franklin County (8.2%). St. Louis County has grown manufacturing roles by 12% since 2012, to 47,881 jobs. While St. Louis City still employs the second-most manufacturing workers in the region, that number has dropped by 19% in the last decade to 16,768 jobs, while St. Charles County has increased manufacturing employment by 49% to 16,029 over that time. In Illinois, most manufacturing roles are in Madison (8.9%) and St. Clair (4.4%) counties.
2023 State of the St. Louis Workforce | 43
Beyond geography, manufacturing roles are changing by the type of manufacturing as well. In 2022, the top subsectors for employment within Manufacturing by three-digit NAICS codes are: Transportation Equipment (23,003 jobs), Machinery (13,114 jobs), Chemical (12,719 jobs), Fabricated Metal Product (10,514 jobs), and Food (10,507 jobs).
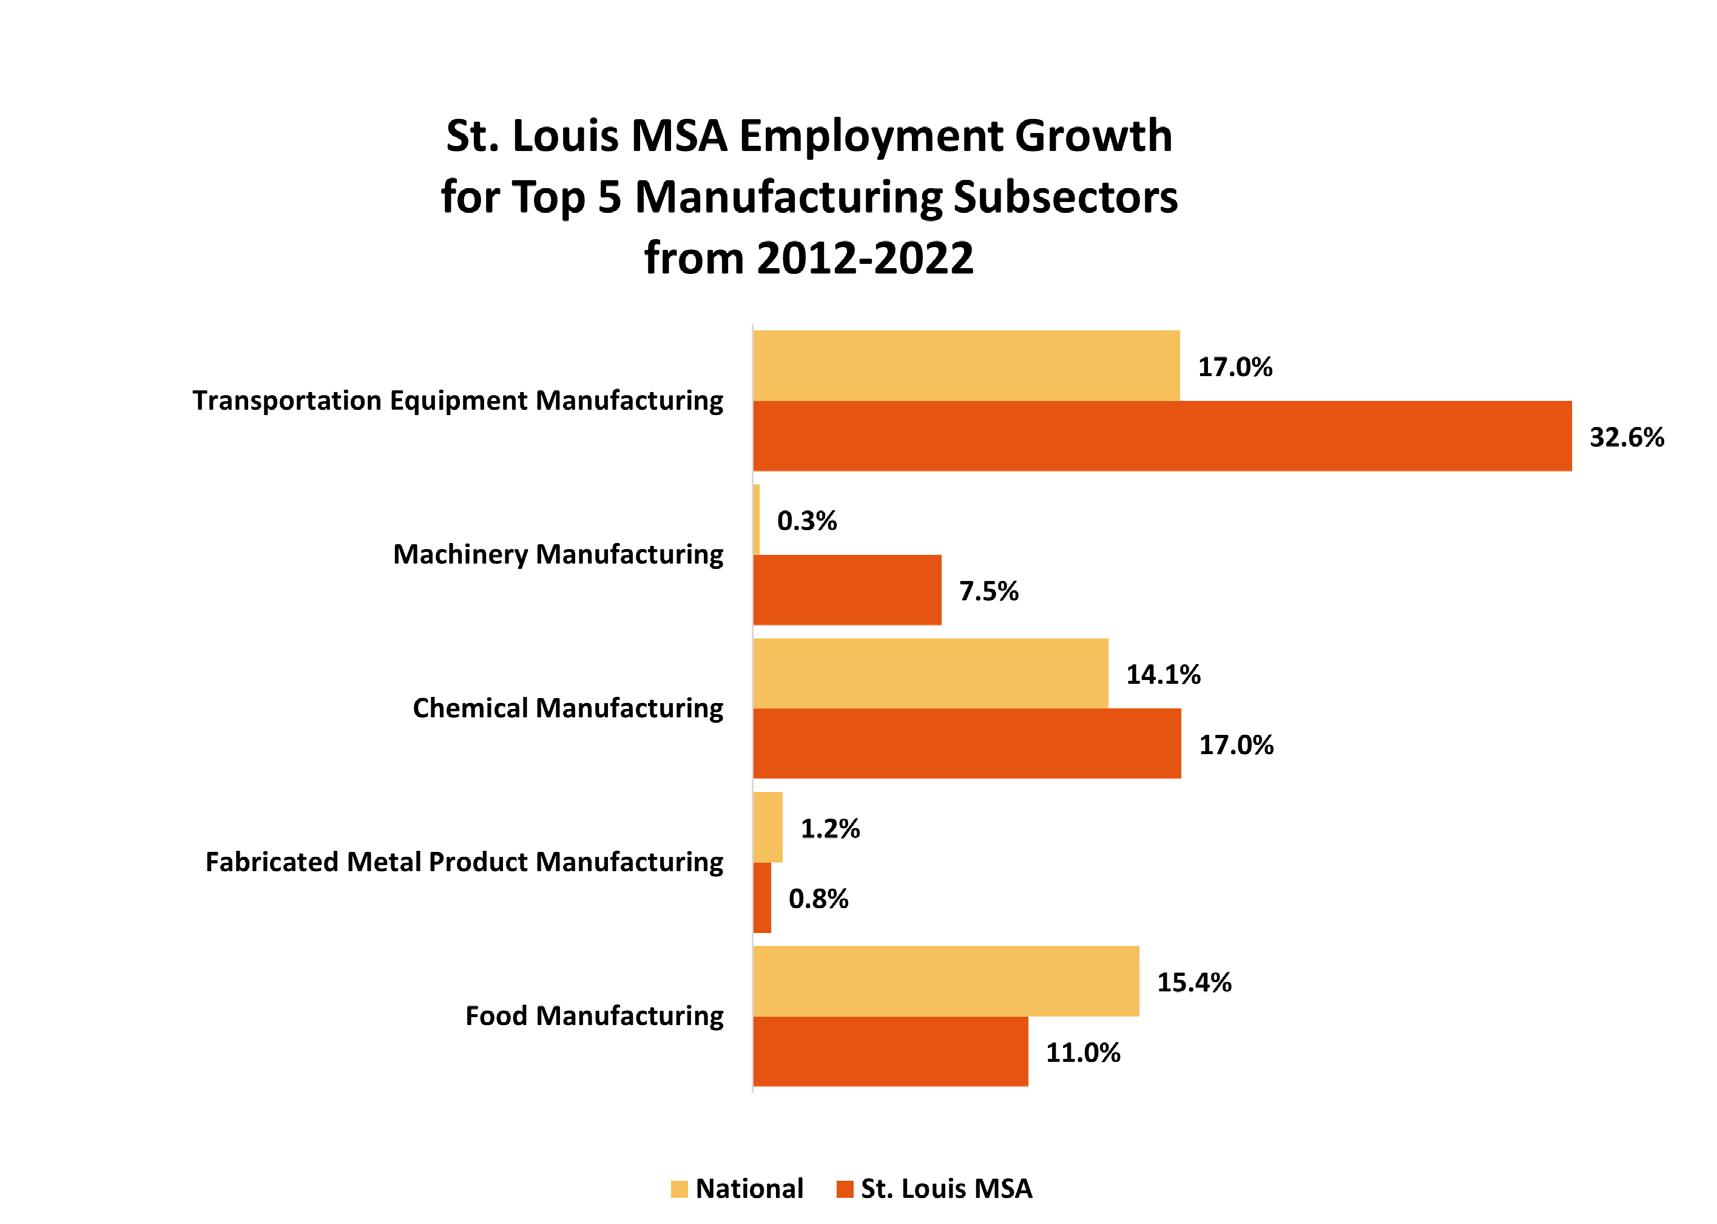
These were the same top five subsectors in 2012, in the same order, though growth over the last decade has varied by subsector. Transportation Equipment Manufacturing jobs grew by 32.5%, outpacing the national job growth of 17% in this subsector. Fabricated Metal Product Manufacturing, on the other hand, only grew by 0.8%, still not far off the national growth rate of 1.2%.
“
The St. Louis region has several strong manufacturing sectors including Aerospace and Defense, Automotive, Biomedical & Life Sciences, AgTech, Geospatial & Location Services, Transportation and Logistics, Construction and Energy.”
Kory Mathews
AMIC STL
44 | 2023 State of the St. Louis Workforce
St. Louis Perspective on Advanced Manufacturing
From our annual employer survey, we are able to assess the trends of manufacturing companies from our own region. For their outlook on employment growth, 67% of manufacturing companies that were surveyed expected to remain at the same level of employment this year, with no significant hiring or firing. Twenty-two percent expected to hire in some capacity, while 11% expected to decrease their workforce over the next year.
Last year’s hiring forecast indicated that 42% of manufacturing companies had expected to hire during this year, as compared to 22% this year, a true dampening of expectations for growth through headcount. Manufacturers are focusing on two main tactics in their hiring efforts. Sixty-two percent of companies surveyed were offering increased wages to attract more workers, and also reported that they hired less experienced workers and would need to train them.
Manufacturers are partnering with other organizations to assist in hiring and training, with 17% of surveyed companies selecting 2-year colleges, training institutions, and nonprofit organizations. Fourteen percent of companies selected 4-year colleges and school districts as partners.
The Future of Advanced Manufacturing
The future of advanced manufacturing indicates a need for developing additional efficiencies. The aging of the American workforce in general means there will be fewer workers available to perform the same amount of work. This is especially true in the manufacturing sector. According to the Bureau of Labor Statistics, 26% of the manufacturing workforce nationally is age 55 or older. Nearly half of all manufacturing employees, or 7.4 million workers across the country, are age 45 or older. With lower birth rates, a much smaller population of workers is coming of age. Unless efficiencies are introduced through new processes or new technology, the U.S. will not be able to sustain the same level of production 20 years from now.
Additionally, the COVID pandemic highlighted our dependence on foreign countries for many parts and products, particularly semiconductor chips and pharmaceutical ingredients. The pandemic supply chain issues were significant in delaying the production and delivery of these key products, as well as highlighting our vulnerability to potential political and economic threats. Reshoring production for these items is in the best interest of the country, though the cost of labor and materials in other countries creates a very different cost model that would be difficult to replicate in the U.S. New production systems created here will only be successful if new efficiencies are created for a more sustainable business model.
St. Louis is not the only Midwest city working to grow its manufacturing base, nor are we unique in our own aging workforce or near-flat population growth. Supporting innovation in the sector and recognizing the need for change will be essential for manufacturing companies, our civic organizations and government and our workforce. Maintaining a healthy manufacturing sector is good for the St. Louis workforce and for the overall health of our regional economy and Missouri’s economy.
2023 State of the St. Louis Workforce | 45
State of the St. Louis Workforce Speaker and Panel
The State of the St. Louis Workforce event on August 16, 2023, featured Charles Gascon, senior economist at the Federal Reserve in St. Louis. His talk focused on both regional and national trends in advanced manufacturing. The panel discussion at the event looked to the future of the advanced manufacturing industry in St. Louis with Dr. Pittman moderating.
Visit stlcc.edu/STLworkforce to access a link to the event recording and to download this report.
Biographies

Charles S. Gascon Federal Reserve Bank of St. Louis Senior Economist
Charles S. Gascon is a senior economist in the Research division at the Federal Reserve Bank of St. Louis. Gascon analyzes economic conditions nationally and in the Eighth Federal Reserve District. Gascon reports on regional economic conditions to the Bank president and staff economists prior to Federal Open Market Committee (FOMC) meetings.

Kevin Webb
API Innovation Center
COO
Kevin Webb is chief operating officer at Active Pharmaceutical Ingredients (API) Innovation Center, a non-profit dedicated to delivering a competitive commercial supply of U.S.-made pharmaceutical ingredients to address national health security. As Chief Operating Officer, Webb is currently leading national efforts to strengthen domestic pharmaceutical manufacturing.

Kory Mathews
Advanced Manufacturing Innovation Center
CEO
Kory Mathews is CEO of the not-for-profit Advanced Manufacturing Innovation Center (AMIC) and a recently retired senior global aerospace and defense executive of the Boeing Company. AMIC focuses on diverse workforce development, advanced manufacturing research and development and production line/ process prototyping across eight manufacturing sectors.

Jeff Pittman, Ph.D.
St. Louis Community College Chancellor
Jeff Pittman, Ph.D., leads STLTranformed, a multi-year, multi-campus and multi-milliondollar initiative that ensures the College continues to meet the region’s ever changing and everincreasing workforce development demands. His work continues STLCC’s tradition of providing quality, affordable and accessible education and workforce training for all St. Louis area residents in support of area businesses.

Chauncey Nelson
Gateway South Innovation District President/CEO
Chauncey Nelson works at the intersection of real estate and social work, collaborating with institutions, corporations and community-based organizations. In this role, Nelson steers effective collaboration and produces sustainable approaches to social impact and economic vitality. Prior to his current role, Chauncey was a Good Developments Group community liaison.

Phyllis Ellison, M.B.A.
St. Louis Community College
Associate Vice Chancellor, Workforce Sotions Group
Phyllis Ellison leads the College’s corporate and community workforce development programs, personal enrichment education, professional development and entrepreneurial initiatives that meet the expanding training and skill development needs of local, regional and national businesses in a range of industries.
46 | 2023 State of the St. Louis Workforce
Acknowledgments
We sincerely thank the 600 companies that took the time away from their businesses to participate in the survey interview.
We also thank the St. Louis Business Journal for their support as our media partner.
We offer our deep appreciation to Charles Gascon of the Federal Reserve Bank of St. Louis, Kory Mathews of the Advanced Manufacturing Innovation Center (AMIC), Chauncey Nelson of the Gateway South Innovation District, and Kevin Webb of the API Innovation Center for sharing their insights on advanced manufacturing and the economy.
Thanks to MOSourceLink for their contributions and analysis of the startup data for the St. Louis region.
Thanks to Sarah L. Coffin, Ph.D., AICP, for her contributions and analysis of the advanced manufacturing data.
Finally, we would like to acknowledge the contributions of Probolsky Research for their help with the administration of the employer survey as well as the data collection and tabulation.
The 2023 State of the St. Louis Workforce report was made possible by the collaborative efforts of staff from the St. Louis Community College Workforce Solutions Group and the Missouri Economic Research and Information Center (MERIC), the research unit of the Missouri Department of Economic Development.
2023 State of the St. Louis Workforce | 47
Appendix: State of the St. Louis Workforce Employer Survey 2023
The employer survey was conducted as phone interviews on weekdays starting May 12, 2023 and ending June 9, 2023. Only complete surveys are used in this report.
1a. Over the past 12 months, would you say your employment levels have increased significantly (by 15% or more), increased slightly (by less than 15%), remained the same as before, decreased slightly (by less than 15%), or decreased significantly (by 15% or more)?
4a. Please tell me if you have encountered the following barriers to
1b. (If there was a significant increase or decrease in 1a) Was your significant increase or decrease due to COVID?
2. Looking ahead over the next 12 months, how does your business PLAN to change your employment levels? Would you say your employment levels will increase significantly (by 15% or more), increase slightly (by less than 15%), remain the same as before, decrease slightly (by less than 15%),
decrease significantly (by 15% or more)
3. If you were to add employees in the next 12 months, which of the following methods would you use?
4b. (Re: each barrier named on Q.4a)
Please tell me how large of a barrier each is to your business using a 1-to-5 scale where 1 is “insignificant” and 5 is a “critical barrier.” You may also use any number between 1 and 5. And, if an item is not applicable to your business, please tell me so.
96 - Not applicable
97 - Refuse
98 - Don’t know/Not sure
Shortage of workers with knowledge or skills
Shortage of available training programs
Economic conditions
Government policies or regulations
Lack of information regarding the occupation
Lack of access to transportation to get to work
Lack of access to child care
Other barrier
5. Next, I am going to read some possible shortcomings of job applicants and ask if you have or have not seen these characteristics in a significant number of applicants during the last 12 months. I would then like you to rank the importance of that shortcoming to your business on a 1 to 5 scale where 1 is “not at all important” and 5 is “very important.”
5a-1. Please tell me if you have or have not noticed a significant number of applicants with “Poor work habits” (including attendance, punctuality, and attention to job).
Have seen this characteristic in job applicants 01
Have not seen this characteristic in job applicants
02
(Do not read) Refuse 97
(Do not read) Don’t know/Not sure 98
5a-2. On the 1 to 5 scale, how important is this applicant shortcoming to
48 | 2023 State of the St. Louis Workforce
Initial Question Employees First, including yourself, how many employees does your company CURRENTLY employ in your area? Less than 5 (Thank & Terminate) 01 5 to 10 02 11 to 49 03 50 or more 04 (Do not read) Refuse - Thank & Terminate 97 (Do not read) Don’t know/Not sure - Thank & Terminate 98
Increased significantly, by 15% or more 01 Increased slightly, by less than 15% 02 Remained the same as before 03 Decreased slightly, by less than 15% 04 Decreased significantly, by 15% or more 05 (Do not read) Refuse 97 (Do not read) Don’t know/Not sure 98
Yes 01 No 02 (Do not read) Not applicable 98
Increase significantly, by 15% or more 01 Increase slightly, by less than 15% 02 Remain the same as before 03 Decrease slightly, by less than 15% 04 Decrease significantly, by 15% or more 05 (Do not read) Refuse 97 (Do not read) Don’t know/Not sure 98
or
(Read list; enter code for each method would use; enter all that apply.) Recalling furloughed workers 01 Recalling workers from a lay-off list 02 Hiring new full-time employees 03 Hiring new part-time employees 04 Hiring contract workers 05 Using a temporary agency 06 (Do not read) Not applicableNot wanting to add employees 95 (Do not read) Would not use any listed method 96 (Do not read) Refuse 97 (Do not read) Don’t know/Not sure 98
expanding your employment level. (Rotate barriers; ask “Any other barrier?” last) Shortage of workers with knowledge or skills 01 Shortage of available training programs 02 Economic conditions 03 Government policies or regulations 04 Lack of information regarding the occupation 05 Lack of access to transportation to get to work 06 Lack of access to child care 07 Any other barrier? (If “Yes” - Record) 08 (Do not read) Have not encountered any barriers to expanding employment level 95 (Do not read) Not applicable - Not expanding employment level 96 (Do not read) Refuse 97 (Do not read) Don’t know/Not sure 98
your business?
(Do not read) 98 - Don’t know/Not sure
Poor work habits
5b-1. Please tell me if you have or have not noticed a significant number of applicants with a “Lack of general knowledge about business or industry.”
Have seen this characteristic in job applicants 01
Have not seen this characteristic in job applicants 02
(Do not read) Refuse 97
(Do not read) Don’t know/Not sure 98
5b-2. On the 1 to 5 scale, how important is this applicant shortcoming to your business?
(Do not read) 98 - Don’t know/Not sure
Lack of general knowledge about business or industry
5c-1. Please tell me if you have or have not noticed a significant number of applicants with a “Lack of ability to interact effectively with people of different cultures and socio-economic backgrounds.”
Have seen this characteristic in job applicants 01
Have not seen this characteristic in job applicants 02
(Do not read) Refuse 97
(Do not read) Don’t know/Not sure 98
5c-2. On the 1 to 5 scale, how important is this applicant shortcoming to your business?
(Do not read) 98 - Don’t know/Not sure
Lack of ability to interact effectively with people of different cultures and socio-economic backgrounds
5d-1. Please tell me if you have or have not noticed a significant number of applicants with a “Lack of communication or interpersonal skills.”
Have seen this characteristic in job applicants 01
Have not seen this characteristic in job applicants 02
(Do not read) Refuse 97
(Do not read) Don’t know/Not sure 98
5d-2. On the 1 to 5 scale, how important is this applicant shortcoming to your business?
(Do not read) 98 - Don’t know/Not sure
Lack of communication or interpersonal skills
5e-1. Please tell me if you have or have not noticed a significant number of applicants with a “Lack of willingness to learn or inability to learn.”
Have seen this characteristic in job applicants 01
Have not seen this characteristic in job applicants 02
(Do not read) Refuse 97
(Do not read) Don’t know/Not sure 98
5e-2. On the 1 to 5 scale, how important is this applicant shortcoming to your business?
(Do not read) 98 - Don’t know/Not sure
Lack of willingness to learn or inability to learn
5f-1. Please tell me if you have or have not noticed a significant number of applicants with a “Lack of teamwork or collaboration.”
Have seen this characteristic in job applicants 01
Have not seen this characteristic in job applicants 02
(Do not read) Refuse 97
(Do not read) Don’t know/Not sure 98
5f-2. On the 1 to 5 scale, how important is this applicant shortcoming to your business?
(Do not read) 98 - Don’t know/Not sure
Lack of teamwork or collaboration
5g-1. Please tell me if you have or have not noticed a significant number of applicants with a “Lack of general computer skills.”
Have seen this characteristic in job applicants 01
Have not seen this characteristic in job applicants 02
(Do not read) Refuse 97
(Do not read) Don’t know/Not sure 98
5g-2. On the 1 to 5 scale, how important is this applicant shortcoming to your business?
(Do not read) 98 - Don’t know/Not sure
Lack of general computer skills __
5h-1. Please tell me if you have or have not noticed a significant number of applicants with a “Lack of critical thinking and problem solving.”
Have seen this characteristic in job applicants 01
Have not seen this characteristic in job applicants 02
(Do not read) Refuse 97
(Do
5h-2. On the 1 to 5 scale, how important is this applicant shortcoming to your business?
(Do not read) 98 - Don’t know/Not sure
Lack of critical thinking and problem solving
5i-1. Please tell me if you have or have not noticed a significant number of applicants with an “Inability to think creatively or ‘out of the box’.”
Have seen this characteristic in job applicants 01
02
5i-2. On the 1 to 5 scale, how important is this applicant shortcoming to your business?
(Do not read) 98 - Don’t know/Not sure
Inability to think creatively or ‘out of the box’ __
5j-1. Please tell me if you have or have not noticed a significant number of applicants with a “Lack of writing skills.”
5j-2. On the 1 to 5 scale, how important is this applicant shortcoming to your business?
(Do not read) 98 - Don’t know/Not sure
Lack of writing skills
5k-1. Please tell me if you have or have not noticed a significant number of applicants with a “Lack of basic math skills.”
Have seen this characteristic in job applicants 01
5k-2. On the 1 to 5 scale, how important is this applicant shortcoming to your business?
(Do not read) 98 - Don’t know/Not sure
Lack of basic math skills __
2023 State of the St. Louis Workforce | 49
not read) Don’t know/Not sure 98
Have not seen this
in job applicants
(Do not read) Refuse 97 (Do not read) Don’t know/Not sure 98
characteristic
Have not seen this characteristic in job applicants
(Do not read) Refuse 97 (Do not read) Don’t know/Not sure 98
Have seen this characteristic in job applicants 01
02
(Do
Have not seen this characteristic in job applicants 02 (Do not read) Refuse 97
not read) Don’t know/Not sure 98
5l-1. Please tell me if you have or have not noticed a significant number of applicants with a “Lack of technical skills specific to the job.”
Have seen this characteristic in job applicants 01
Have not seen this characteristic in job applicants 02
(Do not read) Refuse 97
(Do not read) Don’t know/Not sure 98
5l-2. On the 1 to 5 scale, how important is this applicant shortcoming to your business?
(Do not read) 98 - Don’t know/Not sure
Lack of technical skills specific to the job
5m-1. Please tell me if you have or have not noticed a significant number of applicants with an “Inability to understand written and graphical information.”
Have seen this characteristic in job applicants 01
Have not seen this characteristic in job applicants 02
(Do not read) Refuse 97
(Do not read) Don’t know/Not sure 98
5m-2. On the 1 to 5 scale, how important is this applicant shortcoming to your business?
(Do not read) 98 - Don’t know/Not sure
Inability to understand written and graphical information
5n-1. Please tell me if you have or have not noticed a significant number of applicants with an “Inability to pass a drug test or has a substance abuse issue.”
Have seen this characteristic in job applicants 01
Have not seen this characteristic in job applicants 02
(Do not read) Refuse 97
(Do not read) Don’t know/Not sure 98
5n-2. On the 1 to 5 scale, how important is this applicant shortcoming to your business?
(Do not read) 98 - Don’t know/Not sure
Inability to pass a drug test or has a substance abuse issue __
6. Now we would like you to share the strengths you have seen in job applicants during the last 12 months. Please rank each strength on a 1 to 5 scale where 1 is “did not see this strength in any applicants” and 5 is “saw this strength in all applicants.”
(Do not read) 98 - Don’t know/Not sure
6a. Determination
6b. Personal discipline __
6c. Creativity
6d. Respectfulness
6e. Honesty
6f. Curiosity
6g. Verbal communication skills __
6h. Writing skills
6i. Technical skills
6j. Taking the initiative
6k. Responsibility
6l. Positivity
6m. Ambition
6n. Dependability
7a. Are you experiencing a shortage of skilled applicants for your organization?
__
No (if “no” skip to question 8) 02
(Do not read) Refuse
(Do not read) Don’t know/Not sure 98
7b. (If experiencing shortage of skilled applicants per Q.7a)
Please tell me the skill level required to meet your skill shortages. Approximately what percentage of the SHORTAGES you are experiencing require high-skill applicants (those with a 4-year degree or higher); middle-skill applicants (training or education beyond high school, but less than a 4-year degree); and low-skill applicants (high school or less). What percent of positions require ... Answers MUST total 100%
Refuse =
7c.
experiencing shortage of skilled applicants per Q.7a)
me if you are taking any of the following measures to meet the
Yes 01
8. Which of the following methods do you use to assist current workers to address your company’s need for new or increased skills?
9. Now we have some questions about your company’s workforce by job function.
9a. Do you employ staff in the Accounting or Finance function?
50 | 2023 State of the St. Louis Workforce
97
97 Don’t know/Not sure
98 High-skill, requiring a 4-year degree or
___ Middle-skill, training or education beyond high school, but less than a 4-year degree Low-skill, requiring high school or less
=
higher
Please tell
shortages of applicants. Hiring from outside the St. Louis area 01 Hiring from outside the United States 02 Hiring contractors 03 Forced to hire less experienced workers and then train them 04 Invest in automation instead of hiring 05 Offering increased wages due to shortage of experienced workers 06 (Do not read) Not taking any of listed measures 96 (Do not read) Refuse 97 (Do not read) Don’t know/Not sure 98
(If
skill
(Read list; enter all that apply.) In-house classroom training 01 On-the-job training 02 Vendor training 03 Apprenticeship programs 04 Internship programs 05 Community college provided customized training or education 06 Vocational training 07 Tuition reimbursement 08 Online courses 09 Provide flexible schedule for outside continuing education 10 (Do not read) Not applicable – Do not need new or increased skills 95 (Do not read) Refuse 97 (Do not read) Don’t know/Not sure 98
Yes 01 No (if “no” skip to question 9b) 02 (Do not read) Refuse 97 (Do not read) Don’t know/Not sure 98
9aa. (If employ staff in Accounting or Finance function per Q.9a)
Are you seeing a shortage of skilled applicants in the Accounting or Finance function? Yes
9cc. (If employ staff in Customer Service function per Q.9c)
Are you seeing a shortage of skilled applicants in the Customer Service function?
9aaa. (If seeing shortage of skilled applicants in the Accounting or Finance function per Q.9aa)
Please tell me the skill level of applicants required to meet your Accounting or Finance skill shortages. Approximately what percentage of the shortages you are experiencing require high-skill applicants (those with a 4-year degree or higher); middle-skill applicants (training or education beyond high school, but less than a 4-year degree); and low-skill applicants (high school or less).
What percent of positions require ...
Answers MUST total 100%
Refuse = 97
Don’t know/Not sure = 98
High-skill, requiring a 4-year degree or higher ___
Middle-skill, training or education beyond high school, but less than a 4-year degree
Low-skill, requiring high school or less
9b. Do you employ staff in the Information Technology function?
9ccc. (If seeing shortage of skilled applicants in the Customer Service function per Q.9cc)
Please tell me the skill level of applicants required to meet your Customer Service skill shortages. Approximately what percentage of the shortages you are experiencing require high-skill applicants (those with a 4-year degree or higher); middle-skill applicants (training or education beyond high school, but less than a 4-year degree); and low-skill applicants (high school or less).
What percent of positions require ...
Don’t know/Not sure = 98
requiring a 4-year degree or higher
9d. Do you
9bb. (If employ staff in Information Technology function per Q.9b)
Are you seeing a shortage of skilled applicants in the Information Technology function?
Yes
9dd. (If employ staff in Business Management function per Q.9d)
Are you seeing a shortage of skilled applicants in the Business Management function?
01
No (if “no” skip to question 9c) 02 (Do not read)
9bbb. (If seeing shortage of skilled applicants in the Information Technology function per Q.9bb)
Please tell me the skill level of applicants required to meet your Information Technology skill shortages. Approximately what percentage of the shortages you are experiencing require high-skill applicants (those with a 4-year degree or higher); middle-skill applicants (training or education beyond high school, but less than a 4-year degree); and low-skill applicants (high school or less).
What percent of positions require ...
Answers MUST total 100%
Refuse = 97
Don’t
= 98 High-skill,
9c. Do you employ staff in the Customer Service function?
Yes 01
No (if “no” skip to question 9d)
9ddd. (If seeing shortage of skilled applicants in the Business Management function per Q.9dd)
Please tell me the skill level of applicants required to meet your Business Management skill shortages. Approximately what percentage of the shortages you are experiencing require high-skill applicants (those with a 4-year degree or higher); middle-skill applicants (training or education beyond high school, but less than a 4-year degree); and low-skill applicants (high school or less).
What percent of positions require ...
Answers MUST total 100%
Refuse = 97
Don’t know/Not sure = 98
High-skill, requiring a 4-year degree or higher
Middle-skill, training or education beyond high school, but less than a 4-year degree
Low-skill, requiring high school or less
9e.
you employ staff in
2023 State of the St. Louis Workforce | 51
01 No (if
skip to
02 (Do not read) Refuse 97 (Do not read) Don’t know/Not sure 98
“no”
question 9b)
Yes 01 No (if “no” skip to question 9c) 02 (Do not read) Refuse 97 (Do not read) Don’t know/Not sure 98
97 (Do
Don’t know/Not sure 98
Refuse
not read)
know/Not
requiring
Middle-skill, training or education beyond
school,
or
sure
a 4-year degree or higher
high
but less than a 4-year degree Low-skill, requiring high school
less
(Do
Don’t
02 (Do not read) Refuse 97
not read)
know/Not sure 98
Yes 01 No (if “no” skip to question 9d) 02 (Do not read) Refuse 97 (Do not read) Don’t know/Not sure 98
Answers
total 100% Refuse = 97
MUST
High-skill,
Middle-skill, training
school, but
Low-skill, requiring high
less
___
or education beyond high
less than a 4-year degree
school or
Business Management function? Yes 01 No (if “no” skip to question 9e) 02 (Do not read) Refuse 97 (Do not read) Don’t know/Not sure 98
employ staff in the
Yes 01 No (if “no” skip to question 9e) 02 (Do not read) Refuse 97 (Do not read) Don’t know/Not sure 98
Skilled
Yes 01 No (if “no” skip to question 9f) 02 (Do not read) Refuse 97 (Do not read) Don’t know/Not sure 98
Do
the
Trades function?
9ee. (If employ staff in Skilled Trades function per Q.9e)
Are you seeing a shortage of skilled applicants in the Skilled Trades function?
Yes
9eee. (If seeing shortage of skilled applicants in the Skilled Trades unction per Q.9ee)
Please tell me the skill level of applicants required to meet your Skilled Trades skill shortages. Approximately what percentage of the shortages you are experiencing require high-skill applicants (those with a 4-year degree or higher); middle-skill applicants (training or education beyond high school, but less than a 4-year degree); and low-skill applicants (high school or less).
What percent of positions require ...
Answers MUST total 100%
Refuse = 97
Don’t know/Not sure = 98
High-skill, requiring a 4-year degree or higher
Middle-skill, training or education beyond high school, but less than a 4-year degree ___
Low-skill, requiring high school or less
9f. Do you employ staff in the Manufacturing, Production & Maintenance function? Yes
9gg. (If employ staff in Patient Care function per Q.8g)
Are you seeing a shortage of skilled applicants in the Patient Care function?
9ff. (If employ staff in Manufacturing, Production & Maintenance function per Q.9f)
Are you seeing a shortage of skilled applicants in the Manufacturing, Production & Maintenance function?
Yes
9fff. (If seeing shortage of skilled applicants in the Manufacturing, Production & Maintenance function per Q.8ff)
Please tell me the skill level of applicants required to meet your Manufacturing, Production & Maintenance skill shortages. Approximately what percentage of the shortages you are experiencing require high-skill applicants (those with a 4-year degree or higher); middle-skill applicants (training or education beyond high school, but less than a 4-year degree); and low-skill applicants (high school or less).
Refuse =
Don’t know/Not sure = 98
High-skill, requiring a 4-year degree or higher
a 4-year degree
9g. Do you employ staff in the Patient Care function?
Yes
9ggg. (If seeing shortage of skilled applicants in the Patient Care function per Q.9gg)
Please tell me the skill level of applicants required to meet your Patient Care skill shortages. Approximately what percentage of the shortages you are experiencing require high-skill applicants (those with a 4-year degree or higher); middle-skill applicants (training or education beyond high school, but less than a 4-year degree); and low-skill applicants (high school or less).
What percent of positions require ...
Answers MUST total 100%
Refuse = 97
Don’t know/Not sure = 98
High-skill, requiring a 4-year degree or higher
Middle-skill, training or education beyond high school, but less than a 4-year degree Low-skill, requiring high school or less
10. In your business, what percentage of your TOTAL positions requires each of the following levels of experience? What percent of positions require ...
Answers MUST total 100%
Refuse = 97
Don’t know/Not sure = 98
A minimum of 4 or more years of experience
A minimum of 1 to 3 years of experience
Some experience, but less than 1 year
No experience
11. In your business, what percentage of your TOTAL positions require each of the following levels of education as a minimum requirement? What percent of positions require...
Answers MUST total 100%
Refuse = 97
Don’t know/Not sure = 98
High-skill, requiring a 4-year degree or higher Middle-skill, training or education beyond high school, but less than a 4-year degree
Low-skill, requiring high school or less ___
12. What percentage of jobs in your business are available for individuals with industry relevant short-term training, meaning not more than 6 months
13. Do you offer any of the following work-based learning experiences for students and young adults?
52 | 2023 State of the St. Louis Workforce
01 No (if
skip to
02 (Do not read) Refuse 97 (Do not read) Don’t know/Not sure 98
“no”
question 9f)
01 No (if “no” skip to question 9g) 02 (Do not read) Refuse 97 (Do not read) Don’t know/Not sure 98
No (if
skip to question
02 (Do not read) Refuse 97 (Do not read) Don’t know/Not sure 98
01
“no”
9g)
What
Answers MUST total 100%
percent of positions require ...
97
Middle-skill, training or education
school,
requiring high school or less
beyond high
but less than
Low-skill,
01 No (if “no” skip to question
02 (Do not read) Refuse 97 (Do not read) Don’t know/Not sure 98
10)
Yes 01 No (if “no” skip to question 10) 02 (Do not read) Refuse 97 (Do not read) Don’t know/Not sure 98
No jobs 01 1 to 49% of jobs 02 50 to 100% of jobs 03 (Do not read) Refuse 97 (Do not read) Don’t know/Not sure 98
past high school?
(Do not read) Refuse 97 (Do not read) Don’t know/Not sure 98
16. What aspects of DEI – Diversity,
17. Which statement best describes your company’s position on hiring an applicant convicted of a felony offense who has completed their sentence and/ or probation?
18b.
you expect the number of your remote workers to increase, stay
19. Finally, we want to understand the characteristics that best define a “good” job. Please rank the importance of each of the following job characteristics on a
2023 State of the St. Louis Workforce | 53 13a. Paid internships Yes 01 No 02 13b. Unpaid internships Yes 01 No 02 13c. Career shadowing Yes 01 No 02 13d. Field trips Yes 01 No 02 13e. Classroom presentations Yes 01 No 02 13f. Youth apprenticeships Yes 01 No 02
(If 13a
learning experiences
students and young adults? Yes 01 No 02 14. Do you currently have partnerships with
the following organizations to help you source talent? (Do not read) Refuse 97 (Do not read) Don’t know/Not sure 98 14a. Job Centers or Workforce Investment Boards Yes 01 No 02 14b. School districts or individual K-12 schools Yes 01 No 02 14c. 2-year colleges Yes 01 No 02 14d. 4-year colleges Yes 01 No 02 14e. Training institutions Yes 01 No 02 14f. Nonprofit organizations Yes 01 No 02 14g. Missouri Department of Higher Education and Workforce Development Yes 01 No 02 14h. Other (please record) Yes 01 No 02 15. What percentage of jobs in your firm receives each of the following types of background checks prior to hire? Criminal check, percentage Financial check, percentage Drug screen, percentage eVerify check, percentage Social media check, percentage Professional license or certification check, percentage Check by an outside service, percentage
13g.
through 13f are all “No”) Would you be interested in offering work-based
for
any of
Equity,
Inclusion
business incorporate? (Do not read) Refuse 97 (Do not read) Don’t know/Not sure 98 16a. A DEI strategy or plan Yes 01 No 02 16b. An Equal Opportunity Employer notice in job postings Yes 01 No 02 16c. A DEI statement on your website or in a handbook Yes 01 No 02 16d. A DEI committee Yes 01 No 02 16e. Harassment or sensitivity course or training Yes 01 No 02
and
– does your
(Read list; single response only) Would not consider applicant for any position 01 Depends on the nature of the felony and the time since the offense 02 Would consider for some jobs but not for others 03 Would consider the applicant for any job for which they are qualified 04 (Do not read) Refuse 97 (Do not read) Don’t know/Not sure 98 18a. Do you currently have employees working remotely? Yes 01 No (if “no” skip to question 19) 02 (Do not read) Refuse 97 (Do not read) Don’t know/Not sure 98
Do
same, or decrease over the
12
Increase 01 Stay the same 02 Decrease 03 (Do not read) Refuse 97 (Do not read) Don’t know/Not sure 98
the
next
months?
5
1
5
(Do not read) Refuse 97 (Do not read) Don’t know/Not sure 98 Health insurance Pay rate Sense of purpose Accessibility Retirement plan Job stability Paid time off (vacation or sick leave) Flexibility Paid family leave Inclusiveness, a sense of belonging
1 to
scale where
is “not at all important” and
is “very important.”
Researched and developed by:

3221 McKelvey
Bridgeton, MO 63044
54 | 2023 State of the St. Louis Workforce
Rd.,


