
THE EXTENSIVE PIT BETWEEN
HOMERSFIELD AND FLIXTON, N.E. SUFFOLK HOWARD MOTTRAM
Introduction
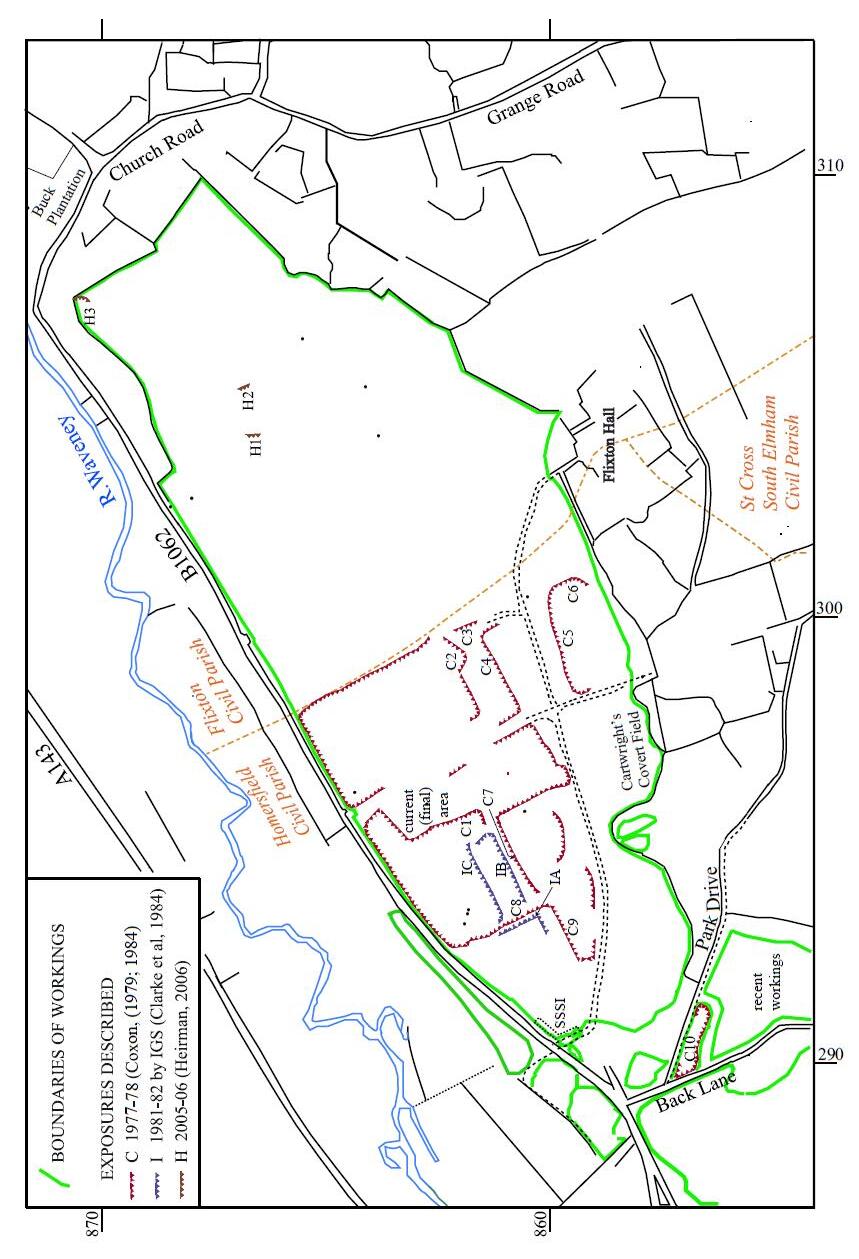
There are several pits in the area, the identification and working histories of which have recently been reviewed (Holt-Wilson, 2023). In the last 50 years, a lot of the extraction was focused on the land immediately south of the A143 (“Old Railway Road”), in the area between Back Lane in Homersfield and the western edge of Flixton village, a distance of 2.2km, see Fig. 1.
There have been a few records of what was exposed in these workings at different periods in time. Since much of the recorded details are unpublished and not accessible on-line, one of the objectives of this article is to bring together some of the information in an accessible format via The Transactions of the Suffolk Naturalists’ Society, initially in printed format and then on-line when the Transactions are uploaded into the ISSUU platform.
Although there is a lot of merit in using simple terms such as “Lower Gravels” or “Unit 1”, these terms have already been used by different authors and one author’s usage may not correspond with that of another author. Therefore, caution is required when reconciling the various accounts and, to try and avoid confusion, a simple, perhaps crude, system has been used here for the sediments that have been worked in the pit.
The Chalk
There are very few boreholes in the vicinity that reach down as far down as the Chalk but a couple of boreholes on the edge of the workings around TM 3025 8672 (BGS refs TM3NW69 and 70) recorded the top surface of the Chalk at about -6m OD.
“Basal Crag”
Sands that have been described as dark green, greyish green or even of blue-green colouration have been recorded from boreholes and sometimes from excavation. These sands were often shelly and they sometimes had mud bands and, more rarely, thin gravel layers (probably lags). As these sands were usually found below the water table1, useful details on the nature of the bedding and the palaeocurrent directions were not obtainable.
The Bottom Half of the Exploited Beds of Sands & Gravels
The “Basal Crag” was overlain by other granular sediments; - individual beds of sand and individual beds of mixed sand and gravel, all generally of a pale yellowish colour. Based largely on borehole records, these beds generally commenced at a level in the range of -2 to +2m OD but, in and around the recent workings between Back Lane and Park Drive, the commencement level was at up to +8m OD.
1 The use of the water table as a reference plane requires caution as the natural water table varied from a winter high of +11m OD in the west to a summer low of +9m OD in the east. Also, water could have been perched on areas of clay and, as there was pumping of water between the lagoons that had been created during mineral excavation and processing, the lagoon levels did not necessarily reflect the natural water table level at any location.
Suffolk Nat. Soc. 59 (2023)
In the exposures at C1 and C7 (for locations see Fig. 1), there was 1.5m of current bedded sand and gravel that had been cut into the top of some underlying till (Coxon, 1979). The current flow direction of the sand and gravel was eastwards (measured as 96∘). Above the latter at about +11m OD, was 1.5m of sand that thickened eastwards to 2.5m at exposures C2, C3 and C4. This prominent horizon of sands (“Flixton Sands”) consisted of current bedded sand that was mainly well sorted but with occasional coarse sand and some gravel (Coxon, 1979; 1984). Trough and planar cross-bedding, climbing ripple laminations and mud layers were also recorded. Palaeocurrent measurements indicated eastward flow (values of 58∘,92∘, and 111∘). These sands were cut into by cross-bedded channel infills 1.5 to 2.0m deep (Coxon, 1979, Fig. 54; 1984, Fig. 52). Low down in these sands, a mud bed with an organic content was seen when a QRA (Quaternary Research Association) field meeting visited the site in 1982, see Fig.s 2 and 3. Sampling of organic muds at an apparently higher level yielded hardly any pollen (Clarke et al., 1984). However, an organic mud examined a few years later yielded pollen and other plant material that indicated a temperate climate (Silva et al., 2007) considered to be of the warm type (Stringer, 2009).
At location H1, these, or similar, granular strata of 0.8m thickness were encountered and described (Heirman, 2006). Here, moderately sorted, fine sand graded up into matrix supported, poorly sorted, bimodal sand and gravel. This was overlain by till (see the next section on the low to mid level tills) which in turn was overlain by 1.7m of poorly to moderately sorted sand with some gravel. The lower part of this latter bed of sand was laminated while the upper part was cross-bedded by currents flowing towards the north or north-east.


Higher up at H1, but below a mid level till, there was very poorly sorted, matrix supported sand and gravel that had been scoured down into the underlying sands. Cobbles and boulders were present and lumps of till. The introduction of the chunks of till was accompanied by an upward increase in the proportion of chalk among the gravel clasts (see Appendix 1, Heirman’s Sub-Unit 4B).
The Low to Mid Level Tills
In the area west of C1 and north of C7, blue-grey till that was peppered with chalk pellets and other rock fragments was recorded as the base of that worked area (Coxon, 1979). The level of this surface is not clear, perhaps circa +10m OD. From one exposure it was seen to be at least 1.5m thick. The presence of this till may have been confirmed by chalky clay that was recorded in 3 closely spaced boreholes drilled in this area by the IGS in 1980 (BGS refs TM28NE13 to 15); possibly due to the restrictions of the drilling technique used (continuous flight augering), better correlation of the deeper levels encountered in the 3 boreholes was not possible.
At the QRA field meeting in 1982, this low level till was obscured by talus but another till was demonstrated at a mid level in the site. This mid level till was clearly persistent between estimated levels of +13 to +14m OD over a distance of about 200m in a face around from location C7, see Fig.s 2 and 3. It may have been the same sandy brown till that had been recorded at location IA between +12 and +14m OD and in a nearby borehole at TM 2934 8618 (BGS ref TM28NE15) between estimated levels
of +11 to +13m OD. At C2 and C3, chalky till occurred as lobes or lenses within channels of sand and gravel (Coxon, 1979; 1984). At an exposure in the recent workings between Back Lane and Park Drive, at around TM 292 855 (Holt-Wilson, 2023), till that was stony but not chalky was measured from +13 to +14m OD, while in some of the mineral exploration boreholes for this area, the till was recorded as only 0.1m thick (SCC Planning Portal ref W/15/5183/CC). Till was absent from these sorts of OD levels in mineral exploration boreholes in Cartwright’s Covert Field, (around TM 297 859, see SCC Planning Portal ref W/12/1190). However, it is possible that similar till was encountered in a borehole at TM 3004 8605 (BGS ref TM38NW23) where it may have been dismissed as overburden from +11 to +13m OD. Till was recorded from about +11 to +13m OD in the pair of boreholes around TM 3025 8672 (BGS refs TM3NW69 to 70) but mid level till was clearly absent from a borehole at TM 3040 8638 (BGS ref TM28NW21).
At H1 sandy brown till of only 0.4 to 0.7m thickness that had a massive structure was recorded (Heirman, 2006). This was low down in the exposure and as the till had been glacially disturbed, it was difficult to give a meaningful level for it, perhaps circa +11 to +12m OD. The till contained very few cobbles and gravel sized clasts were also uncommon. Of the clasts that did occur, flint was dominant with much smaller proportions of quartzose and chalk clasts. The clasts in this till had a bi-polar orientation, dipping down to the south-east and less so to the north-west. This and the microfabric (Heirman, 2006) were more akin to those of lodgement till (subglacial deforming bed/traction till).
Higher in the exposure at location H1, from about +14 to +16m OD, there was a further mid level till. The base of this till was particularly uneven and sometimes gradational from the underlying sand and gravel. It was described as light to dark grey, clayey and massive. It also contained very few cobbles and gravel sized clasts were also uncommon but of the clasts that did occur, chalk was dominant. There were some shell fragments but no far travelled clasts. The orientation of the clasts in the till at H1 showed a wide spread, from north-east through south-east to southwest. The macro and microfabrics and the presence of clasts of the till in the underlying sand and gravel suggested that this till could have been deposited from fluidised mud (sediment gravity flow till, Heirman, 2006).
At location IB, adjacent to Coxon’s exposures of “Flixton Sands”, the IGS recorded a localised development of laminated sandy mud about 0.75m thick, at around +14m OD. This may well have been a variant of till that had been even more distinctly water lain.
The Top Half of the Exploited Beds of Sands & Gravels
At location IA, alternating beds of sand and of mixed sand and gravel were recorded from +14 to +18m OD. These sediments exhibited variable sorting, the sands often being moderately poorly sorted while samples from beds of mixed sand and gravel could be very poorly sorted. The fabric of the gravelly beds ranged from matrix to clast supported. 130m away at location IB, from about +15m OD to +17m OD, there was a bed of sand and gravel in which the clasts were notably composed of angular flint and the bed was overlain by a bed of mud.
At C1 shattered nodular flint cobbles in a sand matrix were noted in a bed 2.0m thick (Coxon, 1979). This was succeeded by poorly sorted current bedded sand and gravel best seen at C7 and C4 but also at C5 and C6, some 3.0 to 4.0m thick. In the face at C8, palaeocurrents indicated flow to the east or east-south-east (measured as 89∘ and 109∘).
At H2, glacial disturbance and talus had once again made it difficult to determine the true thickness of the strata. Here some 1.4m of mainly clast supported sand and gravel was exposed. The sediments alternated from bands of coarse gravel to fine gravel. Among the clasts were very small proportions of Carboniferous chert and Carboniferous limestone.
At H3, there was 4.5m of sand with sand and gravel beds, all in the form of shallow channels. The gravelly beds were poorly sorted and varied from matrix to clast supported. The sands were usually medium grained and exhibited planar crossbedding but sometimes tangential cross-bedding. The flow was directed northeastwards. Again, among the clasts were very small proportions of Carboniferous chert and Carboniferous limestone.
Topmost Till
A borehole, some 1.2km south-east of the site on the higher plateau land at TM 3127 8528 (BGS ref TM38NW68), recorded the Lowestoft Till from about +22 to +42m OD. As much of the Homersfield/Flixton site lay below +20m OD, the Lowestoft Till may have been largely lost by erosion. However, thin, patchy developments of till were recorded from ground level in some of the mineral exploration boreholes for the recent workings between Back Lane and Park Drive (SCC Planning Portal ref W/15/5183/CC) and in exposures in the excavation there (Holt-Wilson, 2023). In basic agreement are the original Geological Survey 1:63,360 scale maps for 50NE and 66SE which showed that “Boulder Clay” only covered the southern parts of the site (the remapping by the IGS was unable to confirm this as much of the natural ground at the site had been disturbed by the time of remapping).
Discussion
The “Basal Crag” has often been attributed to the Norwich Crag. 15Km to the southeast of Homersfield/Flixton, in the Blyth Valley, sands of this nature sometimes occur at the base of undisputed Norwich Crag and so in the Blyth Valley area, at least, the basal greenish coloured sands probably are Norwich Crag and certainly cannot be the younger Wroxham Crag.
From a borehole survey centred some 20km to the north-east of Homersfield/ Flixton, the BGS assessed some clasts in the “Crag” (Hopson & Bridge, 1987). After removal of any shell material, the percentages of quartzose clasts (vein quartz plus quartzite rock) were intermediate between those for Norwich Crag and Wroxham Crag, see Table 1. However, the sizes of the clasts that were examined by the BGS were relatively small (8 to 4mm size range) and it has been known that the quartzose contents of samples may be notably different when larger clasts have been examined.
TABLE 1
COMPARATIVE CLAST ANALYSES FOR “BASAL CRAG”
Size mm Chalk % Quartzose % Flint %
Data from
16-8 0 7-62 34-91 Wroxham Crag (various sites - Rose et al., 2000)
16-8 0-trace 24-37 56-69
Wroxham Crag (Earsham - Holmes et al., 2018)
8-4 0 14-20 49-81 “Crag” (Hopson & Bridge, 1987).
16-8 0 3-13 87-97
16-8 0 3 95
Norwich Crag (Wangford - Clarke & Auton, 1984)
Norwich Crag (Wangford - Rose et al., 2000) percentages of other lithologies (cherts, igneous rocks etc) not shown
The granular sediments in both the Bottom Half and the Top Half of the Exploited Beds of Sands & Gravels at Homersfield/Flixton were very variable. They ranged from having been very poorly sorted to well sorted, and in beds of mixed sand and gravel, the sorting was sometimes bimodal. Also, the fabrics of beds of mixed sand and gravel varied from matrix to clast supported. These variable characteristics showed that the energy levels of the depositional environments varied significantly. Some beds contained chalk and till clasts and some beds were associated with bodies of till, all of which indicated that there must have been a distinct glacial input and the likelihood of some reworking of the underlying sediments. The glacial influences were also likely to have caused disturbance and contortions that were often seen in the sediments. The well sorted sands were originally thought to be fluvial (Coxon, 1979; 1982: Lawson, 1982) but they are typical of shallow nearshore marine sands such as those of the Norwich Crag’s Chillesford Beds and Westleton Beds. However, the association of the sands at this site with glacial outwash is more likely to indicate that they are Wroxham Crag as the ice sheets were much further north when the Norwich Crag was being deposited in the early Pleistocene (see Rea et al., 2018). This affiliation was previously alluded to some time ago (Rose, 2007) and similar sands at a pit in Earsham, 3km to the north-north-east, have been claimed to be Wroxham Crag (Candy et al., 2008).
The changing nature of the depositional environment was further confirmed by the relative proportions of quartzose and flint clasts, the great variabilities of which would have resulted from pronounced fluctuations in the supplies of coarse sediment. Nonetheless, the granular sediments in the Bottom Half and the Top Half of the Exploited Beds had overall similar ratios of quartzose, flint and chalk clasts. At H1, H2 and H3, the quartzose clasts in the Bottom Half were dominantly pallid whereas in the Top Half they were either, dominantly coloured, or equally coloured and pallid (Heirman, 2006); the higher ratio of coloured quartzites in the Top Half implied that a greater proportion were of Ingham/Bytham provenance. In contrast, in the recent workings between Back Lane and Park Drive, Holt-Wilson (2003) recorded that there was a greater proportion of coloured quartzites in his lower gravels. The non-opaque heavy mineral analyses, see Appendix 2, did not differentiate between the Top and Bottom halves. Therefore, the granular sediments in the Bottom Half and the Top Half of the Exploited Beds were very similar and were probably part of the same stratum.
Using a simple clast comparison with other granular sediments in the region, see Table 2, the Homersfield/Flixton granular sediments most closely resembled the glacial outwash known as the Coney Weston Sand and Gravel and the latter’s lateral equivalent, the Leet Hill Sand and Gravel.
TABLE 2 COMPARATIVE CLAST ANALYSES OF SANDS & GRAVELS
32-16 44 7 29
16-8 42 4 50
Aldeby S & G (Lee et al., 2008: Lee et al., 2016)
32-16 0-3 20-28 71-76 Leet Hill S & G (Lee et al., 2016)
16-8 1 13 80 Leet Hill S & G (Lee et al., 2008)
32-16 0-3 usually 0 9-29 av 12 64-88 av 83
16-8 0-4 usually 0 12-25 av 19 68-74 av 77
32-16 0-20 usually 0 0-20 av 9 60-96 av 81
16-8 0-28 usually 0 0-53 av 28 47-82 av 63
Homersfield/Flixton Top Half of Exploited Beds (see Appendix 1)
Homersfield/Flixton Bottom Half of Exploited Beds (see Appendix 1)
16-11 0-6 usually 0 2-26 usually <10 60-96 Coney Weston S & G (Lewis et al., 1999)
32-16 0 39 58 Kirby Cane S & G (Lee et al., 2008) percentages of other lithologies (cherts, igneous rocks etc) not shown
In the Lowestoft area, the Corton Till (“Norwich Brickearth”), was sometimes over 5m thick and it was persistently found over several km (Hopson & Bridge, 1987) suggesting that it was a fairly continuous sheet of till that formed at the base of the icesheet (subglacial till). Despite this generality, it has been proposed that parts of the Corton Till were deposited by meltwater at the base of the icesheet (subaqueous debris flow till) that resulted in bedded and laminated sandy sediments (Lee et al., 2004: Lee et al., 2015). At Knettishall, the Starston Till was only up to 2.5m thick (Lewis et al., 1999) but, even allowing for post-depositional glacial disturbance, it had not been deposited as a continuous planar sheet.
The bodies of till at Knettishall were interbedded with the Coney Weston Sands and Gravels (Lewis et al., 1999) and occurred as unconnected bodies at variable levels that could be stacked (see Lewis et al., 1999, Fig.s 3 and 4). In the Homersfield/Flixton area it was proposed that the Starston Till transitions into the laterally equivalent Corton Till (Lee et al., 2017, Fig. 7).
Both the Starston and Corton Tills were usually described as brown and sandy with no, or few, chalk pellets. However, it was also recognised that the Starston Till can sometimes have a significantly higher chalk content (Lee et al., 2004: Lee et al., 2016). The tills at Homersfield/Flixton were less quartzose and had a higher proportion of black flints than the Corton Till (see Table 3) and they had non-opaque heavy minerals with a slightly higher North Sea – Scotland provenance than the Starston Till at
TABLE 3
COMPARATIVE CLAST ANALYSES OF TILLS
16-8
8-4 75 4 7
32-16 91 0 9
Lowestoft Till at Leet Hill (Rose et al., 2000)
Lowestoft Till nr Ipswich (from Allen, 1984)
Homersfield/Flixton – mid level till Heirman’s Sub-Unit 5 16-8
32-16 0
16-8 4 4 82
8-4 10 13 61 16-8 2 11 68
8-4 2 13 64
16-8 trace 27 63
8-4 trace 32 54
Homersfield/Flixton – low level till Heirman’s Sub-Unit 2A
Corton Till (Lee et al., 2008b)
Corton Till (“Norwich Brickearth”) (Hopson & Bridge, 1987)
percentages of other lithologies (cherts, igneous rocks etc) not shown above
8-4 91 9 Lowestoft Till (Lee et al., 2004)
32-16 0 100
16-8 37 63
8-4 25
32-16 50 50
16-8 24 76 8-4 17 83
16-8 2
8-4 8
16-8 31
8-4 40
Homersfield/Flixton – mid level till Heirman’s Sub-Unit 5
Homersfield/Flixton – low level till Heirman’s Sub-Unit 2A
Corton Till at Happisburgh (Lee et al., 2008b)
Happisburgh Till at Happisburgh (Lee et al., 2008b)
it is assumed that;black (and grey) flints were “freshly” obtained from the Chalk bedrock other flints (brown, white and chattermarked) were recycled following exhumation from the immediately underlying Paleogene and Pleistocene deposits
Knettishall. These characteristics possibly reflected that when the North Sea Ice Sheet was active and progressing southwards, that the location of Homersfield/Flixton was mid-way between Knettishall, which was down drift of exposed Chalk bedrock with flints, and Corton, which was down drift of sandy Crag sediments.
As some tills that occurred at low to mid levels in the Homersfield/Flixton site contained chalk pellets, this chalk content suggested that widespread decalcification had not occurred. However, the finer grained calcium carbonate in their matrixes would have been more susceptible to decalcification and as the matrixes of the low to
mid level tills were much lower in calcium carbonate than for Lowestoft Till, see Table 4, it is possible that selective decalcification of only fine-grained calcium carbonate did occur. Therefore, those brown sandy tills that currently do not contain chalk pellets, probably never did contain chalk pellets.
TABLE 4
% Brief Description
CALCIUM CARBONATE IN MATRIX (% BY WEIGHT)
Data from
32 grey, lots of chalk pellets
13 grey, lots of chalk pellets
13 brown, a few chalk pellets
12 brown, sandy
8 brown, sandy
Lowestoft Till (Lee et al., 2004)
Homersfield/Flixton – mid level till – Heirman’s Sub-Unit 5
Homersfield/Flixton – low level till – Heirman’s Sub-Unit 2A
Happisburgh Till (Lee et al., 2004)
Corton Till (Lee et al., 2004)
calcium carbonate in the matrix of tills in the region is usually comminuted chalk but can include other limestones, especially Jurassic limestones, and shells the Happisburgh Till has also been described as dark grey and with lots of flint, chalk and shell clasts (Lee et al., 2015)
Conclusions
The lowest beds that had occasionally been seen at the site were greenish, sometimes shelly, sands. Referred to as “Basal Crag” in this article, they probably represent the transgressive phase of one of the cycles of the Norwich Crag, possibly the Chillesford Beds.
The succeeding sands and gravels were deposited under fluctuating conditions. Initially they may have started to accumulate under shallow marine conditions in the North Sea, as manifested by well sorted sands. These marine deposits may be Wroxham Crag. Only limited palaeocurrent data was collected and, rather than confirming the shore parallel current directions noted at Earsham (Candy et al., 2008; Holmes et al., 2018), the data indicated offshore directed flow, perhaps associated with an inlet or estuary.
The marine régime was disrupted by the energetic inflows of glacial meltwater that resulted in beds of often poorly sorted sands and gravels of variable composition and sedimentology. Glacial outwash deposits are variable in their composition and bedding characteristics. It is likely that these latter granular sediments at the site are part of a fairly widespread deposit and, that at the site, they are geographically intermediate between the laterally equivalent Coney Weston Sands and Gravels and the Leet Hill Sands and Gravels. In conjunction with these proximal outwash sands and gravels there are occasional bodies of flow or lodgement till that are intermediate in composition between the laterally equivalent Starston Till and the Corton Till.
A final till forms a scanty capping in some parts of the site. This represents the regionally widespread Lowestoft Till that had usually been emplaced as a lodgement (subglacial traction) till from the British & Irish Ice Sheet.
Acknowledgements
Thanks are due to Martin Sanford for assisting with maps and aerial images and to Tim Holt-Wilson for providing access to old aerial photographs and for sharing his knowledge on the site.
References
Candy, I., Holmes, P., Rose, J., & Lee, J. R. (2008). Earsham (TM 313 888): Wroxham Crag deposits. in Candy, I., Lee, J. R., Harrison, A. M. (Eds.), The Quaternary of Northern East Anglia Field Guide. Quaternary Research Association, pp. 97–101.
Clarke, M. R. & Auton, C. The early Pleistocene deposits of the Lower Waveney Valley. in Allen, P. (ed), (1984). Field Guide (revised edition, October 1984) to the Gipping and Waveney Valleys, Suffolk. Quaternary Research Association, Cambridge, pp. 108–110.
Clarke, M. R., Wilcox, C. J. & Horton, A. The terraces of the River Waveney – ii Flixton Quarry – Investigations post-1979. in Allen, P. (ed), (1984). Field Guide (revised edition, October 1984) to the Gipping and Waveney Valleys, Suffolk. Quaternary Research Association, Cambridge, pp. 86– 88.
Coxon, P., (1979). Pleistocene environmental history in central East Anglia. Ph.D thesis. University of Cambridge.
Coxon, P. The terraces of the River Waveney – ii Flixton Quarry – Investigations pre1979. in Allen, P. (ed), (1984). Field Guide (revised edition, October 1984) to the Gipping and Waveney Valleys, Suffolk. Quaternary Research Association, Cambridge, pp. 80–86
Heirman, K. (2006). Early and middle Pleistocene sedimentology and lithostratigraphy at Flixton, northern Suffolk, UK. Unpub MSc thesis, Royal Holloway, University of London.
Holmes, P., Rose, J., Lee, J., Barendgret, R., Candy, I., Riding, J. B. & Lewis, M. (2018). The Middle Pleistocene terraces of the central Waveney valley. Proceedings of the Geologists’ Association, 129: 70–88.
Holt-Wilson, T. (2023). Two late Pleistocene Hippopotamus bones from the Waveney Valley, with a review of Pleistocene vertebrate sites around Harleston, south Norfolk. Bulletin of the Geological Society of Norfolk, 73: 9–83.
Hopson, P. M. & Bridge, D. M. (1987). Middle Pleistocene stratigraphy in the lower Waveney valley, east Anglia, Proceedings of the Geologists’ Association, 98: 171–185. Lawson, T. E. (1982). Geological notes and local details for 10,000 sheets TM28NW, NE, SE & SW Harleston, Norfolk. Institute of Geological Sciences, Keyworth.
Lee. J. R., Bateman, M. D. & Hitchens, S. (2015). Pleistocene glacial and periglacial geology. in Lee, J. R., Woods, M. A. & Moorlock, B. S. P. (eds). British Regional Geology: East Anglia (5th edition). British Geological Survey, Keyworth. pp. 146–171.
Lee, J. R., Booth, S. J., Hamblin, R. J. O., Jarrow, A. M., Kessler, H., Moorlock, B. S. P., Morigi, A. N., Palmer, A., Pawley, S. M., Riding, J. B. & Rose, J. (2004). A new stratigraphy for the glacial deposits around Lowestoft, Great Yarmouth, North Walsham and Cromer, East Anglia, UK. Bulletin of the Geological Society of Norfolk, 53: 3–60.
Lee, J. R., Phillips, E., Rose, J. Vaughan-Hirsch, J. (2016). The Middle Pleistocene glacial evolution of northern East Anglia, UK: a dynamic tectonostratigraphic–parasequence approach. Journal of Quaternary Science 32: 231–260.
Lee, J. R., Rose, J., Candy, I., Moorlock, B. S. P. & Hamblin, R. J. O. (2008a). Leet Hill (TM 384 926); pre-Anglian Bytham river and Glaciofluvial outwash sedimentation. in Candy, I., Lee, J. R. & Harrison, A. M. (eds). The Quaternary of northern East Anglia: field guide. Quaternary Research Association. pp. 102–113.
Lee, J. R., Rose, J., Riding, J. B., Moorlock, B. S. P. & Hamblin, R. J. O. (2008b). Happisburgh Cliffs (TG 380 312): glacial lithostratigraphy, till provenance and icemarginal deposits. in Candy, I., Lee, J. R. & Harrison, A. M. (eds). The Quaternary of northern East Anglia: field guide. Quaternary Research Association, pp. 137–150.
Lewis, S. G., Rose, J. & Davies, H. (1999). Pre-Anglian fluvial and Anglian glaciogenic sediments, Knettishall, Suffolk, England. Proceedings of the Geologists' Association, 110: 17–32.
Moorlock, B. S. P., Hamblin, R. J. O., Booth, S. J. & Morigi, A. N. (2000). Geology of the country around Lowestoft and Saxmundham. Memoir of the British Geological Survey, Sheets 176 and 191 (England and Wales). British Geological Survey, Keyworth.
Rea, B. R., Newton, A. M. W., Lamb, R. M., Harding, R., Bigg, G. R., Rose, P., Spagnolo, M., Huuse, M., Cater, J. M. L., Archer, S., Buckley, F. Halliyeva, M., Huuse, J., Cornwell, S. G. Brocklehurst, S. H. & Howell, J. A. (2018). Extensive marineterminating ice sheets in Europe from 2.5 million years ago. Science Advances 4(6). https://www.science.org/doi/10.1126/sciadv.aar8327.
Rose, J. (2007). The stratigraphy at Fakenham Magna and Flixton: AHOB sites in East Anglia. in Stringer C. & Bello, S. (eds). First workshop of the Ancient Human Occupation of Britain and its European context. AHOB, London, pp. 10–12.
Rose, J., Candy, I. & Lee, J. R. (1991). Leet Hill (TM 384 926): pre-glacial and Glaciofluvial river deposits – with possible evidence for a major glaciation prior to the deposition of the Lowestoft Till. in Lewis, S. G., Whiteman, C. A. & Preece, R. C. (eds). The Quaternary of Norfolk & Suffolk: field guide. Quaternary Research Association, pp. 207–217.
Rose, J., Moorlock, B. S. P. & Hamblin, R. J. O. (2000). Lithostratigraphy and palaeoenvironments of the pre-Anglian sands and gravels of East Anglia. in Lewis, S. G., Whiteman, C. A. & Preece, R. C. (eds). The Quaternary of Norfolk & Suffolk: field guide. Quaternary Research Association, pp. 35–45.
Rose, J. (2007). The stratigraphy at Fakenham Magna and Flixton: AHOB sites in East Anglia. in Stringer C. & Bello, S. (eds). First workshop of the Ancient Human Occupation of Britain and its European context. AHOB, London, pp. 10–12.
Silva, B., Schreve, D., Candy, I., White, M. & Rose, J. (2007). Early Middle Pleistocene Landscapes of Suffolk: The Environmental Archaeology of Flixton Quarry. In Stringer C. & Bello, S. (eds). First workshop of the Ancient Human Occupation of Britain and its European context. AHOB, London, pp. 12.
Stringer, C. (2009). The changing landscapes of the earliest human occupation of Britain and Europe. Developments in Quaternary Science, 14: 1–10.
H.B. Mottram salhow@talktalk.net
(2023)
APPENDIX 1 CLAST ANALYSES OF SANDS & GRAVELS
Size mm Chalk % Quartzose % Flint %
32-16 0 15 82
16-8 0 19 78
32-16 0 9 82
16-8 1 17 80
32-16 3 9 83
16-8 1 17 80
32-16 0 9 86
16-8 <1 22 74
32-16 0 17 83
16-8 4 24 68
32-16 0 17 83
16-8 0 12 84
8-4 <1 25 67
32-16 0 29 64
16-8 0 19 78
32-16 0 10 88
16-8 0 20 76
Data from
Heirman’s Sub-Unit 8M
Heirman’s Sub-Unit 8G
Heirman’s Sub-Unit 8D
Heirman’s Sub-Unit 8A
Heirman’s Sub-Unit 7B
Heirman’s Sub-Unit 6D
Heirman’s Sub-Unit 6B
Heirman’s Sub-Unit 6A
32-8 0 11 85 Coxon’s Upper S & G - east - sample 12
32-8 0 9 88 Coxon’s Upper S & G - east - sample 11
32-8 0 14 81 Coxon’s Upper S & G - east - sample 2
32-8 trace 11 85 Coxon’s Upper S & G - east - sample 3
16-8 0 19 81 IGS’s Upper Gravel - face IA - sample Ton 7
16-8 0 25 75 IGS’s Upper Gravel - face IA - sample Ton 8 16-8 1 23 74 IGS’s Upper Gravel - face IA - sample Ton 9
32-8 0-trace 36-38 57-59 IGS’s Homersfield Terrace
32-8 0 12 84 Coxon’s Upper S & G - central - sample 6
32-8 0 11 88 Coxon’s Upper S & G - central - sample 4
32-8 0 23 76 Coxon’s Upper S & G - west - sample 10
32-8 0 4 94 Coxon’s Upper S & G - west - sample 9
32-8 0 11 87 Coxon’s Upper S & G - west - sample 8
32-8 trace 11 85 Coxon’s Upper S & G - west - sample 7
32-8 trace 11 85 Coxon’s Upper S & G - west - sample 5
32-16 0 16 79 Holt-Wilson’s Upper Sands & Gravels - 1
APPENDIX 1
(cont)
CLAST ANALYSES OF SANDS & GRAVELS
from 32-16 20 20
16-8 28 16
’
’s Sub-Unit 4B BOTTOM
-4 10 13
32-16 0 11
’s Sub-Unit 1B 16-8 0 14 78
32-8 0 3 96 Coxon’s Lower S & G - east - sample 1
16-8 0 53 47 IGS’s Lower Gravel - face IB - sample Ton 3
16-8 0 40 60 IGS’s Lower Gravel - face IC - sample Ton 2
16-8 0 40 59 IGS’s Lower Gravel - face IC - sample Ton 1
16-8 0 44 53 IGS’s Lower Gravel - face IA - sample Ton 6
16-8 6 15 73 Holt-Wilson’s Lower Sands & Gravels - 3
16-8 0 32 55 Holt-Wilson’s Lower Sands & Gravels - 2
Coxon’s west relates to faces C8, C9 & C10, central relates to C1 & C7, east to C2, C3, C4, C5 & C6 percentages of other lithologies (cherts, igneous rocks etc) not shown
APPENDIX 2
North
Ingham/Bytham
stauralite,
North
Scotland amphiboles, epidote, apatite, pyroxenes, micas
Ingham/Bytham catchment only stauralite, kyanite, rutile
Thames and/or Ingham/Bytham zircon, tourmaline