ECOLOGY AND WATER HOLDINGS REDISTRIBUTION


Northern Murray-Darling Basin in Queensland
 Prepared by : Huayang Sun 21 July 2022
RMIT University Landscape Architecture
Seminar Leader: Dr Ata Tara Flexibel Semester 2022
Liberating Digital Design Research Seminar
Population Distribution
Water Holdings Distribution Importance of Water Holding
Regulated Vegetation Endangered and Of Concern Agricultural Form Land Use Form Basic Geographical Conditions
Hydrology System and Vegetation Nearby Wildlife Habitat Distribution
Mobility and Connectivity Indigenous Land Estate
Hydrology, Vegetation, and Wildlife Habitat
Transportation System and Hydrology Agricultural Land Use, Vegetation, and Wetland
Potential Wildlife Habitat
Potential Indigenous Watering Place
Native Vegetation Buffer Development
The Biodiversity Network and Indigenous Watering Place
RMIT University Landscape Architecture
Design Research Seminar - Liberating Digital Seminar Leader: Dr Ata Tara Flexible Semester 2022
2 Content
Indigenous
21 - 22 20 19 18 17 16 15 14 13 12 11 10 09 08 07 06 05 04 03 Conclusion 23 Generation Relationship Composition Background Introduction
CONTEXT
This design research explores the redistribution of land use and surface water holdings in the Northern Murray-Darling Basin, Queensland. It attempts to establish a criterion to identify the potential natural patches and Indigenous cultural flow locations to make the Murray-Darling Basin sustainable. This visual essay contains a series of maps, spatial analysis, and data visualizations. All the data used in this document are from Australian government data websites and ArcGIS Online and visualized in ArcMap and ArcScene. Collecting, composing, relating, interpreting, and generating are used to achieve the ambition in this document.
FOCUS: LAND USE AND SURFACE WATER REDISTRIBUTION
For Aboriginal people, water is sacred and vital not only for meeting daily needs but also for their spirituality, social, and economic wellbeing. It is considered part of their commitment to caring for Country.
However, the surface water distribution is still quite unequal in Murray-Darling Basin (MDB). Across this area, at least 30 Aboriginal entities hold a mere 0.12% of the whole Basin’s equivalent take Baseline Diversion Limit (BDL) of the Basin (including Victoria). There are even no Aboriginal entities holding water in the Australian Capital Territory (ACT) and Queensland (QLD).
Several factors make the surface water holdings very limited. First, most Aboriginal lands have been occupied and dispossessed by British colonists, and the water rights were attached to the land rights. Second, land restitution processes limited the amount of irrigable land available for Aboriginal people to claim. In addition, governments ignored Aboriginal people when making decisions about water and when building the water-based economy.
In recent years, some research and initiative have been developed as a response to dispossession and exclusion from water governance, such as the Cultural Flow and the
Aboriginal Water Initiative (AWI) in New South Wales. In addition, these theories argue that it is crucial to consider both the Traditional Aboriginal knowledge (TAK) and Western Science to establish the water holding system.
This topic also raises another crucial issue in the Basin, which is to consider the land ownership between farm and wildlife habitat because one of the most important values of cultural flow is biodiversity. By establishing forest fragments as endangered wildlife refuges, the agriculture in this area becomes more regenerative and sustainable in long term.
METHODOLOGY/TECHNIQUES/ METHODS
By setting up a criterion based on literature review, various data is collected, visualized, related, and overlayed in ArcMap. Some overlays are created in ArcScene making sure they are clear and provocative.
Cultural Flow
“Cultural Flows” are water entitlements that are legally and beneficially owned by the Indigenous Nations of a sufficient and adequate quantity and quality to improve the spiritual, cultural, environmental, social and economic conditions of those Indigenous Nations. This is our inherent right. (MLDRIN, 2010)
Watering place
The watering place is defined as the physical location (site) to receive the cultural flow within Country. (Cultural Flows - A Guide for First Nations)
Including
River
Wetland Floodplain
Reflected by Reflected by
‘Aboriginal organisations hold 0.556 GL of groundwater entitlements, which equates to 0.022% of the available groundwater resource across the whole Basin.’ (Hartwig et al. 2020:vii)
Presented by Water Holdings by First Nations Water Holdings Distribution in MDB
‘Aboriginal organisations hold 0.556 GL of groundwater entitlements, which equates to 0.022% of the available groundwater resource across the whole Basin.’ (Hartwig et al. 2020:vii)
Vegetation Diversity
Waterbird Diversity
Fish Diversity Water Quality and Hydrological Connectivity
Wildlife Habitat Redistribution
3
Traditional Aboriginal Knowledge (TAK) Valued by Western Science
Forest Fragments Hedgerows Vegetation Buffers
Introduction
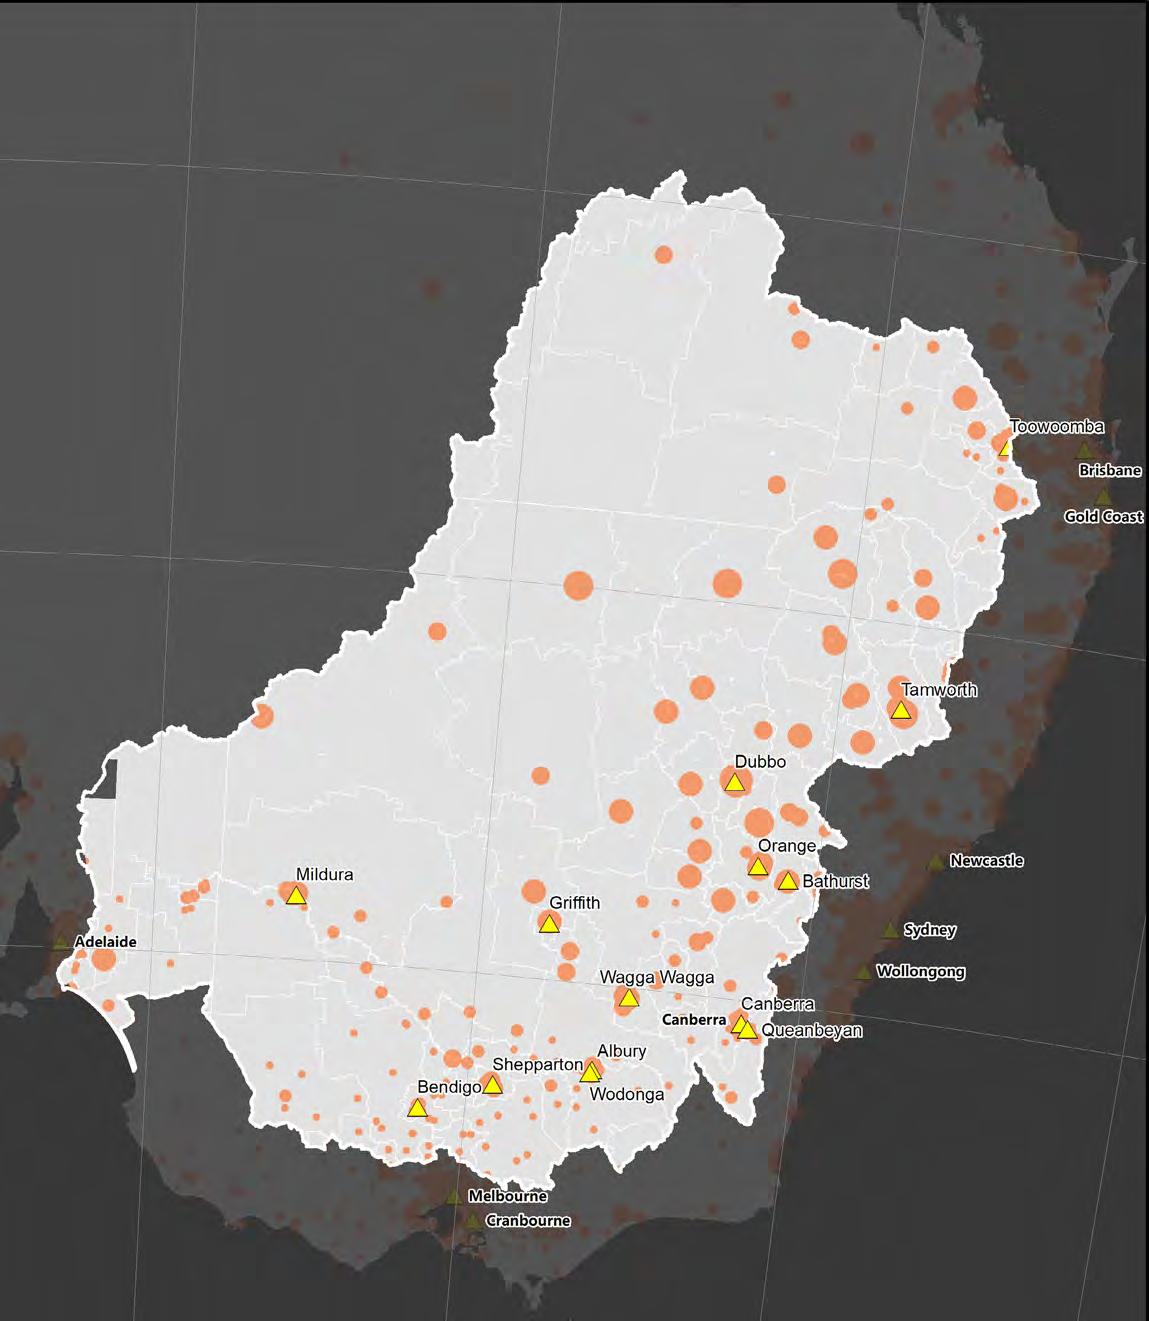
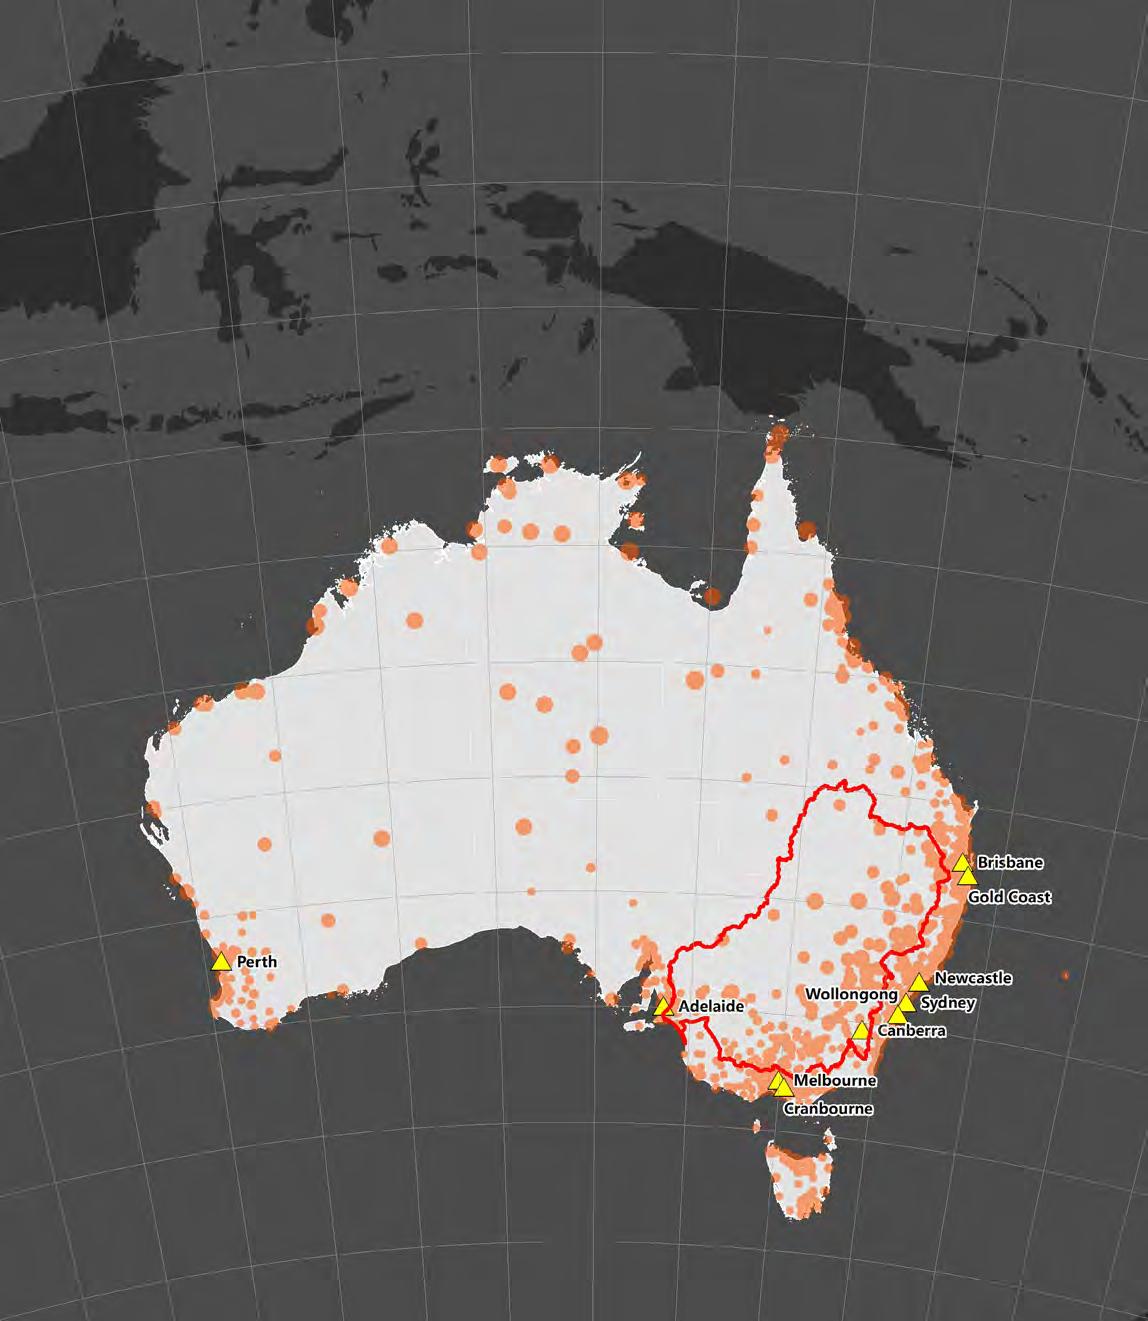
4 120°0’0’’ E 120°0’0’’ E 130°0’0’’ E 130°0’0’’ E 140°0’0’’ E 140°0’0’’ E 140°0’0’’ E 150°0’0’’ E 150°0’0’’ E 155°0’0’’ E 145°0’0’’ E 145°0’0’’ E 140°0’0’’ E 40°0’0’’ S 30°0’0’’ S 25°0’0’’ S 35°0’0’’ S 40°0’0’’ S 30°0’0’’ S 30°0’0’’ S 20°0’0’’ S 20°0’0’’ S 10°0’0’’ S 0°0’0’’ 10°0’0’’ S 0°0’0’’ 150°0’0’’ E 150°0’0’’ E 160°0’0’’ E 110°0’0’’ E 0 - 220 0 - 220 Major Cities Major Cities Boundary of Murray-Darling Basin Boundary of Indigenous Locations Aboriginal Population Aboriginal Population Legend Legend 221 - 516 221 - 516 517 - 977 517 - 977 978 - 1863 978 - 1863 1864 - 3652 1864 - 3652 3653 - 8069 3653 - 8069 N N 0200400800 Km 050100200 Km Mapping Question: What is the current distribution of Aboriginal people in Australia? Data Sources: Australian Bureau of Statistics, Estimated resident Aboriginal and Torres Strait Islander Populations, SA2, 30 June 2016; Australian Bureau of Statistics, Australian Statistical Geography Standard
Edition 3, Indigenous Locations, 2021. Findings: Most of the Aboriginal and Torres Strait Islander population distributes along the west-south and east-south coastline, and most of them live in major cities, such as Melbourne, Brisbane, Perth, etc. Aboriginal population densities are relatively high in northeastern New South Wales and the north coast west of the Gulf of Carpentaria. A similar trend can be found in Murray-Darling Basin: the inner regions, the lower population density. Background Indigenous Population Distribution
(ASGS)
Mapping Question: Why water holding is vital for First Nation people?
Data Sources:
National distribution and typology map of Indigenous watercraft by David Payne, Australian National Maritime Museum;
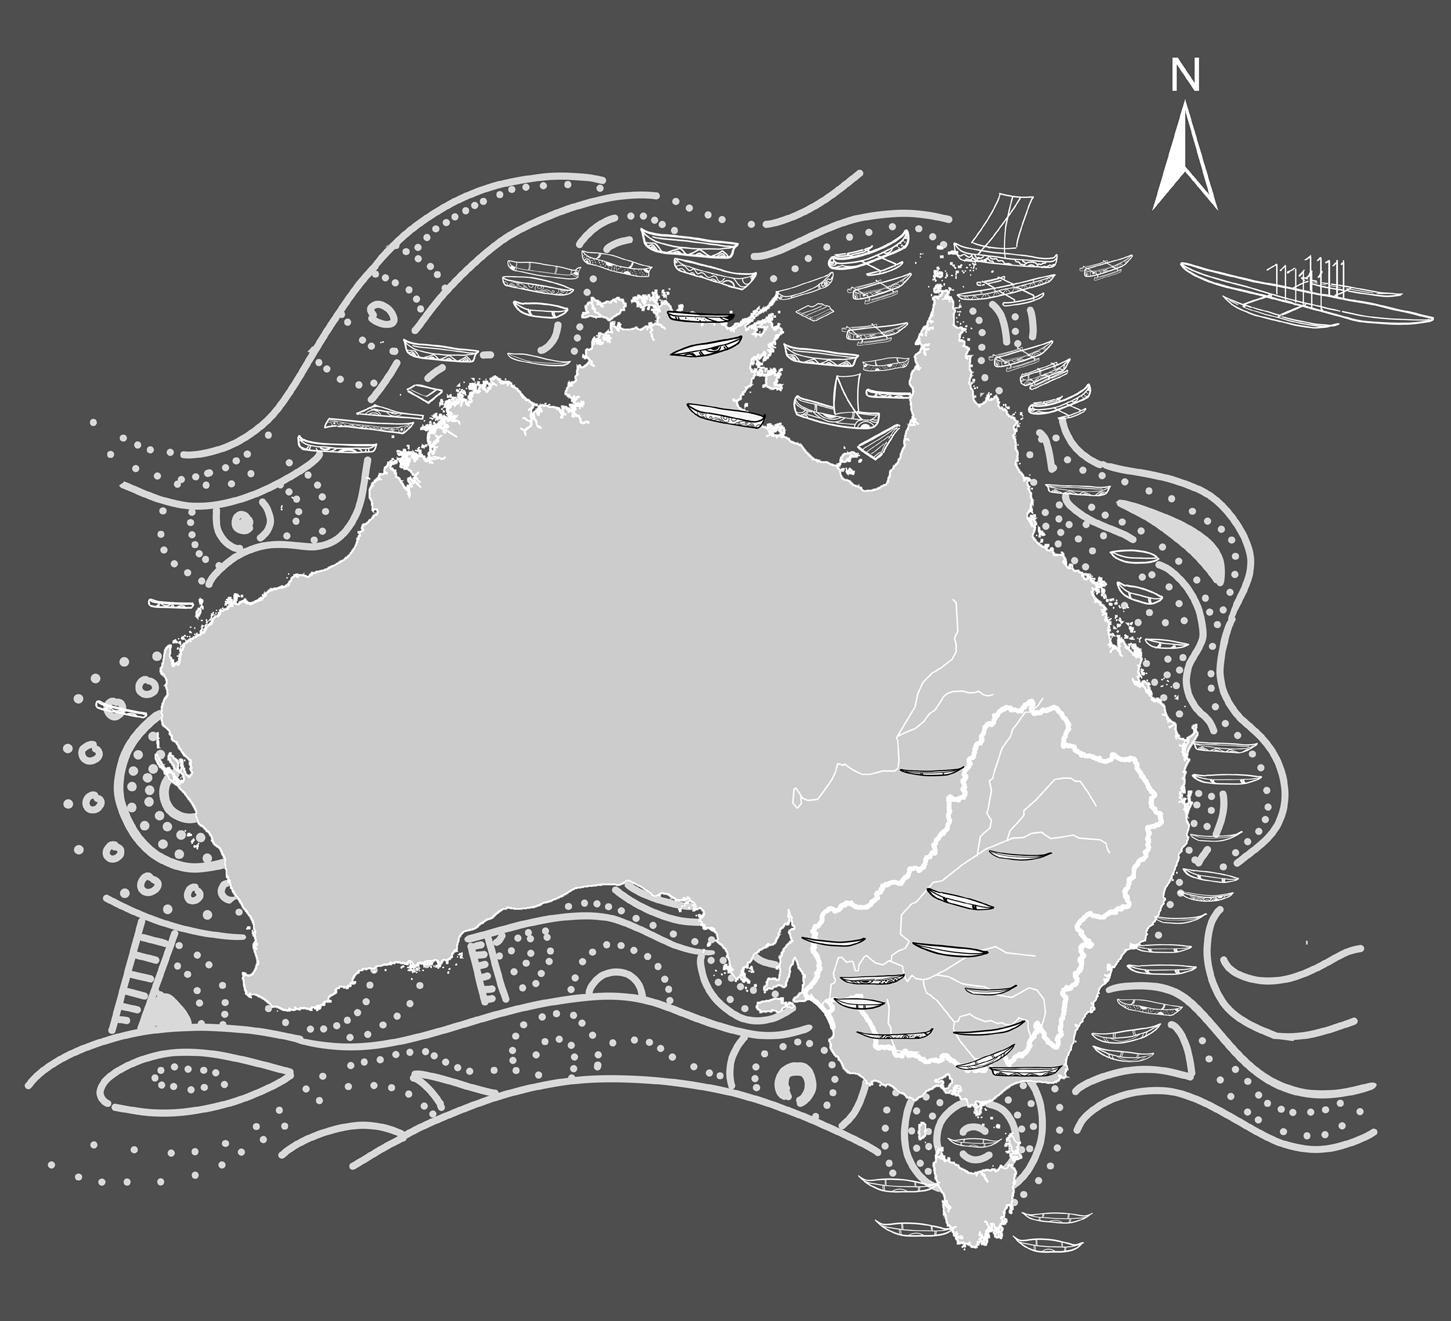
Cultural Flows - a Guide for First Nations, The Murray–Darling Basin Authority.
Cultural Outcomes
Culturally significant species
Crustacean - Marron, Crayfish, Yabby, etc.
Waterbirds - Black Swan, White Ibis, etc.
Vegetation - Common Reed, Lignum, Box Tree, etc.
Fulfilling Cultural
Obligations
to look after water and share it in a pure state down the river complex, and has done so using ceremony and the deep knowledge passed down through the generations.
Cultural Flows - A Guide for First Nations
Plants & animals (hunting and fishing) for food & medicine
Drying and wetting cycles
Seasonally dry wetlands; Semi-dry wetlands
Being and working on Country The Connection between river & floodplain
Waterbird breeding & nesting sites
Refuge for birds and other species
Bugs provide food for other animals (like frogs) Background
Importance of Water Holding
Ecological Outcomes
Wetland as Watering Place
Findings: Apart from daily use, the water system plays a crucial role in their social and cultural economy and well-being. The water system likes the critical organs of our body: rivers are veins that bring the very fundamental life-related element, water, to every part of this continent and Country; wetlands (swamps, marshes, etc.) are the kidneys, filtering the water system and keep the health of Country.
5
Harvesting Lignum growth & reproduction
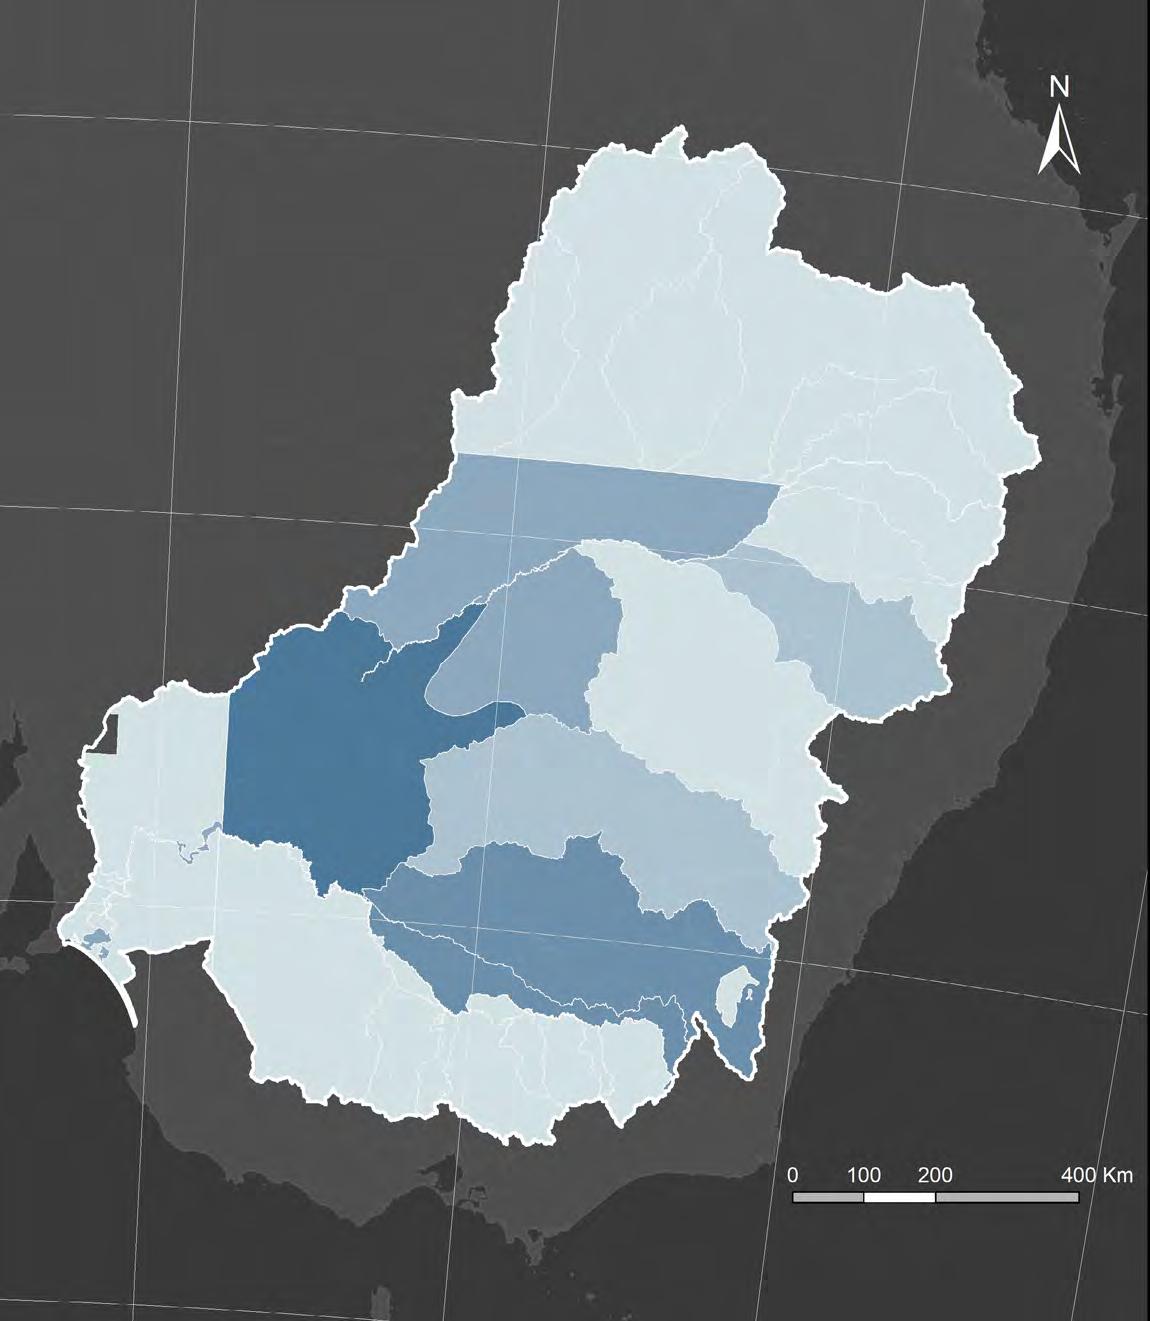
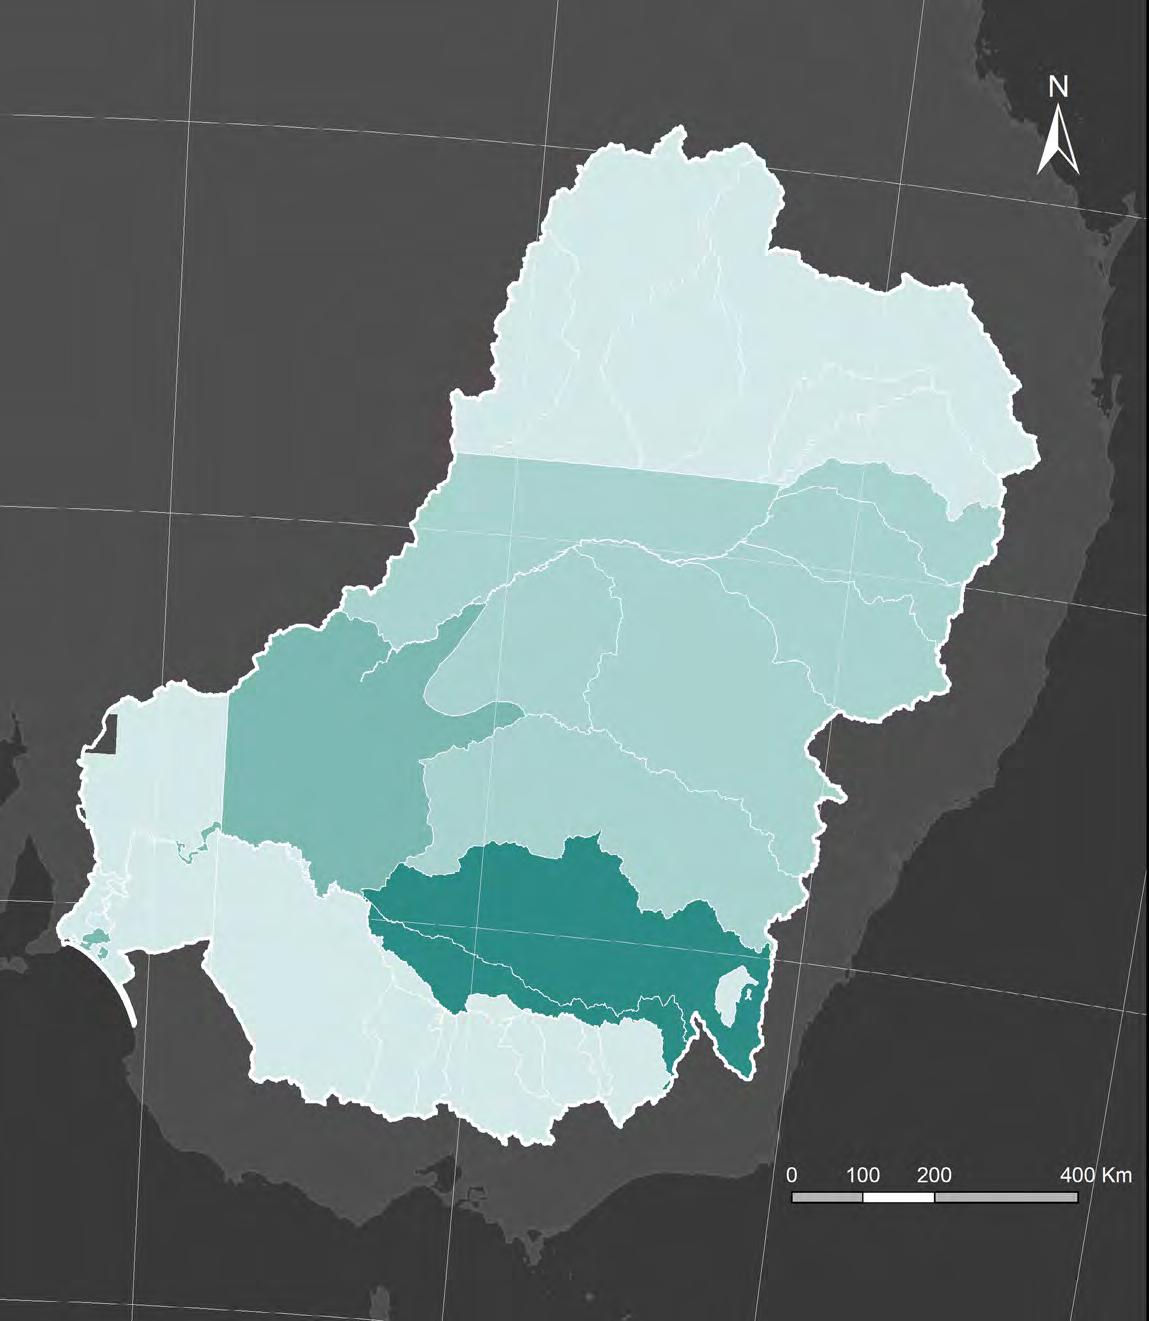
6 0.000 - 0.010 0.000 0.020 - 0.080 0.001 - 0.227 0.090 - 0.140 0.228 - 0.902 0.150 - 0.250 0.903 - 2.348 0.260 - 1.640 2.349 - 4.225 Legend Legend Aboriginal % of total Baseline Diversion Limit(BDL) water holdings (%) Lower Darling Lower Darling Murrumbidgee Lachlan Intersecting Streams Intersecting Streams Namoi Namoi MacquarieCastlereagh Lachlan New South Wales Murray Murrumbidgee South Australian Murray Gwydir NSW Border Rivers Aboriginal water holdings (standardised) (GL/y) 35°0’0’’ S 35°0’0’’ S 35°0’0’’ S 30°0’0’’ S 30°0’0’’ S 30°0’0’’ S 25°0’0’’ S 25°0’0’’ S 25°0’0’’ S 140°0’0’’ E 140°0’0’’ E 150°0’0’’ E 150°0’0’’ E 155°0’0’’ E 155°0’0’’ E 145°0’0’’ E 145°0’0’’ E Mapping Question: How much surface water is Indigenous people holding? How is this water distributed? Data Sources: The status of Aboriginal water holdings in the Murray-Darling Basin. ARI Report No. 2020/004. Australian Rivers Institute, Griffith University, Australia. Surface Water SDL Resource Units, ANZLIC the Spatial Information Council Findings: - Aboriginal entities hold a mere 0.17% of the available surface water in this area, while the Indigenous population contributes 5.3% of the total in MDB. - Most of the surface water which Indigenous people hold is located in the NSW (93.9%). There are no Aboriginal entities holding water in the Australian Capital Territory (ACT) and Queensland (QLD). - The first Zoom-in: the north basin in QLD. Background Water Holdings Distribution
Data Sources:
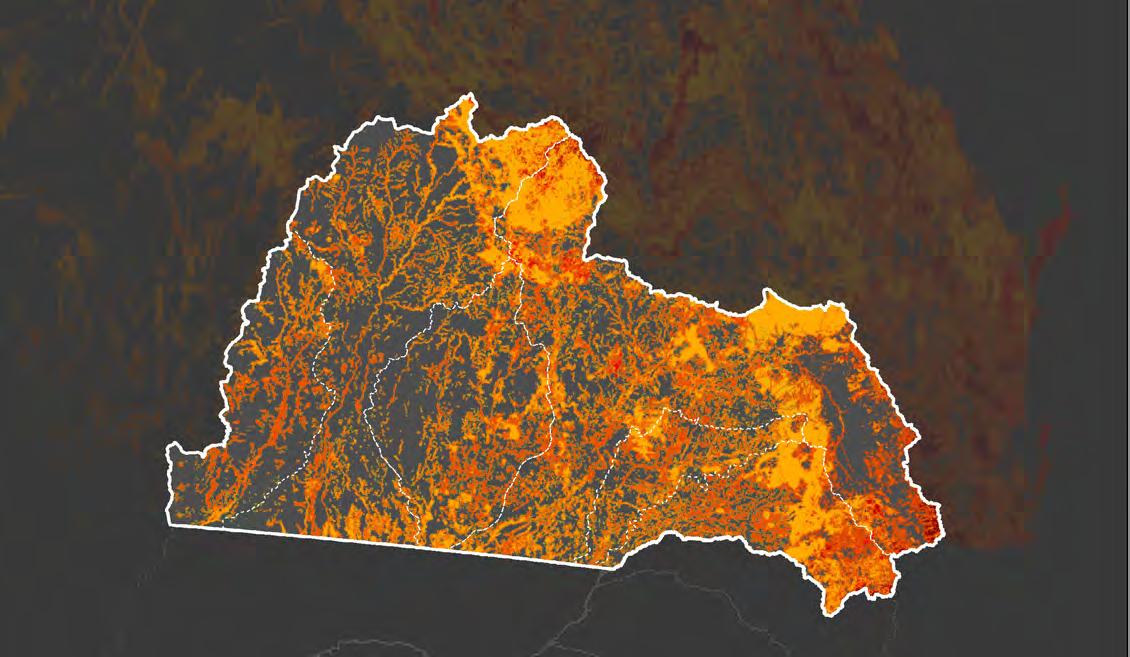
Bushfire Prone Area, July 2017, Queensland, ArcGIS online.

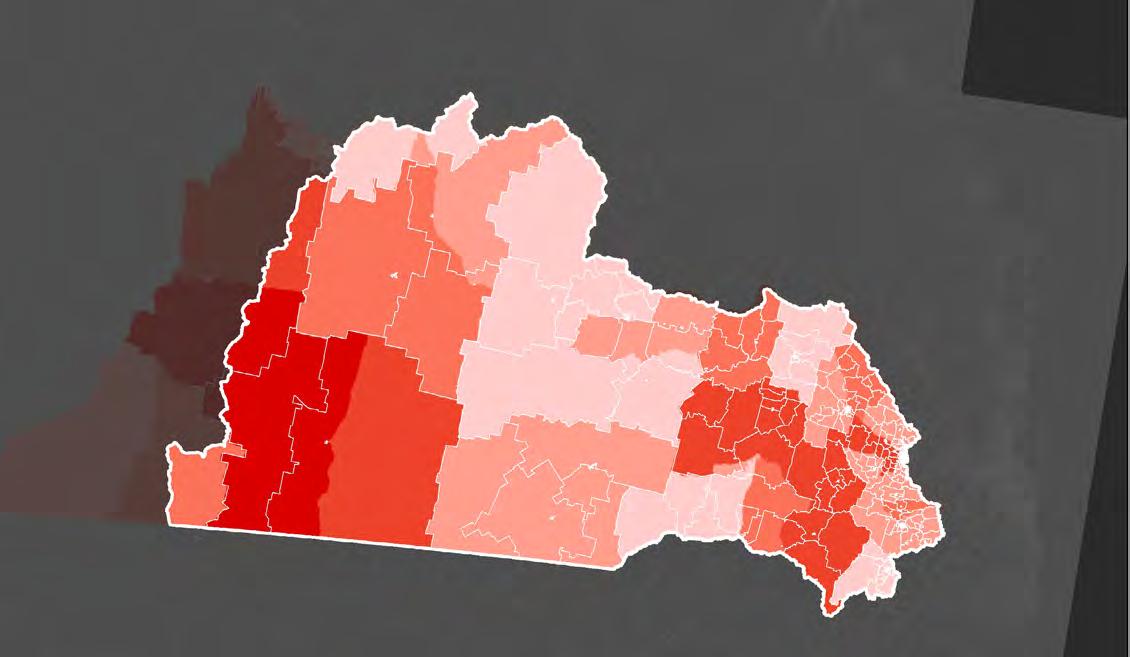
Drought declared percentage, 1963 - 2011, Queensland, ArcGIS online.
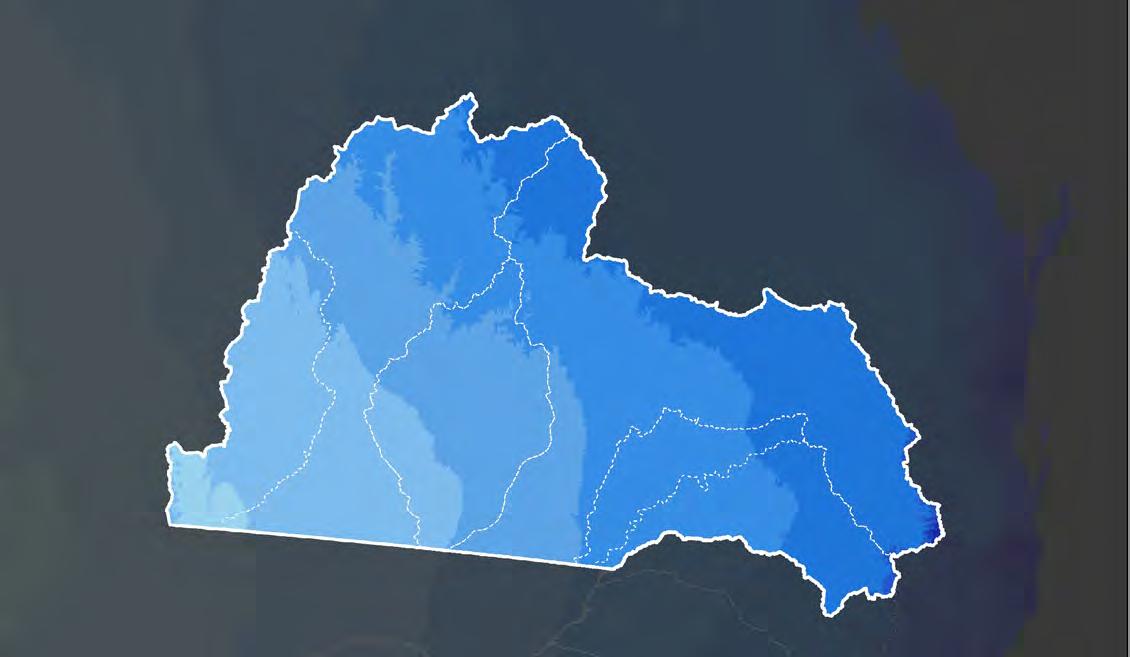
Digital Elevation Data, Geoscience Australia.
Long-term average rainfall map layer 2019, data.gov.au.
7
Very High Potential 7
24 High Potential 25
Medium Potential 31
34
Potential Impact Buffer Catchment Boundary 43
46 Statistical Areas Level 1
Prone Area (July 2017)
0.0 - 200.0 200.1 - 300.0 300.1 - 400.0 400.1 - 500.0 800.1 - 1000,0 1200.1 - 1600.0 Above 1600.0 500.1 - 600.0 1000.1 - 1200.0 Long Term Average Rainfall (Millimeters)
-
- 30
- 33
- 42
-
Bushfire
Percentage of the area declared as being Drought, 1963 - 2011 High: 2145.63 Low: -58.18 Elevation (meters) Mapping Question: Which hazards have crucial effects on the north part of MDB in Queensland?
Composition Basic Geographical Conditions
Findings: According to research, the risk of flood and landslide in this area is not high, considering the average rainfall, the topography, and the slope in this area. However, many parts are medium potential for bushfires, especially the north and east side since the slope in these areas can contribute to the expansion of the fire. At the same time, the Great Dividing Range blocks the wind from the east coast, and this makes the basin threatened by drought. It is depicted in the rainfall map and drought-declared map. 600.1 - 800.0
Findings:
According
The urban area is very few, the largest one is on the east edge - but that is still very small compared with the east coast (in this map’s shadow area).
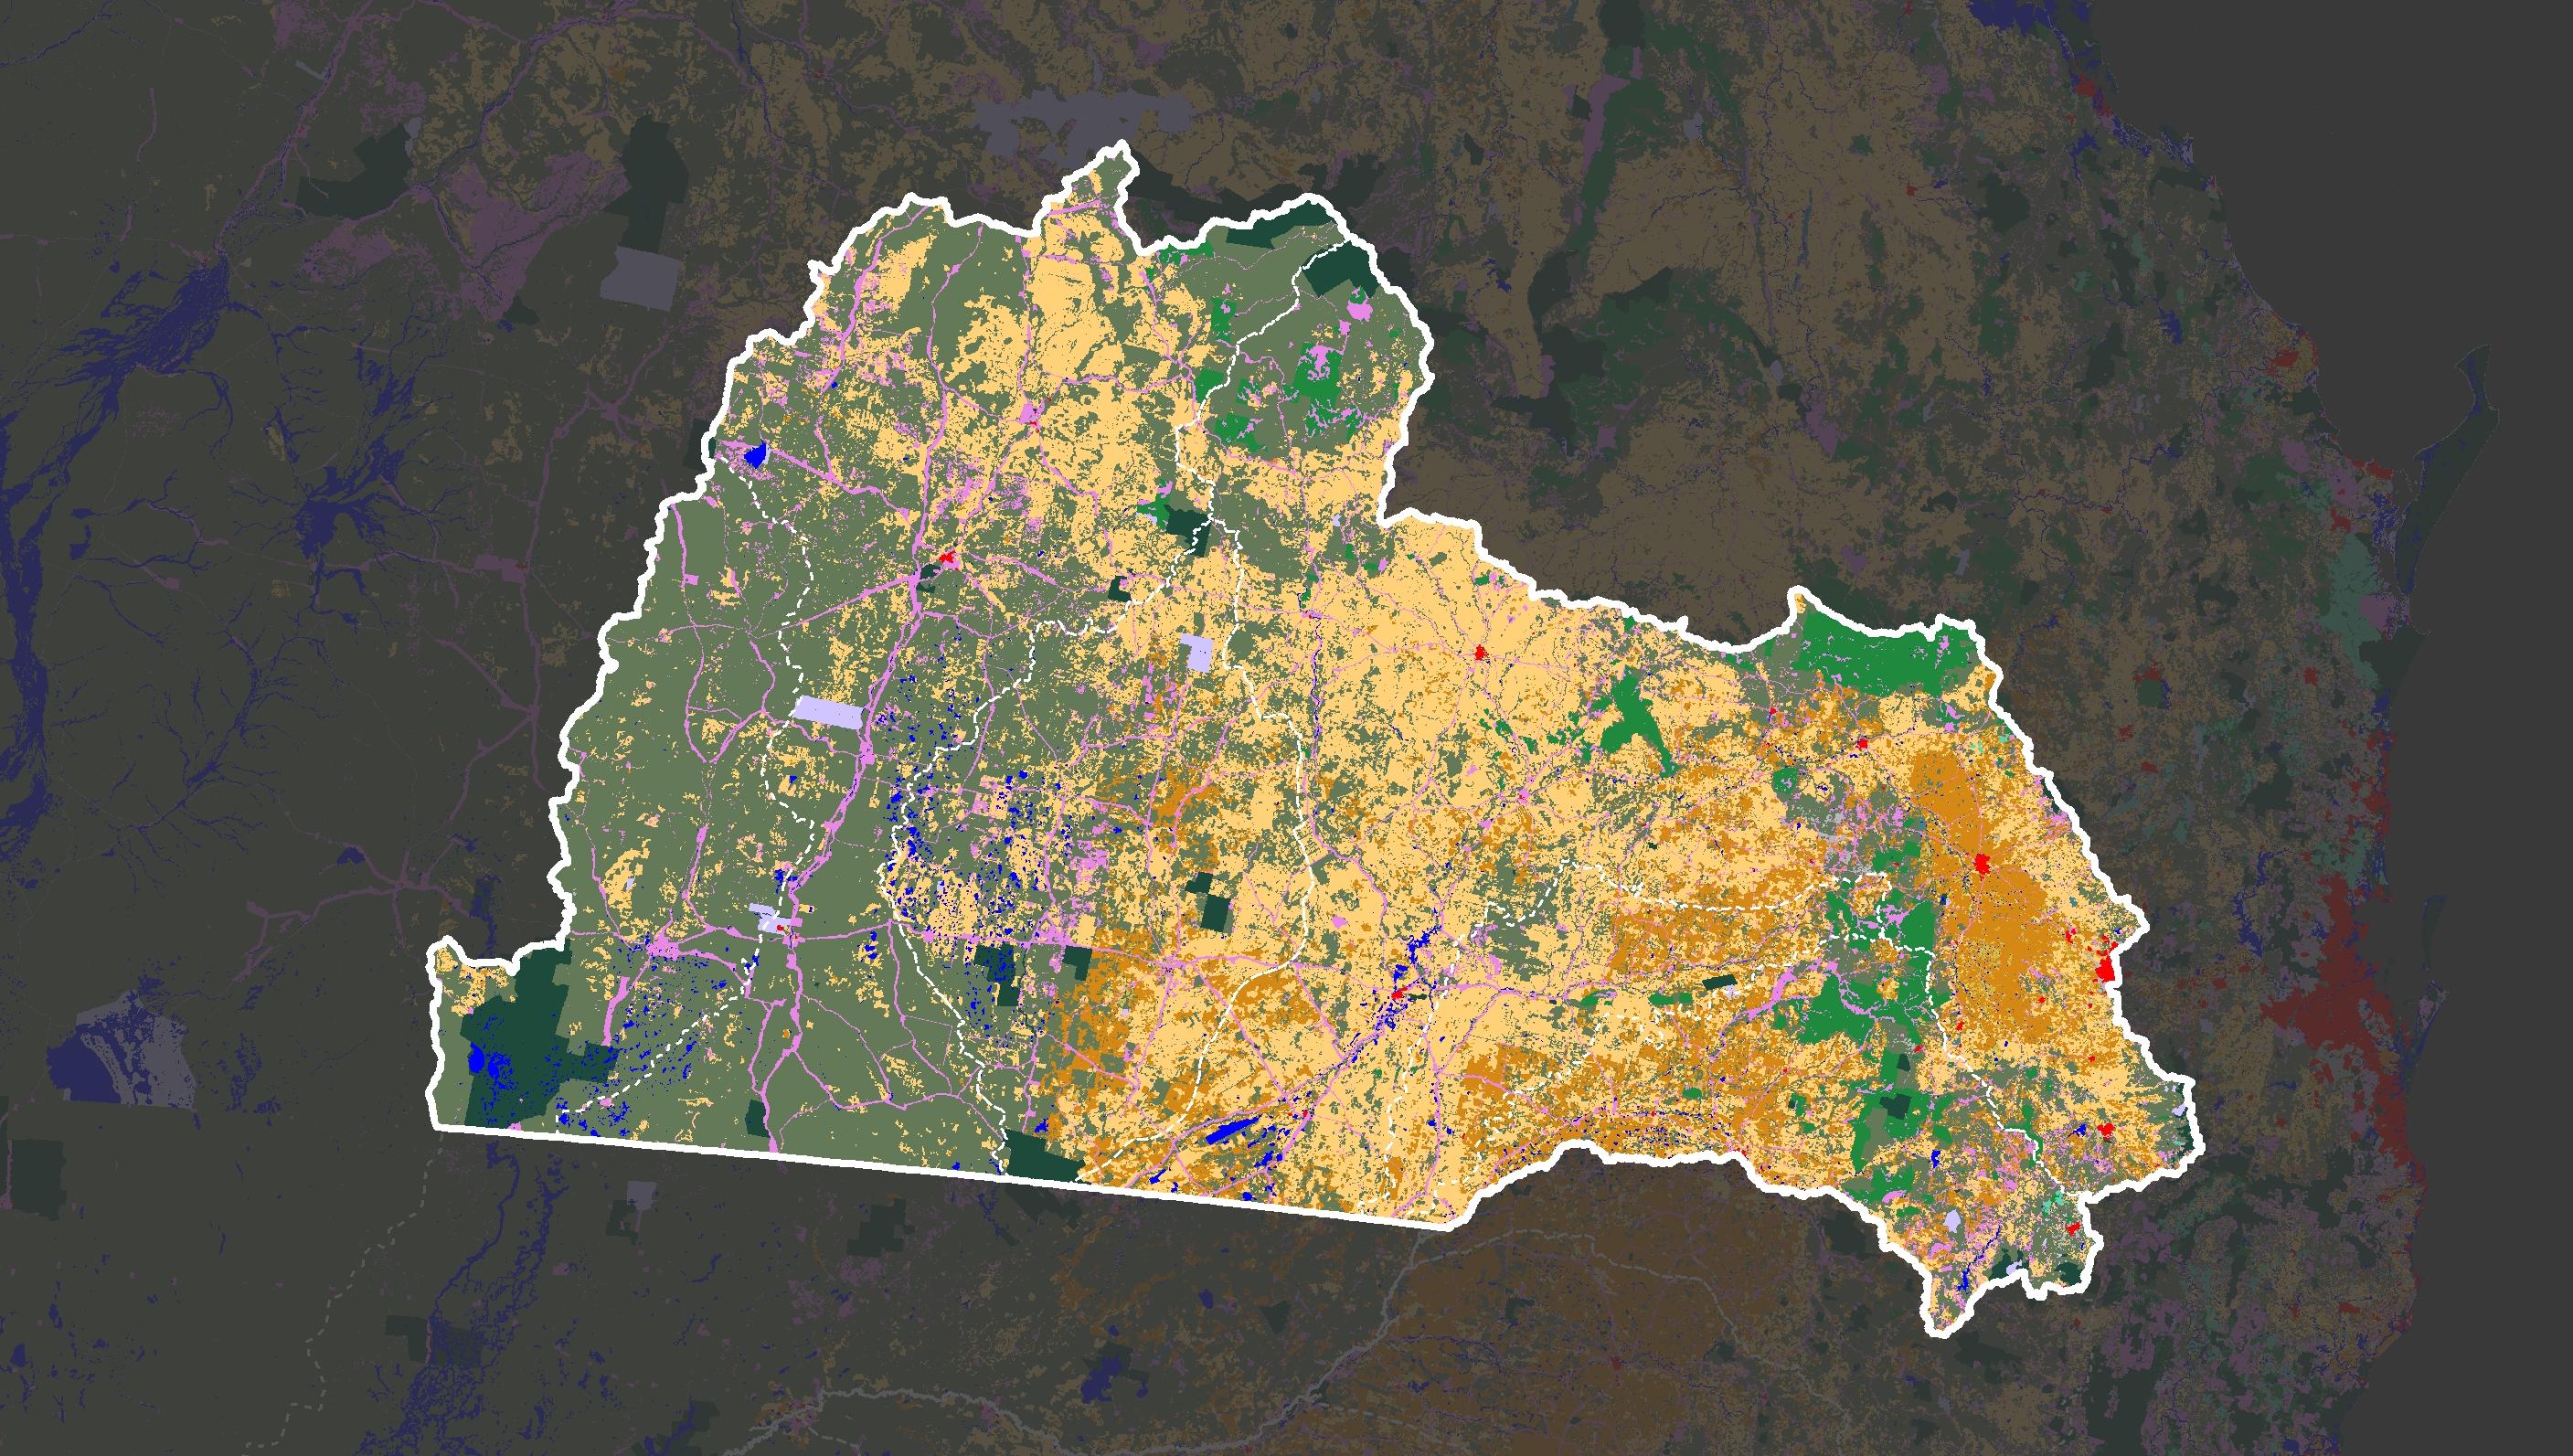
8 Composition Land Use Form Legend Land Use N 050100 200 Km Nature Conservation Dryland Horticulture Managed Resource Protection Land in Transition Grazing Modified Pastures Urban Intensive Uses Other Minimal Use Irrigated Pastures Plantation Forests (commercial and other) Intensive Horticulture and animal Production Grazing Native Vegetation Irrigated Cropping Dryland Cropping Rural Residential and Farm Infrastructure Mining and Waste Water Production Native Forests Irrigated Horticulture Mapping Question: How lands are used and categorized in this area? Data Sources:
250 m. Department of Agriculture, Fisheries, and Forestry.
Land use of Australia 2010–11 to 2015–16,
<https://www.agriculture.gov.au/abares/aclump>
agriculture
economic
domestic demands,
grazing.
Most of MDB in Queensland has been developed for
to meet the
and
and the largest area is for
The modified pasture grazing is mainly located on the middle and east sides of this area, while the native vegetation grazing can be found on the west side.
Many Nature conservations are on the west side and are surrounded by native pasture grazing.
to the shade, rivers are minimally used in this area. However, there are no traditional indigenous uses along them.
NEBINE
WARREGO
CONDAMINE BALONNE MOONIE
BORDER
PAROO
<https://www.agriculture.gov.au/abares/aclump>
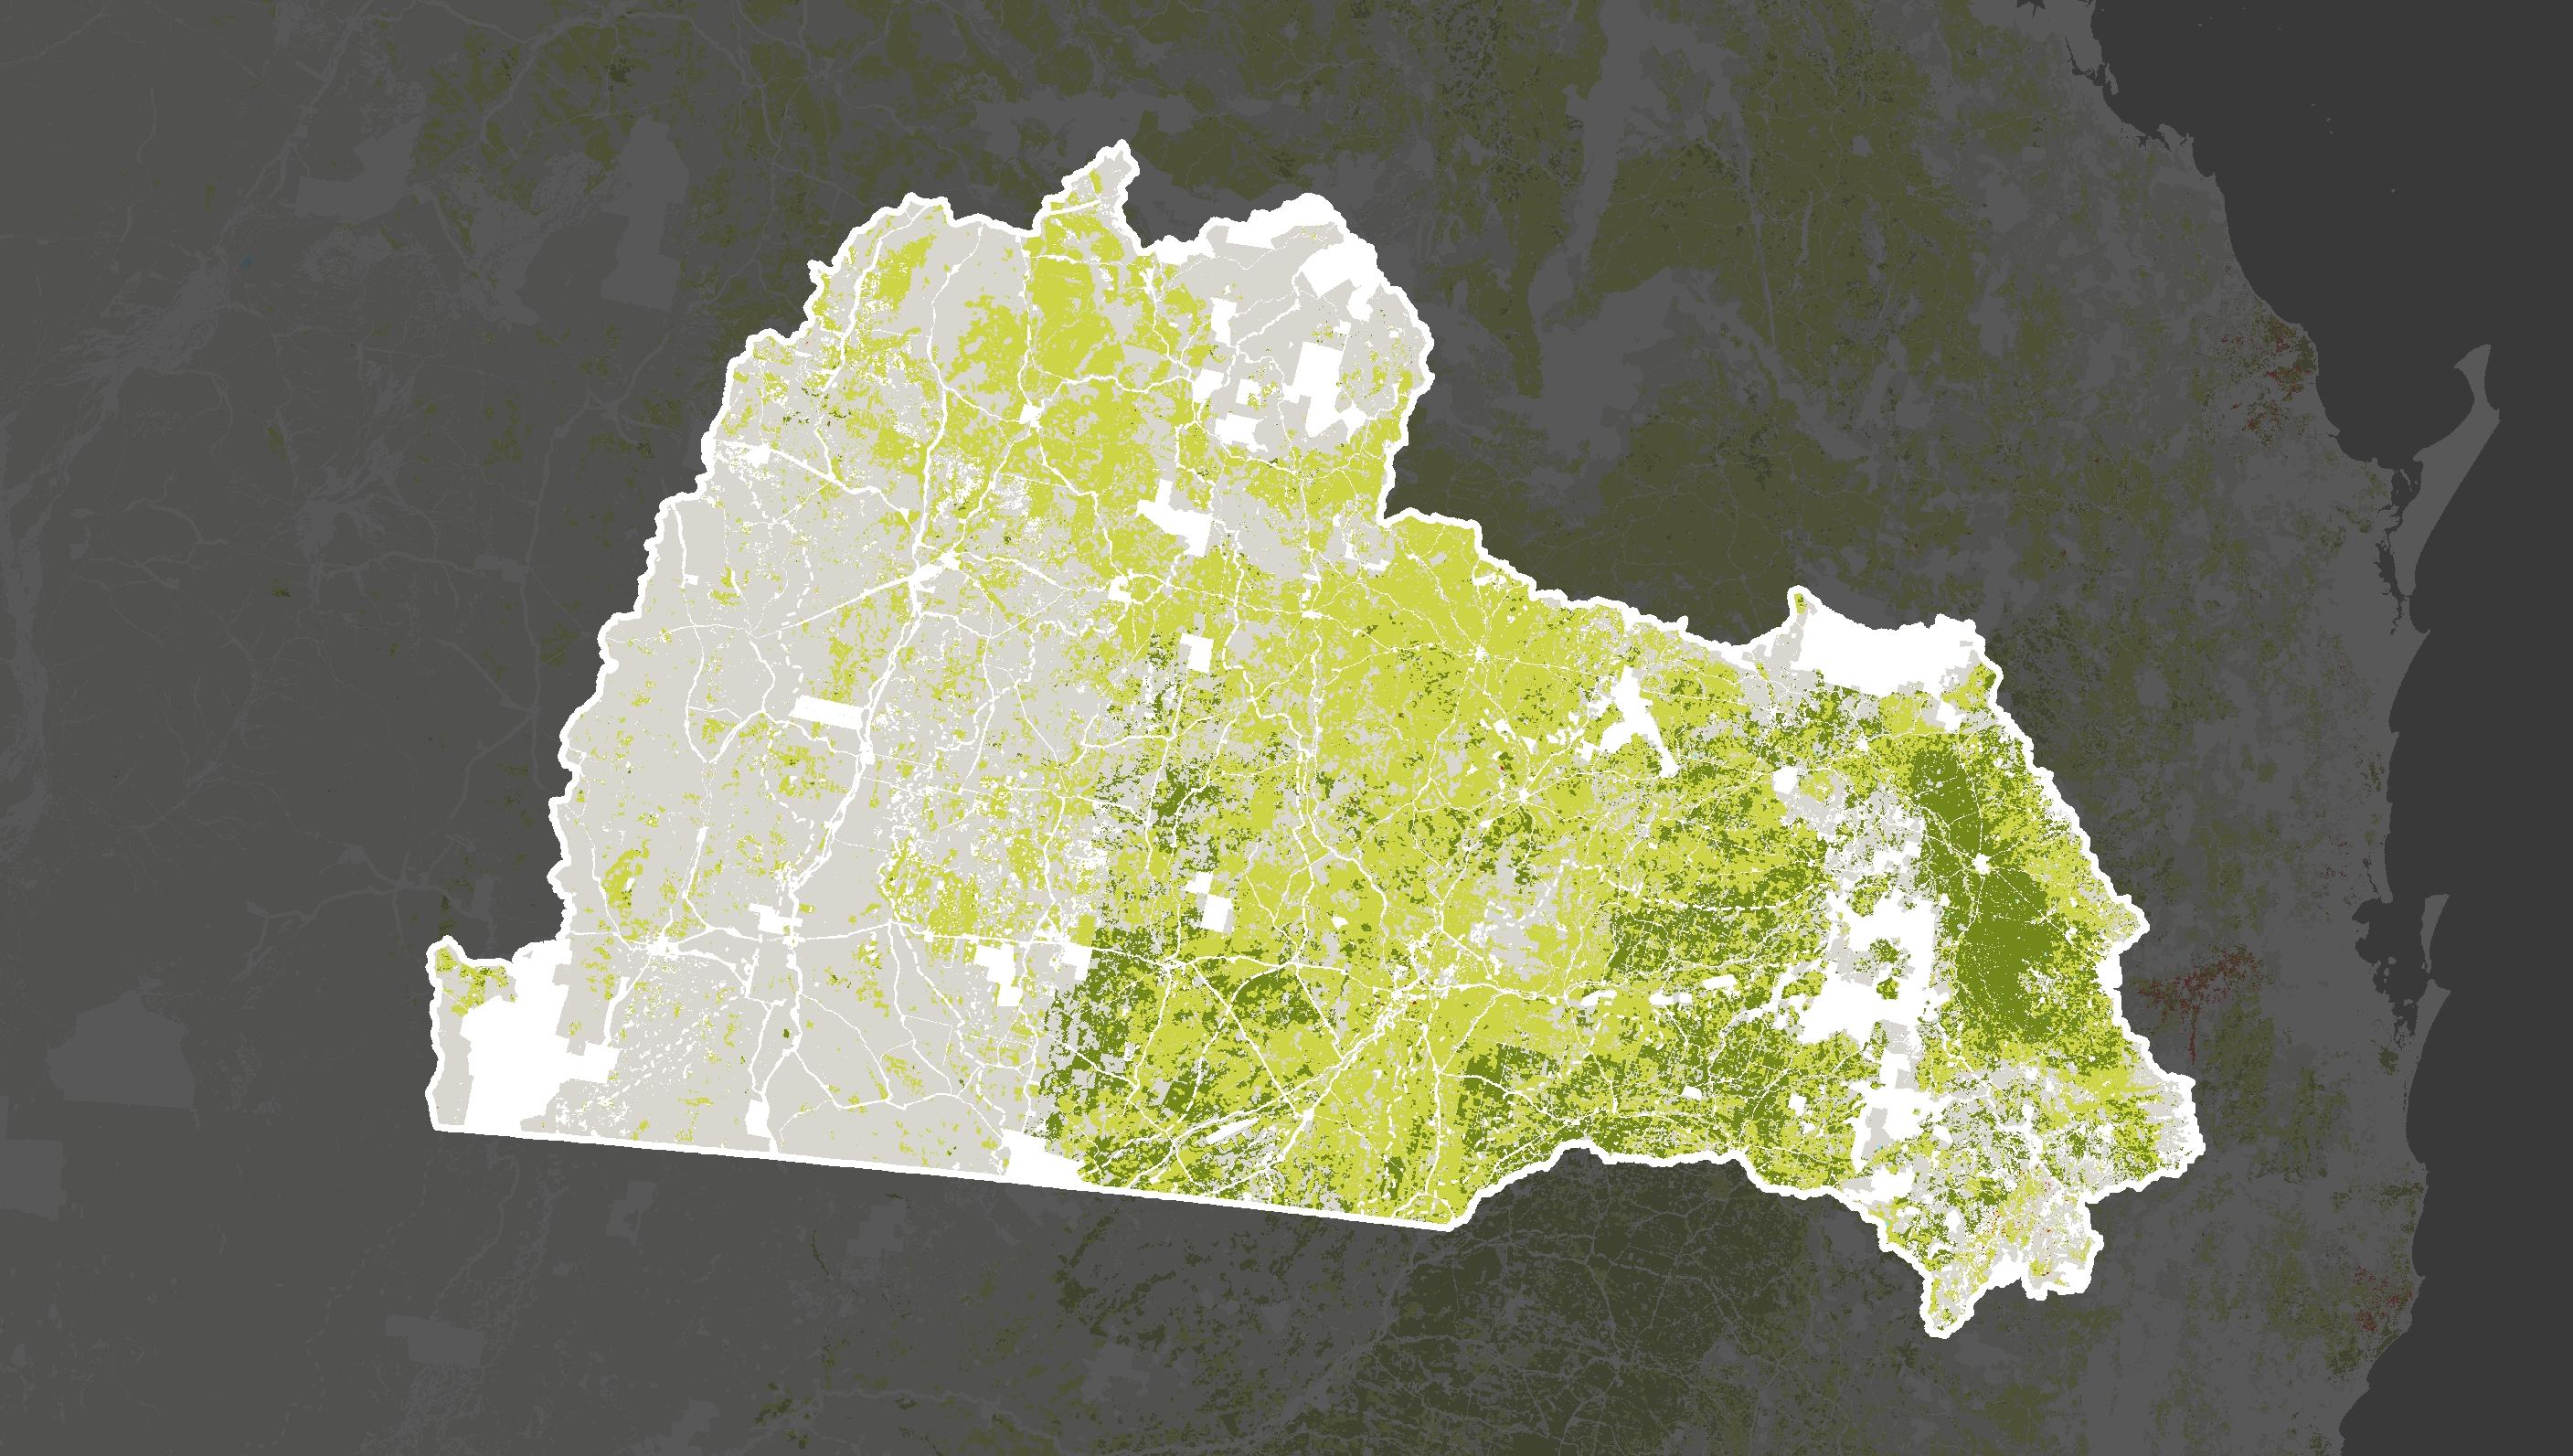
9 Legend Agricultural Industry Land Use N 050100 200 Km Other Uses Grazing Native Vegetation Grazing Modified Pastures Cropping Horticulture
Question: How are agricultural lands distributed in this area? Findings: When specific to agriculture, the varying trend is clearer. Grazing varies from native vegetation to modified pastures from west to east; cropping is mainly distributed on the east
of the basin and at the west foot of the Great Dividing Range, and the further to the west side of the basin, the smaller the distribution area.
uses) are
native forests and natural conservations, according to the
Mapping
side
White blankets (other
mainly from
former page. Data Sources:
Land use of Australia 2010–11 to 2015–16, 250 m. Department of Agriculture, Fisheries, and Forestry.
Agricultural Form Composition
Mapping Question: Where does the endangered or of concern vegetation distribute?

Data Sources:
Matters of state environmental significance - Regulated vegetationcategory B endangered or of concern - Queensland <https://qldspatial.information.qld.gov.au/catalogue/custom/detail. page?fid={5E77558D-CFF5-43BF-B562-9A6C74C3E5C8}>
Matters of state environmental significance - Regulated vegetationcategory C endangered or of concern - Queensland <https://qldspatial.information.qld.gov.au/catalogue/custom/detail. page?fid={002E8C48-D332-4FC0-A3C8-02C2E0BB50D6}>
10
Findings: Most endangered and of concern regulated vegetation distribute in the middle of this area, such as N 050100 200 Km
Nebine, Condamine Balonne, and Moonie Catchments. There is also an obvious distribution on the east edge of the basin. There are only a few endangered or of concern vegetations in Paroo and the lower part of Warrego.
Legend Regulated Vegetation Endangered and of Concern
Category B Containing Endangered Category B Containing of Concern Category C Endangered/of Concern
NEBINE
WARREGO
CONDAMINE BALONNE MOONIE
BORDER
Composition Regulated Vegetation Endangered and Of Concern
PAROO
Legend
Wildlife Habitat - Least Concern
Wildlife Habitat - Endangered or Vulnerable
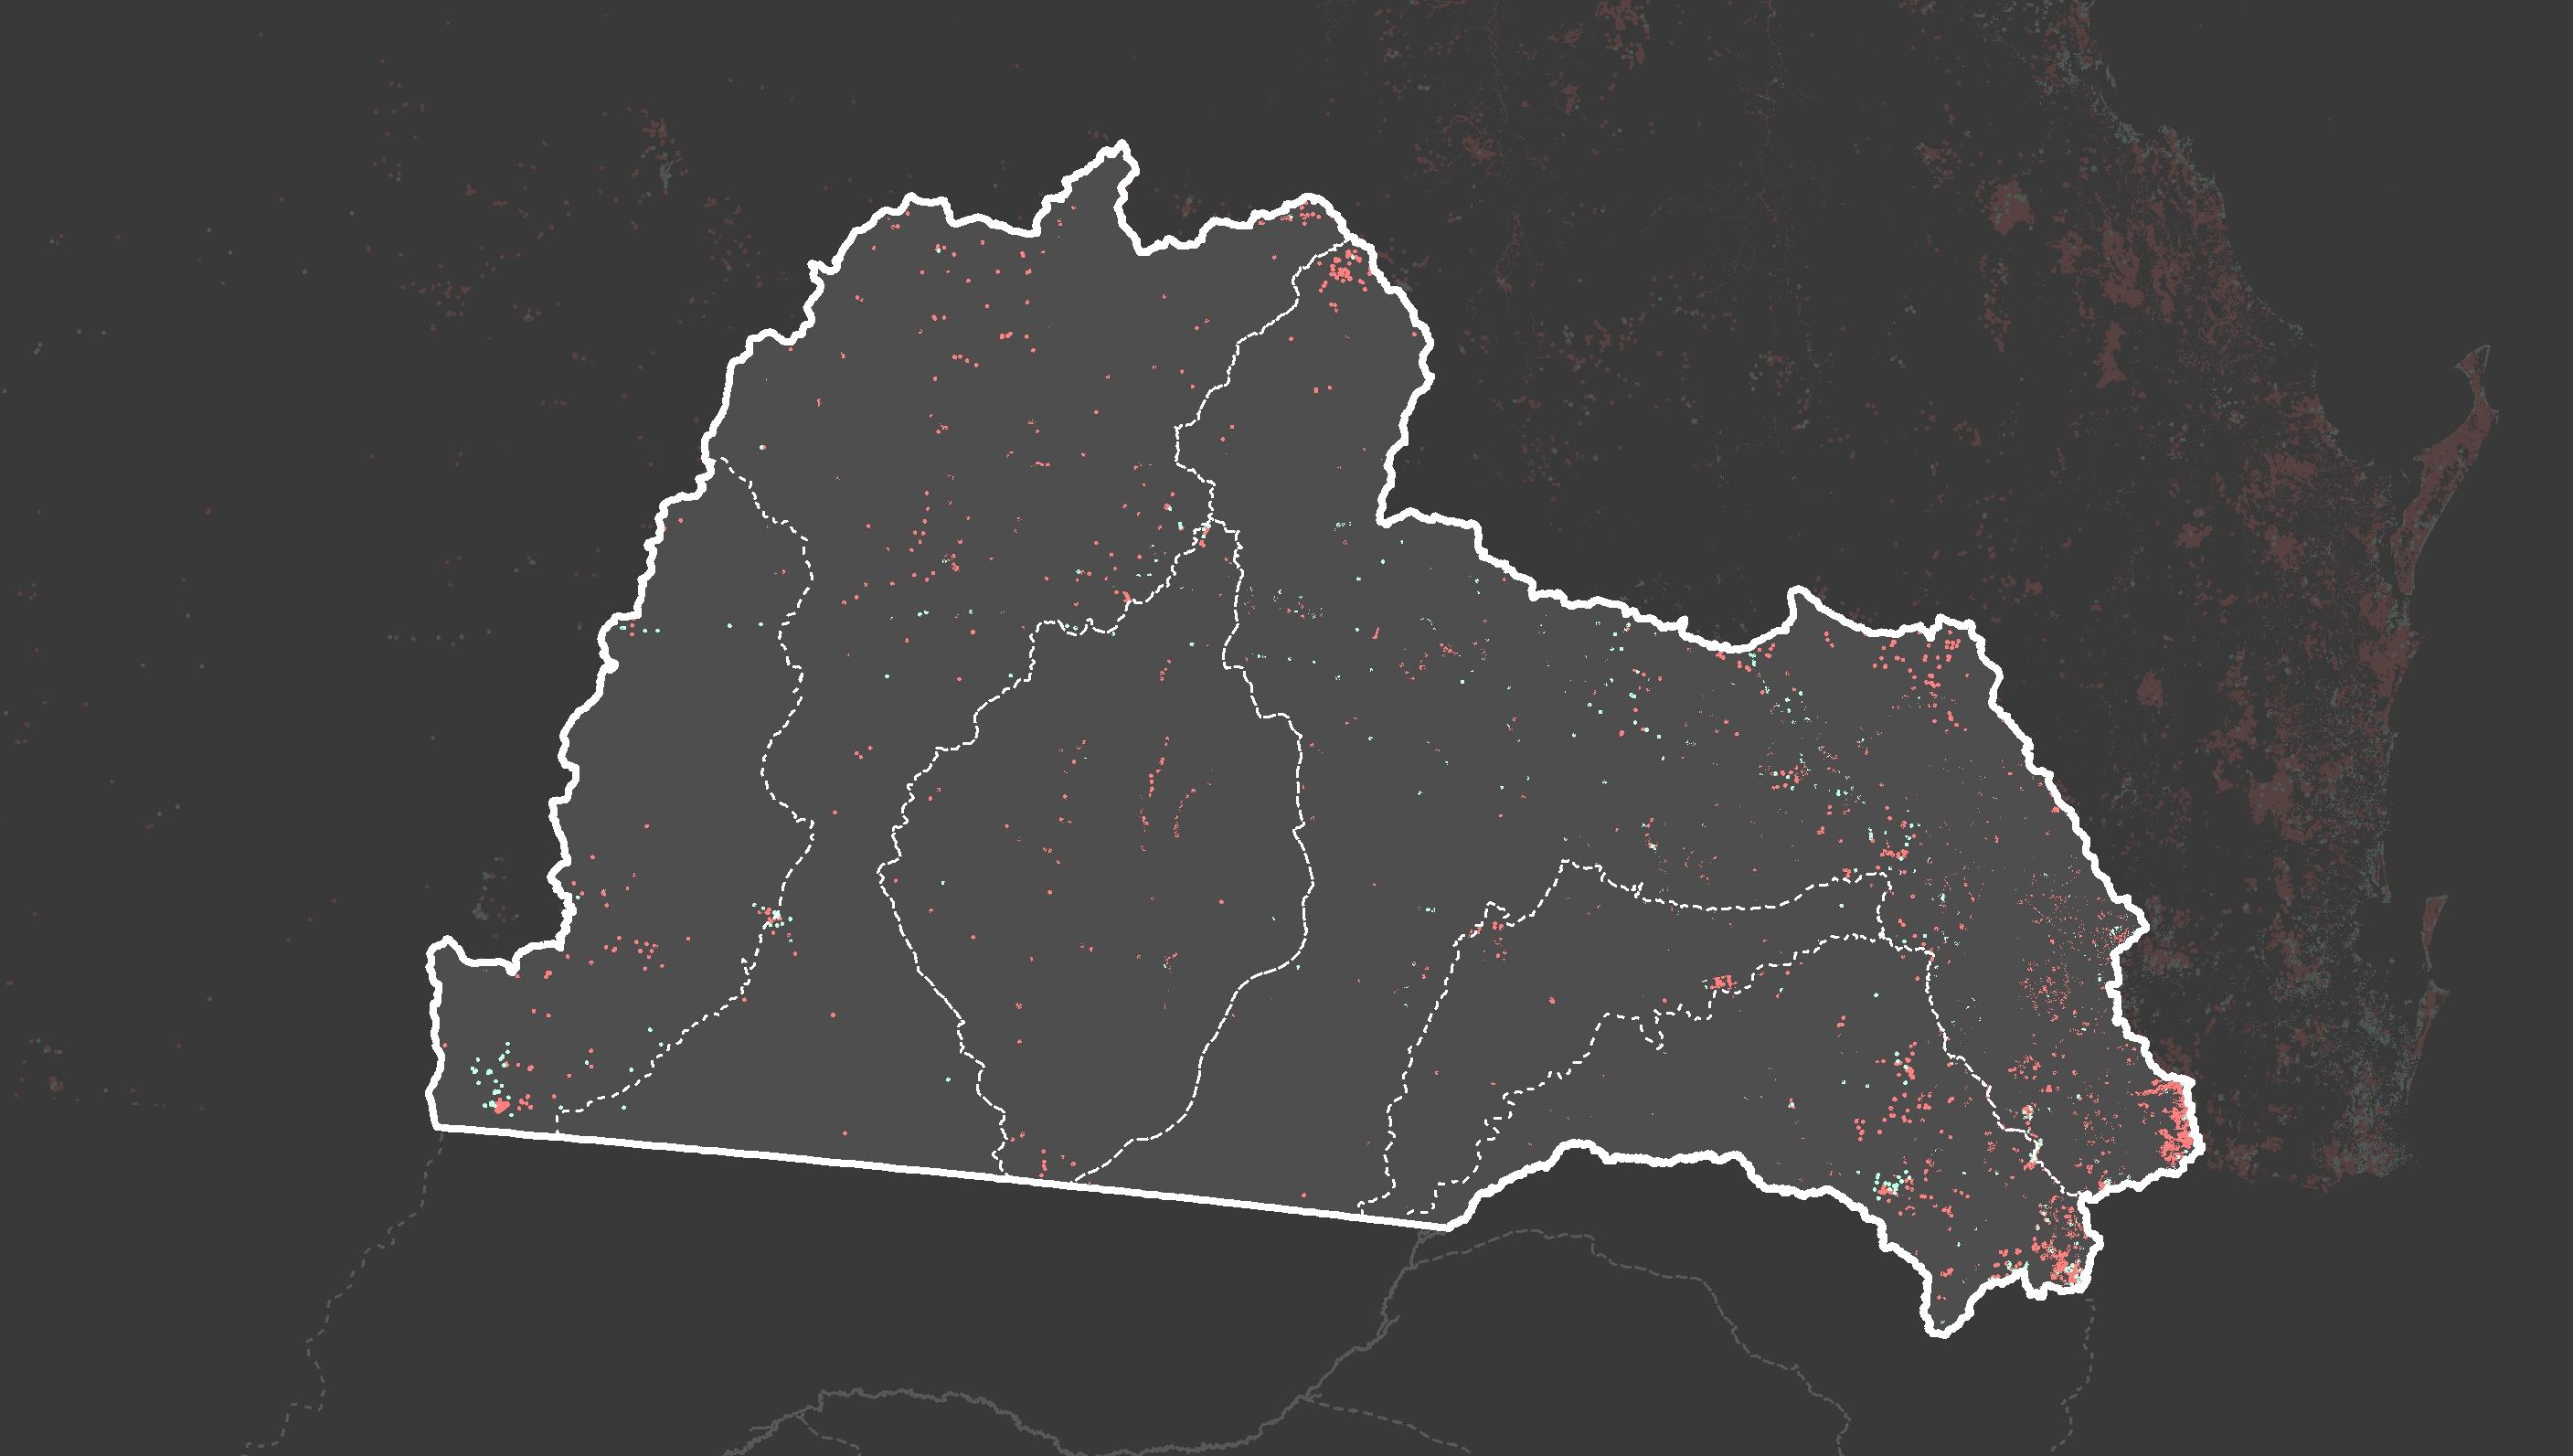
Mapping Question: How do the habitats for wildlife, especially endangered and vulnerable ones, distribute in this part of the basin?
Data Sources:
Matters of state environmental significance - wildlife habitatendangered or vulnerable wildlife <https://qldspatial.information.qld.gov.au/catalogue/custom/detail. page?fid={5C9451C7-D712-4B8D-B3CA-9B21ED1A8215}>
Matters of state environmental significance - wildlife habitat - special least concern animal <https://qldspatial.information.qld.gov.au/catalogue/custom/detail. page?fid={D15BA207-72BE-42B8-B440-6224070BC445}>
Findings:
The number of endangered/vulnerable wildlife habitats is much higher than the least concern ones, which means this area is important for the diversity of
Basin and Queensland. The density of endangered/vulnerable wildlife habitats is lower on the middle and west sides, and the most intensive part is on the southeast edge. The least concerned group follows a similar trend in this area.
11
Murray-Darling
NEBINE
WARREGO
CONDAMINE BALONNE MOONIE BORDER
PAROO
N 050100
Wildlife Habitat Distribution
200 Km
Wildlife Habitat Distribution
Composition
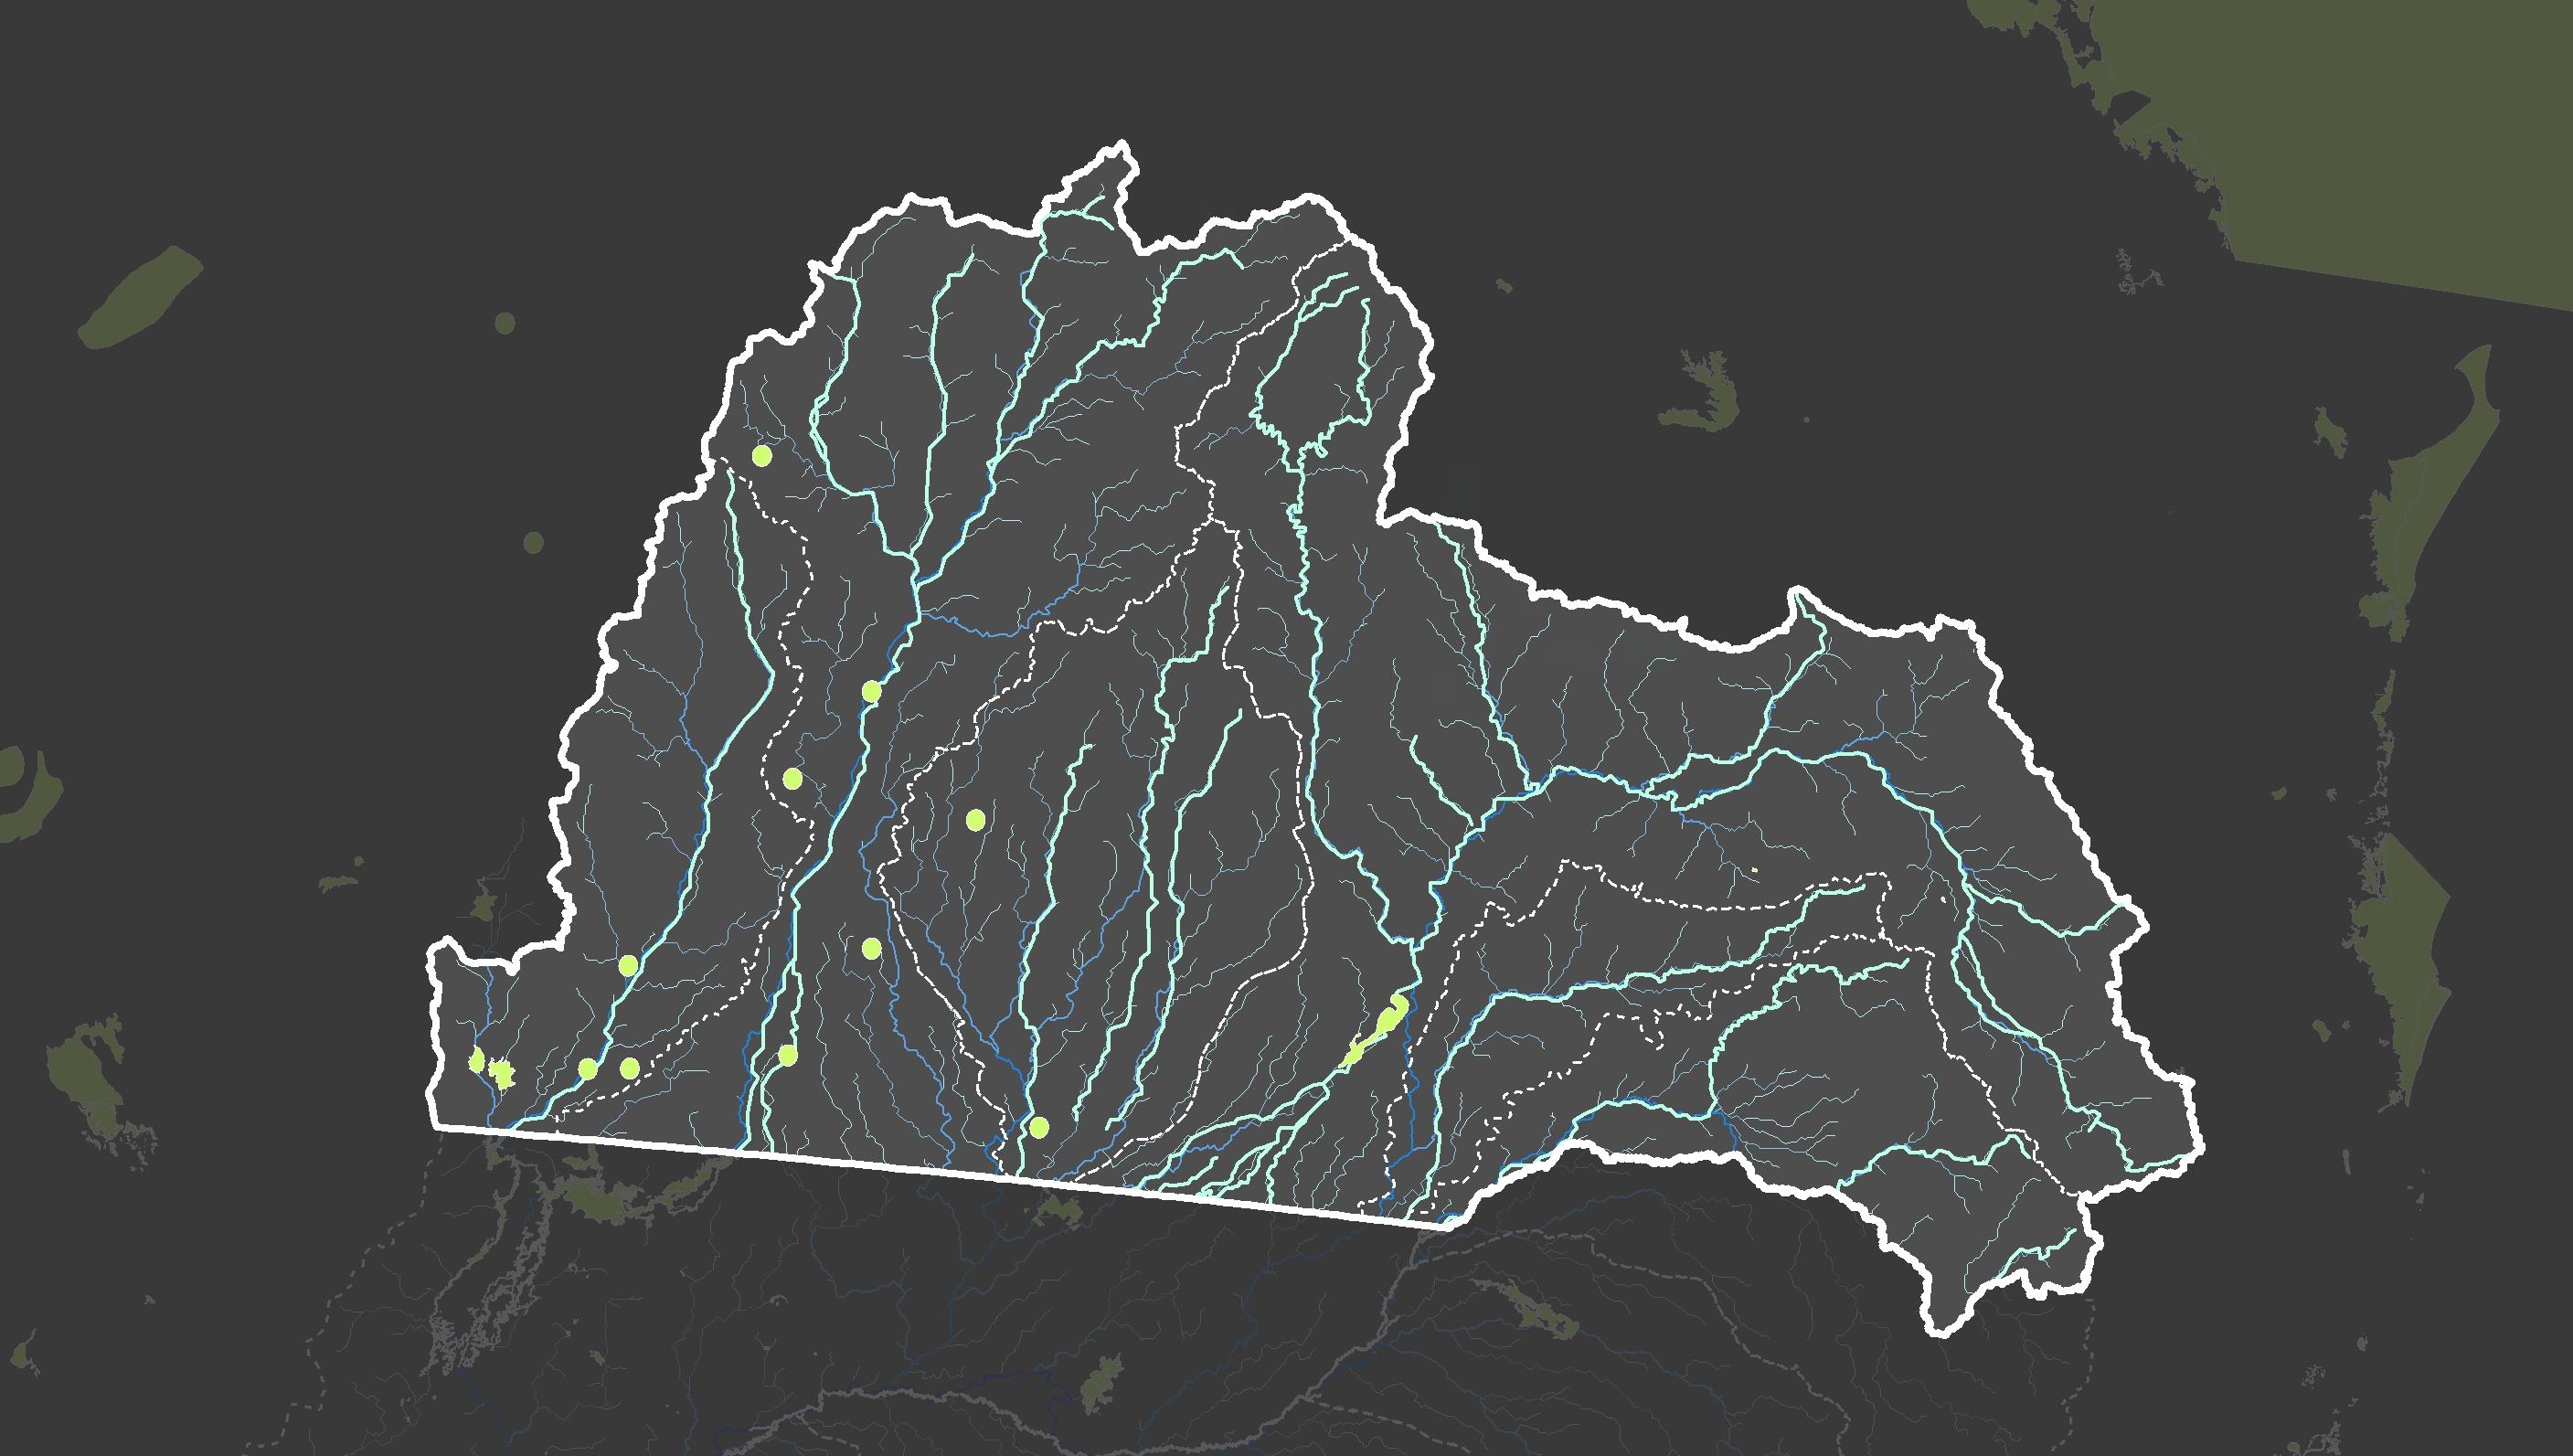
12 Mapping Question: What is the hydrology condition in this area? Data Sources: Hydrology map self-made based on elevation map 1km cells Directory of important wetlands - Queensland
page?fid={21B6FAAC-02BF-4EEE-8E72-5055C43157EF}> Queensland Murray-Darling Basin Catchments Map Findings: A dense surface water system goes through this region. Rivers and creeks generally flow from north to south. Major rivers and creeks are noted on the map. The larger area wetlands are mainly located on the west side and middle but rarely distributed in the east. N 050100 200 Km Nebine Creek Mungalla Creek Wallam Creek CulgoaRiver Warrego River LangloRiver Ward River Nive River Balonne River Condamine River OakeyCk DogwoodCk Maranoa River Bungil CK Moonie River Macintyre Brook WeirRiver Paroo River 4 6 5 7 8 Major Rivers Important Wetlands Hydrology steams above 3 Legend Wetland, floodplain, and regulated vegetation 100m away from them Composition Hydrology System and Vegetation Nearby
<https://qldspatial.information.qld.gov.au/catalogue/custom/detail.
Legend
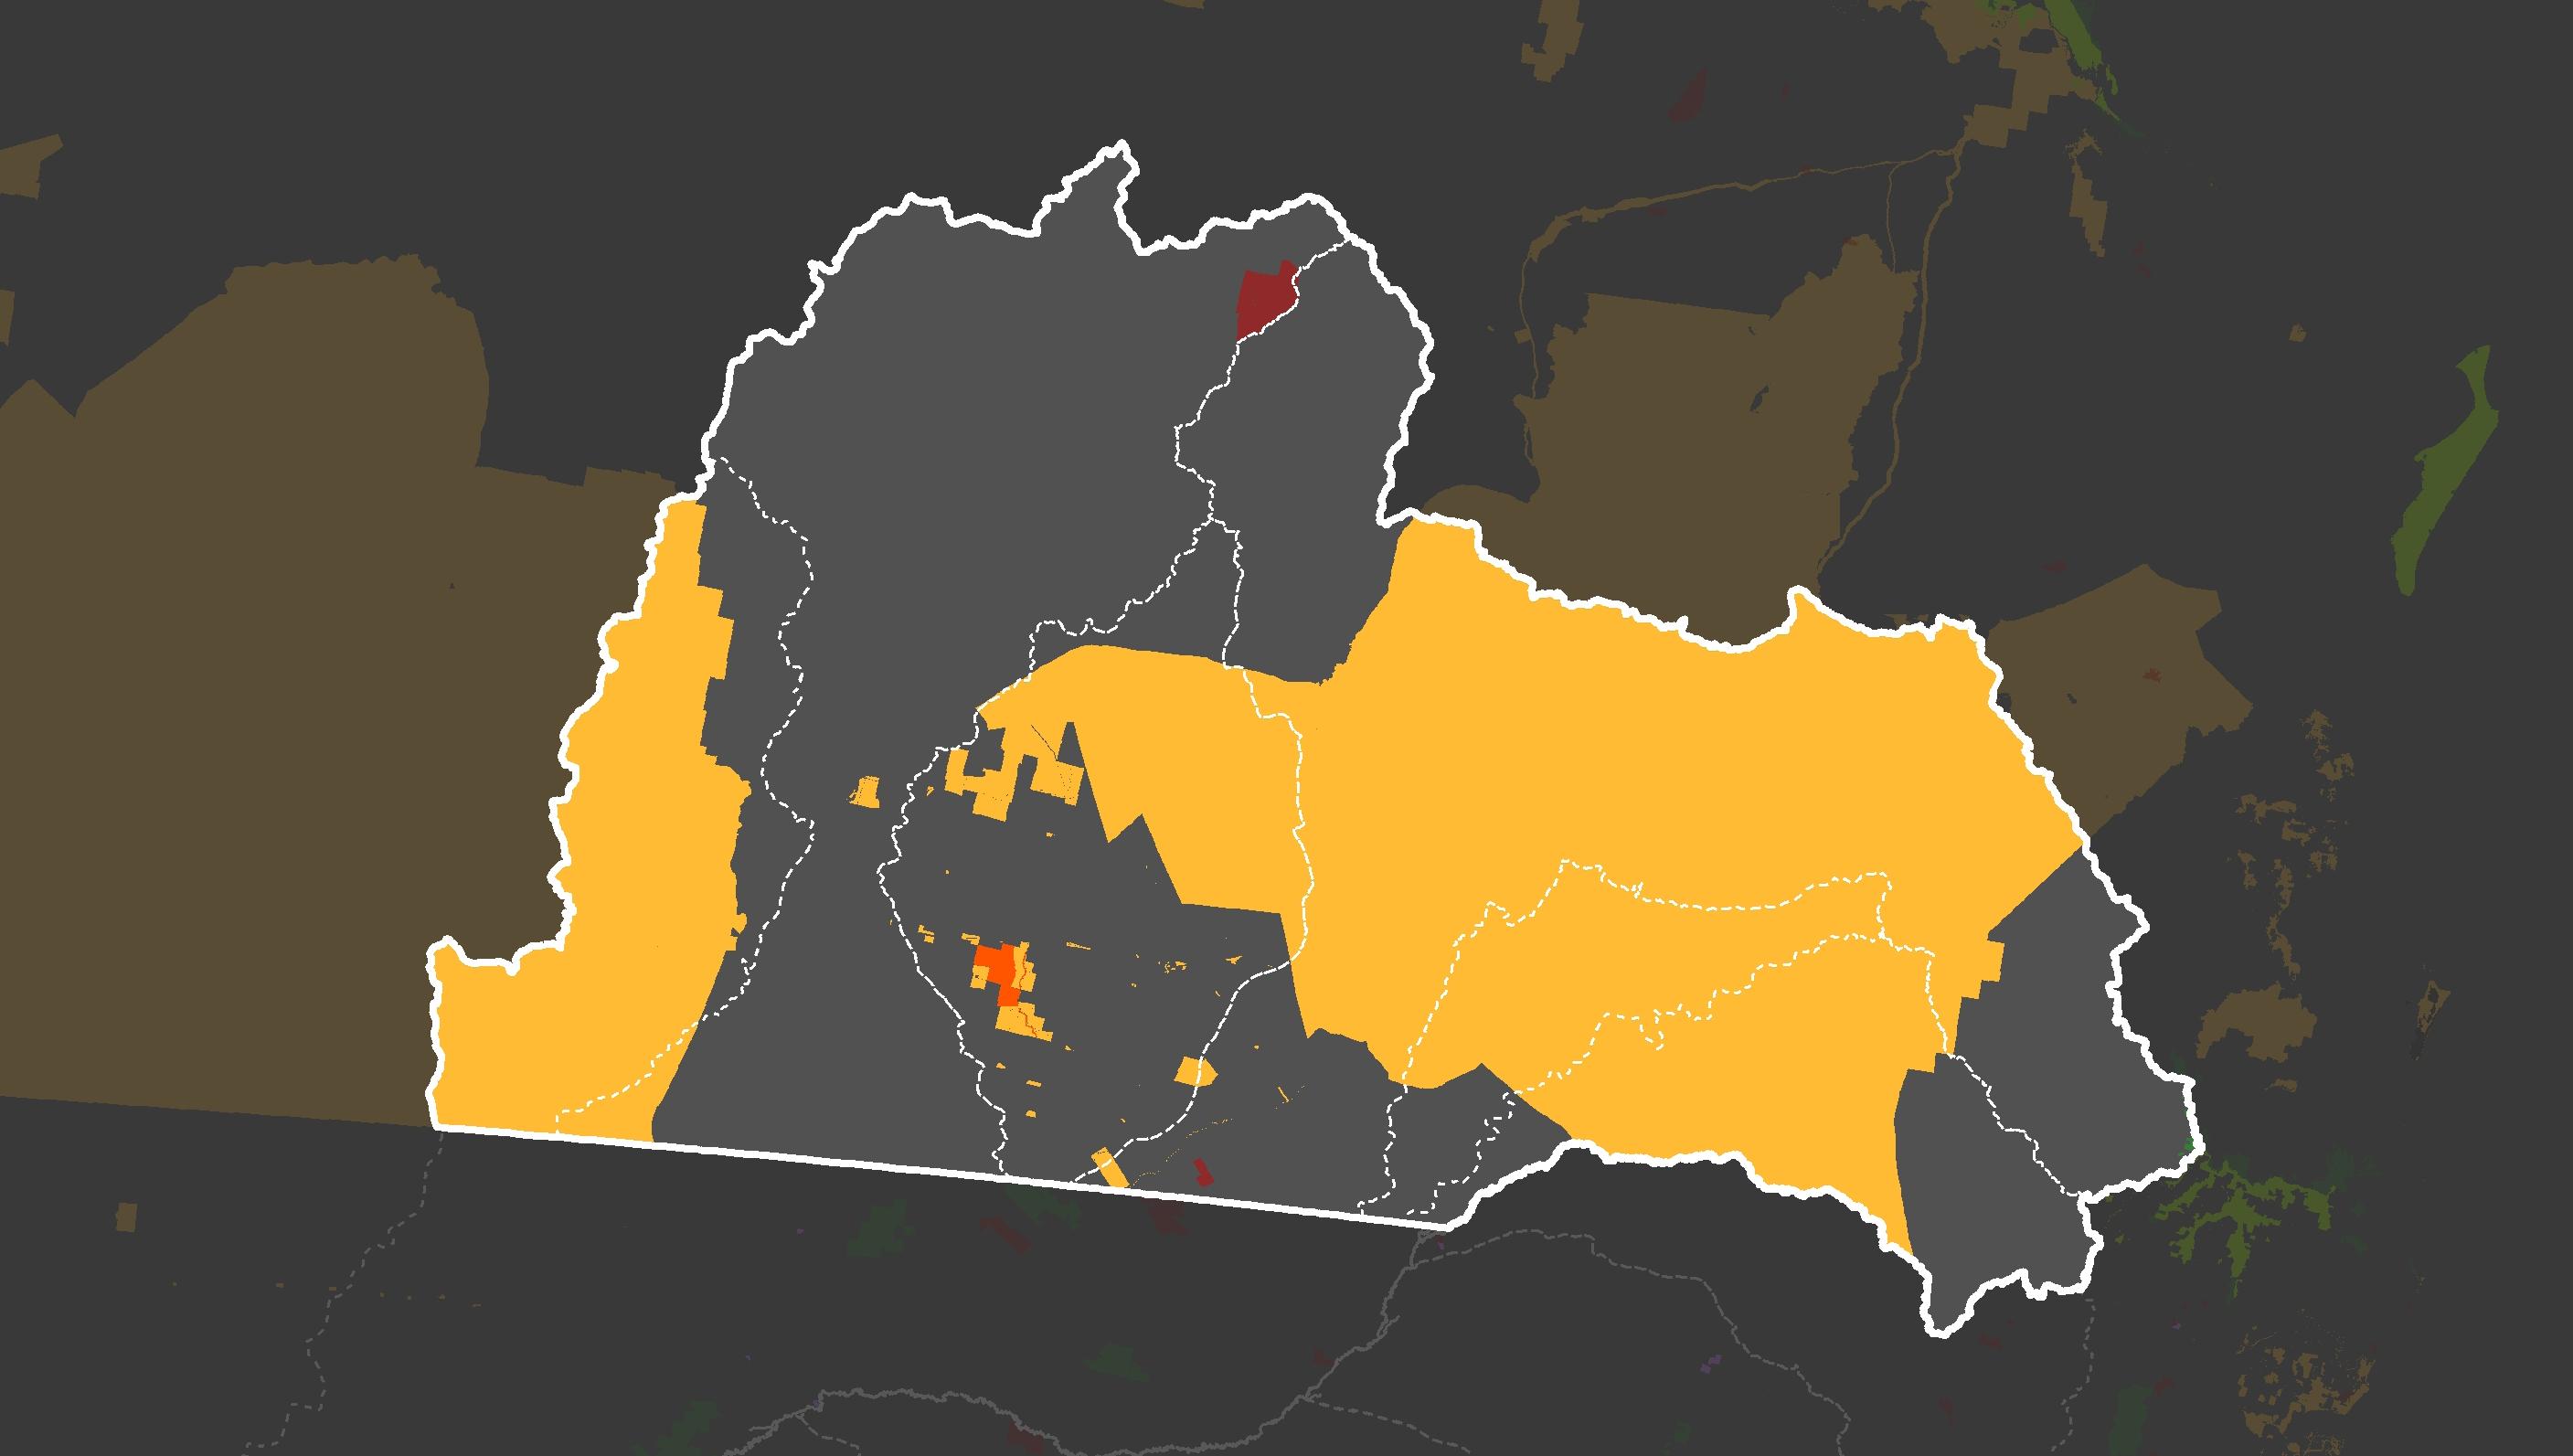
Indigenous Land Estate
Indigenous co-managed Indigenous co-managed and subject to other special rights Indigenous owned and Indigenous managed Indigenous owned, Indigenous managed and subject to other special rights Subject to other special rights
Mapping Question: Are there any lands managed by Indigenous people?
Data Sources:
Indigenous land interests - Queensland <https://qldspatial.information.qld.gov.au/catalogue/custom/detail. page?fid={73F00D41-0C01-4562-9C9A-6917AE0AC11A}>
Findings:
It is clear that major areas are not managed or owned by Indigenous people, but they have some special rights in many of them.
The only two indigenous-owned and managed lands are in the Carnarvon National Park on the north and in Town Dirranbandi on the south, near the boundary.
Apart from those, there is an indigenous owned, managed, and subject to other special rights area in the lower part of Nebine.
13
N 050100 200 Km
Indigenous Land Estate
Composition
14
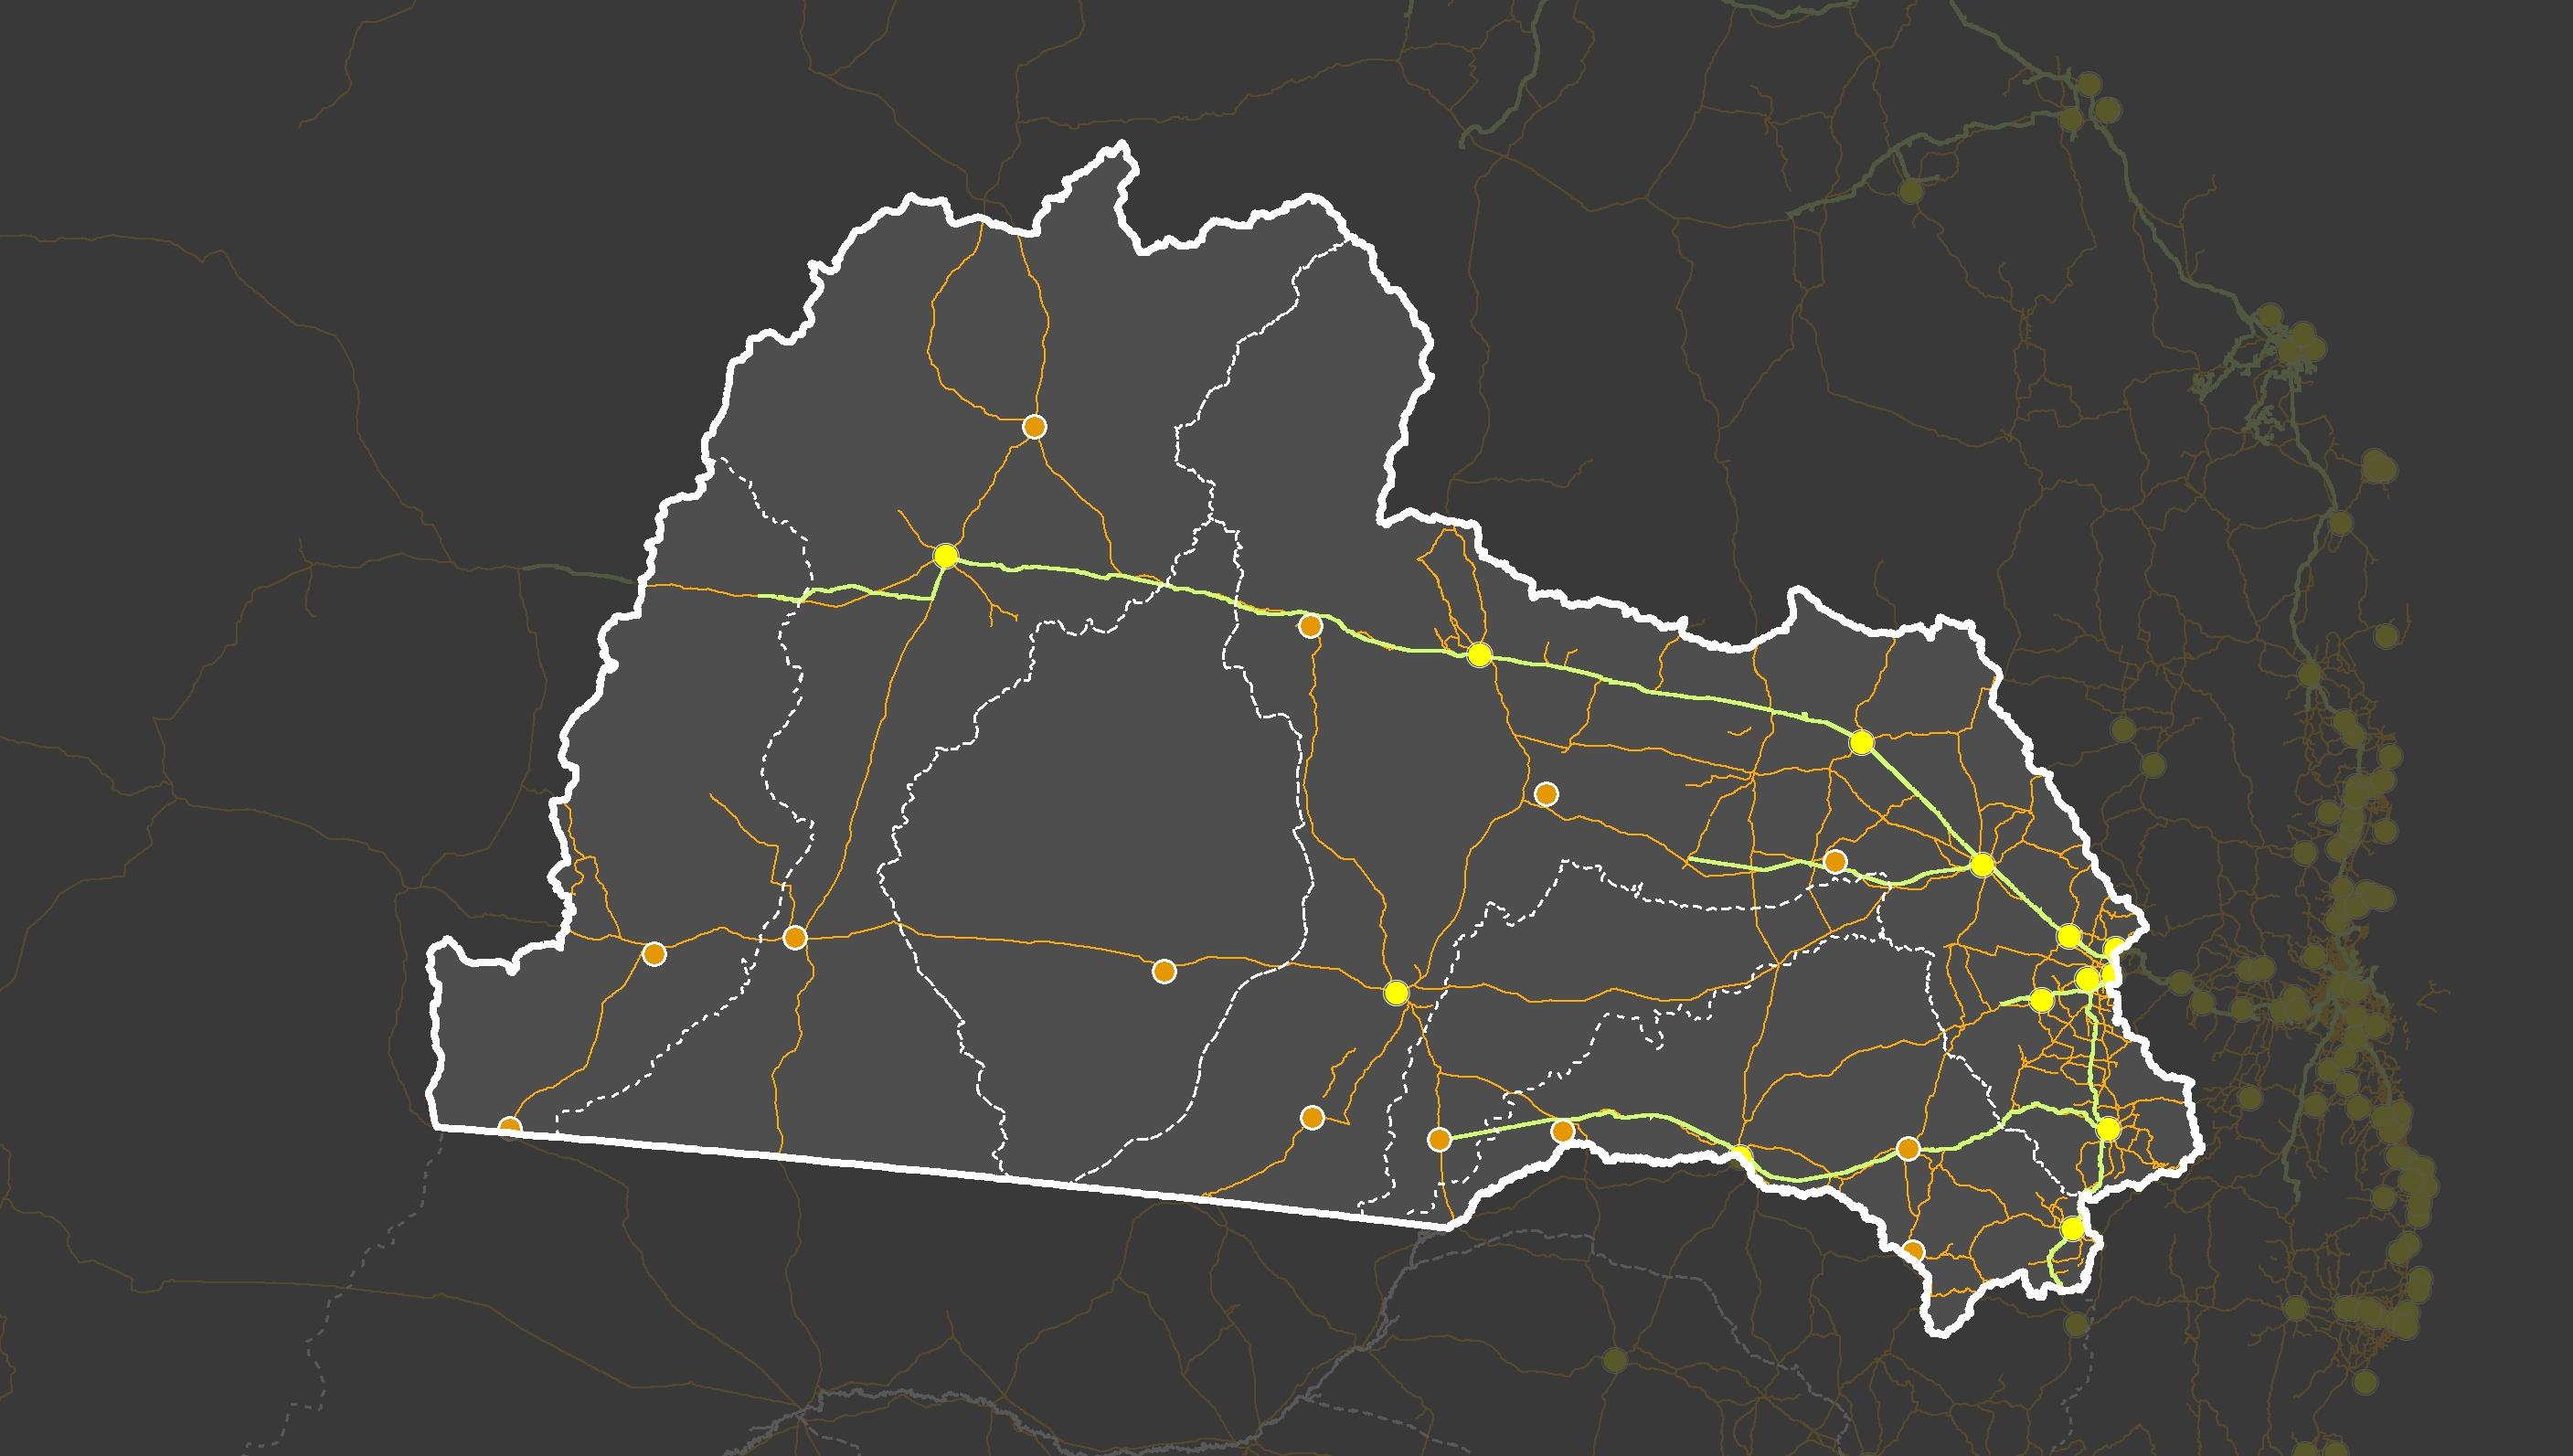
Mapping Question: How human habitats are linked together by motorways and railways in this region? Data Sources: Open Street Map Major Roads, Australia, ArcGIS Online Railway centrelines, Queensland, ArcGIS Online Google Map Findings: The main human habitats are well-linked in the east end of this area, and the network of both transportations has been developed well. In contrast, the railways do not expand to the inner part, and the road system is much less intensive.
N 050100 200 Km
Major Cities Major Roads Railways Major Towns Legend Transportation in MDB, QLD
Charleville
Augathella
Cunnamulla Bollon Eulo Hungerford
Roma Chinchilla Dalby Oakey Westbrook Warwick Stanthopre
Goondiwindi Inglewood Texas
Saint George Dirranbandi Thallon Talwood
Toowoomba Composition Mobility
Highfields Gatton
and Connectivity
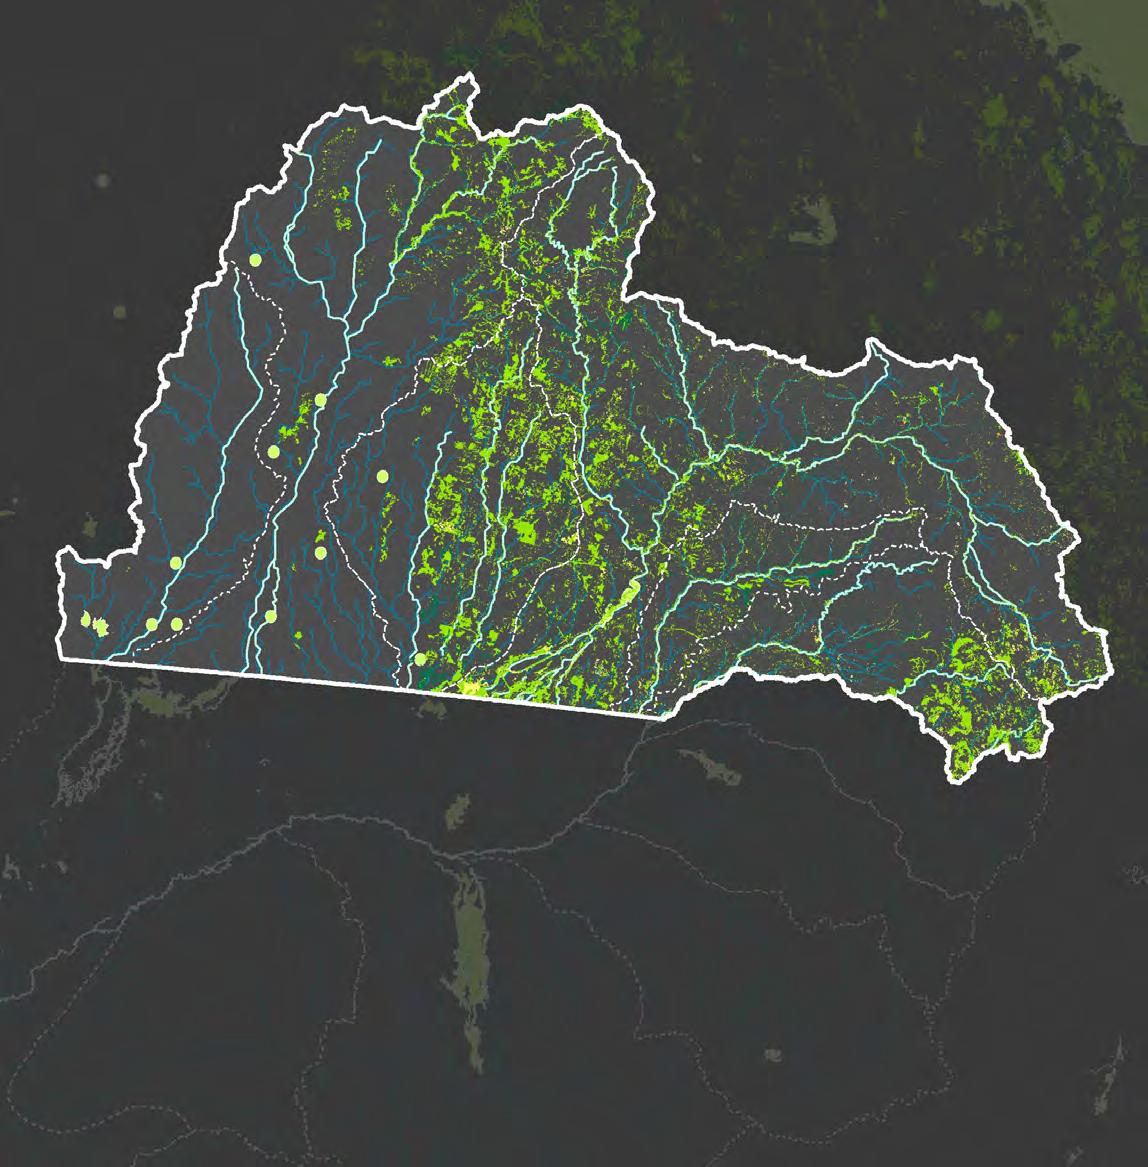
Mapping Question: What is the relationship between the surface water system and the wildlife habitat in this area?
Data Sources:
Matters of state environmental significance - wildlife habitatendangered or vulnerable wildlife <https://qldspatial.information.qld.gov.au/catalogue/ custom/detail.page?fid={5C9451C7-D712-4B8D-B3CA9B21ED1A8215}>
Matters of state environmental significance - wildlife habitatspecial least concern animal <https://qldspatial.information.qld.gov.au/catalogue/ custom/detail.page?fid={D15BA207-72BE-42B8-B4406224070BC445}>
Directory of important wetlands - Queensland <https://qldspatial.information.qld.gov.au/catalogue/ custom/detail.page?fid={21B6FAAC-02BF-4EEE-8E725055C43157EF}>
Hydrology map self-made based on elevation map 1km cells
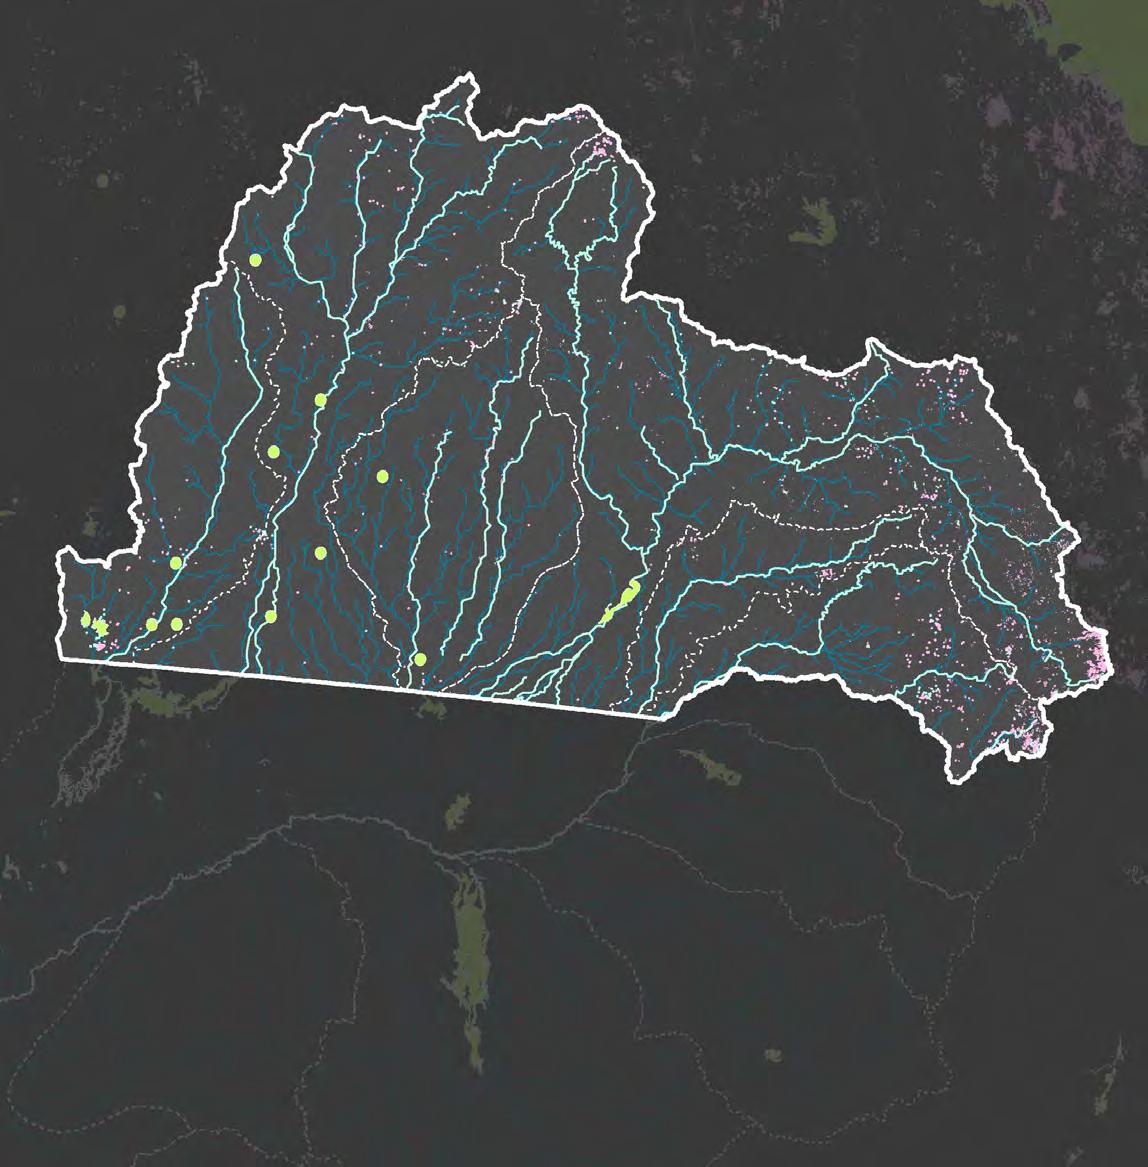
Mapping Question: What is the relationship between the surface water system and the regulated endangered and of concern vegetations?
Data Sources:
Matters of state environmental significance - Regulated vegetation - category B endangered or of concernQueensland <https://qldspatial.information.qld.gov.au/catalogue/ custom/detail.page?fid={5E77558D-CFF5-43BF-B5629A6C74C3E5C8}>
Matters of state environmental significance - Regulated vegetation - category C endangered or of concernQueensland <https://qldspatial.information.qld.gov.au/catalogue/ custom/detail.page?fid={002E8C48-D332-4FC0-A3C802C2E0BB50D6}>
Directory of important wetlands - Queensland <https://qldspatial.information.qld.gov.au/catalogue/ custom/detail.page?fid={21B6FAAC-02BF-4EEE-8E725055C43157EF}>
15
When combining these two elements, it is clearly shown that most habitats are
the steams, no matter
or
This is strong evidence that if Indigenous people want to maintain/ recover
culturally important species (CIS), water holding
critical
goal.
A similar trend to the wildlife distribution means many endangered or of concern vegetations live along the surface water system. It highly covers the same area compared with endangered wildlife habitats. Another aspect
the land use
agriculture. Legend Legend Hydrology & Habitat Relationship Hydrology & Endangered/Of Concern Vegetation Wildlife Habitat - Least Concern Wildlife Habitat - Endangered or Vulnerable High Ecological Significance wetlands Important Wetlands Important Wetlands Major Rivers Major Rivers Hydrology streams above 3 Hydrology streams above 3 N N 0 0 50 50 100 100 200 Km 200 Km Category B Containing Endangered Category B Containing of Concern Category C Endangered/of Concern Relationships Hydrology, Vegetation, and Wildlife Habitat
Hydrology map self-made based on elevation map 1km cells Findings:
along
endangered
not.
the
is
to achieving this
Findings:
affecting this layout is
for
Relationships
Agricultural Land Use, Vegetation, and Wetlands
Endangered/of Concern Vegetation
Mapping Question: What is the relationship between the regulated endangered/of concern vegetation and agricultural land use?
Data Sources: Land use of Australia 2010–11 to 2015–16, 250 m. Department of Agriculture, Fisheries, and Forestry. <https://www.agriculture.gov.au/abares/aclump>
Matters of state environmental significance - Regulated vegetationcategory B endangered or of concern - Queensland <https://qldspatial.information.qld.gov.au/catalogue/custom/detail. page?fid={5E77558D-CFF5-43BF-B562-9A6C74C3E5C8}>
Matters of state environmental significance - Regulated vegetationcategory C endangered or of concern - Queensland <https://qldspatial.information.qld.gov.au/catalogue/custom/detail. page?fid={002E8C48-D332-4FC0-A3C8-02C2E0BB50D6}>
Hydrology map self-made based on elevation map 1km cells
Findings: This map depicts the overlay between the agricultural land use and the endangered/of concern vegetation (all categories) in this area. It is obvious that these two aspects highly overlap in this part of the basin. Certain agricultural lands can be converted into wildlife habitats to improve the local ecosystem.
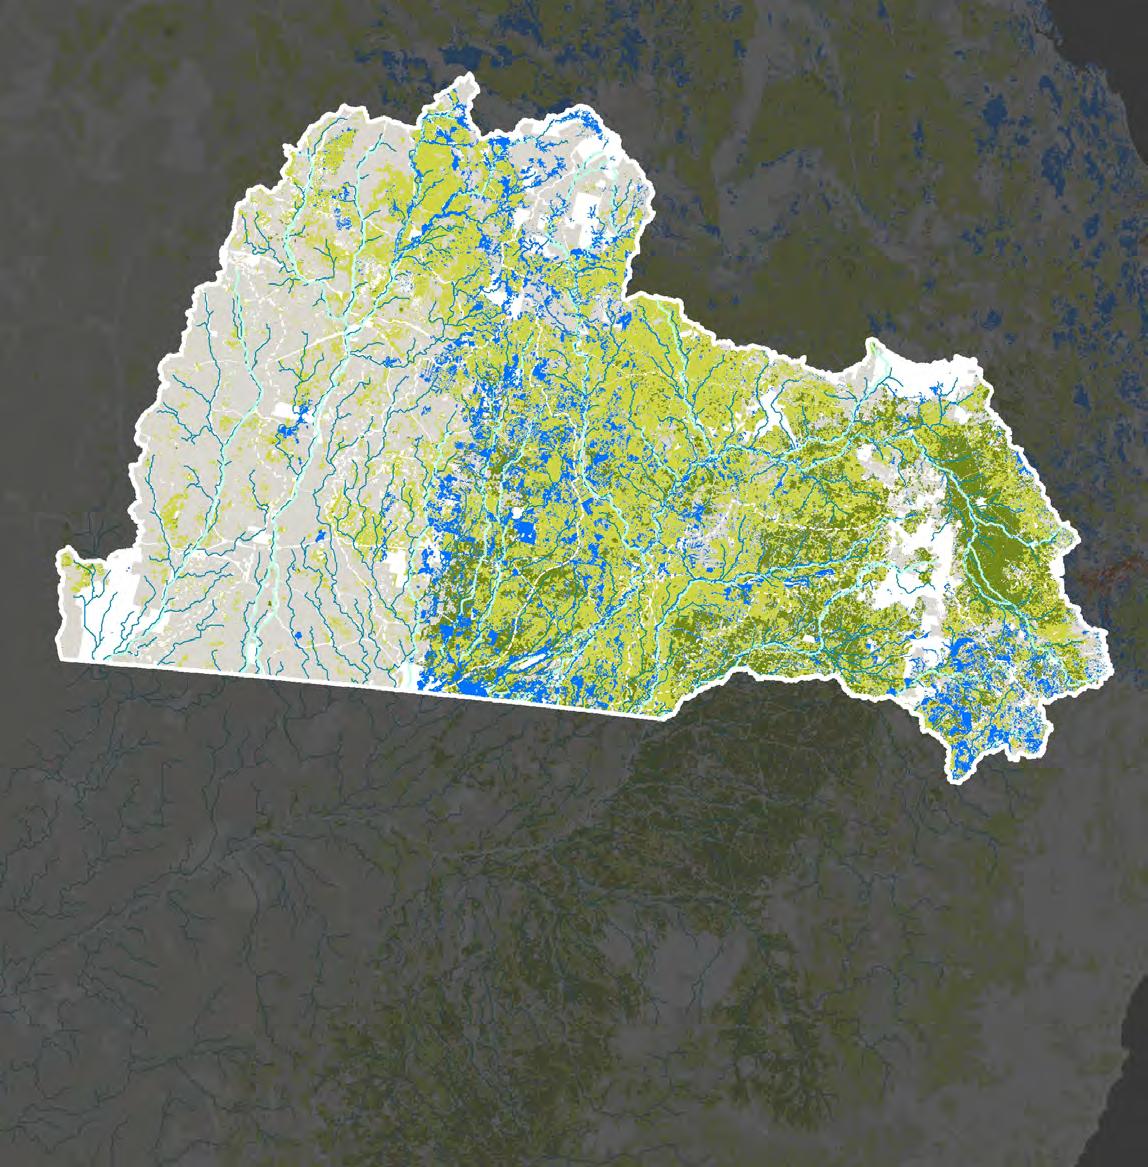
Mapping Question: What is the relationship between the hydrology system and regulated vegetation nearby?
Data Sources:
Matters of state environmental significance - Regulated vegetation100m from wetland - Queensland <https://qldspatial.information.qld.gov.au/catalogue/custom/detail. page?fid={2F11DA9C-2D51-4AB4-9559-55DB8CC62D87}>
Matters of state environmental significance - Regulated vegetationcategory B endangered or of concern - Queensland <https://qldspatial.information.qld.gov.au/catalogue/custom/detail. page?fid={5E77558D-CFF5-43BF-B562-9A6C74C3E5C8}>
Matters of state environmental significance - Regulated vegetationcategory C endangered or of concern - Queensland <https://qldspatial.information.qld.gov.au/catalogue/custom/detail. page?fid={002E8C48-D332-4FC0-A3C8-02C2E0BB50D6}>
Hydrology map self-made based on elevation map 1km cells

Findings:
In the west part of the region, regulated vegetations within 100m have been mapped. Their distribution is highly linked with existing wetlands according to the map. This will help find the potential watering place for cultural flow and rehabilitation of the ecosystem.
16
N N 0 0 50 50 100 100 200 Km 200 Km
Legend Agricultural Industry Land Use and Endangered/of Concern Vegetation
Endangered/of Concern Vegetation
Major Rivers Hydrology streams above 3 Other Uses Grazing Native Vegetation Grazing Modified Pastures Cropping Horticulture Legend Hydrology & Endangered/Of Concern Vegetation Regulated Vegetation within 100m away from Wetlands Important Wetlands Major Rivers Hydrology streams above 3
Findings:
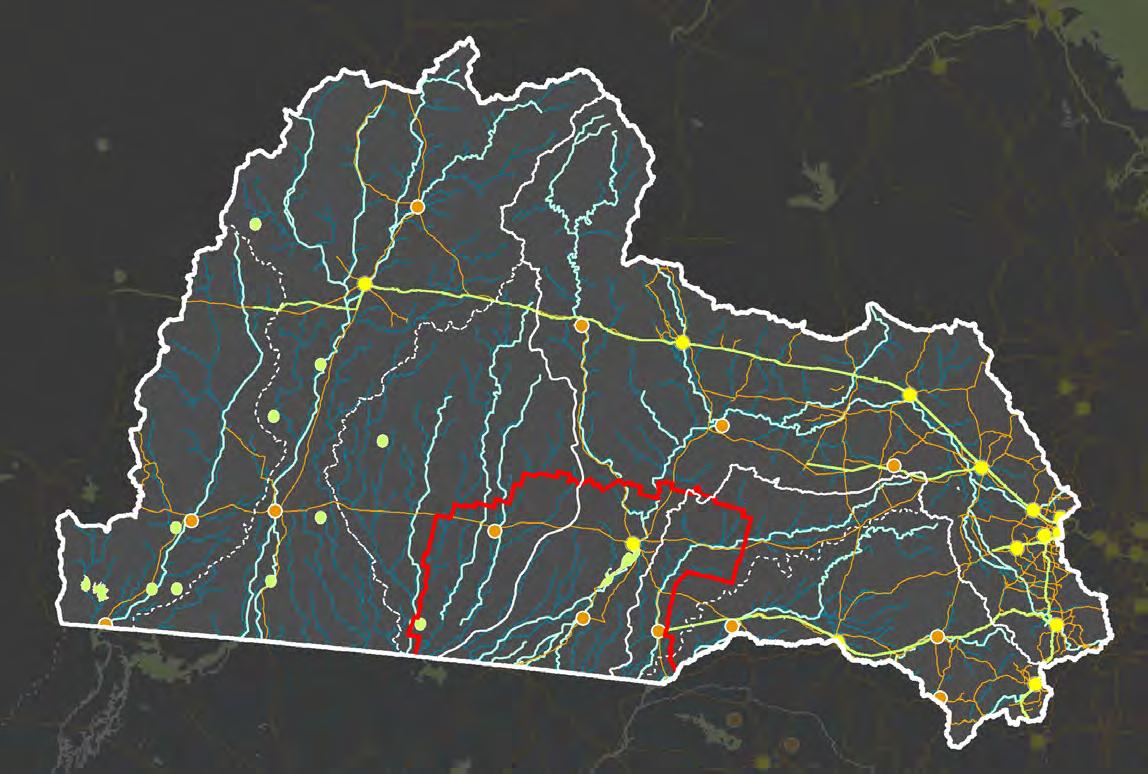
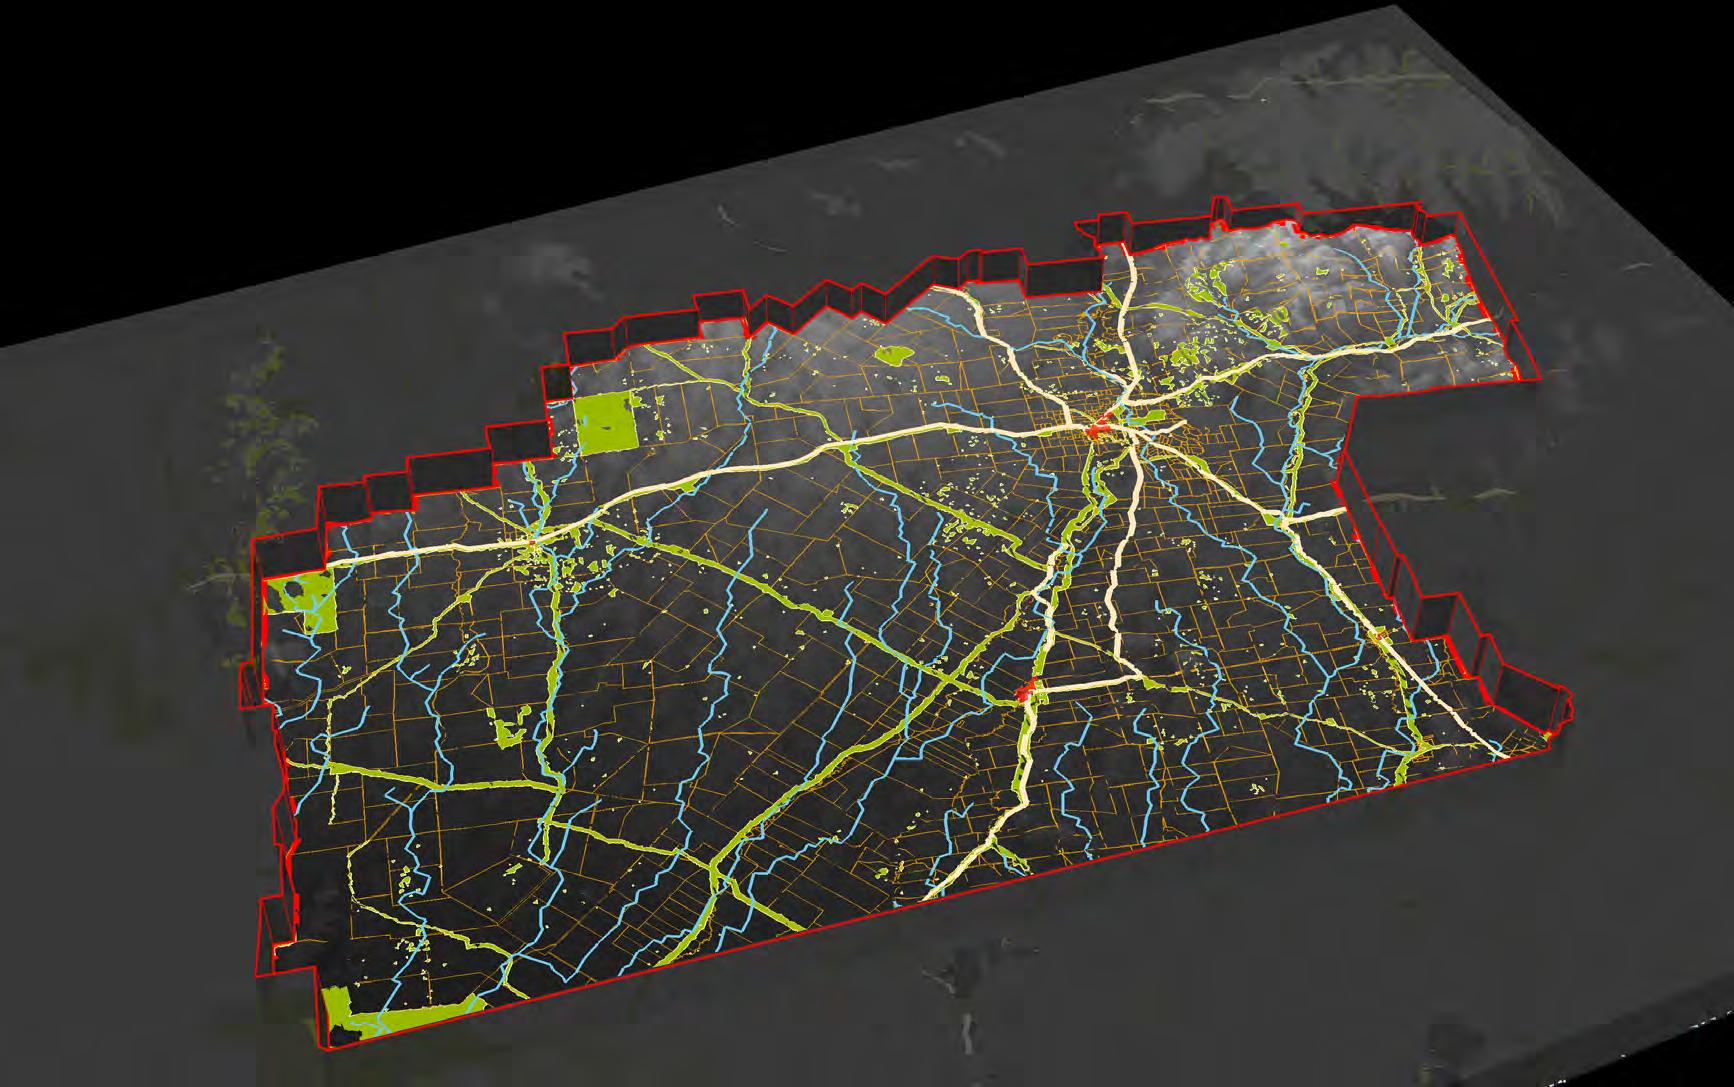
Since one of the research topics focuses on the potential watering place for cultural flow and Indigenous holdings, one factor cannot be ignored - the site should be relatively easy to get access for Indigenous People. After overlapping the major cities and towns, and the transportation system with the local hydrological system, the final answer is becoming clear.
Criterion:
1, the place must have existing floodplain/wetlands - for the development of Indigenous cultural flow and ecosystem rehabilitation;
2, this place has both endangered/of concern animals and vegetation distribution;
3, it is possible to connect the potential habitats/wetlands with hedgerow/agroforestry/native vegetation buffer to create a framework;
4, this place is not far from the state’s transportation system to ensure accessibility.
Under these rules, Ballone Shire becomes the test site. It meets every criterion, and it has a local Indigenous population in Saint George and Dirranbandi. In addition, one of the largest wetland ecosystems locates in the middle of the former two towns. Last but not the least, there are existing nature conservations at the west-south and west-north edges, which makes the connection with the wetland ecosystem and hydrology buffer important and possible.
17
the
Sources: Open Street Map Major Roads,
ArcGIS Online Railway
ArcGIS Online Google Map
of important wetlands - Queensland
Mapping Question: What is
relationship between the surface water system and the human habitat in this area? Data
Australia,
centrelines, Queensland,
Directory
<https://qldspatial.information.qld.gov.au/catalogue/ custom/detail.page?fid={21B6FAAC-02BF-4EEE-8E725055C43157EF}> Hydrology map self-made based on elevation map 1km cells
N 050100200 Km Legend Hydrology & Human Habitat Relationship Important Wetlands Major Rivers Hydrology streams above 3 Major Cities Major Roads Railways Boundary of
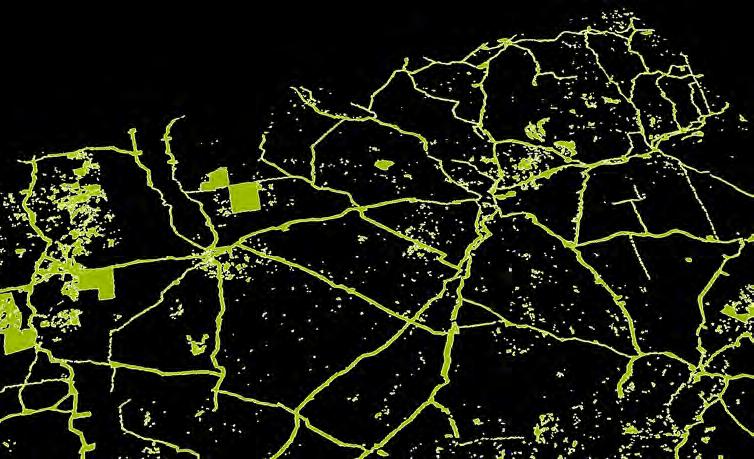
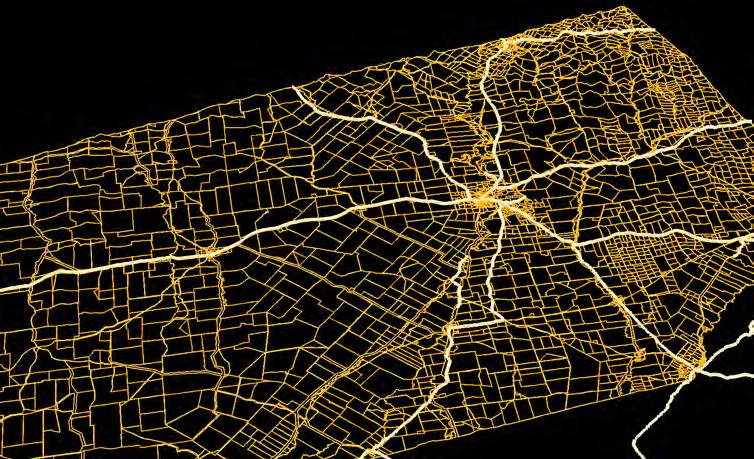
Shire Major Towns Bollon Saint George Dirranbandi Thallon Legend Nature Conservation & Other Minimal Use Major City Form Hydrology streams above 3 Major Roads Boundary of
Shire Cadastral Boundary Relationships Transportation System and Hydrology
Balonne
Balonne
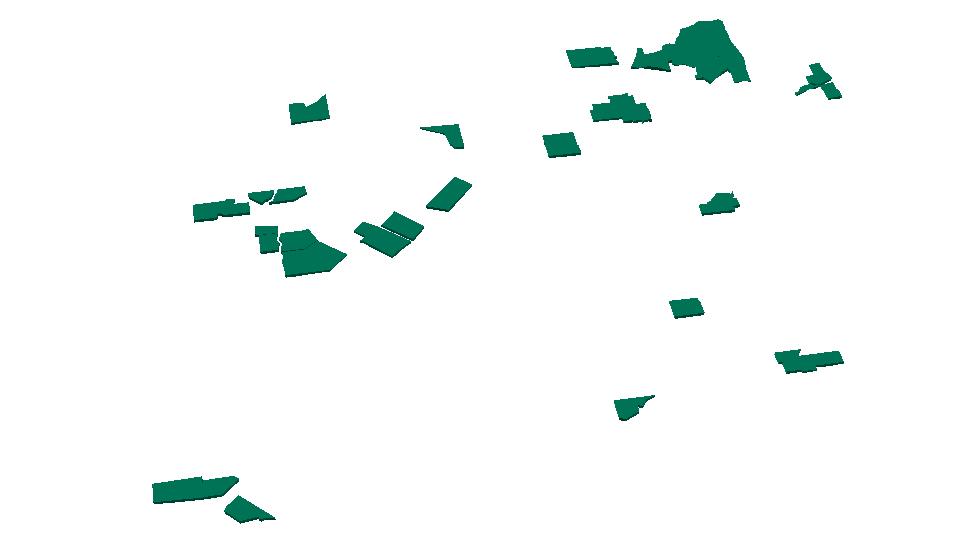
Mapping Question: Where are the potential wildlife habitats if certain farmlands can be converted?
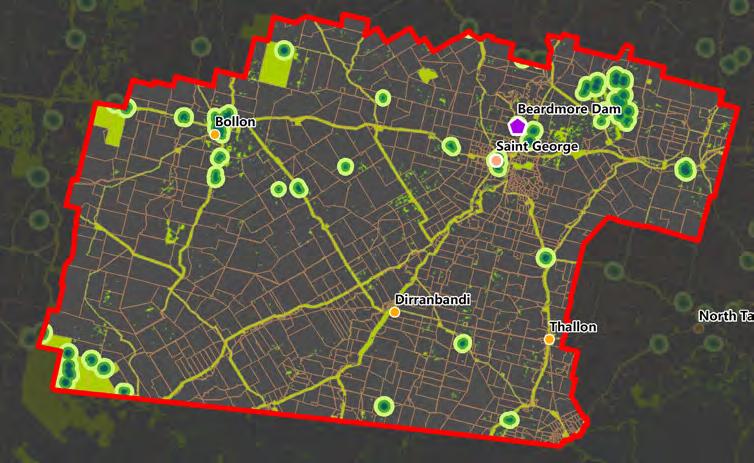

Data Sources: Property boundaries Queensland <https://qldspatial.information.qld.gov.au/catalogue/custom/search. page?q=%22Property%20boundaries%20Queensland%22>
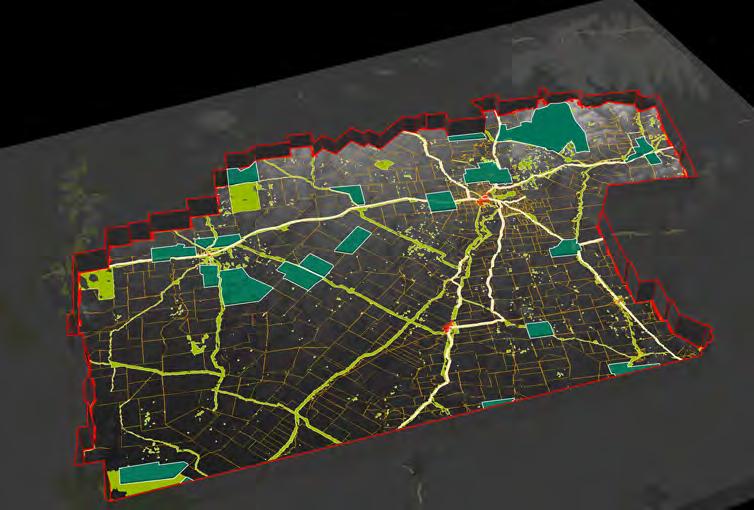
Land use of Australia 2010–11 to 2015–16, 250 m
Matters of state environmental significance - wildlife habitatendangered or vulnerable wildlife <https://qldspatial.information.qld.gov.au/catalogue/custom/detail. page?fid={5C9451C7-D712-4B8D-B3CA-9B21ED1A8215}>
Findings:
18
Legend Dam Town Nature Conservation & Other Minimal Use Potential Wildlife Habitat Cadastral Boundary Main Road
N 012.525
Several new patches are developed in the landscape matrix by combining minimal use & nature conservation, endangered/vulnerable wildlife, and the cadastral boundary. These lands can be natural refuges, or more sustainably, function as the agroforestry system used by Indigenous People before the European colonists for thousands of years. Potential Wildlife Habitat Generation
50 Km Potential Wildlife Habitat (agroforestry)
Existing endangered or vulnerable wildlife habitat buffer, 500, 1500, and 3000m
Nature Conservation & Other Minimal Use
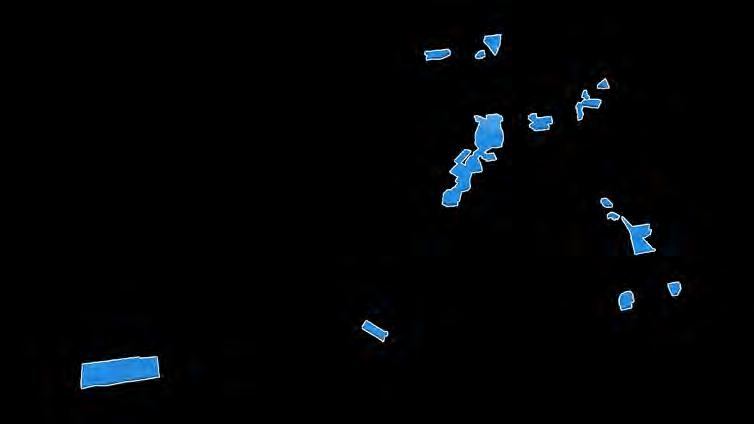
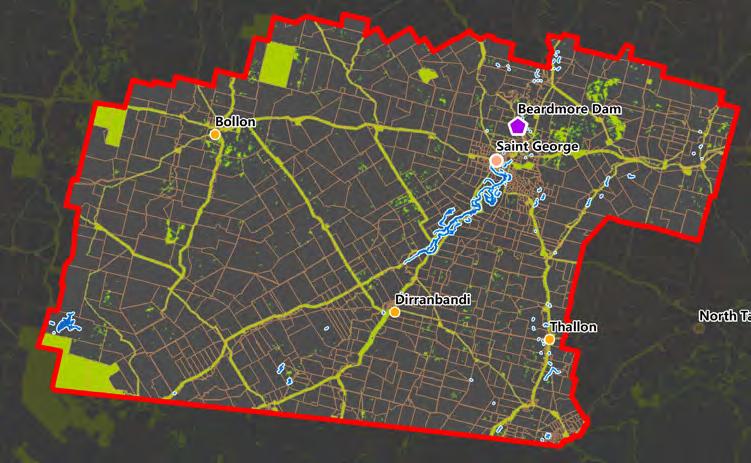
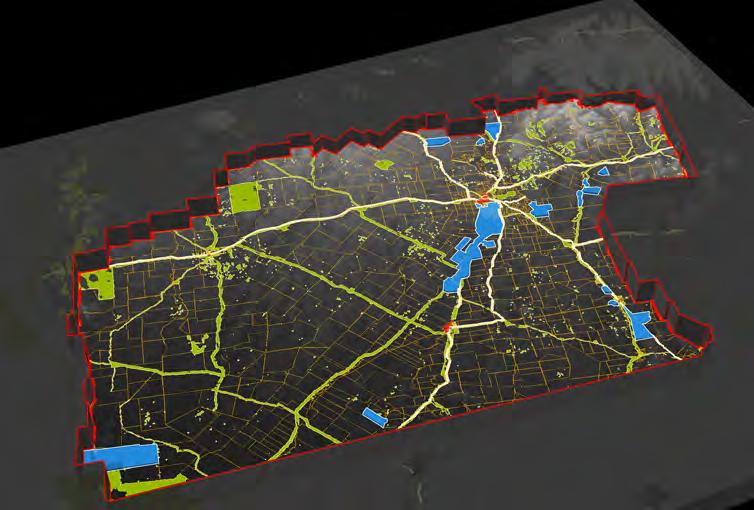
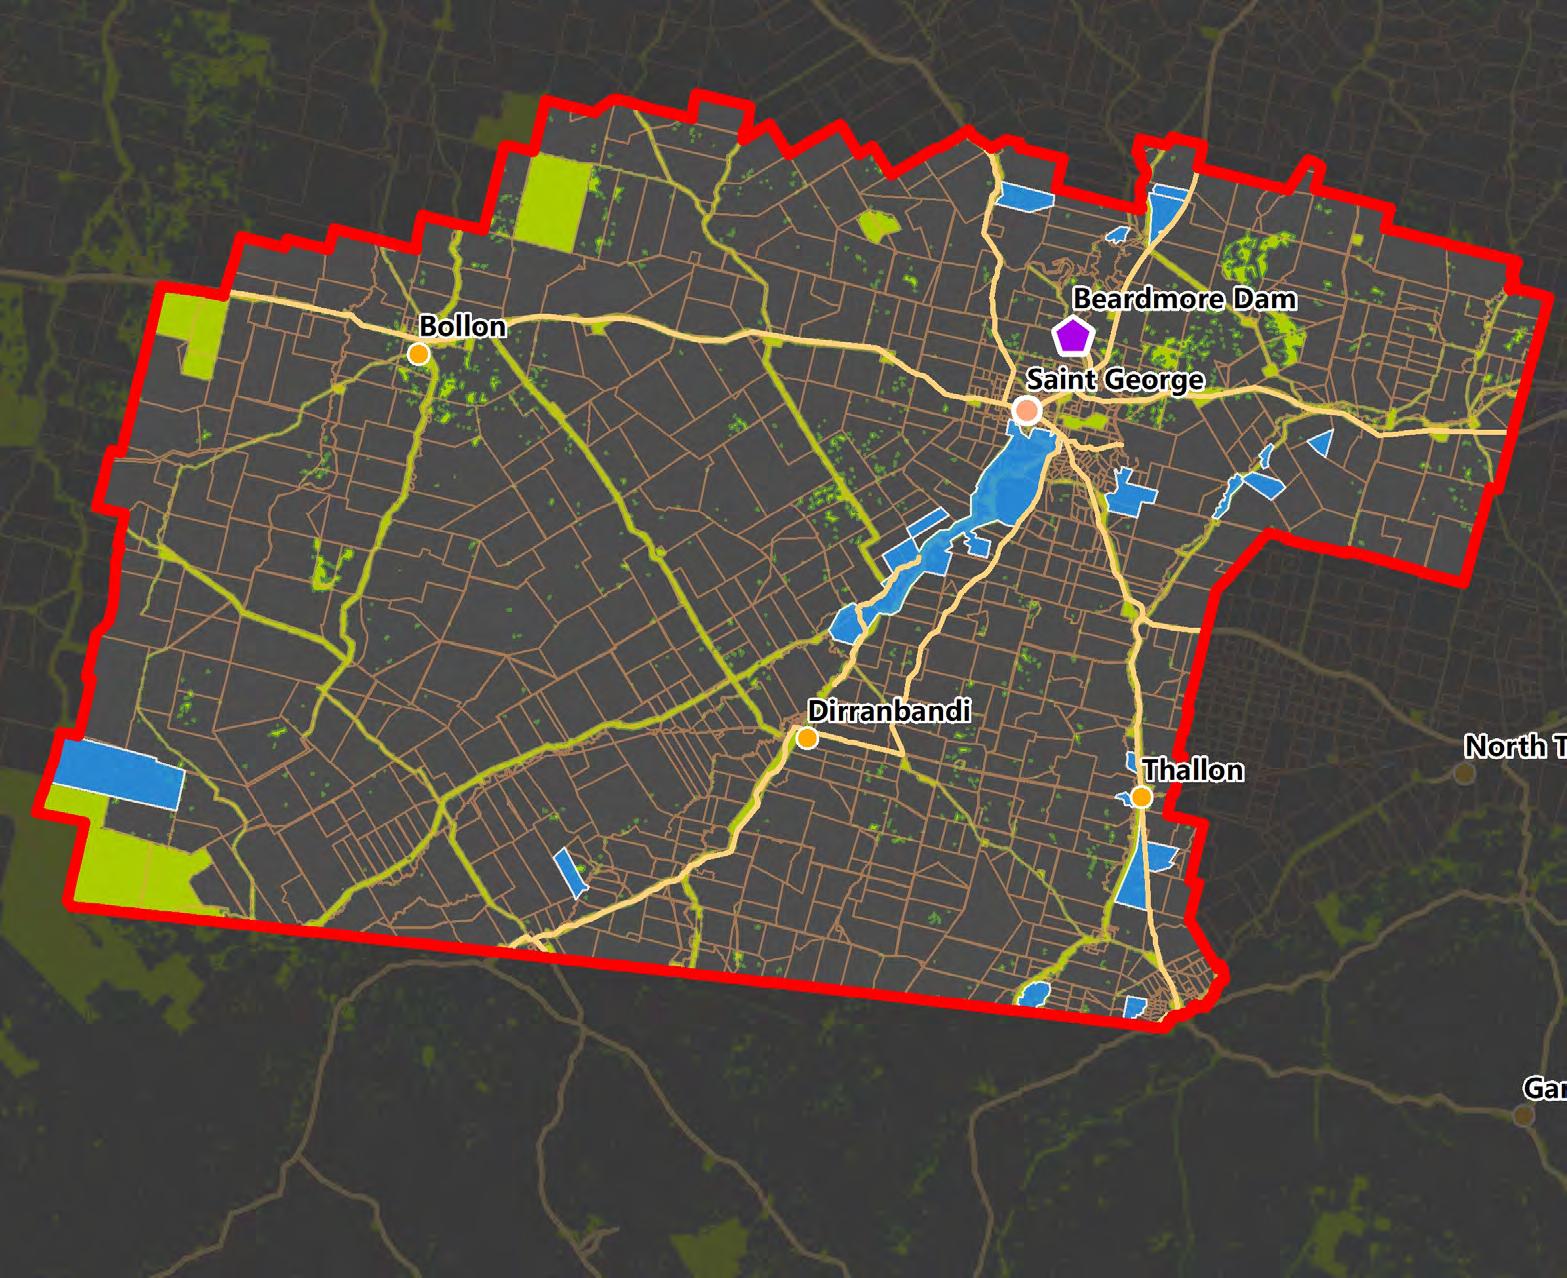
Mapping Question: Where are the potential water holdings for Indigenous People?
Data Sources: Property boundaries Queensland <https://qldspatial.information.qld.gov.au/catalogue/custom/search. page?q=%22Property%20boundaries%20Queensland%22>


Land use of australia 2010–11 to 2015–16, 250 m
Matters of state environmental significance - High ecological significance wetlands - Queensland <https://qldspatial.information.qld.gov.au/catalogue/custom/detail. page?fid={399493AE-5F42-4051-A16E-F9F1B6C1C25B}>
Findings: There are some existing wetlands, but contribute a very few proportion of the total area. Apart from the significant one in the middle of the map, others distribute widely and are scattered. Since the watering holdings are attached to land rights, if the cadastre with wetland can return to Indigenous people, the water holdings problem, land distribution, and local biodiversity can be resolved to a certain extent.
19
N 012.525 50 Km
Potential Indigenous Watering Place Generation
Potential Wetland Areas
Existing wetland buffer, 200 and 600m Legend Dam Town Potential Wildlife Habitats Cadastral Boundary Main Road


20 Native Vegetation Buffer Development Generation
the
be
water quality and aquatic biodiversity?
Property
Land
Hydrology map self-made
map
cells
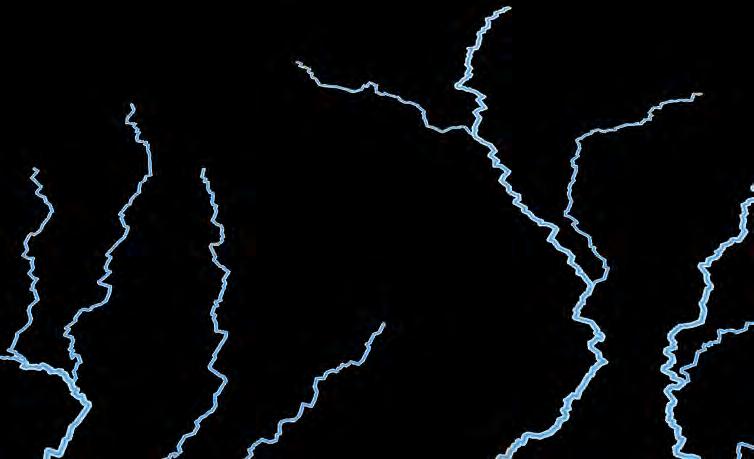
Hydrology has various levels
this area.
are
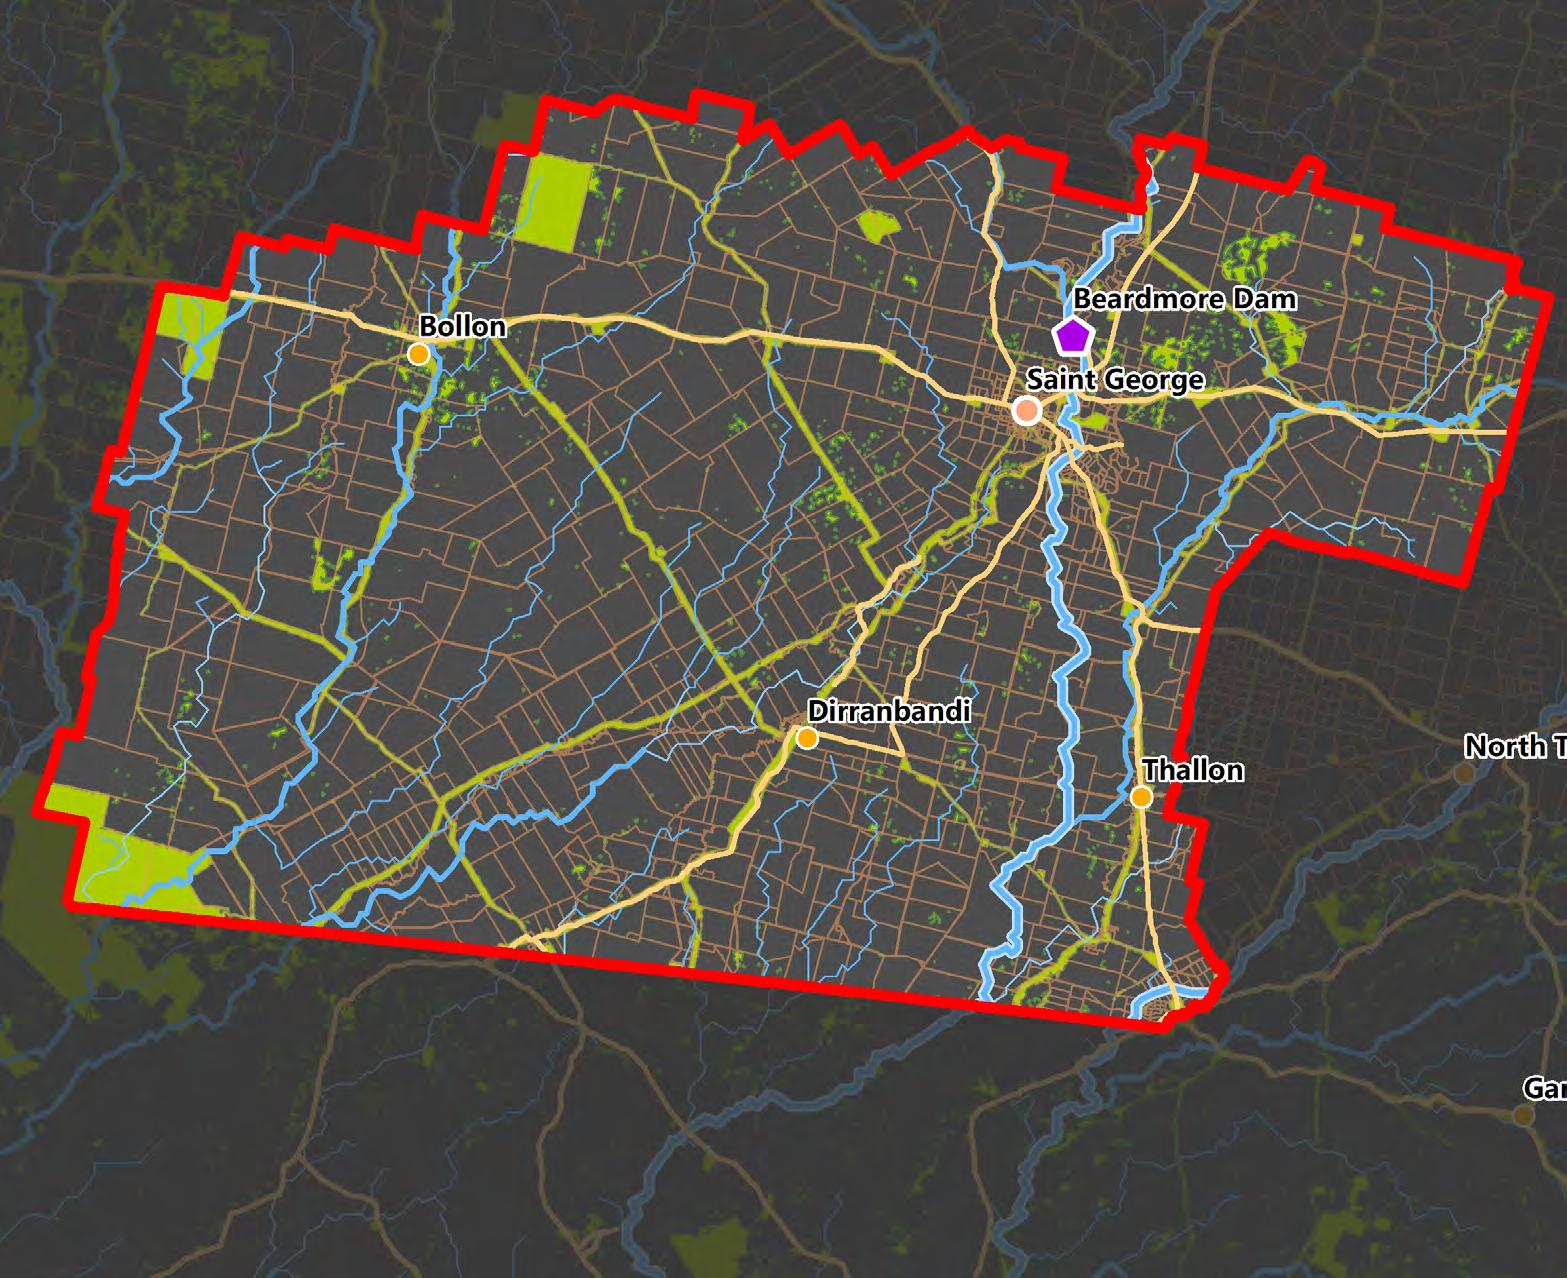
N 012.525 50 Km Legend Dam Town Nature Conservation & Other Minimal Use Native Vegetation Buffer Zones Cadastral Boundary Main Road Buffer zone 500m Buffer zone 1000m
Mapping Question: Where can
native vegetation buffer
developed to improve
Data Sources:
boundaries Queensland <https://qldspatial.information.qld.gov.au/catalogue/custom/search. page?q=%22Property%20boundaries%20Queensland%22>
use of australia 2010–11 to 2015–16, 250 m
based on elevation
1km
Findings:
in
The most significant ones (levels 6 and 7)
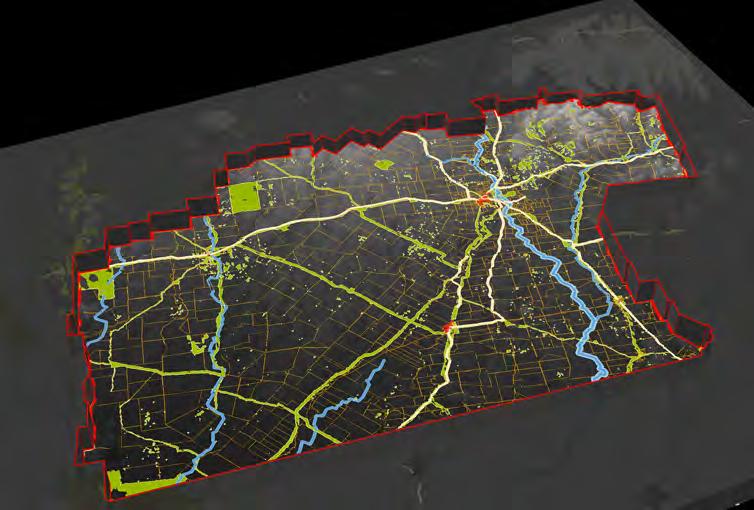
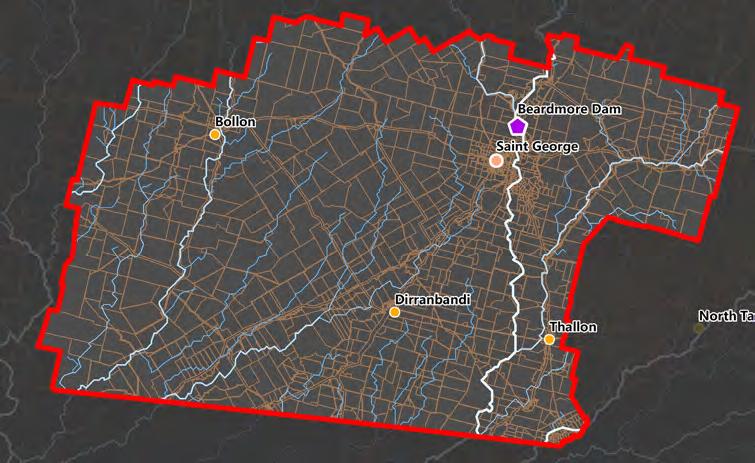
identified on the above map. Their flow direction is mainly from north to south, and some traces have already overlayed with the minimal use area. This design research tries to combine the buffer zone with the local cadastral boundaries, attempting to establish a framework of ecological fence for the local agriculture industry. The buffer zones are also under the potential Indigenous water holding consideration since it ensures the biodiversity of the hydrology system, and this is crucial for the Indigenous watering place.


 Prepared by : Huayang Sun 21 July 2022
RMIT University Landscape Architecture
Seminar Leader: Dr Ata Tara Flexibel Semester 2022
Liberating Digital Design Research Seminar


