The West African Papers series explores African socioeconomic, political and security dynamics from a regional and multidisciplinary perspective. It seeks to stimulate discussion and gather information to better anticipate the changes that will shape future policies. The series is designed for a wide audience of specialists, development practitioners, decision makers and the informed public. Papers are available in English and/or French, and summaries are available in both languages. Initiated by the Sahel and West Africa Club (SWAC) to highlight and promote West African issues, the work presented is prepared by its Secretariat, Members and partners, other OECD departments, related international organisations, associated experts and researchers.
Please cite this publication as: Bai Y., J. Bouscarat, P. Heinrigs, K. Sokourenko and K. Zougbédé (2023), “Healthy diets, costs and food policies in the Sahel and West Africa”, West African Papers, No. 39, OECD Publishing, Paris.
https://doi.org/10.1787/24142026
Author contact: Jill.Bouscarat@oecd.org
This work is published under the responsibility of the Secretary-General of the OECD. The opinions expressed and arguments employed herein do not necessarily reflect the official views of OECD member countries.
Co-funded by the European Union. Views and opinions expressed are however those of the author(s) only and do not necessarily reflect those of the European Union. Neither the European Union nor the granting authority can be held responsible for them.
This document, as well as any data and map included herein, are without prejudice to the status of or sovereignty over any territory, to the delimitation of international frontiers and boundaries and to the name of any territory, city or area.
Authorised for publication by Sibiri Jean Zoundi, Director (acting), Sahel and West Africa Club Secretariat (SWAC/OECD).
The use of this work, whether digital or print, is governed by the Terms and Conditions to be found at http://www.oecd.org/ terms and conditions.
Abstract:
The Sahel and West Africa region is facing a serious food and nutrition security crisis with high rates of acute malnutrition, combined with high rates of malnourishment and over-nourishment – the “triple burden of malnutrition”. Poor-quality diets are the root of all forms of malnutrition, as well as common non-communicable diseases, and are responsible for an estimated one in five adult deaths globally. The high cost of food is a key barrier to accessing a healthy diet. Even before the recent global inflation in food prices, West Africa’s food prices were 30%-40% higher than other regions in the world of comparable income levels. The paper analyses the costs of healthy diets in 17 countries in the Sahel and West Africa and which food groups drive up costs. The observed high cross-country variability in costs and cost composition points to a need for more targeted and nutrition-sensitive food system policies as well as the need to invest in better food price data and monitoring capacities.
Key words: Healthy diets, food systems, food prices, cost of diet, West Africa.
JEL classification: O55, Q11, Q13, Q18
THE SAHEL AND WEST AFRICA CLUB
The Sahel and West Africa Club (SWAC) is an independent international platform. Its Secretariat is hosted at the Organisation for Economic Co-operation and Development (OECD). Its mission is to promote regional policies that will improve the economic and social well-being of the people in the Sahel and West Africa. SWAC produces and maps data, drafts analyses and facilitates strategic dialogue in order to help policies better anticipate the transformations in the region and their territorial impact. It also promotes regional co-operation and more contextualised policies as a tool for sustainable development and stability. Its current areas of work are food dynamics, cities, environment, and security.
SWAC Members and partners include Austria, Belgium, Canada, CILSS (Permanent Interstate Committee for Drought Control in the Sahel), the ECOWAS (Economic Community of West African States) Commission, the European Commission, France, Germany, Luxembourg, the Netherlands, Spain, Switzerland, the UEMOA (West African Economic and Monetary Union) Commission and the United States. SWAC has memorandums of understanding with the University of Florida Sahel Research Group and the Geopolis Institute.
More information: www.oecd.org/swac
TABLE OF CONTENTS
INTRODUCTION
- The triple burden of malnutrition
- The need to shift towards healthy diets
- The importance of affordability, prices and markets
METHODS AND DATA
- Tracking the cost and affordability of healthy diets
- Diet costs and affordability indicators
- Data compilation and resources
- Data limitations and gaps
RESULTS
- Diet costs in Africa
- Which food groups are driving up the cost of healthy diets ?
- Cost of nutritious diets by population subgroups
DISCUSSION
- Guiding food system transformations to support healthy diets
- Reorienting food systems policies to ensure availability and access to healthy diets
- Promote affordability of healthy diets
- Improve monitoring and analytical capacities
INTRODUCTION
The triple burden of malnutrition
Access to healthy diets continues to be a major problem in the Sahel and West Africa. For the fourth year in a row, the number of acutely food-insecure people has increased, due mostly to insecurity and the large numbers of internally displaced people in countries affected by conflict according to the Cadre Harmonisé (CH). Sahelian countries have been particularly affected, and the prevalence of global acute malnutrition regularly exceeds a threshold of 10%, “high” according to the World Health Organization (WHO).
The acute food and nutrition insecurity situation is further aggravated by high rates of undernourishment and malnourishment. Of the West African adult population, 11% is underweight (van Wesenbeeck, 2018[1]). Chronic child undernutrition is alarmingly high, with nearly one out of three children suffering from severe or moderate stunting (27.7%). In addition, millions of people are suffering from widespread micronutrient deficiencies – known as “hidden hunger” – with important consequences for human health. Micronutrient deficiencies, particularly anaemia caused by iron deficiencies, are widespread among young children and women. In West Africa, nearly half of all women of reproductive age have anaemia (Balla, 2015[2]).
Meanwhile, over-nourishment is increasing rapidly. Almost 18% of the region’s adult population is overweight, and another 8% obese (van Wesenbeeck, 2018[1]). This underscores the seriousness of the “triple burden” of malnutrition – undernourishment, malnourishment and over-nourishment – and the need to refocus the agenda of food research and food policy on healthy diets.
The need to shift towards healthy diets
Poor diets are the leading cause of death in the world, responsible for an estimated one in five adult deaths globally (Afshin et al., 2019[3]). Poor-quality diets are the root of all forms of malnutrition as well as common non-communicable diseases and they affect both individuals and societies (Willett et al., 2019[4]). While stunting and obesity are the most visible forms of malnutrition (Masters, Rosenblum and Alemu, 2018[5]), diet quality is affecting health outcomes, whether from suboptimal consumption of healthy food, daily intake of unhealthy foods or from nutrients exceeding the optimal level.
In the past two decades, as a result of rapid population growth, urbanisation and rising incomes, West African countries have seen major changes in food systems and human nutrition (Staatz and Hollinger, 2016[6]).The changes in consumption habits are also creating new challenges in public health and nutrition. In particular, the most vulnerable groups are faced with decisions on how to allocate their food budgets, often constraining them to choose cheap but nutrient-poor starchy staple foods (Allen and Heinrigs, 2016[7]). In many urban settings, the nutritional transition is exacerbated by decreased physical activity.
Farm-level production and food value chain transformations are also impacting the nutritional outcomes of agricultural households. Recent studies have shown a decline in dietary diversity among these households as their products become more specialised and commercialised (Weatherspoon et al., 2019[8]) (Ecker, 2018[9]). But beyond agricultural households, food system transformations are spreading to rural areas, reshaping diets and increasing the importance of markets in accessing food.
Since the 1980s, per capita calorie availability has increased sharply in the region, from 1 945 kilocalories per capita per day in 1980 to 2 661 kilocalories per capita per day in 2019. In some countries, availability has increased by more than 50% (in Benin, Burkina Faso, Ghana and Mali). Although food availability has improved, diets overall lack diversity. A recent study from Nigeria shows that although per capita calorie availability increased by almost 40% between 1985 and 2015, the share of calories provided by non-staple foods remained constant (Olivier Ecker, 2020[10]). In Nigeria, urban households rely on staple foods, the dominant starchy foods consumed daily, for between 52% and 67% of their daily calories (60% to 76% for rural households) while a “recommended healthy diet suggests that about one-third of a person’s daily caloric intake should come from staple foods” (Olivier Ecker, 2020[10]). The focus on total calories needs to shift to a multidimensional approach, considering the intake of both macronutrients and micronutrients.
The definition of a “healthy diet” varies by region worldwide. The composition of a healthy diet may vary depending on individual characteristics, as well as the cultural context, dietary customs and foods that are locally available, but the basic principles of what constitutes a healthy diet are the same. Although there is consensus in the nutrition community on dietary requirements, which set up appropriate intake ranges of nutrients for healthy populations of all ages and sexes (National Academies Press, 2019[11]), diets based exclusively on nutrient reference intakes may lack certain food groups (for example, fruits and vegetables) and fail to provide the dietary diversity required to prevent diet-related chronic diseases (Bai, Herforth and Masters, 2022[12]). Linear programming tends to generate unrealistic diets that are not affordable and do not correspond with local preferences and the options available. Also, only very few consumers would be able to use computational modelling to calculate the appropriate diets precisely. Therefore, many countries issue food-based dietary guidelines (FBDGs) that reflect culturally and nutritionally appropriate dietary patterns (Annex A). These provide practical guidance for achieving adequate nutrients and dietary diversity from the different food groups. Diets following national dietary guidelines tend to meet needs for micronutrients, and to protect against diet-related chronic diseases such as diabetes, obesity, hypertension, cardiovascular diseases and various forms of cancer.
Increasing access to healthy diets will ultimately come from a combination of supply-side and demand-side actions and a better understanding of our food environments. Policy makers need to promote demand for healthy foods, while supporting increased supplies of vegetables, fruits, pulses and sustainably produced animal-source foods at affordable prices (Herforth, 2020[13]). To design effective and targeted policies, policy makers need to be able to assess the drivers of availability, accessibility and affordability of healthy diets.
The importance of affordability, prices and markets
The high price of food is a key barrier for access to sufficient, safe, nutritious food to meet dietary needs and satisfy food preferences for an active and healthy life (Herforth, 2020[13]). According to the Food and Agriculture Organization’s (FAO) Africa Regional Overview of Food Security and Nutrition (FAO, ECA and AUC, 2021[14]), Africans face some of the highest food prices compared to other regions at a similar level of development. Even before the recent inflation in food prices set off by the COVID-19 pandemic and Russia’s invasion of Ukraine, West Africa’s food prices were 30%-40% higher than other regions in the world of comparable income levels (Allen, 2017[15]).
Nutritious foods (such as fruits, vegetables, legumes, nuts and seeds, and animal-source foods) are relatively expensive compared to staples such as cereals and starchy roots (FAO, ECA and AUC, 2021[14]). In Africa, dairy products are the most expensive food group, followed by protein (from animal and plant sources) and fruit and vegetables (FAO, ECA and AUC, 2021[14]) (Allen, 2017[15]).
In all West African countries but Liberia and Senegal, vegetables and animal-sourced food combined account for more than 50% of the cost of a healthy diet. In consequence, the cost of a healthy diet is on average 3.6 times more expensive than an energy-sufficient diet.
Households in West Africa spent on average 50% of their income on food, making them particularly sensitive to food prices and their fluctuations. The recent inflation in food prices is further pushing healthy diets out of reach for millions of people and underscores the importance of price monitoring mechanisms for food and nutrition security. The retail food costs that consumers face at market provide a lens to identify opportunities for action and intervention in food environments. New diet-based indicators tracking the cost of a healthy diet can give policy makers and stakeholders throughout the food system new insight into the drivers of food insecurity. This study analyses the cost of healthy diets in the Sahel and West Africa, identifying costly nutritious food groups relative to other regions, to inform public policy interventions and further research.
METHODS AND DATA
Tracking the cost and affordability of healthy diets
Tracking the cost and affordability of a healthy diet at the systemic level has long been a substantial gap. One key reason for this has been the challenge of properly defining a healthy diet for monitoring purposes. To provide a globally comparable dietary standard across countries to track the cost of a healthy diet, the Food Prices for Nutrition project, a partnership between Tufts University, the World Bank and the International Food Policy Research Institute, has created the Healthy Diet Basket. This global standard averages food groups proportionally from 10 regionally representative and quantifiable national FBDGs in diverse regions – resulting in a dietary standard that represents the range of recommendations formulated by UN Member States (Herforth, 2022[16]).
Least-cost diets and affordability measures
Most marketplaces offer a variety of items to meet consumers’ needs for nutrition and health considerations. Food Prices for Nutrition aims to measure the lowest cost at which a country’s food system delivers the calories, essential nutrients and food groups required for different dietary standards, and to identify the income level that is required to afford a diet of equivalent quality. The purpose of the least-cost diet calculation is to establish a baseline – the lowest possible cost that someone would need to spend on a diet of the kind specified in national dietary guidelines. Least-cost diets allow for substitution among locally available items, based on the most affordable combination of foods that meet each definition of diet quality. Food preferences based on taste, convenience or cultural norms are likely to increase costs and are not taken into account here (Herforth, 2020[13]).
The diet cost ladder in Figure 1 highlights the expected levels of cost associated with achieving various levels of dietary adequacy. The first two rungs, the Cost of Caloric Adequacy (CoCA) and Nutrient Adequate Diet (CoNA) indicators, offer insights on food insecurity and national food system performance, but may not necessarily reflect habitual dietary behaviour or satisfy food preferences. A diet composed exclusively of starchy staples such as grains or tubers may not be a realistic reflection of the average diets in a given country, and nutrients alone do not explain the relationship between food and health – there are many nonessential nutrient components to consider, such as fibre, phytochemicals, the food matrix and the interactions between them. The cost of adhering to national FBDGs, which is tracked by the Cost of a Healthy Diet (CoHD) indicator, shifts focus from nutrients to actual foods, and focuses on the relative proportions of the food groups – prescribing a minimum standard that considers dietary diversity and is able to offer combinations that reflect country-specific norms and food preferences (Herforth, 2020[13]).
Figure 1.
The ladder of diet costs: Energy-Sufficient Diet (CoCA), Nutrient-Adequate Diet (CoNA), Healthy Diet (CoHD)
Source: Tufts University, World Bank and IFPRI (2022[17])
Diet costs and affordability indicators
This study depicts three types of diet, defined and computed as follows:
Cost of Caloric Adequacy (CoCA)
The Cost of Caloric Adequacy (CoCA) is defined as the minimum cost required to meet sufficient caloric energy – defined as 2 330 kilocalories (kcal) per person per day – for day-to-day subsistence needs. The CoCA indicator is the first rung on the diet cost ladder (Figure 1) and is calculated by determining the cost of the minimum amount of the least expensive starchy staple foods in each country required to meet energy needs (Herforth, 2020[13]). A caloric adequate diet allows for short-term survival but does not provide all the necessary nutrients for optimal health, and the resulting deficiencies incur the risk of disease, disability and premature mortality (Herforth, 2020[13]). Calculating the indicator can shed light on the most glaring cases of food insecurity, signalling areas where even the least expensive basic starchy staple foods are economically out of reach.
Cost of Nutrient Adequacy (CoNA)
The Cost of Nutrient Adequacy (CoNA) is defined as the minimum cost required to meet all essential nutrient requirements using the most affordable combination of foods available at a given time and place. Calculating the CoNA indicator requires linear programming – an optimisation model that uses algorithms to construct the least expensive food choices in each context to satisfy the recommended daily intake of 23 macronutrients (carbohydrates, proteins and fats) and micronutrients (vitamins and minerals).
This dietary criterion is meant to avoid a deficiency or excess of caloric energy (2 330 kcal per person per day) and essential nutrients (Herforth, 2020[13]). Least-cost diets that achieve minimum nutrient adequacy may not meet other criteria, such as an energy balance between food groups, that are needed for longterm health and protection against non-communicable disease. The Cost of Nutrient Adequacy may not necessarily produce realistic food item combinations or reflect the dietary choices that people are likely to make. However, this method has proven especially useful to estimate the cost of specific dietary needs across different sub-populations – including age, gender, and reproductive status.
Cost of a Healthy Diet (CoHD)
The Cost of a Healthy Diet (CoHD) refers to the cost of adhering to healthy eating guidelines such as national food-based dietary guidelines (FBDGs), which are designed to promote healthy eating habits and prevent diet-related chronic diseases. The CoHD indicator reflects the cost of a realistic diet with energy balance and dietary diversity between recommended food groups as well as within them – meaning that a variety of different foods should be consumed within each food group. A diet that meets FBDG criteria is likely to meet nutritional needs (adequacy of essential macro- and micronutrients) when followed consistently and providing a variety of foods from all recommended food groups in the recommended amounts.
Three data inputs are required to calculate CoHD in each country: (1) the retail prices of local food items, (2) basic food composition data for each food item (the edible portion and the energy density in kcal), and (3) the recommended daily amounts for each food group (according to the FBDG used). For global calculations that are comparable between the countries and used in this analysis, the CoHD indicator is calculated by selecting the least expensive foods that meet the proportions of the different food groups of the Healthy Diet Basket, which provides a global reference point that is representative of national FBDGs and reflects their commonalities.
The Healthy Diet Basket is composed of six food groups: starchy staples (SS), vegetables (V), fruits (F), legumes, nuts and seeds (LNS), animal-source foods (ASF), and oils and fats (OF).
Cost and Affordability of a Healthy Diet (CoAHD)
The Cost and Affordability of a Healthy Diet (CoAHD) approach measures physical and economic access to locally available foods, in the quantities required for an active and healthy life.
Affordability of a Healthy Diet is a complementary indicator to CoHD, which takes into account the average income and food expenditures in each country. Affordability is reported as the percentage of people (or number of people) who cannot afford CoHD in a given country – which complements cost information with the average financial circumstances of a population. The data inputs required to calculate affordability in each country are: (1) the cost of a healthy diet, (2) population income distribution, and (3) average food expenditure as a share of total budget.
Data compilation and resources
This study covers various food security and nutrition indicators based on the diet cost of food in West Africa and draws on several sources of data described below. All indicators used in this report are national averages – which offer meaningful comparability across countries and are used for global monitoring.
World Bank Food Prices for Nutrition DataHub: This database reports the latest estimates of the Food Prices for Nutrition indicators. The retail food price data are provided by the World Bank’s International Comparison Program (ICP), a global statistical initiative that collects comparative food retail price data (in local currency units) for 680 foods and non-alcoholic beverages across 176 economies. The latest food price data were collected in 2017. While the ICP dataset provides reliable and comparable food price data across countries, only national averages can be generated with these figures (with no temporal or geo-spatial granularity) and some price data for country-specific foods may not be captured. 7
Other World Bank databases: Findings also rely on the World Bank income distribution data and expenditure share data across countries. For the affordability indicators, such as the percentage and number of people who are unable to afford healthy diets in each country and year, national income distributions are sourced from the World Bank Poverty and Inequality Platform (PIP). Share of household expenditure spent on food is taken from each ICP cycle. According to the ICP 2017 dataset, households in low-income countries spend on average 52% of their income on food – leaving 48% of their income for other expenses. Additionally, the World Bank’s World Development Indicator database documents purchasing power parity (PPP) conversion factors, which are used to convert food prices in local currency into international dollars.
Data limitations and gaps
The food price data from the ICP monitors a limited list of foods, which are selected in terms of global relevance and comparability – allowing for comparison of indicators from one country to another. The list of foods for which market prices are collected does not represent all the items and ways that people obtain food in their given context. The ICP provides standardised data on retail food prices, but how people access food involves considerable variation. In particular, low-income populations might obtain foods in other ways and/or at a lower cost than the results suggest. Alternative sources of procuring food may include home production, foraging for wild fruits or hunting, gifts received, or the strategic purchase of lower-quality or less attractive food items than those considered by enumerators that collect price data for the ICP (Bai, Herforth and Masters, 2022[12]).
In addition, the ICP reports the mean annual price of each food, and results are based on a national average to represent diet costs in each country. Further detailed data from within countries is critical for studying temporal or spatial variation of diet costs throughout the year, and across different states and regions where different foods are likely to be available and/or affordable. Using the locally representative Consumer Price Index (CPI) data from national statistical organisations would provide food price information for more locally relevant and culturally appropriate foods in each country and would offer a more context-specific data source for the calculation of diet cost indicators.
Finally, the production, procurement and preparation of food involves several hidden costs. Understanding these externalities – whether social, health-related or environmental – can complement the diet cost indicators discussed in this report with insights about the real-life constraints faced by consumers, and the preferences they adopt to navigate these obstacles. Quite apart from acquiring the raw ingredients, people may not have the time, cooking fuel, skills or resources that are needed to prepare safe, healthy meals with the least-cost basket of foods (Masters et al., 2023[18]).
As for affordability, the estimate of the average share of total household expenditure spent on food (52%), used to measure consumer purchasing power, is likely to vary considerably between countries and population groups. Reliable local data on earnings, wages and overall income are therefore needed to measure affordability more accurately.
RESULTS
Diet costs in Africa
Lowest cost of diets (CoCA, CoNA, CoHD)
This section compares the three diet cost indicators – Cost of Caloric Adequacy (CoCA), Cost of Nutrient Adequacy (CoNA) and Cost of a Healthy Diet (CoHD) – between West Africa and other African regions (i.e. North, East, Southern and Central Africa).
Figure 2.
Average cost of the three diets (CoCA, CoNA, CoHD), by region
USD per person per day, 2017
Note: The figure presents the average USD cost per person per day of the three diets. Diet cost indicators presented above are unweighted group means and do not account for the relative population size of each country. West Africa refers to the ECOWAS sub-region, UEMOA and CILSS member countries. It includes 17 countries: Benin, Burkina Faso, Cabo Verde, Chad, Côte d’Ivoire, Gambia, Ghana, Guinea, Guinea-Bissau, Liberia, Mali, Mauritania, Nigeria, Niger, Senegal, Sierra Leone and Togo.
Source: FAO, IFAD, UNICEF, WFP and WHO (2022[19]) and World Bank (2022[20]).
The cost of energy-sufficient diets (CoCA), the first level of the diet cost ladder (Figure 1), represents the lowest of the three levels of diets. In West Africa, the average cost of an energy-sufficient diet is USD 0.90 per day. The average CoCA differs only moderately across the five African regions (Figure 4), ranging between USD 0.77 and USD 0.95 per day. However, these regional averages obscure significant regional variations. In West Africa, the CoCA ranges from USD 0.57 per day in Burkina Faso to USD 1.94 per day in Togo. At the continental level, the CoCA ranges between USD 0.29 and USD 1.94 per day, with a median cost of USD 0.81 per day.
Southern Africa North Africa
Central Africa West Africa East Africa
As expected, the average cost of diet increases as the quality of the diet increases (Figure 2). The average cost of a nutrient-adequate diet in West Africa is USD 2.23 per day, around 2.5 times more than the energysufficient diet. Only in Southern Africa is the average CoNA higher (USD 2.55 per day). In North, East and Central Africa, the average CoNA is USD 2.10 to USD 2.14 per day.
In West Africa the minimum cost of healthy diets ranges between USD 2.19 per day (Senegal) and USD 4.02 per day (Liberia) (Figure 3). The average cost of a healthy diet is USD 3.22 per day, a further 1.4 times more than the average nutrient-adequate diet and 3.6 times more than an energy-sufficient diet. The five countries where the cost of a healthy diet is highest are Liberia (USD 4.02 per day), Ghana (USD 3.77 per day), Guinea (USD 3.66 per day), Nigeria (USD 3.57 per day) and Benin (USD 3.55 per day). The cost in Liberia is almost twice as high as in Senegal, the country with the lowest cost (USD 2.19 per day). On the continent as a whole, the average cost of a healthy diet is USD 3.25 per day, and West Africa offers a middle ground between other regions. In other African regions, the average CoHD ranges from USD 3.02 (East Africa) to USD 3.75 per day (Southern Africa). The average cost of a healthy diet is considerably lower in East Africa and much higher for Southern Africa.
Figure 3.
Average cost of the three diets (CoCA, CoNA, CoHD) in West Africa, by country
USD per person per day, 2017
CoCA
Liberia
Ghana
Guinea
Nigeria
Benin
Mauritania
Cabo Verde
Côte d’Ivoire
West Africa
Burkina Faso
Guinea-Bissau
Gambia
Mali
Niger
Sierra Leone
Chad
Cameroon
Senegal
Togo
CoNA
Note: The figure presents the average USD cost per person per day for the three diets. West Africa refers to the ECOWAS subregion, UEMOA and CILSS member countries. It includes 17 countries: Benin, Burkina Faso, Cabo Verde, Chad, Côte d’Ivoire, Gambia, Ghana, Guinea, Guinea-Bissau, Liberia, Mali, Mauritania, Nigeria, Niger, Senegal, Sierra Leone and Togo. CoHD is missing for Togo, as no data is available for this country. Data for Cameroon are also presented but are not included while computing the West Africa regional average.
Source: FAO, IFAD, UNICEF, WFP and WHO (2022[19]) and World Bank (2022[20]).
CoHD
Figure 4.
Distribution of the three diet cost indicators (CoCA, CoNA, CoHD), by region
USD per person per day, 2017
East Africa (n=15)
West Africa (n=17)
Central Africa (n=6)
North Africa (n=5)
Southern Africa (n=6)
Note: The figure shows a box plot and presents the distribution of the three diets by region. Each box represents the interval of the diet cost indicators ranging between 25% and 75%, the line representing the median and the cross the average. West Africa refers to the ECOWAS sub-region, UEMOA and CILSS member countries. It includes 17 countries: Benin, Burkina Faso, Cabo Verde, Chad, Côte d’Ivoire, Gambia, Ghana, Guinea, Guinea-Bissau, Liberia, Mali, Mauritania, Nigeria, Niger, Senegal, Sierra Leone and Togo.
Source: FAO, IFAD, UNICEF, WFP and WHO (2022[19]) and World Bank (2022[20]).
Affordability of a healthy diet
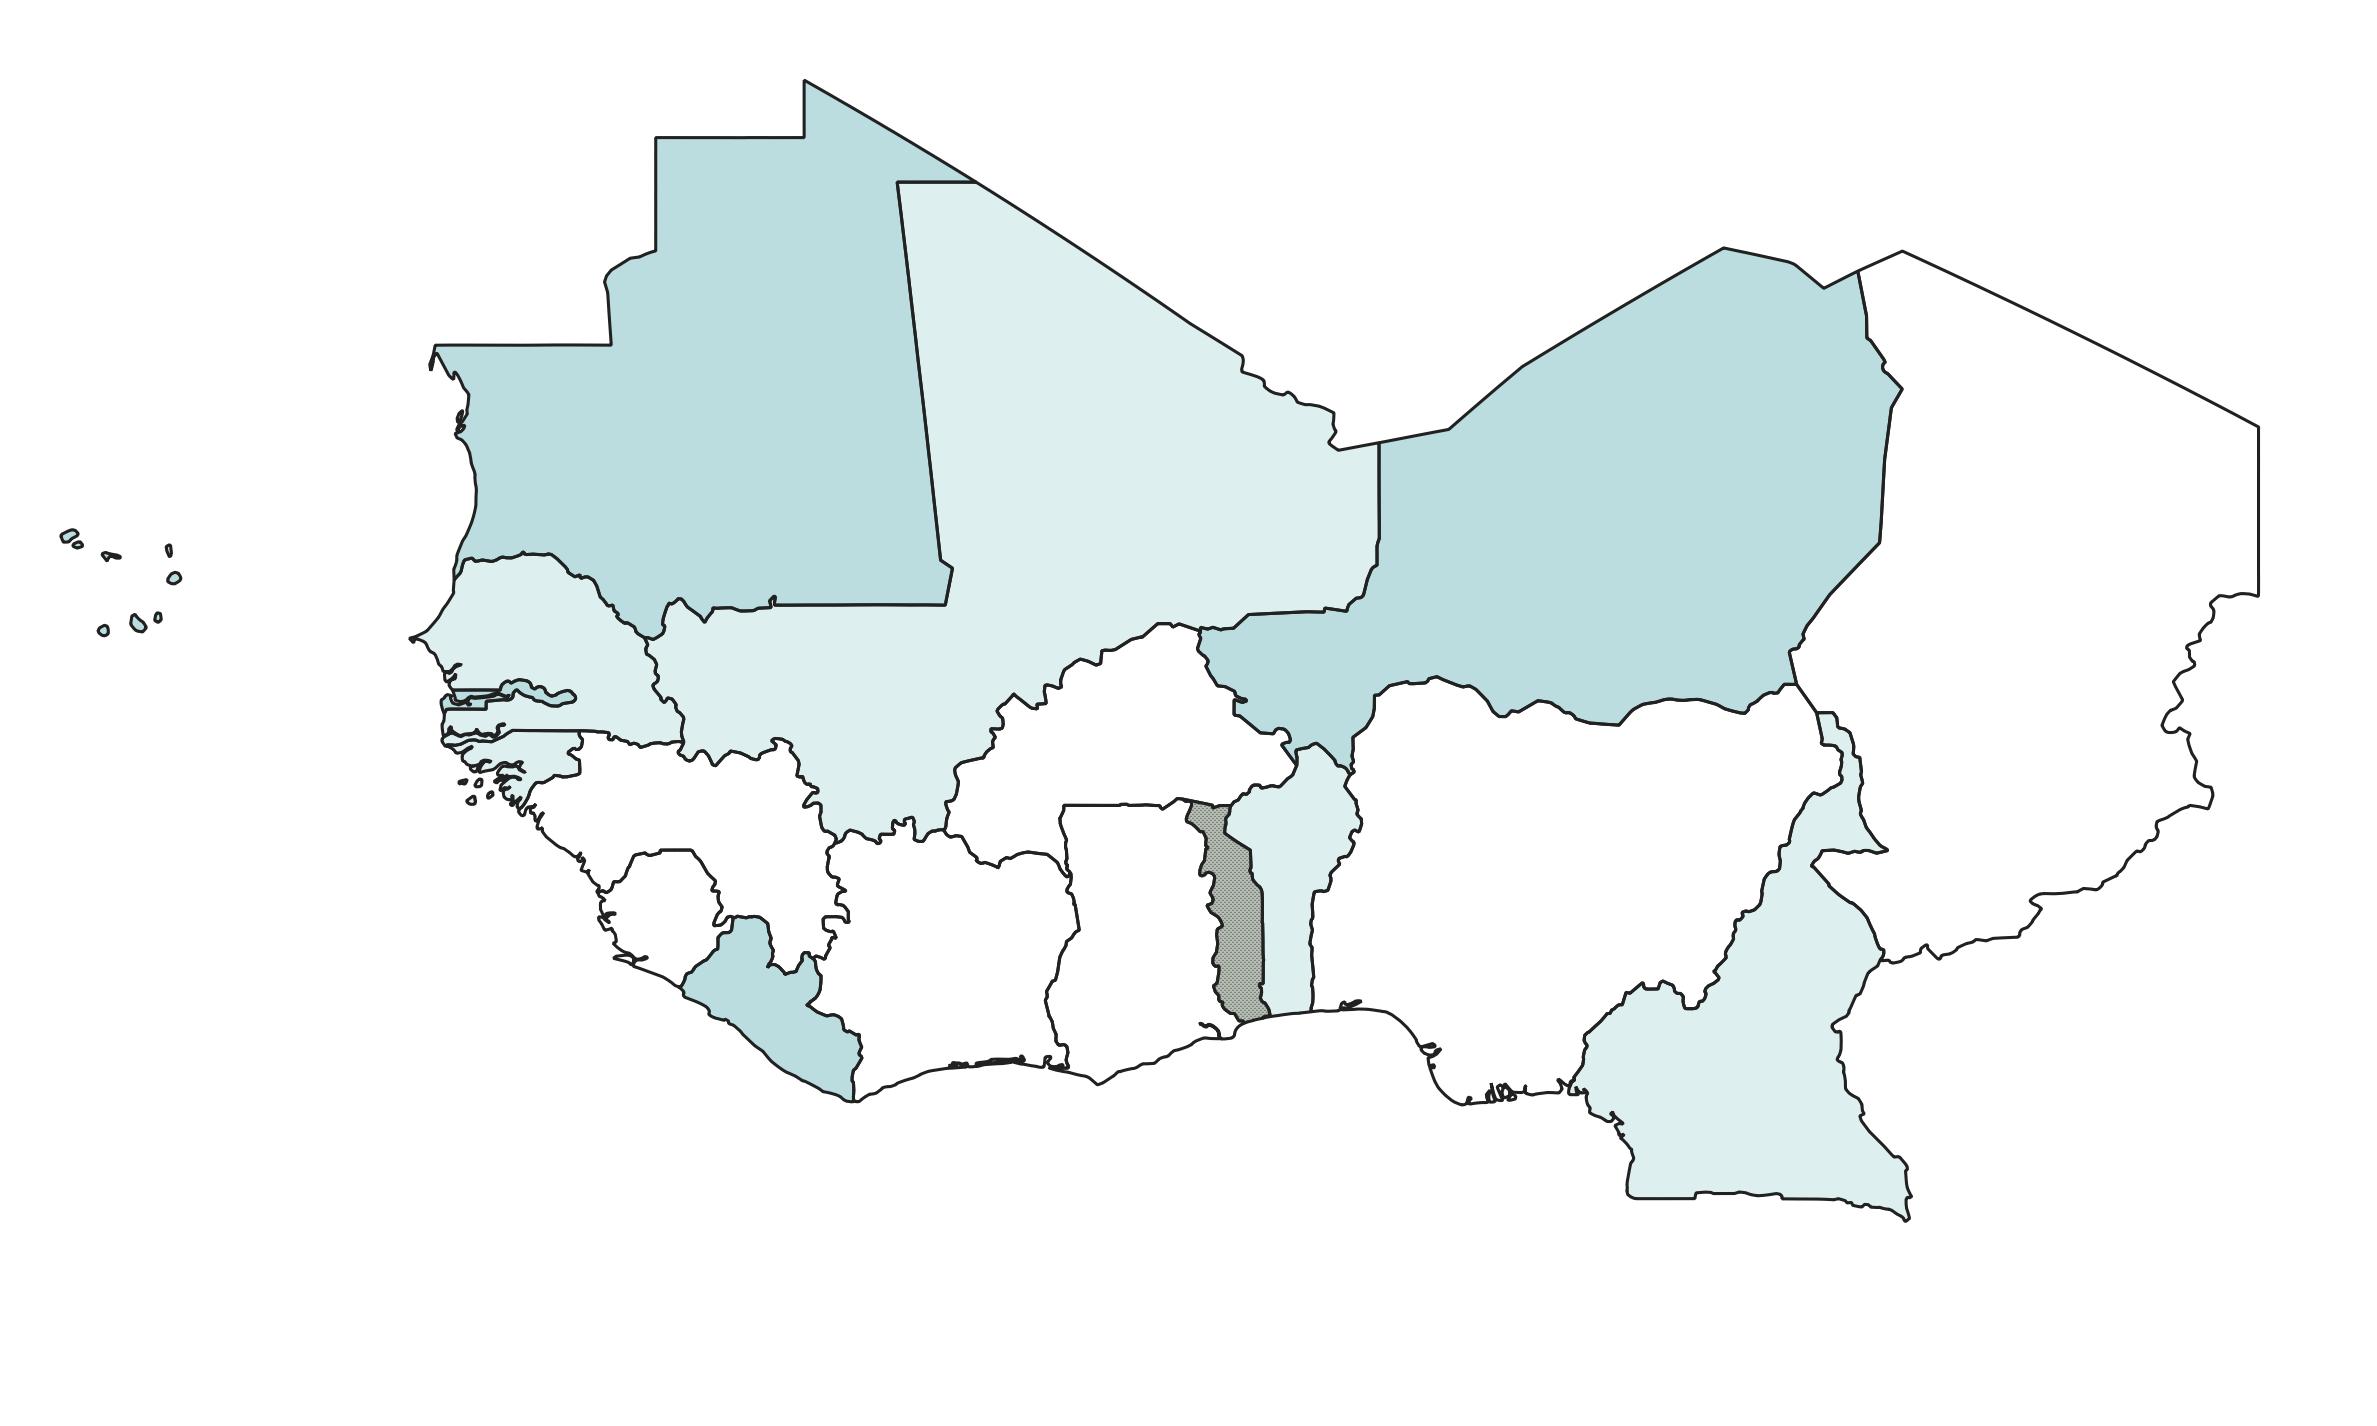
Healthy diets remain out of reach for a large portion of the population. For most Sahelian and West African countries, CoHD exceeds the current food expenditure levels in the population, with a ratio (of CoHD to food expenditure) of more than 1.0 (Map 1 and Figure 5). This indicates that meeting dietary guidance as spelled out by national FBDGs would require individuals to spend more of their budget on food than they currently do. Liberia has the highest ratio, and its CoHD is five times the national food expenditure level (Map 1 and Figure 5).
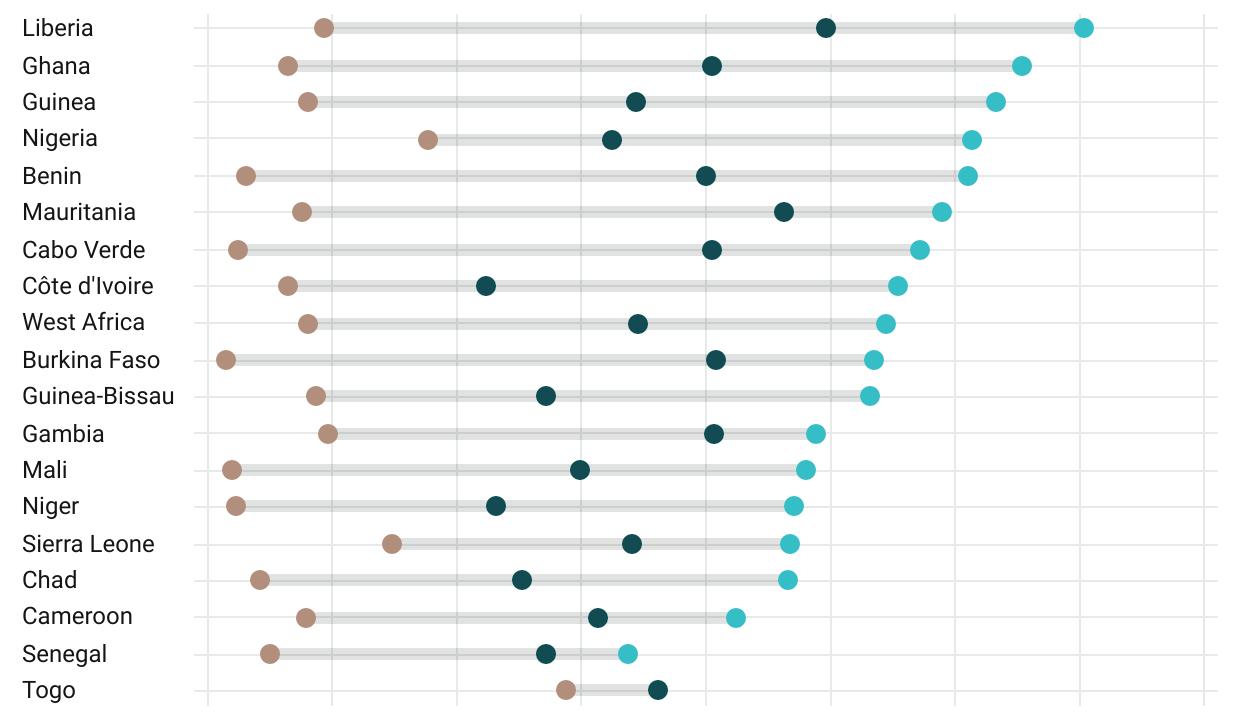
Figure 5.
Food expenditure and Cost of a Healthy Diet (CoHD) in West Africa, by country (in 2017)
Note: The figure displays the Cost of Healthy Diet (CoHD) and the average food expenditure per person for each country in West Africa and for Cameroon. Light blue dots correspond to countries with a ratio (of CoHD to food expenditure) higher than 1. It corresponds to countries for which CoHD exceeds the current food expenditure levels in the population. Dark blue dots correspond to countries with a ratio (of CoHD to food expenditure) lower than 1. Grey dots correspond to countries with a ratio (of CoHD to food expenditure) equal to 1.
Source: FAO, IFAD, UNICEF, WFP and WHO (2022[19]) and World Bank (2022[20]).
expenditure (USD, 2017)
Cabo Verde
Guinea Guinea-Bissau
Burkina Faso
Gambia
Mauritania Benin
Côte d’ivoire
Ghana
Cost of Healthy Diet (CoHD)
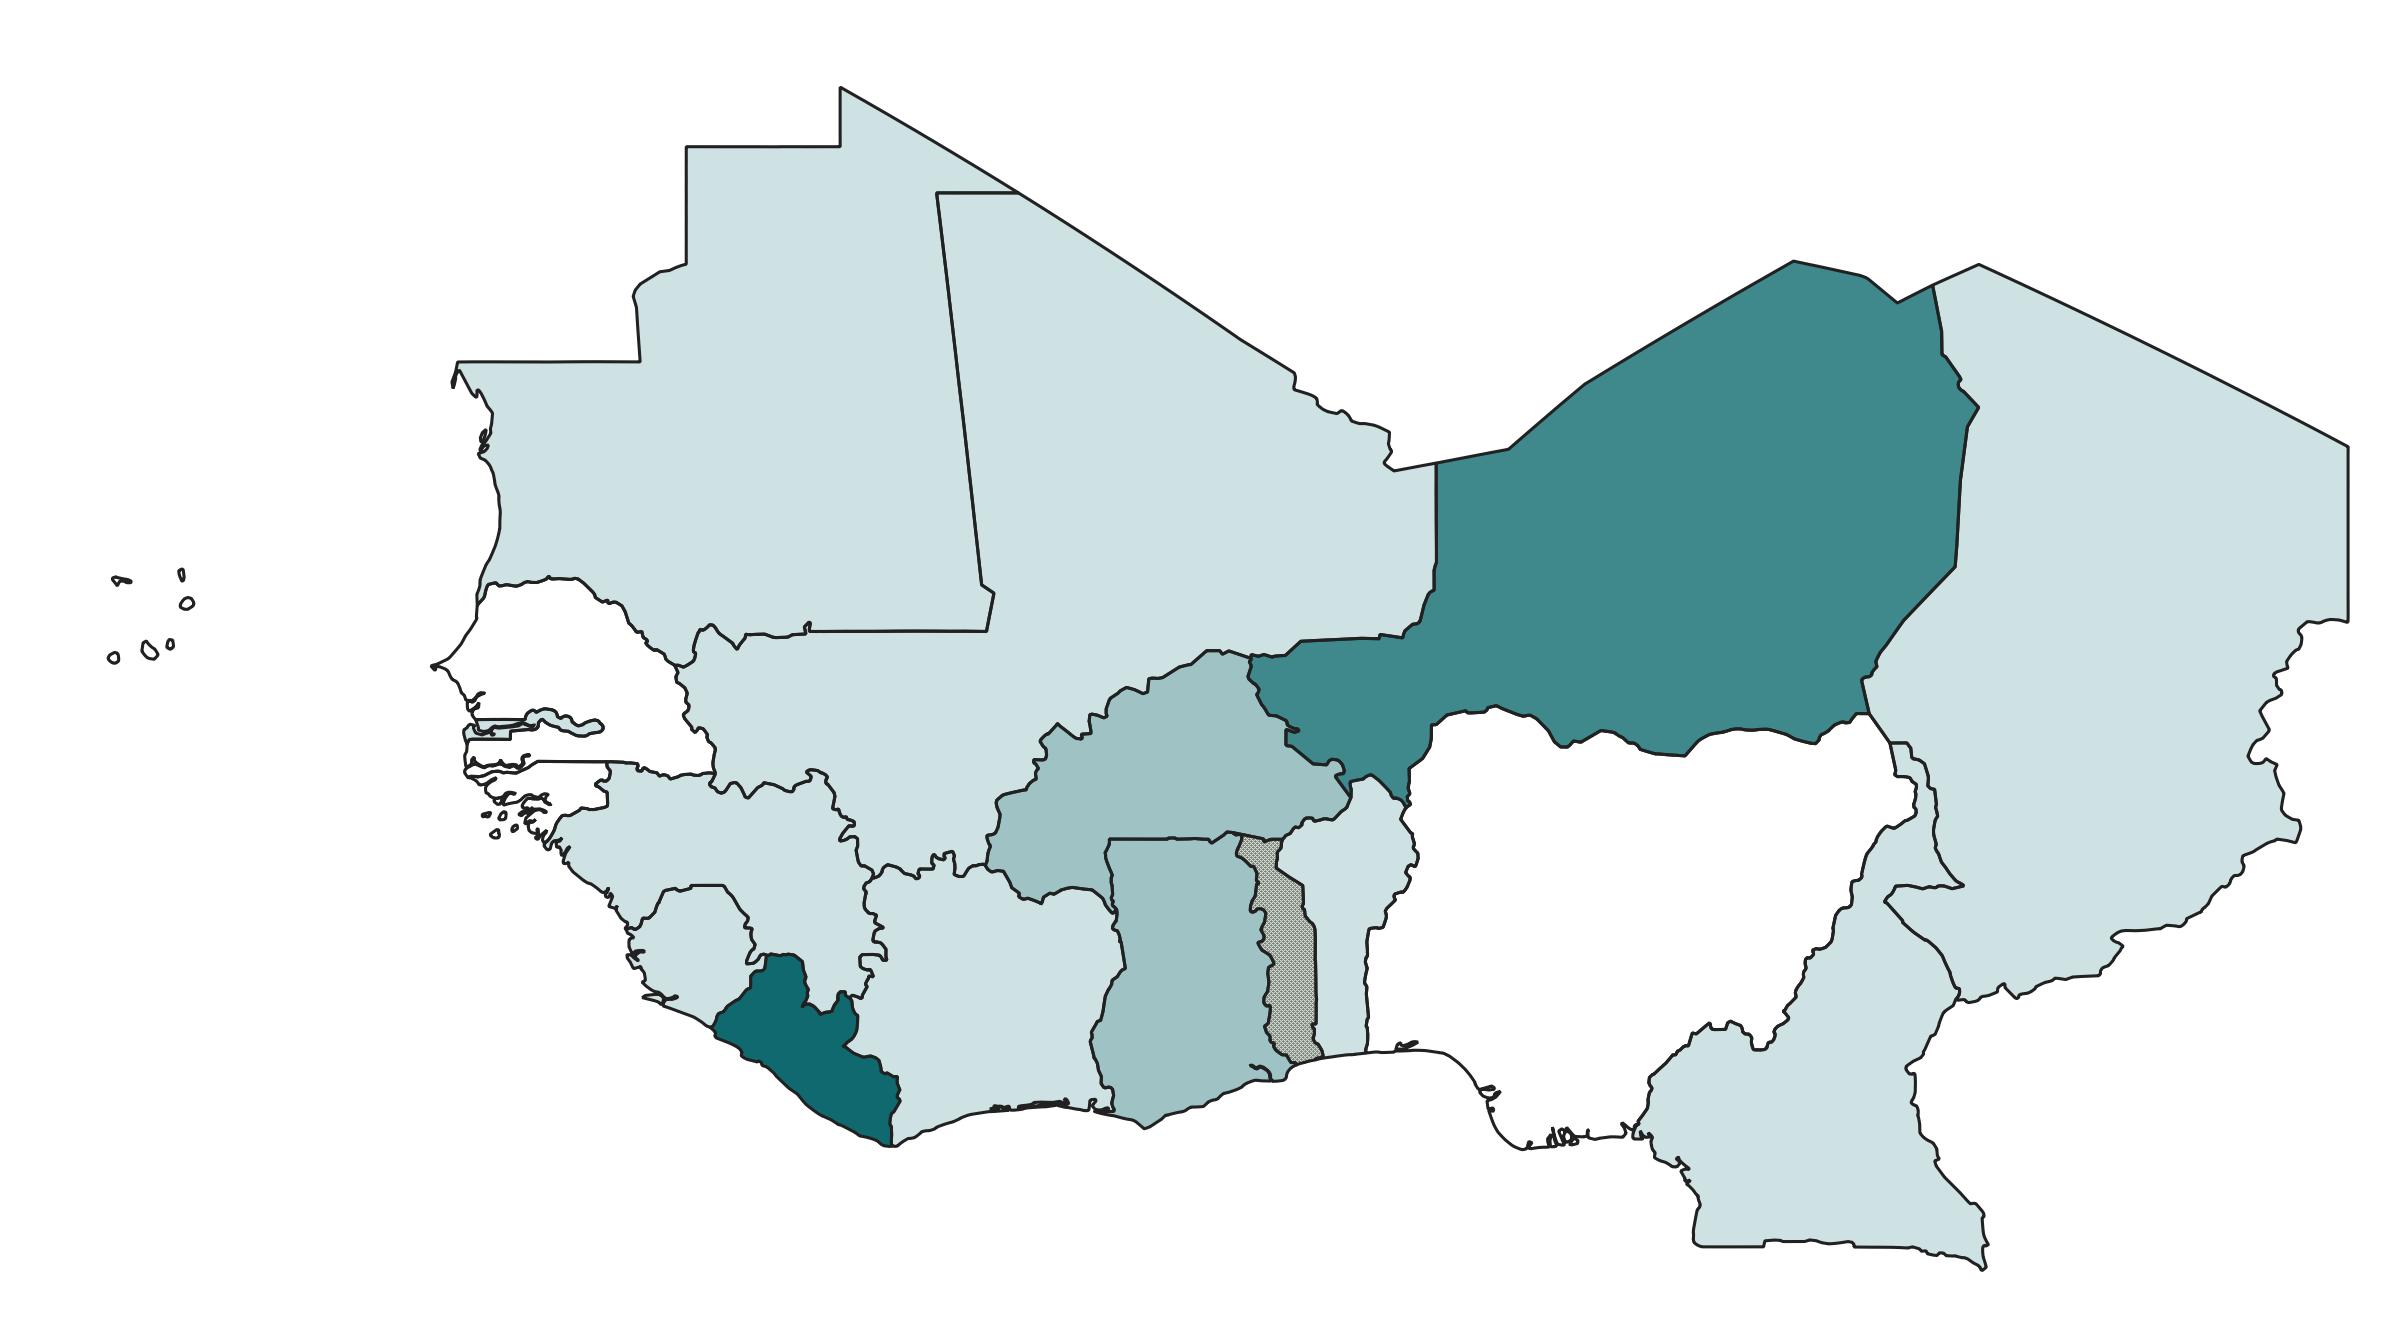
Map 1.
Ratio of the Cost of a Healthy Diet (CoHD) to food expenditure in West Africa, by country (in 2017)
Note: The map presents the ratio of the Cost of a Healthy Diet (CoHD) to food expenditure in West Africa. Togo is not included as no data is available for this country. Data for Cameroon are included.
Source: FAO, IFAD, UNICEF, WFP and WHO (2022[19]) and World Bank (2022[20]).
In all West African countries, the data show a stark reality for low-income households that lack the income to purchase the least costly healthy diets. Calculating affordability, as computed by the Food Prices for Nutrition project (Tufts University, World Bank and IFPRI, 2022[17]), the percentage of the population that cannot afford a healthy diet ranges from 42 to 97 percent. In each country but Cabo Verde and Senegal, more than 60% of the population cannot afford a healthy diet. For those living in poverty, even the least expensive combination of foods that satisfies dietary guidelines exceeds all available income.
Which food groups are driving up the cost of healthy diets ?
Identifying the highest-cost food groups
The Healthy Diet Basket is composed of six food groups: starchy staples (SS), vegetables (V), fruits (F), legumes, nuts and seeds (LNS), animal-source foods (ASF), and oils and fats (OF). Analysing which food groups have the most significant impact on overall diet costs allows the identification of particularly sensitive foods and how they impact overall costs.
Across the region, vegetables and animal-source foods make up the largest share of the total CoHD (Figure 6). Together, these two food groups combined make up more than half of the total cost, with vegetables accounting for 29% and animal-source foods 27% of the total cost.
8
The other two food groups that account for a large share of the costs are fruits (17%) and starchy staples (17%). The two food groups accounting for the smallest share in total costs are legumes, nuts and seeds (6%) and oils and fats (5%). The cost shares that reflect relative needs, therefore, should be interpreted in relation to the composition of healthy diets (in terms of the quantity required).
Figure 6.
Share of food groups in total average Cost of a Healthy Diet (CoHD) in West Africa
Animal-sourced food
Fruits
Starchy staples
Legumes, nuts and seeds
Oils and fats
Note: The figure presents the average percentage contribution of each food group to the average global cost of a healthy diet in West Africa. West Africa refers to the ECOWAS sub-region, UEMOA and CILSS member countries. It includes the following countries: Benin, Burkina Faso, Cabo Verde, Chad, Côte d’Ivoire, Gambia, Ghana, Guinea, Guinea-Bissau, Liberia, Mali, Mauritania, Nigeria, Niger, Senegal and Sierra Leone. Togo is not included as no data is available for this country.
Source: FAO, IFAD, UNICEF, WFP and WHO (2022[19]) and World Bank (2022[20]).
Major differences by country
Significant variations can be observed across countries in terms of the cost of specific food groups compared to the total average cost of a healthy diet. Of the four main food groups that make up the total CoHD, starchy staples and fruits account for the lowest shares. Although in the regional average they account for an equal average of total CoHD, variations across countries are significant. In particular, the cost share of fruits varies considerably, with less spread observed for starchy staples (Figure 7). The greatest variations across countries are observed for animal-sourced foods with the interquartile values (the mid-50%) ranging from 19% to 34%, followed by fruits (12% to 22%) and vegetables (25% to 32%). Starchy staples exhibit lower variation with the “mid-50%” values, ranging from 13% to 18%.
Figure 7.
Cost of a Healthy Diet for West Africa, broken down by cost share of each food group
Note: The figure presents the variation in cost shares within the region by food group. Each box represents the interval of the cost share ranging between 25% and 75%, the line representing the median and the cross the average. West Africa refers to ECOWAS sub-region, UEMOA and CILSS member countries. It includes 17 countries: Benin, Burkina Faso, Cabo Verde, Chad, Côte d’Ivoire, Gambia, Ghana, Guinea, GuineaBissau, Liberia, Mali, Mauritania, Nigeria, Niger, Senegal, Sierra Leone and Togo.
Source: FAO, IFAD, UNICEF, WFP and WHO (2022[19]) and World Bank (2022[20]).
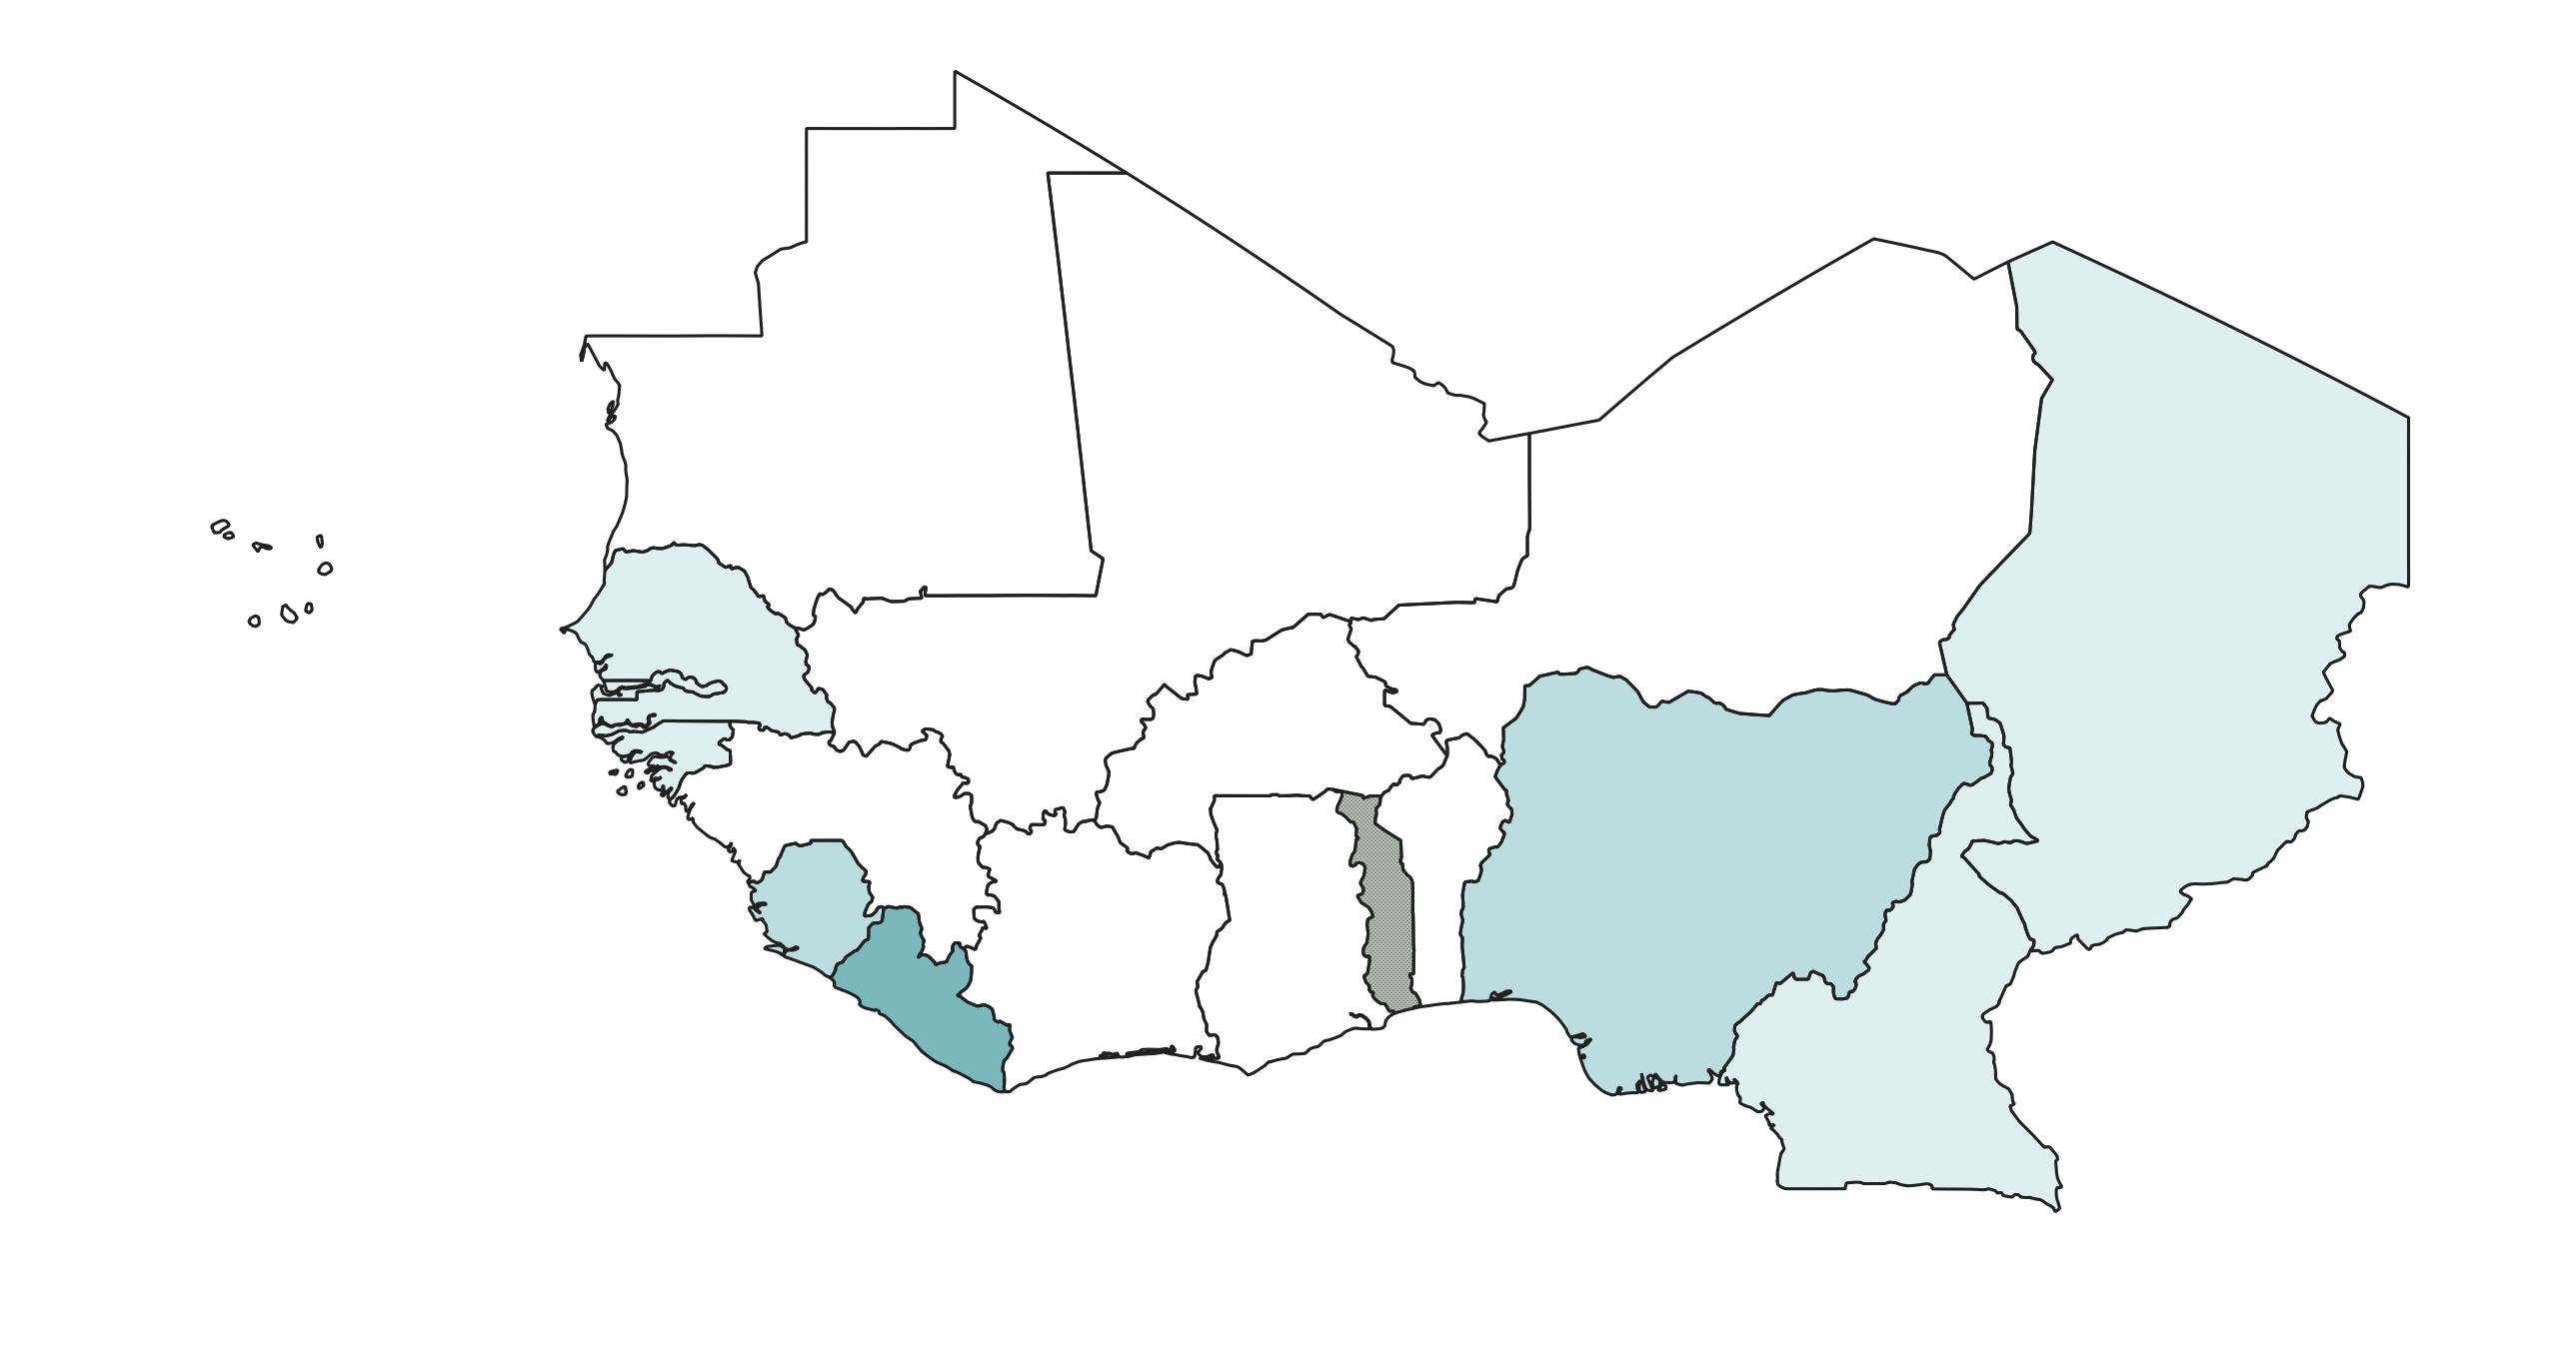
Specific food groups in some countries have a remarkably high cost share: animal-source foods in Niger, starchy staples in Liberia, vegetables in Guinea, legumes, nuts and seeds in Nigeria, and oils and fats in Senegal (Figure 7, Figure 8). In the three countries with the lowest cost share, starchy staples account for 10% to 13% of total cost (Map 2) and range from 21% to 32% in the three countries with the highest share. Liberia is one of the rare cases where starchy staples account for the largest portion of the total CoHD. Ghana follows the region-wide trend of expensive vegetables and animal-source foods but offers the most extreme example (with costs for these groups far higher than others: 66% in cumulative share). Significant variations are also observed for vegetables. In the five countries with the highest share for vegetables, the share of the total cost ranges from 31% to 49%. The population in Guinea appears to face especially high prices for vegetables at market – almost half (49%) of the cost of a healthy diet. Of all countries in the Sahel and West Africa, Niger is the most expensive for animal-source foods. The amounts required to meet dietary guidance can represent nearly 40% of the total cost. Among the countries with the highest share of animal-source foods in total cost are Niger (40%), Burkina Faso (36%), Mali (35%) and Côte d’Ivoire (34%). Finally, oils and fats in Senegal account for nearly 9% of total diet costs, almost double the share in other countries.
Comparing the cost of meeting recommended amounts for each of the food groups, no significant differences are noted between the findings for countries in the Sahel and West Africa and sub-Saharan African countries as a whole. Only minor variations in food group cost shares are found in the Sahel and West Africa between Sahelian and coastal countries. Not surprisingly, the cost of non-starchy staple foods tends to be higher in the Sahel, with a distinct difference in the cost of fruit relative to other food groups (Map 2).
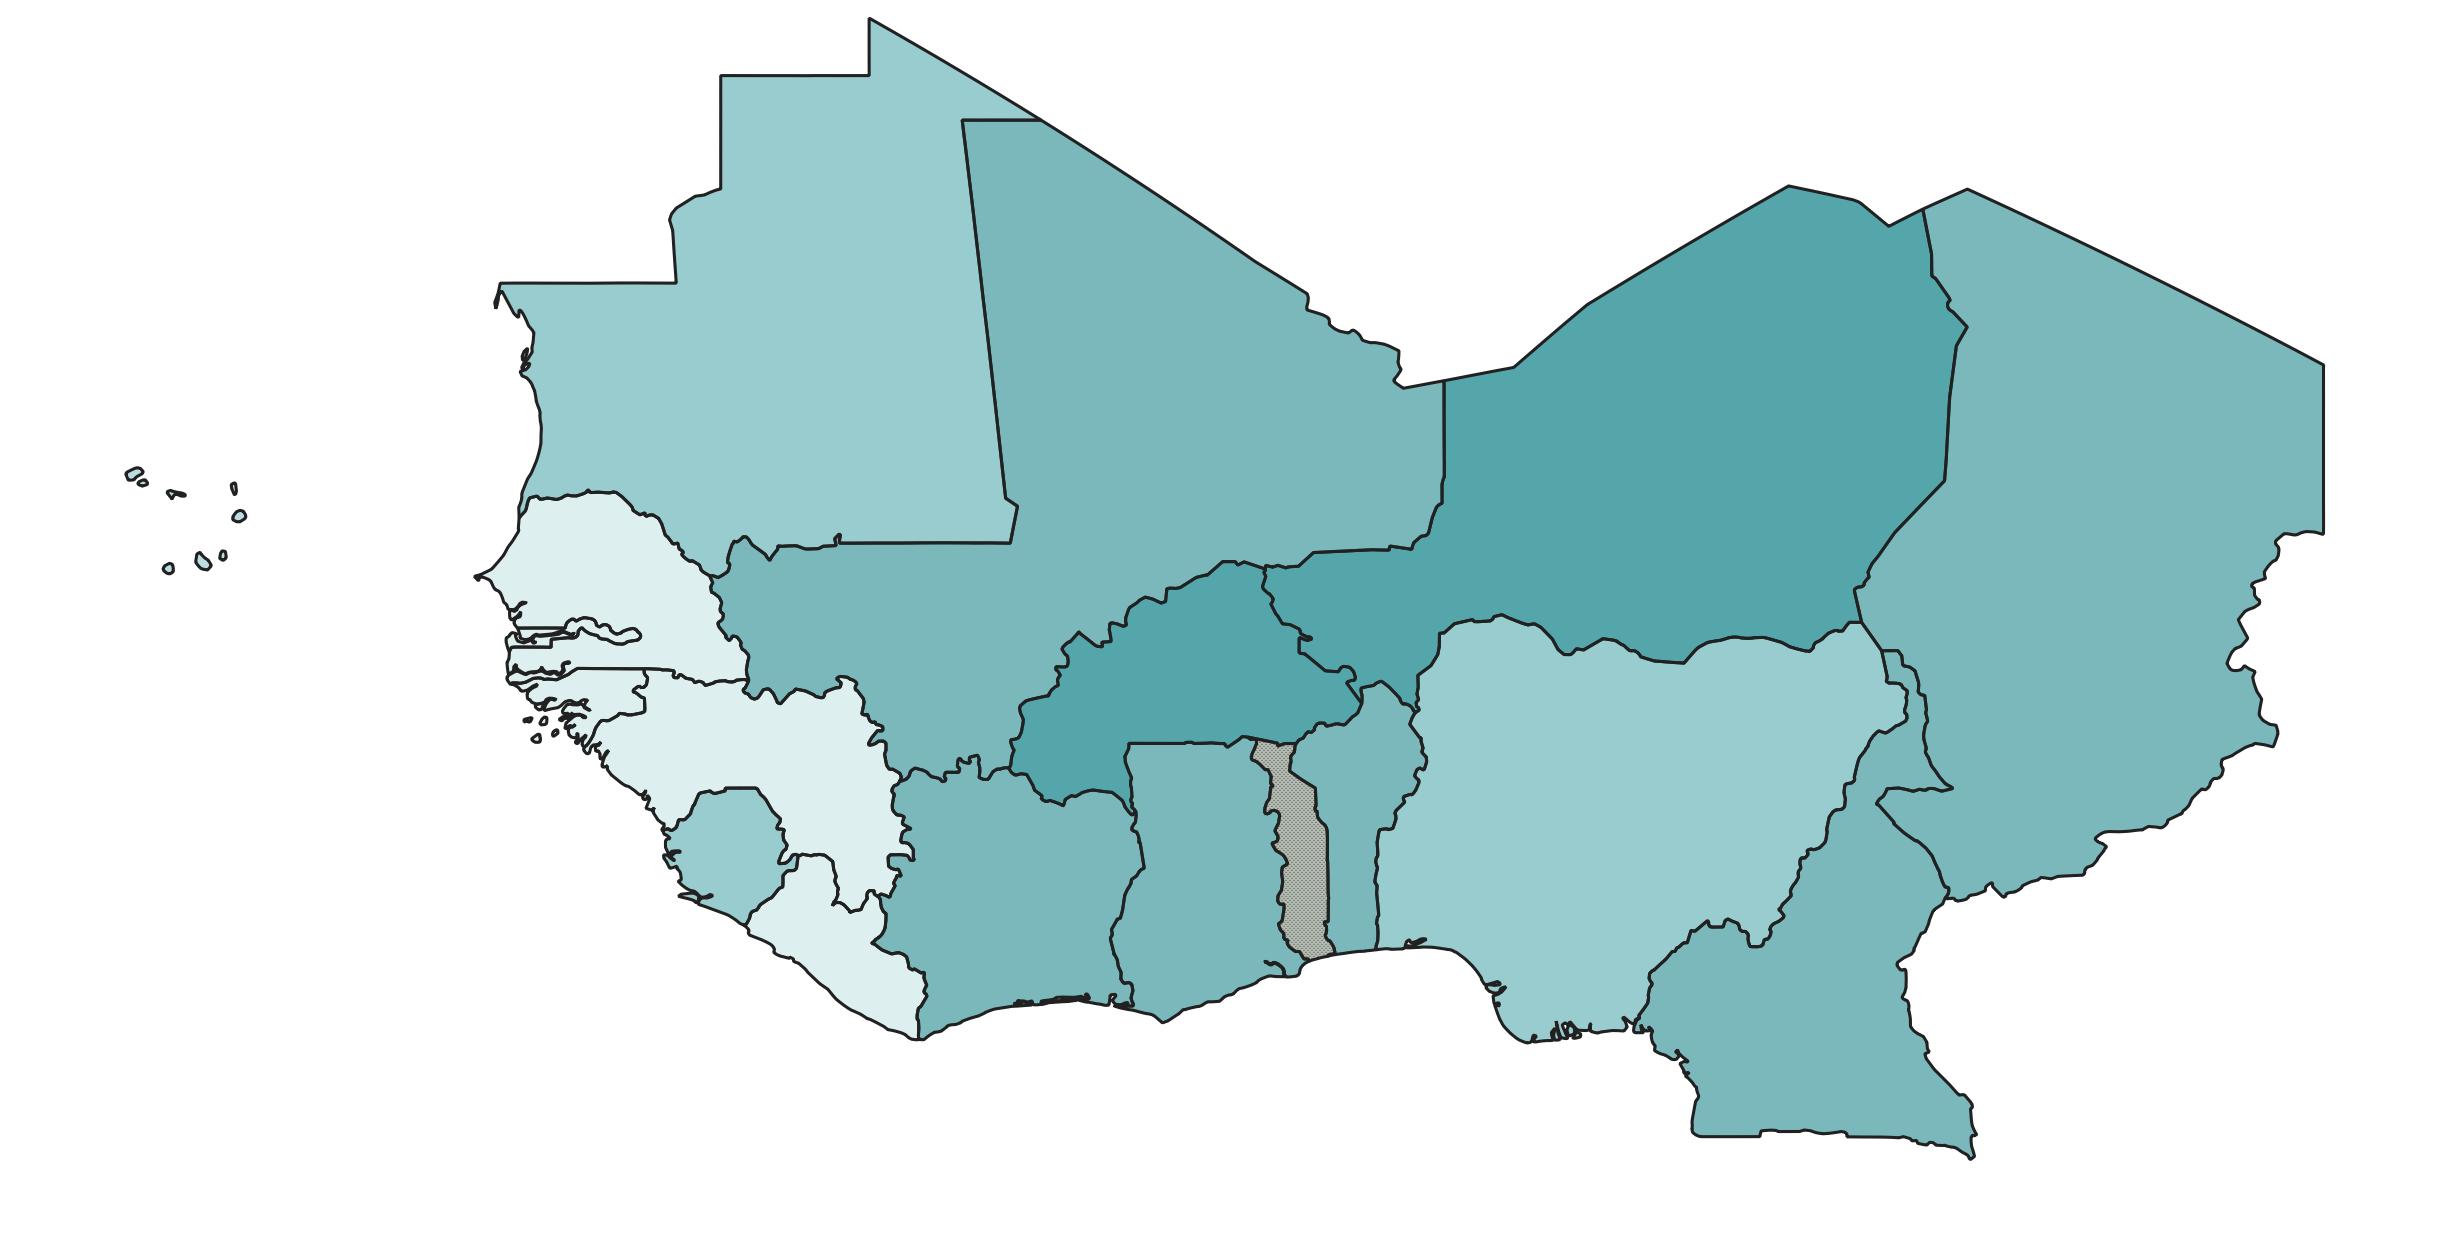
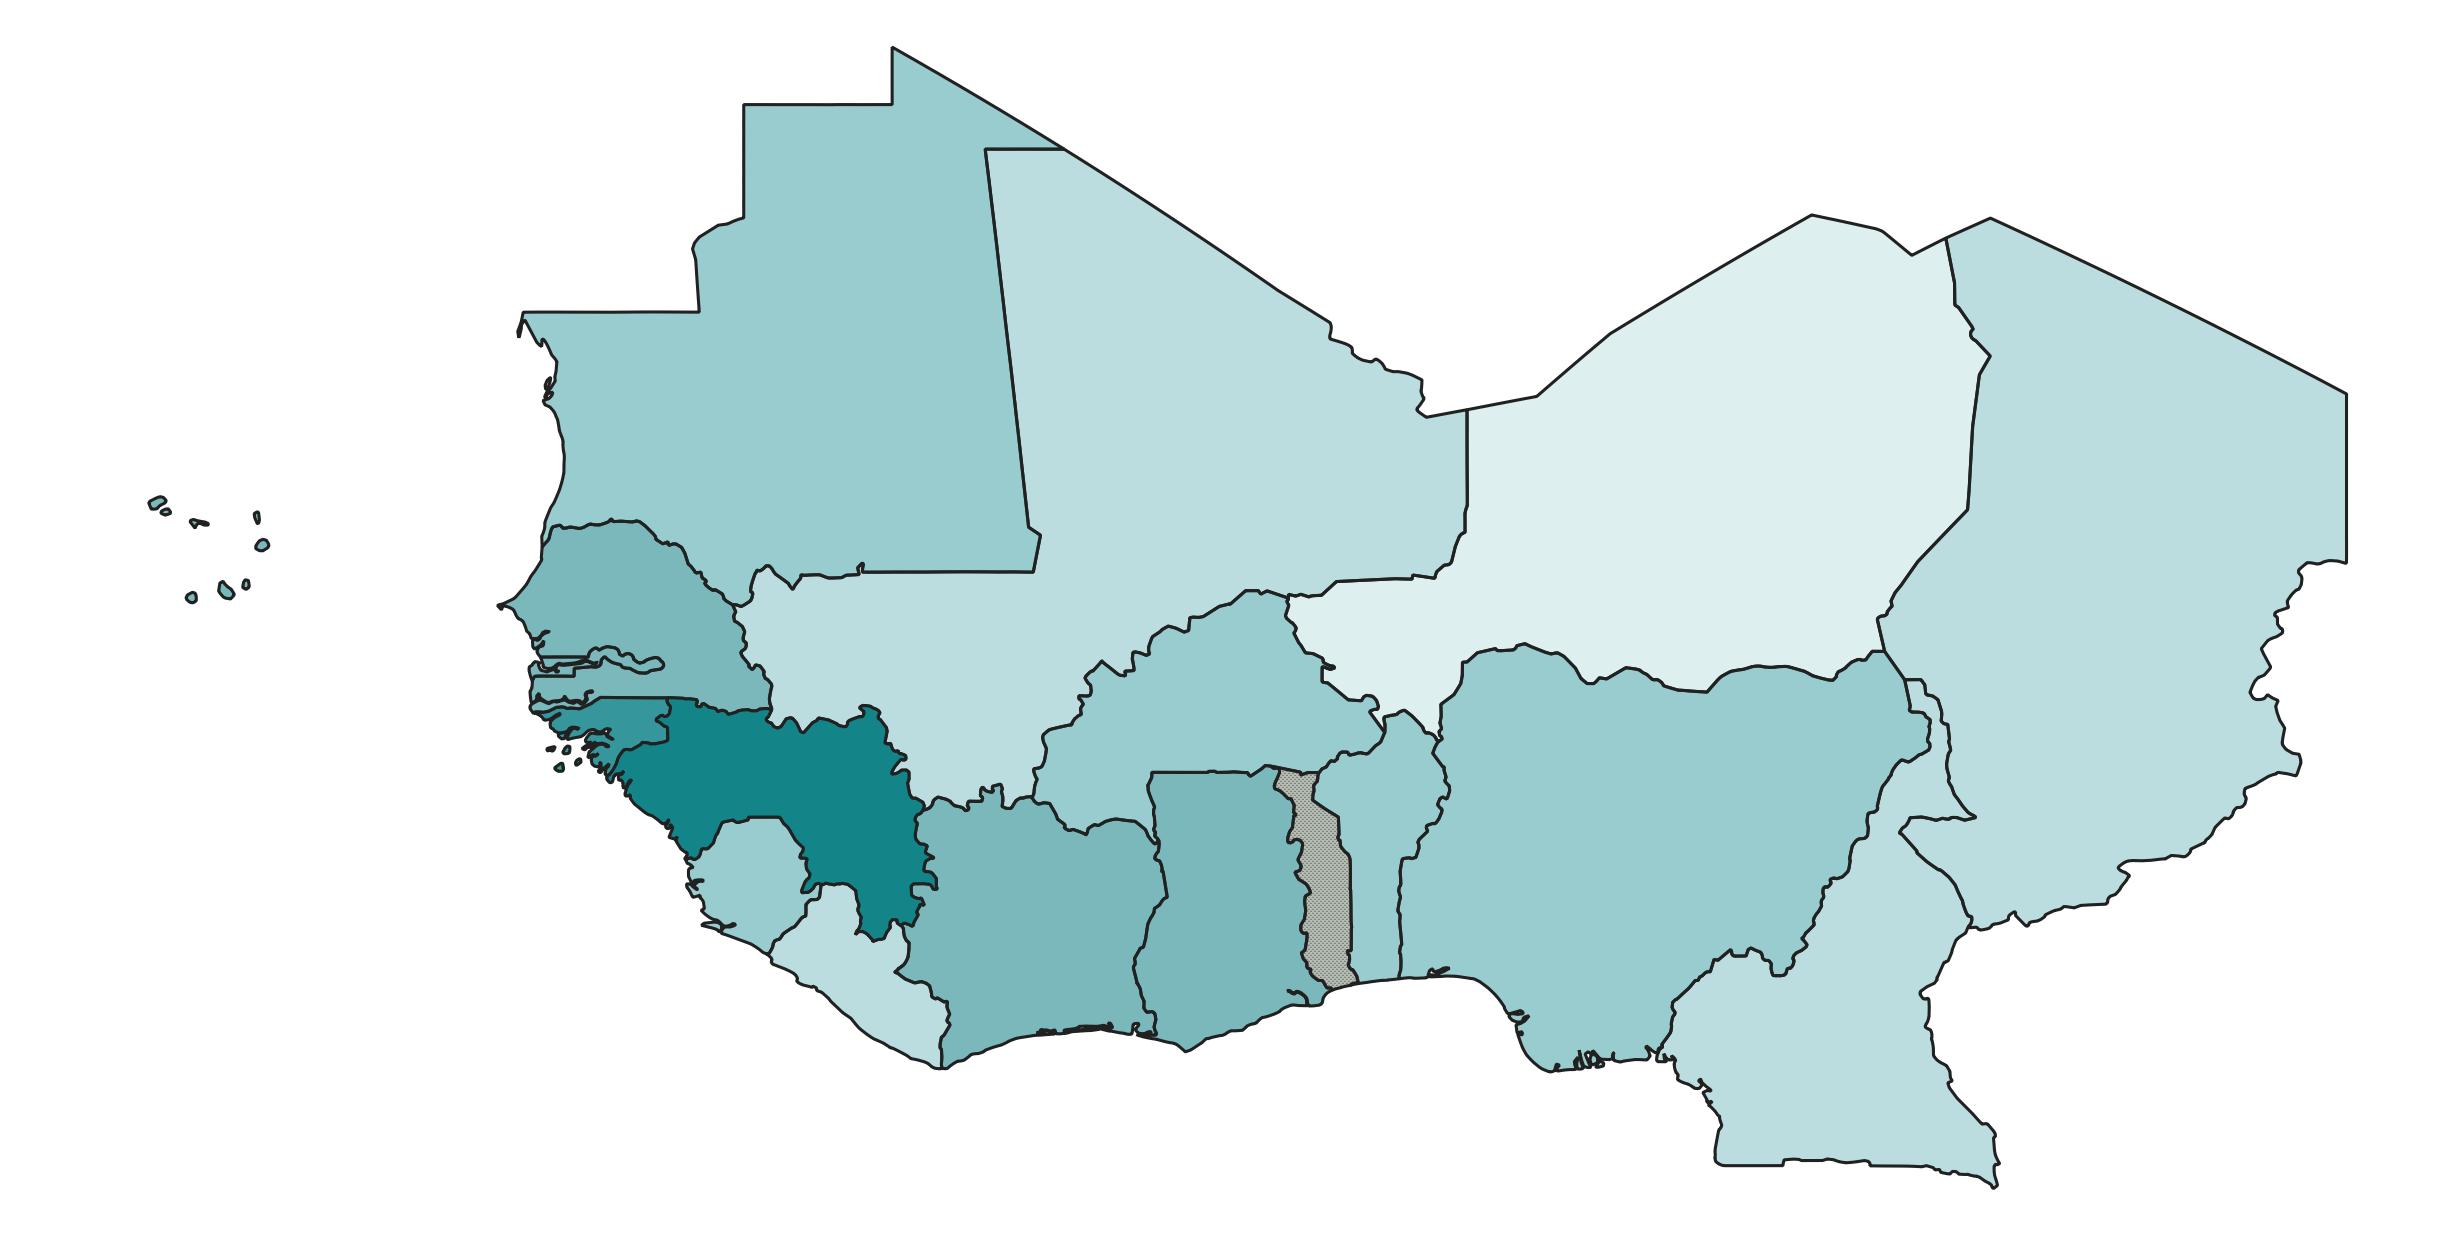
Map 2. Cost of Healthy Diet broken down by cost share of the four main food groups that make up the total CoHD
Animal-sourced food
Fruits
MAURITANIA
CABO VERDE
CABO VERDE
GAMBIA
SIERRA LEONE MAURITANIA
GAMBIA
GUINEABISSAU
GUINEABISSAU
GUINEA
SIERRA LEONE
GUINEA
BURKINA FASO
BURKINA FASO
CÔTE D’IVOIRE
CÔTE D’IVOIRE
Vegetables
Starchy staples
CABO VERDE
CABO VERDE
GAMBIA
SENEGAL CHAD
GAMBIA
GUINEABISSAU
GUINEABISSAU
GUINEA
GUINEA
SIERRA LEONE
SIERRA LEONE
MAURITANIA GHANA CÔTE D’IVOIRE
FASO
BURKINA FASO
TOGO
Fruits
CABO VERDE GAMBIA TOGO BENIN
SENEGAL CHAD
GUINEABISSAU
GUINEA
SIERRA LEONE
CÔTE
D’IVOIRE
CABO VERDE GAMBIA
GUINEABISSAU
GUINEA
SIERRA LEONE
BURKINA FASO NIGERIA LIBERIA
MAURITANIA GHANA
Starchy staples
MAURITANIA GHANA
BURKINA FASO
CÔTE
D’IVOIRE
TOGO BENIN
CHAD
Note: The map presents the percentage contribution of each food group to the average global cost of a healthy diet. Togo is not included as no data is available for this country. Data for Cameroon are included.
Source: FAO, IFAD, UNICEF, WFP and WHO (2022[19]) and World Bank (2022[20]) and authors’ calculations.
These variations across particular food groups translate into significantly different cost share compositions of healthy diets in each country (Figure 7). The six countries (Figure 8) provide an illustration of these stark differences, based on the particularly high cost share for specific food groups.
Figure 8.
Cost of a Healthy Diet for six countries (Ghana, Guinea, Liberia, Niger, Nigeria, Senegal) in West Africa, broken down by the percentage cost of each food group
Source: FAO, IFAD, UNICEF, WFP and WHO (2022[19]) and World Bank (2022[20]).
Cost of nutritious diets by population subgroups
A population’s nutrient needs vary depending on gender, age group and reproductive status. Global analyses have shown that least-cost diets for adolescents, lactating women and older populations require diets that include more nutrient-dense foods and fewer starchy staples than those for adult men (of 19 to 70 years) (Bai, Herforth and Masters, 2022[12]).
In West Africa, least-cost nutrient-adequate diets vary significantly across population subgroups (Figure 9). The nutritional needs of adolescent boys and girls are the most costly, with boys of 14 to 18 years old requiring the highest cost, at a median level of USD 2.73 per day (2017). This aligns with global findings (Bai, Herforth and Masters, 2022[12]), which reported a similar trend of high dietary energy needs from adolescents and women. Nutritional needs of women increase during pregnancy and breastfeeding. The nutritional needs of women increase during pregnancy and breastfeeding. Pregnant and lactating women thus face greater costs for nutrient-adequate diets and require particular attention.
Figure 9.
Cost of nutrient adequacy displayed according to the unique nutrient needs for men and women in West Africa, by age category
USD per person per day, 2017
Women
Men
Age Category
Note: The figure presents the average cost of nutrient adequacy by sex/age category in West Africa. West Africa refers to the ECOWAS sub-region, UEMOA and CILSS member countries. It includes 17 countries: Benin, Burkina Faso, Cabo Verde, Chad, Côte d’Ivoire, Gambia, Ghana, Guinea, Guinea-Bissau, Liberia, Mali, Mauritania, Nigeria, Niger, Senegal, Sierra Leone and Togo.
Source: FAO, IFAD, UNICEF, WFP and WHO (2022[19]) and World Bank (2022[20]) and author’s calculations.
DISCUSSION
The preceding analyses show that the cost of diets increases significantly with diet quality. In West Africa healthy diets are 3.6 times more expensive than energy adequate diets. More than half of the total cost of healthy diets are accounted for by vegetables and animal-source foods, with fruits accounting for another 17% of the cost. These perishable and difficult-to-transport foods also show higher cross-country variation in terms of relative cost share. Starchy staples account for only 17% on average of a healthy diet and show less variation across countries.
However, the overall cost composition of a healthy diet can vary drastically across countries (Figure 8), mostly driven by non-starchy staples. These variations can have significant impacts on the affordability of healthy diets and therefore nutrition outcomes. The data used in this analysis is based on national average prices, so it seems essential to examine sub-national variations in more detail in order to build a more accurate picture of affordability. Costs and affordability are likely to be heavily influenced by the local context (e.g. agro-climatic, infrastructure, isolation and distance), identifying and analysing those will provide more information and avenues for policy intervention. In addition, food prices also show strong temporal variations (seasonality) and further underscore the importance of time- and location specific market price information for monitoring food and nutrition security (Cedrez, Chamberlin and Hijmans, 2020[21]).
The information on food group cost-share can further help identify high-priority foods needed for a healthy diet that are out of reach for a large segment of the population. Particular measures can be designed to reduce the cost of foods that are needed for a healthy diet and lack cheaper alternatives. Similarly they can also identify which nutrient-dense foods are relatively affordable so that strategies can be developed to promote them.
Cross-referencing information on the structure of the cost of a healthy diet by food group and changes in nutritional requirements over the course of a lifetime can also shed light on the age groups and populations likely to face the greatest barriers to food access and affordability. This data can increase the effectiveness of policy instruments intended to reduce the prevalence of nutritional deficiencies in specific focus groups such as adolescents and young mothers.
Further, these methods can also be applied to carry out diet cost sensitivity analyses to different market shocks. Considering different price growth rates by food group will help identify which food groups are driving up the cost of a healthy diet and help to estimate their impact.
Box 1.
Forward estimation of the cost of a healthy diet in 2021
The last round of the World Bank ICP data collection was conducted in 2017. With market disruptions, increase in food prices and commodity inflation due to the COVID-19 pandemic, it is also important to evaluate the trends for CoHD beyond the most updated estimation year (2020) reported in the 2022 State of Food Security and Nutrition in the World (SOFI) report.
In the base case estimation (Figure 10) for the year 2021, the cost of a healthy diet is assumed to grow in alignment with food inflation rates. The annual growth rate of average CoHD in 2021 is 7.6% in West Africa, which is substantially higher than 2.8% in 2020, 0.6% in 2019, and 2.5% in 2018.
Figure 10.
The cost of a healthy diet in West Africa between 2017 to 2021, base case estimation
In the sensitivity scenario, different price growth rates are used for each food group. In Nigeria, for example, the CoHD growth rate for 2021 is 17%, while the growth rate of all food prices calculated using the Food CPI is 20%. However, the growth rates of fruits, vegetables and starchy staples are 12%, 12% and 14% respectively, which are lower than the growth rate of total food prices, while the growth rate of animal-source foods is 24%. Distinguishing between price growth rate of different food groups can help to better predict the evolution of the cost of healthy diets in the coming years, anticipate affordability issues and identify which food groups are driving up costs.
The base case and sensitivity analysis indicates that the cost of a healthy diet increased substantially in the second year after the onset of the COVID-19 pandemic in 2020. As more data is gathered, the changes in diet cost can be tracked for the years affected by the pandemic and the war in Ukraine.
Source: FAO, IFAD, UNICEF, WFP and WHO (2022[19]) and World Bank (2022[20]) and author’s calculations.
POLICY IMPLICATIONS
Guiding food system transformations to support healthy diets
Healthy diets help to prevent all forms of malnutrition and diet-related non-communicable diseases and promote every dimension of individual health. Many of the observed food and nutrition security outcomes in West Africa, including stunting, wasting, overweight and obesity, are related to limited access to healthy diets, as well as their high cost and unaffordability. At the same time, food systems in West Africa are transforming rapidly, with profound changes to consumption patterns, food environments and production systems (Allen, 2017[15]) (Allen and Heinrigs, 2016[7]). The triple challenge that food systems face globally – ensuring food and nutrition security, providing livelihoods and building environmental sustainability – presents policy makers in the region with particular challenges, but also provides opportunities (SWAC/OECD, 2021[22])). Policies will play a major role in shaping the future of the region’s food system. Guiding food system transformations to support healthy diets should be a priority (Ruel and Brouwer, 2021[23]).
Reorienting food systems policies to ensure availability and access to healthy diets
Policy makers have to ensure that food systems as a whole promote healthy and diverse diets, by designing policy packages that ensure that healthy and diverse foods are available and accessible year-round; that healthy diets are affordable to all; that foods are produced with a low environmental footprint; and that consumers are informed, empowered, supported and willing to make healthy dietary choices. Increasing access to healthy diets will ultimately come from an interplay between supply-side and demand-side actions and a better understanding of our food environments. Policies need to promote the demand for healthy foods, while supporting increased supplies of vegetables, fruits, pulses and sustainably produced animal-source foods at affordable prices (Herforth, 2020[13]). A better understanding of the drivers and interactions of availability, accessibility and affordability of healthy diets is needed so that policy makers can design effective, targeted policies.
Areas of policy focus should include:
Update and/or define food-based dietary guidelines (FBDGs) that reflect a country’s culturally and nutritionally appropriate dietary patterns (Annex A). These guidelines provide people with practical guidance on nutrient adequacy and the dietary diversity of food groups. The guidelines should also provide targets for public and private investments to ensure access to healthy diets.
Provide information and education to all food system stakeholders to promote healthy diets.
Rebalance agricultural policies towards nutrition-sensitive investments and incentives in food systems. In particular, investments into food value chains and marketing systems are needed as perishable and hard-to-transport foods face some of the highest marketing costs.
Develop nutrition-sensitive social protection policies for the most vulnerable and in crisis situations.
Promote the affordability of healthy diets
High costs and unaffordability are the main barriers to accessing healthy diets. The cost drivers of healthy diets are seen throughout food supply chains, within the food environment and the political economy that shapes public expenditures into food value chains and trade and investment policies (Ruel and Brouwer, 2021[23]). This means supporting food producers, especially small-scale producers, to deliver nutritious foods to markets at low cost, making sure people have access to these food markets, and making food supply chains work for vulnerable people. Increased support and investment in food storage and processing has the potential to improve the availability of nutritious foods in domestic markets, by significantly reducing food losses. Storage facilities increase food shelf life, stabilise prices and smooth consumption. At the same time, food processing extends the shelf life and safety of perishable nutritious food products and is an additional alternative to avoiding food losses and diversifying food supply on the market.
Policies also need to address the livelihoods and incomes of vulnerable populations, both in rural and urban areas. Here it is necessary to develop broader policy packages, beyond food systems, including social protection and labour market policies that are targeted at informal economy contexts.
Improve monitoring and analytical capacities
The complexity of interactions in determining the cost and affordability of healthy diets underscores the need for significantly improved monitoring and analytical capacity. An intensification of major drivers of food and nutrition insecurity (such as conflict and climate effects) is likely to continue to present a challenge to food affordability in the region. The data used in this analysis provides useful information for describing broad features and issues but does not capture the variety of channels through which consumers access foods (and the prices they must pay), nor spatial and seasonal variation in both price and affordability to inform targeted policy investments, social protection measures and early warning systems.
More detailed information and analyses are needed to identify country differences in cost, revenue and affordability. Added granularity of sub-national data can bring to light the availability and cost of foods throughout the year, demonstrating the effects of seasonality on population access to key food groups.
Governments need to extend data coverage in terms of markets and food products monitored by market information systems. Nutritional goals and healthy diets require additional price monitoring of non-staple products, as well as household revenues and expenditures. This information is more important than ever during the current transformation of the region. Rapid urbanisation is leading to the emerging new cities and markets that need to be considered in market information systems. Familiarity with retail costs that consumers face in the market offers a new lens for identifying opportunities for action and intervention.
Recent market disruption, in the wake of the COVID-19 pandemic and the war in Ukraine, has increased the price of food and the cost of healthy diets. Developing data and monitoring capacity to analyse their effects on the cost and affordability of healthy diets will help identify the population’s capacity to access healthy diets and define effective policy interventions.
Finally, a better understanding of the specific dietary needs and relative costs faced by certain demographic groups, will enable targeted interventions to be put in place to ensure that all demographic groups have access to appropriate diets for their gender, age, physical activity level and physiological state.
NOTES
Based on available Demographic and Health Surveys (DHS) and Multiple Indicator Cluster Surveys (MICS) (between 2010-15).
United Nations Children’s Fund (UNICEF), World Health Organization, International Bank for Reconstruction and Development/The World Bank. Levels and trends in child malnutrition: Key Findings of the 2020 edition of the Joint Child Malnutrition Estimates.
Based on available DHS and MICS surveys (between 2010-15).
Source: Our World in Data based on UN FAO and historical sources.
Dietary choices and the way food is produced have important environmental implications. Current dietary patterns are responsible for an estimated 30% of total greenhouse gas emissions (GHG) (FAO, IFAD, UNICEF, WFP and WHO, 2020[27]). A shift to alternative healthy diet patterns could substantially reduce the GHG emissions associated with food systems.
In this paper, West Africa refers to the ECOWAS sub-region, UEMOA and CILSS member countries. It includes 17 countries: Benin, Burkina Faso, Cabo Verde, Chad, Côte d’Ivoire, Gambia, Ghana, Guinea, Guinea-Bissau, Liberia, Mali, Mauritania, Nigeria, Niger, Senegal, Sierra Leone and Togo. Data for Cameroon are also presented in Figure 3, Figure 5, Map 1 and Map 2 but are not included while computing the West Africa regional average.
The range of costs for animal-source foods (which include dairy, eggs, fish and meat) is greater than for other food groups – indicating that certain types of animal-based protein may be significantly more affordable (or out of reach) than others.
Since national FBDGs do not consistently recommend demographic-specific diets, using the CoHD indicator for this analysis cannot generate comparative results across countries.
REFERENCES
Afshin, A. et al. (2019), “Health effects of dietary risks in 195 countries, 1990–2017: a systematic analysis for the Global Burden of Disease Study 2017”, The Lancet, Vol. 393/10184, pp. 1958-1972, https://doi. org/10.1016/s0140-6736(19)30041-8.
Allen, T. (2017), “The Cost of High Food Prices in West Africa”, West African Papers, No. 8, OECD Publishing, Paris, https://doi.org/10.1787/c2db143f-en
Allen, T. and P. Heinrigs (2016), “Emerging Opportunities in the West African Food Economy”, West African Papers, No. 1, OECD Publishing, Paris, https://doi.org/10.1787/5jlvfj4968jb-en.
Bai, Y., A. Herforth and W. Masters (2022), “Global variation in the cost of a nutrient-adequate diet by population group: an observational study”, The Lancet Planetary Health, Vol. 6/1, pp. e19-e28, https://doi. org/10.1016/s2542-5196(21)00285-0
Balla, M. (2015), “Current Situation of Micronutrient Deficiencies in West Africa. Scaling up rice fortification in West Africa”, Sight&Life Publishers, Basel.
Cedrez, C., J. Chamberlin and R. Hijmans (2020), “Seasonal, annual, and spatial variation in cereal prices in Sub-Saharan Africa”, Global Food Security, Vol. 26, p. 100438, https://doi.org/10.1016/j.gfs.2020.100438
Ecker, O. (2018), “Agricultural transformation and food and nutrition security in Ghana: Does farm production diversity (still) matter for household dietary diversity?”, Food Policy, Vol. 79, pp. 271-282, https://doi.org/10.1016/j.foodpol.2018.08.002
FAO, ECA and AUC (2021), Africa regional overview of food security and nutrition 2020, FAO, https://doi. org/10.4060/cb4831en
FAO, IFAD, UNICEF, WFP and WHO (2022), The State of Food Security and Nutrition in the World 2022, FAO, https://doi.org/10.4060/cc0639en
FAO, IFAD, UNICEF, WFP and WHO (2020), The State of Food Security and Nutrition in the World 2020, FAO, IFAD, UNICEF, WFP and WHO, https://doi.org/10.4060/ca9692en
Herforth, A. (2022), Methods and options to monitor the cost and affordability of a healthy diet globally, FAO, https://doi.org/10.4060/cc1169en
Herforth, A. (2020), Cost and affordability of healthy diets across and within countries, FAO, https://doi. org/10.4060/cb2431en
Masters, W. et al. (2023), “The Cost and Affordability of Preparing a Basic Meal Around the World”, in Science and Innovations for Food Systems Transformation, Springer International Publishing, Cham, https://doi.org/10.1007/978-3-031-15703-5_33
Masters, W., N. Rosenblum and R. Alemu (2018), “Agricultural Transformation, Nutrition Transition and Food Policy in Africa: Preston Curves Reveal New Stylised Facts”, The Journal of Development Studies, Vol. 54/5, pp. 788-802, https://doi.org/10.1080/00220388.2018.1430768
National Academies Press, W. (ed.) (2019), Dietary Reference Intakes for Sodium and Potassium, National Academies Press, Washington, D.C., https://doi.org/10.17226/25353.
Olivier Ecker, A. (2020), “Poor Dietary Quality is Nigeria’s Key Nutrition Problem (Policy Research Brief 119)”.
Ruel, M. and I. Brouwer (2021), Transforming food systems to achieve healthy diets for all, International Food Policy Research Institute, Washington, DC, https://doi.org/10.2499/9780896293991_03.
Staatz, J. and F. Hollinger (2016), “West African Food Systems and Changing Consumer Demands”, West African Papers, No. 4, OECD Publishing, Paris, https://doi.org/10.1787/b165522b-en
SWAC/OECD (2021), “Food system transformations in the Sahel and West Africa: Implications for people and policies”, Maps & Facts, No. 4, https://www.oecd.org/swac/maps/Food-systems-Sahel-West-Africa-2021_EN.pdf.
Tufts University, World Bank and IFPRI (2022), Food Prices for Nutrition Project, https://sites.tufts.edu/ foodpricesfornutrition
van Wesenbeeck, C. (2018), “Disentangling urban and rural food security in West Africa”, West African Papers, No. 15, OECD Publishing, Paris, https://doi.org/10.1787/e0c75266-en.
Weatherspoon, D. et al. (2019), “Stunting, food security, markets and food policy in Rwanda”, BMC Public Health, Vol. 19/1, https://doi.org/10.1186/s12889-019-7208-0
Willett, W. et al. (2019), “Food in the Anthropocene: the EAT–Lancet Commission on healthy diets from sustainable food systems”, The Lancet, Vol. 393/10170, pp. 447-492, https://doi. org/10.1016/s0140-6736(18)31788-4
World Bank (2022), “Food Prices for Nutrition Data Hub”, World Bank Databank (database), https://databank.worldbank.org/source/food-prices-for-nutritionworldbank.nutrition
ANNEX A
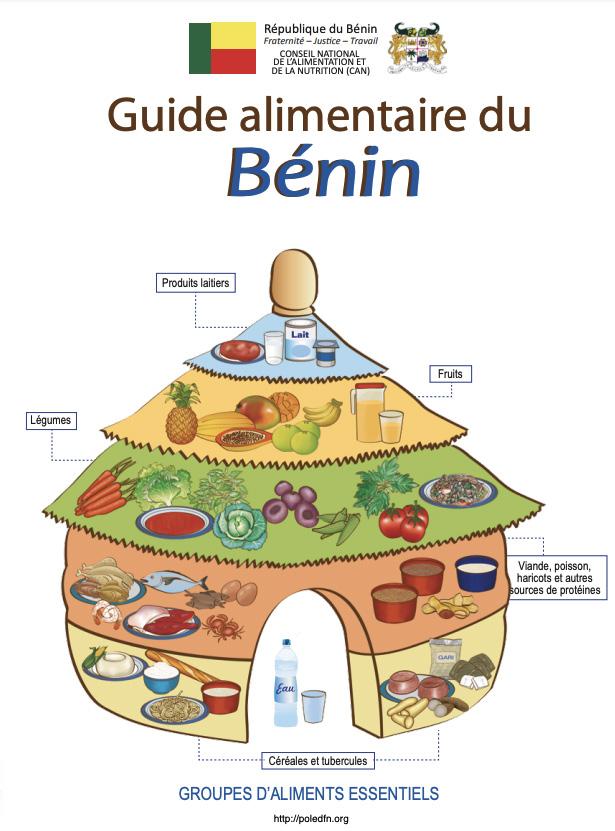
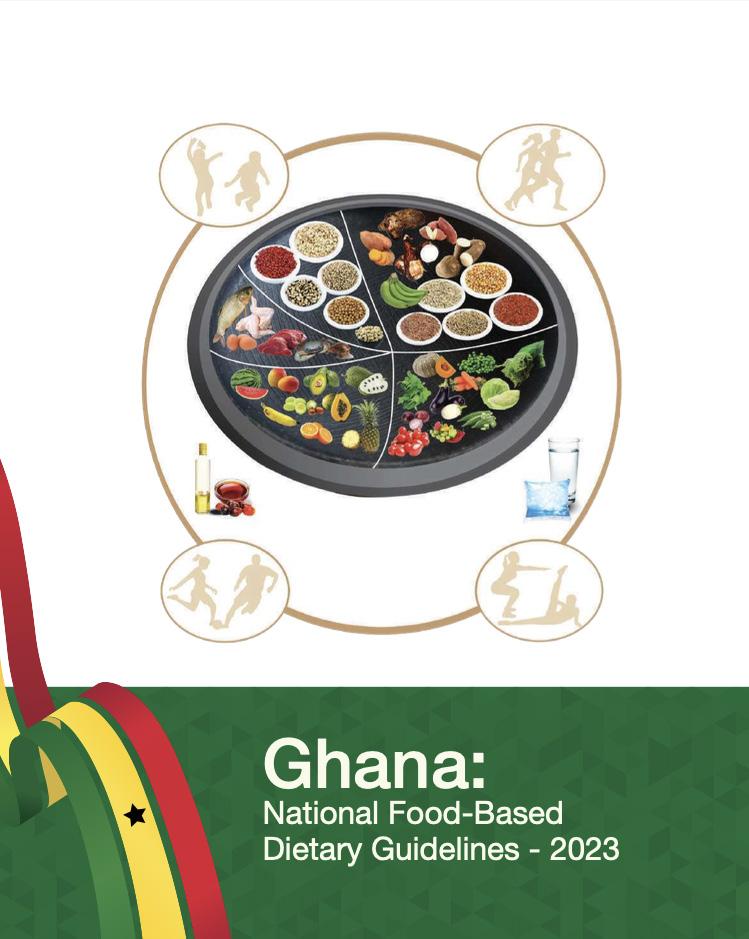
Figure A.1.
Examples of Food-Based Dietary Guidelines (FBDGs) from Benin and Ghana (2022)
Note: Full FBDGs for these countries are available here: https://www.fao.org/nutrition/education/food-dietary-guidelines/regions/en/.
WEST AFRICAN PAPERS
Healthy Diets, Costs and Food Policies in the Sahel and West Africa
The Sahel and West Africa region is facing a serious food and nutrition security crisis with high rates of acute malnutrition, combined with high rates of malnourishment and over-nourishment – the “triple burden of malnutrition”. Poor-quality diets are the root of all forms of malnutrition, as well as common non-communicable diseases, and are responsible for an estimated one in five adult deaths globally. The high cost of food is a key barrier to accessing a healthy diet. Even before the recent global inflation in food prices, West Africa’s food prices were 30%-40% higher than other regions in the world of comparable income levels. The paper analyses the costs of healthy diets in 17 countries in the Sahel and West Africa and which food groups drive up costs. The observed high cross-country variability in costs and cost composition points to a need for more targeted and nutrition-sensitive food system policies as well as the need to invest in better food price data and monitoring capacities.