DNR Proactive Parks

Bolstering Sustainability, Resilience, & Vitality in Michigan’s State Parks
This project is a joint effort conducted by the students/faculty within the Master of Urban & Regional Planning program at the University of Michigan and the Department of Natural Resources for the State of Michigan as a Capstone project for the Winter 2023 semester.
Sustainability is a major point of emphasis at the Taubman College of Architecture & Planning. As such, team members were well-equipped to provide strong recommendations to the Department of Natural Resources regarding Electric Vehicles, Climate Adaptation, Belle Isle State Park, and Porcupine Mountains Wilderness State Park, planning for the future of the more than 100 State Parks within Michigan. These recommendations will guide DNR in its promotion of climate resiliency and enhanced vitality in the park system in both the near and distant future.
INTRODUCING THE PROJECT ACKNOWLEDGEMENTS
Our team would like to acknowledge all the support, resources, and knowledge provided by our client, the Michigan Department of Natural Resources. Additionally, we would like to thank the Taubman College of Architecture and Urban Planning for making the project possible, along with professor Jeff Kahan and GSI Taru for the incredible guidance they delivered throughout the process.
MEET THE TEAM INSTRUCTOR TEAM
Jeff Kahan
Lecturer, University of Michigan
Taubman College of Architecture & Urban Planning
Taru
Ph.D. Candidate, University of Michigan
Taubman College of Architecture & Urban Planning
PROJECT TEAM
Harrison Clark
Danielle Contorer
Christopher Dahman
Lingxiao Du
Sarah Fleckenstein
Matthew Hastings
Rasha Mohamed
Arthur O’Leary
Jihwan Park
Dylan Vaughn-Jansen
Jiahao Wang
Masters of Urban & Regional Planning, University of Michigan
Taubman College of Architecture & Planning
COLLABORATORS
Chuck Allen
Thomas Bissett
Nick Van Bloem
Jordan Byelich
Eric Cadeau
Karis Floyd
Deborah Jensen
Michael Knack
Matthew Lincoln
Vicki McGhee
Timothy Novak
Ron Olson
Doug Rich
Brittany Ruff
Amanda Treadwell
Maia Turek
Michigan Department of Natural Resources (DNR)
State Parks & Recreation Division (PRD)
EXECUTIVE SUMMARY
In partnership with the State of Michigan Department of Natural Resources (DNR), Parks and Recreation Division and Taubman College of Architecture and Urban Planning, this capstone project supports the State’s efforts to plan for the future of Michigan State Parks. Park management agencies across the country have been shifting to promote sustainability, climate adaptation, and vitality. This team has been tasked with assessing these issues through statelevel assessment of climate adaptation and electric recreational vehicle potential, as well as more location specific assessments of Porcupine Mountains Wilderness State Park in the Upper Peninsula and Belle Isle State Park in Detroit.
The first of four sections focuses on the current and future opportunities to promote e-recreational vehicles (ERVs) in parks across the state. This team, led by Danielle Contorer, Harrison Clark, and Jihwan Park has proposed steps to encourage the use of climate-friendly electric recreational vehicles in parks through infrastructure development. In addition to planning recommendations for where these chargers should be placed, this section examines private and grant-based mechanisms which may fund upgraded electric infrastructure and the best course of implementation for ERV chargers, based on existing case studies and programs.
The second section focuses on climate adaptation efforts highlighting natural vulnerabilities across the state of Michigan to better prepare for declining weather conditions and increased natural disasters. This team, led by Dylan Vaughn-Jansen, Lingxiao Du, and Sarah Fleckenstein addresses best practices for the implementation of a general management plan, recommends adaptive strategies, and summarizes research regarding the increased climate risk faced by the State of Michigan.
The remaining two sections provide more site-specific explorations and recommendations to help parks identified by the State. Belle Isle State Park is exploring a number of changes within the park to enhance visitors’ experiences. This team, led by Christopher Dahman and Jiahao Wang, develops plans to improve natural areas, promote sustainable transportation, and manage offpeak periods. These plans include multiple approaches for increasing park vitality including goose population management, urban dark sky, turf remediation, media plans, and event programming.
The Porcupine Mountains Wilderness State Park team, led by Arthur O’Leary, Matthew Hastings, and Rasha Mohamed, investigates approaches to increase economic vitality in the face of climate change at Porcupine Mountains Wilderness State Park. The Porcupine Mountains staff are interested in the long-term viability of the park’s recreational area. This section of the report will examine projections for the Midwest skiable season and suggest potential avenues for the park’s economic development including through increasing recreational opportunities outside of skiing. Reorganizing lodging prices, utilizing the ski hill area for recreation opportunities like mountain biking, and building adventure course attractions are among the top recommendations to cement the park’s ability to draw regional visitors.
1
ELECTRIC VEHICLES
Page 8 - Introduction
Page 13 - Existing & Future Trends in EVs
Page 17 - Case Studies
Page 23 - Recommendations
2
CLIMATE ADAPTATION
Page 45 - Introduction
Page 46 - Climate Hazards
Page 48 - Adaptation Strategies
Page 74 - Conclusion
3
BELLE ISLE STATE PARK
Page 88 - Natural Area Restoration
Page 108 - Transportation Media Plan
Page 113 - Impervious Surface Repurposing
Page 118 - Managing Off-Peak Periods
4
PORCUPINE MOUNTAINS STATE
PARK
Page 138 - Challenges
Page 142 - Regional Ski Hill Operations
Page 143 - Snow Loss Literature Review
Page 156 - Recommendations
CONTENTS TABLE OF
1 ELECTRIC VEHICLES
PROBLEM STATEMENT
With technological advancements and political support, electric vehicle use is increasing across the country. Electric vehicles are capturing an increasing market share, and consumer interest in the market is likely to continue growing. Currently, electric cars dominate the conversation, but electric recreational vehicles (ERVS) – such as jet skis, boats, and snowmobiles – are expected to gain market popularity in the coming years, due in large part to the environmental concerns of traditional combustion enginebased recreational vehicles.
Many start-ups are already selling these electric recreational vehicles, while many new and existing companies are making their first forays into the ERV market. Car manufacturers have also started to explore electric motorhomes and campers for camping. Both electric bikes and cars have seen skyrocketing sales, with rural and urban areas alike adding chargers and other infrastructure to support the conversion to EVs. Advancement of the infrastructure, technology, and investment in the ERV sector has spurred development, and the Parks and Recreation Division of the Michigan Department of Natural Resources is uniquely poised to entice and encourage use of these new technologies in their parks.
Specifically, the division has asked how they might prepare for, promote, and lead the country in the upcoming introduction of electric recreational vehicles, campers, and boats. Currently, Michigan is in the first phase of deploying a statewide EV expansion initiative, Charge Up Michigan. Through the initiative, at least 51 charging locations have been funded in Michigan state parks, though the placement methodology prioritizes statewide mobility in a bare-bones calculation of allowing electric vehicles to successfully navigate the state without losing charge. Conversely, this report details
the planning, policy, and financing needs which underlie ERV rollout specifically in state parks, while providing background, analysis, and recommendations for the Michigan DNR. Expanding ERV infrastructure is inherently connected with other statewide and national initiatives including securing enhanced electric grid resiliency and greater energy efficiency. These aligning missions create opportunities for subsidized resources among other sources of national attention and support. It is our hope that these recommendations will keep Michigan a leader in vehicle technology as well as a destination for environmentally-friendly tourism and recreation.
In this report, electric vehicles (EVs) refer to all-electric vehicles in the electric charging ecosystem. This includes electric cars, bikes, ATVs, watercraft, snowmobiles, motorhomes, and campers. Of these, bikes, ATVs, watercraft, and snowmobiles comprise the family of electric recreational vehicles – that is, all-electric “toys” primarily intended for outside recreation. These are not to be confused with motorhomes or campers, which are primarily intended for shelter while camping, traveling, and so on. Recommendations regarding electric campers and motorhomes are also a subject of this report, and though some may call these vehicles “recreational vehicles” (or RVs), this term is not used here to refer to campers and motorhomes, in order to avoid confusion.
1. INTRODUCTION
1.1 How chargers & electric charging infrastructure work
There are many electric charger types, but they are generally classified into three “levels,” based on their power. Level 1 and level 2 chargers generally use alternating current (AC) – the same type of electricity that powers most electric devices in America.
Level 1 charging is often conducted through a wall outlet and requires only a cord with one three-prong end and another for the electric vehicle, but it is very slow. Level 2 charging generally requires some modification of traditional electric infrastructure, but most modern structures can be converted without concern. In general, they draw about the same amount of power as a standard clothes dryer – around 240-volts.
Level 3 charging is somewhat different from either levels 1 or two. Instead of using alternating current, they use direct current (DC). Because the electric current from a level 3 charger (often called a DC Fast Charger) delivers charge without interruption, these chargers are extremely fast, but they require significant and expensive retrofitting of existing infrastructure. For electric recreational vehicles currently on the market, level 3 chargers are generally not supported and often unnecessary or cost-prohibitive except in areas that expect extremely high rates of ERV traffic. All currently available ERVs use level 2 charging, with only one ERV offering (a snowmobile by Taiga) expected to offer level 3 capability in the future. Level 2 charging provides a less expensive and more universal step toward encouraging ERV use in state parks, so the unique infrastructure needs of level 3 chargers are recommended only in the event that demand significantly outweighs charging capacity in parks with EV charging capability.
During the rollout of the first electric vehicles, some vehicle manufacturers attempted to create specialized and unique connectors for their vehicles. This originally led to many adaptors and access concerns, but the SAE J1772, known colloquially as the “J plug”, has become the standard choice for level 2 charging. We were unable to find a single example of an electric recreational vehicle for sale in the United States that did not use this type of connector. As a result, level 2 chargers for cars and recreational electric vehicles use
the same type of connectors and equipment, creating a surprisingly inter-operational system, and allowing REV owners to charge their recreational vehicles at sites designed for cars. While this would perhaps suffice in dire circumstances (or perhaps en route to a trail), park-based chargers are a more desirable alternative, both because they allow mid-recreation charging and because they avoid additional burden for ERV owners to find charging sites outside of the park system.
9 8
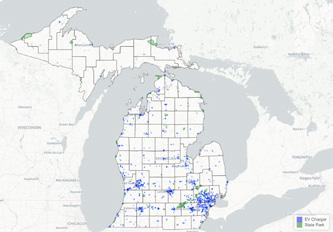
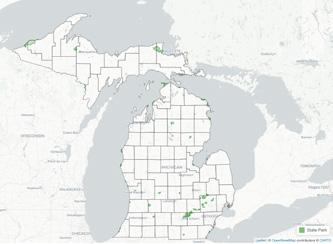
Figure 1.1: States Parks with area greater than 1000 acres in Michigan
Figure 1.2: EV Chargers & States Parks with area greater than 1000 acres in Michigan
1.2 Geographical analysis on existing chargers and state parks
Charging requirements and best practices
The placement of chargers in Michigan’s state parks is unlikely to be a one-size-fitsall approach. Therefore, while this section makes generalizations about the regions and park attributes that are likely to be best suited for charger installation, it also defers to the professional experience of staff at the Michigan Department of Natural Resources. It is evident from insights gained through our analysis of EV technology, existing policies, and case studies across the United States, that Michigan State Parks will require a range of strategies to implement this new technology across varied locations and contexts. In combination with park staff expertise, we hope that the recommendations presented here will encourage best practices in charger placement, installation, and partnerships.
SNOWMOBILES AND ATVS
First, we recommend establishing chargers on paths and in parks already frequented by snowmobiles and ATVs. The primary benefit of this recommendation is economic: the only new infrastructure requirement would be the charging station itself, and DNR staff will not be required to build, maintain, or groom additional trails. Like electric cars, electric recreational vehicles are meant for incorporation alongside existing recreational vehicles, so separation is unnecessary. Similarly, the establishment of charging stations along routes currently used by snowmobiles and ATVs is likely to spread awareness of ERV adoption through conversation with ERV users and curiosity about the new infrastructure. In expectation that the majority of ERV early adopters are likely to already own a recreational vehicle and frequent certain trails and regions, this
recommendation also encourages direct marketing to potential adopters.
The best placement for ERV chargers is wherever they will be most used. Given this, the placement of chargers on loops or out-and-backs is an attractive option –enabling users to make use of the chargers at various points of their recreation. This will also encourage more awareness of chargers, due to RV traffic going past, if not using, the charging site. For this reason, placement of chargers as near as possible to trails is ideal. Similarly, because charging an ERV takes a larger amount of time than filling a tank with gas, placement of chargers is crucial and may even become a source of economic development for rural regions if done correctly. If an ERV user can stop at a bar, restaurant, or other attraction – or perhaps a town which contains many such locations – they are likely to do so while awaiting a new charge. This will also reduce the costs of electrification because modern electric infrastructure is more likely to be available in areas which already have residences and businesses. Earlier adopters of ERVs may also have more expendable income to spend at these locations and an interest in small or local businesses. If companies begin renting ERVs, this would also enable switching-out snowmobiles or ATVs which are running low on battery for a new one, or charging at a provider-specific location. Similarly, ERV users may be interested in exploring nature on foot while waiting to recharge, so short trails or attractive natural sites nearby to charging locations could prove popular.
Finally, to encourage use of ERVs on trails, signage and marketing are crucial. In the early stages of ERV rollout, trails which cater to ERV users are certain to be unique and rare. The DNR should seize on this opportunity to promote the opportunity, marketing these trails on their website and social media accounts, as well as through press releases and public relations campaigns. Signage
in the area is also crucial, not only because ERV users who get lost may find themselves running out of battery, but as a way to reduce range anxiety for potential trail users and make the presence of such areas better known among current snowmobile and ATV users. Chargers installed with these vehicles in mind should include payment systems, even if they are not initially enabled, so that consumers can be asked to cover the cost of the electricity that is generated.
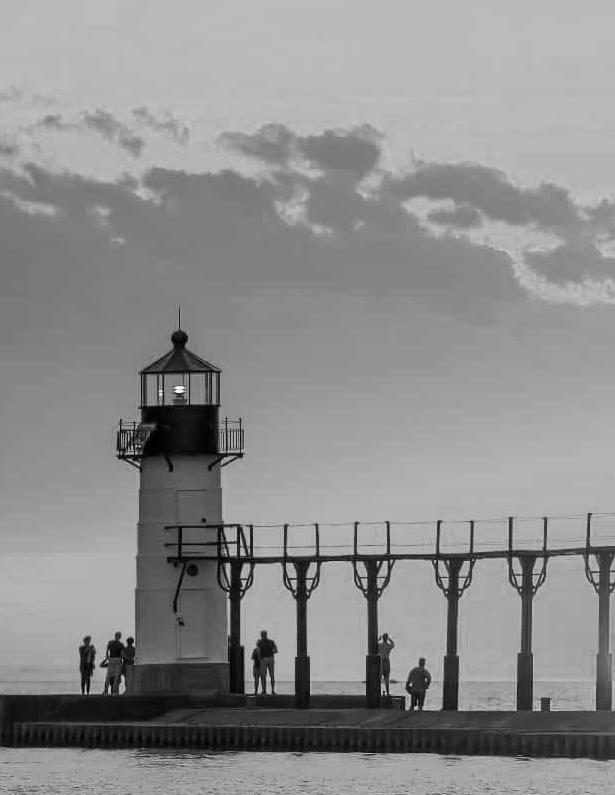
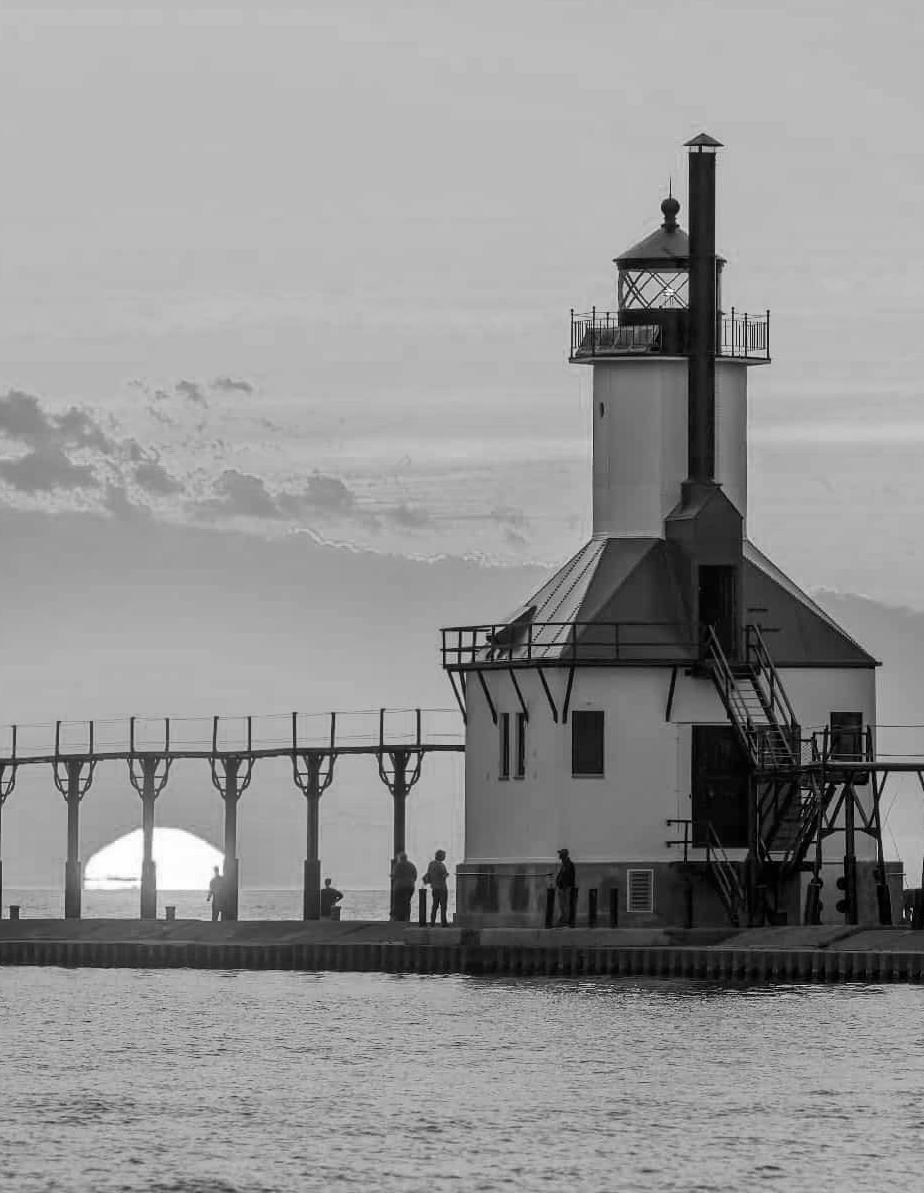
WATERCRAFT
The placement of boat and jet ski chargers is, by necessity, simpler than placement of snowmobile and ATV chargers. Chargers must be installed on docks, and in many cases, this may be as simple as retrofitting existing dock infrastructure. Many docks in the United States already have electricity, often in 30 and 50-amp configurations, to charge the batteries on personal watercraft while they are docked. Though watercraft chargers are not yet ubiquitous as neither electric boats nor waterskis are currently shipping to consumers, this existing infrastructure is almost certain to lower the cost of installation. We therefore recommend that electric charging infrastructure for personal watercraft sit side-by-side with existing, traditional charging pedestals so that electric boat owners may make use of the existing infrastructure without taking space away from gas-powered personal
11 10
1.3
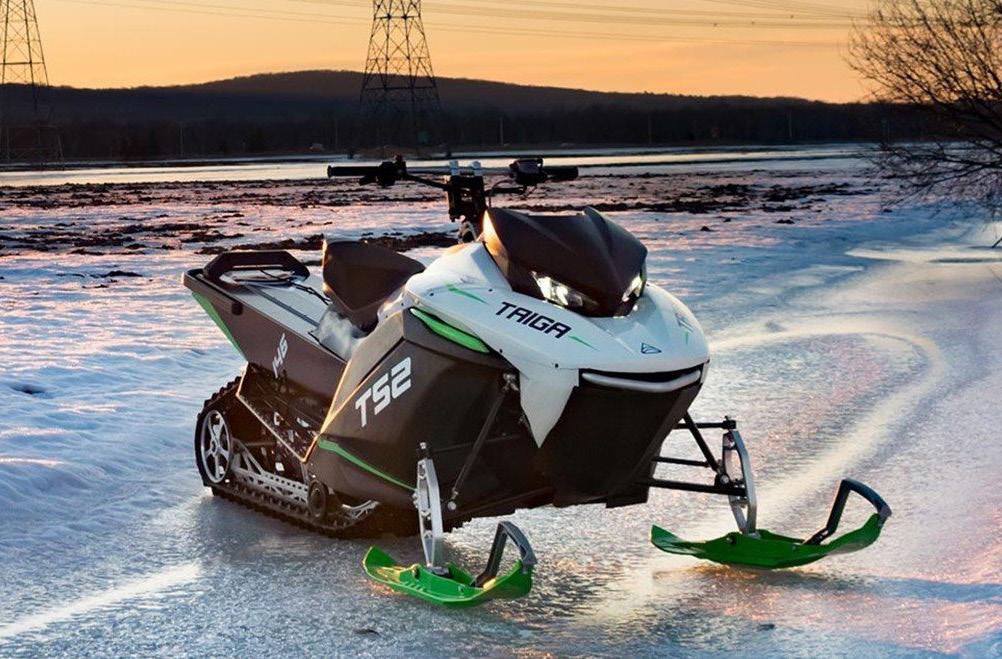
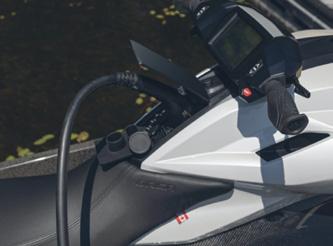
Figure 1.3: Taiga’s EV snowmobile, the first electric model commercially available2
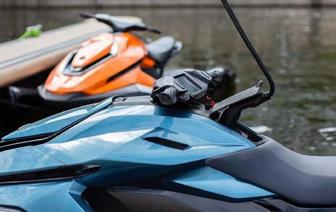
Figure 1.4: EV jet ski dockside with EV charger3
watercraft. As the transition to electric watercraft continues, it may be possible to phase out older charging pedestals, though converting, not reducing, charging options on existing docks is the best approach to encouraging electric boat users at the lowest cost and with the least disruption to other watercraft-users. As with all electric charger installations, we recommend including payment systems on the pedestals so that users will offset the costs associated with increased electricity draw.
CAMPERS & MOTORHOMES
Campers and motorhomes are already largely dependent on charging pedestals at overnight camping sites. Currently, there are no electric motorhomes or campers on the market in the United States, and the majority of camper users do not travel more than a few hundred miles from their homes – still a number of manufacturers, such as Winnebago, are attempting to bring E-motorhomes to market. Motorhomes and campers are also frequently pluggedin during their use, with chargers directly
running the battery.4 Therefore, while electric campers and motorhomes should have the ability to charge at state parks, electric camper and motorhome users are unlikely to expect to charge their batteries, or need to do so, at campgrounds in state parks. With this in mind, we recommend a wait-and-see approach toward installing charging stations focused on campers and motorhomes, especially given that future vehicles are likely to use the same chargers as electric cars. In the meantime, investment in upgraded electricity infrastructure in areas where campers and motorhomes currently use power is the best way to prioritize resources to prepare for any market trend and will benefit current users of motorhomes as well. Considering how the cost of power could be passed onto consumers is also a best practice, and improvements of the electrical infrastructure should include meters or payment systems, even if not active, so that the future potential for increased electricity demand at these sites will create increased costs for the Department of Natural Resources.
2. EXISTING AND FUTURE TRENDS IN EVS
2.1 Industry’s Transition to Electric Vehicles
The electric vehicle market has exploded in recent years. There is good reason to believe that Americans will continue gaining interest in the electrification of vehicles (both cars and recreational), especially as the price point of battery technology continues to fall. In 2021, global CO2 emissions from the transportation sector were 7.7 gigatons, equivalent to 23% of all global CO2 emissions.6 Of this, road transportation emissions accounted for 77%.7 Because this sector relies so heavily on fossil fuels, the electrification of road vehicles is essential, and electric vehicles will play a significant role in decarbonization. Fortunately, global electric vehicle sales continue growing. Global electric car sales reached their highest rate in 2021 – 9% of all new cars sold – despite the global supply chain issues. Battery electric vehicle (BEV) and plug-inhybrid electric vehicle (PHEV) sales increased from 200,000 in 2013 to 10.5 million in 2022, representing 13% of global light vehicle sales in 2022.8 According to Goldman Sachs and Bloomberg, EVs will make up about half of new car sales worldwide by 2035.9 10 In the United States, 630,000 electric cars were sold in 2021, accounting for 4.5% of total car sales.11
However, the United States still lacks sufficient charging infrastructure, compared to what will be needed to meet demand in the near future. Charging issues are the biggest concern for EV consumers in the US.12 S&P Global Mobility estimates that there are about 126,000 Level 2 and 20,000 level 3 chargers in the US as of 2022. By 2027, about 1.2 million Level 2 chargers and 109,000 Level 3 chargers need to be deployed nationally to meet expected demand. In addition, by 2030, about 2.13 million level 2 and 172,000 level 3 public chargers will be required to keep up with an expected 28.3 million electric vehicles
on US roads.13 Increased demand for these chargers could be alleviated by ERV-specific chargers in park environments, far from parking lots – beginning with popular state parks in areas with more EVs.
2.2 Political Support for EV Infrastructure
Climate change, the coronavirus pandemic, global supply chain issues, and the Russian invasion of Ukraine have changed the U.S. energy market significantly, making fossil fuel supply sources much less reliable and their prices more volatile. The United States has also begun taking significant steps toward increasing access to fossil fuel alternatives. For example, the Inflation Reduction Act (IRA), signed on August 16, 2022 contains $369 billion in energy security investments and climate protection programs over the next ten years.14 Expanding the electric vehicle market is one of the main contents of the act, and the same technological innovations are likely to benefit technological innovations relevant to ERVs as well.
The Bipartisan Infrastructure Law (BIL)will also provide $7.5 billion to develop EV charging infrastructure in the US. The goal is to install 500,000 public chargers by 2030. However, even the addition of public chargers could be insufficient to support the growing number of electric vehicles predicted to be on the roads in the near future.15 The National Electric Vehicle Infrastructure (NEVI) Formula Program, created by BIL, also contains a total of $5 billion to be spent on electric-vehicle chargers across 53,000 miles of highways in 35 states across the country, including Michigan.16
Michigan’s Department of Natural Resources funds their Waterways Program from two sources – boat registration fees and the Michigan marine fuel tax.17 We recommend that the Michigan DNR invest in watercraft chargers which allow billing by kilowatt hour (kWh) and explore their statutory ability to
13 12
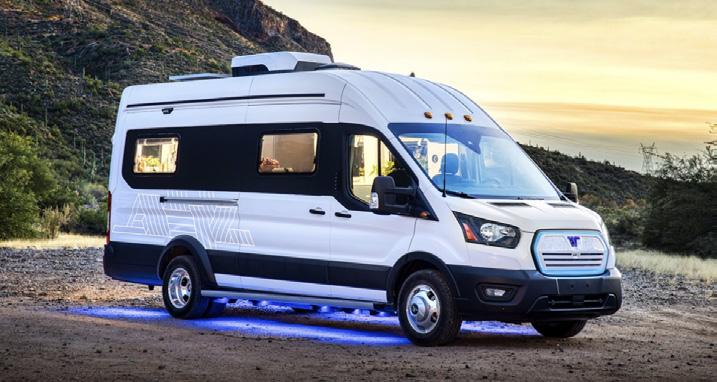
Figure 1.5: E-RV Winnebago Sprinter Van Concept Model5
divert those funds to the Waterways Program in order to make up for the expected loss of marine fuel revenue. In the long term, we recommend that the State of Michigan adopt a two-tier boat registration fee, where EV boats pay a higher rate due to their marine fuel tax-free operation. Michigan may consider this alongside requiring registration for jet skis (as Wisconsin does) as a method to recoup revenue lost to electrification.
2.3 Market Trends of Electric Vehicles
An electric vehicle is defined as “a vehicle that can be powered by an electric motor that draws electricity from a battery and is capable of being charged from an external source.”18 We categorized electric vehicles into three categories: electric cars, electric motorhomes and campers, and electric recreational vehicles. As already mentioned, electric recreational vehicles mean all-electric “toys” intended for outside recreational use, including electric bikes, electric all-terrain vehicles (ATVs), electric watercraft, and electric snowmobiles. In addition, although some may call motorhomes and campers “recreational vehicles” (or RVs), this term is not used in this report to refer to campers and motorhomes, in order to avoid confusion.
ELECTRIC CARS
As explained in industrial and political trends, the electric car market has exploded. The number of electric cars is rapidly growing, already accounting for 4.5% of total car sales in 2021. The transition will definitely affect the needs and patterns of state park visitors, so we need to prepare for the change. An increasing number of SUVs and Pickup trucks, which are commonly used for camping at state parks, were going electric, accounting for 16% of total SUV sales and 1.8% of total pickup track sales, respectively, in 2022.19 20
Besides, though cars are not the focus of this study, interest in electric vehicles and
electric recreational vehicles are closely intertwined, with Americans’ interest in the market representing a shift toward electric modality. Further, Level 2 chargers for electric cars are most often compatible with electric recreational vehicles. This means that, as Americans bring chargers into their homes for their new electric vehicles and become comfortable finding and using chargers in public places, there will be fewer hurdles to adopting electric recreational vehicles. Advances in battery-electric technology may similarly benefit both cars and recreational vehicles which rely on electric power.
ELECTRIC CAMPERS AND MOTORHOMES
Electric camper and motorhome market is just emerging. Some companies have announced their new electric campers and motorhomes. Major car manufacturers, such as Mercedes Benz, Toyota, and Volkswagen, unleashed their 100% electric campers in 2022 and 2023.21 22 Traditional camper and motorhome manufacturers, Bowlus, Winnebago Industries, and Thor, also unveiled their all-electric campers and motorhomes in 2022.23 24 25
With technological advancement and political support, car manufacturers are able to mount high-capacity battery packs and efficient power systems to campers and motorhomes. The price of electric campers and motorhomes is also getting affordable, accelerating market growth in electric models.
introducing the first-ever mass-produced electric watercraft.28 The only electric watercraft currently on the market in the U.S., the watercraft boasts nearly 30 miles of use between charges. Taiga currently supports level 1 and 2 charging on these boats as shown in Figure1.6, but they are working to integrate level 3 charging.29 The company who owns Sea-Doo has similarly signaled their commitment to electrifying their fleet by 2026.30
snowmobiles in terms of acceleration, top speed, noise reduction, and pollution minimization.32
ELECTRIC ATVS
ATV market is also transitioning to electrification not only to minimize traditional ATVs’ noise and pollution but also to cope with current volatile gas prices. The Global electric ATV and UTV market size is expected to grow at an annual average of CAGR 19% during 2023-2029 with battery technology advancement.33 The U.S. market also is expected to grow around 19% annually since North America is the biggest and fastgrowing market in the world.

ELECTRIC WATERCRAFT
A number of factors influence the sale and use of personal watercraft, including technological improvements, access to water activities, and disposable income.26 North America is the largest watercraft market, and the U.S. market accounted for the biggest market share in 2020.27 In 2019, Taiga also unveiled its electric water jet,
ELECTRIC SNOWMOBILES
Taiga, the Montreal-based start-up, has recently released a lineup of snowmobiles, some of which have begun shipping to customers. These snowmobiles have a range around 60 miles between charges, with one which supports level 3 charging in development. Taiga snowmobiles have been quickly adopted, and the company is investing in chargers along designated partnership paths in Québec, which will be detailed in the case study. The maker of SkiDoo has pledged to go all electric by 2026, and brands like Artic Cat are attempting to follow.31
Taiga announced the first electric snowmobile to the public in 2018, and now the company’s products have better specifications than traditional two-stroke
In 2021, Polaris unveiled the Ranger XP Kinetic with a driving range of 80 miles and a towing capacity of up to 2,500 lbs,34 and EcoCharger launched Lithium Prestige 4WD ATV with a driving range of 69 miles and a towing capacity of up to 881 lbs.35 In 2022, Theron Sport, a small start-up based in Quebec, developed Reever with 110 miles of driving range and 1,500 pounds of towing capacity.36 Although the prices of the models, ranging from $20,000 to $30,000, are much higher than traditional models, most models are eligible for a 10% tax credit off the purchase price.37
15 14
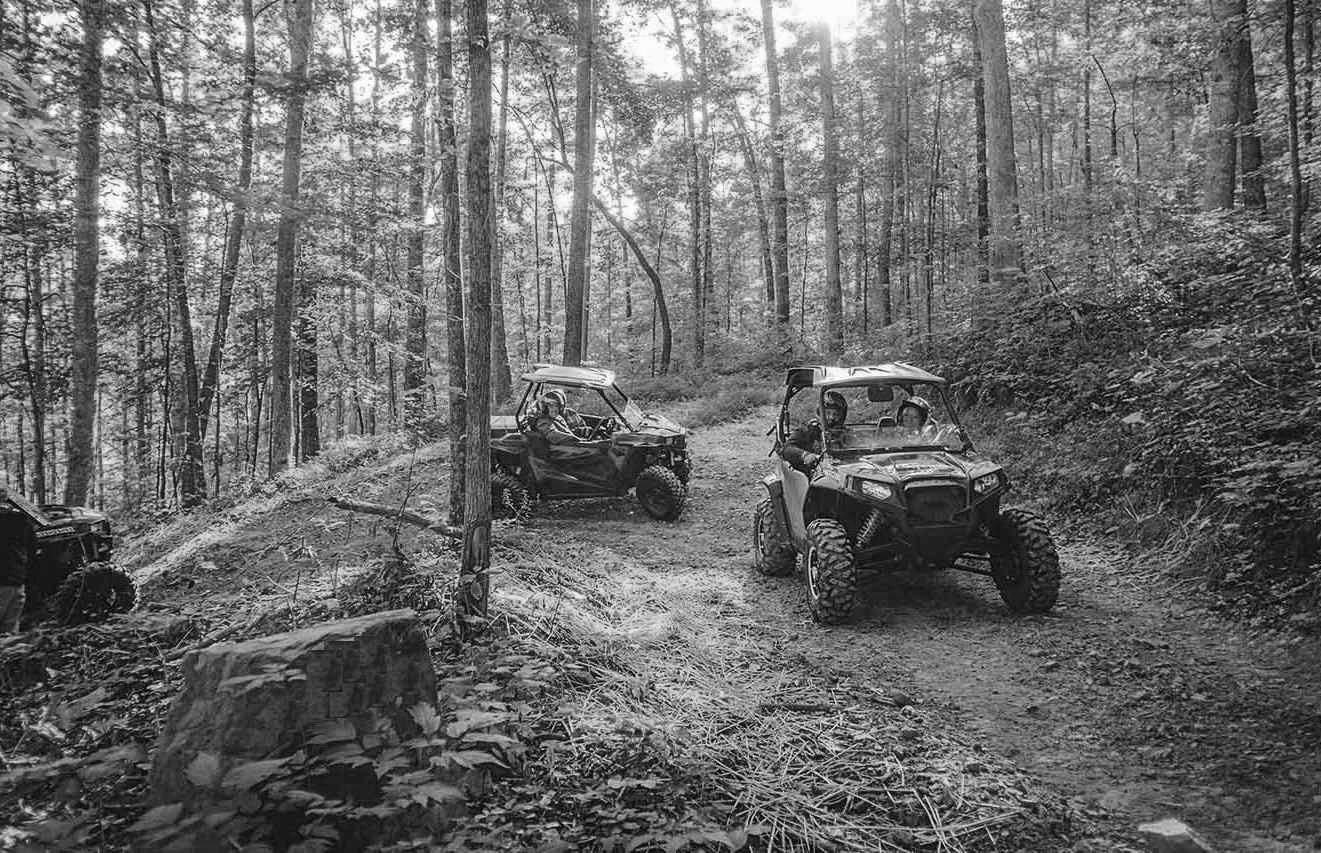
Figure 1.6: Taiga watercraft “Orca” charging with an universal charging connector.
Figure 1.7: Polaris ATV in a Michigan state park, just off the trail.
Current Issues and Challenges
With ongoing trends in electric vehiclefriendly policies and increased industry interest, the number of electric vehicles in the US is expected to grow for the foreseeable future. Currently, most state parks require a car to visit because of their remote locations and limited public transportation options. Electric cars are already popular to bring visitors to and from the parks, with chargers available in increasingly remote areas. The electric camper and motorhome market is also emerging. Therefore, state parks need to prepare to establish charging infrastructure to attract people to state parks and increase revenue.
In addition, parks need to expand their electric vehicle infrastructure to mitigate air and water pollution. Most particulate matter (PM10) emissions in national parks are dominated by road dust, and sulfur dioxide (SO2) and nitrogen oxides (NOx) emissions are primarily from automobile fuel combustion.38 Decreasing the number of traditional gas-combustion vehicles is essential to reduce air pollution, such as SOx, NOx, and PM10, in state parks.
In addition, most snowmobiles currently use two-stroke motors, which emit 90 times as much air pollution as standard automobiles and seriously impact water chemistry and quality.39 Snowmobiles are also extremely loud, especially in comparison to their often quiet surroundings, and consequently may
disturb wildlife and people. Although there has been severe criticism of two-stroke motors, they still comprise a vast majority of snowmobiles in use, especially due to their lower price point. Therefore, there is a trend to regulate the number of snowmobiles and water jets at national or state parks. For example, to encourage this switchover, the National Park Service announced a federal regulation code that prohibits personal watercraft with two-stroke engines that do not meet 2006 emission standards at Lake Mead and Lake Mohave National Recreation Area after the year 2012.40 In addition, NPS regulates the number of snowmobiles up to 720 per day at Yellowstone National Park from 2006 and 540 in 2008.41 Electrification of these vehicles can mitigate these environmental concerns.
There is already a movement to expand electric vehicle infrastructure in national and state parks in the US from the public and private sectors. The National Park Service (NPS) is collaborating with the National Renewable Energy Laboratory (NREL) to install Level 2 charging stations in all 28 California national parks and monuments to serve their 39 million visitors per year.42 NPS is also partnering with BMW to install up to 100 electric vehicle charging stations nationwide.43 In addition, Rivian, an electric vehicle maker and automotive technology company, is installing electric charging stations across the US, including Michigan, Tennessee, Colorado, and South Carolina.44 45 46 47
With the negative environmental impacts of traditional watercraft, a shift in the market share toward electric watercraft would provide opportunities to reduce certain sources of pollution in vulnerable areas. For example, motorboat use can lower water quality in lakes by raising levels of nitrogen, polyaromatic hydrocarbons, and methyl tertbutyl ether – all of which threaten to disturb ecosystems and deplete water quality.48 Though the adoption of e-watercraft cannot entirely remove emissions, it would almost certainly improve environmental conditions and contribute to the preservation of Michigan’s waterways and Great Lakes.
One of the major challenges is that the prices of electric recreational vehicles are higher than those of traditional ones as shown in Table 1. However, fortunately, the price is going down with technological advancements and tax credits.
The State of Michigan has installed the first two Level 2 EV charging stations in Holland State Park and unveiled its plan to install more than 30 additional charging across 15 Michigan state parks in 2023.49 Although this project can serve as a stepping stone for expanding electric vehicle infrastructure in the future, it is likely to be insufficient, both due to its small scale and parking lot placement, as this will not serve recreational vehicles on trails, docks, or campgrounds.
3. CASE STUDIES
3.1 Taiga Snowmobile Trail in Quebec, Canada
In June of 2022, Taiga Motors kicked off its deployment of EV chargers with the installation of e-snowmobile chargers in the remote forests of the Mauricie and Lanaudière regions of Québec. This location is a hotspot for snowmobilers already, and upon visiting the Lanudinére’s official website, users find a snowmobile page boasting, “Endless snow. Infinite white landscapes”
before welcoming users to “Snowmobile Country.” Taiga’s expansion into this area builds on nearly 3,000 miles of existing routes and trails.50
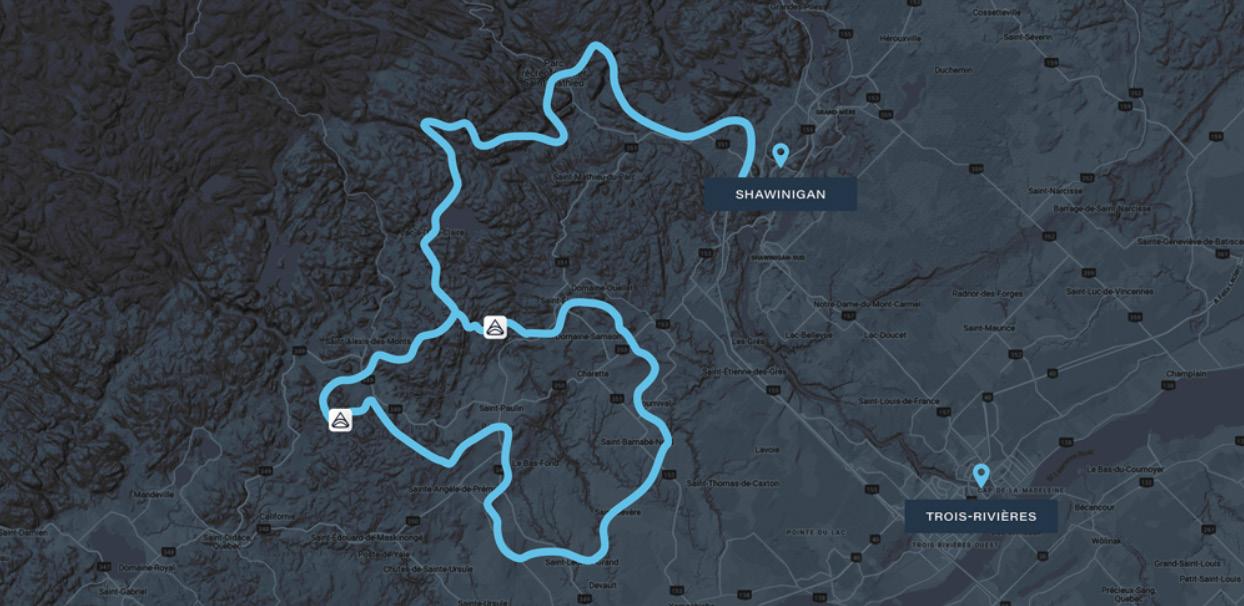
Taiga created a 150 mile loop for snowmobilers to ride freely, knowing that they were within reach of a charger as shown in Figure 1.8.51 Without electric charging infrastructure, this would have been unthinkable, and would-be electric adopters would have found themselves constrained to short, out-and-back trips and competition with cars for use of level-2 chargers in the area, found themselves constrained to short, out-and-back trips and competition with cars for use of level-2 chargers in the area, or constrainment to charge using traditional outlets – a process which is feasible for overnight charging but would be unlikely to allow operation for more than one batterylife per day.
Amazingly, Taiga achieved this loop with only two charging stations. The first stop consists of two level-2 chargers and one level-3 charger. 50 miles from the start of the trail, the charger is placed in Le Baluchon, an éco-villégiature (small, countryside getaway location) with a focus on preserving that natural environment for tourists. Local businesses seem likely to thrive with the placement of electric charging stations so close to the town, and snowmobilers will have the option between a three-hour charge and a visit to the village or a faster, one-hour charge. 50 miles further, riders may also stop at Pourvoirie du Lac Blanc, a small town with tourist-focused amenities and dining establishments. With both level-3 and level-2 chargers available, snowmobilers again have the option to take a longer or shorter break before covering the last 60 miles to return to the trailhead.
17 16 2.4
Traditional Electric Watercraft (120 - 180 hp) $10,000 - $20,000 103 $15,000 - $25,000 104 Snowmobile $10,000 - $15,000 105 $17,000 - $20,000 106 ATV (four wheel, 250 cc - 1000 cc+) $5,000 - $15,000 107 $10,000 - $25,000 108 Table 1.1 Price
differences between traditional and electric recreational vehicles
At the time of construction, Taiga was not yet shipping their e-snowmobiles, and the trail has only recently been unveiled. Still, many of the lessons from their deployment of chargers may inspire future attempts to build networks of chargers to satisfy growing ERV needs. Notably, this is the only known e-snowmobile-friendly trail in the world. The assumed user base for this track are individuals who already frequently go snowmobiling in the area and choose to buy their own e-snowmobiles. Taiga’s investment in both the product and the locale represents a “build it and they will come” mentality that is familiar among EV car companies and has proven effective at expanding use by
minimizing so-called range anxiety.52 The choice of a trail in the shape of a loop also maximizes the ability of snowmobilers to use chargers and may allow potential expansion in the future – as e-snowmobile ranges or EV trail networks grow. Finally, incorporating level 2 and 3 chargers nearby to local villages and locations of interest encourages the use of either charger, depending on the user’s preference, and offers flexibility to patronize local businesses while keeping the cost of installation down by not relying solely on level-3 charging.
3.2 Renewable Energy Facilities in New York State Parks

A number of state and local governments are shifting their energy sources to renewable energy for sustainability and energy independence. The global electricity generation share of renewable energy rose from 1.4% in 2000 to 13% in 2021, driven by the rapid growth of solar and wind power.53 54
In particular, global renewable energy consumption has grown at an average of 12.6% per year.55 The electricity market in the US also has a similar trend. The renewable energy share increased from 9.2% in 2010 to 19.7% in 2021, especially with the increase in
solar and wind power from 0.01% to 2.81% and from 0.15% to 9.21%, respectively.56
Renewable energy deployment in national and state parks is also spreading across the country as many states set decarbonization and renewable energy targets. In particular, New York State is one of the most ambitious states in the US regarding renewable energy expansion and climate change adaptation. The state has a goal of generating 70% of its electricity from renewables by 2030 and 100% from zero-emission sources.57 The recently passed Climate Leadership and Community Protection Act (CLCPA) funds infrastructure to generate an estimated nine gigawatts of offshore wind installation by 2035, six gigawatts of distributed solar by 2025, and three gigawatts of energy storage by 2030.58 From 2011 to 2021, New York State Parks have installed 6 megawatts of solar panels, covering 15% of State Parks’ total statewide energy consumption. New York State Parks’ goal is to cover half of its electricity needs at parks, historic sites, recreational trails, golf courses, and other facilities through renewable energy by 2027.59
Grant Cottage State Historic Site in New York State went off the grid in 2021 since a
19 18
Figure 1.8: Taiga’s electric off-road charging network with the 250-kilometer trail loop through the forests of the Mauricie and Lanaudière regions in Quebec. There are two stops with both level-2 and level-3 charging stations.
Figure 1.9: Doreen Paris, president and CEO of NYSERDA announced that N.Y. Grant Cottage became the first NYS park to disconnect from the grid during a press conference on Monday, April 19, 2021 in Wilton (Lori Van Buren/Times Union)
$400,000-project with 90 solar panels with 34.2 kilowatt-output and 48 batteries for power storage can provide 100 percent of the electricity needed to operate its twostory residential building and visitor center.60 The system will enable Grant's Cottage to become the first State Park disconnected completely from the electric energy grid (Figure 1.9).61 The project was supported by the New York State Energy Research and Development Authority (NYSERDA)'s On-site Energy Manager Program.
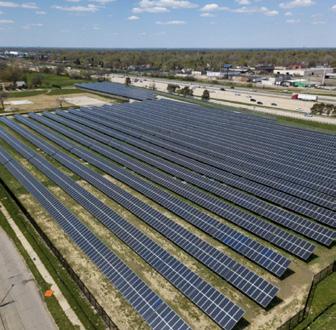
In addition, New York State Parks launched major solar power projects at four state parks on Long Island and in the Hudson Valley, partnering with New York Power Authority (NYPA) and AES Distributed Energy in 2020. NY Green Bank, a division of NYSERDA, provides financing to support the projects. The four solar arrays at state park locations total 3.8 MW and are expected to produce about 4.6 GWh of energy annually. The first location is Sunken Meadow State Park in Kings Park (Suffolk County, easternmost portion of Long Island) as shown in Figure 1.10.62 Two ground arrays contain a total of 988 solar panels that are expected to produce about 444,100 kWh annually and will connect to the grid through a PSEG distribution line.63 The second location is Taconic State Park (Columbia County). A ground array will contain 3,640 solar panels expected to produce about 1.6 GWh in the first year and will connect to the grid through an NYSEG distribution line. The third location is James Baird State Park in Pleasant Valley (Dutchess County). A ground array at the site will contain 6,474 solar panels expected to produce about 2.7 GWh in the first year and will connect to the grid through a Central Hudson distribution line. The last one is Clarence Fahnestock State Park (Putnam County). A ground array at the Canopus parking lot will contain 384 panels expected to produce nearly 166 MWh in the first year and connect to the grid through an NYSEG line.
Rivian, an electric car manufacturer, plans to install a “Waypoint Chargers Network” at shops, restaurants, hotels, and parks across the U.S. and Canada. The network will consist of more than 10,000 Level 2 chargers open to the public for EVs using the J1772 plug.64 The J1772 plug is the type of plug used by most electric vehicle makers, including Tesla, Ford, Hyundai, Toyota, and Rivian, for Level 1 and Level 2 charging. Their plan also includes steps to install chargers at state parks. Rivian has installed or plans to install additional EV charging stations at state parks in Michigan, Tennessee, Colorado, South Carolina, and other states.
The Lake Michigan EV Circuit Tour, also called an “Electric Route 66”, is another example of partnership between Rivian, state governments, utility companies, and nonprofit organizations to install EV chargers in state parks. The circuit spans more than 1,100 miles of drivable shoreline along the lake. New EV chargers will be installed along the
route within the next few years to link major cities surrounding Lake Michigan – including Chicago, Milwaukee, Green Bay, Traverse City, and other cities. Rivian already reached an agreement with the states of Illinois, Indiana, Michigan, and Wisconsin to proceed with the multistate collaboration project.65 As part of the plan, Rivian has installed two Level 2 charging stations in Holland State Park and will expand the plan to 15 additional state parks in Michigan.66
Rivian partners with local governments, utility companies, transmission companies, and nonprofit organizations to install EV charging stations in state parks. For example, Rivian will provide Level 2 Rivian Waypoints chargers at no cost to the state or taxpayers in the state of Michigan. Figure 1.11 shows the financing structure and stakeholders of the project. ITC, an independent electricity transmission company, provides the funding for electrical use. Consumers Energy, a Michigan-based utility company, runs a program to pay for upgrades to the electrical systems at state parks necessary for installing EV chargers through the Power MI Drive program. Adopt a Charger, a nonprofit organization, provides technical, marketing, and sponsorship
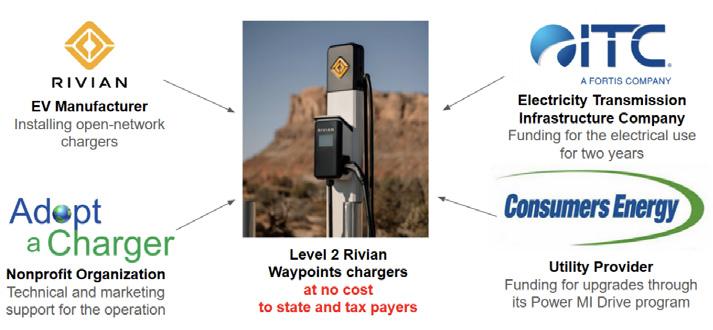
support for the operation of the chargers.67
In addition, Rivian powers its charging networks with 100% renewable energy. This means that the amount of electricity the EV charging system delivers is equal to or less than that generated from renewable resources on an annual basis.68 Rivian uses various mechanisms to meet renewable energy electricity demands, including power purchase agreements (PPA), onsite and community-based renewable projects, and partnerships with utilities or local energy developers. When it is not possible to connect to current energy sources or the current grid heavily relies on fossil fuels, Rivian develops energy sources in local communities partnered with energy developers. A 6.75-megawatt solar project in Tennessee is a representative example. Since Tennessee’s grid is powered by only 0.4% solar, Rivian was not able to find proper sources for its electricity demands. Therefore, the company partnered with Clearloop, a Nashville-based carbon solution company, to develop “Paris Solar Farm – Puryear” in Henry County in Tennessee. Rivian provided 15% of upfront financing of the solar project to cover electricity that will be used by
21 20
Figure 1.10: Installed solar farm in Sunken Meadow State Park in Kings Park (Suffolk County, easternmost portion of Long Island)
3.3 Rivian EV Charging Systems in State Parks
Figure 1.11: Partnership to install level 2 Rivian chargers in Michigan
Rivian Waypoints chargers planned for Tennessee state parks.69 Through this partnership, Rivian is committed to reducing carbon and increasing renewable sources generation and access for local communities. Meanwhile, Clearloop quantitatively measures carbon emissions and compares the impact of renewable energy projects to determine where the new solar projects can be deployed. The company also assesses the social and economic impacts of the project on communities in terms of economic benefits and sustainability.70
3.4 O’Shea Solar Park
Public lands may also be leased to private companies, particularly utility companies or energy developers, as a source of revenue for both public and private partners. O’Shea Solar Park in the Grandale neighborhood of west Detroit, completed in 2017, is a perfect example of a partnership between the
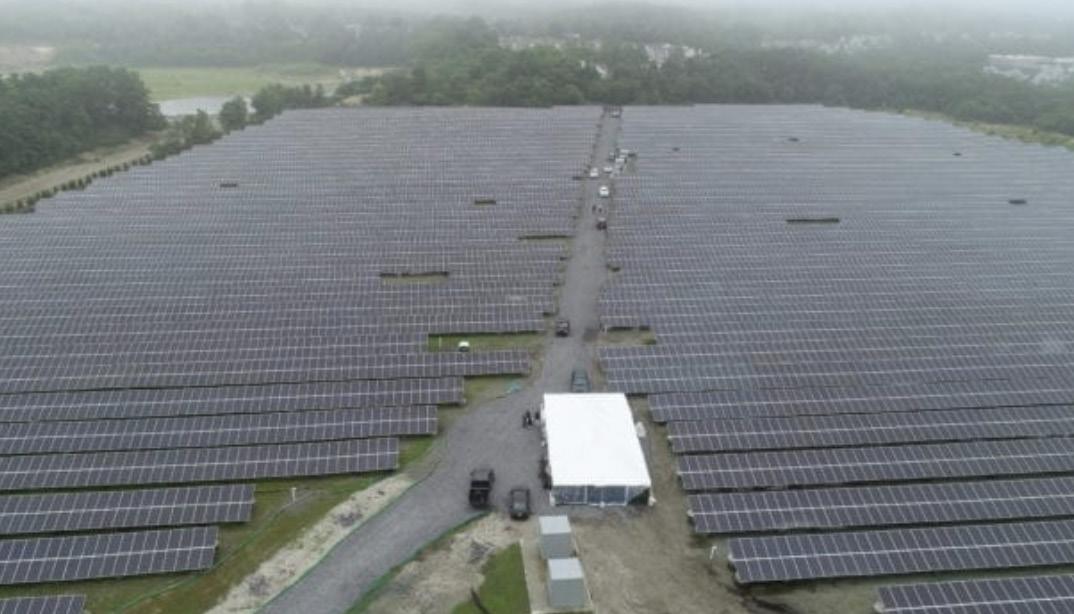
public sector and a local utility company. The 20-acre site owned by the city of Detroit had been abandoned for many years. A playground and a historic recreation center were damaged and decommissioned for several years. The city of Detroit and DTE Energy, a local utility company, partnered to transform this abandoned site into one of the largest urban solar farms in the U.S.71 The 2.44 MW solar array facility, consisting of 7400 Suniva high-efficiency modules, SMA string inverters, and Solar FlexRack racking systems, can power 450 homes in Detroit as shown in Figure 1.12.72 73 According to the City of Detroit, the predicted tax revenue is $1.4 million over 20 years. DTE also paid $25,000 one-time lease payment and agreed to maintain a portion of the the 10-acre solar array which costs approximately $400,000 over the lease lifetime. Beyond that, DTE Energy also rebuilt playgrounds, picnic areas, and educational facilities, and provided local job training and placement for local workers during construction and maintenance.
4. RECOMMENDATIONS
4.1 Financing Mechanisms to Expand Energy Grids
Implementing EV chargers in state parks will likely require financing from a variety of stakeholders. Adding EV chargers and infrastructure to state parks places an additional strain upon the existing energy capacity at each site, so the first focus must be on expanding energy capacity at state parks. Once the grids have been retrofitted and can sustain an optimal level of electric current, state parks could add the supply of charging stations in which the grid was built to support.74 To determine if a park’s electric grid needs to first expand in order to build out charging capacity and infrastructure, individual parks will need to contact utility distribution planners through their respective utility providers. Depending on the need for increased charging infrastructure and the current capacity, state parks will have differing needs and expected costs for installation. Once the electric grid has been retrofitted to meet a specific park’s needs, a park can purchase its own chargers for an average of $2,000 per unit, for an average installation cost of $2,000 per unit.75 However, financing the grid’s expansion is the first step to implementing EV infrastructure.
One of two options for expanding state parks’ electric capacity focuses on building existing electric grids to enable its support of added electric use. Expanding the grid’s current electric source involves increasing transmission and distribution substations to augment the existing infrastructure.76 Facilitated either through federal grant application and distribution or fragmented contracts between individual state parks and regional electricity companies, the financing for this expansion will require assessments of existing energy capacity at individual parks. Grid expansion provides an opportunity to incorporate more resilient and efficient energy infrastructure for increased clean energy production over time. There is federal capital available for this initiative. The Biden-Harris Administration launched the Grid Resilience Innovative Partnership (GRIP) program as part of the administration’s Building a Better Grid Initiative, and was funded by the Bipartisan Infrastructure Law in 2022.77 The GRIP Program provides $5 billion between FY 22-26 to finance initiatives and programs that innovatively utilize transmission retrofitting and grid expansion to expand clean energy. Creating resilient and reliable grid infrastructure throughout Michigan’s state parks optimizes this capital by simultaneously contributing to the
Program
Smart Grid Grants
Relevance
Increasing capacity of transmission systems, integrating renewable energy at the transmission and distribution levels, and facilitating the integration of increased electrified vehicles and buildings.78
Grid Innovation Program
Innovative approaches to expand existing energy grids to accommodate increased EV infrastructure.79
Economic development focus: expanding state parks visitation to households with EVs, E-motorhomes, and E-recreational vehicles.80
23 22
Figure 1.12. The O'Shea solar project in Detroit. DTE partnered with the city of Detroit on a 10-acre 2.44 MW solar project in 2017. DTE and the city agreed to a one-time lease payment of $25,000 covering 20 years.
Transmission Siting and Economic Development Grants Program
Table 1.2: Available Federal Grants through the GRIP and Transmission Facilitation Programs
electrification of vehicle and recreational infrastructure. This Program provides a plethora of financing mechanisms available to states to administer electric grid expansion. The federal assistance is attained by a state entity which then distributes the funding between its targeted parks. The state of Michigan’s DNR is a qualifying entity to apply for the following grants, and if granted the capital, can distribute it between state parks at its own disposal. Therefore, the DNR will further have to analyze and prioritize which parks at differing scales should receive different levels of funding. The financing options have various intentions, and Table 1.2 shows potential programs that have direct relevance to Michigan’s potential initiative.
4.2 Renewable Microgrids as a Supplemental Electricity Source
The second of two recommendations for bridging the energy gap between existing energy availability and the energy necessary to power new EV chargers is utilizing a microgrid of renewable energy sources. The necessary retrofitting for electric grids at state parks, allows an opportunity to supplement traditional electric systems by adding a microgrid as a separate source of electricity to supplement the existing energy system. Installing a microgrid allows for the opportunity to switch the source of energy to renewable systems such as solar or wind. Electricity generated from a traditional grid source is financed by surge pricing where the relationship between energy consumption and energy costs are directly correlated. Solar panel efficiency refers to the relationship between peak sunlight received by a solar panel and its ability to convert that sunlight into electricity.81 Utilizing a solar grid can avoid peak period pricing which exponentially increases electric costs due to widespread overuse of electricity. Because Michigan state parks see their highest visitation rates in the summer and warmer months, longer peak hours of sunlight will
align with the changes of demand for EV chargers. Considering peak charging periods and associated costs, solar charging most effectively reflects the popular hours of EV demand with hours of peak sunlight. Energy grids directly offset energy consumption with immediate renewable energy supply. Aside from covering the gap of electric supply, an added source of renewable energy creates an opportunity to cover the added electricity consumption of chargers. This financing consideration would sustainably consider the longevity of costs associated with charging electricity. Excess energy generated by a renewable source could be dedicated to other park uses, decreasing dependence on nonrenewable sources of energy altogether. Our team spoke with representatives from DTE who confirmed the potential interest in land leasing partnerships from an electric company’s perspective.82 Compensation including land square footage and energy supply and service can be exchanged mutually between parks and electric companies. Implementing energy microgrids in or near state parks provides clean sources of supplemental energy production available to be focused for EV charging infrastructure.
4.3 Land leasing for renewable energy sources
If electricity in state parks comes from fossil fuels, the transition to electric vehicles will only continue to advance carbon emissions. Of course, small-scale solar panels on building roofs or in parking lots may increase the portion of renewable energy sources in state parks. However, beyond that, other options to increase DNR’s revenue might include selling excess energy or leasing public lands to the private sector.
O’Shea Solar Park is a great example of creating partnerships between state parks and local electricity companies, making use of unused public lands and increasing revenue. Since many major companies
25 24
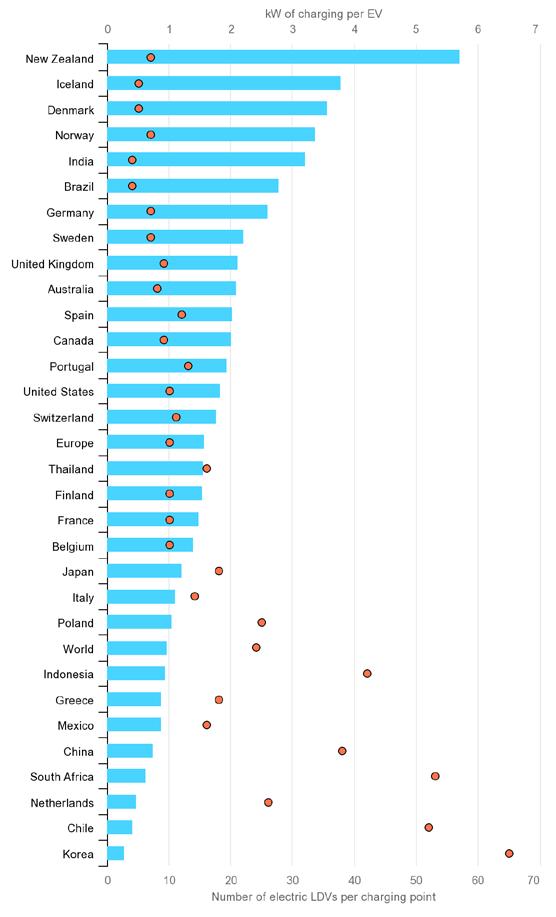
Figure 1.13: Charging points per EV and kW per electric LDV in selected countries, 202183
are willing to, or eager to, find appropriate land to develop renewable energy sources with ESG business trends and decarbonization commitments, there are likely to be many well-qualified partners in Michigan. As previously detailed, electric vehicle manufacturers, such as Rivian, Mercedes, and Tesla, started to develop by themselves and invest in renewable energy projects to meet their environmental and social commitments.84 85 86 Beyond this, utility companies are also trying to increase their renewable energy sources. Consumers Energy’s ambitious integrated resource plan (IRP) to retire coal-powered plants by 2025, 15 years faster than the original target, and to provide 63% of its electricity by clean energy sources by 2040 was already approved by the Michigan Public Service Commission (MPSC).87 88 DTE’s IRP to develop 6,500 MW of solar, 8,900 MW of wind, 1,810 MW of battery storage, and retire two coal-fired power plant units totaling 1,535 MW in 2028, was also approved by MPSC.89
Land leasing for utility-scale renewable energy projects can be a perfect option to meet the green targets of private companies and local and federal governments, as well as to increase DNR’s revenue. There is also political support from the Biden-Harris Administration and Congress to permit 25 gigawatts of renewable power on public lands not later than 2025.90
The Bureau of Land Management (BLM), managing 245 million acres of public lands with solar, wind, and geothermal potential, is leasing its land to the private sector to support the government’s target and increase its revenue. By 2022, the BLM had approved more than 120 renewable energy projects on public land with a combined generating capacity of over 12,000 megawatts. The Bureau of Ocean Energy Management (BOEM) is also leasing wind energy areas in various states, including New York, New Jersey, Massachusetts, Virginia,
4.4 EV Charger Hardware / Infrastructure Private Rebates
Currently, EV manufacturers are facilitating rebate programs for residential, commercial, and public initiatives to incentivize the growth of EV markets and infrastructure. In the United States, the number of EVs on roads grew faster than the number of public charging points, with about 18 EVs per charging point in 2021.95 The report continues to articulate that while EVs more than doubled in the US in 2021, the quantity of electric chargers more than tripled. The EV market’s success is dependent upon more frequently placed chargers, and the elimination of charge anxiety on behalf of EV consumers. This correlated market relationship incentivizes manufacturers to offer financial rebates and benefits to external institutions and public spaces for offering access points of EV charging.
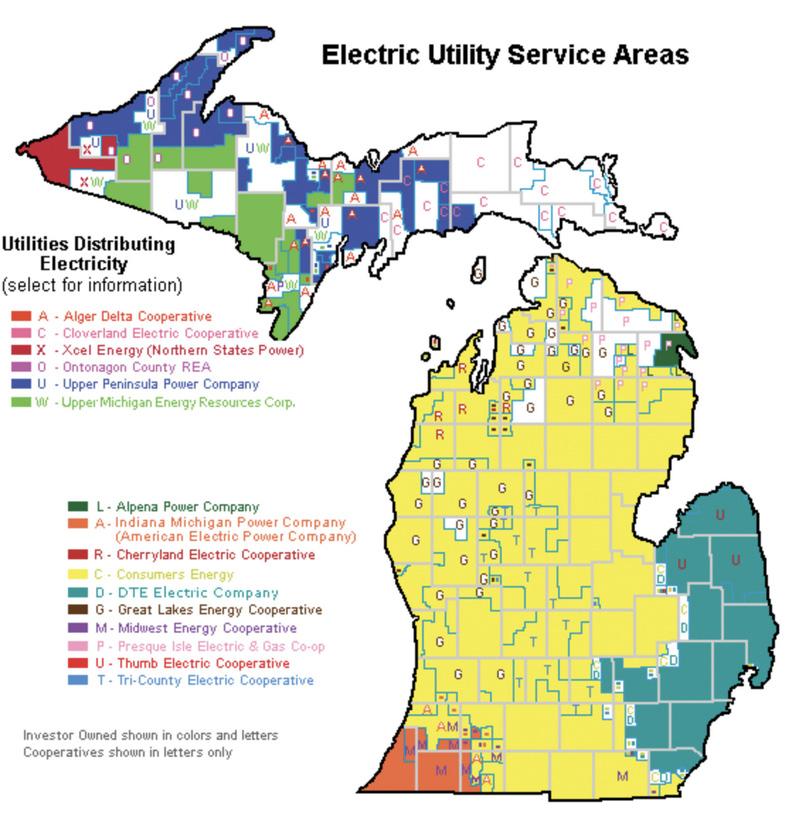
Unlike the recurring and long-term financial planning required to retrofit energy systems in the first section of financing, financing/ purchasing EV charging infrastructure is a one-time investment, with additional maintenance and upgrades only necessary later in the hardware’s lifecycle. The below table exhibits existing rebate programs administered through private electric companies and available to state parks. All of the listed rebate programs are financed through first-come-first-serve capital, and are only available until the funding runs out. While rebates and discounted financing plans for charging hardware are only intended to spark initial momentum in expanding statewide/national EV infrastructure, the state has an opportunity to leverage these foot-in-the-door needs of manufacturers and capitalize on costeffective plans for installing promotional chargers. Figure1.14 breaks down Michigan’s regions by electric service provider by region. A majority of the state’s electric production is
facilitated by companies which offer public or commercial rebate incentives. Table 1.3 shows examples of electric company rebate programs.
27 26 Maine, California, Oregon, North Carolina, South Carolina, and Texas.91 92 93 94
Figure 1.14. Electric Utility Service Area Map96
Electric Company Rebate Details
Cherryland Electric Cooperative97
Rebate Amount Level 2 EV Charger: $1,000 rebate. Rebate cap is $15,000.00 for large projects involving other energy efficiency measures that are being installed.
Eligibility / qualifications Qualifying chargers must be public facing and Energy Star rated Consumers Energy98
Rebate Amount Public Level 2 Charger: Can qualify for a rebate of up to $7,500 for the installation of a for a site location that will be accessible to residents of a Multi-Dwelling Unit
Public Level 2 Charger: Can qualify for up to $5,000 for accommodation/hospitality sites where overnight charging is likely to occur
Eligibility / qualifications Install at least one Public Level 2 Charging Station from PowerMiDrive’s approved list
DTE Energy99
Rebate Amount Level 2 Charger: Up to $2,000 per port
DC Fast Charger: Up to up to $55,000 per charger
Eligibility and Qualifying Criteria
• The DCFC location will be in a visible, safe, well-lit, and accessible location with a parking space for each charger port.
• The DCFC shall be in an area that has amenities to accommodate a minimum of a 30 minute charge time.
• The premises of the DCFC will provide clear signage to create visibility and guidance for effective DCFC utilization, available 24 hours per day seven days per week.
Lansing Board of Water and Light
Rebate Amount Level 2 Charger: $4,500 rebate, and up to three chargers per customer location (for a total of up to $13,500 rebate per account location)
Eligibility and Qualifying Criteria Submit this one page application form Contact EVProgram@lbwl.com for individualized project qualification confirmation. The program will go live end of April 2023.
Presque Isle Electric & Gas Co-Op102
Rebate Amount Level 2 Charging Station: Up to $600
Eligibility and Qualifying Criteria Custom incentives based on forecasted (kWh/yr) energy savings
Eligibility and Qualifying Criteria
Required:
• Well-lit area
• Publicly accessible 24/7
Preferred:
• No more than $100,000 required by DTE to fund system upgrades
• Proximate to highway access
Great Lakes Energy100
Rebate Amount Level 2 Smart Charger: Up to $800 per unit
Eligibility and Qualifying Criteria Level 2 charger must be permanently installed and have data capability.
Holland Board of Public Works101
Rebate Amount Level 2 charger: 50% of the cost of the charger up to $1,500.
DC fast charger (480v 150kW minimum): determined on a case-by-case basis with a maximum rebate of $35,000.
• $0.07 per annual kWh savings (projected) or 75% of the project cost, whichever is lower
While each region has access to the rebate programs administered by their local/ respective electric company, there is no mechanism for statewide application and retention method for public EV chargers. Because of the inherent fragmentation of electric services, each rebate comes with individualized eligibility and qualification requirements. Some companies have a list of pre-approved subcontractors that
applicants are urged to utilize to optimize the rebate application process. Partnerships between manufacturers and state parks can take place on varying scales depending on the extent of charging infrastructure desired by individual parks.
29 28
Table 1.3: Electric company rebate programs.
Electric recreational vehicles pose a series of challenges and opportunities for Michigan’s State Parks. Infrastructure improvement will be a necessary first step to accommodating the future of electric recreational vehicles in the park system, and as ERVs become increasingly common, the placement of charging stations will become a major factor in encouraging and facilitating ERV users. The environmental benefits of this shift, as facilitated by the Parks Department, are numerous and will protect the natural environment across Michigan if successfully implemented. ERVs will also open a number of fiscal opportunities, spurring economic development in areas near chargers and allowing parks to charge their users for the convenience of charging on the go.
We would like to suggest some recommendations for expanding EV infrastructure in state parks. The first one is to capitalize on numerous funding opportunities to build both the electric grid infrastructure and charging stations themselves. Michigan’s Department of Natural Resources is lucky
to be at the forefront of this movement as an early adopter. Besides, there are many programs that include subsidies, grants, and rebates available to expand EV infrastructure from governments and private companies.
The second recommendation is to establish new partnerships and improve existing partnerships with the private sector and non-profit organizations. Electric utilities – both cooperatives and companies like DTE and Consumers Energy – and electric vehicle companies are keen to establish partnerships with state and local government organizations. Some of the partnerships may provide offset installation costs or support land leasing in exchange for electric grid updates or charger installation.
With these and other opportunities to build out the charging capacity of the state’s parks at an offset cost, Michigan can build its capacity as a destination for ERV users across the region as a first adopter by harnessing the private market’s resources and enthusiasm for expansion.

30 5. CONCLUSION
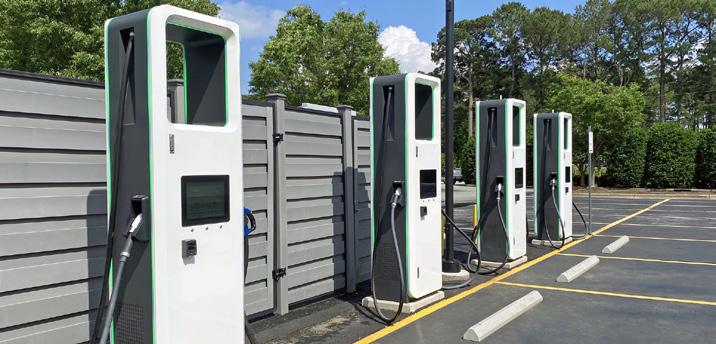
Figure 1.15: Increased Provision of EV Charging Stations Should be Prioritized
KEY RECOMMENDATIONS
PLANNING RECOMMENDATIONS FINANCING RECOMMENDATIONS
• Install chargers where people already want to recreate instead of creating new trails to cater exclusively to ERVs.
• Prioritize EV chargers where perceived demand is highest, based on visitation rates and the number of recreational vehicles currently in use.
• Create charging stations on routes like out-and-back trails where EV users can charge at multiple points and make better, more frequent use of charging stations.
• Work with local communities and businesses, especially those that rely on tourism, to establish locations where people can charge their ERV while enjoying local restaurants, coffee shops, and hotels.
• Invest in marketing and engagement to get EV chargers noticed online, such as on chargings apps and websites run by EV manufacturers and third parties. Include ERV-focused language and photographs in marketing materials.

• Look into public-private partnerships, including land leasing programs, that will benefit both parks and power companies. Reach out to electricity co-ops, as well as major companies, in order to provide EV charging opportunities across regions.
• Maintain existing partnerships and establish new partnerships with the private sector, including electric and utility companies, EV manufacturers, and non-profit organizations.

• Explore federal funding programs to fund grid resilience and efficiency, especially in areas in rural regions and areas along the coasts.
• Consider building solar microgrids to bridge the “electricity gap” in areas, especially where use depends largely on seasonal and meteorological factors. This will provide additional energy that is likely to coincide with peak periods (i.e. sunny days).
32 33
ENDNOTES
1.) “Charge Up Michigan: Electric Vehicle Charging Station Infrastructure Network Map.” n.d. Michigan Department of Environment, Great Lakes, and Energy ArcGIS Online. Accessed April 17, 2023. https://egle.maps.arcgis.com/apps/webappviewer/index. html?id=2c82b996255844b6967d3c46b072c0bd.
2.) “Quebec Company Unveils World's First Electric Snowmobile.” n.d. Mountain Culture Group. Accessed April 21, 2023. https://mountainculturegroup.com/montreal-company-unveils-worldsfirst-electric-snowmobile/.
3.) O'Hare, Ben. 2022. “2023 Taiga Motors Orca Electric Jet Ski First Ride: Zero Emissions Fun In The Sun.” InsideEVs. https://insideevs.com/reviews/599998/taiga-motors-orca-first-drive/.
4.) RV Industry Association Staff. 2021. “Shorter Trips, State Parks, And Outdoor Recreation Trending With New RV Buyers.” RVIA. https://www.rvia.org/news-insights/shorter-trips-state-parks-andoutdoor-recreation-trending-new-rv-buyers.
5.) Attwood, James. 2022. “Winnebago e-RV concept is a Ford Transit-based electric camper.” Move Electric. https://www.moveelectric.com/e-cars/winnebago-e-rv-concept-ford-transitbased-electric-camper.
6.) IEA. 2022. “Global energy-related CO2 emissions by sector – Charts – Data & Statistics.” IEA. https://www.iea.org/data-and-statistics/charts/global-energy-related-co2-emissions-bysector.
7.) IEA. 2022. “Transport.” IEA. https://www.iea.org/reports/transport.
8.) Irle, Roland. n.d. “Global EV Sales for 2022.” EV-Volumes. Accessed April 17, 2023. https://www. ev-volumes.com/.
9.) Goldman Sachs. 2023. “Electric Vehicles are Forecast to Be Half of Global Car Sales by 2035.” Goldman Sachs. https://www.goldmansachs.com/insights/pages/electric-vehicles-are-forecastto-be-half-of-global-car-sales-by-2035.html.
10.) Boudway, Ira. 2022. “More Than Half of US Car Sales Will Be Electric by 2030.” Bloomberg.com. https://www.bloomberg.com/news/articles/2022-09-20/more-than-half-of-us-car-sales-willbe-electric-by-2030?leadSource=uverify%20wall#xj4y7vzkg.
11.) IEA. 2022. “Electric Vehicles.” IEA. https://www.iea.org/reports/electric-vehicles.
12.) Gersdorf, Thomas, Russell Hensley, Patrick Hertzke, Patrick Schaufuss, and Andreas Tschiesner. 2020. “The Road Ahead for E-mobility.” McKinsey. https://www.mckinsey.com/industries/ automotive-and-assembly/our-insights/the-road-ahead-for-e-mobility.
13.) Brinley, Stephanie. 2023. “EV Chargers: How many do we need?” S&P Global. https://www. spglobal.com/mobility/en/research-analysis/ev-chargers-how-many-do-we-need.html.
14.) The White House. 2022. “BY THE NUMBERS: The Inflation Reduction Act.” The White House. https:// www.whitehouse.gov/briefing-room/statements-releases/2022/08/15/by-the-numbers-theinflation-reduction-act/.
15.) Kampshoff, Philipp, Adi Kumar, Shannon Peloquin, and Shivika Sahdev. 2022. “America’s electric-vehicle charging infrastructure.” McKinsey. https://www.mckinsey.com/industries/publicand-social-sector/our-insights/building-the-electric-vehicle-charging-infrastructure-americaneeds.
16.) Federal Highway Administration. 2022. “Biden-Harris Administration Announces Approval of First 35 State Plans to Build Out EV Charging Infrastructure Across 53,000 Miles of Highways | FHWA.” Federal Highway Administration. https://highways.dot.gov/ newsroom/biden-harris-administrationannounces-approval-first-35-state-plansbuild-out-ev-charging.
17.) Department of Natural Resources. n.d. “Waterways facilities.” Department of Natural Resources. Accessed April 17, 2023. https://www.michigan.gov/dnr/managingresources/prd/waterways
18.) Department of Energy. n.d. “Alternative Fuels Data Center: Electric Vehicle (EV) Definition.” Alternative Fuels Data Center. Accessed April 3, 2023. https://afdc.energy. gov/laws/12660.
19.) IEA. 2023. “As their sales continue to rise, SUVs’ global CO2 emissions are nearing 1 billion tonnes.” IEA. https://www.iea.org/ commentaries/as-their-sales-continueto-rise-suvs-global-co2-emissions-arenearing-1-billion-tonnes.
20.) Tecchi, Joey. n.d. “Americans Spent Over $2.2 Billion On Electric Pickup Trucks In 2022.” Tailored Trucks. Accessed April 10, 2023. https://tailoredtrucks.com/blog/electrictruck-pickup-sales-2022/.
21.) Johnson, Peter, Michelle Lewis, Fred Lambert, and Jameson Dow. 2022. “Unleash your wanderlust with Mercedes Benz's new electric mini camper.” Electrek. https:// electrek.co/2022/11/04/wanderlust-withmercedes-benzs-new-electric-eqt-minicamper/.
22.) Weiss, Chris. 2023. “All-electric Toyota camper van converts from MPV to mini RV.” New Atlas. https://newatlas.com/automotive/ campervan-electric-toyota-revolutioncamper/.
23.) Potter, Everett. 2022. “Bowlus Unveils The First All-Electric RV.” Forbes. https://www. forbes.com/sites/everettpotter/2022/08/25/ bowlus-unveils-the-first-all-electric-
rv/?sh=36cb1a844132.
24.) Sauer, Megan. 2022. “Winnebago is making a fully electric RV — here's what it'll look like.” CNBC. https://www.cnbc. com/2022/01/21/winnebago-is-making-afully-electric-rv-heres-what-itll-look-like. html.
25.) Clemishaw, Jeff. 2022. “RV giant Thor Industries partners with electric vehicle company.” RV Travel. https://www.rvtravel. com/rv-giant-thor-industries-partnerselectric-vehicle-company-1079b/.
26.) “Global Personal Watercraft Market 2023-2030 | April 2023 Updated.” n.d. Mobility Foresights. Accessed April 17, 2023. https:// mobilityforesights.com/product/personalwatercraft-market/.
27.) “Personal Watercraft Market Size, Industry Share | Forecast, 2030.” n.d. Fortune Business Insights. Accessed April 17, 2023. https:// www.fortunebusinessinsights.com/personalwatercraft-market-105942.
28.) Lambert, Fred, Jameson Dow, Seth Weintraub, and Peter Johnson. 2022. “Taiga Orca electric jet ski is here, and it's pure unadulterated fun.” Electrek. https://electrek. co/2022/07/11/taiga-orca-electric-jetskipure-unadulterated-fun/.
29.) TAIGA. n.d. “Electric-powered personal watercraft.” Taiga Motors. Accessed April 17, 2023. https://www.taigamotors.com/ products/orca.
30.) BRP Inc. 2021. “BRP to Introduce Electric Models for Each of its Product Lines by the End of 2026.” PR Newswire. https:// www.prnewswire.com/news-releases/ brp-to-introduce-electric-models-foreach-of-its-product-lines-by-the-endof-2026-301255551.html?itid=lk_inline_ enhanced-template.
31.) Root, Tik. 2022. “From snowmobiles to watercraft, power sports equipment is going electric.” The Washington Post. https://www. washingtonpost.com/climate-solutions/ interactive/2022/electric-snowmobile-
climate-change-pollution/.
32.) https://snowmobilehow.com/electricsnowmobile/
33.) Orion Market Reports. 2023. “Electric ATV and UTV Market Opportunities and Forecast 2022-2028.” Orion Market Reports. https:// orionmarketreports.com/electric-atv-andutv/129066/.
34.) Hawkins, Andrew J. 2021. “Polaris' new Ranger XP Kinetic is an all-electric side-by-side with a lot of horsepower.” The Verge. https://www.theverge. com/2021/12/1/22809628/polaris-ranger-xpkinetic-electric-utv-price-specs-zero.
35.) Motavalli, Jim. 2022. “Exploring the Great Outdoors With Electric Snowmobiles and ATVs.” Barron's. https://www.barrons. com/articles/exploring-the-greatoutdoors-with-electric-snowmobiles-andatvs-01670864837.
36.) Lambert, Fred, and Peter Johnson. 2022. “Theron Reever: Electric ATV that will make you stop waiting for the Tesla Cyberquad.” Electrek. https://electrek.co/2022/11/08/ theron-reever-electric-atv/.
37.) Jacobs, Caleb. 2022. “Electric ATVs and UTVs Could Get $2,500 Discount If New Tax Credit Passes.” The Drive. https://www. thedrive.com/news/electric-atvs-and-utvscould-get-2500-discount-if-new-tax-creditis-passed.
38.) Shepherd, Don. 2001. “Estimating and Reducing Emissions from Within National Parks.” EPA. https://gaftp.epa.gov/air/nei/ei_ conference/EI10/intemissions/shepherd.pdf.
39.) Millner, Jen. n.d. “Snowmobiles in Yellowstone National Park: An American right, or wrong?” SERC. Accessed March 26, 2023. https://serc.carleton.edu/research_ education/yellowstone/snowmobiles.html.
40.) National Park Service. 2015. “Two-Stroke PWC Engine Regulations.” National Park Service. https://www.nps.gov/lake/learn/ management/twostroke.htm.
41.) Brown, Matthew. 2007. “Yellowstone
poised to allow 540 snowmobiles a day.” The Seattle Times. https://www.seattletimes.com/ life/outdoors/yellowstone-poised-to-allow540-snowmobiles-a-day/.
42.) Parsons, David. 2021. “NREL Work Helps Visitors to National Parks Get Home Again.” NREL. https://www.nrel.gov/news/ program/2021/nrel-work-helps-visitors-tonational-parks-get-home-again.html.
43.) National Park Service. 2021. “Partnerships Result In Up To 100 Electric Vehicle Charging Stations Across Parks (U.S.” National Park Service. https://www.nps.gov/articles/ evstations.htm.
44.) Jeltema, Ryan. 2022. “Rivian installing electric vehicle chargers at Michigan state parks.” ABC12. https://www.abc12.com/ news/state/rivian-installing-electricvehicle-chargers-at-michigan-stateparks/article_71c9fc7a-ddb3-11ec-a493df3cd13b63ec.html.
45.) Schofinski, Kim. 2021. “State Parks, Rivian Partner on Electric Vehicle Charging Stations.” Tennessee State Parks. https://tnstateparks. com/blog/state-parks-rivian-partner-onelectric-vehicle-charging-stations.
46.) Anderson, Sam. 2022. “Colorado, Rivian Announce Ambitious State Park EV Charging Plan.” GearJunkie. https://gearjunkie.com/ news/rivian-ev-charging-stations-coloradostate-parks.
47.) Green, Mary. 2022. “Electric vehicle chargers coming to most SC state parks.” Live 5 News. https://www.live5news. com/2022/12/14/electric-vehicle-chargerscoming-most-sc-state-parks/.
48.) Asplund, Timothy R. 2000. “Information sent out in February:.” Wisconsin DNR. https:// dnr.wi.gov/lakes/publications/documents/ lakes.pdf.
49.) Department of Natural Resources. 2022. “Whitmer celebrates partnership to install electric vehicle chargers in state parks.” State of Michigan. https://www.michigan.gov/dnr/ about/newsroom/releases/2022/05/26/
whitmer-celebrates-partnership-to-installelectric-vehicle-chargers-in-state-parks.
50.) Tourisme Lanaudière. n.d. “Snowmobile : over 4,800 km of trails | Lanaudière, Mauricie.” Tourisme Lanaudière. Accessed April 17, 2023. https://lanaudiere.ca/en/must-seeactivities/snowmobile/.
51.) TAIGA Team. 2022. “Electrifying Snowmobile Trails of Quebec EN.” Taiga Motors. https://www.taigamotors.com/blog/ electrifying-snowmobile-trails-of-quebec.
52.) Pevec, Dario, Jurica Babic, Arthur Carvalho, Yashar Ghiassi-Farrokhfal, Wolfgang Ketter, and Vedran Podobnik. 2019. “Electric Vehicle Range Anxiety: An Obstacle for the Personal Transportation (R)evolution?”
2019 4th International Conference on Smart and Sustainable Technologies (SpliTech), (June), 1-8. 10.23919/SpliTech.2019.8783178.
53.) BP. 2023. “BP Statistical Review of World Energy 2022 (71st edition).” BP. https://www. bp.com/content/dam/bp/business-sites/en/ global/corporate/pdfs/energy-economics/ statistical-review/bp-stats-review-2022-fullreport.pdf.
54.) Heineke, Florian, Nadine Janecke, Holger Klärner, Florian Kühn, Humayun Tai, and Raffael Winter. 2022. “An era of renewable energy growth and development.” McKinsey, October 28, 2022. https://www.mckinsey. com/industries/electric-power-and-naturalgas/our-insights/renewable-energydevelopment-in-a-net-zero-world.
55.) Rapier, Robert. 2022. “Renewable Energy Grew At A Blistering Pace In 2021.” Forbes, August 23, 2022. https://www.forbes.com/ sites/rrapier/2022/08/23/renewableenergy-grew-at-a-blistering-pace-in2021/?sh=4a9649272025.
56.) U. S. Energy Information Administration. 2023. “Monthly Energy Review (February 2023).” U. S. Energy Information Administration. https://www.eia.gov/ totalenergy/data/monthly/pdf/mer.pdf.
57.) New York State. 2022. “Governor Hochul
Announces New Framework to Achieve Nation-Leading Six Gigawatts of Energy Storage by 2030.” The Official Website of New York State. https://www.governor.ny.gov/ news/governor-hochul-announces-newframework-achieve-nation-leading-sixgigawatts-energy-storage.
58.) Keefe, Dan, and Brian Nearing. 2020. “Major Solar Power Projects Launched at Four State Parks on Long Island and in the Hudson Valley.” The Official Website of New York State. https://parks.ny.gov/newsroom/pressreleases/release.aspx?r=1575.
59.) Keefe, Dan, and Brian Nearing. 2021. “Press Release - NYS Parks, Recreation & Historic Preservation.” Press Release - NYS Parks, Recreation & Historic Preservation. https://parks.ny.gov/newsroom/pressreleases/release.aspx?r=1699.
60.) Keefe, Dan, and Brian Nearing. 2021. “Press Release - NYS Parks, Recreation & Historic Preservation.” The Official Website of New York State. https://parks.ny.gov/ newsroom/press-releases/release. aspx?r=1650.
61.) Liberatore, Wendy. 2021. “Grant Cottage first N.Y. historic site fueled by solar.” Times Union. https://www.timesunion.com/ news/article/Grant-Cottage-fueled-bysolar-16112596.php#photo-20887505.
62.) Deedy, Donna. 2019. “Community celebrates new solar farm in Kings Park.” TBR News Media. https://tbrnewsmedia.com/ community-celebrates-new-solar-farm-inkings-park/.
63.) Winzelberg, David. 2020. “Sunken Meadow State Park to get solar installations.” Long Island Business News. https://libn. com/2020/03/25/sunken-meadow-statepark-to-get-solar-installations/.
64.) Rivian. n.d. “Charging.” Rivian. Accessed March 27, 2023. https://rivian.com/ experience/charging.
65.) States of Illinois, Indiana, Michigan, and Wisconsin. 2022. “Lake Michigan Electric
36
Vehicle Circuit Tour Memorandum of Understanding Between Illinois, Indiana, Michigan, and Wisconsin.” State of Michigan. https://www.michigan.gov/leo/-/media/ Project/Websites/leo/Lake_MI_Circuit_ MOUdocx1.pdf.
66.) Mulka, Angela. 2022. “Rivian installing electric vehicle chargers at 15 Michigan state parks.” Midland Daily News. https:// www.ourmidland.com/news/article/ DNR-Michigan-and-Rivian-ev-chargerpartnership-17195617.php.
67.) Walz, Eric. 2022. “Rivian to Install Electric Vehicle Chargers in Michigan State Parks as Part of a New Partnership.” FutureCar. https:// www.futurecar.com/5428/Rivian-to-InstallElectric-Vehicle-Chargers-in-MichiganState-Parks-as-Part-of-a-New-Partnership.
68.) Rivian. n.d. “How does Rivian power its charging networks with 100% renewable energy? - Support Center.” Rivian. Accessed March 27, 2023. https://rivian.com/support/ article/how-does-rivian-power-itscharging-networks-with-100-renewableenergy.
69.) Rivian. 2022. “Rivian and Clearloop Partner on Solar Project - Newsroom.” Rivian. https://rivian.com/newsroom/article/rivianand-clearloop-partner-on-solar-project.
70.) Business Wire. 2023. “Rivian and Clearloop Host “First Charge” Event to Celebrate New EV Charging Site Powered by 100 Percent Carbon-Free Renewable Energy in Tennessee.” Business Wire. https://www.businesswire.com/news/ home/20230120005390/en/Rivianand-Clearloop-Host-%E2%80%9CFirstCharge%E2%80%9D-Event-to-CelebrateNew-EV-Charging-Site-Powered-by-100Percent-Carbon-Free-Renewable-Energy-inTennessee.
71.) Oake, Holly. 2017. “Motown goes solar: O'Shea solar project to transform abandoned urban park.” Inovateus Solar. https:// inovateus.com/motown-goes-solar-osheasolar-project-to-transform-abandoned-
urban-park/.
72.) Miller, Kylee. 2022. “Science of Weather: O'Shea Solar Park.” CBS News. https://www. cbsnews.com/detroit/news/science-ofweather-oshea-solar-park/.
73.) Balaskovitz, Andy. 2019. “As Detroit studies solar potential, residents focus on community benefits.” Energy News Network. https:// energynews.us/2019/03/05/as-detroitstudies-solar-potential-residents-focus-oncommunity-benefits/.
74.) “The Grid - Beginner's Guide To The Electric Grid” 2023 https://palmetto.com/ learning-center/blog/the-grid-beginnersguide-to-the-electric-grid
75.) Kurczewski, Nick. n.d. “How Much Does It Cost To Charge an Electric Car?” Kelley Blue Book. Accessed March 17, 2023. https://www. kbb.com/car-advice/how-much-does-itcost-to-charge-an-ev/#math.
76.) Woodall, Laurie A. 2012. “Transmission Basics: Facilities, Interconnection and Permitting.” Transmission Basics. https:// www.energy.gov/sites/prod/files/2013/07/f2/ Transmission_Woodall_0.pdf.
77.) “Biden-Harris Administration Announces $13 Billion To Modernize And Expand America's Power Grid.” 2022. Department of Energy. https://www.energy.gov/articles/bidenharris-administration-announces-13-billionmodernize-and-expand-americas-powergrid.
78.) “Smart Grid Grants.” 2022. Department of Energy. https://www.energy.gov/gdo/smartgrid-grants.
79.) “Grid Innovation Program.” 2022. Department of Energy. https://www.energy. gov/gdo/grid-innovation-program.
80.) “Transmission Siting and Economic Development Grants Program.” 2023. Department of Energy. https://www. energy.gov/gdo/transmission-siting-andeconomic-development-grants-program.
81.) “What Is A Peak Sun Hour? Calculate Your Peak Sun Hours.” 2023. Palmetto Solar. https://
palmetto.com/learning-center/blog/whatare-peak-sun-hours.
82.) The DTE point of contact is Milena Marku, Customer Marketing Manager; Electric Vehicle Strategy and Programs O: 313.235.7116 | M: 313.316.3232 | milena.marku@dteenergy. com
83.) “Charging points per EV and kW per electric LDV in selected countries, 2021 –Charts – Data & Statistics.” 2022. IEA. https:// www.iea.org/data-and-statistics/charts/ charging-points-per-ev-and-kw-perelectric-ldv-in-selected-countries-2021.
84.) Johnson, William. 2022. “Rivian makes huge investment into renewables to power operations.” Teslarati. https://www.teslarati. com/rivian-investment-renewables-poweroperations/.
85.) Johnson, William. 2022. “Mercedes invests in renewable energy projects in Germany.” Teslarati. https://www.teslarati.com/ mercedes-benz-daimler-renewable-energyinvestment/.
86.) EnergyTech. 2022. “EV maker Rivian chooses Wind PPA to offset Energy consumption at Illinois Manufacturing.” EnergyTech. https://www.energytech.com/ renewables/article/21255968/ev-makerrivian-chooses-wind-ppa-to-offset-energyconsumption-at-illinois-manufacturing.
87.) Consumers Energy. 2021. “2021 Clean Energy Plan.” Consumers Energy. https:// www.consumersenergy.com/-/media/CE/ Documents/company/IRP-2021.ashx.
88.) Michigan Public Service Commission. 2022. “MPSC approves Consumers Energy integrated resource plan settlement agreement, takes additional steps to boost electric capacity.” State of Michigan. https:// www.michigan.gov/mpsc/commission/ news-releases/2022/06/23/mpsc-approvesconsumers-irp_takes-steps-improvecapacity.
89.) Howland, Ethan. 2022. “DTE Electric proposes $9B spend on 5.4 GW renewables,
760 MW storage, coal-to-gas power plant switch.” Utility Dive. https://www.utilitydive. com/news/dte-energy-resource-plan-irpsolar-coal-michigan-psc/635781/.
90.) U.S. Department of the Interior. 2022. “Interior Department Outlines Roadmap for Continued Renewable Energy Progress on Public Lands.” U.S. Department of the Interior. https://www.doi.gov/pressreleases/interiordepartment-outlines-roadmap-continuedrenewable-energy-progress-public-lands.
91.) Allen, Liz, and Amy Danise. 2022. “Let The Bidding Begin: 43 Companies to Compete For Five California Offshore Wind Leases.” Forbes. https://www.forbes.com/sites/ allenelizabeth/2022/12/05/let-the-biddingbegin-43-companies-to-compete-for-fivecalifornia-offshore-wind-leases/.
92.) Department of the Interior. 2022. “BidenHarris Administration Announces Winners of Carolina Long Bay Offshore Wind Energy Auction.” Official DOI Website. https:// www.doi.gov/pressreleases/biden-harrisadministration-announces-winnerscarolina-long-bay-offshore-wind-energy.
93.) Department of the Interior. 2022. “BidenHarris Administration Continues Offshore Wind Momentum, Announces Next Steps for Gulf of Maine.” Official DOI Website. https://doi.gov/pressreleases/biden-harrisadministration-continues-offshore-windmomentum-announces-next-steps-gulf.
94.) Buljan, Adrijana. 2022. “US Announces Record-Breaking Offshore Wind Lease Sale.” Offshore Wind. https://www.offshorewind. biz/2022/01/12/us-announces-recordbreaking-offshore-wind-lease-sale/.
95.) “Trends in charging infrastructure –Global EV Outlook 2022 – Analysis.” 2022. IEA. https://www.iea.org/reports/globalev-outlook-2022/trends-in-charginginfrastructure.
96.) “Electric Utility Service Area Map.” n.d. State of Michigan. Accessed April 21, 2023. https://www.michigan.gov/mpsc/consumer/ electricity/electric-utility-service-area-map.
97.) “Home.” 2023. YouTube. https:// cherrylandeleccoop.formstack.com/forms/ commercial_rebates_2023
98.) “Public Charger Rebates.” 2023. Consumers Energy. https://www. consumersenergy.com/residential/ programs-and-services/electric-vehicles/ level-2-charging-station-rebates.
99.) “Business EV Charger Rebate.” 2023. DTE Energy. https://www.dteenergy.com/us/ en/business/service-request/pev/pev-bizcharge-frwd.html.
100.) “Energy Wise.” 2023. Great Lakes Energy. https://www.gtlakes.com/energy-wise/.
101.) “Charge Up Holland.” 2023. Holland Board of Public Works. https://hollandbpw.com/en/ charge-up-holland.
102.) Clark, Casey. 2023. “Energy Optimization & Rebates - Presque Isle Electric & Gas Co-Op.” PIE&G. https://pieg.com/energyoptimization-rebates/.
103.) JetDrift. 2022. “2023 Jet Ski Price List: How Much Is a Jet Ski? [Chart].” JetDrift. https:// www.jetdrift.com/how-much-is-a-jet-skiprices/.
104.) Lambert, Fred, Michelle Lewis, and Jameson Dow. 2020. “Taiga unveils cheaper versions of its electric watercraft.” Electrek. https://electrek.co/2020/07/15/taiga-orcacheaper-electric-watercraft/.

105.) MotorBiscuit. 2022. “How Much Does a Snowmobile Cost?” MotorBiscuit. https:// www.motorbiscuit.com/how-much-does-asnowmobile-cost/.
106.) Coulton, Marisa. 2022. “Taiga Motors, which aims to be the Tesla of powersports, starts delivery of its Nomad snowmobiles.” Financial Post. https://financialpost.com/ commodities/energy/electric-vehicles/ taiga-motors-which-aims-to-be-thetesla-of-powersports-starts-delivery-of-itsnomad-snowmobiles.
107.) Motorcycle Zombies. n.d. “How Much are ATVs? (Average Cost for New & Used Quads & UTVs) - MotorcycleZombies.com.” Motorcycle
Projects & Repair Guides. Accessed April 12, 2023. https://www.motorcyclezombies.com/ atv-utv/atv-cost/.
108.) Quick, Amanda, and Tolu Akinshete. 2022. “Best Electric ATVs in 2022.” webBikeWorld. https://www.webbikeworld. com/best-electric-atvs/.
109.) “Smart Grid Grants.” 2022. Department of Energy. https://www.energy.gov/gdo/smartgrid-grants.
110.) “Grid Innovation Program.” 2022. Department of Energy. https://www.energy. gov/gdo/grid-innovation-program.
111.) “Transmission Siting and Economic Development Grants Program.” 2023. Department of Energy. https://www. energy.gov/gdo/transmission-siting-andeconomic-development-grants-program.
112.) “Home.” 2023. YouTube. https:// cherrylandeleccoop.formstack.com/forms/ commercial_rebates_2023
113.) “Public Charger Rebates.” 2023. Consumers Energy. https://www. consumersenergy.com/residential/ programs-and-services/electric-vehicles/ level-2-charging-station-rebates.
114.) “Business EV Charger Rebate.” 2023. DTE Energy. https://www.dteenergy.com/us/ en/business/service-request/pev/pev-bizcharge-frwd.html.
115.) “Energy Wise.” 2023. Great Lakes Energy. https://www.gtlakes.com/energy-wise/.
116.) “Charge Up Holland.” 2023. Holland Board of Public Works. https://hollandbpw.com/en/ charge-up-holland.
117.) Clark, Casey. 2023. “Energy Optimization & Rebates - Presque Isle Electric & Gas Co-Op.” PIE&G. https://pieg.com/energyoptimization-rebates/.
2 CLIMATE ADAPTATION
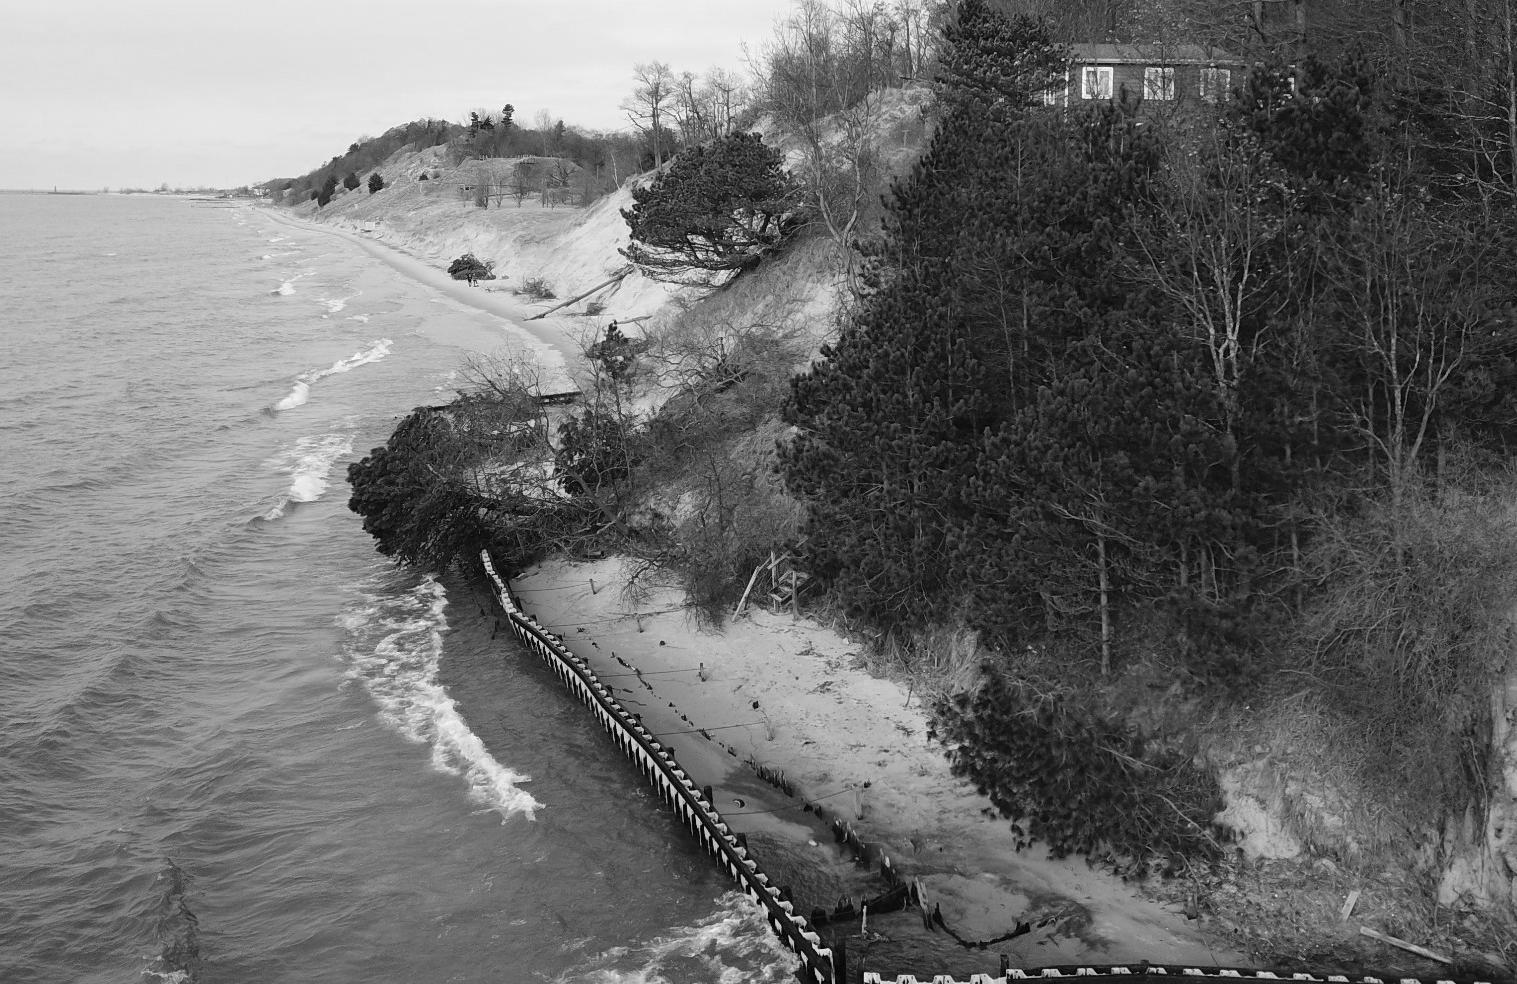
PROBLEM STATEMENT
Though the Midwest is not expected to experience the same devastating weather events as Western, Southern, and coastal US communities, Michigan is not immune to the impacts of climate change.1,2 Michigan is already experiencing significant changes in the natural environment – such rising temperatures, increased precipitation patterns, and greater frequency and intensity of extreme weather events such as storms and flooding.3 4 These changes have significant impacts on ecosystems, infrastructure, and visitors of Michigan state parks.
State parks conserve and protect Michigan’s priceless natural resources, which provide environmental services such as carbon sequestration, water purification, cultural significance, and human wellbeing. Green spaces and healthy ecosystems are considered to be some of the most effective ways for cities to adapt to extreme heat, precipitation, and other weather events in towns and cities. However, in order for these natural resources to stay healthy, resilient, and accessible to their users, the parks themselves require additional adaptation measures. In addition to increased climate
risks, the visitation and use of state parks is expected to increase as warmer seasons become extended. Additionally, Michigan and the Great Lakes Region is commonly regarded as a potential haven for climate refugees which will likely further increase the visitation and reliance on state parks.5
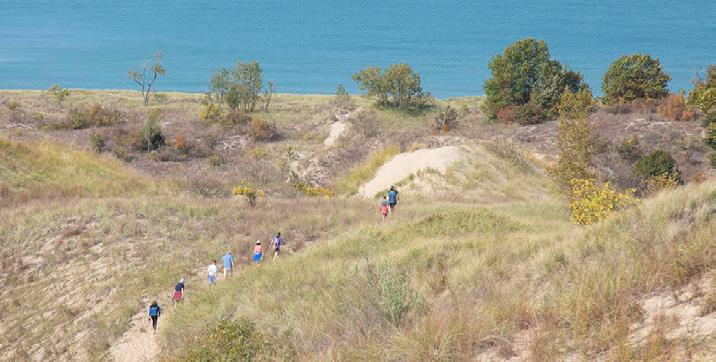
The Michigan Department of Natural Resources (DNR) has the challenge of managing a broad range of natural features and diverse ecosystems within over 100 state parks. These parks and diverse environments will be impacted by compounding effects of climate change (i.e. warming winters leads to warming lake temperatures and changes in precipitation patterns).6 The changes we examined fall into four key climate hazard categories: extreme heat and warming, increased storm events, shoreline erosion, and lake level variation. From these climate risks we identified vulnerable infrastructure that includes: trails, buildings, roads/parking, electric systems, stormwater systems, cultural resources, park use. This report provides a list of specific, tangible actions the Department of Natural Resources may employ to proactively create a system of resilient infrastructure that will counter the rising climate challenges.7
1. INTRODUCTION
As the stress of climate change impacts environmental systems, people, and infrastructure, the Department of Natural Resources Parks and Recreation Division will be faced with the decision to adapt. This section of this document will provide recommendations for adaptation strategies to key climate-related hazards and threats to park infrastructure and operations.
Climate adaptation is often described as “managing the unavoidable,” as compared to mitigation, which is described as “avoiding the unmanageable.” In other words, climate adaptation is an approach to climate change where adaptors work to coexist with climate change’s effects. This is in contrast to mitigation, which is an effort to lessen the effects of climate change before they begin. While both adaptation and mitigation are necessary for climate resilience, this section will be detailing adaptation measures exclusively. This will be done in four phases. This section further explains adaptation measures that can be taken proactively by the Department of Natural Resources
to respond to the imminent threat of climate change. It is not intended to serve as a disaster-response plan or any other retroactive or responsive plan.
First, this section will outline the research methodology of our team. Next will be a description of vulnerabilities of the state park system. After that, this section will describe hazards faced by state parks in Michigan. This will be accomplished through four key lenses: heat-related hazards, storm-related hazards, shoreline erosion, and lake level variation-related hazards. Each of these three focus areas will include vulnerabilities, recommended adaptations, general management plan implementations, and asset management considerations.
Climate adaptation is a vital component of climate resilience. While the hazards faced by the Michigan state parks are broad and intertwined, there are concrete steps that can be taken to protect the assets and infrastructure of the parks.8
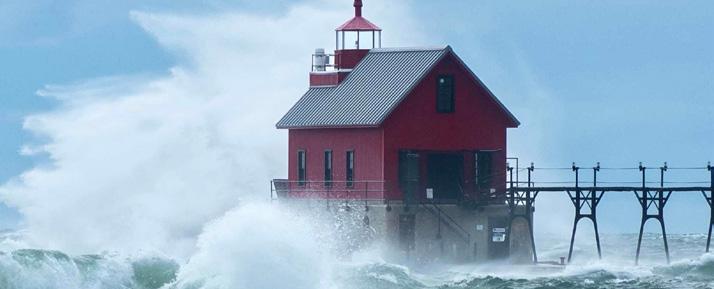
44 45
Figure 2.1 South Haven, MI Large Waves, High Winds, and Beach Erosion
Figure 2.2 Warren Dunes State Park
In our report, we have used a variety of methods to gain a deeper understanding of the natural hazards climate change brings to state parks and their respective adaptation strategies. We have used a variety of information sources to see how these risks might affect the parks and the ecosystems around them.
The impacts of climate change are dependent on hyperlocal information such as the natural features, elevation grades, soil types, and forest density to name a few. The immensely diverse terrain and environments throughout a single state park can vary, and is particularly varied throughout the state of Michigan.
In order to identify the unique challenges of each region of Michigan, we examined nine state parks in the South Lower Peninsula, North Lower Peninsula, and Upper Peninsula. We conducted informational interviews with the park managers and used the park websites and news articles to collect information about the climate impacts, infrastructure, natural resources, and visitor activities within the nine state parks.
Our adaptation strategy recommendations come from a variety of sources including
peer-reviewed articles, case studies, literature, and discussions with experts in the field.
By bringing together a wide range of sources and viewpoints, we provide a complete picture of the asset and infrastructural vulnerabilities in Michigan state parks and provide practical and effective solutions to protect them in the long run.9
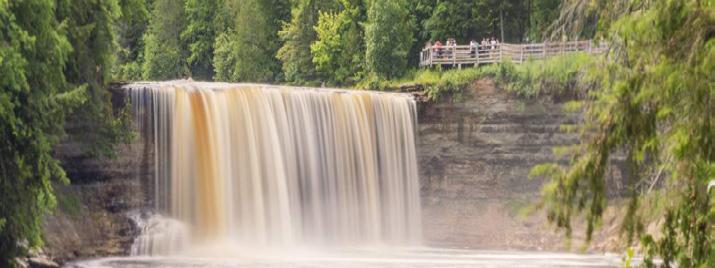
2. CLIMATE HAZARDS
We used the Fourth National Climate Assessment, a mandated analysis of climate change in the US, to outline the specific impacts of climate change on the Midwest. We describe the climate change effects as “hazards” because they will create natural shocks and stressors to the environment, infrastructure, and people. We grouped the Midwestern climate impacts into four key climate hazard categories: heat and warming, increased storm events, shoreline erosion, and lake level variation. These natural hazards will alter the ecosystems, infrastructure, and use of Michigan state parks.
We focused our adaptation research on the infrastructure, cultural resources, and visitors of the parks who will be exposed to these climate hazards including: trails, buildings,
harbors and boats, roads and parking lots, electric utilities, storm water systems, cultural resources, and park visitor use. The following section outlines the climate hazards and their impacts in Michigan state parks.
2.1 Extreme Heat and Warming
While there is an abundance of threats facing Michigan’s state parks from increased temperatures, there are also a number of adaptations that can be implemented to respond to these potentially devastating effects of climate change. The risk of wildfire will be elevated in wooded areas such as state parks, and structures will need to be re-evaluated for risk. Roads and parking lots will possibly be compromised; vulnerable to buckling and cracks. Power outages from severe storm events are likely, which could compound the risk of fire by leaving emergency fire suppression unavailable. The effects of overall increased temperatures in Michigan are going to be significant to the state parks system.
2.2 Increased Storm Events
Michigan is expected to be significantly impacted by precipitation patterns, with changes in frequency and intensity. Michigan is predicted to experience more snowmelt, higher rates of precipitation, and increased frequency of extreme storms. Though the impacts will vary by region, the general emerging patterns appear to be warmer, wetter, and wilder weather events.
As a result of warming temperatures and changes to precipitation, the duration of natural snow cover has decreased and is projected to continue to decrease in the 21st century.10 Winter precipitation is expected to increase in the Northern part of the United States and will likely come in the form of rain which increases snow melt.11
century, which will include more frequent and intense storms in addition to late growing season droughts.12 This will mean that there will likely be both wet weather events and longer periods of drought. Heavy rainfall events are likely to increase in frequency due to the warming climate. This also increases the risk of flash flooding events. Additionally, the warming climate, atmospheric instability, and extreme storm events can increase the probability of tornadoes and strong winds in Michigan.13
2.3 Shoreline
Michigan state parks are facing climate hazards in the form of shoreline erosion. Shoreline erosion along the Great Lakes poses a threat to both park infrastructure and natural habitats.14 As extreme weather events become more frequent due to climate change, powerful storm surges and high winds contribute to the erosion of beaches, dunes, and bluffs.
A recent study using LiDAR-equipped unmanned aerial vehicles (UAV) documented substantial shoreline recession at two Lake Michigan beaches between 2013 and 2019, with nearly 35 meters of shoreline lost and 70 cubic meters of material per meter submerged or eroded.15 This erosion process compromises the stability of park structures, trails, and recreational areas, while also disrupting the delicate balance of shoreline ecosystems.16 As a result, park visitors may find limited access to certain areas and altered landscapes, affecting their overall experience.
2.4 Lake Level Variation
Overall, the Midwest is expected to have slightly more precipitation over the next
In addition to shoreline erosion, Michigan state parks face challenges associated with fluctuating lake levels and flooding.17 Rising lake levels can inundate low-lying areas, leading to damage to park facilities, submerged trails, and limiting recreational activities. On the other hand, unusually low
46 47
1.1 Methods
Figure 2.3 Tahquamenon Falls State Park
Erosion
lake levels may expose lake beds, impacting boating and fishing opportunities for park visitors.18
Climate change is a driving factor behind these lake level fluctuations, with consequences for commercial and recreational boating, coastal planning, and management. Additionally, variations in lake water levels can trigger changes in lakeedge wetland types and areas, influenced by hydrogeomorphological predictors such as water level, hydroperiod, and elevation.19
3. ADAPTATION STRATEGIES
Our team focused adaptation recommendations around the infrastructure, cultural resources, and park users that/ who will be exposed to the expected climate hazards. We outline this section into four parts: vulnerabilities, adaptation strategies, asset management questions, and red flags. The vulnerabilities describe infrastructure, cultural resources, and visitors that may be affected by the key climate hazards. The adaptation strategies include infrastructural changes and park management practices that will increase the resilience of infrastructure, cultural resources, and visitors. The asset management questions are lists of questions that should be added to the current Asset Management system in order to identify and monitor key infrastructure’s conditions. The red flags are indicators that infrastructure is vulnerable to further damage and requires immediate attention.
In addition to infrastructure and park management projects, park managers should work to maintain the ecological health and resilience of the local environmental systems. The rich and diverse ecological systems of Michigan will be under considerable stressors including pollution, water temperature changes, differences in precipitation, and invasive species are likely to thrive.
3.1 Extreme Heat and Warming Hazards
Michigan is expected to experience higher high temperatures. These temperatures will lead to increased drought risk, wildfire risk, and infrastructure damage to everything from roads cracking and buildings damaged by wildfire. This damage is hard to avoid, as it is challenging to avoid rising temperatures’ effects.
Anticipated threats associated with warming include damage to buildings and other structures, buckling roads and parking lots, hazardous electrical utility settings, and diminished park use. After outlining the threats, adaptation tactics will be outlined and made clear.
Additionally, asset management strategies will be covered in this section as they pertain to extreme heat. Finally, this section will establish thresholds for action to be taken to further adapt to the effects of climate change.
BUILDINGS AND STRUCTURES VULNERABILITIES
The effects of increased temperatures on structures in Michigan’s state parks will be significant. State parks boast a natural setting and natural-inspired design (“parkitecture,”) which, while aesthetically pleasing, can pose problems concerning wildfire control due to issues like proximity to nearby treelines and a lack of defensible space.20
Rising temperatures bring increased likelihood of wildfires in Michigan’s state parks. Increased snowfall in winters, a result of climate change’s impacts to storms, leads to greater branch breakage, adding potential fuel to wildfires, especially in unmaintained forestland. While wildfires were once a natural occurrence, they are becoming more frequent and hotter around the globe as temperatures rise dramatically and poor forest management leads to brush fuel.21 For example, in recent years Porcupine
Mountains Wilderness State Park reported three wildfires, one burning as much as approximately 1,100 acres due to a lightning strike.22 This exemplifies the rising risk of wildfires due to natural causes. Additional risks are present due to wildfires caused by human-made sources, which will be covered in the utilities section.
To combat the risk of wildfires, the USDA Forest Service recommends maintaining up to a 30-foot radius from buildings of low, green vegetation, and a 30 to 100-foot radius from buildings of fuel reduction; this refers to clearing brush from forest floors and eliminating adjacent trees in the fuel reduction zone.23 Implementing a fuel reduction zone of up to 100 feet from buildings deemed critical and located in forested areas will be a necessary adaptation to the increased risk of wildfires caused by extreme heat. PRD should evaluate all buildings vulnerable to fire and determine which critical buildings should have fuel reduction zones implemented. Asset management plans should also require a verification that buildings have adequate space available for emergency vehicles in the event of fire or other emergencies.
Rising temperatures will also bring increased cooling needs for park buildings like visitor centers and ranger stations. Some of these buildings may not currently be equipped with air conditioning. The Department of Natural Resources should consider an asset management plan that includes an audit of frequently-occupied buildings of this nature to determine their air conditioning capabilities and whether or not the buildings’ air conditioning should be upgraded.
Additional consideration should be placed on the cleanup of forest floors after heavy snow events. Particularly after a dry, hot summer, heavy snows cause branch breakage, leading to accumulation of wildfire fuel on the forest floor. As snow begins to melt
in springtime, crews should clear downed vegetation from forest floors to reduce severity of potential wildfires.24
ROAD AND PARKING LOT VULNERABILITIES
Heat is a considerable factor in the wear and tear of surface parking lots and asphalt roads. Increased temperatures lower the structural integrity of asphalt roads, leading to buckling and cracking over time.25
When feasible, roads should be constructed of concrete, which is considerably more durable than asphalt even though concrete roads come with higher construction costs. Asset management will consist of increased maintenance of roads and parking lots; sealing cracks and filling potholes will be more common. General management plans should be updated to include more thorough inspection and maintenance of roads and surface parking lots.
ELECTRIC UTILITIES VULNERABILITIES
The primary risk commonly associated with electrical utilities is the downing of overhead transmission or distribution lines. These lines carry high voltage over long distances, and are susceptible to damage from storms. If an electrical line is downed during or following an extreme heat event, the risk of wildfire is drastically increased. Potential fuel for the fire is abundant, and the higher temperatures lower the threshold for fire to spread.26
In addition to the risks associated with fire, downed electrical lines also can lead to complications related to power outages. Parks that operate on wells rely on electrical pumps to source water for structures as well as fire suppression. If a line is downed, causing fire, the compounding risk of a lack of fire suppression could be catastrophic.
Potential adaptations vary. Above ground, electric infrastructure should be regularly cleared of vegetation to protect them
48 49
from fire or high wind events.. A further adaptation, although costly, is the transition to underground electrical lines. Underground conduit eliminates the risk associated with high wind and wildfire threats. Finally, to prevent loss of fire suppression or water pressure during outages, backup solar power should be installed at wells to provide pump power. This electricity could also be used to power critical systems during outages, such as ticket sales or ranger stations. This does not have to be limited to backup power either, as installing permanent, large-scale solar power infrastructure is of great benefit to parks economically and environmentally.
General management plans should include language requiring the regular clearing and maintenance of transmission and distribution lines throughout state parks. New utilities in wooded areas should be considered as strong candidates for underground conduit rather than overhead lines.
PARK USE VULNERABILITIES
A significant risk to state parks is the decline in park use associated with the effects of climate change. Increased heat may seem like a potential boon to attendance, as winters will generally shorten and summers
lengthen, but the rising temperatures could have a ripple effect resulting in more dramatic rain events.27
Popular adaptations to extreme heat include the addition of air conditioning and cooling centers throughout parks, as well as the introduction of more native and climate resilient shade trees. Shade trees on trails provide a much more pleasant experience for guests of the park hiking or otherwise recreating on trails.
For rising heat, air conditioners are necessary additions to parks to provide relief from intense temperatures. Many parks in Michigan and throughout northern states are not equipped with air conditioning. However, it is a relatively inexpensive addition to park buildings that could be vital in the viability of park use throughout hot summer months.
In addition to air conditioning, cooling centers may become necessary for parks that experience intolerable climates in the future. An air conditioned tent or other large structure with seating and plentiful chilled bottled water is all it would take to prepare a cooling center at minimum.
This section concludes with a list of asset management survey questions to be included for park managers, as well as a list of red flag conditions that indicate the need for immediate action in response to climate change. The asset management questions are for inclusion in the facilities asset management survey conducted by park managers. Red flags should be available to all relevant parks staff and action should be taken to rectify any conditions as soon as possible.
ASSET MANAGEMENT SURVEY QUESTIONS RELATED TO EXTREME HEAT AND WARMING
Buildings and Structures
• How far away from the treeline is the building?
• Is there 100’ of defensible space?
• Is there adequate fire equipment access for the building?
• Is there working air conditioning in the building?
• Is fire suppression available without electricity? Is solar backup power available?
Roads and Parking Lots
Electric Utilities
• What is the road made of (paved or unpaved; asphalt or concrete)?
• Are there considerably large cracks or potholes in the road or parking lot?
• Is the road surface appropriate for the level of traffic?
• Are overhead distribution and transmission lines clear from tree branches?
• Are transmission line rights-of-way clear of dense vegetation and accessible?
RED FLAGS FOR EXTREME HEAT AND WARMING
Buildings and Structures
Roads and Parking Lots
Electric Utilities
• Cooling systems unable to maintain comfortable temperatures.
• Fire suppression is unavailable without electricity.
• Surfaces cracking and/or melting due to heat.
• Overhead lines make contact with tree branches
• Electrical system unable to provide key services during outage (insufficient backup).
50 51
Figure 2.4 Shaded Trail at Kal-Haven Trail State Park
Climate adaptation for flooding involves gray and green infrastructure to reduce the risks and vulnerabilities of more frequent and extreme storm events. There are four main approaches to climate adaptation to extreme storms and flooding: protect, accommodate, avoid, and retreat. These methods provide different approaches depending on the type of weather and flooding events that affect the land and infrastructure (see figure 2.5).28
• Protection strategies refer to physical barriers that stop or separate floodwaters from entering particular areas. Gray infrastructure strategies that stop floodwaters could include dams, levees, and riprap.29 Green protection strategies could include coir rolls and dunes.30 Coir rolls are large rolled logs that are filled with natural fibers that act to slow erosion and floodwaters. Similarly dunes naturally work to absorb and slow down floodwaters. Protection strategies are most effective for areas that experience flooding from lake level or riverine level rising. These strategies are most relevant to the “Shoreline Erosion” and “Lake Level Variation” sections.
• Accommodation involves designing buildings and infrastructure to be more resilient to flooding by minimizing water and flood damage. This could include raising structures above flood levels, designing buildings with flood-resistant materials, and/or constructing stormwater storage
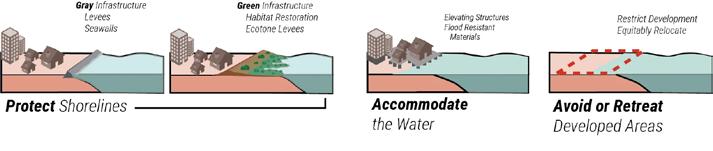
around the infrastructure (ie. bioswales or retention ponds). These strategies are most effective for areas that experience continual minor flooding or occasional extreme flooding.
• Avoiding refers to avoiding new development in areas prone to flooding. This is mainly used for areas at high risk for flooding such as floodplains and floodways, or areas near rising sea or lake levels. This can include regulations that prohibit or limit development in areas that are currently or are predicted to be high risks to flooding.
• Retreating involves moving structures from areas that are at high risk for flooding. This may be necessary in areas where protection and accommodation measures are too expensive, insufficient, or unreasonable. This approach will likely be the main measure to adapt the cultural resources within Michigan state parks.
A combination of these approaches may be necessary to adapt to the increasing risks of storm events and flooding. Different approaches may be more appropriate for different areas which will depend on the cost of protection, availability of suitable land for avoiding or retreating, and the level of worker capacity for different approaches.
These flooding adaptation methods (Protection, Accommodation, Avoiding, and Retreating) will guide the following recommendations to adapt park infrastructure and cultural resources.
TRAIL VULNERABILITIES
Many trails are built near water features and are prone to high soil moisture concentration.31 Increased precipitation and snowmelt will result in flooded or muddy trails which can be susceptible to damage and widening with overuse. Intense storms can also knock down trees or branches which may fall onto the trail and create barriers for park visitors. Creeks and riverines may also flood which can damage small bridges. As the climate of Michigan changes, the frequency and cost of maintenance of trail infrastructure will increase, particularly on popular trails.32
Muddy Trails
Retreat and Avoid
For consistently muddy sections of trails, the more long term solution and environmentally friendly option would be to retreat. This means that muddy sections of trails should be relocated to align with side-hills and include sloping trail grades.33 This will allow water to run off, rather than sit on flat surfaces. Future trail developments in areas prone to flooding or mud should be constructed along higher elevations with sloping grades. Additionally, park managers could deter the use of problematic trails by closing off trails during wet seasons.
Accommodate:
When retreating or avoidance methods are not feasible, there are options to accommodate the trails to reduce mud and water retention. Muddy sections of trails could be hardened with larger rocks or geosynthetics such as geogrids, geonets, and cellular contaminants of substrates.34 Geosynthetics are the unnatural adaptation method, but they can help with additional drainage, better tread holds, and they require less infill.35
Flooded Trails Retreat
In areas that have particularly high flood risks, avoid and retreat methods should be prioritized. Rerouting trails and sections of trails with highest flood risks to areas that will be necessary.36 Park management should consider the possibility of higher water levels for areas where trails that pass by creeks and rivers.
Accommodate:
Commonly flooded trails can be accommodated by modifying infrastructure for future climates. This could include boardwalks or sections of boardwalks that raise the trail above the floodwaters. Additionally, culverts can be added or increased in size to accommodate additional water flow. Trails that cross creeks and rivers should have bridges that are made of materials that are rot resistant.37 The bridges should also be at a height that accommodates higher water levels.
Widening Trails
Accommodate:
Hikers typically step along the edges of trails that are flooded or muddy. This can lead to widening of the trails and trampling of trailside vegetation.38 Popular trails that also experience muddy or flooded trails should be accommodated by putting logs or large rocks along the edge of the trail to deter walking off trail.
Additionally, a way to keep hikers from widening trails is to place educational signs around the park to communicate the consequences of widening.39 This could additionally inform visitors about vegetation or animals that may be vulnerable to being trampled.
52 53
3.2
Increased Storm Event Hazards
Figure 2.5 Protect, Accommodate, Avoid, and Retreat
Buildings and structures that are located near water features will be particularly vulnerable to flooding and damage after frequent and intense weather events. Indoor flooding may occur due to pooling around structures or through leaks in the building. Extreme weather events such as strong winds, heavy snow, and ice can directly damage buildings or they can cause trees to fall on buildings.
Heavy Rain Flooding and impacts on Buildings and Structures
There are different forms of accommodating buildings for heavy rain flooding to prevent structural damage.
Accommodate:
Buildings can be accommodated to protect them from rain runoff flooding areas close by. Installing rain barrels can keep rainwater from pooling near foundations. Rainwater can be safely retained in rain gardens and french drains as well. If buildings are located in areas where water frequently floods or surrounds the building, the heating and cooling equipment should be moved to higher elevations within the building to prevent the risk of flooding the equipment.40 It is common for older infrastructure to have sewage and stormwater systems together. This causes major issues when the water system is inundated and untreated sewage can come back into the building. In these cases, backflow valves can be installed to prevent sewage from coming up in the building.
Buildings that experience frequent flooding in a specific area should install a sump pump to remove water from the building. Park managers can put sandbags in front of expected flood waters as a rapid response to flooding in specific areas. Additionally, buildings can be weatherized
by waterproofing windows or adding french drains and gutter extensions to help move water away from the building. In areas where there are occasional floods due to acute shocks, such as flash floods, buildings may need to be retrofitted by raising it above the height of flood waters. This is a very costly adaptation measure, but can reduce flood insurance premiums.41
Retreat or Avoid
In areas that experience continuous major flooding, buildings and structures should be relocated. Moving the structure to higher elevations will reduce the risk of flooding the most. However, this adaptation measure is very costly; it requires the building to have a solid structure that can withstand the forces of moving the building.42 Additionally, new structure developments should consider the location of rising lake levels and river levels as precipitation increases with climate change. The decision to physically move buildings away from flood zones, versus abandoning old buildings and constructing new ones will need to be assessed by the cultural significance, available land for new development, and costs involved.
Storm Damages to Buildings and Structures
Wind speeds will likely increase with more intense and frequent storms from climate change. Additionally, warming temperatures will make snow wetter and heavier and ice storms may be more frequent. Wind, ice, and heavier snow can put considerable stress on buildings and structures causing direct damage. These stressors can also damage trees which can fall on buildings and structures.
Accommodate:
Weatherizing buildings to reduce moisture condensation and leaks will be important for maintaining structural resilience to withstand heavy snow, ice, and strong winds. This will prevent moisture from rotting or weakening
weight bearing structural components. The top chords of trusses, rafters, purlins, and truss plates are most vulnerable to water damage (see figure 2.6).43 Additionally, buildings should be made with strong roofs, walls, floors, and foundations that will be resilient to strong winds and potentially tornadoes.44

When structures show signs of holding more weight than they are meant to handle, park managers will need to remove the snow. Caution should be taken when removing snow because it can make the higher up snow quickly slide down the roof.
common on the western and eastern coast of Lake Erie, but they can also occur in shallow bays that have long distances of open water where wind can blow across it.46 Edge waves are the most rare form of storm surge which is created by a derecho, or long line of strong thunderstorms.47
Seiches are similar in the way that wind pushes water into larger waves at one side of a lake (see figure 2.8). Seiches are different from storm surges because they are created by atmospheric pressure changes, fast moving weather fronts, and strong shifting winds.48

HARBORS AND BOATING VULNERABILITIES
Harbors and boating will be impacted by more extreme weather conditions such as fast winds and rapid atmospheric pressure changes. These impacts can result in storm surges, seiches, and in the more rare case edge waves.45
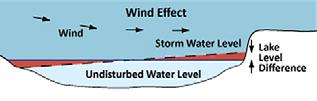
Storm surges are temporarily occuring high waves that are created by strong winds that can reach a height of one to eight feet in the Great Lakes (see figure 2.7). They are most
All of these forms of lake level changes occur during extreme storm events and can cause flooding or extremely low shoreline levels. Larger waves, storm surges, and seiches can damage harbors and boating infrastructure with wave impacts. Moreover, extremely low tides can damage harbors and boating by scraping the bottoms of boats. Therefore, the frequency and cost of maintenance of harbor and boating infrastructure will increase.
54 55
AND STRUCTURE
BUILDING
VULNERABILITIES
Figure 2.6 Top chord diagram
Figure 2.7 Storm Surge Diagram
Figure 2.8 Seiche Diagram
High Water Levels in Harbors
Accommodate:
Storm surges and seiches that create high water levels with larger waves can damage harbors and boating infrastructure with wave impacts. Michigan state parks that are located in high risk areas for storm surges or seiches should prepare to plan for additional repairs and upkeep maintenance to sustain the resilience and stability of harbor infrastructure.
Harbors can become resilient to temporarily higher water levels by maintaining, modifying, or replacing weaker harbor and boating infrastructure with stronger made materials. For example, wood docks are less resilient to freezing and rotting whereas polyethylene, aluminum, and steel are more durable.
Pilings, which are wood, concrete, or metal posts that anchor docks should also be regularly maintained and assessed for damage by park managers. Piling can be repaired or replaced with more durable materials, like concrete or metal. Semi-rotted wood pilings can be repaired with steel pipe halves that are bolted together around the piling (see figure 2.9).49 50
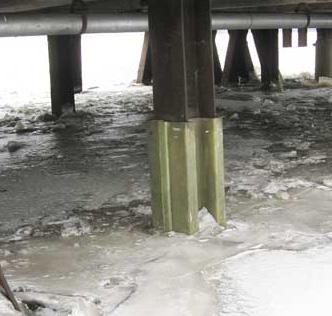
Low Water Levels in Harbors
Accommodate:
When water levels become particularly low, marinas will need to adapt so that boats do not scrape their bottoms in abnormally shallow waters during and after storms. Though it is costly, regular dredging in harbors can help boats safely navigate through shallower waters. Furthermore, dredging simultaneously helps manage siltation and erosion.
Harbor infrastructure made from wood will become more susceptible to rot damage when it is exposed to the open air during low water levels. Park managers should regularly assess and maintain key harbor infrastructure such as docks, slips, and dock pilings.51
ROADS AND PARKING VULNERABILITIES
Roads and parking lots maintenance will increase with snow, ice, and rain precipitation. Increased precipitation during winter months will likely include more snow and ice, which requires heavy road and parking lot maintenance. Warmer winter months with fluctuanting freezing and nonfreezing temperatures will damage roads when water gets into cracks and expands, thus creating potholes.
Flooded parking lots and roads can damage the road materials, but it also can create problems for the surrounding water systems. Impervious pavement can move runoff quickly, which can move road contaminants into waterways and overburdened stormwater systems.
Road Maintenance
Accommodate:
Road maintenance frequency and costs will likely increase as a result of climate changes. This will include winter road maintenance such as salting and snow
plowing. Additionally, with warmer winter temperatures and more precipitation, the State Parks should expect to perform more road repairs such as pothole and crack filling.
Heavy Rain Flooding and Impacts on Roads and Parking Lots
Accommodate: There are many adaptation solutions for roads and parking lots to move rainwater off the paved surface. The slope grading of parking lots and roads should water off the road to nearby locations. The slope can be adjusted to allow water to move toward safe water storage locations. Green infrastructure will be the most sustainable method for safe water storage of excess runoff. The following examples of green infrastructure for water storage can be constructed and used in combination with one another. The appropriate form and/or combination of water storage method(s) will depend on the grading of the surface and amount of runoff that needs to be accommodated for.
Native plant grow zones can be planted with native, deep-rooted, salt-resistant plants that will be able to absorb large amounts of runoff (see figure 2.10). Native plant grow zones can be planted in open areas along roads where the stormwater runoff moves off by sheetflow. Native plant grow zones have been
used by Wayne County, Michigan when they worked to convert large park areas to native habitat and reduce the amount of runoff in stormwater systems. Similar to all roadside plantings, bioswales, and rain gardens, the line of sight may be impacted if taller natives are planted. Additionally, there will be initially higher maintenance needed to establish the plants.52, 53
Rain gardens are another way to collect stormwater runoff along roads and parking lots. They are shallow depressions in the ground that are planted with native, deeprooted, and salt-resistant plants which will hold the water and filter it through the soil.54 Rain gardens should be installed in areas where water flows heavily over the side of the road or parking lot, or it can be located where stormwater pipes outlet. Rain gardens are shallow, but can hold more water depending on the space available.
Bioswales are similar to rain gardens in the way that they are shallow depressions with native, deep-rooted, and salt-resistant
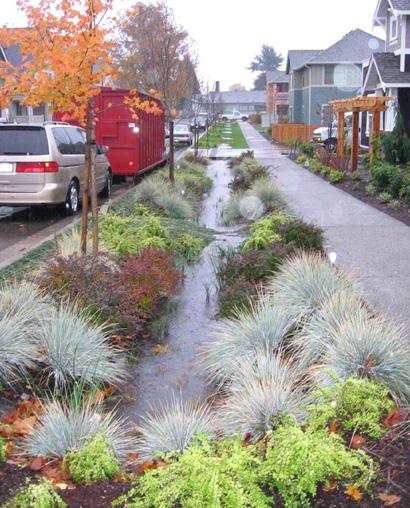
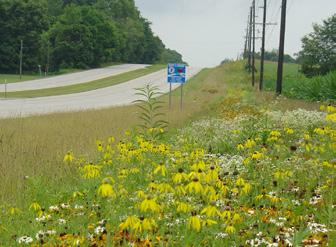
56 57
Figure 2.9 Maintained Pilings
Figure 2.10 Roadside native plant grow zones
Figure 2.11 Roadside rain garden
plants. However, the purpose of bioswales is to move water from roads and parking lots toward another water storage location such as a rain garden, detention basin, or retention pond. In the case that water storage developments are unable to handle the amount of runoff, bioswales can include stormwater pipes that take runoff away from the site.55
In cases with larger amounts of runoff and there is large amounts of space nearby, a detention basin or retention pond may be a necessary development. Both detention basins and retention ponds can hold large amounts of water and are shaped in similar ways. To differentiate the two, detention basins include an outlet structure that moves water away from the site, whereas retention ponds do not have an outlet structure. Detention basins tend to be dryer than a retention pond. Since the detention basin outlet structure lets water move immediately toward stormwater outlets, it does not contribute to considerable water quality improvements. Additionally, detention basins should be designed to drain within 3 days.56 If they do not drain properly, they can become breeding grounds for mosquitoes because detention basins may hold shallow, still water, whereas retention ponds typically hold deeper water.57 Retention ponds do not have an outlet structure, which allows them to hold more water over long periods of time. Retention ponds can also provide habitat for marine animals, native plants, and birds. In order to keep both retention ponds and detention basins clear of mosquito breeding, park management should work to keep the inlets, outlets, and the bottom of the pond clean of debris; maintain erosion; and maintain vegetation around the ponds.
New developments of parking lots and roads in areas that experience frequent and higher amounts of flooding could benefit from additionally installing pervious (or permeable) pavement materials. Pervious
pavement allows stormwater to infiltrate into the soil, which minimizes wear on the pavement. The type of permeable pavement design can influence the durability of the surface, which can include pavers, porous asphalt, or pervious concrete (see figure 2.12). However, permeable pavement costs twice as much as regular pavement, and it also requires regular maintenance to clean out debris that will stop water from filtering through the pavement.58
analysis of installing pervious pavement should also include long term costs such as semi-annual pavement sweeping.

Retreat:
Roads that are located near bodies of water that experience frequent and extreme flooding to the point where roads are closed often, should be relocated or alter the path of the road to higher elevations when possible.
ELECTRIC UTILITY VULNERABILITIES
Electricity supply will likely be disrupted by more frequent and intense storms that can directly or indirectly damage electricity distribution infrastructure. Strong wind and heavy snow precipitation can directly damage distribution power lines; though most commonly, strong wind and heavy snow can take down trees and limbs that pull down lines or poles.
Direct Storm Damage to Power Lines
Avoid:
As a local Michigan example, the city of Ann Arbor has used pervious pavement for low volume streets. The city of Ann Arbor has used pervious concrete for alley way and pavers that line streets. Due to the high cost and maintenance of pervious pavement, this stormwater management infrastructure should be carefully planned to make sure that the site will be a long term location of a road or parking lot that will not be at high risk of erosion or lake level rising.
The type of pervious pavement that the parks may install will be dependent on the area that needs to be paved, the budget, and subsurface make-up to allow water to filter through the ground.59 The cost-benefit
Power lines that are high above the ground are the most common way to distribute electricity because they are the cheapest to install. Underground power cables are much more resilient to fallen trees and different weather conditions, but they are much more expensive to install.
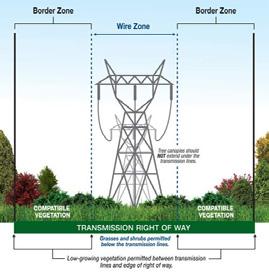
Tree Damage to Power Lines
Avoid:
Transmission lines typically have large vegetation removed by clear cutting trees (see figure 2.13). This largely reduces the risk of fires and downed transmission lines which are particularly expensive and high voltage. Similarly, the distribution power lines that lead to lights and buildings in the parks should keep clear zones around power lines to reduce the risk of fallen trees. This means that park management should regularly prune branches away to keep conservative distances from the lines.60
There are multiple parks in Michigan that have made use of the transmission line cleared zones by developing biking and walking paths along the border zone of the clearing. The Canton Trail System has a section located along a transmission trail for three miles.61 The Novi ITC Corridor Trail is also located along transmission line clearings, and it connects different trails by hiking and biking routes (see figure 2.14).62 63
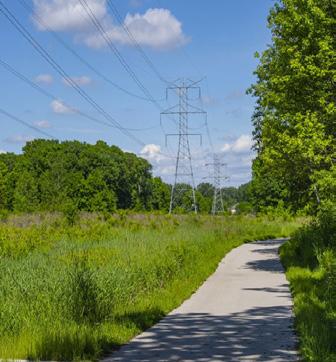
58 59
Figure 2.12 Different types of pervious pavement
Case Study Example:
Figure 2.13 Transmission line clear zones
Case Study Example:
Figure 2.14 Novi ITC Transmission Trail
Power Outage
Accommodate:
In the case that extreme storm events take out the power, there can be multiple effects to the park structures and lighting. This can impact infrastructure that park staff and visitors rely on for safety, comfort, or business (ie. indoor and outdoor lighting, heating and cooling systems, cashier registers, and water pump systems). Water, heating, cooling, and light may be essential for park visitors and staff’s resilience during inclement weather and emergencies.
Local solar power production and generators should be considered to develop electrical resilience at the state parks. However, solar power generation is a much more sustainable and cost effective option compared to diesel generators.64 Additionally, switching to renewable energy production reduces the parks’ environmental impacts and fulfills the Parks and Recreation Division’s Green Initiatives Principle 1: Waste and Energy Reduction.
STORMWATER SYSTEM VULNERABILITIES
More frequent and intense precipitation events will lead to increased pressure on stormwater systems. The timing and distribution of precipitation will also impact stormwater systems, which may lead to overflowing stormwater systems and culverts.
Heavy Flooding Events and Stormwater Systems
Accommodate:
Stormwater systems may need to be designed or upgraded to handle larger volumes of runoff, which could include increasing the capacity of stormwater pipes, storage facilities, culverts, and other infrastructure.
storage such as rain gardens, bioswales, detention basins, and retention ponds can build resilience of stormwater systems. By absorbing or holding rainwater, these stormwater storage systems can slow down stormwater from moving to nearby bodies of water and filter pollutants. These systems will be particularly important during flash flood events which can quickly move sediment and cause erosion.
Park managers should be aware if the park has a combined stormwater and sewage systems. Combined sewer systems are vulnerable to overflow with increased precipitation and extreme storm events. Combined sewer overflows will pollute nearby streams and bodies of water with untreated sewage. In order to avoid this, park managers should plan to have separate stormwater and sewage systems installed.
CULTURAL RESOURCE VULNERABILITIES
Cultural resources within Michigan state parks can include architectural historic sites, historic archeology, prehistoric archeology, and underwater sites such as shipwrecks.65 Many of the cultural resources will be at risk due to excess precipitation and intense storm events as a result of climate change. Excess rain will likely weather historic structures and archaeological sites, and extreme weather events will make archaeological resources vulnerable to inundation.
Furthermore, many of the archeological resources within the state parks also have not been found, inventoried, or identified yet. Flooding events have a high potential to wash away topsoil and uncover new cultural resources. As new cultural resources are discovered and more visitors come to the parks, they may be at risk of looting and theft. This is particularly common for beached shipwrecks and stealing shipwreck wood for reclaimed wood furniture.66
Additionally, as the parks’ landscapes change and develop as a result of climate change, cultural resources may be uncovered during trail, road, or other construction activities. In these cases it is important to value the unearthed archaeological resources and act accordingly to preserve them.
Exposure, Weathering, and Theft of Cultural Resources
Protect:
In most cases protection measures for known archeological sites will be the most plausible strategy to enhance the resilience of cultural resources. The most feasible protection measures will require Park Managers to plan for an inventory of cultural resources, to develop community appreciation, and educate the public about the cultural resource.
In many cases, there is no option to accommodate cultural resources due to their fragile nature. However, developing community appreciation and knowledge can help develop plans to preserve archeological artifacts and/or discourage theft. Park managers should develop partnerships with experts and proper representatives within the Michigan Tribal Historic Preservation Officers, Tribal Cultural Representatives, and State Historic Preservation Officers. These local experts can help identify cultural artifacts and educate people of their history and value. Developing community appreciation and a sense of pride is an important way to protect cultural resources.
Case Study Example:
community, there are potential economic development gains to the widespread appreciation and research. When researchers visit the sites and stay in the community, they simultaneously support the local tourism industry and may rent boat time or other equipment to visit the shipwrecks.67
Flooded Cultural Resources
Accommodate and Retreat:
Cultural resources are not as flexible to adaptation due to the fact that they cannot be changed or moved easily or at all, and they tend to be very fragile. There are cases where historic architectural sites can be adapted and relocated. However, this is specific to the structural soundness of the building and capacity for structural accommodations without drastic change to the building.
More frequent and intense storms can create unfavorable or hazardous conditions for park visitors. Days with intense storms will certainly deter visitors, however warming temperatures will likely extend the visitation season beyond the current peak visitation season (Memorial Day to Labor Day).
The aforementioned sections have described the impacts climate change will have on infrastructure due to the prediction of increased frequency and intensity of storms. Infrastructure damage will also impact visitors’ experiences of parks and will likely limit accessibility to the parks when trails, roads, and parking lots are closed or partially closed.
As discussed in the “Roads and Parking Vulnerabilities” section, stormwater
Thunder Bay National Marine Sanctuary protects the many shipwrecks in Lake Huron off the coast of Michigan through legal conservation boundaries and educational outreach. The sanctuary supports research, education, and community involvement which protects the shipwrecks through local networks. In addition to the supportive
Though there will likely be more precipitation, projections estimate that there will be less overall snow and shorter durations of snow cover. This will alter the winter activities that park visitors are able to participate in. Snow dependent activities such as snow shoeing, skiing, and snowmobiling will become
60 61
PARK USE AND VISITATION VULNERABILITIES
increasingly more expensive to maintain with artificial snow, there will be shorter periods to partake in these activities, or possibly unfeasible in certain areas.
Despite the more extreme weather conditions and infrastructural damage due to climate change, visitation to parks is expected to increase within areas that will have relatively milder climate impacts.68 69
During and After Storms
The main way to build park visitor’s resilience to extreme weather conditions is to educate people to prepare expectations and preparedness. Park managers should educate visitors about the volatility of climate change and how it is difficult to predict future weather conditions. Therefore, visitors should be educated about emergency preparedness. Educating visitors could include permanent or temporary signage, workshops, or tours of the impacts the park has experienced.
Parks should have publicly accessible and resilient shelters available for visitors to reside
in case of emergency during extreme storm events, which should be well publicized to visitors. This could include shelters to reside during rain events, extreme cold conditions, and extreme wind events that could include tornadoes.
After extreme weather conditions, the park’s infrastructure and environment may be damaged. Park managers should work to close off hazardous areas or areas that may be vulnerable to treading from visitors. Park managers can educate visitors about how to avoid dangerous areas and “leave no trace” practices to protect themselves and the vulnerable environment around them.
Park managers commonly struggle to fix issues around the parks due to the insufficient budgets and staffing. Visitors should be provided information about the limitations of park management to fix issues around the park. These limitations could potentially be an opportunity to ask for community help around the park, such as volunteer labor, donations, or alternative partnerships.
The following Asset Management Survey Questions and Red Flags are meant to organize data on the structural conditions and identify vulnerabilities of the park infrastructure.
ASSET MANAGEMENT SURVEY QUESTIONS RELATED TO STORM EVENTS
Trails
• Is the soil type around trails conducive to rainwater absorption?
• Does it have a strong drainage capacity?
• What condition is the trail bridge in? Are bridges on trails strong enough to withstand higher water levels? Are bridge materials made of rot resistant materials?
Buildings and Structures
Harbors and Boating
Roads and Parking
Electrical Utilities
Stormwater Systems
• Is the building at the bottom of an elevation grade change?
• Is the harbor infrastructure resilient to storm surges or larger waves?
• Is the harbor infrastructure adaptable to extremely low tide levels?
• Is the harbor infrastructure made from rot resistant materials?
• Is the road paved or unpaved?
• Are there considerably large cracks or potholes in the road or parking lot?
• Is there a buffer zone separating power lines and trees?
• Is there a backup electrical source for emergencies to operate water pumps, park operations, and lighting?
• Is the stormwater system combined with sewage?
• Do culverts consistently flood over their capacity?
RED FLAGS FOR INCREASED STORM EVENTS
Trails
Buildings and Structures
Harbors and Boating
• Trampled vegetation
• Consistently muddy trail sections
• Water pooling next to foundation
• Foundation Cracks
• Stormwater leaks in the building
• Fixed height docks
• Too much height between the dock and the water level
• Not enough space between the dock and the water level
• Exposed wood docks or pilings
Roads and Parking Lots
Electric Utilities
• Water pooling in a certain section of parking lots or roads
• Consistently closed roads
• Extreme sagging during winter storm events
• Branches reaching over power lines
• Power outages for extended periods
• Potable water systems on a pump system that is reliant on electricity
Stormwater Systems
• Combined stormwater and sewage systems
• Inundated culverts
62 63
Figure 2.15 Tree damage after storm
Climate change has led to significant shoreline erosion in Michigan state parks, particularly along the coastline. Coastal erosion is a process by which local sea level rise, strong wave action, and coastal flooding wear down or carry away rocks, soils, and sands along the coast.70 The rising water levels in the Great Lakes due to climate change are exacerbating erosion problems. For instance, the water level of Lake Michigan has increased by six feet since 2013, and the levels are predicted to continue rising in the coming decades.71
To address shoreline erosion, it is crucial to conduct asset management surveys that identify vulnerabilities and develop erosion prevention strategies. These surveys focus on various aspects of park infrastructure, including trails, buildings, roads, and electrical systems, as well as cultural resources and the overall park experience. Furthermore, red flags are suggested to indicate issues or vulnerabilities that could compromise the safety, resilience, or longterm functionality of park assets.
TRAIL VULNERABILITIES
Trail Instability
Trail instability refers to the wear and tear that occurs on the surface materials of a trail due to natural causes. This can cause the surface of the trail to become uneven and loose, resulting in ruts and holes that can make the trail unsafe and unsustainable. If left unchecked, this erosion can make the trail unusable due to safety concerns or difficulty navigating.72
Accommodate:
For trails, we can realign them, add boardwalks, and construct erosion-resistant paths. Implementing erosion control measures like geotextiles (permeable fabric materials used in civil engineering and
construction projects to provide stabilization, filtration, and drainage), retaining walls, and vegetation planting is also important. Additionally, park management should regularly inspect and repair affected trails and install barriers and signs to guide visitors away from hazardous areas.
Case Study Example:
California State Parks initiated a project to address erosion issues by removing and recontouring trails. Interventions included selected trails were closed and removed using techniques such as decompacting soil, restoring natural contours, and reestablishing native vegetation. The recontouring process minimized the visual impact of the removed trails and aided in the recovery of damaged ecosystems. The trail removal and recontouring project in California State Parks has successfully addressed erosion issues and improved the overall trail network.73 (See figure 2.16).74
materials, leading to potential issues such as cracks, settling, or even collapse.75
Accommodate:
In order to protect building foundations, erosion control measures like retaining walls, vegetation, or drainage systems should be installed. By regularly inspecting and maintaining foundations, park managers can detect and address potential issues before they escalate. Additionally, structures should be designed and built with erosion-resistant foundations, such as piers or piles, which elevate the structure above erodible soil.76 In some cases, at-risk-structures will need to be relocated away from erosion-prone areas like coastal or riverbank zones, or unstable slopes.
HARBORS AND BOATING VULNERABILITIES
Loss of Protected Mooring Areas or Docking Infrastructure
As shorelines erode, natural harbor areas or coves may change in shape and extent, resulting in a decrease in available sheltered spaces for mooring or anchoring boats. This erosion can also undermine the stability and functionality of vital shoreline structures, such as docks, piers, and boat ramps.
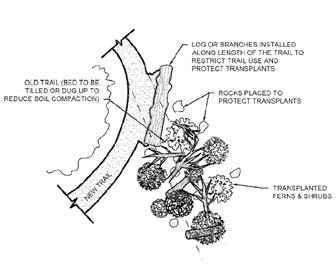
Accommodate:
or gravel, leading to potholes, cracks, and bumpy surfaces. Additionally, when erosion wears away the soil underneath these areas, it can weaken their overall stability and structure.
Accommodate:
To reduce wear and tear on roads and parking lots, stronger, weather-resistant materials should be considered during construction. Establishing regular maintenance schedules can facilitate prompt identification and repair of damages. Regular inspections and geotechnical assessments can detect areas of weakness or erosion before they become major issues. Moreover, it is essential to integrate erosion control methods such as efficient drainage systems, retaining walls, and vegetation to reinforce the soil and diminish the effects of water runoff.77
ELECTRIC AND STORMWATER SYSTEM VULNERABILITIES
Unstable Underground Wiring
2.16 Trail Obliteration and Rehabilitation
BUILDINGS AND STRUCTURES VULNERABILITIES
Foundation Damage
Erosion can undermine the stability of the foundation, and structural harm occurs to the base of buildings and other infrastructure due to the wearing away of soil, rock, or other
Employ erosion control measures like installing riprap, constructing seawalls, or utilizing living shorelines to stabilize eroding areas and protect crucial boating infrastructure. Additionally, adopt adaptive design elements, such as floating docks or modular piers, that can accommodate changing shoreline conditions and water levels.
ROAD AND PARKING VULNERABILITIES
Surface Deterioration and Subsurface
Undermining
Erosion has the potential to damage parking lots and roads by breaking up the asphalt
As shorelines erode, the soil around the underground wiring can be washed away, leading to exposure and potential damage to the cables.78 This can disrupt the electrical supply and communication networks, as well as compromise the functioning of stormwater systems. Furthermore, the erosion of shorelines can also lead to the undermining of nearby structures, increasing the risk of damage or collapse, which may also impact the underground wiring and stormwater systems.79
Accommodate:
We recommend planting trees and stabilizing riverbanks to help control soil erosion, which in turn reduces sediment accumulation in waterways. To enhance the durability of underground wiring systems, it is advisable to use stronger materials and protective casings.80
64 65
3.3
Shoreline Erosion
Figure
CULTURAL RESOURCES VULNERABILITIES
Degredation of Historic Trails and Pathways and Loss of Archaeological Sites
Erosion can cause the loss or degradation of historic trails and pathways, exposure, damage, or destruction of buried cultural remains, artifacts, and features due to the wearing away of soil and sediment layers. Increased erosion can also lead to the exposure and degradation of buried archaeological sites.
Accommodate:
We propose regularly maintaining and restoring historic trails and pathways by clearing debris, repairing damaged sections, or reinforcing vulnerable areas with erosion-resistant materials. We should also incorporate cultural resource protection into long-term park management and climate adaptation plans. Raising public awareness about the importance of cultural resources and the risks posed by climate change and erosion is crucial.81 Encouraging responsible park use and visitor behavior can also help minimize human-induced erosion.
PARK USE VULNERABILITIES
Limited Access to Facilities, Loss of Recreation Areas, or Safety Hazards
Erosion can lead to closures of park facilities, like campgrounds or picnic areas, as well as reducing the size of beaches, meadows, or other recreational areas. Also, erosion can create hazards like falling rocks, landslides, or unstable ground.82
Accommodate:
Relocating or reinforcing vulnerable facilities should be considered to minimize disruptions to park operations and visitor experiences. This might entail moving campgrounds or picnic areas, or strengthening structures such as restrooms or visitor centers. Revitalizing eroded recreational zones, such as beaches, meadows, or playgrounds, through the addition of new sand, soil, or vegetation, or by implementing erosion-resistant elements like sand fences or retaining walls, is crucial.83 Most importantly, installing safety features, such as warning signs, barriers, or fencing, to inform visitors of potential erosion-related hazards and safeguard them from harm is importance.
The following Asset Management Survey Questions and Red Flags are meant to organize data on the structural conditions and identify vulnerabilities of the park infrastructure.
ASSET MANAGEMENT SURVEY QUESTIONS RELATED TO SHORELINE EROSION
Trails
• What is the current condition of the trail?
• What are the most vulnerable sections of the trail network?
• What are the primary causes of instability? And what are the potential consequences of trail instability?
Building and Structures
• What is the estimated remaining useful life of the building, and how does shoreline erosion affect this estimate?
• What are the erosion rates and patterns in the park?
Harbors and Boating
• Are there visible signs of erosion, such as collapsing banks or exposed roots, along the shoreline near harbors and boating infrastructure?
• Has any infrastructure, including docks, piers, boat ramps, or waterfront amenities, been damaged or undermined due to erosion?
Roads and Parking
• How can we assess the current condition of surfaces and underlying support?
• What are the primary causes of erosion-related surface deterioration and undermining in the area?
• What specific erosion control measures have been implemented, and have they been effective in stabilizing the soil and reducing the impact of water runoff on the area?
Electric Utilities
Stormwater Systems
• Are there any noticeable signs of erosion around riverbanks or underground wiring systems?
• What measures are in place to monitor and control sediment buildup and erosion at the site?
RED FLAGS FOR SHORELINE EROSION
Trails
• Steep or eroding banks alongside trails
• Cracks, slumping, or a visible loss of material along the edges of trails84
• Accumulation of sediment along trails or in nearby water bodies
Buildings and Structures
Harbors and Boating
Roads and Parking
Electric Utilities
Stormwater Systems
• Visible cracks, bowed walls, or uneven floors
• Doors and windows sticking or misaligned
• Soil loss or erosion around the foundation
• Noticeable loss of land, collapsing banks, or exposed roots along the shoreline
• Cracked, leaning, or partially submerged docks, piers, or boat ramps
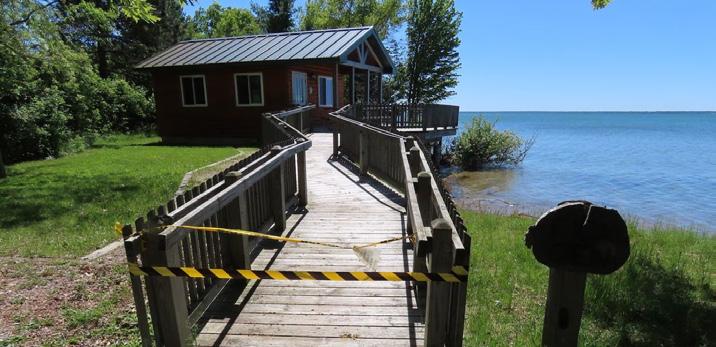
• Edge deterioration of the road or parking lot
• Uneven or sunken pavement
• Frequent and unexplained power outages and irregular voltage fluctuations
• Stormwater outfalls exposed to erosion
• Blocked or rerouted water flow
66 67
Figure 2.17 Eroding Shoreline Close Cabins at Tawas State Park
Lake Level Variation
Rising water levels in the Great Lakes have led to more frequent seasonal tidal flooding in Michigan state parks. A striking example of this impact is the six-foot increase due to climate change in Lake Michigan’s water level since 2013, as reported by the National Weather Service.85
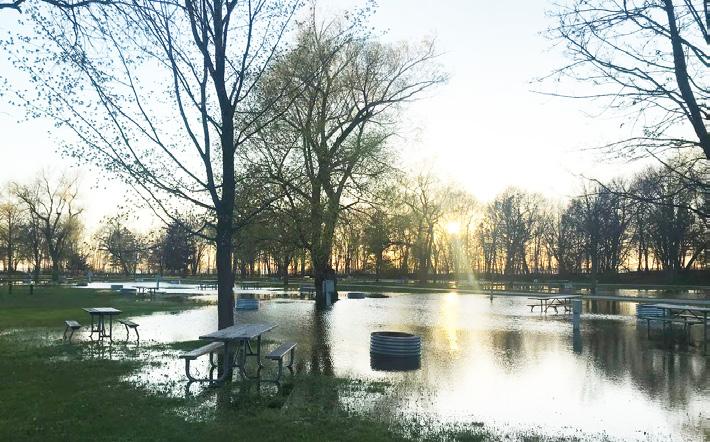
Moreover, the Great Lakes’ water levels are predicted to continue to increase in the next few decades due to climate change: Lake Superior rising 19 centimeters (7.5 inches), Lake Erie 28 centimeters (11 inches), and Lake Michigan and Huron by 44 centimeters (17.3 inches) by 2050. Great Lakes residents already struggle with flooding, especially after the record-high water levels in 2019 and 2020. Currently, water levels are no longer at record-highs, flooding remains a huge problem.86 However, some other scientific organizations, such as the National Oceanic
and Atmospheric Administration (NOAA), the Great Lakes Integrated Sciences and Assessments (GLISA), and the International Joint Commission (IJC), have studied the potential impacts of climate change on the Great Lakes water levels and have indicated that they could increase in the future.
This section delves into the flooding issues affecting our parks’ infrastructure—from trails and buildings to roads and electrical systems, as well as the preservation of cultural resources and the overall park experience. For each vulnerability and their respective adaptation strategies, we propose asset management survey questions that create a foundation for developing effective climate adaptation. In addition, we identify potential red flags to ensure the long-term viability and functionality of the assets. These red flags signify issues or vulnerabilities that could affect the safety or resilience of the assets.
TRAIL VULNERABILITIES
Washed Out Trails
Washouts occur when floodwaters erode the soil and other supporting materials along a trail, leading to the collapse or removal of portions of the trail. This can make the trail impassable or hazardous for hikers. Washouts can also undermine the stability of nearby structures such as bridges or boardwalks, posing additional safety risks87.
Accommodate:
To maintain trail usability and visitor safety, it is recommended to reroute trails to circumvent damaged areas. If a washedout section is too extensive for rerouting, elevating trails or constructing bridges over the affected areas may be necessary. These bridges not only enable hikers to safely traverse but also protect the trail from further damage. To avert future washouts, reinforcing susceptible trail sections with materials such as gravel, rocks, or geotextiles is advised,88 as these help stabilize the trail and mitigate the impact of floodwaters (see Figure 2.19).89
BUILDINGS AND STRUCTURES VULNERABILITIES
Weakened Foundations and Material Deterioration
Floodwaters can compromise the integrity of a building’s foundation, walls, and support structures, weakening the overall structure and potentially leading to collapse. Prolonged exposure to water and moisture can cause construction materials, such as wood and drywall, to deteriorate, making buildings less safe and functional.90
Accommodate:
Incorporate flood-resistant design principles when building new structures or renovating existing ones in state parks. Reinforce foundations, elevate structures, use waterresistant materials, and design proper water flow and drainage. Elevated walkways and paths, as well as flood-resistant infrastructure, also provide additional protection.91
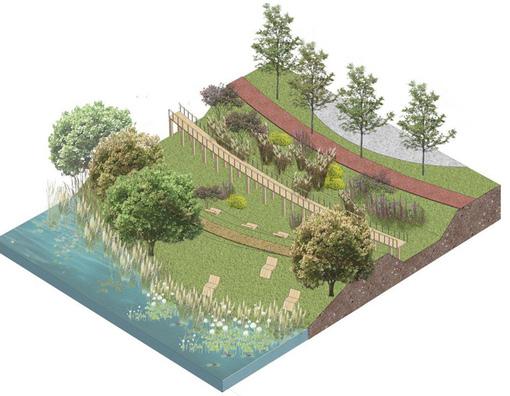
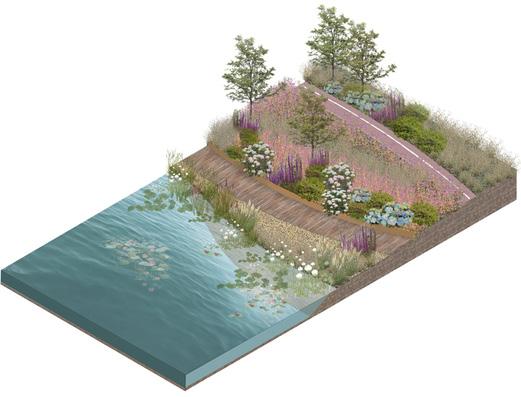
68 69
3.4
Figure 2.18 Flooded campsites at Tawas State Park
(a) before (b) after
Figure 2.19 relocating or elevating trails
The Des Allemands community in St. Charles Parish, Louisiana, experiences flooding during tropical storm events. To address flood protection while also creating a community asset, the parish is considering a project that involves bank stabilization along Bayou des Allemands and the implementation of low earthen barriers.
During the onset of storm seasons, temporary flood protection is overlaid on a compacted earthen base. Low earthen barriers prevent water intrusion and can be landscaped with plants, trees, or grass. They can surround a single house and yard or a small grouping of homes, providing protection from floods up to three feet. However, it is important to note that these barriers can trap water on the internal side, requiring a pumping system to move water out. In cases of storms and power loss, a backup power source would be needed. During heavy rainfall events, low earthen barrier systems may require active attention from landowners or neighborhoods to ensure they function as intended (see figure 2.20).92 93
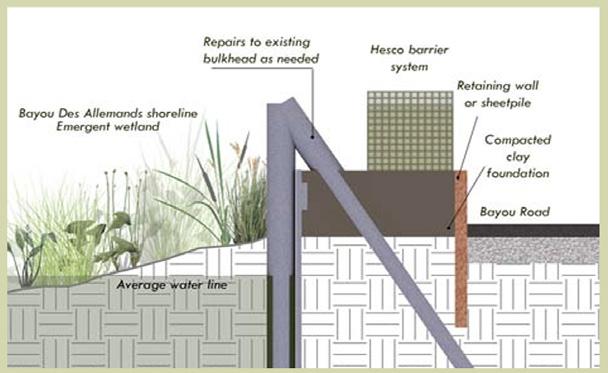
HARBORS AND BOATING VULNERABILITIES
Salination of Waterways and Siltation
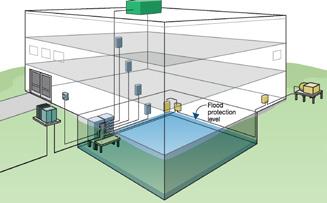
Increased flooding can bring more sediment into harbors, which leads to siltation and sedimentation. As a result, the water becomes shallower, making it more difficult to navigate and ultimately impacting the quality and enjoyment of boating activities.
Accommodate:
Preserve or restore natural barriers like marshes, bags, fens, and dunes, which can act as buffers to help absorb floodwaters and reduce the impacts on water quality and ecosystems. Also, carry out periodic dredging of harbors and navigation channels to remove accumulated sediment and maintain safe water depths for boating activities.
ROADS AND PARKING VULNERABILITIES
Inundation of Low-Lying Areas
Low-lying areas in parks are at a higher risk of flooding since they sit at lower heights and are usually near bodies of water like rivers, lakes, or shorelines.94 Floodwaters can cause
surface damage, undermine the structural integrity of the pavement, and potentially lead to potholes or cracks. Additionally, floodwaters often carry sediment, which can accumulate on roads, affecting usability and necessitating extensive cleanup efforts.
Accommodate:
Construct raised walkways, paths, and access points in flood-prone areas to maintain accessibility and visitor safety. Upgrade park roads and parking lots with flood-resistant materials or green infrastructure, such as bioswales (shallow, landscaped channels designed to capture, filter, and slow down stormwater runoff), permeable pavements, and rain gardens, to help absorb and filter stormwater.95
ELECTRIC AND STORM WATER SYSTEMS VULNERABILITIES
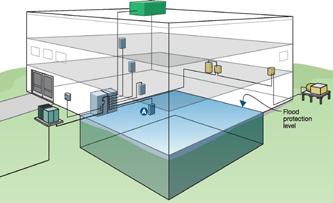
Damaged Electrical Infrastructure and Overburdened Stormwater Systems
Flooding can cause significant harm to electrical equipment, such as transformers, power lines, and control systems, within state parks. When water infiltrates this equipment, it can lead to short circuits, malfunctions, or even complete failure. As a result, park facilities may lose power, which
can disrupt operations, affect lighting and communication systems, and pose safety risks to visitors and staff96. Also, the existing stormwater systems, including catch basins, culverts, drainage channels, and retention ponds, can become overwhelmed when flooding.
Accommodate:
Raise essential electrical components above anticipated flood levels and install waterproof casings or enclosures for electrical equipment. Enhance existing stormwater management systems and promote natural drainage by restoring wetlands, reforesting areas, and maintaining or improving riparian buffers along waterways. Incorporate alternative power sources, like solar panels or generators, to add resilience for park facilities in case of electrical infrastructure damage.97
Case Study Example:
Gulf State Park, Alabama has incorporated flood-resistant design principles in the construction of its facilities, including elevating structures and using waterresistant materials, to minimize damage from hurricanes and coastal flooding. Simplified diagram showing primary electrical system components mitigated by relocation to higher floors as figure 2..98
70 71
Case Study Example:
Figure 2.20 Compacted Earthen Base
(a) before (b) after
Figure 2.21 Simplified electrical system diagram
Note: The basement panel will remain vulnerable to flooding. The panel should be isolated from the rest of the electrical system.99
CULTURAL RESOURCES VULNERABILITIES
Damage to Historic Structures and Erosion of Archaeological Sites
Flooding can have severe consequences for historic buildings, monuments, or other structures within state parks. When floodwaters infiltrate these structures, they can weaken foundations, cause wood to rot or warp, corrode metals, and damage masonry. Additionally, flooding can accelerate erosion processes around archaeological sites, which can expose, damage, or wash away important artifacts or features100. Fast-moving floodwaters can cause soil to erode rapidly, leading to the destabilization of archaeological remains.
Accommodate:
It is recommended that parks determine which vulnerable structures exist in areas prone to flooding and develop mitigation plans to safeguard them. To protect historic structures from water infiltration, implement flood-proofing measures like installing flood barriers or sealing building openings (a process of closing or covering gaps, cracks, or other openings in a building to prevent unwanted elements, such as water, air, or pests, from entering). Enhance drainage systems around historic structures and archaeological sites to prevent water accumulation and reduce the risk of damage.
Plant vegetation around archaeological sites to anchor the soil and reduce erosion, which also acts as a natural buffer, absorbing water and minimizing flood impact.101
PARK USE VULNERABILITIES
Damage to Park Infrastructure and Disruption of Recreational Activities
Floods can wreak havoc on park facilities like restrooms and visitor centers. They also lead to limited access to park areas as campsites or picnic spots become submerged. As a result, activities such as hiking, fishing, and camping are affected, with fishing spots and boat launches becoming damaged or contaminated.102
Accommodate: Create backup plans for recreational activities that might be disrupted and communicate clearly about park closures or changes in access to park facilities. Develop and implement emergency response plans outlining procedures for park staff and visitors during flood events, including evacuation routes and communication strategies, to ensure safety and minimize confusion. When building or renovating park facilities, consider using flood-resistant materials and designs, such as elevating structures in flood-prone areas, to reduce potential damage and improve the park’s resilience to flooding events.103
ASSET MANAGEMENT SURVEY QUESTIONS RELATED TO LAKE LEVEL VARIATION
Trails • Do washouts occur frequently in the park? Are there patterns that can help predict future events?
• What is the current condition of the park’s drainage systems, and how effective are they at preventing washouts?
• What are the potential environmental impacts of trail repair or reconstruction, and how can these be minimized?
Buildings and Structures
• What is the expected lifespan of the existing materials and foundation, considering the local climate and potential for flooding?
• Are there any historical records of flooding events in the area?
• What are the costs and benefits of using alternative, more flood-resistant materials in building construction or repairs?
Harbors and Boating
• Has flooding affected coastal habitats, such as marshes, dunes, or other ecosystems that serve as natural buffers or support marine life?
• Is there an accumulation of sediment in harbors, navigation channels, or around boat ramps that has led to navigational hazards or shallow waters?
Roads and Parking
• What are the most vulnerable assets in low-lying areas of the park?
• What is the current state of the park’s infrastructure (ie. roads, bridges, and buildings) in low-lying areas?
• Are there current park management practices that protects assets and in low-lying areas?
Electrical Utilities
• What are the conditions and capacities of the electrical infrastructure?
• What are the anticipated future demands on these systems due to climate change, park use, or park development?
• Is the electrical infrastructure suceptible to flooding? Would it be feasible to install solar power systems as a means to address power outages?
Stormwater Systems
• What are the capacities of the stormwater systems in place?
• How vulnerable are the stormwater systems to flooding, and what are the potential consequences of damage or failure?
RED FLAGS FOR SHORELINE EROSION
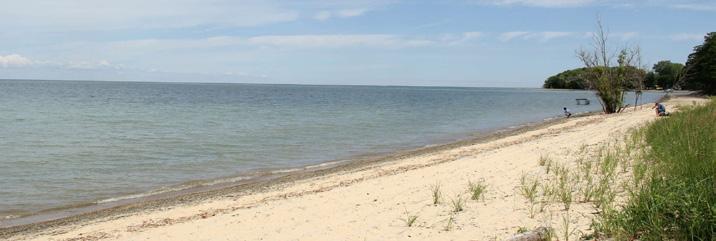
Trails
Buildings and Structures
Harbors and Boating
Roads and Parking
Electric Utilities
Stormwater Systems
• Puddles or pools of standing water along trails
• Weather warnings for heavy rainfall, flash floods, or snowmelt
• Swelling, warping, or buckling of materials, including wood, drywall, or flooring
• Frequent or recurring flooding events in the area
• Degradation or loss of coastal habitats, such as marshes, fens, or dunes
• Lake levels meeting or inundating docks
• Puddles, mud, or visible water seepage in low-lying areas
• Rivers, creeks, or other water bodies visibly rising or overflowing their banks
• Electrical equipment submerged or exposed to water
• Inadequate drainage near electrical infrastructure
• Frequent standing water or inadequate or blocked drainage
• Overflowing or breached retention or detention ponds
72 73
Figure 2.22 Lowered lake levels on Lake Huron
4. CONCLUSION
Increased temperatures are going to require great adaptation from the Department of Natural Resources. The risks of rising temperatures are associated with everything from infrastructural challenges like buckling roads to diminished park use. Additionally, as the average global temperature rises, snowmelt will increase and snowfall will decrease. Increased rain events compared to snow events are anticipated, and higher temperatures increase the intensity of storms.
Increased intensity and frequency of storm events will require substantial infrastructural changes within Michigan state parks. These infrastructural changes may require considerable financial support and additional staffing support. The risks of extreme weather events will impact the infrastructure, ecological systems, and park visitors.
Climate change has significantly impacted Michigan’s state parks, especially along the coastlines, as it leads to more shoreline erosion and flooding risks. The increasing water levels in the Great Lakes, particularly in Lake Michigan, have posed a threat to park infrastructure, natural resources, and cultural
assets. By implementing erosion control measures, flood-resistant designs, regular maintenance and inspections, and proper park management, we can help protect Michigan’s state parks from the devastating effects of climate change.
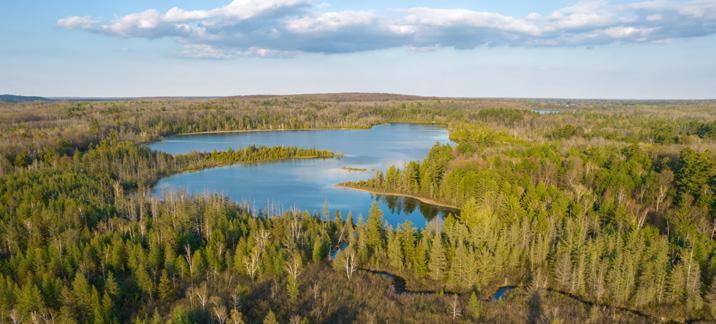
Climate change is anticipated to impact Michigan and the Great Lakes region in the coming years. Adaptation measures related to rising temperatures, storm events, and erosion and flooding will be necessary to implement, and this section outlined the necessary steps to take to adapt to climate change’s effects. The risks of rising temperatures are associated with everything from infrastructural challenges like buckling roads to diminished park use. It is projected that Michigan will experience more snowmelt, precipitation, and increased frequency of extreme storm events. The Great Lakes’ swelling water levels have posed a threat to Michigan state parks. Climate change is a growing threat, but with proper adaptation the devastation can be minimized. The Michigan DNR’s adoption of adaptation measures will be vital in continued operations throughout the coming decades.

74
Figure 2.23 Rifle River Recreation Area
KEY RECOMMENDATIONS
EXTREME HEAT/WARMING
• Determine critical building status to decide if buildings should have a 100-foot fuel reduction zone implemented
• Clear vegetation within 100 feet of critical buildings
• Construct new parking areas and roads using concrete for longevity.
• Plan for cooling centers throughout high summer volume parks.

• Begin to install air conditioning in frequently occupied buildings.

• Divert stormwater runoff to safe stormwater storage locations such as retention ponds, detention basins, rain gardens, and other green infrastructure.
• Construct infrastructure to be resilient to flooding with rot resistant materials.
• Construct infrastructure to be structurally strong and weatherized to withstand damage such as downed trees, heavy snow, ice, and wind.
• Inventory critical electrical reliant systems such as water systems, essential park operations, and lighting systems and plan for resilient backup power sources such as renewable energy source or a generator.
• Assess park infrastructure vulnerabilities and implement erosion prevention strategies, such as realigning trails and using adaptive design elements. Protect building foundations and stabilize harbors and boating infrastructure for a safer park experience.
• Utilize weather-resistant materials and protective casings for roads and stormwater systems. Conduct regular inspections and assessments, reinforce vulnerable facilities, and implement erosion-resistant elements to maintain park infrastructure.

• Maintain and restore historic trails, protect cultural resources in park management, raise public awareness, and address park use vulnerabilities with safety features to mitigate erosion-related hazards
• Use flood-resistant design principles in new constructions and renovations, such as elevated structures, reinforced foundations, and effective drainage systems.
• Enhance existing stormwater management systems and encourage natural drainage through wetland restoration, reforestation, and riparian buffer maintenance.
• Allocate resources to enhance understanding of flooding impacts on park resources and guide the development and implementation of effective adaptation strategies.

76 77
INCREASED STORM EVENTS SHORELINE EROSION LAKE LEVEL VARIATION
ENDNOTES
1.) Hsiang, Solomon, Robert Kopp, Amir Jina, James Rising, Michael Delgado, Shashank Mohan, D. J. Rasmussen, et al. “Estimating Economic Damage from Climate Change in the United States.” Science 356, no. 6345 (June 30, 2017): 1362–69. https://doi. org/10.1126/science.aal4369.
2.) Risk Factor. “Michigan Flood Factor® Report.” Accessed April 21, 2023. https:// riskfactor.com.
3.) Jordan, Micah. Tawas Point State Park Climate Change Impacts Interview. Interview by Sarah Fleckenstein, February 15, 2023.
4.) Roberts, Rachel. North and South Higgins State Park Climate Change Impacts Interview. Interview by Sarah Fleckenstein, February 15, 2023.
5.) Harder, Andrea, and Katherine BuntingHoward. “The Great Lakes and ClimateInduced Human Migration.” New York Sea Grant, August 2022. https://seagrant.sunysb. edu/Images/Uploads/PDFs/GreatLakesPEMOCC-FactSheet.pdf.
6.) Jay, A., D.R. Reidmiller, C.W. Avery, D. Barrie, B.J. DeAngelo, A. Dave, M. Dzaugis, M. Kolian, K.L.M. Lewis, K. Reeves, and D. Winner, 2018: Overview. In Impacts, Risks, and Adaptation in the United States: Fourth National Climate Assessment, Volume II [Reidmiller, D.R., C.W. Avery, D.R. Easterling, K.E. Kunkel, K.L.M. Lewis, T.K. Maycock, and B.C. Stewart (eds.)]. U.S. Global Change Research Program, Washington, DC, USA, pp. 33–71. doi: 10.7930/ NCA4.2018.CH1
7.) US Department of Commerce, NOAA. “October 16th, 2019: Large Waves, High Winds, and Beach Erosion.” NOAA’s National Weather Service. Accessed April 19, 2023. https://www. weather.gov/grr/20191016_WavesAndWind.
8.) Southwest Michigan. “Warren Dunes State Park — Your High Adventure Playground,” March 23, 2021. https://swmichigan.org/ blog/6305-warren-dunes-state-park-your-
high-adventure-playground.
9.) “Discover Tahquamenon Falls State Park | Upper Peninsula.” Accessed April 19, 2023. https://www.uptravel.com/ outdoors-recreation/national-state-parks/ tahquamenon-falls-state-park/.
10.) O’Toole, Daniel, Leslie A. Brandt, Maria K. Janowiak, Kristen M. Schmitt, P. Danielle Shannon, Patricia R. Leopold, Stephen D. Handler, Todd A. Ontl, and Christopher W. Swanston. “Climate Change Adaptation Strategies and Approaches for Outdoor Recreation.” Sustainability 11, no. 24 (January 2019): 7030. https://doi.org/10.3390/ su11247030.
11.) Ibid.
12.) Angel, J., C. Swanston, B.M. Boustead, K.C. Conlon, K.R. Hall, J.L. Jorns, K.E. Kunkel, M.C. Lemos, B. Lofgren, T.A. Ontl, J. Posey, K. Stone, G. Takle, and D. Todey, 2018: Midwest. In Impacts, Risks, and Adaptation in the United 2: Fourth National Climate Assessment, Volume II [Reidmiller, D.R., C.W. Avery, D.R. Easterling, K.E. Kunkel, K.L.M. Lewis, T.K. Maycock, and B.C. Stewart (eds.)]. U.S. Global Change Research Program, Washington, DC, USA, pp. 872–940. doi: 10.7930/NCA4.2018.CH21
13.) Gensini, Vittorio A., and Harold E. Brooks. “Spatial Trends in United States Tornado Frequency.” Npj Climate and Atmospheric Science 1, no. 1 (October 17, 2018): 1–5. https:// doi.org/10.1038/s41612-018-0048-2.
14.) Thompson, Carol. “Great Lakes Water Levels to Rise in 2020, Threatening Michigan’s State Parks.” Lansing State Journal. https:// www.lansingstatejournal.com/story/news/ local/2019/12/12/great-lakes-lake-huronwater-levels-2019-michigan-state-parksflooding-mi/4239358002/.
15.) Troy, Cary D., Yi-Ting Cheng, Yi-Chun Lin, and Ayman Habib. “Rapid Lake Michigan Shoreline Changes Revealed by UAV LiDAR Surveys.” Coastal Engineering 170 (December
1, 2021): 104008. https://doi.org/10.1016/j. coastaleng.2021.104008.
16.) MPR News. “Climate Change Threatens Great Lakes Shoreline with Erosion,” April 23, 2020. https://www.mprnews.org/ story/2020/04/23/climate-changethreatens-great-lakes-shoreline-witherosion.
17.) Loiselle, Audréanne, Raphaël Proulx, Marie Larocque, and Stéphanie Pellerin. “Resilience of Lake-Edge Wetlands to Water Level Changes in a Southern Boreal Lake.” Wetlands Ecology and Management 29, no. 6 (December 1, 2021): 867–81. https://doi. org/10.1007/s11273-021-09815-7.
18.) Ibid.
19.) VanDeWeghe, Alexander, Victor Lin, Jennani Jayaram, and Andrew D. Gronewold. “Changes in Large Lake Water Level Dynamics in Response to Climate Change.” Frontiers in Water 4 (2022). https://www.frontiersin.org/ articles/10.3389/frwa.2022.805143.
20.) Knack, Mike. Porcupine Mountains
Wilderness State Park manager. “Interview with Dylan Vaughn-Jansen.” February 2023.
21.) Toohey, Richard. Cornell University climate science researcher. “Interview with Dylan Vaughn-Jansen.” January 2023.
22.) Knack, Mike. Porcupine Mountains
Wilderness State Park manager. “Interview with Dylan Vaughn-Jansen.” February 2023.
23.) Westover, Robert Hudson. “Make your home wildfire defensible.” United States Department of Agriculture Forest Service. April 29, 2021. https://www.fs.usda.gov/features/ make-your-home-wildfire-defensible.
24.) Knack, Mike. Porcupine Mountains
Wilderness State Park manager. “Interview with Dylan Vaughn-Jansen.” February 2023.
25.) Gong, Z., Zhang, L., Wu, J. et al. Review of regulation techniques of asphalt pavement high temperature for climate change
adaptation. J Infrastructure Preserve Resilience 3, 9 (2022). https://doi.org/10.1186/ s43065-022-00054-5
26.) Knack, Mike. Porcupine Mountains
Wilderness State Park manager. “Interview with Dylan Vaughn-Jansen.” February 2023.
27.) Toohey, Richard. Cornell University climate science researcher. “Interview with Dylan Vaughn-Jansen.” January 2023.
28.) Bland, Alastair. “Warming to Managed Retreat.” KneeDeep Times, September 25, 2021. https://www.kneedeeptimes.org/ warming-to-managed-retreat/.
29.) Risk Factor. “Finding Flood Solutions.” Accessed March 23, 2023. https://riskfactor. com.
30.) Ibid.
31.) O’Toole, Daniel, Leslie A. Brandt, Maria K. Janowiak, Kristen M. Schmitt, P. Danielle Shannon, Patricia R. Leopold, Stephen D. Handler, Todd A. Ontl, and Christopher W. Swanston. “Climate Change Adaptation Strategies and Approaches for Outdoor Recreation.” Sustainability 11, no. 24 (January 2019): 7030. https://doi.org/10.3390/ su11247030.
32.) Ibid.
33.) Meadema, Fletcher, Jeffrey L. Marion, Johanna Arredondo, and Jeremy Wimpey. “The Influence of Layout on Appalachian Trail Soil Loss, Widening, and Muddiness: Implications for Sustainable Trail Design and Management.” Journal of Environmental Management 257 (March 1, 2020): 109986. https://doi.org/10.1016/j.jenvman.2019.109986.
34.) Ibid.
35.) “0723-2806-MTDC: Trail Construction and Maintenance Notebook.” Accessed April 6, 2023. https://www.fs.usda.gov/t-d/pubs/ htmlpubs/htm07232806/page10.htm.
36.) “Increase Resilience of Trail System to Higher Peak Flows by Repairing, Replacing,
and Rerouting Trails and Trail Bridges with High Demand for Access | Climate Change Resource Center.” Accessed March 25, 2023. https://www.fs.usda.gov/ccrc/approach/ increase-resilience-trail-system-higherpeak-flows-repairing-replacing-andrerouting.
37.) Ibid.
38.) Meadema, Fletcher, Jeffrey L. Marion, Johanna Arredondo, and Jeremy Wimpey. “The Influence of Layout on Appalachian Trail Soil Loss, Widening, and Muddiness: Implications for Sustainable Trail Design and Management.” Journal of Environmental Management 257 (March 1, 2020): 109986. https://doi.org/10.1016/j.jenvman.2019.109986.
39.) Ibid.
40.) Risk Factor. “Finding Flood Solutions.” Accessed March 23, 2023. https://riskfactor. com.
41.) Ibid.
42.) Ibid.
43.) Dave Kammel. “Snow Loads on Farm Buildings.” Extension Lincoln County, April 16, 2018. https://lincoln.extension.wisc. edu/2018/04/16/snow-loads-on-farmbuildings/.
44.) All Fab Building Components Inc. “Truss Terminology,” n.d. https://www.all-fab. com/wp-content/uploads/2015/12/TrussTerminology.pdf.
45.) Bechel, Adam. “Storm Surges, Seiches and Edge Waves | Wisconsin Sea Grant.” Sea Grant University of Wisconsin (blog), November 6, 2018. https://www.seagrant. wisc.edu/our-work/focus-areas/coastalprocesses-and-engineering/coastalprocesses/storm-surges-seiches-andedge-waves/.
46.) Ibid.
47.) “MRCC Living With Weather - Great Lakes Weather.” n.d. Midwestern Regional Climate Center. Accessed April 17, 2023. https://mrcc. purdue.edu/living_wx/greatLakes/index.html.
48.) “Coastal Geohazards—Seiches.” 2018. National Park Service. https://www.nps.gov/ articles/coastal-geohazards-seiches.htm.
49.) “Section 2: Infrastructure | Clean Marina Resource Guide.” Accessed April 16, 2023. https://www.michiganseagrant.org/cleanmarina-classroom/course-units/increasingresilience/section-2-infrastructure/.
50.) Ibid.
51.) “Reinforcing Our Waterfronts: Increased Resilience at Marinas and Harbors.” Sea Grant and Great Lakes Integrated Sciences and Assessment Program, n.d. https:// www.michiganseagrant.org/wp-content/ uploads/2018/10/14-728-Increase-Resilienceat-Marinas-and-Harbors.pdf.
52.) Ibid.
53.) INDOT. “Roadside Management Program.” INDOT, October 7, 2021. https://www.in.gov/ indot/current-programs/green-initiatives/ roadside-management-program/.
54.) Mullen, Amy. “Managing Water with Rain Gardens and Bioswales.” Spotts Garden Service (blog), September 30, 2020. https://spottsgardens.com/rain-gardensbioswales-rainscaping/.
55.) “Plant Selection for Rain Gardens –Flathead Conservation District,” May 4, 2020. https://flatheadcd.org/plant-selection-forrain-gardens/.
56.) EPA Office of Water. “Stormwater Structures and Mosquitoes.” EPA, August 2005. https://www3.epa.gov/npdes/pubs/sw_wnv. pdf.
57.) “Stormwater Basins: How Detention and Retention Ponds Work.” Accessed March 30, 2023. https://info.wesslerengineering. com/blog/stormwater-basins-detentionretention-ponds.
58.) “Pervious Paving — Civic Garden Center of Greater Cincinnati.” n.d. Civic Garden Center of Greater Cincinnati. Accessed April 17, 2023. https://www.civicgardencenter.org/ pervious-paving.
59.) Ibid.
60.) TVA.com. “Anatomy of a Right of Way.” Accessed April 3, 2023. https://www.tva. com/energy/transmission/right-of-waymaintenance/anatomy-of-a-right-of-way.
61.) Corp, ITC Holdings. “‘Transmission Trails’ Offer Natural Beauty and Recreation in SE Michigan Communities.” Accessed April 3, 2023. https://www.prnewswire.com/newsreleases/transmission-trails-offer-naturalbeauty-and-recreation-in-se-michigancommunities-300519379.html.
62.) City of Novi. “ITC Corridor Trail.” Accessed April 3, 2023. https://cityofnovi.org/services/ parks,-recreation-and-cultural-services/ parks-and-recreation-facilities/itc-corridortrail.
63.) Corp, ITC Holdings. “‘Transmission Trails’ Offer Natural Beauty and Recreation in SE Michigan Communities.” Accessed April 3, 2023. https://www.prnewswire.com/newsreleases/transmission-trails-offer-naturalbeauty-and-recreation-in-se-michigancommunities-300519379.html.
64.) Energy.gov. “Renewing Our National Parks.” Accessed April 11, 2023. https://www. energy.gov/eere/femp/renewing-ournational-parks.
65.) O’Shea, John. Cultural Resources and Climate Change Impacts Interview. Interview by Sarah Fleckenstein, March 27, 2023.
66.) Ibid.
67.) O’Shea, John. Cultural Resources and Climate Change Impacts Interview. Interview by Sarah Fleckenstein, March 27, 2023.
68.) Micah Hewer, Daniel Scott & Adam Fenech (2016) Seasonal weather sensitivity, temperature thresholds, and climate change impacts for park visitation, Tourism Geographies, 18:3, 297-321, DOI: 10.1080/14616688.2016.1172662
69.) Perry, Elizabeth, Robert Manning, Xiao Xiao, and William Valliere. “Multiple Dimensions of Adaptations to Climate Change by Visitors to Vermont State Parks.”
Journal of Park and Recreation Administration 36, no. 2 (2018). https://doi.org/10.18666/JPRA2018-V36-I2-8308.
70.) “Coastal Erosion | U.S. Climate Resilience Toolkit.” Accessed April 11, 2023. https://toolkit. climate.gov/topics/coastal-flood-risk/ coastal-erosion.
71.) Chicago Tribune. “The Battle for Lake Michigan: As Beaches Erode, Millions of Dollars Have Been Poured into Temporary Solutions. Can Anyone Find a Long-Term Fix?,” November 20, 2020. https://www.chicagotribune.com/ news/environment/great-lakes/ct-lakemichigan-climate-change-20201120p3jsqgcldvdq7ozpapdi7oxixa-htmlstory.html.
72.) “Trail Safety: The Perception and Reality | Operations | Parks and Recreation Magazine | NRPA.” https://www.nrpa.org/parksrecreation-magazine/2014/july/trail-safetythe-perception-and-reality/.
73.) “Chapter 27 - Erosion Sediment Control and Trail Removal.FINAL.04.04.19.Pdf.” https://www.parks.ca.gov/pages/1324/ files/Chapter%2027%20-%20Erosion%20 Sediment%20Control%20and%20Trail%20 Removal.FINAL.04.04.19.pdf.
74.) Ibid.
75.) Keep Safe. “Keep Safe.” https:// keepsafeguide.enterprisecommunity.org/.
76.) “How to Stop Soil Erosion Around Your Foundation.” Van Matre Construction (blog), December 7, 2020. https:// bouldercontractors.com/how-to-stop-soilerosion-around-your-foundation/.
77.) “Bakhsh - Design Methodology for Subgrades and Bases Under Concrete Roads and Parking Lots.” https://rmc-foundation. org/wp-content/uploads/2017/06/ErosionDesign-Reports-Combined.pdf.
78.) Grenoble, Penelope B. “Rockfall Protection: Challenges in Design and Installation.” Stormwater Solutions, September 1, 2000. https://www.stormwater.com/erosioncontrol/vegetation-management/
81
article/13000710/rockfall-protectionchallenges-in-design-and-installation.
79.) Sulaeman, Dede, and Thomas Westhoff. “The Causes and Effects of Soil Erosion, and How to Prevent It,” February 7, 2020. https:// www.wri.org/insights/causes-and-effectssoil-erosion-and-how-prevent-it.
80.) Shoreline Erosion: The Cause, Effect, and Solution.” SOLitude Lake Management: FullService Lake And Pond Management, April 11, 2022. https://www.solitudelakemanagement. com/blog/shoreline-erosion-the-causeeffect-and-solution/.
81.) Ma, Krieger. “Lost and Forgotten Historic Roads The Buffalo Trace, a case study,” United States Department of Agriculture, September 12, 2014. https://www.fs.usda.gov/Internet/FSE_ DOCUMENTS/stelprdb5444947.pdf
82.) Cohen, Burrowes, and Gwam. “The Health Benefits of Parks and Their Economic Impacts,” Urban Institute, February 2022. https://www.urban.org/sites/default/ files/2022-03/the-health-benefits-of-parksand-their-economic-impacts_0.pdf
83.) Cohen, Burrowes, and Gwam. “The Health Benefits of Parks and Their Economic Impacts,” Urban Institute, February 2022. https://www.urban.org/sites/default/ files/2022-03/the-health-benefits-of-parksand-their-economic-impacts_0.pdf
84.) Washington Trails Association. “7 Signs Your Trail Is in Trouble & What to Do About It.” https://www.wta.org/news/signpost/7-signsyour-trail-is-in-trouble-what-to-do-about-it.
85.) NPR. “Climate Change Is Already Impacting Lake Michigan — Here’s How,” September 16, 2019. https://www.npr.org/ local/309/2019/09/16/760909053/climatechange-is-already-impacting-lakemichigan-here-s-how.
86.) Blakely, Natasha. “Great Lakes Water Levels Could Increase on Average from 19 to 44 Centimeters in the next Few Decades, Study Says.” Great Lakes Now, June 27, 2022.
https://www.greatlakesnow.org/2022/06/ great-lakes-water-levels-increase-nextfew-decades/.
87.) “Best Management Practices for Erosion Control During Trail Maintenance and Construction - American Trails.”
https://www.americantrails.org/resources/ best-management-practices-for-erosioncontrol-during-trail-maintenance-andconstruction.
88.) Angeles, Mailing Address: 600 E. Park Avenue Port, and WA 98362 Phone: 360 5653130 Contact Us. “Trail Conditions - Olympic National Park (U.S. National Park Service).” https://www.nps.gov/olym/planyourvisit/ wilderness-trail-conditions.htm.
89.) “Not All Parks Should Be Green: 10 Tips to Design Landscape Infrastructure.” ArchDaily, 13 Oct. 2020, https://www.archdaily. com/926764/not-all-parks-should-begreen-10-tips-to-design-landscapeinfrastructure.
90.) “Flood-Resistant Crawlspace Foundations | Building America Solution Center.” Pacific Northwest National Laboratory. August 12, 2022. https://basc. pnnl.gov/resource-guides/flood-resistantcrawlspace-foundations.
91.) Thomas, Geo. “Effects of Capillary Water on Structures and Foundation | Preventing Damage.” EngineeringCivil.Org (blog), July 16, 2020. https://engineeringcivil.org/articles/ civil-engineering/effects-of-capillary-wateron-structures-and-foundation-preventingdamage/.
92.) Nadine, Nadine, Glen Bolen, Camille Manning-Broome, Michele Deshotels, Jeannette Dubinin, John Fregonese, C.J. Gabbe, et al. n.d. “Best Practices Manual for Development in Coastal Louisiana.” Coastal Protection and Restoration Authority. Accessed April 17, 2023. http://coastal. la.gov/wp-content/uploads/2014/03/CPEX_ Coastal_Manual_052012_web-1.pdf.
93.) Ibid.
94.) “Impervious Surfaces and Flooding | U.S. Geological Survey.” https://www.usgs. gov/special-topics/water-science-school/ science/impervious-surfaces-and-flooding.
95.) Virginia Institute of Marine Science. “Rural Areas Will Bear the Brunt of U.S. Sea-Level Rise.” https://www.vims.edu/newsandevents/ topstories/2022/rural_inundation.php.
96.) Rutherford Electric Membership Corporation. “Electrical Safety During and After Storms.” https://www.remc.com/stormcenter/electrical-safety-during-and-afterstorms.
97.) StrikeCheck. “Surge and Lightning Damage to Electronics.” https://strikecheck. com/webinars/surge-and-lightningdamage-to-electronics/.
98.) Federal Emergency Management Agency. 2020. “Protecting Building Utility Systems From Flood Damage.” FEMA. https:// www.fema.gov/sites/default/files/2020-07/ fema_p-348_protecting_building_utility_ systems_from_flood_damage_2017.pdf.
99.) Ibid.
100.) Drdácký, Miloš F. “Flood Damage to Historic Buildings and Structures.” Journal of Performance of Constructed Facilities 24, no. 5 (October 1, 2010): 439–45. https://doi. org/10.1061/(ASCE)CF.1943-5509.0000065.
101.) “The Vulnerabilities of Cultural and Paleontological Resources to Coastal Climate Change Processes in Northwest Alaska (U.S. National Park Service).” https://www.nps.gov/ articles/aps-15-1-2.htm.
102.) “Public Parks and the Pandemic: How Park Usage Has Been Affected by COVID-19 Policies | PLOS ONE.” https://journals.plos. org/plosone/article?id=10.1371/journal. pone.0251799.
103.) “Park and Recreation Infrastructure Is Critical | Research | Parks & Recreation Magazine | NRPA.” https://www.nrpa. org/parks-recreation-magazine/2021/ september/park-and-recreationinfrastructure-is-critical/.
BELLE ISLE STATE PARK
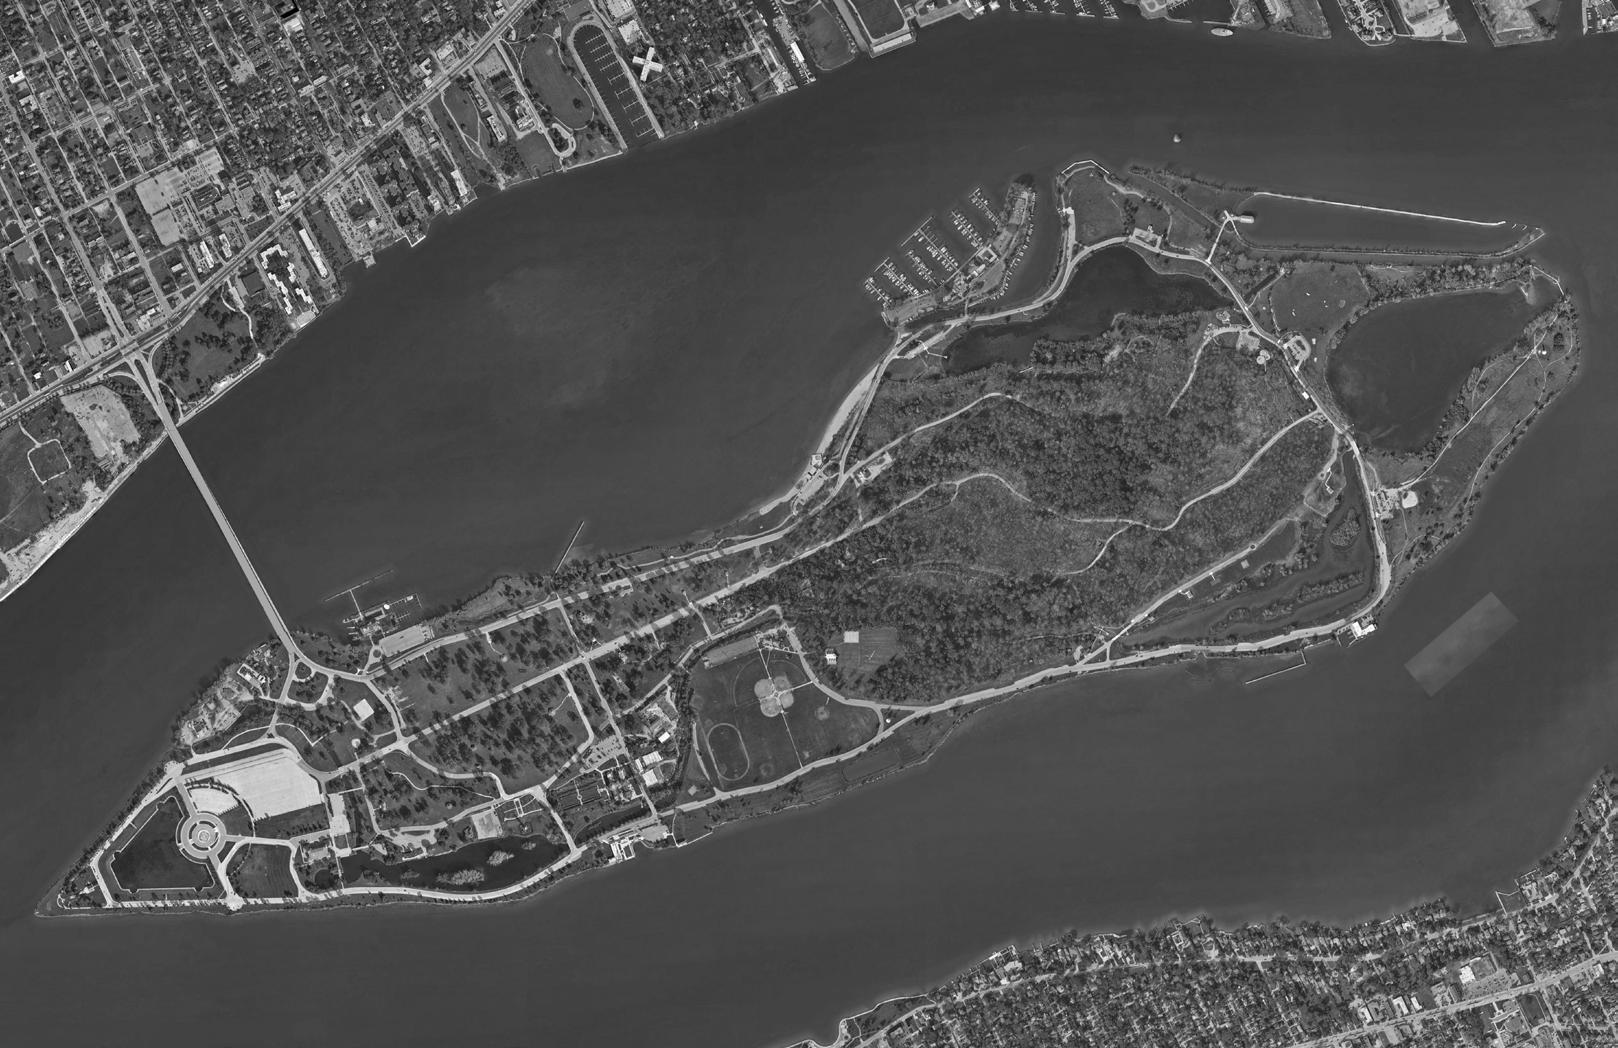
3
Belle Isle State Park, the largest city island park in the country, is a popular destination for locals and visitors alike, offering a variety of recreational and cultural activities. Remaining committed to its mission, DNR has asked the University of Michigan Graduate Consultant Team to research solutions to problems relating to natural area restoration, urban dark sky designation, transportation, and park management during off-peak periods. This plan addresses these concerns through research, data analysis, and case studies, providing the State with strong recommendations to improve Belle Isle in the years to come.
Looking to improve the environmental footprint at Belle Isle, the Department of Natural Resources has tasked the consultant team with several deliverables relating to natural area restoration. Sitespecific turf remediation is of exceptional importance, as there is a desire to create habitat for important fauna such as bees and small mammals while simultaneously limiting attractiveness to canadian geese. Impervious surfaces are also being targeted, with an emphasis on replacement or removal in order to use the island’s spaces more effectively. Due to the ever-growing threats posed by climate change, shoreline protection measures are being examined as well.
Along with on-the-ground measures, the report also explores the possibility of “urban dark sky” designations and recommendations to help Belle Isle meet the requirements and reduce light pollution while still maintaining adequate lighting for safety and security.
In addition to the need to improve natural amenities on the island, the DNR also made a request for a transportation-centric media campaign to encourage both new and
existing users to adopt more sustainable and multi-modal access to the park. High traffic volumes during peak months (MaySeptember) are a major issue at Belle Isle and often cause considerable delays/ congestion. To mitigate this problem, lessons from effective apps, programs, and studies from around the world were examined, both in the transportation and scheduling context. Doing so enables DNR to address the separate issue of off-peak periods in an attempt to incentivize planned visitation to the island during less-popular time slots. Utilizing this app-based model in conjunction with enhanced programming and destinations promises noticeable improvements in visitor behavior. When combined with infrastructural advancements such as better transit and multimodal amenities, this campaign could encourage alternative visitation patterns that shift periods of peak demand.
1. INTRODUCTION
1.1 History & Importance of Project
Belle Isle State Park (see Figure 3.1), covering 982 acres, is a recreational park situated on an island in the Detroit River. The Anishinabeg peoples who initially lived in Belle Isle in its earliest known days, called it “Wah-nabe-zee” or Swan Island.1 Prior to the arrival of Europeans, these indigenous peoples inhabited and used the area for trading and hunting. During the 1700s, the French settlers referred to it as “Hog Island,” and it was used for keeping animals. In 1879, the City of Detroit purchased the island from the Campau family and opened it to the public the following year. As urban areas grew, cities began designating space for relaxation and recreation, and Belle Isle became a popular choice to become a park. Some elements of a plan created by famous landscape architect Frederick Law Olmsted were integrated into the island’s design.2
Operating more than 100 parks and
recreation areas statewide, the DNR is committed to the adoption of innovative design and management trends to encourage sustainability, climate resiliency, and vitality at its facilities. This focus has come to define investment at Belle Isle State Park, which has seen more than $50 million in DNR-funded improvements since the department’s takeover in 2014. With restrictions on indoor activities and social gatherings during the pandemic, residents turned to outdoor activities and nature as a way to maintain physical and mental health, putting added pressure on Belle Isle’s facilities.
1.2 Scope of Work
The first section, “Natural Area Restoration,” deals with topics including turf remediation, goose population control, shoreline protection, and potential urban dark sky designation at Belle Isle. The second section, “Transportation,” approaches mobility issues
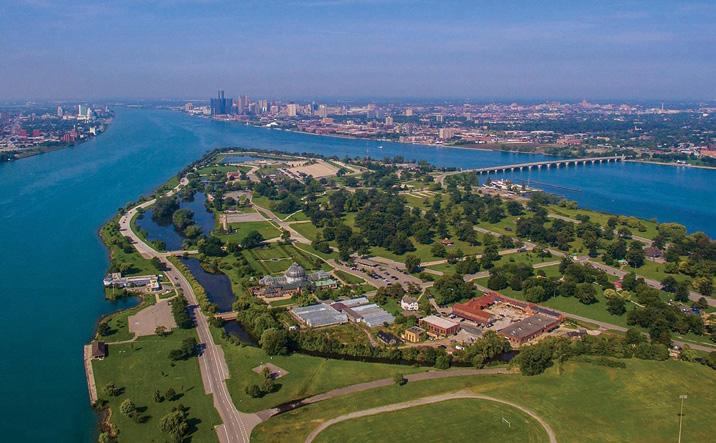
at the park through a media lens, exploring marketing campaign basics, best practice examples both inside and outside the park setting, and examples of transportationfocused smartphone applications. The third section, “Impervious Surface Repurposing,” emphasizes redesign and reuse of Belle Isle State Park’s space, and mainly includes the repurposing methods for the Paddock and unutilized impervious surfaces. The final section, discusses events programming and many potential ways to attract visitors during off-peak periods. The report contains numerous case studies across the United States and world, conceptual strategy guidelines, and feasible implementation measures for Belle Isle specific issues – as well as several maps and site renderings.
1.3 Methods
This report prioritized sustainability and ease of implementation and attempts to provide a comprehensive view of the strategies most
86 86 87 PROBLEM STATEMENT
Figure 3.1: Belle Isle is situated between the cities of Detroit (right) & Windsor (left)
likely to advance these goals. The research methods primarily consist of:
• Field Investigation The team has conducted multiple on-site visits to Belle Isle to gather information, identify site conditions, investigate problem areas, and take photographs.
• Surveys & Secondary Research: Team members conducted thorough surveys that involved interviews, data collection, and literature review. The team also had conversations with staff to gain access to issues and policy information, which helped the team understand the current situation and expectations for improvements on the island.
• Case studies: The project relied heavily on case studies as its primary research method. The team conducted extensive research and analysis of various case studies, examining similar projects and initiatives both locally and globally to gain insights and inspiration.
2. NATURAL AREA RESTORATION
2.1 Urban Night Sky Place Designation CONTEXT
Excessive or inappropriate use of artificial light, also known as light pollution, can have severe environmental consequences for both humans and wildlife, as well as our climate.3 Considering growing concerns about environmental sustainability, energy consumption and climate change, multiple efforts are being made to mitigate light pollution and provide outstanding dark sky experiences. At the request of DNR, the team reviewed the Urban Night Sky Place Proposal and the International Dark Association (IDA) requirements for IDSP designations. This section discusses domestic and international cases of urban lighting plans and puts forth recommendations for establishing guidelines for an urban night sky place on Belle Isle.
Hangzhou, China is famous for the West Lake – a natural space for individuals to recreate and relax.4 The West Lake site covers 22.79 square miles and attracts more than 300,000 visitors per day.5 Since 2013, the government of Hangzhou has tried many kinds of planning to improve the nighttime environment of the West Lake scenic site, including a dark sky plan.
The West Lake District once had a plethora of streetlamps, tree lights, and building screen lights, all of which were intended to make the area exceptionally vibrant and alluring. However, since 2013, the government of Hangzhou has established a dark sky protection zone in the West Lake Scenic area.6 In order to prevent stray light that will beam into the sky, the use of diffuse light bulbs (bulbs which cast light in every direction) is not permitted in most natural settings.
After four years, this dark sky reserve was codified in 2017 with a precisely defined range of allowable lighting infrastructure.7 In addition, the government of Hangzhou strengthened penalties for violations and set up an accountability system for pertinent departments. For example, companies and organizations receive instruction about proper lighting use from administrative officials. Those companies and organizations who fail to make corrections within a designated time limit can be fined between $400 and $2000.8
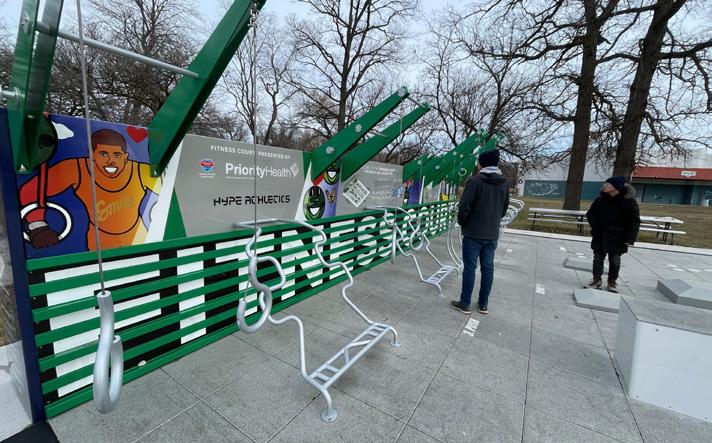
Following the success of the Hangzhou Urban Lighting Master Plan, Hangzhou experienced a remarkable leap forward in the construction of its lighting system and protection of the night sky. The plan outlined how urban lighting would be distributed across different areas and zones, with each zone having specific indicators related to factors such as brightness, color temperature, and standards for using colored lights.9 The plan also created
three lighting sections. (see Figure 3.3)
• The document outlines various aspects of fundamental traffic lighting such as street lighting levels, operating hours, maintenance procedures, emergency protocols, and other elements related to roads, sidewalks, slow greenways, parking lots, bridges, and traffic signals.
• West Lake has a landscape lighting plan for installing lighting fixtures on surfaces (mountain, water), landscape landmarks and spots (portal, landmark, night viewing spots, buildings). The lighting fixtures are controlled by the smart control system. By utilizing solar energy, LED high efficiency light sources, and other smart technologies, lighting uses less energy and emits fewer greenhouse gasses.
• The master plan provides specific guidelines for night tours routes and big events in the scenic area such as dark sky camping.

88 89
Figure 3.2: Team members conducted multiple site visits at Belle Isle
Figure 3.3: West Lake, Hangzhou, China
CASE STUDY - HANGZHOU,
CHINA
The city has successfully integrated the principles of dark sky protection into its urban planning, promoting the harmony of artificial lighting and night environment, and emphasizing the balance between urban development and ecology.10
RECOMMENDATIONS
First, Belle Isle State Park can implement comprehensive lighting plans:

• Transportation Lighting Management Plan: Only absolutely essential lighting like street lamps that are needed for safety should be used. This includes lights which are used for safe and secure transportation, including vehicles’ lights, and lighting for parking lots, streets, sidewalks, and bicycle paths, etc. The proper use of shielding and careful aiming to target the direction of the light beam is important so that light shines downward and does not spill beyond where needed. Prescribed routes for night visitors will also limit the use of light infrastructure in the remaining non-visit areas.
• Building Lighting Management Plan: Reduce light fixtures outside the building such as Nature Center, Conservatory, Belle Isle Aquarium, and control the lighting level and operating hours based on the occupancy.
• Landscape Lighting Management Plan: All lighting for landscape should be targeted and directed to light up only the intended area, such as James Scott Memorial Fountain, Livingstone Memorial Lighthouse, “One World ... Under Michigan Stars’’ Sculpture, etc. Keeping landscape lighting to the lowest possible level allows visitors to enjoy the nighttime landscape while minimizing the impact on the environment. (see Figure 3.4)
Second, the DNR can explore the cost/benefit of developing a sophisticated control system for lighting infrastructure:
• Consider a night sky quality monitoring program by using photometers, utility meters and other technologies to track the evolution of night sky brightness. This data can be used to analyze the changes of sky brightness level over the year. Smart lampposts can also capture a wide range of new forms of data which may be a valuable new asset for the park.
• Using advanced technologies such as sensors, controllers, and software can not only help staff control lighting infrastructure to meet the requirements of IDA and night event hosters, but also save energy and money.11 LED smart lighting and sensors work together to monitor and adjust the lighting levels based on factors such as time of day, weather, and activity levels in the park. This system can deliver a 20-25% reduction in energy costs, while the payback is pegged at around five years.12 For example, the lights can be programmed to switch
on 15 minutes before sunset and off 15 minutes after sunrise. Many companies are already working on developing this functionality. For instance, Philips Lighting provides a complete range of outdoor control systems, which are designed for sustainable use on parking lots, street lighting, and area lighting. Many lighting manufacturers also offer a dark-sky series of light fixtures.
• By installing a smart lighting control system, park staff can easily control the behavior. An excessive amount of lighting may not necessarily improve safety and security at night. Instead, by ensuring that the lighting parameters fall within a certain range, it becomes easier to create a safe and comfortable night environment for visitors.13 According to the available studies, the color temperature range of the light comfort zone in urban park pedestrian space is (3126 K, 4498 K), and the average horizontal illuminance range is (4.08 lx, 6.99 lx).14 While considering the lighting control, the park staff also need to pay attention to the use and experience of some visually impaired people with night blindness. The park can utilize night pathways with luminescent materials.15 (see Figure 3.5)
Third, creating a harmonious night environment among Belle Isle, Detroit River and the built area will not only protect the Detroit night sky environment, but also to promote nighttime activities. Belle Isle State Park is an urban oasis situated on the Detroit River, which makes it easily accessible both from Detroit and Windsor, Canada. This unique location with stunning waterfront views also creates a challenge for maintaining a dark night sky due to the constant urban glow.16 Additionally, the park closes at 10pm, depriving citizens of the opportunity to fully enjoy the night sky. To address this issue, Belle Isle can consider implementing periodic activities that allow for controlled fluctuations in lighting. For
example, one way to plan nighttime activities is to schedule dining and entertainment activities during dusk time. As the sky gradually darkens, the event can transition naturally into observation events.
The park might also consider organizing events such as Night Week, Dark Nights, and Observation Nights to provide citizens with an opportunity to explore the Milky Way and the beauty of the night sky. To accommodate the events, the park will have to extend its operating hours until midnight and dim the lighting to a lower level. These events would include stargazing and other observation activities that promote a deeper education and appreciation of the night environment.
2.2 Turf Grass Remediation INTRODUCTION
As the DNR aims to transform the turf lawn into native vegetation and create a more hospitable environment for native species on Belle Isle, this section delves into the creation of a native plant database. In order to balance the aesthetic and functional needs of the park and its visitors, developing a vegetation management plan for Belle Isle can ensure the preservation of the natural beauty while providing a safe and enjoyable environment for everyone. The team broke the vegetation management plan into two main categories: Ecological, and River viewing.
CREATING A NATIVE PLANT DATABASE
Native plants have a crucial role in the ecosystem as they are suited to the local environmental conditions, promote soil fertility, minimize erosion, and require fewer fertilizers and pesticides compared to non-native plants. Moreover, they support local wildlife such as bees and butterflies, amphibians, reptiles, and mammals, which helps maintain biodiversity.17
90 91
Figure 3.4: James Scott Memorial Fountain
Certain institutions and organizations in Michigan offer a robust vegetation database, which can greatly assist in the selection of native plant species for Belle Isle. The Natural Area Preservation (NAP) in Ann Arbor provides lists of native vegetation for Southeast Michigan. These lists include a variety of trees, shrubs, and herbaceous plants that are native to the region and are important for preserving the biodiversity and ecological health of the area. The tree list includes species such as the sugar maple, red oak, and white pine, which are common in Southeast Michigan. The shrub list includes species such as the common elderberry, hazelnut, and highbush blueberry, while the herbaceous list includes species such as the wild columbine, Virginia bluebells, and wild ginger.18
The Michigan Native Plants Database, maintained by The Native Plant Nursery LLC, is
an online resource that provides information about the various native plant species found in Michigan. The database contains information on over 1,600 species of plants native to Michigan, including their common and scientific names, bloom time, and the types of soils and light conditions in which they thrive. This database also provides information about the ecological benefits of native plants, including their ability to support pollinators such as bees and butterflies, and their role in preventing erosion, improving soil health, and providing habitat for wildlife. In addition, the database offers advice on how to incorporate native plants into landscaping projects and includes a section on plants that are particularly well-suited for rain gardens and other types of water-conserving landscapes.19
Another Michigan firm involved with native landscaping is Designs By Nature, LLC which is a fully licensed greenhouse in Laingsburg Michigan, established in 1997 and grows only native plants of Michigan Genotypes. It has a database for wildflowers which gives important information for setting pollinator areas.
Through the integration of various sources and the creation of a local plant database, the DNR can acquire valuable resources to aid in the selection, procurement, and cultivation of plants. These resources will also prove useful during the subsequent implementation processes.
ECOLOGICAL METHODS & ALTERNATIVES
The ecological aspect of the plan involves the maintenance and restoration of natural areas for wild species, and sustainable alternatives for lawns.
Royal Oak City, and Appleton participating. The purpose of this campaign is to pause mowing during the month of May, allowing flowers to bloom in lawns. By partnering with the Parks for Pollinators BioBlitz program, the National Recreation and Park Association has engaged numerous parks in the important work of educating their communities and advancing pollinator protection strategies across the country.20 The program uses Geographic Information System (GIS) analysis to select specific sites and implement regulations for mowing and maintaining the protected areas.21 A recent study showed that these steps can benefit bees, butterflies, grasshoppers, and other insects.22
Less intense mowing practices lead to fewer pests and potential cost savings for park managers. Our team encourages Belle Isle to join the No Mow May campaign and
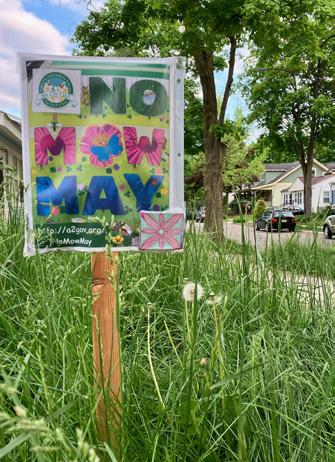
create small-scale pollinator areas (1,000 sq ft - 1 acre) which are not heavily used by visitors (see Figure 3.6). One consideration for mowing is to avoid cutting more than 1/3 of the grass blade at a time in a single mowing.23 And in the summer, moving the blade height to between two and four inches will provide the best results.24
Rain Gardens
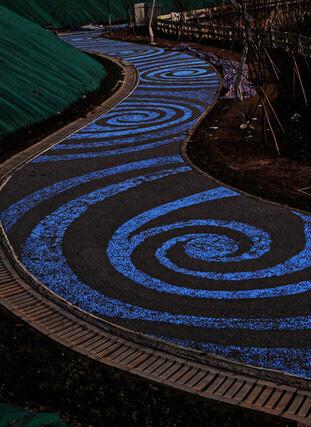
Furthermore, as a more long-lasting method of native plant preservation than No Mow May, installing a rain garden is one of the easiest and most cost-effective methods. (see Figure 3.7) It helps filter and absorb stormwater into groundwater resources while providing beauty and wildlife habitats in small spaces. Rain gardens can vary in size depending on the site conditions, the amount of runoff that needs to be managed, and the desired aesthetic qualities. When creating a native rain garden, it’s important to consider the local environment and include trees, shrubs, and herbaceous perennials that are adapted to the area. Typically, a rain garden ranges from 300 to 1000 square feet in a park and costs $7 to $25 per square foot.25
A key point of installing a rain garden is to consider the bloom time and what native plants look like in different seasons. Native plants provide year-round beauty, so all the parts of plants such as stems, leaves, flowers, fruits, etc., can produce a unique and beautiful landscape in each season. Belle Isle State Park can achieve durability and diversity in rain garden landscapes by mixing plants from different seasons. (see Figure 3.8) Especially in the winter, use a variety of hardy, native vegetation to ensure success of new planting areas.
Urban Gardening and Urban Farming Opportunities
May is a campaign that has rapidly gained popularity in the United States since 2020, with many cities such as Ann Arbor,
Urban gardens with edible landscapes can enable children and people to provide their own healthy, fresh, locally grown produce.
92 92 93
Figure 3.5: “Starpath” employing luminescent materials
No Mow May No Mow
Figure 3.6: No Mow May, Ann Arbor, Michigan
Numerous instances of flourishing urban gardens in urban areas exist, wherein significant turf areas and unused surfaces were transformed into more lively green spaces.
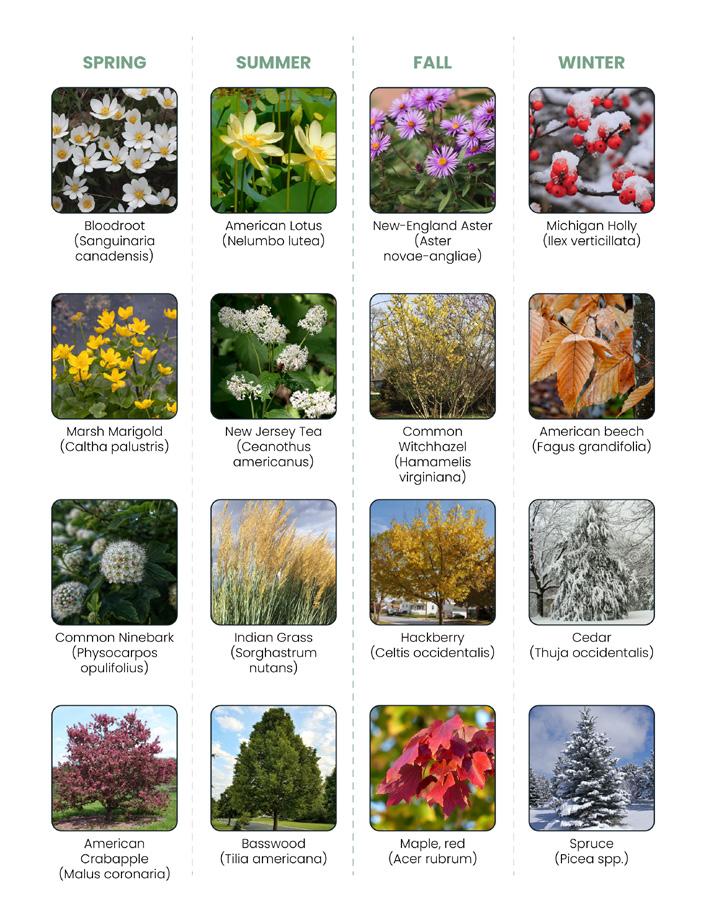

For instance, a Michigan based organization involved with turf lawn conversion is the Michigan Urban Farming Initiative (MUFI). MUFI focuses on promoting sustainable agriculture and food security in urban areas.26 The organization operates a threeacre urban farm in the city’s North End neighborhood, which is used for growing a variety of crops, including vegetables, fruits, and herbs. Beginning in 2011, MUFI’s 100,000 volunteers have cultivated and provided more than 50,000 pounds of organic produce to over 2,000 households living within a 2-square mile area, without charging any fees to the recipients.27 In addition to producing food, MUFI also serves as a community hub for education and outreach on sustainable agriculture and healthy
eating. The organization also offers a variety of programs and workshops for community members, including technical training, workshops, and children’s playground.
To give another example, Cuyahoga Valley National Park, about 20 miles south of Cleveland, is the only national park to lease land to farmers.28 The farmers must follow local, state and federal regulations to make sure sustainable farming.29 The urban farming program is good to maintain healthy soil and minimize environmental impact by using sustainable methods like rainwater harvesting and companion planting. And it increases access to fresh produce, improves food security and gives opportunities for community members to come together, and work collaboratively. What’s more, in 2022, Pittsburgh City Councilman Anthony Coghill converted an unused field in Brookline Memorial Park into a city-run urban farm, which grows food to be donated to local food banks and distributed to residents.30
94 94 95
Figure 3.7: Rain Gardens can provide habitats for Belle Isle fauna, increasing biodiversity
Figure 3.8: Seasonal plantings enhance variety & aesthetic appeal of Rain Gardens
While there may not be a concrete case study or established effectiveness of programs involving urban farming in national parks in Michigan, our team recommends that the DNR explore this concept as a part of a sustainable alternative, based on an analysis of the benefits and case studies of urban agriculture. The DNR can consider implementing an urban farming program in the future if it meets regulatory requirements to give a space for social gathering and food security.
Using Online Platforms for Habitat Protection
Educating the public about the benefits of native plants, the importance of preserving biodiversity, and the impact of human activities on the environment can go a long way in fostering a culture of sustainability. For example, the Cornell Labs Yardmap project and Hummingbirds at Home program both focus on habitat improvement for birds. They enlists people to take photos and log observations of hummingbirds and other birds on flowers to view and share habitat improvements.31
The team recommends that DNR develop a program for pollinator protection and habitat for native fauna. For instance, during the NO Mow May period, the park can host an event about taking and posting photos of native wildlife. This event can help the park staff collect wildlife data and increase the public awareness of habitat protection. Besides, involving the community in the planning, design, and maintenance of vegetation projects can also create a sense of ownership and pride in local green spaces, ultimately leading to greater success and longevity of the initiatives.
recommended implementations be located only in select areas. For example, converting some turf lawn near the paddock area to bioswales to better accommodate storm water infiltration might be an appropriate location. (see Figure 3.9)
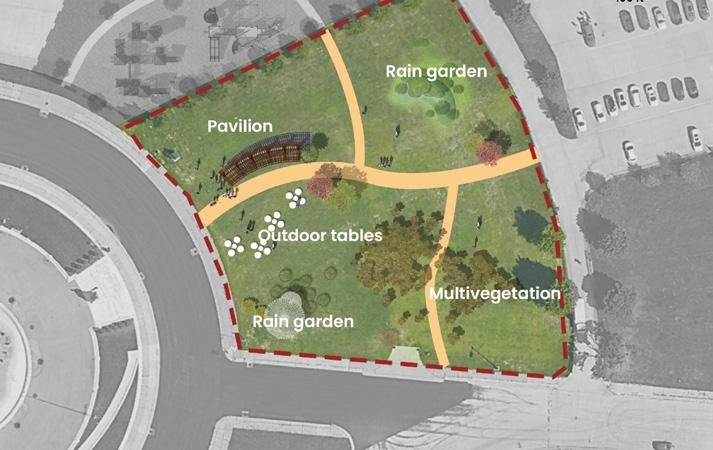
of alternatives, and several site-specific implementation possibilities.
GENERAL BIOLOGY
Department of Natural Resources a degree of control over where Belle Isle’s geese congregate and reside.
Meanwhile, the team has recommended some sites that can be used to install rain gardens, create pollinator areas, build riverfront landscapes, and host events through research. Since converting turf grass can have significant costs up front, the team
Due to the public desire for riverfront scenery, the vegetation plan for the riverbank area should focus more on grasses and shrubs that maintain views of the water. In general, low-lying shrubs and grasses are often preferred for river viewing areas, as they allow for an unobstructed view of the river. American white waterlily and water smartweed are both good alternatives to the free-floating invasive plants, while many emergent plants which have roots instead of floating along the surface, like pickerelweed and blue flag iris, also add diversity to the waterfront scenery.32 Many visitors on the island like sitting and looking at the water, so based on site conditions and shoreline protection(discussed in the following section), the Park can place benches and plant trees to provide shade. (see Figure 3.10)
2.3 Goose Population Control
RIVER VIEWING CONCEPT INTRODUCTION
Nesting in urban areas for over 50 years, Canada Geese (Branta canadensis) have made their homes in countless parks, golf courses, and landscaped urban areas across the United States. With more than 9.92 million birds nationwide,33 the threat of conflict between geese and humans is significant, necessitating an increased emphasis on sustainable goose management.34 Limiting goose habitat can both restrict population growth on the island and reduce contention between geese and park visitors, leading to better park experiences. This section discusses the general biology of Branta Canadensis, common nonlethal methods used to deter them, the political implications
While constantly feeding, Canada Geese are scrupulous grazers, only consuming plants (or parts of plants) high in protein, such as grass shoots, and seed heads, as well as various aquatic plants.35 Selectivity in feeding peaks from early spring to late summer, a period of significant note due to its connotations with peak visitation at Belle Isle. Spring also coincides with their breeding season, as nest construction and egg laying begin around late March. Like their feeding tendencies, Geese are also discriminatory when it comes to nesting, preferring islands, inlets, and other geographies surrounded-by or adjacent-to water.36 This selectivity can be seen largely as an opportunity, as planting more desirable vegetation near natural nesting areas and in locations less-needed for human use can potentially give the
Like all waterfowl, Canada Geese are subject to natural predation from a variety of species, each of which finds a niche at different stages of the bird’s life cycle. Due to the determined nesting behavior of geese – which sees an increase in defense intensity by both the mother and the father as incubation draws to a close37 – unhatched young tend to be relatively safe. As a result, the highest vulnerability occurs during the first 70 days after goslings hatch. During this period, individuals are unable to fly, notably weak, and dependent on their parents for protection. This results in predation from a wide array of species including foxes, hawks, raccoons, and coyotes – all of which are present year-round on Belle Isle.38 While studies have shown that as much as 95% of all gosling mortality is due to
96 96 97
Figure 3.9: Turf Lawn near the Paddock transformed into a Rain Garden with amenities
predation, average survival rates among the young remain above 90%.39 This means park managers cannot realistically rely upon natural predators as a form of goose population control. Instead, DNR must look to implement a coordinated series of nonlethal methods to create an effective and sustainable goose management program at the park.
POTENTIAL NONLETHAL CONTROL METHODS
Developed by the Jack H. Berryman Institute for Wildlife Damage Management and the International Association of Fish and Wildlife Agencies, the existing toolbox for goose management is both diverse and scalable. Among the list of proven methods include the elimination of food handouts, exclusion, landscape modification, removal/relocation, frightening devices, hazing, and repellants.40 Exclusion and landscape modification are explored below, as they represent the most effective options available to DNR. It
must be noted that lethal methods such as hunting, egg destruction, and euthanasia (during molt, when geese are flightless) have also been employed, but are highly contentious politically and should be avoided when possible. In the case of Belle Isle, such avoidance is quite feasible, as the large island provides enough real estate for a symbiotic association between geese and park visitors. The following section illustrates ways in which the Department of Natural Resources can employ plantings, infrastructure, and deterrents to foster such a relationship.
EXCLUSION
One of the most effective methods employed in goose management is the practice of landscape modification. The technique “deters geese from sites by restricting their ability to move between water and land without flying, reducing the nutritional value of forageable land, and making the site

appear unsafe.”41 Adequately addressing each of these tenets is crucial, as a site must be made unattractive on multiple fronts in order to properly deter waterfowl. Due to Belle Isle’s proximity to other large urban areas, emphasizing “unattractiveness” promises to have a significant impact on goose population, as many birds will likely opt for more-preferable areas.
Among the most successful landscape modification tactics available to DNR is the concept of exclusion, which uses physical environmental alterations to restrict ease of movement between water and land.42 Geese exhibit natural tendencies towards areas where connected land-water access is readily available for several reasons. First and foremost, such habitats provide the waterfowl with ease of escape in instances of predation, as the birds tend to view bodies of water as a low-exertion, highly successful getaway option.43 This notion of exertion also applies to feeding, as geese must forage
more after flight due to the increased caloric demands that the activity requires.44 Because of this, they will opt for “safe” (e.g. areas with a seamless barrier between water & land) feeding areas whenever possible. Finally, water serves as a vital resource in the nesting process, as females prefer to nest on islands, muskrat houses, or platforms surrounded by water and adjacent to food.45 By constructing barriers between provision and protection, DNR can influence where gaggles choose to congregate, manufacturing a healthy separation between the birds and park visitors.
There are numerous infrastructural possibilities available to the Department of Natural Resources when it comes to fabricating exclusionary habitats on Belle Isle. Considering the emphasis on aesthetics and natural environment restoration on the island, solutions must flow seamlessly into the landscape. For major bodies of water such as the large pond adjacent to the James Scott Memorial Fountain and northern portions of Lake Tacoma, a layered approach is preferable. This starts with placing a short fence (1-2 feet high) in the water and surrounding it with emergent aquatic vegetation. (see Figure 3.13)46 Many native plant species can be utilized for this function, including Narrow-Leaved Reedgrass, Jointed Twig Rush, and Hardstem Bulrush.47 Implementing a variety of plantings in a stratified fashion will not only conceal the fence, but it will also obstruct a goose’s preferred sightline of 30 feet, making the pond/lake feel unsafe and less desirable.48 A subsequent layer of exclusion should be fabricated on land adjacent to the body of water via the planting of thick shrubs or hedges.49 Just as is the case with aquatic plantings, use of native species is crucial and can be achieved through hearty shrubs such as Upland Switchgrass, Porcupine Grass, Dogwood Shrub, and Spicebush.50 These tall plantings serve as great hiding spots for predators and further limit goose visibility,
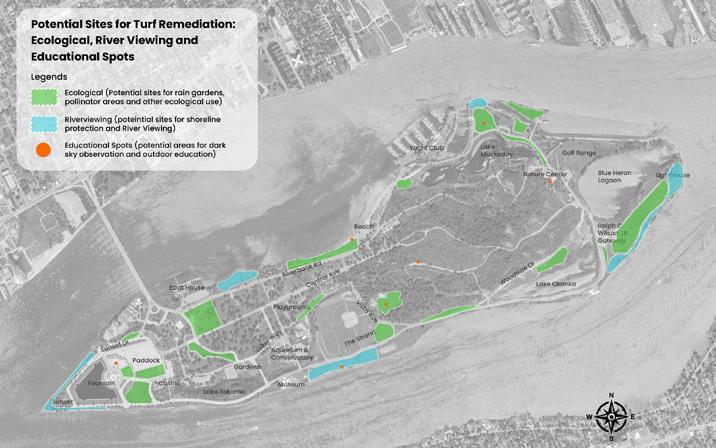
98 98 99
Figure 3.10: Potential Locations for Turf Remediation
Figure 3.11: Geese near the Paddock
making foraging in the area more dangerous. With both “provision” and “protection” areas carrying greater risk, geese will opt for safer locations if they are available. This, the third and final layer of the exclusion approach, is known as the concept of “tolerance zones.” The purpose of these environments is to ensure the success of site aversion by providing geese with undisturbed, preferable, and safe forage.51 Tolerance zones should be implemented in areas underutilized by park visitors, thereby preventing goose-visitor conflict. A visualization showing a potential distribution layout of exclusion & tolerance zones at Belle Isle is shown below. (see Figure 3.12)
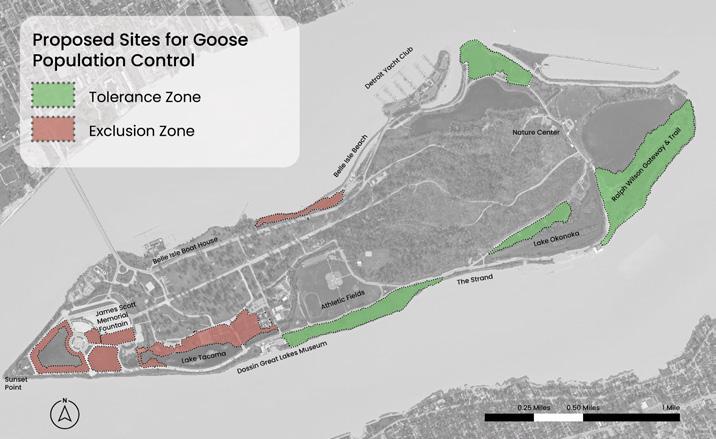
Another important component of landscape modification in the goose management context is turf remediation. Urban geese obtain much of their sustenance from the consumption of grasses and are quite
selective regarding what species they will eat.52 Given this, the alteration of turf type, height, and fertilization can have a major impact on feeding interest, especially when good alternatives are available. In exclusion zones, a major emphasis should be placed on mowing and trimming grass as infrequently as possible, as geese prefer young shoots for their high nutritional value and ease of digestion.53 When grasses are at least six inches high, it becomes difficult for the waterfowl to access these shoots. Palatability – the degree to which lawns are sought out by geese as a preferred feeding option – should also be addressed, both via fertilization restrictions and ground cover modifications. Turf grasses containing endophytes represent one of the best options for DNR, as they contain bittertasting alkaloids which deter consumption by geese.54 While there has been expressed concern over the use of tall fescue, other endophytic grasses exist, such as fine fescue and ryegrass.55 These turf types can be
further bolstered by other unpalatable native ground cover, including Pennsylvania Sedge, Wintergreen, and Wild Ginger. Implementing these ground covers alongside traditional turfs, shade trees, and shrubs will enhance the aesthetic appeal of Belle Isle’s lawns, reduce the amount of turf remediation needed, and create spaces of poor palatability.

For optimal implementation, turf remediation must be conducted in a place-based manner with exclusion and tolerance zones receiving different treatments. In exclusion zones, unpalatable grasses and groundcovers should be planted, both in prairie and balanced landscape formats. Fertilization (due to its adding of nutrients and thus consumption value to plants) must be kept to a minimum, as well as mowing. Trees should also be prioritized in these areas, as geese require a low flight angle of roughly 13O and will avoid areas preventing easy
takeoffs.56 To ensure the success of exclusion zones, tolerance zones should be designed to attract geese in all possible formats. Space design should include the planting of Kentucky Bluegrass (a favorite food amongst Canadian Geese), regular mowing, removal/ restriction of tall shrubbery/trees, and optimizing ease of transport between water and land.57 A sample ideation utilizing these concepts is shown below. (see Figure 3.14)
FRIGHTENING, HAZING, & HABITUATION
While impactful, landscape modification on its own will not suffice as a long-term goose management technique due to the notion of habituation. Geese are highly intelligent animals and quickly adapt to methods used to control them, especially those used repeatedly. Because of this, a suite of frightening/deterrent techniques should be implemented in exclusion zones. Below is a list of proven approaches provided by The Humane Society of the United States:58
100 101
Figure 3.12: Designated Tolerance & Exclusion Zones on Belle Isle
FURTHER LANDSCAPE MODIFICATION TENETS
Figure 3.13: Mirror Lake at The Ohio State University is a great example of Exclusion in action
List of Possible Hazing Techniques:
• Radio-Controlled Boats
• Recordings of Canada Goose Distress Calls
• Scare Dogs
• Canine Effigies (Coyote, Wolf, Dog Cutouts/3D Models)
• Lasers Pointers Specifically-Designed to Deter Geese
• Methyl Anthranilate (Repellant Dispersed as Fog)
2.4 Best Practices in Shoreline Protection INTRODUCTION
Optimized coastal risk reduction typically includes both natural and structural remediation techniques, with infrastructure intensity determined based on the reach, resilience, and fetch of a shoreline.59 To better understand these terms, definitions from the National Oceanic & Atmospheric Administration (NOAA) are provided…60
Reach – “A longshore segment of a shoreline were influences and impacts, such as wind direction, wave energy, and littoral transport (movement of noncohesive sediment such as sand) mutually interact.
Resilience – “The ability to avoid, minimize, withstand, and recover from the effects of adversity, whether natural or manmade, under all circumstances of use.” In the shoreline context, this applies to engineered, ecological, and communitybased defense measures.
Fetch – “A cross-shore distance along open water over which wind blows to generate waves. For any given shore, there may be several fetch distances depending on predominant wind direction.”
Utilizing software from the Czech firm Windy, project collaborators studied the above factors to determine case studies most relevant to Belle Isle.61 In regard to wind, Belle Isle is characterized by working winds from the North, East, and West, with westerlies being the most common.62 These winds are gusty yet mild, as speeds tend to hover between 9 and 20 miles per hour (60% of winds recorded in 2022 were between 9-13mph).63 Relative to oceanic coastlines, waves are a non-issue, as the island experiences flat water conditions. Chop waters only arise in instances of strong gusts (27+ mph), which only comprised ~5% of recorded gales on the island in 2022.64 Considering the typical direction and speed of wind & wave, fetch tends to be strongest at the island’s western tip but can fluctuate due to the area’s variable wind direction.
Belle Isle is already well protected from wavebased erosion through strategic placement of revetments, sills, and breakwaters along its shores. Located primarily on the western tip and southern edge of the island, revetments (see figure -R-) are comprised of stone rubble and concrete blocks, fortifying shores from the threats of waves & erosion.65 Requiring little maintenance and featuring an indefinite lifespan,66 this type of “gray” infrastructure promises to protect Belle Isle for years to come. Due to the strait connecting the Detroit River with Lake Okonoka, the island also employs a series of breakwaters in its shoreline protection suite. These offshore structures break waves and stabilize wetlands, protecting the calm water conditions on the lake.67 Much like revetments, breakwaters are economical in shallow waters, enabling DNR to properly maintain them as a sustainable shoreline protection measure.68 Due to moderate wave conditions, “green techniques” known as sills are employed in various spots across the rest of the island, including the eastern tip

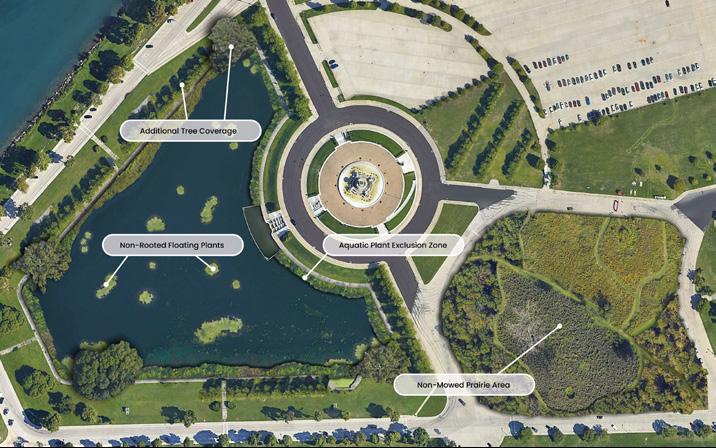
and southern shore adjacent to the athletic fields. Utilizing a combination of sand, stone, and vegetation, sills provide habitat and ecosystem services while simultaneously dissipating wave energy.69
CASE STUDY - BEAUFORT LIVING SHORELINE
Noting significant erosion along its Beaufort, NC Lab Beach in the late 1990s, NOAA moved to bolster the shoreline’s infrastructural defense mechanisms. Emphasizing the utilization of “green” techniques, the administration decided to construct a marsh using cordgrass (Spartina alterniflora) and oyster sill. Combining organic features with infrastructural capabilities, the oyster sill was found to be preferable to the oftenused granite alternative, as it created a valuable fishery and bird habitat while also dissipating wave energy.70 Due to the living nature of the sill, water quality also improved, as the oysters removed nitrogen & phosphorous from the bay surrounding Pivers
103 102
Figure 3.14: Exclusionary infrastructure applied to the Paddock Pond
& INFRASTRUCTURE
CURRENT CONDITIONS
Figure 3.15: Breakwaters near South Pier
Island.71 Studying erosion trends following shoreline reconstruction in 2000, NOAA noted numerous successes. The marsh performed significantly better in storm conditions when compared to “gray” infrastructure such as bulkheads, completely eliminating lawn erosion.72 In regard to cost, the oyster sill proved to maintain itself, acting as a living shoreline and growing in size over the 10-year study period.73 As a result of oyster population growth and subsequent sediment accretion, the planted marsh progressed further into the bay, both enhancing habitat opportunities and increasing the depth of the natural erosion barrier.
River National Research Reserve acted, utilizing a partnership with the New York State Office of Parks, Recreation, and Historic Preservation to create lasting infrastructural change. Regrading the shore to a shallow slope (<18O), project collaborators crafted a series of stone terraces planted with native dogwood, pickerelweed, and bulrush along the riverbank.75 These plantings, along with Sycamore trees planted further up shore, reduced erosion via a bolstered root substructure. To create a more resilient water-land interface, small boulders were placed in the intertidal zone, limiting the erosion effectiveness of both wave and ice.76 The project was a resounding success, as the installed slope, rock, and plant features prevent further shoreline erosion adjacent to the boat launch, enabling continued park visitor access to the Hudson River.77
CASE STUDY - CLIMATE READY BOSTON
RECOMMENDATIONS
Enhance the Effectiveness of Existing Sills Through the Utilization of Living Shoreline Principles
Structural case studies from Beaufort, NC and Coxsackie, NY provide DNR with a strong range of ideas to enhance the effectiveness and vitality of sills located across the island and should be implemented. This should include the implementation of oyster sill, which would reduce wave energy while also aiding in the recovery of the freshwater mussel, an endangered mollusk native to the Detroit River.79
Promote Greater Diversity in Plantings on the Island’s Sills
Using the Coxsackie Living Shoreline project as a benchmark, the Department should introduce staggered shorelines in areas of high visibility, including shores south of the athletic fields and just west of the Belle Isle Beach House (see Figure 3.17). Along with enhancing freshwater marsh habitat and erosion defense,81 these affordable improvements will enhance the natural aesthetic for bikers/walkers on the Iron Belle Trail.
Develop a Shoreline Protection Plan
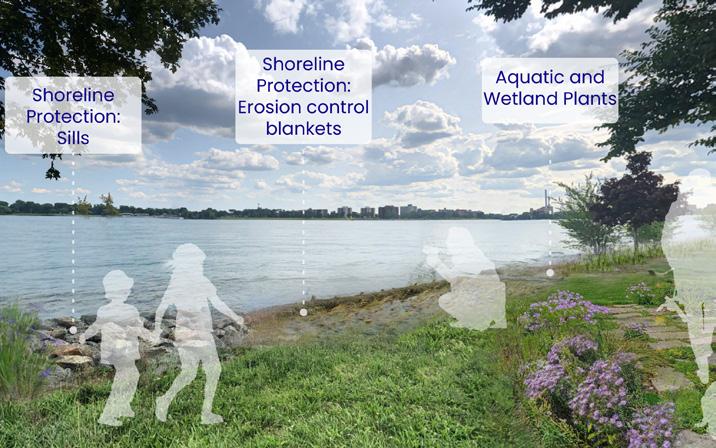
CASE STUDY - COXSACKIE BOAT LAUNCH
Built on a highly erodible historic fill (nonindigenous material placed on a property to raise elevation) along the Hudson River, the Coxsackie State Boat Launch had been susceptible to erosion since its conception.74 In February 2012, the Hudson
In December 2016, the City of Boston mobilized to protect its vulnerable shorelines via modifications in public policy, management practices, and land use regulations. Titled Climate Ready Boston the resultant plan guides future investments in sustainable infrastructure/policy, placing a strong emphasis on place-based solutions. While conducted on a much larger scale than Belle Isle, the document produced by the Massachusetts capital provides DNR with a strong ideation on how to guide shoreline protection investment. Utilizing GIS analysis, Climate Ready Boston studies “Near Term” (2030-2050), “Mid-Term” (2050-2100), and “Later Term (2100 Onward) floodplain progression, showing what percent of specific areas could be inundated by flood waters at various points in the municipality’s future.78 Based on these projections, the plan provides a list of eleven place-based resilience strategies, emphasizing both infrastructural and informal (such as education) methods.
Consistent with the Conservancy’s mission to “protect, preserve, restore, and enhance the natural environment and unique character of Belle Isle,”80 DNR should look to diversify plantings and landscapes at the island’s sills.
Applying lessons from Climate Ready Boston, DNR should begin work on a climate resiliency plan, placing a major emphasis on shoreline resilience. Future floodplain data should be analyzed to determine near-term, mid-term, and long-term threat levels, which in turn can help the Department determine whether enhanced infrastructure will be needed. While “green” infrastructure is optimal now, Belle Isle may need to upgrade in the future.

104 105
Figure 3.16: Revetment at Western Tip of Island
Figure 3.17: Using a variety of sill plantings enhances both aesthetic appeal & erosion resilience
When seeking funding for ecological enhancement projects, our team focused on tree planting and green space initiatives.
First, the Greening of Detroit is a non-profit organization focused on enhancing the quality of life for Detroiters by planting trees, providing job training, and involving youth in the education of the natural environment.
Second, the Michigan Master Gardener Association (MMGA) supports the Michigan State University Extension Master Gardener Program and local communities by promoting horticultural education and gardening techniques. The park can use the MMGA Calendar of Events to post gardening events and activities which may attract experts on gardening stuff.
Third, Wild Ones, a not-for-profit educational organization, offers free, professionally designed native garden templates for multiple regions in the United States. The organization is able to assist the park in constructing rain gardens and bioswales. Fourth, The Michigan Association of Conservation Districts (MACD) is a not-forprofit membership organization that can provide landowners with a wide range of wildlife information, assistance, and program delivery to address wildlife habitat and species management.
The DNR can explore the possibility of forging a long-term partnership with the organizations mentioned above to receive ongoing support in terms of products, personnel, and technical assistance for vegetation planting.
Non-profit groups often find it easier to obtain grants and other funding when there is volunteer support and an educational component included in a proposal. The team suggests that Belle Isle can design some educational programs. For example,
outdoor education classes for students in kindergarten through 6th grade and a limited number of classes for preschool students; local high schools and college students environmental education and service learning classes; undergraduate and graduate students in relevant fields may fulfill academic requirements while facilitating particular restoration projects.
3. TRANSPORTATION MEDIA PLAN
3.1 Media Campaign Basics
Impactful engagement, regardless of sector, focus, or goal, relies on key tenants to effectively reach an audience. As efforts begin to forge a transportation-centric media campaign for Belle Isle, prioritization of such tenants – including reach, frequency,
budget, and goals82 – will be crucial en route to success. Reach and frequency are of significant note, as they largely determine the cost of the campaign. Data collected from the Belle Isle Multimodal Mobility Study shows that a strong majority of park visitors are Detroit residents, meaning the scope can be limited to the city and its surrounding metropolitan area.83 Reach requires a platform, all of which vary in total usage and age distribution. As of 2021, YouTube (81% of Americans), Facebook (69%), and Instagram (40%) are the highest-used apps, serving as the best avenues for advertising and outreach.84 Considering Facebook and YouTube both reach at least 70% of persons in the 18-29, 30-49, and 50-64 age cohorts, they function as the most effective advertising platforms.85 Promotions can be bolstered by additional outreach on Instagram, which is characterized by young users and Facebook ownership, the latter of which would enable a streamlined fee-payment system.86 These payments vary in cost, averaging $0.94 “perclick”/$12.07 per 1,000 impressions (views) and accumulating to upwards of $4,000/ month.87 Because most best-practices utilize proprietary apps and advertising, DNR must be strategic about its budgeting and the amount of advertising it deems practical.
Determining advertising feasibility can be broken into five major steps, often termed the “Media Plan Process.”88 Utilizing this procedure is crucial to strategic use of funding and a successful campaign. Shown below are each of the components:
1. Set Campaign Goals
2. Conduct Market Research
3. Determine Budget
4. Begin Media Campaign
5. Analyze Results, Adjust as Needed
The identification of principal goals is the first step of strong media plan formation. Based on the desire to construct a proprietary transportation app for Belle Isle, advertising strategy should center around driving brand
awareness and increasing social media following, especially on Instagram.89 While the Belle Isle Conservancy currently boasts sixty-four thousand followers on Facebook and twenty-three thousand followers on Instagram (see Figure 3.18), this comprises only 9.4% and 3.7% of Detroit’s population, respectively. Enhancing these numbers will be key to the success of a new media platform for the park, as most visitors surveyed during the Belle Isle Multimodal Mobility Study reported residence in the Detroit Metro Area. To do this, quality market research is required, with key emphases on target audience selection, industry trend analysis, and content type designation.90 With the target audience data provided by the Belle Isle Multimodal Mobility Study and industry trend analysis included in this section, DNR will be equipped to produce/budget a final content plan. Once enacted, the media campaign must be tracked in real-time to ensure strengths are bolstered and weaker portions are revised.91
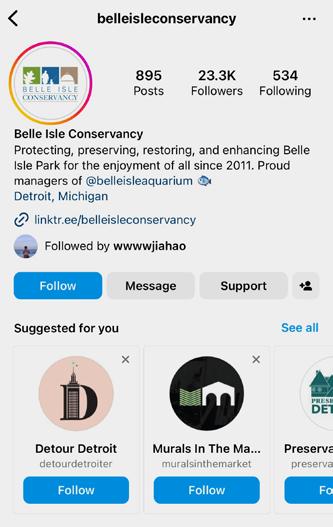
107 106
FUNDING & SUPPORT OPPORTUNITIES
Figure 3.18: Belle Isle’s following on Instagram
“A majority of Belle Isle visitors reside in Detroit, prioritizing the area for media campaign focus.”
A media campaign which successfully markets and encourages shifts in travel habits exists in two arenas – one “within” Belle Isle and one “outside” of it. The latter of these domains involves traditional media methods including advertising, promotions, and crafting of brand image. Examples of these initiatives are plentiful, including MTA’s #TakeTheTrain, #TakeTheBus movement to restore post-pandemic transit usage, San Diego MTS’s “Choose Transit” ridershipincrease strategy, and Mariposa County’s brand-awareness push.92 Learning from these studies will enable DNR to implement a media campaign that best-connects with park visitors.

Originally designed to restore train and bus ridership in the aftermath of COVID-19, MTA’s #TakeTheTrain, #TakeTheBus initiative provides DNR with numerous lessons on how to devise a cost-effective media campaign. When the national COVID shutdown began in March of 2020, New York City and its bustling economy came to a sudden halt.
Subway ridership fell by more than 60%, while commuter rail saw a 90% decrease in its rider base.93 As MTA applied for a $4 billion federal bailout, it began looking to the future, aware that the road to recovery required patience and sound budgeting. From this understanding arose #TakeTheTrain, #TakeTheBus – a strategy focused on posters, wraps, and strong brand recognition. The initiative was centered around four unique yet unified campaigns:
1. “New York is Open” – Designed to sell the alluring parks/spaces accessible to New Yorkers via MTA transit offerings.
2. “Comeback” – A call to all NYC residents to “hop aboard” the legendary city’s comeback story.
3. “Public Transit is Better” – Campaign used to remind riders of the time, climate, and safety benefits of rail & bus.
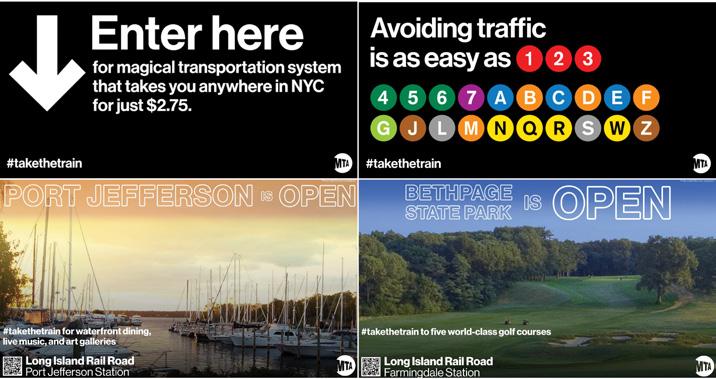
4. “Signs of Affection” – Implements the iconic MTA design standards to encourage residents to return to the subway, a defining characteristic of the New York experience
Posting the graphics across the city and within transit vehicles, MTA aimed to recapture reputation and nostalgia, promoting its services via visual anecdotes. The creation of strong branding has worked for MTA – which has seen ridership climb to nearly 70% of pre-COVID levels as of February 202394 – and promises to work for DNR as well. Using MTA’s strong branding as a model (see Figure 3.19), the Department can work to itemize Belle Isle and its assets, inspiring strong changes in park user behavior.
While traditional posters, billboards, and posted graphics are a staple of any media campaign, internet engagement represents the way of the future. The San Diego Metropolitan Transit System (SDMTS) mobilized this ideal through its Choose Transit campaign, an initiative aimed at encouraging ridership of 18 to 50-yearold nonusers, students, parents, and environmentally-conscious individuals residing near transit lines.95 Utilizing instructional video assets, social media content, and the support of 80 partner organizations such as Caltrans & SANDAG, the agency garnered 250 million paid advertising impressions and 3.5 million earned media impressions.96 Studying its ridership pre- and post-implementation, SDMTS found that the media campaign directly influenced user behavior, as its bus and trolley systems saw 15% and 17% increases in ridership, respectively.97 The agency also used the Choose Transit initiative to reinvigorate its “ride free day,” combining increased publicity with eliminated costs to spur changes in transportation behavior. The exercise was a resounding success, as ridership on the fare-free day exploded by more than 52,000 trips.98 These findings illustrate both the benefits of implementing an internet-based media plan, as well as the importance of partnerships in campaign execution. As such, DNR must look to work with local and regional transportation actors (DDOT, SEMCOG, etc.) as it constructs its engagement strategy,
as doing so will enhance the scope of its project and lead to stronger outcomes (see recommendations).
Although media such as posters and internet content are the tools used to change rider behavior, master plans serve as the bedrock for a successful media campaign. Mariposa County’s Transit Marketing Plan acts as a great resource in this regard, as it provides DNR with strong standards pertaining to plan structure, content, budgeting, and implementation. The document is broken into three primary sections – Introduction, Market Assessment, and Marketing Plan – and is structured using the previously discussed “Media Plan Process,” serving as an example of its implementation. Among the notable content in the plan is the Trip Characteristics subsection, which studies the variables trip purpose, frequency of mode use, and the availability of transit system information to
108 109
3.2 Utilizing Media Outside Belle Isle
Figure 3.19: New York’s MTA utilized physical branding to initiate user behavior in travel habits
Figure 3.20: SDMTS used a unified physical & digital media campaign to increase ridership
guide where enhanced marketing efforts are needed.99 Described in Section 3, the plan’s clearly defined marketing objectives – including the increase of brand awareness and user-friendliness – are of important as well, as they guide the final engagement strategy. Along with content and structure, Mariposa County’s campaign offers great insight into effective budgeting, as the local transportation commission utilizes a “5% of Operating Budget” standard when investing in advertising.100 This is highly relevant to DNR, as it can use the rule to balance funding needs at Belle Isle and to substantiate federal financial support for advanced marketing infrastructure such as app development and social media promotions. Further analysis of its budgeting shows that Mariposa County organizes its investments into a 5-year “Marketing Plan Schedule,” updating/revising its efforts every fiscal year.101 By utilizing this phased approach, the county made better use of its allocated capital, implementing the complete plan over an extended timeframe. Due to the significant costs of an internet-based campaign and to the desire to enhance Belle Isle in other manners simultaneously, this approach is highly relevant to DNR.
Despite its impact on brand awareness, mode choice, and usage habits, traditional advertising can do little to alter behavior once visitors have arrived at the park. For this reason, we recommend that DNR staff consider implementing a tailored engagement strategy for efforts “within” Belle Isle, modeling its efforts based on findings presented by Brown, Kappes, and Marks in their analysis of park user tendencies. In their study, the authors employed the concept of “load-balancing” (the practice of directing variable demand in a closed system) to solve the problem of uneven visitor distribution.102 The premise was that a globally aware system knowledgeable of real-time
crowding, coupled with strong intervention tools, could effectively manipulate crowd flow and distribution. To test the theory, a proprietary app consisting of a central server, control interface, and numerous clients was developed.103 The application featured the following functionalities:
• An interactive map showing an individual’s current location as determined by GPS.
• A listing of attraction wait-times, updated in real time via cellular communication.
• Information and incentives.
Incentives, termed “bonuses” in the app, were
categorized into three types – Informational (e.g., notification of current congestion at a particular attraction), Experiential (e.g., preferred seating at a show/event), and Commercial (e.g., discount on food/ merchandise).104 These incentives were then tested over two study periods, one in the United States (5-day duration, 910 visitor groups) and one in Europe (10-day duration, 1,370 visitor groups) to measure effectiveness.
Findings from the incentive test illustrate the potential of app-based behavior control, as the study found that “incentives pushed to mobile devices can be a valuable crowd mitigation mechanism, with significant crowd movement being easily achieved via cost-effective incentives.”105 Bonuses were highly effective in the pilot, as an average of 1 in every 4 visitor groups responded to any given push impetus. This high rate of incentive redemption benefitted not only those receiving them, but all park users, as better crowd distribution led to decreased congestion and shorter wait times.106 Notably for DNR, the authors found that “a mobile app like the one used in the study can be easily achieved without additional park infrastructure or large capital outlay.”107 Such affordability, combined with the high success rate of the featured bonuses, makes the study a strong model for app development in the Belle Isle context.
3.4 Utilizing Media Inside Belle Isle
Along with enhancing crowd distribution and reducing congestion, well designed apps can facilitate multimobility through information design, furthering DNR’s ability to encourage changes in travel behavior. A strong example of this in practice is Columbus, Ohio’s PIVOT app, which is part of the city’s smart city initiative. Powered by real-time data, the software suggests routes based on schedule, budget, and mode preferences, giving users viable (and often preferable) alternatives to simply traveling by car.108 The application
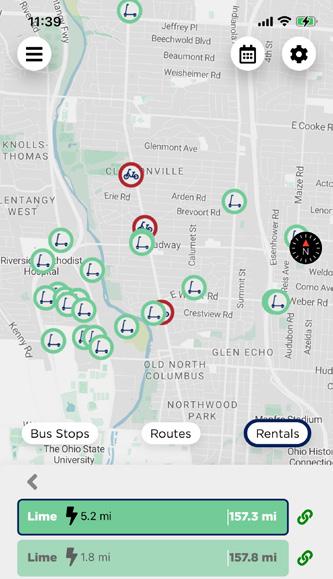
is well-designed and user-friendly via strong aesthetic appeal, simplifying and facilitating the multimodal process (see Figure 3.21). This success comes at a cost, however, as Columbus spent $2.3 million to develop the program.109 This investment was made possible through the United States Department of Transportation’s SMART Grants Program, which provides funding to public sector agencies to conduct projects focused on advancing smart community technologies and transportation efficiency.110 In fiscal year 2022 alone, SMART funded 59 projects in 33 states outlaying $94 million in total financial support.111 While highly selective – only about 15% of proposals are accepted each year – the program represents a strong funding source for DNR as it looks to create a viable transportation and incentive app for Belle Isle. However, without significant outside funding, we don’t recommend the DNR pursue this option due to the high cost.
3.5 Recommendations
Design & Implement a Physical Advertising Campaign
As displayed by MTA’s #TakeTheTrain initiative, there is significant value in strong branding and consistent signage. In talks with Lori Pawlik of Wade Trim, team members discovered that many visitors are currently getting lost on Belle Isle due to a lack of proper wayfinding infrastructure.112 Improving the amount and quality of signage will not only facilitate travel around the island but will also encourage shifts in user behavior. With less well known destinations currently hard to find, many visitors stick to those which they know best.113 Implementing strong signage can change this, enabling visitors to feel more comfortable exploring the island, promoting more sustainable visitation patterns and reducing congestion at specific attractions.
110 111
3.3 Utilizing Media Inside Belle Isle
Figure 3.21: PIVOT shapes travel behavior through information design
Design & Implement a Digital Advertising Campaign
Similar to how the San Diego Metropolitan Transit System (SDMTS) employed a strong social media campaign to increase bus and trolley ridership, Belle Isle can use YouTube, Facebook, and Instagram to promote multimodal access to the island. The SDMTS study proved that social media by itself can be a strong tool in changing behavior without altering transportation offerings,114 meaning that simply encouraging visitors to take transit or bike will undoubtedly lead to a more diversified mode share. However, it must be noted that to create more widespread changes, infrastructural (such as bike lanes leading into the island and park & ride facilities) and service-based (such as more frequent, regular transit service to Belle Isle) improvements will be needed. However, the bridge to Belle Isle limites the ability of DNR to provide these alternative modes of access.
Partner with Local Transportation Entities to Create Complimentary Physical Solutions
Along with advertising, the physical environment can play a role in individual travel behavior.115 Despite how strong DNR’s media campaign may be, a program would benefit from establishing partnerships with regional entities including (but not limited to) the City of Detroit, DDOT, and SEMCOG to construct infrastructural enhancements to its media push. These improvements should be tailored to the message DNR chooses to create and could include…
• Cycling – Working with the City of Detroit & DDOT to designate, fund, and build dedicated bikeable routes from the city to Belle Isle. This should include the construction of bike lanes “offshore” (in Detroit, leading to Belle Isle) and proper wayfinding consistent with branding used for the media plan. It must be noted that while the average cyclist can travel
12 miles per hour, most bike trips (43%) range from 2-5 miles,116 a statistic which can guide infrastructure investment.
• Transit – Conversations with Wade Trim revealed that there is significant stakeholder interest in the implementation of a shuttle originating outside of Belle Isle that stops frequently at destinations across the island.117 Cost is one of the biggest components determining transit ridership,118 so a free shuttle should be prioritized if possible. Shuttle service could be provided via a partnership between DNR & DDOT, similar to how the City of Columbus and COTA utilized the creation of the “Cbus” – a once every 15 minutes shuttle – to enhance tourism in Downtown Columbus.119 However, this type of improvement would likely be quite expensive and therefore may not be particularly feasible from a cost-benefit standpoint.
• Parking – Shuttle ridership could be significantly bolstered via the construction of park & ride facilities in Detroit with shuttle stations. Considering that 67% of patrons currently access Belle Isle by car,120 this likely represents the fastest way to reduce the number of automobiles on the island, as many drivers would embrace not having to wait in the long toll lines.
Recommendation #4 – Create a Belle Isle Smartphone App
Learning from the amusement park study,121 DNR should attempt to create a Belle Isle App which could be used to influence visitor behavior. The app could assist DNR in its goal to change behavior towards sustainability and enhance off-peak visitation by sending incentives to individuals possessing the software. The app should be designed with the same branding standards (color, typeface, etc.) as both the physical and digital campaign in order to become more recognizable and thus more widely used.
Download rate could likely be increased by advertising the app on physical signage (via QR code and logo), social media ads, and on DNR’s website.
4. IMPERVIOUS SURFACE REPURPOSING
4.1 Introduction
Belle Isle has a significant amount of impervious pavement, including the Paddock and some unutilized parking lots on the west side of the park. According to Wade Trim, a Detroit-based engineering consultant firm, the average daily parking occupancy rate in the Paddock in July, 2022 was less than 50 percent.122 The team used ArcGIS to estimate that the Paddock and surrounding parking lots had about 11.7 acres of unutilized impervious surfaces (see Figure 3.25). Additionally, the lack of major attractions and recreational facilities near the area
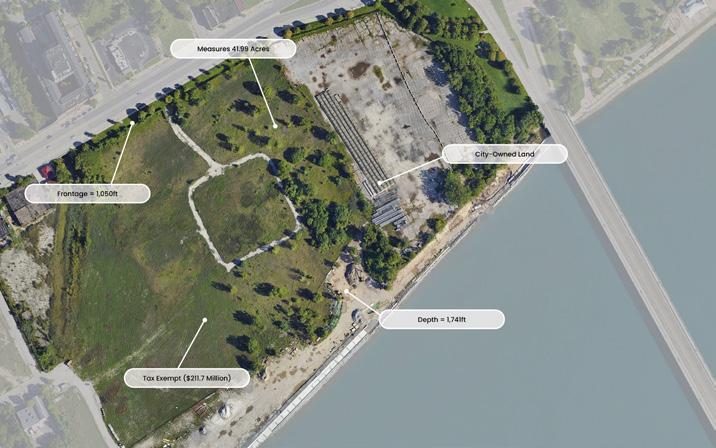
112 113
Figure 3.22: Land West of Gabriel Richard Park could be transformed into a Belle Isle Park & Ride
Figure 3.23: Potential painted traffic playground at the Paddock
makes people hesitant to use the parking lots. Therefore, in this section, the team explored cost-effective ways to transform these parking lots, such as painting, adding playgrounds and food trucks, as well as sustainable methods for placing bioswales to redesign and repurpose these surfaces.
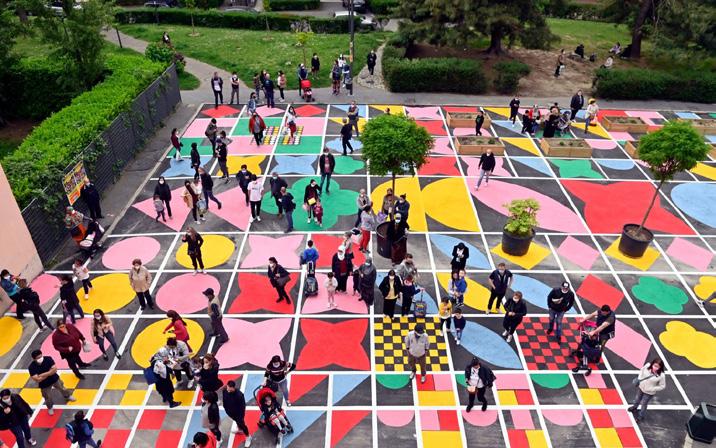
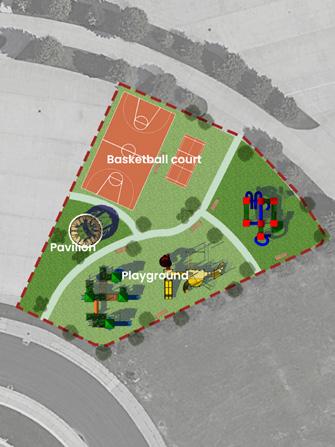
families a fun space to learn rules of the road away from street traffic.124 Simple paint on the vacant parking lot guides children through a range of games, including a “follow me” track, giant Tic-Tac-Toe, “Dot and Boxes,” and hopscotch.125 The program also incorporates educational materials and activities, such as videos, games, and simulations, to further reinforce important traffic safety concepts.
Due to the large size of the unutilized impervious surfaces on Belle Isle, the team recommended that the DNR takes the lowcost approach of painting. For example, Portland Bureau of Transportation (PBOT)’s Safe Routes to School program began installing temporary traffic playgrounds and play spaces in summer 2020.123 (see Figure 3.23) A traffic playground is a small model of a city traffic map roadways painted onto a paved surface in a park, school yard or closed-off street, and it provides children and
Painting on the parking lots is a semipermanent method and needs to be repainted every 1-3 years. Typically, a 4500 square feet project ranges between $500-$1200 in hard costs for paint, painting supplies and food if all of the organizing including program coordination, community engagement and artwork is volunteer labor.126 Not only is it a low-cost method to remodel these spaces, but it also adds a sense of belonging.
Furthermore, graffiti art is a more artistic form of expression that can add a unique and authentic character to parking lots and other impervious surfaces. By incorporating the artist’s vision and creativity, the site can become a canvas for meaningful and impactful artwork which can also contribute to the site’s branding and identity, making it more memorable and appealing to visitors. In addition, the vibrant outdoor space can also serve as a distinctive landmark and guide for visitors, improving their appreciation and navigation of the site.
Typically, an artist from the community volunteers to elicit and then interpret community feedback into a coherent design that successfully depicts the community’s shared sense of place.127 The DNR can partner with museums and companies such as the Detroit Institute of Arts Museum, Dossin Great Lakes Museum, and Ford Motor Company to provide a unique opportunity for artists or residents to paint in the unutilized parking lots. The themes for painting and graffiti art can range from reproductions of existing
art works, highlighting industrial features, portraying visions of the community, and more. The possibilities are endless, and such a collaboration would undoubtedly bring a fresh, creative perspective to the island.128 (see Figure 3.25)
4.3 Event-Based Approaches
COME THRU MARKET
Belle Isle State Park can explore the option of utilizing the Paddock as a temporary location for a farmers market. By developing a place spanning roughly 0.4 acres, the island could provide visitors with a marketplace providing local sellers with a suitable temporary sales venue, while simultaneously offering a diverse range of high-quality and distinct products. For example, The Come Thru Market in Portland, Oregon is a community-focused incubator market that aims to support Black and Indigenous farmers and makers in the area.129 It transformed underutilized parking
lots into vibrant and bustling marketplaces. It is designed to provide a space for these groups to sell their products directly to customers, while also fostering community building and economic empowerment.130 (see Figure 3.26)
POP-UP RETAIL
Pop-up shops are temporary retail stores, designed to be highly experiential, with unique displays, decorations, and interactive elements that help to create a memorable and engaging shopping experience.131 Pop-up shops can be made from shipping containers which can take advantage of underutilized and negative spaces. The team recommended that the DNR collaborate with popular brands, such as SpongeBob, Nike, etc. to establish container pop-up shops at the Paddock, creating a temporary display area. The popularity of these brands could also serve as a draw for people to gather in the space. Additionally, installing a small
114 115
Figure 3.24: More permanent additions can bolster Paddock repurposing
4.2 Painting Parking Lots
Figure 3.25: The Paddock provides a great opportunity to showcase local artists
bandshell with an electrical connection can accommodate bands and other recreational activities to make the space more pleasant. For instance, Piazza Pod Park in Philadelphia is a multi-use park with retail spaces made entirely of shipping containers.132 The well-designed space features a variety of themes, including food and beverage, fashion, art, health, and beauty. As a result, this once dusty parking lot has become an amazing place for dining and recreation in the Northern Liberties neighborhood in Philadelphia, PA. The unique collection revitalizes this area and offers people a new space to experience.133 (see Figure 3.27)
FOOD TRUCKS
Another way to reuse the Paddock and unutilized areas is to place food trucks. Our team recommends that Belle Isle explore the potential of hosting a food truck event in the southern section of the paddock, where there is ample open space for food trucks and
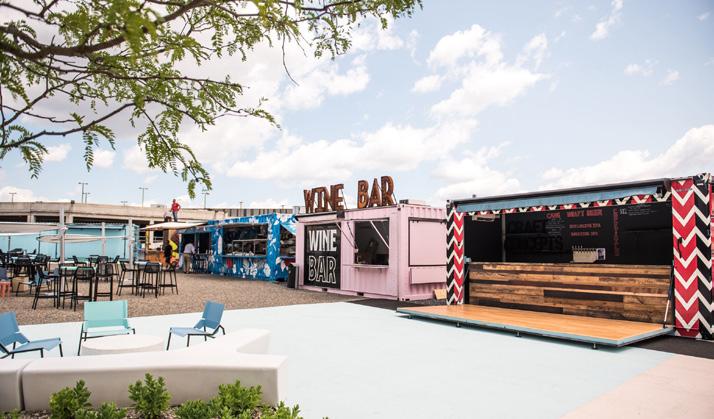
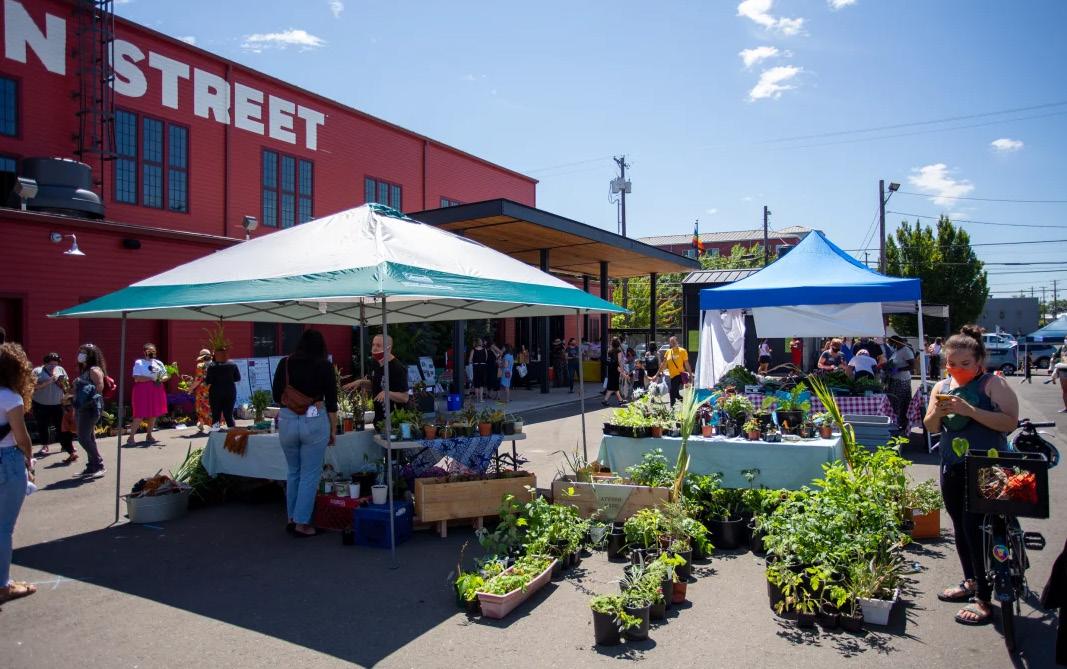
nearby lawns for visitors to enjoy their food. This concept has been successfully executed in the Food Truck Rally event on the island in 2018 and has the potential to attract a large number of visitors.134 Besides, food trucks and vendors are flexible forms which can be found in many areas of the island, so a food truck sign which can be placed in designated areas can provide visitors with a sense of direction and purpose.135
4.4 Building A Playground
A good example of repurposing vacant lots is Arch Street Park, Lawrenceburg, Indiana.(see Figure 3.28) The park covers approximately 1.3 acres and features a variety of amenities and recreational activities, such as an ADA playground, swings and climbing equipment, Shadow Play Tri Runner, Rox All See Saw, Merry Go Round, and Infinity Bowl.136 By laying synthetic turf or other padded surface and installing amenities, the park underwent a remarkable transformation
from a drab and underutilized parking lot into a vibrant and welcoming public space.137 Artificial turf not only replaces the unsightly impervious surface but also provides a more comfortable and attractive surface for children. There are also lawns and native plants on the site. Overall, it is a great playground providing a green space for people of all ages and abilities.
Building a playground like Arch Street Park is an excellent way to repurpose impervious surfaces. To transform an impervious surface into a vibrant community space, the first step is to lay down an artificial synthetic turf instead of high-cost materials. The average installation costs $5,300, and the price per square foot ranges from $5.50 to $19.75.138 Although the initial expense of installing synthetic turf is more than the cost of planting a natural grass lawn, it could be a cost-effective option in the long run because of its lifespan of 10 to 25 years and the absence of lawn upkeep costs.139
Along with this, the park can also include equipment and facilities such as fitness equipment, playgrounds, and other recreational activities for people of all ages. (see Figure 3.29) This not only provides a much-needed space for families to unwind and spend time together but also adds an element of fun and playfulness to the area. Additionally, several benches and shaded areas can be added to encourage visitors to relax and enjoy the scenery. Besides, by partnering with amusement equipment suppliers, such as GameTime Playground supplier, the park may receive additional equipment and financial support.
4.5
Removing large parking lots or installing permeable parking lots can be costly endeavors, which involves several steps such as preliminary assessment, design, excavation, and installation. Given DNR’s cost-saving considerations, the team
116 117
Figure 3.26: “Come Thru Market” can transform the Paddock into a place of community building
Figure 3.27: Piazza Pod Park in Philadelphia, PA transformed shipping containers into a vibrant retail space
Installing Bioswales
suggests focusing on improving the Paddock area, considering providing bioswales along the low-lying areas on the periphery of the Paddock to encourage better infiltration of stormwater. These bioswales should be located in where the direction of stormwater would be flowing off of the concrete surface.140 By planting resilient native vegetation, bioswales eventually require little maintenance and help cleanse the stormwater while adding a touch of visual interest to the parking lot area.141 (see Figure 3.31) In conclusion, the Park can repurpose the Paddock and selected impervious areas by using a mix of options mentioned above. (see Figure 3.30)
5. ATTRACTING USERS DURING OFFPEAK PERIODS
5.1 Introduction
Similar to many other parks, Belle Isle State Park experiences varying levels of user demand throughout different periods of time. To encourage visitors to come to the park during off-peak periods, such as weekdays and the spring and winter seasons,the team
presents two strategies for shifting the flow and attracting more visitors - offering weekday discounts and hosting more events during off-peak periods. It’s worth noting that the success of an event is often determined by the suitability of the venue, and therefore the events discussed in this section are directly related to the previous sections on site renovation and repurposing.
5.2 Applying Discounts
First, to attract more users and encourage them to engage in events or programs during off-peak periods, offering incentives can be a helpful strategy. This could include discounts on admission fees, free services like refreshments or merchandise from food trucks or pop-up shops. Nature Center, Conservatory, Aquarium, Museum can offer a “weekday discount” on general admission tickets if they visit on a weekday rather than on the weekend. For example, Columbus Museum of Art in Ohio also provides an additional incentive to attract visitors during weekdays. They offer discounts on admission fees every Thursday from 5-9 PM, where visitors can purchase general admission and special exhibition tickets for only $5 instead of the regular $18.142 This promotion not only makes the museum more accessible to people who may not have the financial means to visit during regular hours, but also provides an opportunity for those who are busy during the weekends to still enjoy the museum’s exhibitions and events.
Second, the team suggests offering discounts for commercial vehicles during weekdays. This can incentivize businesses to use Belle Isle as a meeting or event space during slower days, while also generating revenue for the park. Also, package discounts for picnics and BBQs can be offered to customers who book a complete package that includes catering, equipment rental, and other services. The Park can offer a 10% discount for customers who book a
complete package for their event during off-peak season. Furthermore, the Park can provide services for hosting birthday parties, and charge lower fees during weekdays compared to weekends. For example, Rapids Water Park is a water park located in Riviera Beach, Florida. This park offers birthday services and packages that include admission tickets, a reserved table, pizza, and soft drinks143 Due to the limited number of party space and a 10% midweek discount, this method diverted some of the weekend visitors into the week144
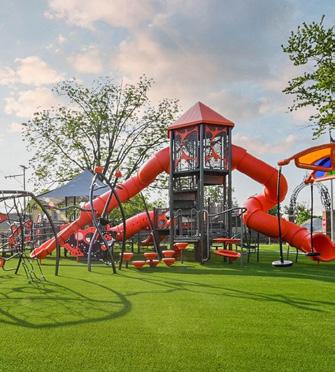
Third, Belle Isle State Park can hold the Peaceful Mornings event during off-peak periods which allows visitors to purchase discounted admission tickets for the early morning hours. For instance, the Museum of Modern Art (MoMA) offers a program called “Quiet Mornings” which is designed to attract visitors during off-peak hours. Visitors can purchase discounted tickets for the
early morning hours on the first Wednesday of every month, which allows them to experience the museum in a calm and peaceful atmosphere before the museum officially opens to the public.145
5.3 Hosting Events During Off-Peak Periods
Placemaking is an approach to planning, designing, building and maintaining public spaces in a way that focuses on the people that use and benefit from the space.146 Belle Isle can hold some weekday-only events and periodic festival during off-peak periods:
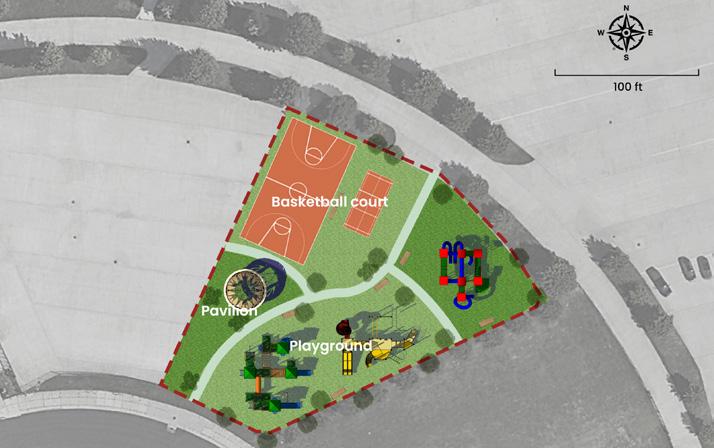
Food Truck Wednesdays
Ann Arbor Restaurant Week is a biannual celebration of local food.147 During Restaurant Week participating restaurants offer fixed price lunches and dinners. Some of the less expensive restaurants offer 2-for-1 pricing.148 Following Ann Arbor’s example, Belle Isle State Park can hold Food Truck
118 119
Figure 3.28: Arch Street Park
Figure 3.29: Playgrounds
act as a cost-effective & popular impervious surface repurposing option
Week in the summertime at the Paddock where food trucks and pop-up shops can give visitors a fixed menu with discounted pricing. Besides, the Park can accommodate summertime bands or DJs during “Food Truck Wednesdays” by using the facilities.
Belle Isle Market Day
Using the previous example of the Come Thru Market, which takes place on the first Monday of every month, the market draws in a large number of people on weekdays by offering locally sourced and seasonal produce that is not typically found in chain supermarkets.149
The team proposed that Belle Isle State Park can host a Belle Isle Market Day on the first Monday of every month to attract sellers and buyers.
Ground Painting Event
Belle Isle State Park can hold art painting events annually to encourage artists and
residents to paint on the Paddock and other vacant parking lots. During the off-peak periods when parking is less occupied, this creates sufficient ground canvas and space for hosting the event.
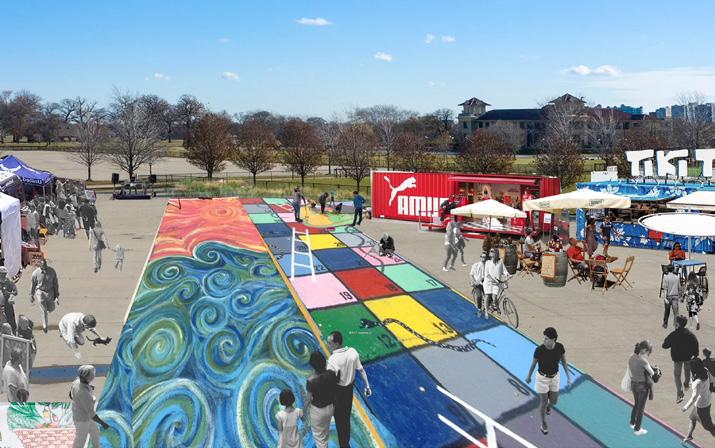
Boulders Art Battle Royal
Strategically placed boulders, which cost between $200 and $400 each, can be used to host a biannual stone painting competition on Belle Isle, encouraging visitors to participate in the creative activity. For instance, the Rockefeller Flag Project is a temporary public art installation that replaces traditional American flags with 193 unique designs created by artists from around the world, aimed at promoting messages of hope, unity, and love.150 The project has the power to attract a large number of visitors during its specific times of the year and also encourage people to reflect on practical problems such as food safety
and climate change. The stone painting theme can revolve around similar topics to the flag project, such as climate, equality, and history.(see figure151 25 Stone -R-) At the same time, it is important to pay attention to the environmental impact and potential harm that airbrushing can cause to rocks and their surroundings.
International Festivals
Chinese Spring Festival (Lion Dance) falls between late January and mid-February; Diwali (the Festival of Lights) falls between mid-October to mid-November.152 As numerous festivals do not coincide with the peak season, the Park can utilize these festivals to promote activities that enhance people’s lives and cultivate a more inclusive environment. For example, Balboa Park in San Diego, California hosts an annual Diwali Mela, which celebrates Diwali. The festival includes Indian music and dance performances, food vendors, and cultural displays.
Fitness Classes
The park can offer mid-week free fitness classes, such as yoga and pilates, to promote healthy living. Many parks in Detroit offer free outdoor classes. For example, in partnership with Sidewalk Detroit, Eliza Howell Park offers a free all-levels Hatha yoga class every Monday through August 30 from 6-7 p.m.153 Another example is Yoga on the Riverfront. Led by Urban Solace studio in partnership with the Detroit River Conservancy, it offers a free yoga class every Friday through August 27 at 10 a.m. The class provides a perfect opportunity to unwind mid-week and prepare for the upcoming weekend.154 (see Figure 3.32)
Educational Events
Hands-on workshops on gardening, farming, birding, painting, etc. Belle Isle can offer free environmental courses to visitors who bike or walk to the island.
Figure 3.31: Bioswales help control stormwater and provide visual interest to parking lots

120 121
Figure 3.30: Rendering displaying a combination of event & painting-based options to repurpose Belle Isle’s Impervious Paddock
In response to the issues raised by the DNR about Belle Isle State Park, the team conducted research using a variety of methods to provide valuable recommendations. The first section, Natural Area Restoration, explores Urban Dark Sky Designations, Turf Remediation, Goose Population Control, and Shoreline Resiliency.
Due to its proximity to the City of Detroit, the team recommends DNR adopt infrastructural and policy changes similar to those utilized from the case study in West Lake, China. By applying comprehensive lighting plans, smart control systems, and educational programs to its existing infrastrucutre, the team believes that DNR can create a harmonious environment benefitting both visitors and the environment.
To enhance biodiversity and aesthetic appeal
at Belle Isle, the team advocates for the implementation of rain gardens, seasonal plantings, and “no-mow” periods. Such Turf Remediation tactics promise to revolutionize island landscapes, enhancing the visitation appeal.
The management of canada goose population remains a challenging issue. This section discusses the general biology of the species, common non-lethal methods used to deter them, and several site-specific implementation possibilities.
Belle Isle is characterized by an uneven distribution of visitors both weekly and monthly. The team researched methods to change patron behavior in its Transportation Media Plan section. Methods that were identified included consistent branding across physical and digital marketing campaigns, the embrace of regional partnerships between DNR & transportation
focused entities to create supportive infrastructure, and the fabrication of a proprietary app for the island. Some tactics are more costly than others, but a phased approach promises to promote sustainable transportation and visitation patterns to and from the island.
Cognizant of the large amounts of underutilized pavement at Belle Isle, the team provides a wide variety of alternatives in its Impervious Surfaces Repurposing section. Both event and place-based methods are identified, including “Painting the Paddock,” “Come Thru Market,” bioswale construction, and playground fabrication. This suite of options enables DNR to make changes based on the funding it has available.
Management of the park during off-peak periods is another significant challenge facing Belle Isle. Employing case studies, the team provides proven methods to DNR,
including International Festivals, Fitness Classes, and Educational Events. Such programming, comnbined with strategic discounts, promises to attract more visitors during weekdays and other less-popular time frames.

By studying case studies and outcomes of various parks and cities, this report discusses the application of sustainable and recreational measures to repurpose impervious surfaces. Furthermore, the team has summarized a series of activities and events suitable for off-peak periods. In conclusion, the proposed goals of enhancing the natural beauty and providing a healthy and sustainable natural environment, building a smooth, safe and diversified transportation system, and creating a more dynamic and creative artificial and cultural space on Belle Isle have been thoroughly explored and analyzed in this section.

122 123
6. CONCLUSION
Figure 3.31: Fitness classes such as outdoor yoga are an effective way of attracting off-peak use
Figure 3.31: International Festivals Such as Lion Dance Celebrate Culture & Attract Visitors
KEY RECOMMENDATIONS
URBAN DARK SKY PLACE TURF REMEDIATION GOOSE CONTROL SHORELINE RESILIENCY TRANSPORTATION MEDIA OFF-PEAK/IMPERVIOUS
• Implement comprehensive lighting plans on Transportation, Buildings, Landscape.
• Consider upgrading smart control systems for lighting infrastructure with a list of lighting contractors.
• Organize educational activities on dark sky protection.

• Create a database of native plants: Grass, shrubs, trees, aquatic and ornamental plants.

• Make a vegetation management plan from two perspectives: Ecological methods, riverviewing concept. The ecological methods include installing rain gardens, no mow may campaign, wildlife platforms and urban agriculture future opportunities.

• The river viewing concept depicts an unobstructed view of the river and some key considerations of riverfront landscaping.
• Designate specific exclusion and tolerance zones across the island
• Utilize a suite of tactics centered around the use of landscape modification and exclusion
• Bolster efforts through the use of frightening devices and hazing
• Enhance the effectiveness of existing sills through the utilization of lizing shoreline principles
• Promote greater diversity in plantings on the island’s sills
• Develop a shoreline protection plan
• Design & implement a physical advertising campaign
• Design & implement a digital advertising campaign
• Partner with local transportation entities to create complimentary physical solutions

• Create a Belle Isle smartphone app
• Low-Cost Method: Painting parking lots - repainted every 1-3 years.
• Temporary Method: Placing food trucks and pop-up shops with amusement equipment.
• Recreational Method: Installing artificial lawns and playgrounds

• Sustainable Method: Implement bioswales which enable the pavement to become natural.
• Host more events in offpeak periods, such as Food Truck Wednesday, Ground Painting Event, Belle Isle Market Day etc.
• Weekday admission discounts, package discounts, and weekday birthday service discounts, etc.

124 125
ENDNOTES
1.) American Association for State and Local History, “Detroit’s Island Jewel: A Tour of Belle Isle Park,” AASLH (blog), accessed April 9, 2023, https://aaslh.org/detroits-island-jewela-tour-of-belle-isle-park/
2.) Detroit Historical Society, “ENCYCLOPEDIA OF DETROIT | Belle Isle Park,” accessed April 3, 2023, https://detroithistorical.org/learn/ encyclopedia-of-detroit/belle-isle-park.
3.) International Dark-Sky Association, “Light Pollution,” accessed April 3, 2023, https:// www.darksky.org/light-pollution/.
4.) UNESCO World Heritage Convention, “Ancient Chinese Cultural Landscape, the West Lake of Hangzhou, Inscribed on UNESCO’s World Heritage List - UNESCO World Heritage Centre,” accessed April 3, 2023, https://whc.unesco.org/en/news/767.
5.) Bureau of Finance, “Visitor flow at major paid attractions in West Lake Scenic Area in November 2020.,” accessed April 3, 2023, http://www.hangzhou.gov.cn/art/2020/12/11/ art_1229063408_3831267.html
6.) Hangzhou News, “Overall Urban Lighting Plan of Hangzhou Main Urban Area,” accessed April 5, 2023, https:// hznews.hangzhou.com.cn/chengshi/ content/2013-03/12/content_4642992.htm
7.) China Environment News, “Hangzhou will draw a black sky reserve,” accessed April 5, 2023, http://env.people.com.cn/n1/2018/0123/ c1010-29780695.html.
8.) Ibid.
9.) Hangzhou Bureau of Planning and Natural Resources, “Hangzhou Urban Lighting Master Plan,” accessed April 5, 2023, http:// ghzy.hangzhou.gov.cn/art/2019/11/22/ art_1228968051_31098.html.
10.) Hangzhou Bureau of Planning and Natural Resources, “Hangzhou Urban Lighting Master Plan,” accessed April 5, 2023, http:// ghzy.hangzhou.gov.cn/art/2019/11/22/
art_1228968051_31098.html.
11.) GovernmentTechnology, “How Smart Lighting Technology Can Provide Valuable Insights—and Cost Savings—to Your Community,” GovTech, June 9, 2021, https:// www.govtech.com/sponsored/how-smartlighting-technology-can-provide-valuableinsights-and-cost-savings-to-yourcommunity.
12.) James Blackman, “The Hard ROI of Smart Street-Lighting – Seven Ways for Cities to Make Their Money Back,” RCR Wireless News (blog), October 16, 2018, https://www. rcrwireless.com/20181016/uncategorized/roiof-smart-street-lighting
13.) International Dark-Sky Association, “Lighting, Crime and Safety,” International Dark-Sky Association, accessed April 10, 2023, https://www.darksky.org/light-pollution/ lighting-crime-and-safety/.
14.) Jun Zhang and Wenhan Dai, “Research on Night Light Comfort of Pedestrian Space in Urban Park,” Computational and Mathematical Methods in Medicine 2021 (December 21, 2021), https://doi.org/10.1155/2021/3130747
15.) International Dark-Sky Association, “Find Dark Sky Friendly Lighting,” International Dark-Sky Association, accessed April 18, 2023, https://www.darksky.org/our-work/lighting/ lighting-for-industry/fsa/fsa-products/
16.)DETROITZOO, “Out of the Shadows: Celebrating International Dark Sky Week ,” Detroit Zoological Society Blog, accessed April 3, 2023, https://detroitzooblog.org/2022/04/19/ out-of-the-shadows-celebratinginternational-dark-sky-week%EF%BF%BC/.
17.) Virginia Department of Conservation and Recreation, “Benefits of Native Plants,” Natural Heritage, accessed April 3, 2023, https://www. dcr.virginia.gov/natural-heritage/benefits
18.) Natural Area Preservation, Ann Arbor, “Native Plants,” accessed April 3, 2023, https://www.a2gov.org/departments/Parks-
Recreation/NAP/Native-Plants/Pages/ NativePlants.aspx.
19.) The Native Plant Nursery LLC, “Michigan Native Plants Database Search,” accessed April 3, 2023, http://www.nativeplant.com/ plants/search/input
20.) Michele White, “Create More Sustainable Parks Through Pollinator and Native Habitat | Open Space | National Recreation and Park Association,” accessed April 14, 2023, https://www.nrpa.org/blog/create-moresustainable-parks-through-pollinator-andnative-habitat/.
21.) National Recreation and Park Association, “Parks and Pollinators: Taking Action and Advancing Sustainability | Best Practice Resources | Publications and Research | NRPA,” accessed April 14, 2023, https:// www.nrpa.org/publications-research/ best-practice-resources/parks-andpollinators-taking-action-and-advancingsustainability/.
22.) Bee City USA, “No Mow May,” April 8, 2021, https://beecityusa.org/no-mow-may/
23.) City of De Pere, “No Mow May,” City of De Pere, Wisconsin, accessed April 14, 2023, http://www.deperewi.gov/topic/subtopic. php?topicid=533&structureid=3.
24.) Bee City USA, “No Mow May,” Bee City USA (blog), April 8, 2021, https://beecityusa.org/ no-mow-may/
25.) Grand Valley State University, “Rain Gardens - Groundswell Stewardship Initiative,” accessed April 18, 2023, https:// www.gvsu.edu/groundswell/rain-gardens-81. htm.
26.) The Michigan Urban Farming Initiative, “All About MUFI,” accessed April 3, 2023, https://www.miufi.org/about.
27.) The Michigan Urban Farming Initiative, “MUFI - Projects,” accessed April 3, 2023, https://www.miufi.org/projects
28.) U.S. National Park Service, “Farming in a National Park - Cuyahoga Valley National Park (U.S. National Park Service),” accessed April 12, 2023, https://www.nps.gov/cuva/ learn/historyculture/farming-in-a-nationalpark.htm
29.) Lucy Sherriff, “Could Farming Secure the Future of America’s National Parks?,” NBC News, January 4, 2020, https://www.nbcnews. com/news/us-news/could-farming-securefuture-america-s-national-parks-n1110361.
30.) Julia Felton, “Portion of Brookline Memorial Park may be converted into urban farm,” TribLIVE.com, November 10, 2022, https://triblive.com/local/portionof-brookline-memorial-park-may-beconverted-into-urban-farm/
31.) U.S. National Park Service, “Bird, Pollinator, & Wildlife Habitat Not Just for National Parks Anymore. (U.S. National Park Service),” accessed April 14, 2023, https://www.nps.gov/ articles/bird-pollinator-wildlife-habitat-notjust-for-national-parks-anymore.htm.
32.) Emma Costantino, “Avoid Buying Invasive Aquatic Plants,” Muskegon River Watershed Assembly, January 22, 2021, https://mrwa.org/ avoid-buying-invasive-aquatic-plants/.
33.) Allen Gosser, Michael Conover, and Terry Messmer, “Managing Problems Caused by Urban Canada Geese” (Logan, Utah: Utah State University, 1997), https:// berrymaninstitute.org/files/publicationdownloads/geese.pdf
34.) Louise Eriksson et al., “The Public and Geese: A Conflict on the Rise?” Human Dimensions of Wildlife 25, no. 5 (April 16, 2020): 421.
35.) Gosser, Conover, and Messmer 1997, 4.
36.) Gosser, Conover, and Messmer 1997, 4.
37.) Jeanne Clermont, Denis Réale, and JeanFrançois Giroux, “Similarity in Nest Defense Intensity in Canada Goose Pairs,” Behavioral Ecology and Sociobiology73, no. 8 (August
2019): 1–9.
38.) Gosser, Conover, and Messmer 1997, 4.
39.) Thomas Fondell et al., “Predators of Dusky Canada Goose Goslings and the Effect of Transmitters on Gosling Survival,” Journal of Field Ornithology 79, no. 4 (December 2008): 399–407.
40.) Gosser, Conover, and Messmer 1997, 5.
41.) Gosser, Conover, and Messmer 1997, 4.
42.) Gosser, Conover, and Messmer 1997, 5.
43.) “Solving Problems with Canada Geese - A Management Plan and Information Guide” Washington, DC: The Humane Society of The United States, accessed March 25, 2023, https://www.humanesociety.org/sites/ default/files/docs/canada-goose-guide.pdf.
44.) Bart Nolet et al., “Scaring Waterfowl as a Management Tool: How Much More Do Geese Forage after Disturbance?,” Journal of Applied Ecology 53 (2016): 1413–21, https://doi. org/10.1111/1365-2664.12698.
45.) Gosser, Conover, and Messmer 1997, 5. 46.) Gosser, Conover, and Messmer 1997, 6. 47.) “Michigan Natural Features Inventory” (Michigan State University), accessed March 26, 2023, https://mnfi.anr.msu.edu/ communities/description/10671/great-lakesmarsh.
48.) “Solving Problems with Canada GeeseA Management Plan and Information Guide” n.d.
49.) Gosser, Conover, and Messmer 1997, 6.
50.) “Michigan Natural Features Inventory” n.d.
51.) “Solving Problems with Canada Geese - A Management Plan and Information Guide” n.d.
52.) James Sedinger and Dennis Raveling, “Dietary Selectivity in Relation to Availability and Quality of Food for Goslings of Cackling Geese,” The Auk 101, no. 2 (April 1984): 295–306.
53.) Gosser, Conover, and Messmer 1997, 6.
54.) Garrett Heineck, “Endophytes: The Friendly Fungi in Turfgrass” (University of Minnesota), accessed March 27, 2023, https:// turf.umn.edu/news/endophytes-friendlyfungi-turfgrass
55.) Heineck n.d.
56.) Gosser, Conover, and Messmer 1997, 7.
57.) Gosser, Conover, and Messmer 1997, 6.
58.) Solving Problems with Canada Geese - A Management Plan and Information Guide” n.d.
59.) “Natural and Structural Measures for Shoreline Stabilization” (US Army Corps of Engineers, February 2015), https://coast.noaa. gov/data/digitalcoast/pdf/living-shoreline. pdf.
60.) “Natural and Structural Measures for Shoreline Stabilization” 2015
61.) “Detroit Wind Forecast” (Windy.App), accessed April 16, 2023, https://windy.app/ forecast2/spot/748067/Belle+Isle
62.) “Detroit Wind Forecast” n.d.
63.) “Detroit Wind Forecast” n.d.
64.) “Detroit Wind Forecast” n.d.
65.) “Natural and Structural Measures for Shoreline Stabilization” 2015
66.) “Natural and Structural Measures for Shoreline Stabilization” 2015
67.) “Natural and Structural Measures for Shoreline Stabilization” 2015
68.) “Natural and Structural Measures for Shoreline Stabilization” 2015
69.) “Natural and Structural Measures for Shoreline Stabilization” 2015
70.) “NOAA’s Pivers Island Living Shoreline Project” (NOAA), accessed April 18, 2023, https://www.habitatblueprint.noaa.gov/ living-shorelines/beaufort/
71.) “NOAA’s Pivers Island Living Shoreline Project” n.d.
72.) “NOAA’s Pivers Island Living Shoreline Project” n.d.
73.) “NOAA’s Pivers Island Living Shoreline Project” n.d.
74.) “NOAA’s Coxsackie State Boat Launch Living Shoreline Project” (NOAA), accessed April 18, 2023, https://www.habitatblueprint. noaa.gov/living-shorelines/coxsackie/.
75.) “NOAA’s Coxsackie State Boat Launch Living Shoreline Project” n.d.
76.) “NOAA’s Coxsackie State Boat Launch Living Shoreline Project” n.d.
77.) “NOAA’s Coxsackie State Boat Launch Living Shoreline Project” n.d.
78.) “Climate Ready Boston” (Boston, MA: City of Boston, December 2016), https:// www.boston.gov/sites/default/files/ file/2023/03/2016_climate_ready_boston_ report.pdf.
79.) John Hartig, “Great Lakes Moment: The Imperiled Mussels of the Detroit River” (Great Lakes Now, July 4, 2022), https://www. greatlakesnow.org/2022/07/great-lakesmoment-mussels-detroit-river/
80.) “Mission & Focus” (Belle Isle Conservancy), accessed April 18, 2023, https://www.belleisleconservancy.org/ mission.
81.) “NOAA’s Coxsackie State Boat Launch Living Shoreline Project” n.d.
82.) Alexander Boyle, “What Is Media Planning and How to Create an Effective Media Plan” (Briefbid), accessed March 8, 2023, https:// briefbid.com/media-insights/what-ismedia-planning-and-how-to-create-aneffective-media-plan/.
83.) Lori Pawlik, Introduction to Belle Isle Multimodal Mobility Study, Zoom, February 24, 2023.
84.) Brooke Auxier and Monica Anderson, “Social Media Use in 2021” (Washington, DC, April 7, 2021), https://www.pewresearch.org/ internet/2021/04/07/social-media-usein-2021/.
85.) Auxier and Anderson 2021
86.) Emily Dopson, “What Facebook Ads
Cost in 2022: Everything You Need to Know” (Shopify, January 20, 2022), https://www. shopify.com/blog/facebook-ads-cost
87.) Dopson 2022
88.) Boyle n.d.
89.) Boyle n.d.
90.) Lori Pawlik, Introduction to Belle Isle Multimodal Mobility Study, Zoom, February 24, 2023.
91.) Boyle n.d.
92.) Boyle n.d.
93.) Vicky Abihsira, “Transit Marketing Campaigns We Love” (Trapeze Group, October 29, 2020), https://www.trapezegroup. com/blog-entry/transit-marketingcampaigns
94.) Christina Goldbaum, “MTA, Citing Huge Drop in Riders, Seeks $4 Billion Virus Bailout,” The New York Times, March 17, 2020, https:// www.nytimes.com/2020/03/17/nyregion/ coronavirus-nyc-subway-federal-aid-.html.
95.) Brad Lander, “Riders Return - As New Yorkers Return to Buses and Subways, Some Pandemic Ridership Trends Are Here to Stay” (New, York, New York, March 16, 2023), https:// comptroller.nyc.gov/reports/riders-return/
96.) Abihsira 2020
97.) Abihsira 2020
98.) Abihsira 2020
99.) Abihsira 2020
100.) “Mariposa County Transit - Transit Marketing Plan” (Mariposa County Local Transportation Commission, May 2010), https://mariposacounty.org/ DocumentCenter/View/40718/DRAFT-2010Mariposa-Transit-Marketing-Study?bidId=.
101.) “Mariposa County Transit - Transit Marketing Plan” 2010
102.) Amber Brown, Jacqueline Kappes, and Joe Marks, “Mitigating Theme Park Crowding with Incentives and Information on Mobile Devices,” Journal of Travel Research 52, no. 4 (July 1, 2013): 426–36.
103.) Brown, Kappes, and Marks 2013
104.) Brown, Kappes, and Marks 2013
105.) Brown, Kappes, and Marks 2013
106.) Brown, Kappes, and Marks 2013
107.) Brown, Kappes, and Marks 2013
108.) “Multi-Modal Trip Planning Application” (SMRT Columbus), accessed April 1, 2023, https://smart.columbus.gov/projects/multimodal-trip-planning-application.
109.) “Multi-Modal Trip Planning Application” n.d.
110.) “Strengthening Mobility and Revolutionizing Transportation (SMART) Grants Program” (U.S. Department of Transportation), accessed April 2, 2023, https://www.transportation.gov/grants/ SMART
111.) “Strengthening Mobility and Revolutionizing Transportation (SMART) Grants Program” n.d.
112.) Lori Pawlik, Introduction to Belle Isle Multimodal Mobility Study, Zoom, February 24, 2023.
113.) Lori Pawlik, Introduction to Belle Isle Multimodal Mobility Study, Zoom, February 24, 2023.
114.) Abihsira 2020
115.) John Forester, Bicycle Transportation: A Handbook for Cycling Transportation Engineers (Cambridge, Massachusetts: MIT Press, 1994), https://ieeexplore-ieee-org. proxy.lib.umich.edu/book/6276864.
116.) Forester 1994
117.) Lori Pawlik, Introduction to Belle Isle Multimodal Mobility Study, Zoom, February 24, 2023.
118.) Jarrett Walker, Human Transit (Washington, DC: Island Press, 2011.
119.) “CBus - Your Downtown Circulator” (Central Ohio Transit Authority), accessed April 18, 2023, https://www.cota.com/services/ cbus/.
120.) Lori Pawlik, Introduction to Belle Isle
Multimodal Mobility Study, Zoom, February 24, 2023.
121.) Brown, Kappes, and Marks 2013
122.) State of Michigan Department of Natural Resources, “Belle Isle Park Multimodal Mobility Study,” accessed March 19, 2023, https://www. michigan.gov/dnr/managing-resources/prd/ bip-study.
123.) Ibid.
124.) City of Portland, “Traffic Playgrounds & Playspaces | Portland.Gov,” accessed April 3, 2023, https://www.portland.gov/ transportation/safe-routes-school/trafficplaygrounds-playspaces.
125.) Wilson Kea, “Five Great Ways to Repurpose Parking Lots During the Pandemic,” July 23, 2020, https://usa. streetsblog.org/2020/07/23/five-great-waysto-repurpose-parking-lots-during-thepandemic/.
126.) The City Repair Project, “Street Painting FAQ — The City Repair Project,” accessed April 3, 2023, https://cityrepair.org/street-paintingfaq
127.) The City Repair Project, “Street Painting FAQ — The City Repair Project,” accessed April 3, 2023, https://cityrepair.org/street-paintingfaq.
128.) Dima Stouhi, “Serena Confalonieri
Transforms Abandoned Parking Lot in Milan into a Graphic Urban Playground,” ArchDaily (blog), August 3, 2021, https://www. archdaily.com/966152/serena-confalonieritransforms-abandoned-parking-lot-inmilan-into-a-graphic-urban-playground.
129.) Come Thru Market, “Come Thru Market,” accessed April 3, 2023, https://www. comethrupdx.org/.
130.) Come Thru Market, “Come Thru Market,” accessed April 3, 2023, https://www. comethrupdx.org/.
131.) Ibid.
132.) Piazza Pod Park, “Piazza,” accessed April 3, 2023, https://piazzapodpark.com/.
133.) Piazza Pod Park, “Piazza,” accessed April 3, 2023, https://piazzapodpark.com/.
134.) “Thousands in Attendance at the ‘Worlds Largest Food Truck Rally’ on Belle Isle,” Text. Article, FOX 2 Detroit (FOX 2 Detroit, November 4, 2018), https://www.fox2detroit.com/news/ thousands-in-attendance-at-the-worldslargest-food-truck-rally-on-belle-isle
135.) “Belle Isle Food Trucks | Home Page,” accessed April 22, 2023, https:// belleislefoodtrucks.com/
136.) Travis Thayer, “City Of Lawrenceburg To Open New Arch Street Park Playground,” accessed April 3, 2023, https://www. eaglecountryonline.com/news/local-news/ city-of-lawrenceburg-to-open-new-archstreet-park-playground/.
137.) City of Lawrenceburg, “Arch Street ParkCity of Lawrenceburg Indiana and Main Street Official Site,” accessed April 3, 2023, https:// www.thinklawrenceburg.com/attractions/ parks/arch-street-park/.
138.) Sinziana Spiridon, “How Much Does Artificial Grass Cost in 2023?,” Lawn Care Blog | Lawn Love, September 20, 2022, https:// lawnlove.com/blog/artificial-grass-cost/.
139.) Ibid.
140.) TRUEGRID Paver, “How Much Do Permeable Pavers Cost?,” TRUEGRID Pavers, October 2, 2021, https://www.truegridpaver. com/pervious-pavers-cost/.
141.) “Filtration Overview,” accessed April 22, 2023, https://www.susdrain.org/deliveringsuds/using-suds/suds-components/ filtration/filtration.html.
142.) Columbus Museum of Art, “Other Ways to Save | Columbus Museum of Art,” accessed April 3, 2023, https://www.columbusmuseum. org/visiting/free-and-discounted-tickets/ other-ways-to-save/
143.) Rapids Water Park, “Birthday Parties | Rapids Water Park,” February 25, 2022, https:// www.rapidswaterpark.com/groups/birthdayparties/.
144.) Ibid.
145.) MoMA, “Quiet Mornings | MoMA,” accessed April 3, 2023, https://www.moma. org/calendar/events/2424.
146.) TN Department of Health, “Placemaking,” accessed April 3, 2023, https://www.tn.gov/ health/cedep/environmental/healthyplaces/healthy-places/land-use/lu/ placemaking.html
147.) Ann Arbor Restaurant Week, “Ann Arbor Restaurant Week,” Ann Arbor Restaurant Week, accessed April 17, 2023, https://www. annarborrestaurantweek.com.
148.) Susan Selasky, “Ann Arbor Restaurant Week Starts Sunday, More than 30 Locations Participating,” Detroit Free Press, accessed April 17, 2023, https://www.freep.com/ story/entertainment/dining/2023/02/04/ ann-arbor-restaurant-week-startssunday/69871623007/.
149.) Victoria, “Come Thru Black and Indigenous Market - Portland Living on the Cheap,” accessed April 3, 2023, https:// portlandlivingonthecheap.com/blackindigenous-market-the-redd/.
150.) “Rockefeller Center’s ‘The Flag Project’ Spreads Hope in NYC | Wallpaper,” accessed April 3, 2023, https://www.wallpaper.com/art/ the-flag-project-rockefeller-center-newyork.
151.) “Campus Rocks,” accessed April 22, 2023, https://www.montclair.edu/centerfor-student-involvement/traditions-events/ campus-rocks/
152.) Steven Tonthat, “Portland Lion Dancers Come Roaring Back for 2022 Lunar New Year - OPB,” accessed April 22, 2023, https://www. opb.org/article/2022/02/04/portland-liondancers-come-roaring-back-for-2022lunar-new-year/.
153.) CHANDRA FLEMING, “Free outdoor yoga and other summer classes in Detroit,” DETOUR (blog), June 23, 2021, https://detourdetroiter. com/free-yoga-detroit-and-other-outdoorexercise-classes/
4 PORCUPINE MOUNTAINS STATE PARK

PROBLEM STATEMENT 1. INTRODUCTION
The Michigan Department of Natural Resources’ (DNR) Parks and Recreation Department (PRD) tasked our team with enhancing the visitation and revenue of Porcupine Mountains Wilderness State Park. Specifically, with an extended summer season, the park wants to understand options for adapting the ski hill for yearround recreational usage. This report builds on previous studies completed within Ontonagon County, including some that focus on increasing tourism in the Western Peninsula, strengthening economic vitality in the region, and increasing recreation opportunities inside Porcupine Mountains. Our team gathered public feedback on current needs of the park, endeavored to understand the approaches of tourism and amenities offered by other state and national parks, and researched how other ski hills are adapting to extended summer seasons. Finally, our team cataloged potential future recreation opportunities, and created recommendations.
Porcupine Mountains is the largest state park in Michigan, spanning roughly 60,000 acres with over 40,000 acres protected by a state wilderness designation.1 The state began forming the park in 1944 with land purchases, which aimed to protect scenic natural areas. The park is open year round, and has drawn in an average of 488,000 visitors annually over the past 5 years. The park boasts over 90 miles of hiking trails, rustic cabins, and the last remaining large stands of virgin hardwood-hemlock forest in the state of Michigan.2 Porcupine Mountains has a rich history of human impact, including: Native American settlements, surface mines, logging crews, European fur trappers, and underground copper mines.3 The Ojibwa people stewarded the land that Porcupine Mountains resides on prior to European settlement. This history is honored in the name of the park, as the Ojibwa people named the area Porcupine Mountains due to the resemblance of the silhouette of the mountains to the distinctive rodent.4
Porcupine Mountains is home to a number of amenities that draw in people from all over the world. In the winter, the park currently offers skiing, snowshoeing, and cross country skiing, as well as private and group lessons for skiing and snowboarding.5 While the roads close in the winter, cross country skis and snowmobiles unlock the many beautiful sites the park offers. In the spring and summer, the park offers fishing, hiking, camping, backpacking, canoeing, kayaking, boating, and paddle boarding.6 With climate change presenting new challenges for park management, Porcupine
1.1 Method
Mountains park staff is seeking to increase the economic vitality of the park by attracting more visitors. The park boasts many popular natural attractions, including the Lake of the Clouds and the scenic Presque Isle River corridor.
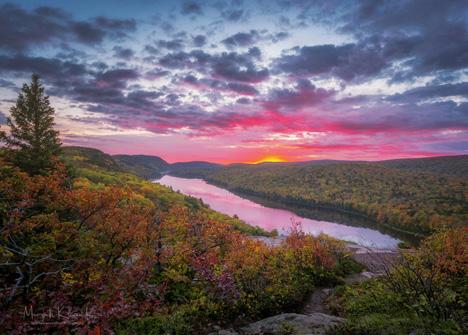
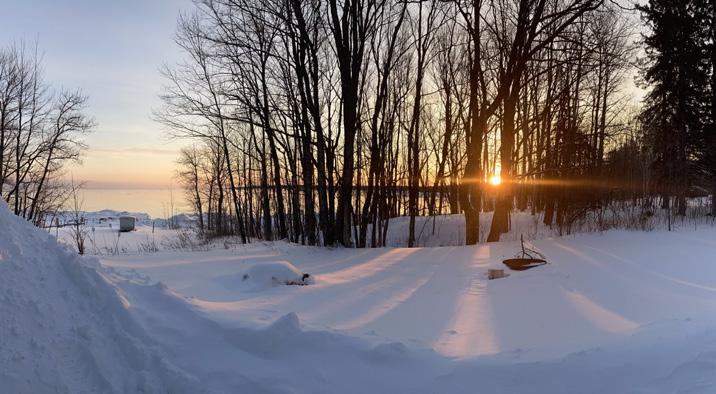
Other attractions include the Summit Peak observation tower, Porcupine Mountains Winter Sport Complex, fall chairlift rides, an 18-hole disc golf course, and more.7 Overall, the park provides opportunities for all to enjoy the wilderness, opportunities for individuals to connect with nature in solitude and in community.
Our team began our project with a client meeting that included Michael Knack, Park Manager, and Doug Rich, DNR Western U.P. District Supervisor, informing our team on the condition of the park and what issues they wanted to explore more in depth. A small group from the capstone class conducted a site visit to Porcupine Mountains in early February and met with Doug and Michael. Our team was given informational brochures, maps, and newsletters, and gained valuable information while touring the ski hill along with a few other areas of Porcupine Mountains.
Following our meeting with park staff, our team read through the 2019 General Management Plan for Porcupine Mountains Wilderness State Park. Afterwards, our team met with University of Michigan library staff and were given leads to begin researching. From these meetings, our team decided that an analysis of climate impacts on the future use of the ski hill would be useful context for long term planning. After conducting this initial evaluation, research was broken down into high and low impact recreation uses that the ski area of Porcupine Mountains could offer.
135 134
Figure 4.1: Site Visit Photo
Figure 4.2: Porcupine Mountains Lake of the Clouds8
PARTNERS INVOLVED
In preparing this report, our team met with many stewards and professionals who work with the Porcupine Mountains. In this section, our conversations with individuals who work at, or on issues closely related to, the Porcupine Mountains. Our primary contacts were with Michael Knack and Doug Rich. During our site visit, they provided significant insight regarding specific issues the Porcupine Mountains face, and what strengths the park offers. They also directed us to the 2019 General Management Plan for Porcupine Mountains, which outlines previous work conducted by Beckett & Raeder regarding stakeholder engagements, park goals and priorities, and general information. Using this document as a roadmap, our team built off of this previous work. Two collective priorities emerged from stakeholder meetings documented in the plan: increasing trail maintenance,
and improving cabins.10 Mountain biking, becoming increasingly popular in the Western Upper Peninsula, could increase the need for trail maintenance. Reorganizing lodging in the park could create avenues for additional revenue, as the current pricing system is outdated. (see Figure 4.3)
While in Winter Sports Complex, the chalet and maintenance building, at Porcupine Mountains, our team came across an online survey (see Figure 4.4) from the University of Michigan’s Economic Growth Institute and the Western U.P. Planning & Development Region (WUPPDR). The survey is collecting data from visitors to the Western Upper Peninsula and has a few questions directly related to Porcupine Mountains. This survey directed us towards Sarah Crane, a research manager at the Economic Growth Institute, Eli McClain, a research assistant at the Economic
Growth Institute, and Jerald Wuorenmaa, the Executive Director of the WUPPDR. As this research is actively ongoing, the results of this survey will not be available until next year, however, these results may assist in future planning endeavors and would be good for staff at Porcupine Mountains to review. Our team suggests contacting Sarah Crane or Jerald Wuorenmaa with regards to the survey results. A few other people that our team contacted through the course of this project included Joshua Scott, associated with the local visitors bureau, Elissa Buck, DNR Commercial Services, Chuck Allen, DNR Department Analyst, and Sally Berman, president of Friends of the Porkies.
PUBLIC ENGAGEMENT
During our site visit to the Porcupine Mountains, our team conducted a public engagement survey with visitors at the Winter Sports Complex. From conversations with over twenty groups, our team gained a better understanding of the various backgrounds and interests of visitors. Most visitors had heard of Porcupine Mountains through word of mouth, and a few were lifelong visitors. When asked about the biggest barrier to visiting the park, the most popular responses were the remoteness of the park and availability of lodging. The visitors emphasized that they loved the wilderness aesthetic of Porcupine Mountains and that adding more shopping or food options might erode that value. When speaking to visitors, they were in general agreement that the park was incredibly family friendly. We observed many groups of friends, and families enjoying the snowy slopes together during our visit.
When asked about what improvement or extra amenities the park could offer, visitors had a lot of ideas. A popular suggestion was to bring back a second chair lift. There had been a second chair lift which was disassembled after failing an inspection. This chair lift had given more access to the western side of the ski area. Another suggestion was to include a tubing hill for small children as an additional family friendly option to offer in the winter. Mountain biking was suggested by a handful of visitors for summer recreation, as was the establishment of a small coffee and beer bar. Overall, visitors were very pleased with the park’s current state and seemed excited at the prospect of additional amenities.
136 137
Figure 4.3: Management Zones of the Porcupine Mountains Wilderness State Park9
23 MANAGEMENT ZONES Miles LakeSuperior LakeoftheClouds Mirror Lake
Figure 4.4: Surprise Survey
Grand Portage State Park are the only ones that do not offer options for camping on site.
2. CHALLENGES
In order to develop successful recommendations for economic development, it is important to understand the operations of competing parks to assess if current Porcupine Mountains operations and facilities are strong enough to draw individuals to the park, instead of to other parks. Our team looked at Isle Royale National Park, Pictured Rocks National Lakeshore, Apostle Islands National Lakeshore, Keweenaw National Historical Park, Grand Portage State Park, and Voyageurs National Park. These parks had been identified by Porcupine Mountains park staff as the regional competitors. This section will explore seasons of operation, amenities and activities, as well as internet and social media visibility across all federal facilities.
Of the six federal parks evaluated, three are located in the state of Michigan, two are
located in Minnesota, and one is located in Wisconsin. The parks vary in size from as small as 278 acres to as large as 218,200 acres in size. Four out of the six parks operate year round, with Isle Royale and Keweenaw Historical Park closing for the winter season.12 13 In 2021, the parks ranged in annual visitors with a high of 1.3 million visitors at Pictured Rocks, to a low of 12,457 at Keweenaw Historical Park.14 The subsections below summarize the different attractions, lodging and amenities, and social media tactics being used to draw in visitors – in order to provide a more in-depth look at the approaches different parks take.
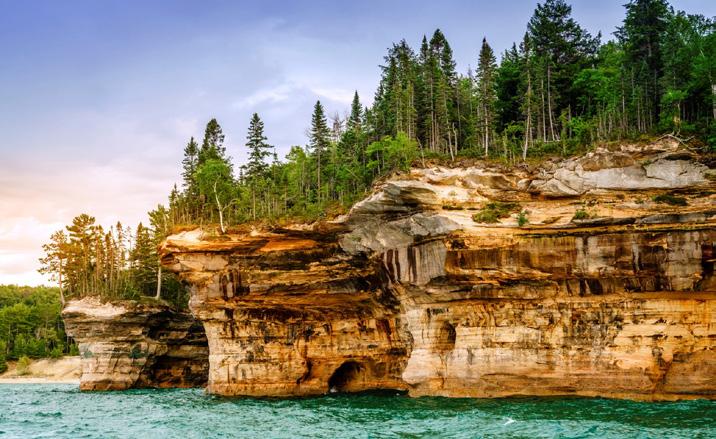
2.2 Overnight Accommodations
Isle Royale and Voyageurs National Parks are the only two parks that provide lodging on park property, with other parks instead offering links to lodging information through their visitors bureau website. Of all the parks analyzed, Keweenaw Historical Park and
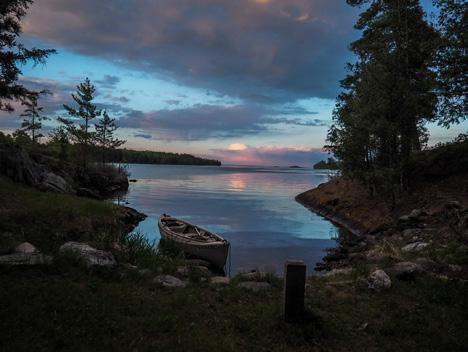
Isle Royale offers four options for individuals considering extending their stay overnight.15 There is the option to backpack, which includes hiking or paddling to a new campground each day. Visitors also have the option to set up a basecamp for the duration of their stay, so they can return to the same location at the end of each night. They also have the unique option to dock their boat and set up camp nearby. Most of these outdoor options are provided on a seasonal basis, as well as a first-come, first-served basis for parties under six. Isle Royale offers lodging at the Rock Harbor Lodge complex, which has sixty available lodge rooms
which accommodate up to four guests and have a view of the lake. They also have twenty duplex cottages which accommodate six people and offer a private bath as well as a kitchenette. The Rock Harbor Lodge has options of dining at either the hall or a local grill.16
Voyageurs National Park offers lodging options through their Kettle Falls Hotel, which is open seasonally from May through September. They have three options for booking – Villa Rates, Hotel Rates, and Rentals. Non-kitchen rooms that sleep 2-4 people can be rented for $210 nightly, kitchen rooms that sleep 2-4 people can be booked for $260 nightly, and suites which sleep up to 8 people can be booked for $390 nightly. Hotel rooms can be rented as doubles or singles.
2.3 Online Presence
Of the parks analyzed, websites are either operated on the National Parks Websites or on respective States’ websites – never by the individual park management. None of the parks host individual websites on their own, although the national parks websites have a standard layout that is much more user friendly, offering tabs that help users navigate the website which aids in the experience of planning a trip out to the parks (see Figure 4.7). The State of Michigan parks website has a single page listing the amenities of the Porcupine Mountains. The layout of the websites operated by the state of Michigan provides brief information about the park, a slideshow of a few scenic pictures, a list of the activities and facilities in text, and an option to make a reservation. The reservations are exclusively for camping or day use for Porcupine Mountains, though there is a lodging tab for other parks. This page does not include the ability to make reservations for any of the park’s amenities; these are available only through the website of the concessionaire provider – Simple Adventures – a link to which is not directly provided on the state parks website. You can click a link to the winter sports complex, which navigates you to an
139 138
Figure 4.5: Pictured Rocks National Lakeshore, Munising, MI11
2.1 Competition
Figure 4.6: Voyagers National Park
external site that gives you more relevant planning details. Through that link you get to another website, which is also operated by the state, illustrating how to plan a trip in the winter months (so far no similar feature exists for the summer). Although there is a link to their concessionaire provided on this second website.
For the websites of the nearby national parks, the landing page offers various links to images across the park, but also offers three distinct tabs to explore information about the park: Plan Your Visit, Information About the Park, and Get Involved. The “Plan Your Visit” tab includes 11 sub-tabs that offer potential visitors the opportunity to plan a trip either based on season, basic information (fees, passes, and other relevant information),
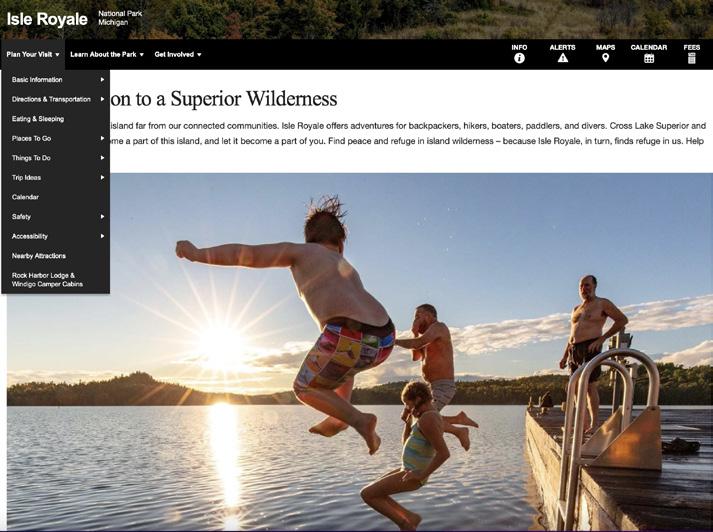
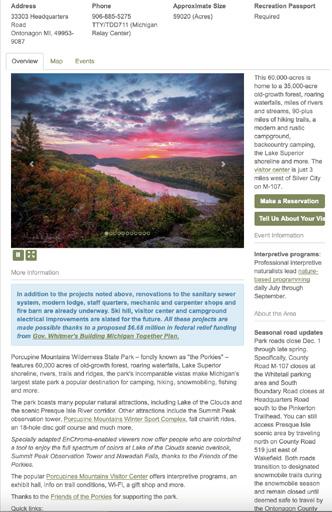
transportation, eating and sleeping options, things to do, etc (see Figure 4.8). The choice to cluster these tabs so that website visitors can easily skim to find pertinent information makes the website much more easily accessible.
While looking at information available across the different parks, the most stark difference was in social media presence. Most, if not all, of the parks our team analyzed had official social media pages with significant follower counts and consistent posting. Across the parks our team explored, all of the parks have either an official Instagram page or an official Facebook page – and most of the parks observed have both. For the average across the five parks with active Instagram accounts, there is an average of 40,000 followers per park. Across the five parks that have active Facebook accounts, there is an average of 55,000 followers per park with a low of 16,000 and a high of 105,900 followers.
Social media usage by both park staff and
visitors can be a useful tool for management, marketing, and visitor safety in many parks and protected areas. This is due to the fact that many of the platforms are openly available, can be used free of charge, and offer consistent data streams. According to park management professionals we spoke with, collecting data in the Upper Peninsula poses a number of logistical challenges. Typical data collection methods can be both costly and labor intensive, but social media has shown to be a promising tool for big data collection. Increased online visibility through social media is also correlated with increased visitors and park popularity, so social media expansion may be a useful tool to attract visitors, collect data, and understand user trends at the parks.17
140 141
Figure 4.7: Porcupine Mountains Website
Figure 4.8: Porcupine Mountains Amenities List
Figure 4.9: Isle Royale Dropdown on Website
3. REGIONAL SKI HILL OPERATIONS
Private ski hills in the area provide a unique perspective for understanding current offerings across ski hills. By seeing what private hills are doing we can assess what is viable for the recreational market. Our team looked at Mount Bohemia, Snowriver, Ski Brule, and Mount Zion; these hills were identified by Porcupine Mountains staff as regional resorts worth noting. Specific operational and monetary information was not collected and noted to be “notoriously difficult to acquire” by other academic papers focusing on ski resorts.18
Mount Bohemia is mostly focused on expert level skiers as a market, so their experience offers a fully packaged resort experience with a spa, bars, restaurants, and retreats.19 There are no summer recreational activities described on their website aside from resort style offerings. Snowriver offers lodging and food for the visitors to their ski hill, but there is also no mention of summer recreation to be found on their website.20
Ski Brule has night skiing and terrain parks (rails, boxes, and jumps) to bring more skiers to their hill during the season. They are able to ensure a more stable season by using snow guns when possible. In the summer, the resort offers lodging and has skeet shooting as well as canoe rental.21
Mount Zion at Gogebic Community College offers tubing and cross country skiing in the winter in addition to their ski hill,22 and they also host a disc golf green in the summer. All the ski hills seem to offer some form of variety in the winter, while the larger resorts have the amenities, like restaurants and lodges, to keep guests around. However, the summer season lacks recreational activities throughout the region. This offers the Porcupine Mountains a chance to differentiate themselves within the market by offering recreation during summer months which no nearby ski hills have been able to provide.23
4. SNOW LOSS LITERATURE REVIEW
As Porcupine Mountains looks to increase the usability of their recreational area, our team focused on future trends in skiing, with an eye toward climate change that will affect snowy seasons. Snowfall patterns are becoming less reliable, and without snowmaking equipment the winter sports complex at Porcupine Mountains is especially vulnerable. From a literature review conducted by our team, we have identified a number of factors that the Porcupine Mountains staff should consider when investing in the ski hill. Despite discrete ski resort operations data being “notoriously difficult to acquire” our team found predictions for ski season changes and information about what some resorts have done to mitigate the impacts of a less profitable skiing season.
While it is generally accepted that climate change is occurring, the local impacts on weather and seasons is hard to precisely predict, this research provides an overview of generally anticipated trends. The Intergovernmental Panel on Climate Change (IPCC) defines vulnerability as “the degree to which a system is susceptible to, or unable to cope with, the adverse effects of climate change, including climate variability and extremes.” Ski resorts fit this definition well, their operations are dependent on a favorable climate.25 The ski season, and in turn profitability of a ski operation, is highly dependent on the snow of each season.26 Within the last 20 years, snowfall has become increasingly unreliable.27 Many scientific models estimate that ski resorts around the world will have less snow on average and that the ski-able season will become significantly shorter, these trends have already begun and are predicted to worsen.28
When it does snow, the variability of weather during the same time period may result
in more rain-on-snow scenarios, which diminish the possible benefits from new snow significantly.29 Atmospheric models predict that the first frost will continue to be later in the year each season and that opening dates will follow. Within the next few decades Michigan ski hills may only be able to open for the season past the new year, missing out on any November and December visitors.30 This poses a serious risk to remote ski hills since the traditional holiday season, late December to early January, can account for nearly one fifth of total lift tickets.31 With a later start, the pressure is on to make up the revenue during the operating days, despite likely lower attendance. Predictions for Midwestern ski operations estimate a season anywhere from 30-60% shorter in length by 2050 than what is currently operating.32 33
4.1 Expand Snowmaking
One method resorts have taken in order to combat the decreasing snowfall is to expand snowmaking operations. Once viewed as an extra cushion or luxury for resorts, snowmaking is now increasingly crucial to make ski operations be able to stay open.34 While rather expensive, many resorts see snowmaking as the only way to ensure the slopes have enough snow to be safe for skiers. However, even with snowmaking equipment, resorts may have less total snow than years past. Snow guns need appropriate temperatures to create snow. As winters get warmer, the efficiency of snow making will likely decrease. Low lying elevation ski areas are likely to have winter days where they are not able to make their own snow even through artificial methods.35 Some of the climate models included the ability to make artificial snow at the resorts, and these resorts still had shortened seasons in future.36 37 As the winters get warmer and greener, more snowmaking is required to deliver a shorter season.
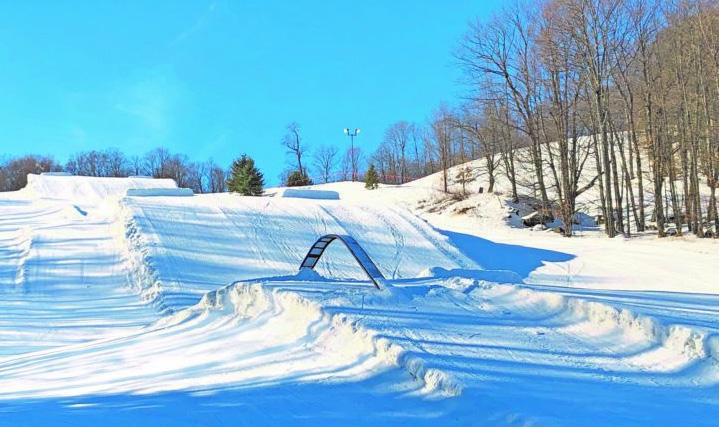
142 143
Figure 4.10: Ski Brule Terrain Park24
The ski hill at Porcupine Mountains has relied on natural snow for its lifetime, and installing snow making equipment can be a big financial burden. The costs of a snow making system depends on a number of factors, such as labor for construction and installation, weather during operation, and the cost of water and electricity for operation. Estimates vary widely, as few private resorts disclose their finances, but to cover one acre of ski hill with one foot of snow, the costs can be estimated around $1,200.38,39 In order to cover 45 acres of skiable and groomable hillside, the park may need to spend over $50,000 a year. The infrastructure required along with the operational energy makes the process expensive.40 Operating costs of snowmaking systems are expected to increase 60%, on average, between 2021 and 2050.41 With waning ski seasons, the payback period for such an investment is much less reliable, making a sound financial model very difficult to create.
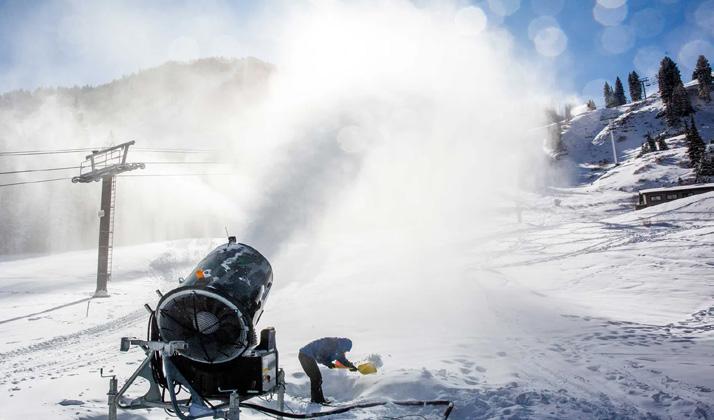
There are a few other methods that resorts have employed to keep snow around as long as possible, such as shading ski trails to reduce melting, adding reflective material on top of snowpacks, or even hauling snow in from nearby locations.42 While all these methods aim to preserve as much snow, and skiing, as possible, the most popular adaptation is diversification away from snow based activities. Diversifying options by increasing the variety of attractions offered year round.
4.2 Rebranding Ski Resorts
Resorts throughout the world have recently been rebranding from ski resorts to outdoor recreation resorts. In the winter some places have expanded their offerings to include tubing, ice skating, more rentals, lessons, terrain parks, expanded lodging, and food.44 45 46 Multiple economic analysis reports recommend that ski resorts become all-season venues.47 While skiing can still be a primary reason for many people to
visit, guests are made aware of the extra features the park has to offer.48 Many of the resorts analyzed have expanded into summer activities including mountain biking, hiking, and guided nature activities.49 Luckily, Porcupine Mountains is already a wonderful summer destination, so expanding recreational activities at the ski area will simply increase the options. Many large resorts have adapted their slopes into activity parks that include climbing walls, alpine slide, zipline, even waterparks.50,51,52 These more intense uses require significant investments, but they also allow for the possibility for yearround use. It is important for these resorts to offer something that is not nearby, ensuring they don’t create too much competition for their investments, so unique experiences are likely to be most profitable.53 Converting resorts into year-round destinations makes them more economically viable for a future where skiing is not able to be profitable every year.
4.3 Partnering Resorts
Beyond diversifying the resort offerings, many ski resorts have been joining forces. As local snowfall becomes less reliable, resorts across the world have entered into partnerships to mitigate a bad season. These partnerships include agreements between resorts to share ticket revenue and ticket availability. Epic, a popular pass, gives access to 63 resorts worldwide, and the revenue from these ticket sales is divided among the resorts included with the pass.54 A season with poor snowfall and poor ticket sales can lead to a resort struggling to recover for many years,55 so resorts have come together into partnerships to reduce the risk that a bad season could compromise the financial stability of the resort.56 In these deals, there is typically a portion of revenue from each resort that is shared with the other resorts, as expanding skiers’ access to wider regions gives a higher likelihood that the skiing is favorable somewhere in the system.57
Conglomerated resorts have shown to be more economically profitable than resorts that operate independently.58 In order for Porcupine Mountains to benefit from this aspect of the industry, further research is needed into the type of ticket deals that the park could make with other ski resorts.
Aside from large partnerships of resorts forming, large lone resorts stand to continue operating longer term than smaller resorts.59 The largest ski resorts are more capable of investing in themselves and able to adapt to new needs relatively quickly.60 As a result, the larger resorts with more financial cushion are more likely to survive bad seasons.61 This has been shown with many smaller ski resorts closing due to lack of investment. However, the closure of smaller resorts in the region could push more skiers to the ones that remain open.62 If this were a large enough trend, the open resorts could see a temporary increase in ticket sales at resorts that remain open. Eventually though, total regional ticket sales are expected to shrink as ski seasons become shorter.
4.4 Key Takeaways
Climate for skiing is becoming less reliable for a ski operation like Porcupine Mountains. Snowmaking is a temporary solution that may be prohibitively expensive, and may not be worthwhile in the long run. The possible skiing season at Porcupine Mountains is likely to start later in the year and be less reliable through the winter months, and shorter seasons are quite likely. In order to continue attracting visitors to the Porcupine Mountains area, the Park could diversify their winter and summer activity offerings to become a recreational destination year round. However, working alone is increasingly challenging and entering into a regional, or even national, deal with other ski resort operations could help balance revenue and possibly attract new customers. Having a larger financial base will allow Porcupine Mountains more flexibility to adapt to the fluctuating winters.
144 145
Figure 4.11: Snowmaking Machines43
*
CATALOGING AND RECOMMENDING AMENITIES
This section will examine potential amenities and attractions that Porcupine Mountains could integrate into current park plans to better increase visitation to the parks. Our investigation coincided with a turning point for park policy and natural features protections. Since the annual summer season is lengthening, more visitors are coming to the park, leading to increased need for and difficulty in park maintenance. The number of visitors reached 310,000 in 2016, when registration was first required for backcountry
campers, and rose fairly steadily to nearly 600,000 in 2020 despite a three-month closure of the campgrounds and cabin rentals that year. The visitor number was nearly as high in 2021 but declined to near the 2019 level in 2022 (430,000 visitors)63
This is most likely because during the height of COVID-19 pandemic, visitors could go outside and visit nature safely as long as they kept their distance from one another. It is important to note that our recommendations pertain specifically to the recreation area of the park. This is because most of Porcupine Mountains falls under a wilderness designation and is, therefore prohibited by law from establishing any type of modern recreational infrastructure. The only development that can occur within the state park is within the recreation area64
This section will pull in information from general studies that examined mountain biking tourism, as well as the suggestions offered by the International Mountain Biking Association (IMBA) specially for Porcupine Mountains. First, we’ll provide a brief overview of mountain biking, an attraction that could pull in a large number of visitors during the off-season of the ski hill. Next, our team examined potential shifts of the pricing of cabins currently offered by Porcupine Mountains.
Following this section, the report discusses the potential for expanding the bunny hill to include snow tubing. Additionally, we contacted multiple DNR staff about the possibility of expanding concessions. Finally, we explored the idea of having a private developer build a wilderness outdoor activity/ attraction. Our team’s research, public engagement, and discussions with Porcupine Mountains staff generated recommendations and action plans of relatively inexpensive ways to bring in more revenue to the recreational area of the park.
5.1 Mountain Biking
Mountain Biking is becoming increasingly popular as a recreational activity nationally in the United States. Its popularity has grown exponentially in states with expansive natural land, like Utah, California, and Colorado. There are perhaps many reasons for this – some of it is due to the natural topography of these areas – but these areas also have a great ability to market and make destinations that revolve around mountain biking. An example of a mountain biking destination in Oregon is the City of Oakridge, which has
had a substantial increase in the number of mountain bike visitors over the last five yearhs. These visitors
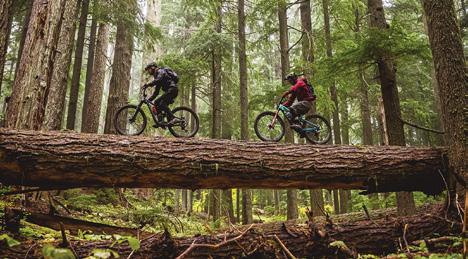
provide a needed boost to the city’s economy, which was historically based in natural resource extraction.65
Another example is the village of East Burke, Vermont which was struggling with its loss of traditional industry in the region and struggles with economic stagnation and population loss, similar to Ontonagon. During this time period, Kingdom Trails Association was formed – a non-profit organization which has created a mountain biking network across 97 private properties. The Kingdom Trails Association has created over a hundred miles of hiking trails, leading to an exponential increase in visitors (up to 137,000) and income (estimated to be around $10 million annually) for the village of East Burke.67
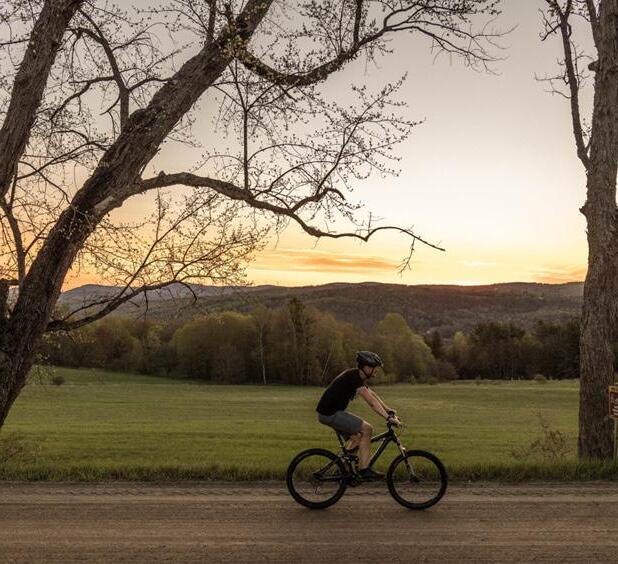
147 146 5.
Year Average Visitors 2014 145,758 2015 178,01 2016 310,581* 2017 346,541 2018 450,059 2019 414,485 2020 586,555** 2021 555,522 2022 434,688
Table 4.1: Average Visitors to Porcupine Mountains From 2014 Onwards
Data provided by Michael Knack, Manager of the Porcupine Mountains Wilderness State Park.
In 2016 the park required all back country campers to register and made the sites reservable hence the major increase.
** In 2020 the park lost 3 months of campsite and cabin rentals due to coronavirus.
Figure 4.12: Oakridge Backcountry Biking66
Figure 4.13: Mountain Biking in East Burke68
This has helped revive the region economically and has helped make it a thriving tourist destination. An example closer to home, within the state of Michigan, is Copper Harbor, approximately 2 hours away from Porcupine Mountains. Copper Harbor, which used to be known for its copper extraction, is now nationally known for its well regarded mountain biking trails. A grassroots mountain biking community has developed one of the nation’s top trial systems, earning an International Mountain Biking Association (IMBA) designation, and is just a stone’s throw away from Porcupine Mountains.71
The International Mountain Biking Association prepared a proposal for Porcupine Mountains in 2015, detailing what biking opportunities could be offered at the recreational area, particularly at and around the ski hill. The report provides guidance for the Michigan DNR, Friends of the Porkies, Nonesuch Mountain Bike Club, and Soke Trails. These stakeholders expressed interest in the development of a sustainable, destination-quality mountain bike trail system that would meet the needs of residents and bolster the outdoor recreation-based economy in and around Michigan’s Porcupine Mountains Wilderness State Park.69 Stakeholders indicated that multiple opportunities exist
for bike trails within the park such as the existing facilities, surrounding passionate community, and positive annual revenue for Porcupine Mountains Wilderness State Park. The IMBA highlighted
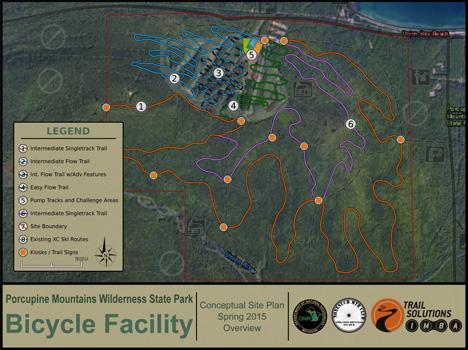
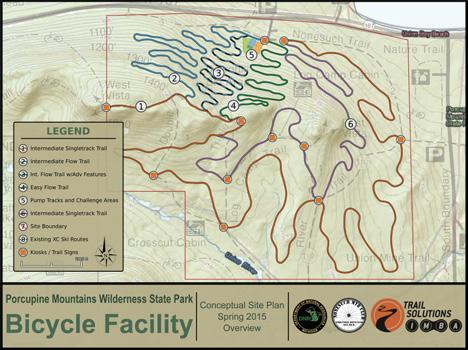
these same factors in their report. The existing facilities of the ski hill include: a concessions and rental building, event space, kitchen, indoor bathrooms, parking, and a gift shop. The chair lift
itself has the potential to be retrofitted to carry mountain bikes up the hill, which makes it a particularly desirable amenity. This would mean that the facilities of the ski-hill would be usable during the off season period, and there may even be an opportunity to provide additional services to visitors, such as mountain bike rental and repair.
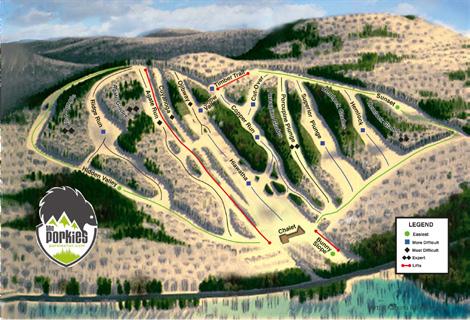
Local recreation advocates and organizations see the creation of trails as an “essential development for improved quality of life, economic diversification, and long-term community sustainability.”74 As mentioned, the development of quality biking trails has become the backbone of similar regional economies as evidenced by the dramatic increase in tourism income. The IMBA notes that “only a collaborative effort throughout many sectors of the community will turn the vision of great trails into reality.”75 The development of trails on and around the ski hill and recreation area of Porcupine Mountains also has the potential to increase annual visitation. As the summer season continues to extend because of climate change and ski hills have the possibility of snow loss, it would be beneficial to create a viable, all-season and/ or off-season recreational activity that has the ability to draw in visitors during the warmer months.
However, there are also policy and environmental factors limiting the location and type of mountain bike trails. The Porcupine Mountains contain an extensive hiking trail system, including a segment of the North Country Trail. The majority of hiking trails
are not open to mountain biking. The developed crosscountry ski trails are, but these paths traverse wet areas and unsustainable slopes; thus, they do not provide a quality mountain bicycling experience. According to the IMBA study, the soil in the park
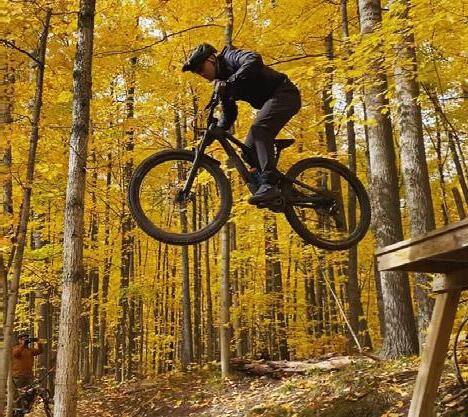
148 149
Figure 4.14: Mountain Bike Jump70
Figure 4.15: Porkies Ski Hill Map
Figure 4.16: Topography of Potential Bike Trails72
Figure 4.17: Satellite of Potential Bike Trails73
would make it difficult to develop sustainable trails with grades steeper than 7% to 10%, and ideal trail grades would be kept in the 5% to 6% range.76 Keeping in mind the constraints above, the IMBA did identify a 15-mile stretch of land within the Porcupine Mountains recreation area in which an intentional and purpose-driven mountain biking trail could be built. This area has been identified as an initial target for the park, and has the capability of future lift access. The addition of purpose-built bike trails around the ski area would make it an attractive option for allseason visitors and regional mountain bikers, including the Friends of the Porkies, Nonesuch Mountain Bike Club, and Soke Trails, who have been requesting such facilities since before 2014. These trails could also provide a potential new revenue stream for the state park and the residents of Ontonagon County. IMBA’s report recommends situating three bike-specific tracks near the Porcupine Mountain Chalet and lower lifts.
These tracks include a skills challenge area, pump tracks (a small course with many small jumps, similar to a skate park), and a dirt jump or slopestyle area.77 The challenge area is designed for users to practice technical riding skills in a low consequence environment. The pump tracks area would be designed for a range of skill levels to allow cyclists to learn and perfect their riding skills; this may include a tot track and pump park. The dirt jump and slopestyle areas would also be designed for beginner to advanced riders, allowing for riders to eventually use the gravity flow trails. The cost estimates for this heavily depend on the amount and method of trail construction; pricing for contractors or skilled labor differs greatly as compared to volunteers or trails stewards. The low cost estimate in 2015 was $845,000 USD and the high was $1,795,000.78 If the Porcupine Mountains staff were to put this project into effect, they need to factor in the additional budgetary costs due to inflation. In order to provide a visual guide for this project,
our team built a potential workflow in ESRI’s Survey123 for trails to be mapped out via GPS which could help initial placement and marketing maps in the future. Please see attached Appendix for that information.
5.2 Lodging and Concessions
In this section, our team developed a brief overview of the lodging structure of state campground, backcountry cabins, and lodge fees for Porcupine Mountains. We also created a brief roadmap of potential future concessions. For information on lodging, we used DNR’s website for cabin reservations to compile a list of information about each cabin in a spreadsheet added into the Appendix of this paper.
Regarding concessions, we have spoken to DNR staff about the possibility of expanding concessions to include alcohol, as a number of visitors mentioned their interest in purchasing beer during our site visit. Since expanding concessions to include a liquor license is a time-intensive process that would involve Michigan State Legislature approval for issuance, we aren’t able to explain the process substantially in this section. It is important to note that expanding concessions to include a variety of alcohol and hot drinks should involve the current company in charge of concessions, Simple Adventures. If expanding the concessions offered at Porcupine Mountains seems to be a viable route, then it would be worthwhile to have discussions between DNR staff and Simple Adventures about the ways that bringing in alcohol/hot drinks could change service, and what that would mean for the current contract. However, due to the slower speed of this process we will not be expanding on it further in this report.
Porcupine Mountains has 25 lodges in the park, which are a combination of modern lodgings with electricity and other amenities and backcountry cabins or yurts which provide shelter and rustic amenities such as
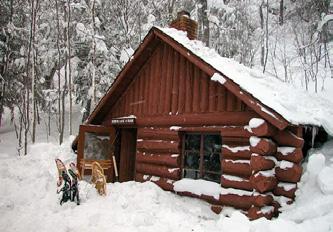
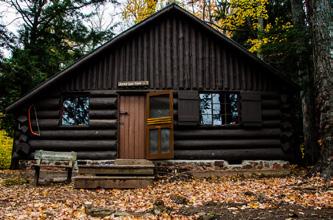
wood-fire stoves.79 Most backcountry cabins are priced at $78 per night, with the exception of Cotten Cabin, which is priced at $100. The Tiny House is priced at $100 per night, and the Kaug Wudjoo Lodge is the most expensive at $215 per night.80 However, with the exception of these unique lodging opportunities, the cost per night does not vary according to the intended occupancy. For example, the two-person Mirror Lake Cabin is the same price as the eightperson Mirror Lake Cabin. One potential increased revenue stream for the Porcupine Mountains may be charging more for cabins based on the amount of guests each cabin can accommodate. Therefore, the Mirror Lake Cabin that sleeps four could have an increased rate compared to the cabin that sleeps two, and so on up to the eight-person cabin. We believe these price increases are viable because there is such a high demand for lodging. For instance, the Michigan State Parks reservation website shows that modern lodging, which can be booked up to a year in advance, is almost fully booked. The same can be said for backcountry cabin reservations, which can be booked up to six months in advance. Adjusting prices for cabins based on capacity is a relatively simple change that has the potential to increase revenue for the parks by a wide margin. However, our team understands that there is a delicate balance between increasing revenue and providing affordable accommodations. It is important to continue funding state park programs and activities while also keeping these resources accessible for Michiganders who cannot afford steep price increases. Therefore, we suggest only a small increase in price to reflect demand and capacity in lodging. This would likely manifest in two-person cabins maintaining the price of $78 and increasing prices from there based on occupancy.
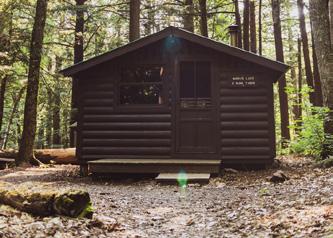
150 151
Figure 4.18: Porcupine Mountains Mirror Lake 2 occupant Cabin81
Figure 4.19: Porcupine Mountains Mirror Lake 8 occupant Cabin82
Figure 4.20: Mirror Lake 4 Occupant Cabin83
5.3 Tubing hill
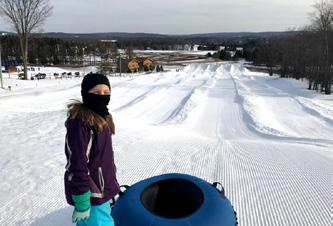
Expanding wintertime activities to include tubing were one of the suggestions received from public engagement. Tubing could be a family friendly way to increase potential revenue during the snow season with very little infrastructure needed. A tubing hill can be created rather easily. An attachment to a snow groomer can create two embanked tubing lanes.84 The embanked lanes provide a small wall of snow to buffer the tubes from running into each other or other visitors on the mountain. However, embanked lanes are not necessary if the tubing is on a gentle hill with slower speeds. The tubing run can be placed on a portion of the hill that has a significant horizontal run at the end in order to slow down tubes naturally. The tubing run can be placed without requiring an additional chair lift, and the walk back up to the start of the tubing run can help spread out the riders. The tubes themselves cost roughly $100 each,85 but they are expected to last at least six commercial seasons before needing replacement.86 With the ability to rent out tubes for a few dollars an hour, the tubes would most likely pay for themselves within their lifetime. The most important factor would be the siting of the tubing relative to the rest of the Winter Sports Complex. The tubing hill could be adjacent to the existing bunny hill or at the wide-open bottom of the Hiawatha run.
5.4 Adventure Courses
ZIPLINE
Ziplines and other such recreational features have been suggested for Porcupine Mountains. Due to their popularity elsewhere and the trend of recreational diversification our team researched a few of the larger recreational structures suggested for Porcupine Mountains. Many other ski resorts have also added ziplines and similar “activity parks” as mentioned in the snow loss section. For this reason, our team researched available information on how other state parks have done with zipline attractions.
Ziplines have been built in state parks around the country. Muskegon State Park has a full recreation center that includes a zipline.88 The 1,400 foot dual zip line, seen here, cost the park roughly $215,000 to build. The funding came through multiple sources but included $120,000 from the Natural Resources Trust Fund and the Muskegon County Community Foundation.89 Rides cost approximately $30 and can be combined with the other activities. The feature opened in 2021, so it is relatively new. A variety of attractions are already at the Muskegon Luge Adventure Sports Park – a portion of Muskegon State Park – to draw in visitors.90 The adventure park has plans to expand its recreational opportunities, and funding is already underway to build more ziplines.
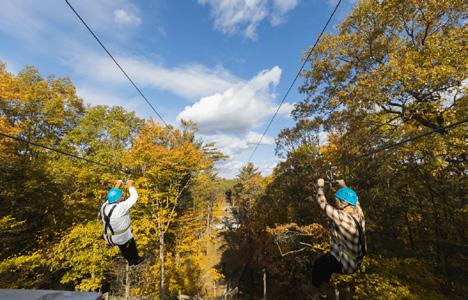
In Alabama three state parks have zipline adventure courses: Lake Guntersville State Park, Wind Creek State Park, and DeSoto State Park.91 In Idaho the zipline operation at Eagle Island State Park recently sold to a new concessionaire.92 The zipline is combined with a ropes course to make an Aerial Adventure Park for kids and adults.93 The operation sold for $150,000 and the operating company has been paying the park 7% of their gross annual receipts which comes to roughly $3,500.94
If a new zipline course were to be installed at Porcupine Mountains, the towers should be constructed along the edges of ski runs. This would provide an open space for the ziplines to run across, and the towers would not obstruct the winter uses. Running the course through open areas also limits the need for tree removal.95 The infrastructure required to build a full zipline course might be rather expensive and would require more substantial infrastructure constructions, though the chair lift could be used to take riders to the top of the zip course.
However, our cost-benefit analysis indicates that a zipline would not likely provide a significant amount of income to the State Parks system. If the Park took a private concessionaires approach, like the Idaho example,
zipline with planned areas to expand downhill. According to the earlier examples, a 1,400 foot zipline would likely cost more than $200,000 and could take up to 60 years to pay back from user charges alone, assuming a revenue of $3,500 a year. At that point, the operation would likely need to be replaced, therefore this approach is not recommended.
SUSPENSION BRIDGE
Porcupine Mountains might be able to identify a private company who could pay for the infrastructural improvements necessary for the zipline. Assuming terms similar to other agreements, – 7% of gross annual receipts paid to the park – Porcupine Mountains could realistically expect to earn a thousand dollars a year from the development. Such an operation would be beneficial to the private company, would create a few seasonal jobs, and could increase the likelihood of private interest in expanding recreational offerings with other structures at Porcupine Mountains. Additionally, ziplines would not likely be used during the wintertime, limiting revenue opportunities. If Porcupine Mountains wanted to build, and fund, the zipline themselves, they could start with a smaller portion of the
Porcupine Mountains has a wealth of scenic views that are unmatched, making it an ideal location to construct a pedestrian suspension bridge. A pedestrian bridge offers a great balance of scenic views and adventure as they give visitors the thrill of being suspended high in the air. There are over 1,000 bridges in the National Park system. Bridges come with many costs in construction and continued maintenance. The National Park system spent around $113 million dollars in 2021 maintaining 84 bridges in the park system.97 Most, if not all, are not the scale of pedestrian suspension bridges, which can be multimillion dollar investments aimed at providing expansive views of cities or scenic forests. Suspension bridges are a large investment in time and cost, but they tend to be major attractions as they are more rare to come across.
153 152
Figure 4.21: Snow Tubing in Michigan87
Figure 4.22: Muskegon State Park Zipline96
Michigan State University’s Hidden Lake Gardens recently decided to construct a suspension bridge in an effort to attract more visitors to the area. This project titled “Reach For the Sky” is a $2.2 million effort to build a 700 foot long canopy in the Hidden Lake Gardens. The design and construction of this canopy will be developed by Phoenix Experiential Designs, who have constructed a number of suspension bridges both domestically and abroad.98 The project is anticipated to open later this spring. Information regarding pricing is anticipated to be announced with the opening of the bridge.99 Additionally, suspension bridges can be used year round and are particularly spectacular after a winter snowfall.
Boyne Mountain Resort in Michigan recently constructed a timber wood suspension bridge on their property. This 1,200 ft bridge is the largest timber wood suspension bridge in the world, with 36 ft of glass installation that hangs 118 ft above ground.100 This suspension bridge came to fruition following the success of the resort’s sky bridge built on their property in Tennessee. Both bridges were designed and built by Experiential Resources (Eri), a firm that has 25 years of experience building and designing adventure attractions.101 This private venture does not have publicly available information about the cost of construction. The construction process took approximately one year and three months from conception
to development.102 The entry fee is twenty-five dollars for people ages eleven to sixtynine.103
While construction costs of suspension bridges tend to be high, they are major tourist attractions and can yield large returns through purchase of additional tickets to access the attraction. The Porcupine Mountains scenic routes provide an ideal space to create a major attraction, draw in more visitors, and add another major revenue stream for the park. Conde Nast Traveler has an article listing “16 Incredible Suspension Bridges Around the World;” of these 16 bridges, online ticket pricing was available for 11 parks.104 Prices range from free admissions, to upwards of $40, with an average fee of $18.09 for adult entry across these suspension bridges.
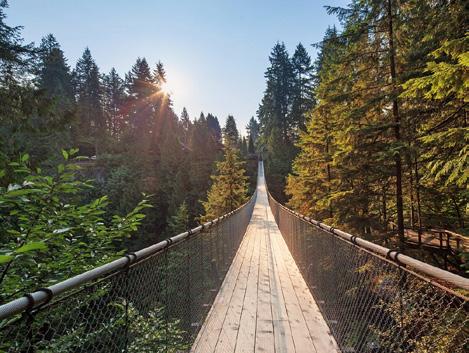
A suspension bridge requires a lot of upfront construction and development costs with continued maintenance costs. It could take upwards of a few years to see the return on investment. When the Porcupine Mountain Wilderness Park is able to make larger infrastructure investments, building a suspension bridge could be a viable option for development. It does require large upfront costs, but they provide a consistent stream of added income for the park system.
ALPINE SLIDE
Another recreation item that has been suggested for Porcupine Mountains is an alpine slide. Some ski resorts and parks have already had great success, with alpine slides creating off-season revenue for ski hills. An alpine slide is essentially a summer version of a bobsled; however, the alpine slide runs on a smooth continuous track made of fiberglass, concrete, or stainless steel. Alpine slides tend to be found in resort parks, but they are fairly rare and they do not appear to be available at state owned parks anywhere in Michigan. If the state partnered with a private developer to construct the slide, it has the potential to create a mutually beneficial financial scenario and bring in more park visitors.
and one of the largest alpine slides in the world. There are three tracks, which range in difficulty from beginner to advanced. It is roughly 3,500 ft long. This slide can reach a maximum speed of 37 mph because of the manual braking system, however, most people will fall within the range of 15-25 miles per hour.109 The season for Bromley’s alpine slide is the end of May to the middle of October. Tickets for the 2019 season for individuals cost about $37 per person,110 though the cost depends on age, group size, and equipment rentals.
One existing example is the alpine slide in Park City, Utah. Park City is the largest ski resort in the United States, with over 7,000 acres dedicated to skiing, hiking, alpine slides, and other outdoor recreational activities. The Alpine slide offers over 3,000 feet of a lugelike track, and is sold with a chair lift ride up to the top of the track.106,107 The season runs from the end of May to early September. Ticket prices range from $17 to $28. This alpine slide can reach speeds of up to 25 miles per hour.108
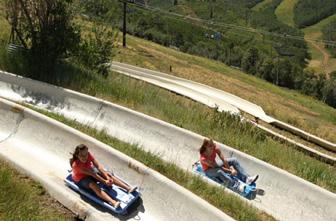
Another example of an alpine slide at a resort is in Bromley Mountain, Vermont. This alpine slide was built in 1976; it is the first triple tracked alpine slide in North America,
Alpine slides tend to have large upfront infrastructure costs and annual maintenance costs. Though specific pricing regarding current day pricing could not be found, a New York Times article from 1976 lists the price of crafting the alpine slide at Bromley Mountain VT, as $200,000.111 Adjusted for inflation, that is roughly $1 million in today’s dollars. Although, the alpine slide has an advantage of utilizing the existing infrastructure, since alpine slide systems are gravity based and there will need to be a mechanism to get people from the bottom of the run to the top efficiently. Therefore, using an existing chair lift would ease the financial burden of building another chairlift. If Porcupine Mountains were to install an alpine slide, our team would recommend it be in close proximity to the chair lifts, but not in the middle of the ski slope.
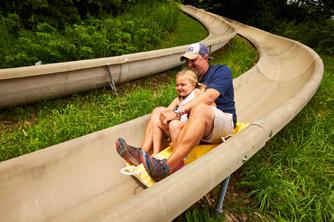
155 154
Figure 4.23: Suspension Bridge in Capilano Suspension Bridge Park105
Figure 4.24: Park City Utah Alpine Slide112
Figure 4.25: Bromley Alpine Slide113
6. RECOMMENDATIONS
Our recommendations for porcupine mountains will be structured into categories based on intensity of infrastructure, with simpler recommendations being less costly and more intensive recommendations being more expensive. Our low cost recommendations are to restructure cabin pricing and establish a more pronounced online presence. Changing cabin pricing to be by-occupancy pricing, especially for the backcountry cabins, would be a simple way to increase revenue for the park. Since the lodging in the Porcupine Mountains is so sought-after and consistently booked, increasing the pricing even in smaller increments could create a more consistent revenue stream for the park to use on other necessities and upkeep. Increasing the park’s presence online will help engage visitors who are not local to the region and point them toward lodging and amenities. These two recommendations require little to no
infrastructural requirements, though they require some system reorganization.
For infrastructural improvements, our medium-cost option is to create a tubing hill, either adjacent to the bunny hill or just uphill of the chalet. This activity would require buying an attachment to the snow groomer and purchasing snow tubes to rent at the chalet. The inclusion of a tubing hill could attract people who might not necessarily know how to ski or do not have the ability to ski, to partake in an exciting winter activity.
Category Recommendation
Management
Management
Restructure pricing based off of occupancy of cabins rather than a flat base price for all
Create a more accessible media presence online through social media and a more comprehensive website to garner more attention from visitors not in the region
Management Assess opportunities to partner with nearby ski resorts on season passes
Low-Infrastructure Expand the bunny hill to include tubing
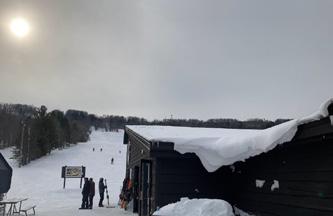
High-Infrastructure Create a network of mountain biking trails and courses
High-Infrastructure Build a exciting attraction through a partnership with a private developer (Zipline, Suspension Bridge, Alpine Slide)
Table 4.2: Table of Recommendations
7. APPENDIX
The attached links below constitute the appendix of tables and surveys for the Porcupine Mountains research team. If you have any difficulty in reaching these links please contact staff at Taubman College.
Porcupine Mountain Public Engagement Survey
Spreadsheet for Comparing State/National Parks
Spreadsheet Comparing Lodging Porcupine Mountains
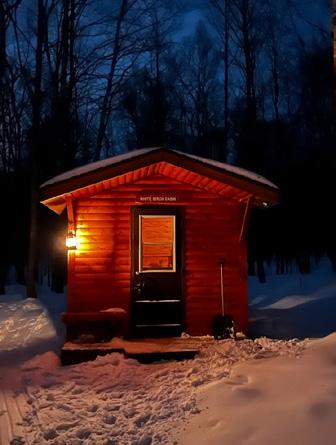
Our high cost options involve the creation of trails or infrastructure in the recreation area of the park. The first, and likely best, course of action would be to create dedicated mountain bike trails for Porcupine Mountains. The other options our team analyzed, such as the zipline or alpine slide, may be appropriate in the future if Porcupine Mountains becomes a major summer recreational adventure area. Partnering with companies that construct and operate these facilities might be the best way to avoid upfront capital costs, increase park visits, and generate increased revenue for the Park. Additional data from the park’s operation of the ski hill during the 2022-2023 season could provide better estimates for time period and funding availability. The data from the visitor survey by WUPPDR could provide additional context for expanding recreational options in the region. (see Table 4.2)
ArcGIS Survey123 Public Engagement Questionnaire for Creating Bike Trails
Link to tables for comparison section
156 157
Figure 4.26: White Birch Cabin
Figure 4.27: Ski Chalet
KEY RECOMMENDATIONS
RESTRUCTURING LODGING MEDIA PRESENCE REGIONAL OPPORTUNITIES TUBING
• Restructure lodging pricing based on occupancy of cabins rather than a flat base price for all. Preserve affordability while increasing funds available for recreational investment.

• Create a more accessible media presence online through social media and a more comprehensive website to garner more attention from visitors not in the region.

• Assess opportunities to partner with regional or national ski resorts on season passes to mitigate year to year fluctuations in skiable weather.


• Expand the bunny hill to include tubing, increase family friendliness of the park and winter opportunities.
BIKING ADVENTURE COURSE

• Incrementally create a network of mountain biking trails and courses that can be flexible to the needs and wants of park management and visitors.
• Build an exciting attraction through a partnership with a private developer (Zipline, Suspension Bridge, Alpine Slide). Diversifying off-season recreation opportunities.

158 159
Endnotes
1.) Michigan Department of Natural Resources. 2019. Porcupine Mountains
Wilderness State Park General Management Plan. N.p.: Beckett & Raeder.
2.) Ibid.
3.) The International Mountain Bicycling Association – Trail Solutions program. 2015. Porcupine Mountains State Park Trails Recommendation Report.
4.) Ibid.
5.) State of Michigan. n.d. “Porcupine
Mountains Wilderness State Park.” DNR State MI. Accessed April 3, 2023. https://www2. dnr.state.mi.us/parksandtrails/Details. aspx?id=426&type=SPRK.
6.) Ibid.
7.) Barnet, Pilch, and Alan. 2022. “Disc Golfing.” Porcupine Mountains Michigan. December 13, 2022. https://www.porcupineup.com/discgolf/.
8.) shelbydiamondstar, “Wonderful Sunrise and Fall Color at Lake of the CloudsPorcupine Mountains, Michigan [2048 X 1363] [OC].”
9.) Michigan Department of Natural Resources. 2019. Porcupine Mountains Wilderness State Park General Management Plan. N.p.: Beckett & Raeder.
10.) Michigan Department of Natural Resources. 2019. Porcupine Mountains
Wilderness State Park General Management Plan. N.p.: Beckett & Raeder.
11.) Pictured Rocks National Lakeshore, Munising, MI [OC] [4000x3000] : r/EarthPorn (reddit.com)
12.) National Park Service U.S. Department of Interior. n.d. “Operating Hours & SeasonsIsle Royale National Park (U.S.” National Park Service. Accessed April 12, 2023. https://www. nps.gov/isro/planyourvisit/hours.htm.
13.) National Park Services U.S. Department
of Interior. n.d. “Operating Hours & Seasons - Keweenaw National Historic Park.” https:// www.nps.gov/kewe/planyourvisit/hours.htm.
14.) U.S. Department of Interior. n.d. “NPS Stats.” IRMA. Accessed April 12, 2023. https:// irma.nps.gov/Stats/.
15.) U.S. Department of Interior. n.d. “Where to Stay - Isle Royale National Park (U.S.” National Park Service. Accessed April 12, 2023. https:// www.nps.gov/isro/planyourvisit/where-tostay.htm.
16.) National Parks Service - U.S. Department of Interior. 2022. “Rock Harbor Lodge & Windigo Camper Cabins - Isle Royale National Park (U.S.” National Park Service. https://www.nps.gov/isro/planyourvisit/rockharbor-lodge.htm.
17.) Tenkanen, H., Di Minin, E., Heikinheimo, V. et al. Instagram, Flickr, or Twitter: Assessing the usability of social media data for visitor monitoring in protected areas. Sci Rep 7, 17615 (2017). https://doi.org/10.1038/s41598-01718007-4
18.) Shih, Charles, Sarah Nicholls, and Donald F. Holecek. “Impact of Weather on Downhill Ski Lift Ticket Sales.” Journal of Travel Research 47, no. 3 (February 2009): 359–72. https://doi. org/10.1177/0047287508321207.
19.) Mount Bohemia - Extreme Skiing - Upper Peninsula of Michigan. “Mount Bohemia - Extreme Skiing - Upper Peninsula of Michigan.” Accessed March 3, 2023. https:// www.mtbohemia.com/.
20.) “SnowRiver | Home.” Accessed March 3, 2023. https://www.snowriver.com/.
21.) “Ski Brule | Family Ski Resort in Michigan’s Upper Peninsula.” Ski Brule. Accessed March 3, 2023. https://skibrule.com/.
22.) “Gogebic Community College - Mt. Zion.” Accessed March 3, 2023. https://www. gogebic.edu/community/mtzion-167246. html.
23.) Kane, Mark, and Melissa Sherburne. “Opportunities Beyond Skiing in Mountain Communities.” SE Group Multi-Season Recreation Planning (August 2012): https:// coskitowns.com
24.) Ski Brule. 2021. “19.20 Ski Brule Parks -.” Ski Brule. 2021. https://skibrule.com/brulemountain/skiing-snowboarding/19-20-skibrule-parks/.
25.) Haanpää, Simo ; Juhola, Sirkku ; Landauer, Mia. “Adapting to Climate Change: Perceptions of Vulnerability of down-Hill Ski Area Operators in Southern and Middle Finland.” Current Issues in Tourism. Routledge, n.d. doi:10.1080/13683500.2014.892917.
26.) Shih, Charles, Sarah Nicholls, and Donald F. Holecek. “Impact of Weather on Downhill Ski Lift Ticket Sales.” Journal of Travel Research 47, no. 3 (February 2009): 359–72. https://doi. org/10.1177/0047287508321207.
27.) Washington Post. “How Four Ski Resorts Are Working to Slow Their Demise.” February 10, 2022. https://www.washingtonpost.com/ travel/2022/02/10/ski-resorts-climatechange/.
28.) Secon, Holly. “Photos of Abandoned Ski Lifts and Snowless Slopes Reveal the Toll That Rising Temperatures Are Taking on Winter Resorts.” Business Insider. Accessed March 3, 2023. https://www.businessinsider.com/skiresorts-face-no-snow-empty-mountainslost-customers-photos-2020-2.
29.) Time. “Italy’s Ski Resorts Grapple With a Snowless Future,” January 19, 2023. https:// time.com/6248345/italy-ski-resorts-nosnow-climate-change/.
30.) Wobus, Cameron, Eric E. Small, Heather Hosterman, David Mills, Justin Stein, Matthew Rissing, Russell Jones, et al. “Projected Climate Change Impacts on Skiing and Snowmobiling: A Case Study of the United States.” Global Environmental Change 45 (July 1, 2017): 1–14. https://doi.org/10.1016/j.
gloenvcha.2017.04.006.
31.) Scott, Daniel, Jackie Dawson, and Brenda Jones. “Climate Change Vulnerability of the US Northeast Winter Recreation– Tourism Sector.” Mitigation and Adaptation Strategies for Global Change 13, no. 5 (June 1, 2008): 577–96. https://doi.org/10.1007/s11027-0079136-z.
32.) Dawson, J., and D. Scott. “Managing for Climate Change in the Alpine Ski Sector.” Tourism Management 35 (April 1, 2013): 244–54. https://doi.org/10.1016/j. tourman.2012.07.009.
33.) Wobus, Cameron, Eric E. Small, Heather Hosterman, David Mills, Justin Stein, Matthew Rissing, Russell Jones, et al. “Projected Climate Change Impacts on Skiing and Snowmobiling: A Case Study of the United States.” Global Environmental Change 45 (July 1, 2017): 1–14. https://doi.org/10.1016/j. gloenvcha.2017.04.006.
34.) Motavalli, Jim. "Losing winter: as climate change takes hold, our coldest season is the first casualty." E, JanuaryFebruary 2008, 26+. Gale Academic OneFile (accessed March 3, 2023). https:// link.gale.com/apps/doc/A173923072/ AONE?u=umuser&sid=bookmarkAONE&xid=9afdab1c.
35.) Finnerty, Ryan. “Ski Resorts No Longer Trust There Will Be Reliable Snowfall in Warming Climate.” NPR, February 20, 2022, sec. Climate. https://www.npr. org/2022/02/20/1082012469/ski-resorts-nolonger-trust-there-will-be-reliable-snowfallin-warming-climate.
36.) Scott, Daniel, Geoff McBoyle, and Brian Mills. “Climate Change and the Skiing Industry in Southern Ontario (Canada): Exploring the Importance of Snowmaking as a Technical Adaptation.” Climate Research 23, no. 2 (January 31, 2003): 171–81. https://doi. org/10.3354/cr023171.
37.) Wilson, Geoff; Green, Mark; Mack, Ken. Historical Climate Warming in the White Mountains of New Hampshire (USA): Implications for Snowmaking Water Needs at Ski Areas. 38 Mountain Research and Development 2 164-171, 8 (2018) https://doi. org/10.1659/MRD-JOURNAL-D-17-00117 DOI 10.1659/MRD-JOURNAL-D-17-00117 BIOONE
38.) Blanchard, Allan. 2016. “How Much Does It Cost to Make Snow at a Ski Resort?” Ambipar Response EMS, Inc. https://emsenv. com/2016/06/08/cost-to-make-snow/.
39.) Guglielmino, Helena. 2017. “The Hardships of Making Snow | Cost, Reliance, & Environmental Impacts.” SnowBrains. https://snowbrains.com/the-hardships-ofmaking-snow-cost-reliance-environmentalimpacts/.
40.) Scott, Daniel, Geoff McBoyle, and Brian Mills. “Climate Change and the Skiing Industry in Southern Ontario (Canada): Exploring the Importance of Snowmaking as a Technical Adaptation.” Climate Research 23, no. 2 (January 31, 2003): 171–81. https://doi. org/10.3354/cr023171.
41.) Andrea Damm, Judith Köberl, and Franz Prettenthaler, “Does Artificial Snow Production Pay under Future Climate Conditions? – A Case Study for a Vulnerable Ski Area in Austria,” Tourism Management 43 (August 1, 2014): 8–21, https://doi.org/10.1016/j. tourman.2014.01.009
42.) Haanpää, Simo ; Juhola, Sirkku ; Landauer, Mia. “Adapting to Climate Change: Perceptions of Vulnerability of down-Hill Ski Area Operators in Southern and Middle Finland.” Current Issues in Tourism. Routledge, n.d. doi:10.1080/13683500.2014.892917.
43.) Baraniuk, Chris. 2019. “Melting Ski Resorts Are Developing a Fatal Addiction to Snow Machines.” Wired UK. November 30, 2019. https://www.wired.co.uk/article/snowmachines-ski-resorts.
44.) Kidston, Martin. "Yellowstone-Area Ski Hill Looking to Expand with Zip Line." McClatchyTribune Business News, Apr 19, 2012.
45.) Emily J. Wilkins, Hadia Akbar, Tara C. Saley, Rachel Hager, Colten M. Elkin, Patrick Belmont, Courtney G. Flint, Jordan W. Smith "Climate Change and Utah Ski Resorts: Impacts, Perceptions, and Adaptation Strategies," Mountain Research and Development, 41(3), R12-R23, (28 September 2021)
46.) Neff, Jim. "Midwest Ski Towns Offer Advantages: Great Skiing and Good Prices without Losing Slope Time to Travel." Chicago Tribune, Nov 02, 2008. https://proxy.lib.umich. edu/login?url=https://www.proquest.com/ newspapers/midwest-ski-towns-offeradvantages/docview/420738665/se-2.
47.) Technology and Operations Management. “When Your Product Is Dependent on Snow, How Do You React to Climate Change? A Look at Vail Resorts.” Accessed April 20, 2023. https://d3.harvard. edu/platform-rctom/submission/whenyour-product-is-dependent-on-snow-howdo-you-react-to-climate-change-a-lookat-vail-resorts/.
48.) Technology and Operations Management. “When Your Product Is Dependent on Snow, How Do You React to Climate Change? A Look at Vail Resorts.” Accessed March 3, 2023. https://d3.harvard. edu/platform-rctom/submission/whenyour-product-is-dependent-on-snow-howdo-you-react-to-climate-change-a-lookat-vail-resorts/.
49.) Kadane, Lisa. "Summer Fun on the Slopes: Ski Resorts Reinvent Themselves when the Snow Melts: [Final Edition]." Edmonton Journal, Jul 28, 2001.
50.) Motavalli, Jim. "Losing winter: as climate change takes hold, our coldest season is the first casualty." E, JanuaryFebruary 2008, 26+. Gale Academic OneFile (accessed March 3, 2023). https:// link.gale.com/apps/doc/A173923072/
AONE?u=umuser&sid=bookmarkAONE&xid=9afdab1c.
51.) Kidston, Martin. "Yellowstone-Area Ski Hill
Looking to Expand with Zip Line." McClatchyTribune Business News, Apr 19, 2012.
52.) Technology and Operations Management. “When Your Product Is Dependent on Snow, How Do You React to Climate Change? A Look at Vail Resorts.” Accessed March 3, 2023. https://d3.harvard. edu/platform-rctom/submission/whenyour-product-is-dependent-on-snow-howdo-you-react-to-climate-change-a-lookat-vail-resorts/.
53.) Kane, Mark, and Melissa Sherburne. “Opportunities Beyond Skiing in Mountain Communities.” SE Group Multi-Season Recreation Planning (August 2012): https:// coskitowns.com
54.) Megroz, Gordy. 2018. “The Ikon and Epic Passes Are Great for Ski Buffs. Until They're Not.” Bloomberg.com. https://www. bloomberg.com/news/articles/2018-10-12/ the-ikon-and-epic-passes-are-great-forski-buffs-until-they-re-not.
55.) Scott, Daniel, Jackie Dawson, and Brenda Jones. “Climate Change Vulnerability of the US Northeast Winter Recreation– Tourism Sector.” Mitigation and Adaptation Strategies for Global Change 13, no. 5 (June 1, 2008): 577–96. https://doi.org/10.1007/s11027-0079136-z.
56.) Emily J. Wilkins, Hadia Akbar, Tara C. Saley, Rachel Hager, Colten M. Elkin, Patrick Belmont, Courtney G. Flint, Jordan W. Smith "Climate Change and Utah Ski Resorts: Impacts, Perceptions, and Adaptation Strategies," Mountain Research and Development, 41(3), R12-R23, (28 September 2021)
57.) Technology and Operations Management. “When Your Product Is Dependent on Snow, How Do You React to Climate Change? A Look at Vail Resorts.” Accessed March 3, 2023. https://d3.harvard. edu/platform-rctom/submission/whenyour-product-is-dependent-on-snow-howdo-you-react-to-climate-change-a-lookat-vail-resorts/.
58.) Moreno-Gené, Jordi, Laura SánchezPulido, Eduard Cristobal-Fransi, and Natalia Daries. “The Economic Sustainability of Snow Tourism: The Case of Ski Resorts in Austria, France, and Italy.” Sustainability 10, no. 9 (September 2018): 3012. https://doi. org/10.3390/su10093012.
59.) Finnerty, Ryan. “Ski Resorts No Longer Trust There Will Be Reliable Snowfall in Warming Climate.” NPR, February 20, 2022, sec. Climate. https://www.npr. org/2022/02/20/1082012469/ski-resorts-nolonger-trust-there-will-be-reliable-snowfallin-warming-climate.
60.) Moreno-Gené, Jordi, Laura SánchezPulido, Eduard Cristobal-Fransi, and Natalia Daries. “The Economic Sustainability of Snow Tourism: The Case of Ski Resorts in Austria, France, and Italy.” Sustainability 10, no. 9 (September 2018): 3012. https://doi. org/10.3390/su10093012.
61.) Motavalli, Jim. "Losing winter: as climate change takes hold, our coldest season is the first casualty." E, JanuaryFebruary 2008, 26+. Gale Academic OneFile (accessed March 3, 2023). https:// link.gale.com/apps/doc/A173923072/ AONE?u=umuser&sid=bookmarkAONE&xid=9afdab1c.
62.) Dawson, J., and D. Scott. “Managing for Climate Change in the Alpine Ski Sector.” Tourism Management 35 (April 1, 2013): 244–54. https://doi.org/10.1016/j. tourman.2012.07.009.
63.) Western U.P. Planning & Development Region, “Ontonagon County Five-Year Recreation Plan 2023-2027” (Western Upper Peninsula Planning and Development Region (WUPPDR), December 20, 2022). Pg. 18
64.) Ibid.
65.) Nicholas S. Meltzer, “Adapting to the New Economy: The Impacts of Mountain Bike Tourism in Oakridge, Oregon” (University of Oregon Department of Planning, Public Policy and Management, June 2014).
66.) Lyden, Trevor. 2021. “The Great Escape | Oakridge’s Enduring Backcountry Appeal.” Freehub Magazine. February 25, 2021. https:// freehub.com/features/great-escape.
67.) Sara Cottingham and Kasey Osborne, “Understanding Mountain Bike Tourism” (Downstream Strategies, November 18, 2019).
68.) Hansman, Heather. 2022. “In Northern Vermont, Trying to Smooth the Ride for Mountain Biking.” The New York Times, May 23, 2022, sec. Travel. https://www.nytimes. com/2022/05/23/travel/vermont-mountainbiking.html.
69.) The International Mountain Bicycling Association – Trail Solutions program. 2015. Porcupine Mountains State Park Trails Recommendation Report. pg.3
70.) Upper Peninsula Travel and Recreation Association. 2023. “Mountain Biking U.P. Michigan | Upper Peninsula.” Www.uptravel. com. 2023. https://www.uptravel.com/ outdoors-recreation/trails/mountain-biking/.
71.) Ibid.
Ibid.
Ibid.
Ibid.
76.) The International Mountain Bicycling Association – Trail Solutions program.
2015. Porcupine Mountains State Park Trails Recommendation Report.
77.) Ibid.
78.) Ibid.
79.) Michigan Department of Natural Resources, “Michigan State Park & Harbor Reservations,” Midnrreservations.com, 2023, https://midnrreservations.com/
80.) Michigan Department of Natural Resources, “MI 2023 Campground Operations Schedule,” January 12, 2023
81.) LIGGETT, SEARRA. 2021. “Backpacking to the Mirror Lake Cabins & Seeing the Lake of the Clouds | Porcupine Mountains Wilderness
State Park.” Searra Liggett. October 7, 2021. https://searraliggett.com/blog/backpackingto-the-mirror-lake-cabins-amp-seeing-thelake-of-the-clouds-porcupine-mountainswilderness-state-park.
82.) Suchocki, Tim. 2012. “Mirror Lake 8 Bunk Cabin.” Flickr. October 10, 2012. https://www. flickr.com/photos/timsuchocki/8270861065.
83.) Nolte, Michaela. 2021. “23 Crazy and Homey Tales from the Porcupine Mountain Cabins - Michigan4You.” Michigan4you.com. February 27, 2021. https://michigan4you.com/ porcupine-mountain-cabins/.
84.) Gooding, Gates. 2020. “Attachment #1 City of Steamboat Springs Howelsen Hill
Tubing Project Feasibility Study and Pro forma Financial Model.” City of Steamboat Springs.
85.) “Snow Tubes & River Tubes.” n.d. Tube Pro Inc. Accessed April 17, 2023. https://www. tubeproinc.com/products.php?cat=10.
86.) Gooding, Gates. 2020. “Attachment #1 City of Steamboat Springs Howelsen Hill
Tubing Project Feasibility Study and Pro forma Financial Model.” City of Steamboat Springs.
87.) Vanderweide, Melody. 2023. “Snow Tubing in Michigan: 30+ Places to Go Snow Tubing in Our Great Lakes State - Grkids.com.” Grkids. com. January 6, 2023. https://grkids.com/ snow-tubing-in-michigan-winter/.
88.) “Muskegon State Park.” n.d. Michigan DNR. Accessed April 17, 2023. https://www2. dnr.state.mi.us/ParksandTrails/Details. aspx?id=475&type=SPRK.
89.) White, Rose. 2021. “Quarter-mile-long zip line ushers in 'transformational moment' for Muskegon complex known for its luge.” MLive, June 9, 2021. https://www.mlive.com/news/ muskegon/2021/06/quarter-mile-long-zipline-ushers-in-transformational-momentfor-muskegon-complex-known-for-its-luge. html.
90.) “Zip Line.” n.d. Muskegon Luge Adventure Sports Park. Accessed April 17, 2023. https:// msports.org/zip-line/.
91.) “Zip Lines | Alapark.” n.d. Alabama State
Parks. Accessed April 17, 2023. https://www. alapark.com/activities/zip-lines.
92.) Elmore, Troy. 2023. “Agenda Item Concession Assignment.” Idaho State Parks. https://parksandrecreation.idaho.gov/wpcontent/uploads/Agenda-Item-ConcessionAssignment.pdf.
93.) “About Us – Zip McCall.” n.d. Zip McCall. Accessed April 17, 2023. http://zipmccall.com/ about-us/.
94.) Elmore, Troy. 2023. “Agenda Item Concession Assignment.” Idaho State Parks. https://parksandrecreation.idaho.gov/wpcontent/uploads/Agenda-Item-ConcessionAssignment.pdf.
95.) White, Rose. 2021. “Quarter-mile-long zip line ushers in 'transformational moment' for Muskegon complex known for its luge.” MLive, June 9, 2021. https://www.mlive.com/news/ muskegon/2021/06/quarter-mile-long-zipline-ushers-in-transformational-momentfor-
96.) Muskegon Luge Adventure Sports Park. “Adventure for Any Season.” Accessed April 2, 2023. https://msports.org/.
97.) National Parks Service - U.S. Department of Interior. 2023. “Bridges - Transportation (U.S.” National Park Service. https://www.nps. gov/subjects/transportation/bridges.htm.
98.) Graham, Lester. 2022. “Hidden Lake Gardens suspension bridge takes you on a walk through the treetops.” Michigan Radio. https://www.michiganradio.org/ environment-climate-change/2022-10-20/ suspension-bridge-through-the-tree-topscould-attract-more-visitors-to-an-msuhidden-gem.
99.) Michigan State University. n.d. “Hidden Lake Gardens | Infrastructure Planning and Facilities.” MSU IPF. Accessed April 3, 2023. https://ipf.msu.edu/hidden-lake-gardens.
100.) Experiential Resources (ERi). n.d. “Designed and built by ERi...SkyBridge MI: the world's longest timber-towered suspension bridge. — Experiential Resources.” Experiential
Resources. Accessed April 10, 2023. https://www.experientialresources.com/ skybridgemichigan.
101.) Experiential Resources (ERi). n.d. “Designed and built by ERi...SkyBridge MI: the world's longest timber-towered suspension bridge. — Experiential Resources.” Experiential Resources. Accessed April 10, 2023. https://www.experientialresources.com/ skybridgemichigan.
102.) Experiential Resources (ERi). n.d. “Designed and built by ERi...SkyBridge MI: the world's longest timber-towered suspension bridge. — Experiential Resources.” Experiential Resources. Accessed April 10, 2023. https://www.experientialresources.com/ skybridgemichigan.
103.) “What to Know About SkyBridge Michigan: Height, Construction Details, Hours and More.” 2022. NBC Chicago. https:// www.nbcchicago.com/news/local/whatto-know-about-skybridge-michiganheight-construction-details-hours-andmore/2976288/.
104.) Baillargeon, Zoe. 2021. “16 Incredible Suspension Bridges Around the World | Condé Nast Traveler.” Conde Nast Traveler. https:// www.cntraveler.com/gallery/incrediblesuspension-bridges-around-the-world.
105.) Harbour Air Seaplanes. 2023. “2023 Seaplane Tour with Admission to Capilano Suspension Bridge Park.” Tripadvisor. 2023. https://www.tripadvisor.com/ AttractionProductReview-g154943d13454095-Seaplane_Tour_with_ Admission_to_Capilano_Suspension_ Bridge_Park-Vancouver_British_.html.
106.) Park City Mountain Resort, “Park City Summer Hours & Prices | Park City Mountain Resort,” Www.parkcitymountain.com, 2023, https://www.parkcitymountain.com/explorethe-resort/activities/summer-activities/ summer-hours-and-pricing.aspx.
107.) AlpineCoasters, “Park City Alpine Slide (2023 Guide),” Alpine Coasters, January 31, 2023, https://alpinecoasters.com/park-city-
72.)
73.)
74.)
75.) Ibid.
alpine-slide/.
108.) AlpineCoasters, “Park City Alpine Slide (2023 Guide),” Alpine Coasters, January 31, 2023, https://alpinecoasters.com/park-cityalpine-slide/.
109.) AlpineCoasters, “Park City Alpine Slide (2023 Guide),” Alpine Coasters, January 31, 2023, https://alpinecoasters.com/park-cityalpine-slide/
110.) Sophia, “Whiz down Vermont’s Longest Water Slide at This Epic Mountain Park,” OnlyInYourState, July 6, 2019, https://www. onlyinyourstate.com/vermont/longestalpine-slide-vt/.
111.) Robert J. Dunphy, “Notes: Alpine Sliding,” The New York Times, July 11, 1976, sec. Archives, https://www.nytimes. com/1976/07/11/archives/notes-alpinesliding-notes-about-travel-notes-abouttravel.html#:~:text=The%20American%20 representative%20of%20Demag
112.) AllTrips.com. 2023. “Park City Utah Alpine Slide.” AllTrips - Park City Utah. 2023. https:// www.allparkcity.com/summer_recreation/ alpine_slide.php.
113.) Sophia, “Whiz down Vermont’s Longest Water Slide at This Epic Mountain Park,” OnlyInYourState, July 6, 2019, https://www. onlyinyourstate.com/vermont/longestalpine-slide-vt/.
CONCLUSION
This report synthesizes the Michigan Department of Natural Resources’ existing and expected areas of targeted investment, with the intention of increasing statewide park access, sustainability, and park revenue. Determining the necessary steps and stakeholders to implement Electric Recreational Vehicle Infrastructure in a cost-effective manner places Michigan at the forefront of electric vehicle adoption, primed to take advantage of new financing opportunities while safeguarding the state’s natural lands. This report recommends best practices for planning EV charger placement, explains current and future infrastructural needs of electrification, and recommends a number of partnerships to ease this transition. The section on Climate Adaptation outlines existing vulnerabilities of the state park system. Primarily, the section provides guidance regarding the risks, general management plan implementations, asset management considerations, and recommended adaptation strategies for the following hazards faced by state parks in Michigan: excessive heat, storms, erosion, and flooding.
Two focus areas highlight place-based research and recommendations for Porcupine Mountains Wilderness State Park and Belle Isle State Park. While the Porcupine Mountains State Park has attracted skiers for many years, the economic reliability of its ski season is shrinking. In order to stave off seasonal disinvestment, this section looks to other ski hills experiencing the same phenomena, many of which have diversified their recreational offerings by season – maintaining skiing in the winter and adding infrastructure for mountain biking and other activities for summer months. In addition to offering more activities, the report recommends restructuring the existing lodging system to accommodate more visitors and yield additional profits.
The report’s section on Belle Isle State Park proposes recommendations to advance goose management, transportation mode shift, and potential dark sky classification. This section analyzes various case studies for Urban Dark Sky opportunities, and its ideas for goose management include planting intentional landscaping, infrastructure, and other natural deterrents. Finally, the Belle Isle plan explores methods for encouraging visitation during off-peak periods by suggesting events that will incentivize visitors during less-busy times of day.
Early adoption of sustainable, resilient, and intentional state park initiatives will set up Michigan’s DNR to adapt to and avoid future hazards. Together, these four sections constitute recommendations drawn from team site visits, stakeholder conversations, and thorough research to design a guiding structure for implementing programs that benefit Michigan state parks. These recommendations, coupled with institutional and experiential knowledge from Michigan state parks staff will encourage visitors to the state parks to enjoy the beauty of Michigan’s natural resources for years to come, even as the needs and opportunities in Michigan’s state parks change and evolve.
168