
18 minute read
Site Analysis: Digital Site Survey
The first step of responsible design is to understand not only the client’s needs, but also the constraints and potential of the building site. Site analysis involves obtaining geographical information, maps, aerial photos, topographic data, building context information, as-built drawings, preliminary code information, and anything you’ll need to make informed design decisions. This preliminary information will enable you to make realistic decisions about what can actually be built.
Obtaining all of this data can be a huge task. SketchUp Pro allows you to grab preliminary 3D data, everything you need to get started sketching, estimating, and designing while you wait for the hard data to show up. In this section, you will learn techniques to gather accurate 2D and 3D site data in a short amount of time. This data will allow you, as a designer, to make informed decisions, saving time and headaches later when real data arrives.
Advertisement
A digital site survey is the process used to create a 2D site plan, 2D/3D contour map, and site sections from Google 3D data without leaving your desk. By converting 3D data into 2D drawings, or sketch backgrounds, you can get started on a project immediately and make informed design decisions. The ability to generate a two-dimensional site plan of just about any building or site allows you to immediately assess project scope and make more accurate estimates of time and work. This process can fit into any designer’s workflow and style, whether it is sketching by hand or diving right into 3D modeling. The techniques illustrated in this section allow you to gather a wealth of 2D and 3D information digitally without ever visiting the site (Figure 15.1).
A video of the entire following exercise is available at www.suexch.com/tSWFa .
g eo- l oc AT ion
The first step of a digital site survey is to geo-locate the site in SketchUp. Geo-location is the process of identifying a precise real-world geographic location and assigning it to a SketchUp model. During the geo-location process you will import 2D aerial imagery, 3D terrain, precise latitude and longitude coordinates, and the exact Solar North direction. With this data attached to your model, you will be able to make informed decisions about existing conditions, topography, and sun angles.
By accurately geo-locating a model, you also open the door to a multitude of possibilities for integrating with other data-rich Google “geo” services. This connection to Google is one of the unique features that sets SketchUp apart from other 3D software packages. As you will see, SketchUp is seamlessly integrated with popular Google products such as Maps, Street View, Earth, and Building Maker. These additional Google products allow you to easily pick a location, generate context building models, find optimized building facade textures, and view your designs in a real-world context.
Adding a location
For this exercise, you should have the Google toolbar open. Click on the View drop-down menu and choose Toolbars c Google. To geo-locate a model using the Add Location feature, follow the steps discussed here (Figure 15.2).
1. Start a new SketchUp model by either opening SketchUp, or by clicking on the File drop-down menu and choosing New.
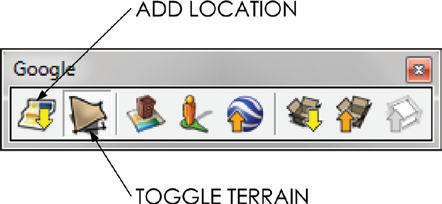
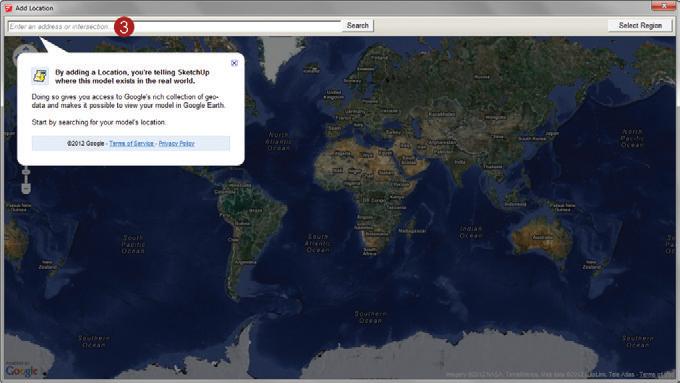
2. Click the Add Location button on the Google toolbar (Figure 15.3). This automatically launches a Google Maps interface where you can search for and find any location on planet Earth.
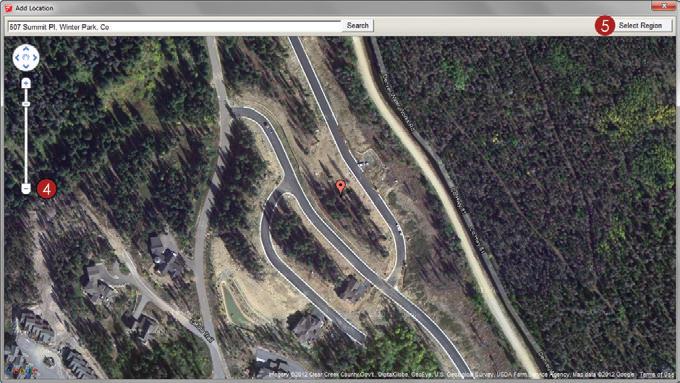
3. The search bar at the top of the Add Location window will accept an address, zip code, intersection, city name, or popular landmark. For this example, enter 507 Summit Pl, Winter Park, Co. Click the Search button (or press Enter) to start the search; the map will zoom into the specified location.
TIP navigate the Add location window the same as you would google Maps. click and drag to pan the map up, down, and side to side. Double-click on the map to zoom in. Double-right-click on the map to zoom out. you can also use the Screen navigation tools in the top-left corner of the map.
4. Zoom out two to three clicks so you can see more of the site as shown in Figure 15.4.
5. Click the Select Region button at the top-right corner of the Add Location window. This adds a selection rectangle to the map with pins on the four corners.
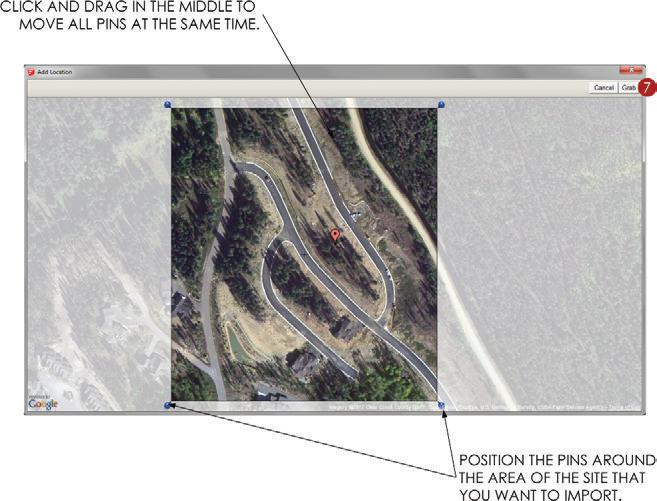
6. Select the site by repositioning the pins as shown in Figure 15.5. Typically, you will select the desired site plus any surrounding context that will be visible and potentially influence your design. Not to worry, you can easily add more terrain if you decide that you want more of the site in the future.
7. Once the selection rectangle surrounds the desired site, click the Grab button at the top-right corner of the Add Location window. This closes the Add Location window and returns your active screen to SketchUp. Now there is a full-scale aerial snapshot of the selected site in your SketchUp model.
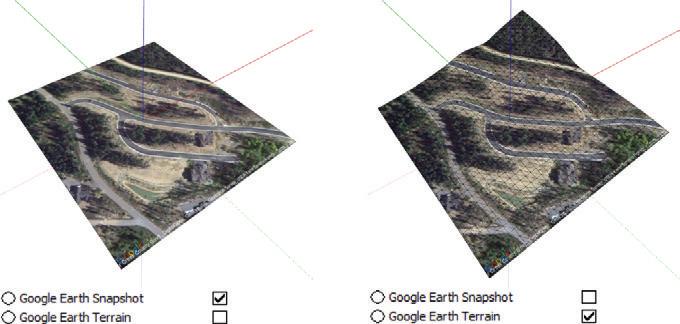
8. In addition to the flat aerial imagery, you have also imported the 3D terrain of the site (Figure 15.6). Click the Toggle Terrain button on the Google toolbar to toggle between the flat aerial imagery and the 3D terrain. The 2D aerial imagery and 3D terrain are simply locked groups of geometry that are automatically added to the Google Earth Snapshot layer and the Google Earth Terrain layer. The Toggle Terrain button simply switches these layers on and off.
Verifying Model location
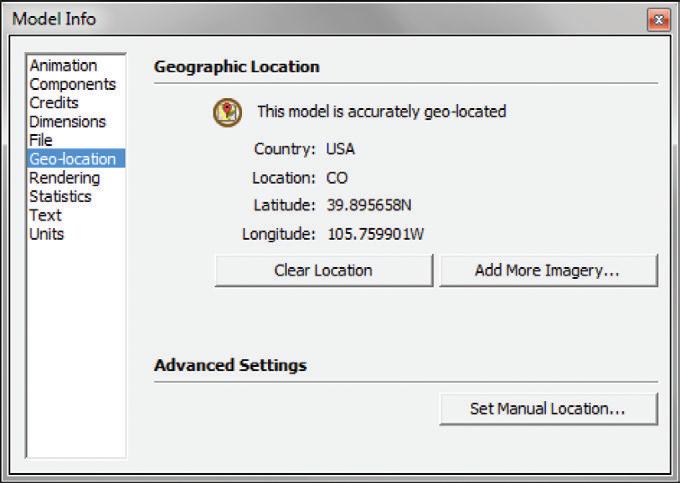
The Add Location feature attached a precise Earth location to your SketchUp model. You can verify the actual location by clicking on the Window drop-down menu and choosing Model Info, then click on the Geo-location tab (Figure 15.7). This tab displays the latitude and longitude, and it allows you to clear the location, add more imagery, and set the location manually (which is rarely necessary).
Verifying Solar north
By adding a precise location to your model, you also added an accurate Solar North direction. Solar North establishes the path of the sun relative to your SketchUp model to create extremely accurate shadows. To access the Solar North tools, click on the View dropdown menu and choose Toolbars c Solar North (Figure 15.8). The first button on the Solar North toolbar toggles the North arrow on and off. The green axis is north by default, and Solar North is often very closely aligned with the green axis. It is possible to change the Solar North direction of a model, but doing so is not recommended. The remaining two buttons on the Solar North toolbar, Set North tool and Enter North Angle tool, allow you to modify the Solar North direction with precision. If you do change the Solar North direction, the shadows will no longer be real. For best results, leave Solar North alone after you add a location to a SketchUp model.
Si T e Pl A n
After you add a location to your SketchUp model, generating a detailed site plan is simple. Use the SketchUp Drawing tools to trace the flat 2D aerial imagery and create vector linework that can be set to an architectural scale in LayOut or can be exported to other drafting programs. This makes a great starting point for any designer who wants to understand site constraints and the general scope of a project.
2D Plan
There are endless ways to approach the task of tracing a site. Once you are comfortable in SketchUp, you will find a few favorite tools that you will tend to lean on.
Trace Roads
Use the Drawing tools to trace the 2D aerial imagery and create a 2D site plan. Here are a few tips for tracing:
☑ Confirm that the Toggle Terrain button is off so that only the 2D aerial imagery is showing.
☑ Set the length snapping to a round dimension, such as 1 f or 1 g to keep your dimensions clean. In the Model Info dialog’s Units tab, check the Enable Length Snapping check box and enter the desired tolerance.
☑ Use the Materials browser’s Edit tab to desaturate and lighten the aerial imagery. This will make the lines stand out against the imagery and make it easier to see what you are working on.
☑ After tracing the road, close off the ends to create a surface. Then make them a group.
☑ Draw one side of the road, and then use the Offset tool to create the other side.
☑ Advanced tools, such as the bezier.rb script, will help you accurately trace curved roads.
☑ It is okay to be loose and sketchy when you’re tracing insignificant details.
☑ Use the Axes tool to align the axes with the buildings that you are tracing. Remember, it is a three-click process. First, click to set the origin; second, click to set the red axis; third, click to set the blue axis.
☑ Use the Rectangle tool instead of the Line tool to trace buildings. The Rectangle tool draws all lines on axis and generates significantly more geometry per click. Quickly clean up extra geometry by clicking and dragging over extra lines with the Eraser tool.
☑ Trace the house footprints and extrude them into 3D. Make each house a group (Figure 15.9).
Converting to 3D Roads
Now that you have created a 2D site plan, drape it onto the 3D terrain to create the 3D roads. This step uses, but does not require, the Instant Road plugin from www.valiarchitects.com If you use this script, the roads will have accurate topography lines. If you don’t use it, they won’t. They aren’t critical, but accurate topography lines make more realistic graphics, and using Instant Road is easy!
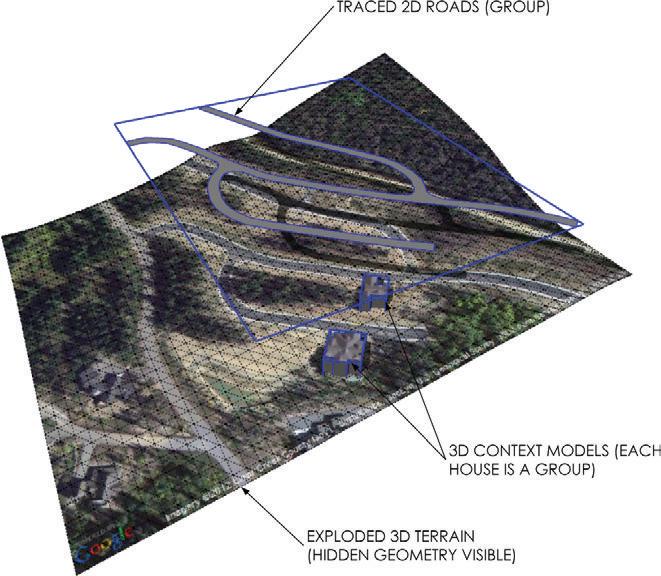
1. Toggle the 3D Terrain on.
2. Right-click on the terrain and choose Unlock.
3. Right-click on the terrain again and choose “Explode.”
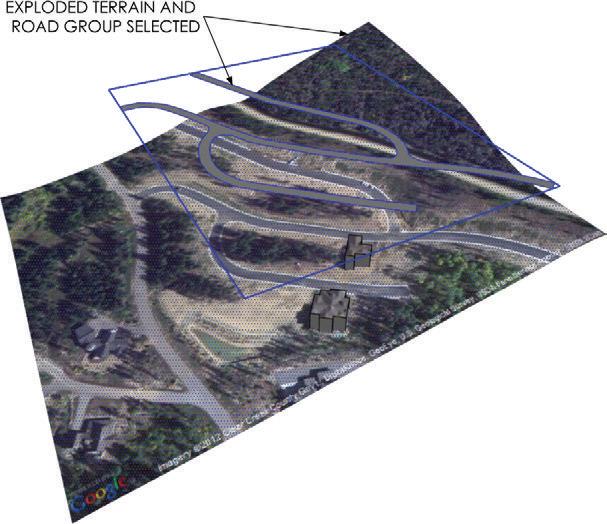
4. Using the Select tool, select the terrain mesh and the grouped 2D roads (Figure 15.10).
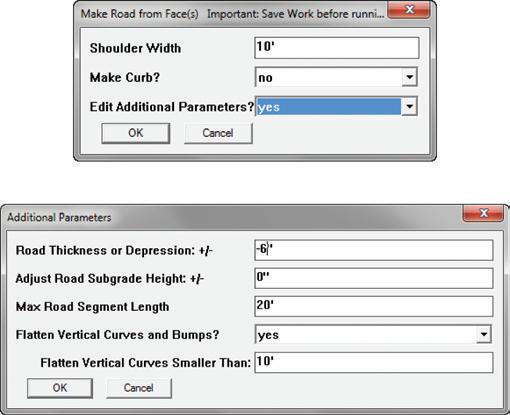
5. Click on the Plugin drop-down menu and choose Instant Road c Create Road from Face(s). Assign the appropriate settings. The free version limits the road shoulder to 3 f. If you’re using the Pro version, set the Shoulder Width to 10 f, set Make Curb to No, and set Edit Additional Properties to yes. Click OK to run the operation (Figure 15.11).
6. Select the new roads and the extra group of lines, then right-click on the selection and choose “Explode.”
7. Activate the Paint Bucket tool. Hold down the Alt key (Command on Mac) and click on the terrain to sample the GE Snapshot material.
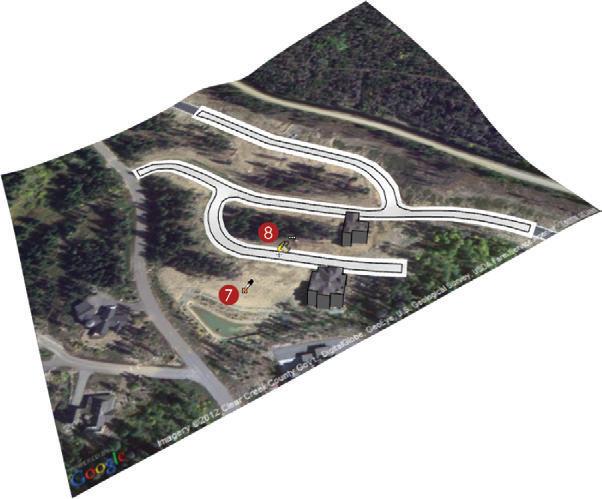
8. While holding down the Ctrl key (Option on Mac), click on the new road to apply the GE Snapshot material with the “clicked on” material to all of the connected faces (Figure 15.12).
9. Using the Select tool, triple-click on the terrain; assign Layer0 to all of the terrain edges and surfaces.
10. Right-click on the selection and choose Make Group.
11. Assign the Google Earth Terrain layer to the new 3D Terrain group.
12. Right-click on the new group and choose Lock to lock the group.
TIP instead of performing step 5, you could use the Drape tool to simply drape the 2D roads onto the 3D site. however, this won’t set the contour lines to accurately represent the roads later.
Always save before you perform any sandbox or instant road operations. you should do this not because the Sandbox tools are buggy, but because if you click on the wrong object, you could find yourself waiting a long time. The Sandbox tools have the potential to process and/or generate a huge amount of geometry with one click.
3D Topographic Survey
Imagine getting your paws on a complete topographic survey of a proposed site within five minutes of receiving a new project, without leaving your desk—and for free! Although a full survey can take weeks to schedule and days to complete, with SketchUp you can generate a schematic topographic survey based on the 3D terrain data from Google Earth.
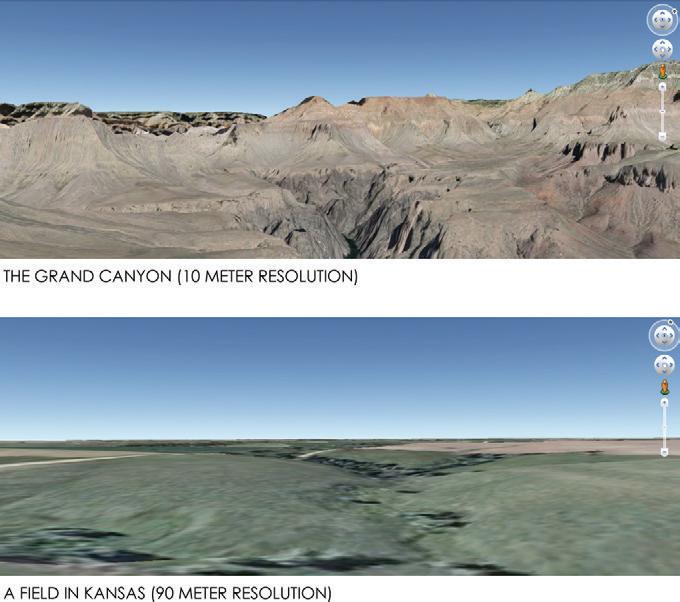
How accurate is the imported terrain data? Old terrain is 90-meter resolution, better terrain is 30-meter resolution, and excellent terrain is 10-meter resolution. All 3D terrain can be used for preliminary schematic design, but it’s not a replacement for a survey. In other words, don’t build off of the imported terrain data! The Grand Canyon at 10-meter resolution is spectacular, as you can see in Figure 15.13.
Slicing the Terrain
A topographic survey represents the earth sliced horizontally at regular intervals. Google provides the 3D terrain so you just need to slice it. Use simple rectangles and the Intersect menu to create topography lines, as discussed here:
Chapter 15: Site Analysis: Digital Site Survey
2. Using the Eraser tool, hold down the Shift key and click and drag over the houses to hide them if you have created them.
3. Draw a rectangle that is larger than the site. Double-click the rectangle using the Select tool to select the surface as well as the bounding edges. Right-click on the selection and choose Make Group (Figure 15.14).
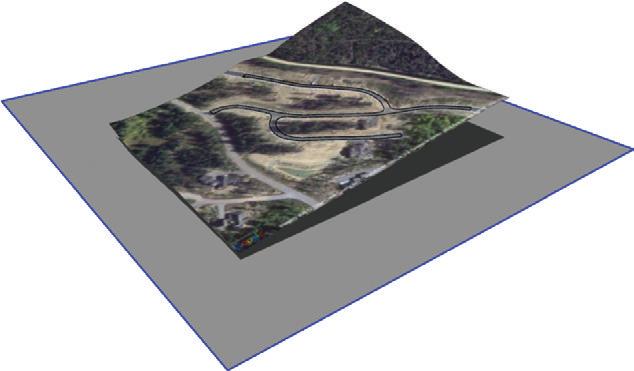
4. Move the rectangle down on the blue axis until it is obviously underneath the site geometry (Figure 15.15).
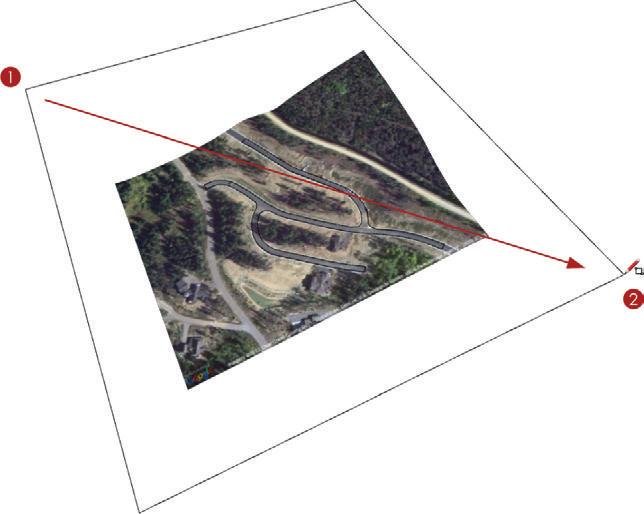
5. Copy the rectangle up along the blue axis 5 f (or whatever interval you want your topographic map to read; for example, 1 f, 10 f, 25 f). Immediately after you make a copy, type 150x , then press Enter, to make 150 additional copies of the original rectangle, each at the same interval. The goal is to make sure that the entire 3D terrain is covered with the rectangle slices (Figure 15.16).
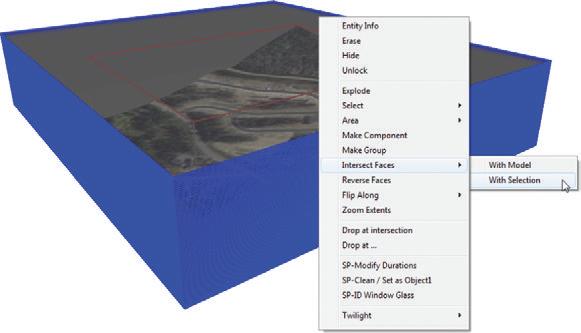
6. Select all of the rectangle slices and terrain. Right-click on the selection and choose Intersect Faces c With Selection (Figure 15.17). This draws all of the slices the rectangles make when they penetrate the 3D terrain, thereby creating topography lines.

7. Delete all of the rectangle slices. You no longer need them after the topography lines are created (Figure 15.18).
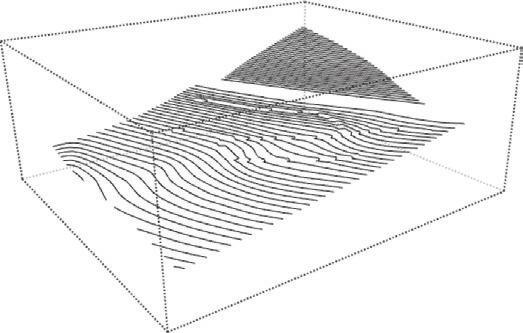
8. Click on the Edit drop-down menu and choose Select All. Right-click on the selection and choose Make Group. Because the 3D terrain is locked, only the topography lines will be included in the group.
TIP At this point, you could export the model to a 3D .dwg file so you can use it in your favorite cAD program. click on the file drop-down menu and choose export c 3D Model. Set the export type to .dwg and save to the appropriate folder.
Site Plan Scenes
You have created all of the geometry you need for the site plan and section. Now you need to create scenes to display the geometry in a meaningful way in LayOut. It is best to first create all of the geometry and scenes in SketchUp, and then move them to LayOut to create a presentation.
To create the scene representing the topographic lines, follow these steps:
1. Click on the Camera drop-down menu and choose Standard Views c Top.
2. Click on the Camera drop-down menu and check on Parallel Projection.
3. Click on the Camera drop-down menu and choose Zoom Extents.
4. Open the Layers dialog box by clicking on the Window drop-down menu and choosing Layers. Turn off both the Google Earth Terrain and Google Earth Snapshot layers. The site topography lines will remain.
5. Verify that the context houses are hidden.
6. Open the Scenes dialog by clicking on the Window drop-down menu and choosing Scenes. Click on the Add Scene button (+) in the top-left corner of the Scene dialog. Rename the scene LO_5 f TOPOGRAPHY. Place checks beside all of the properties to save.
7. Slide the new scene to the end of the line by clicking on the Move Scene Down button near the top-right corner of the Scenes dialog (Figure 15.19).
TIP Before starting the next scene, click on the lo_5 f ToPogrAPhy scene and be careful not to move the camera. To properly align in layout, two scenes need to have the same camera view.
To create the scene that represents the site plan, follow these steps:
1. Click the Add Scene button (+) in the top-left corner of the Scene dialog. Rename the scene LO_SITE PLAN . Place checks beside all of the Properties to Save.
2. Click on the Edit drop-down menu and choose Unhide All. You should be able to see the context houses again.
3. Hide the topography lines by holding down the Shift key and scrubbing over them with the Eraser tool. The entire group will be hidden with one swipe.
4. Toggle on the 3D terrain by using the Toggle Terrain button on the Google toolbar.


5. Turn on the shadows (Figure 15.20).

6. Right-click on the LO_SITE PLAN scene tab at the top of the screen and choose Update (Figure 15.21).
The 5 f TOPOGRAHY and SITE PLAN scenes are complete, but you won’t need them until later in this section when you create the final presentation in LayOut.
Si T e Sec T ion
Site sections clearly describe level changes throughout a site. Using the Section tool in SketchUp to cut through the 3D site topography will allow you to generate unlimited site sections.
Section Plane
Use a section plane to slice the site and clearly describe the elevation changes present at the site. Just follow these steps:
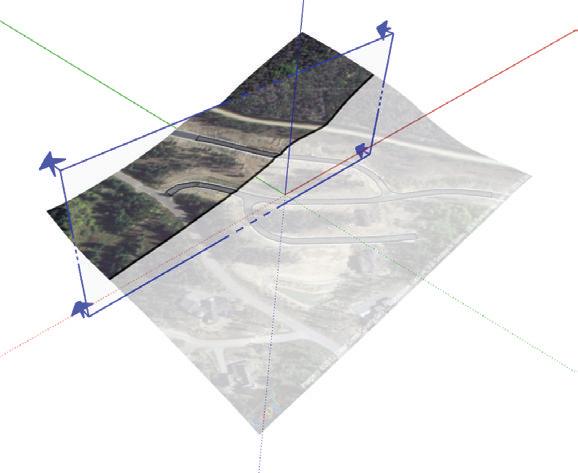
1. Orbit into a 3D view and zoom out to take in the entire 3D terrain on one screen.

2. Activate the Section Plane tool from the Google toolbar. Find the proper orientation for the section plane, hold Shift to lock the orientation, and then click to place the section plane (Figure 15.22).
3. Use the Move tool to adjust the location of the section plane as shown in Figure 15.23.
Site Section Scene
Now that you have added a section through the site, you will need to add a scene to create the Site Section drawing in LayOut. Just follow these steps:
1. Click on the 2D DRAWING utility scene tab at the top of your screen.
2. To open the Scenes dialog, click on the Window drop-down menu and choose Scenes.
3. Click on the plus sign (+) to add a scene. Check on all of the properties to save. Name the scene LO_SITE SECTION .
4. Right-click on the section plane and select Align View to set the camera angle perpendicular to the section plane.
5. Click on the Camera drop-down menu and verify that the camera is set to Parallel Projection.
6. Click on Zoom Extents to maximize the geometry on your screen.
7. Right-click on the LO_SITE SECTION scene tab at the top of the screen and choose Update.
8. Click the Move Page button to slide the new scene to the end of the line (Figure 15.24).
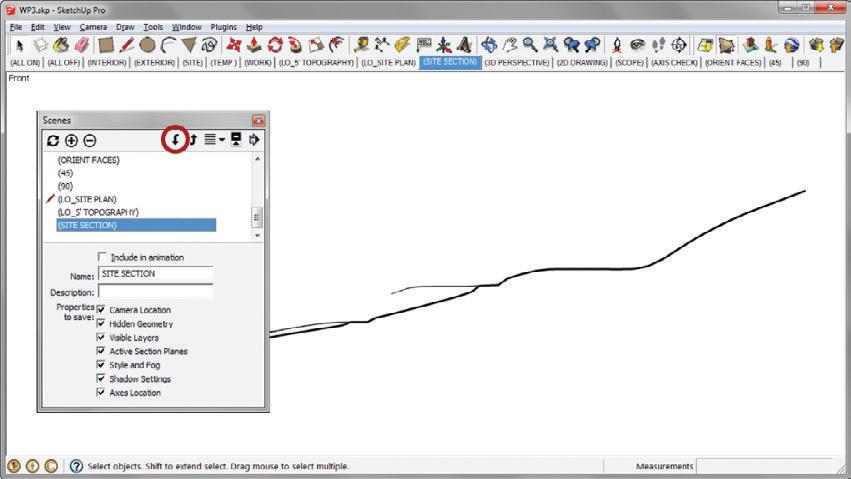
At this point, you must save your model to the appropriate project folder or TEMP folder. You will need the saved file to create the final LayOut presentation. Name this file BIC_Winter Park Site.skp
f in A l Dr AW ing S
Now that you have created all of the scenes you need for the digital site survey, you are ready to present them in LayOut. In this section, you will arrange the scenes and use advanced LayOut operations to create background drawings you can use for your sketches during the design process. After some practice, you should be able to generate this type of digital-site survey graphic in just a few minutes. These graphics are also great to use when you are sitting down with a client to discuss a new project.
Site Plan
Create a site plan to think through site logistics and explain site improvements. Just follow these steps:
1. Open LayOut. Select the BIC_8.5 x 11_Landscape template (Figure 15.25).
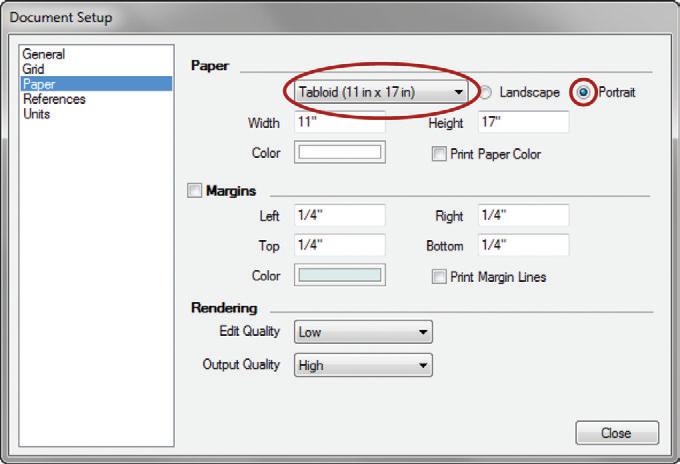
2. Click on the File drop-down menu and choose Document Setup c Paper. Adjust the paper settings to tabloid size with a portrait orientation (Figure 15.26).

3. Click on the File drop-down menu and choose Insert. Navigate to the folder containing the BIC Winter Park Site.skp file, select the file, and choose Open.
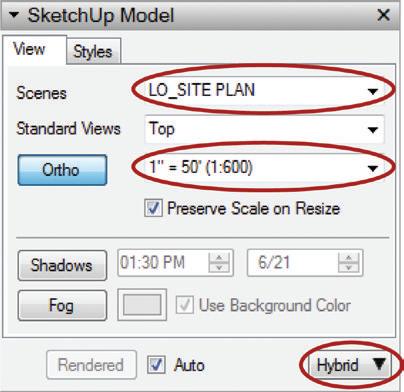
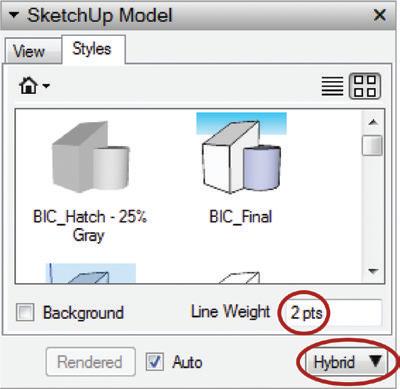
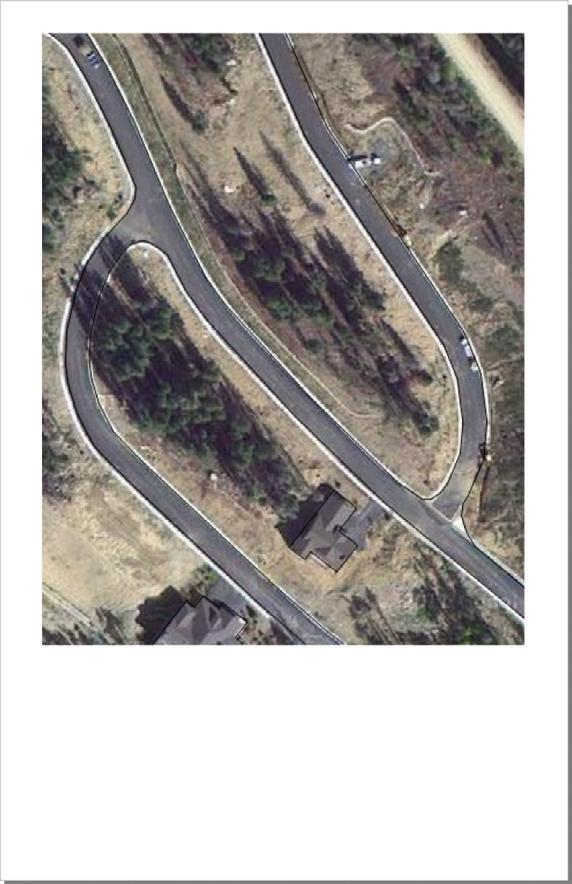
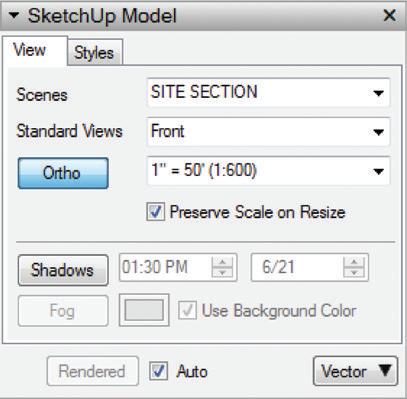
4. The BIC_Winter Park Site.skp file in the new viewport will be set to Last Saved View. With the viewport selected, assign the SITE PLAN scene in the SketchUp Model Inspector. Set the viewport to render as Hybrid so both the raster imagery and the vector linework will show. Set the viewport scale to 1 g = 50 f (Figure 15.27).
5. Use the Select tool to resize and move the viewport to fit the page as shown in Figure 15.28.
6. On the Style tab of the SketchUp Model Inspector, set the line weight to 2. If Auto-Render is unchecked, you should render the models on the page at this time (Figure 15.29).
Figure 15.27 The SketchUp Model settings indicate the scene, scale, and render settings.
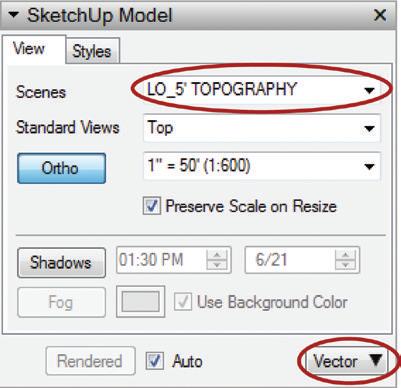
7. With the viewport selected, click on the Edit drop-down menu and choose Duplicate. This will make a copy of the viewport exactly 1 g down and 1 g to the right.
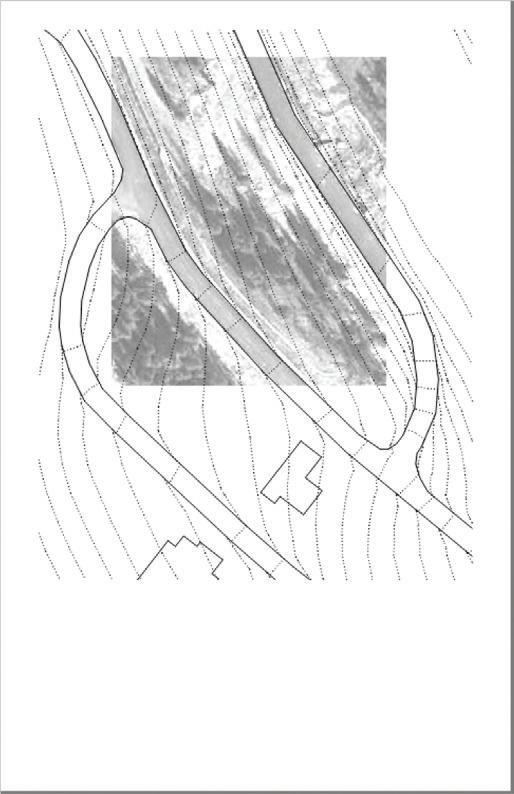
8. In the SketchUp Model Inspector, on the View tab, assign the LO_5 f TOPOGRAPHY scene to the viewport. Set the viewport to render as Vector (Figure 15.30).
9. While holding down the Shift key, tap the Left arrow key four times and then tap the Up arrow four times. When the Shift key is held down, each nudge is 1/4 g
10. Click on the Edit drop-down menu and choose Explode. The contents of the viewport become LayOut geometry and are no longer linked to the SketchUp model.
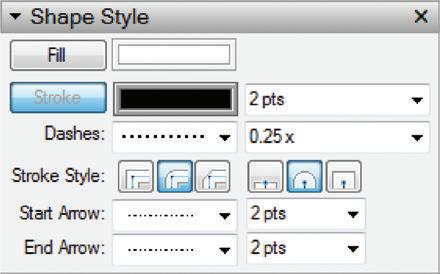
11. In the Shape Style Inspector, set the line weight to 2, the dash pattern to dots, and the dashes scale to .25 (Figure 15.31).
12. Right-click on the LO_SITE PLAN viewport and choose Explode. The raster contents of the viewport are now represented as an image in LayOut, and the vector contents of the viewport are now represented as LayOut geometry.
13. Both the raster and vector contents are contained in a group. Right-click again on the group and choose Ungroup.
14. Using the Rectangle tool, draw a mask shape around the site as shown in Figure 15.32. Draw the shape to cover up what you want to see.
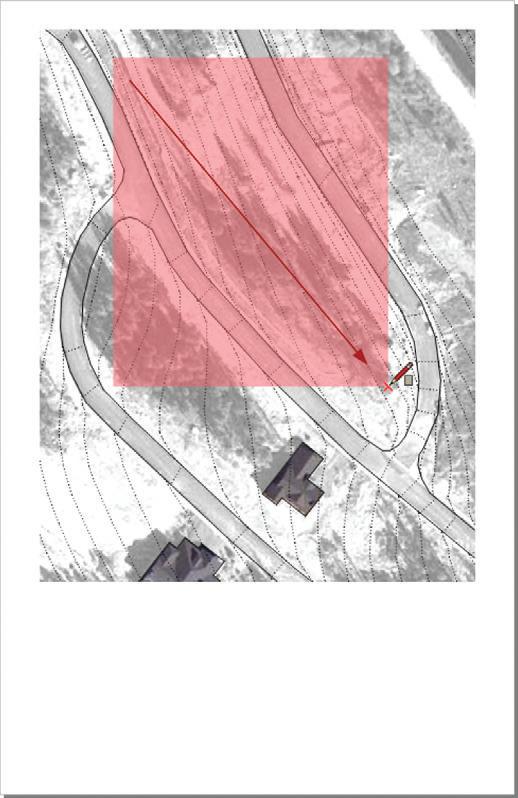
15. Using the Select tool, select both the mask shape and the image, right-click on the selection, and choose Create Clipping Mask. You can modify the mask shape by double-clicking on the masked image and then double-clicking on the masking shape. Press the Esc key to finish the edit (Figure 15.33). See Chapter 14 “Inserting Content” for more information on editing clipping masks.
Site Section
Create a site section to think through site grading and level changes. Just follow these steps:
1. Click on the File drop-down menu and choose Insert. Once again, navigate to the folder containing the Winter Park Site.skp file, select the file, and choose Open.
2. Within the SketchUp Model Inspector, assign the SITE SECTION scene to the new viewport. Set the viewport to render as Vector. Set the scale to 1 g = 50 f (Figure 15.34).
3. Resize and move the viewport to fit the page and include the site section drawing as shown.
4. Right-click on the viewport and choose Explode.

5. Right-click on the new group and choose Ungroup.
6. Delete the unwanted geometry as shown in Figure 15.35.
7. Select the Site section line. In the Shape Style Inspector, set the stroke width to 3 (Figure 15.36).
Annotation
1. Open the Scrapbooks Inspector and navigate to the TB - Elegant collection.
2. Add drawing titles to the presentation. Using the Select tool, double-click in the scrapbooks to change the drawing title, drawing number, and scale (Figure 15.37).
3. Using the Next Page button in the Scrapbooks Inspector, navigate to the Sections and Elevations page of the TB-Elegant scrapbook. Add a section cut line where the section plane was added in SketchUp (Figure 15.38).

4. Modify the section tag and drawing titles using the Select tool. Double-click on text to edit and correctly coordinate the drawings and tags.
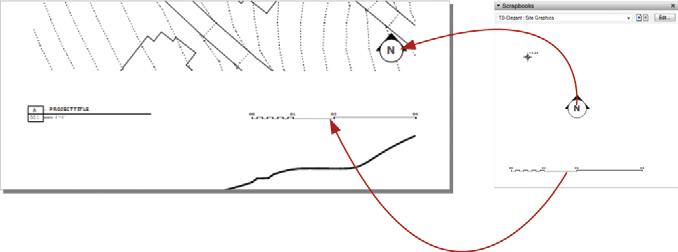
5. Using the Next Page button in the Scrapbooks Inspector, navigate to the Site Graphics page of the TB-Elegant scrapbook.
6. Add a graphic scale and North arrow from the collection (Figure 15.39).

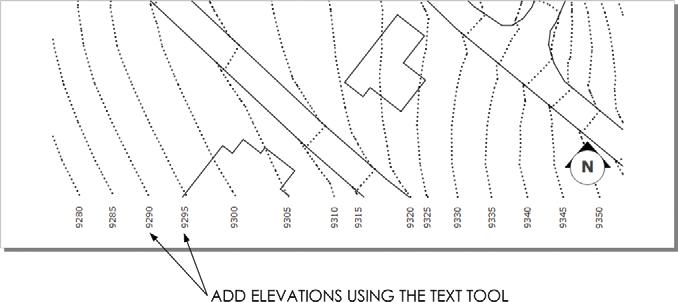
7. Use the Text tool to assign elevations to the topography lines. Find accurate elevations by hovering your cursor over points in Google Earth. You can quickly access the site in Google Earth by clicking on the File drop-down menu in SketchUp and choosing Preview in Google Earth (Figure 15.40, Figure 15.41).

e xporting PDf
Now that the presentation is complete, it is time to print and start designing. Click on the File dropdown menu and choose Export c PDF to create a .pdf file you can print or email. Navigate to an appropriate project folder, or your TEMP folder, and select Save (Figure 15.42).
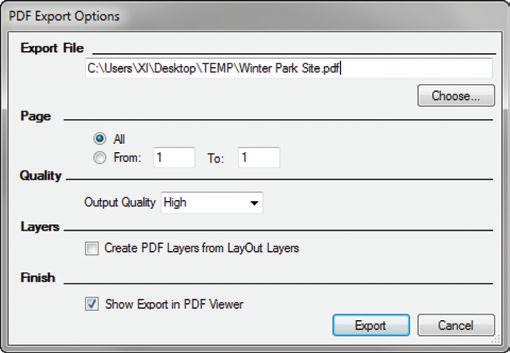
Uncheck Create PDF Layers from LayOut Layers. Typically, you won’t need to have these layers available in the .pdf, and they can sometimes cause problems at the print shop.
Set the Output Quality to High. Final output should always be at the highest resolution and quality possible (Figure 15.43).
c h APT er Poin TS
☑ You can explode viewports in LayOut for existing conditions because the existing conditions do not change.
☑ Many of the operations completed in this chapter can be accessed from several different places; an Inspector, a keyboard shortcut, a custom toolbar, a right-click menu, or from the drop-down menus at the top of the screen. Use whichever method feels best to you.
☑ You should export LayOut presentations to a .pdf file and print from there because a .pdf file gives you the most printing options. Avoid using the Print command in LayOut.
☑ After you practice making the digital site survey exercise five times, you should be able to do the whole thing in less than fifteen minutes.
☑ You can unlock and modify the terrain, but don’t move it. If you move the terrain, the geo-location settings and shadows will no longer be accurate.
Chapter 15: Site Analysis: Digital Site Survey


