THE STEIN TEAM

New York City Q1 2023 Market Update
MARKET OVERVIEW
Please find the Sotheby’s International Realty 2023 Q1 report. As you look through, it is important to note that comparing Q1 ‘23 to Q1 ‘22 is a bit misleading, as ‘22 Q1 was an incredibly active quarter and we saw more real estate change hands than ever before. This was due to the pent up demand from buyers who had been on the sidelines during the depths of the pandemic who finally reemerged and went on a buying frenzy. The frenzy came to an abrupt halt in April of 2022 with the rise in interest rates and the drop in the financial markets. From April ‘22 to until very recently, we saw far far less real estate trade as buyers again retreated to the sidelines. It has only been in the past month or so that we have seen an increase in activity, with buyers now returning to the market.
One other observation from this report worth mentioning is that while Q1 of ‘23 was slow in almost all sectors, the ultra-high end, $10m and above, remained strong and this is reflected in the fact that the average sales price rose year over year. We attribute this to the fact that ultra-high-net-worth buyers have been undeterred by interest rate hikes as many purchase in all cash.
We appreciate the continued trust you place in us and our entire team. We value the opportunity to advise you, your family, colleagues & friends. Please always feel free to reach out to us with any questions.
Jeremy & Robin Stein
The Stein Team, #3 Sotheby’s Team Nationwide

SteinNewYork.com
JEREMY STEIN
Sr. Global Real Estate Advisor | Associate Broker 917.854.4411
Jeremy.Stein@sothebys.realty
ROBIN STEIN
Sr. Global Real Estate Advisor | Associate Broker 917.570.8386
Robin.Stein@sothebys.realty
3 37 EAST 67TH STREET, PHAB
Testimonials
“My wife and I have used Robin and Jeremy Stein as our real estate brokers for the past 15 years, representing us in the sale of four apartments in New York City. We have used the Stein Team to represent us because of their professionalism, market knowledge, hard work and ability to maximize value. In every instance, they have dedicated the appropriate resources, time and effort in managing the sale process resulting in a successful transaction.”
 - THOMAS
“Jeremy and Robin are the only people that I would trust as my brokers. They take the time to understand precisely what I am looking for, and as a result, constantly deliver the right stuff. Whether I’m on the buy side or the sell side, Jeremy and Robin always protect my interests, yet still manage to get the deal done. Both their strategy and execution are brilliant, and there’s no one else I’d want in my corner when it comes to residential real estate.”
- ERIC
“Jeremy and Robin are professional, knowledgeable and extremely effective. In addition, we always know that they will put our interests first. Twice, they have talked us out of purchasing homes, and each time something better came along later, just as they had suggested it would. We recommend Jeremy and Robin wholeheartedly.”
- ED & LAUREN
“Thank you for the great job you and your team did in helping to sell our home. We always felt well supported, from our earliest meetings through the final closing. The time, effort, energy and focus that you showed really made a difference, and we appreciate the high level of communication with your team throughout the process. We would highly recommend your group in the future!”
- MICHAEL & LAURIE
“Your broker becomes the most important person in your life when finding a home for your family. Jeremy and Robin were trusted advisors during these times in our life. I wouldn’t trust anyone else with that responsibility.”
- WILL
5
907 FIFTH AVENUE, MAISONETTE
112W18PH6A.com
Market Overview {Q1 | 2023}
In comparison to Q1 2022, in Q1 2023, the number of transactions dropped 38% market-wide, with the $3M-$10M market having the most sizeable drop, being down 47%. The over $10M market had a significant drop in number of closed sales as well, falling 41%. However, the average sales price for the over $10M market increased by 35%.
2,492 Closed Sales
-38% Change in Closed Sales {2023 v 2022}
$1.94M Average Sales Price
Closed sales reflect market activity 4-6 months prior due to the protracted closing period in NYC.
Comparing Y-O-Y may be misleading as the NYC real estate market was still very actively recovering from the Covid shutdown in Q1 2022.
-4% Change in Average Sales Price {2023 v 2022}
manhattan
Number of Closed Sales vs. Inventory
Average / Median Sales Price
Number of Closed Sales Average Sales Price Median Sales Price
UNDER $3 Million {2023 v 2022} -36% -6% -8% 1Q:23 2,120 $1.10M $875K 1Q:22 3,334 $1.17M $950K BETWEEN $3 - 10 Million {2023 v 2022} -47% -2% -3% 1Q:23 322 $4.77M $4.20M 1Q:22 613 $4.88M $4.35M OVER $10 Million {2023 v 2022} -41% 35% 19% 1Q:23 50 $19.51M $15.35M 1Q:22 85 $14.41M $12.90M ALL Price Points {2023 v 2022} -38% -4% -15% 1Q:23 2,492 $1.94M $1.02M 1Q:22 4,032 $2.02M $1.20M
Overview / New York City Q1 Market Update Average Sales Price Median Sales Price # of Closed Sales Inventory1,000 2,000 3,000 4,000 5,000 6,000 7,000 8,000 9,000 Q1:21 Q2:21 Q3:21 Q4:21 Q1:22 Q2:22 Q3:22 Q4:22 Q1:23 $$500,000 $1,000,000 $1,500,000 $2,000,000 $2,500,000 Q1:21 Q2:21 Q3:21 Q4:21 Q1:22 Q2:22 Q3:22 Q4:22 Q1:23
5
Inventory
All New York City
109
216 419
$20 Million and Above
$10 - 20 Million
$6 - 10 Million
$4 - 6 Million
$2 - 4 Million
$1 - 2 Million
Under $1 Million TOTAL
CONDOS & CO-OPS
The historic absorption range of equilibrium for the New York City market area is 6-8 months. We ended Q1 2023 with 6,120 active units on the market. The absorption rate of active inventory was 6.8 months in Q1 2023. This statistic means that it would take 6.8 months to absorb the active inventory that is currently on the market based upon the rate of sales over the last 6 months. Based on the same calculation, it would take less than 7 months to absorb the current inventory priced below $2M, less than 12 months for inventory priced between $2M-$6M, over 17 months for inventory priced between $6M-20M, and nearly 2 years to absorb properties priced above $20M given the current inventory in Manhattan.
Absorption Line of Equilibrium 32.6% 24.9% 21.7% 8.6% 6.8% 3.5% 1.8% 0 5 10 15 20 25 Under $1M $1-2M $2-4M 4-6M 6-10M 10-20M $20M+
The absorption rate is calculated by taking the total number of currently active listings and dividing by the average number of closed sales over the 6-month period. 529 1,326 1,523 1,998 6,120
Number of Active Listings
Absorption Rate
Average Days on Market vs. Listing Discount
Overview / New York City Q1 Market Update All New York City
Days
Market Listing Discount
Average
on
Q1 2021 Q2 2021 Q3 2021 Q4 2021 Q1 2022 Q2 2022 Q3 2022 Q4 2022 Q1 2023 Average Days on Market 152 159 123 117 112 105 89 110 135 Listing Discount -7.1% -6.2% -5.4% -5.3% -5.0% -7.0% -5.9% -8.9% -9.7% Listing Discount Average Days on Market 0 20 40 60 80 100 120 140 160 180 -12.0% -10.0% -8.0% -6.0% -4.0% -2.0% 0.0% Q1:21 Q2:21 Q3:21 Q4:21 Q1:22 Q2:22 Q3:22 Q4:22 Q1:23 7

There is opportunity in any market. Choose a real estate partner who gets results. Feature Property: 22East93.com © 2023 Sotheby’s International Realty. All Rights Reserved. Sotheby’s International Realty® is a registered trademark and used with permission. Each Sotheby’s International Realty office is independently owned and operated, except those operated by Sotheby’s International Realty, Inc. The Sotheby’s International Realty network fully supports the principles of the Fair Housing Act and the Equal Opportunity Act. SOTHEBYSREALTY.COM/NYC MANHATTAN BROKERAGES
The Luxury Market
Closed Sales Count, Average Sales Price & Highest Sales Price
Average Sales Price vs. # of Closed Sales
All New York City Co-Ops & Condos Over $10M The Luxury Market / New York City Q1 Market Update Q1 2021 Q2 2021 Q3 2021 Q4 2021 Q1 2022 Q2 2022 Q3 2022 Q4 2022 Q1 2023 # of Closed Sales 28 77 87 72 85 91 75 53 50 Average Sales Price $16.80M $17.50M $18.38M $22.57M $14.41M $19.51M $18.52M $17.72M $19.51M Highest Sales Price $41.00M $82.50M $66.00M $188M $46.96M $101M $75.89M $72.00M $51.00M Sales in the luxury price sector, above $10M, decreased by 5.7% compared to last quarter. However, the average sales price in this sector is higher than Q1 2022. sothebysrealty.com # of Closed Sales Average Sales Price10 20 30 40 50 60 70 80 90 100 $0 $5,000,000 $10,000,000 $15,000,000 $20,000,000 $25,000,000 Q1:21 Q2:21 Q3:21 Q4:21 Q1:22 Q2:22 Q3:22 Q4:22 Q1:23 9
Condos
In Q1 2023, 1,058 condominium transactions closed representing a 44% decrease from 2022. Condominiums priced between $3M-$10M saw the biggest decrease in number of closed sales at 49%. As compared to Q1 2022, the average sales price of condominiums increased 7%, and the average price per square foot increased 10%.
1,058 Closed Sales
-44% Change in Closed Sales {2023 vs. 2022}
$2.95M Average Sales Price
7% Change in Average Sale Price {2023 vs. 2022}

{Q1 | 2023} manhattan
59West12thSt4EF.com
Number of Closed Sales
Average / Median Sales Price
Number of Closed Sales Average Sales Price Median Sales Price Average Price/Sq. Ft.
Condos / New York City Q1 Market Update
UNDER $3 Million {2023 v 2022} -43% -5% -8% 0% 1Q:23 783 $1.37M $1.20M $1,476 1Q:22 1,373 $1.44M $1.30M $1,477 BETWEEN $3 - 10 Million {2023 v 2022} -49% 1% 2% 7% 1Q:23 229 $4.98M $4.48M $2,263 1Q:22 445 $4.93M $4.40M $2,121 ABOVE $10 Million {2023 v 2022} -36% 34% 20% 20% 1Q:23 46 $19.88M $15.68M $4,345 1Q:22 72 $14.82M $13.03M $3,611 ALL Price Points {2023 v 2022} -44% 7% -6% 10% 1Q:23 1,058 $2.95M $1.62M $2,167 1Q:22 1,890 $2.77M $1.73M $1,963
Average Sales Price Median Sales Price $0 $500,000 $1,000,000 $1,500,000 $2,000,000 $2,500,000 $3,000,000 $3,500,000 Q1:21 Q2:21 Q3:21 Q4:21 Q1:22 Q2:22 Q3:22 Q4:22 Q1:23500 1,000 1,500 2,000 2,500 Q1:21 Q2:21 Q3:21 Q4:21 Q1:22 Q2:22 Q3:22 Q4:22 Q1:23 11
Co-Ops
The 1,434 closed co-op transactions in Q1 2023 represented a 33% decrease in number of sales compared to Q1 2022. The most significant drop was seen for co-ops priced above $10M, with the number of sales decreasing 69% compared to Q1 2022. However, the average and median prices in this sector each increased by 27% and 15% respectively, versus the entire co-op market, which saw average sales prices decline by 12%.

1,434 Closed Sales
-33%
Change in Closed Sales {2023 v 2022}
$1.19M
Average Sales Price
-12%
Change in Average Sales Price {2023 v 2022}
{Q1
| 2023} manhattan
345East57St11AB.com
151 East 58th Street, PH55W 151 East 58th Street, PH55W
Number of Closed Sales
Average / Median Sales Price
Number of Closed Sales Average Sales Price Median Sales Price
Co-Ops / New York City Q1 Market Update
UNDER $3 Million {2023 v 2022} -32% -5% -3% 1Q:23 1,337 $938K $750K 1Q:22 1,961 $989K $775K BETWEEN $3 - 10 Million {2023 v 2022} -45% -11% -8% 1Q:23 93 $4.24M $3.90M 1Q:22 168 $4.74M $4.25M ABOVE $10 Million {2023 v 2022} -69% 27% 15% 1Q:23 4 $15.33M $13.50M 1Q:22 13 $12.10M $11.70M ALL Price Points {2023 v 2022} -33% -12% -4% 1Q:23 1,434 $1.19M $799K 1Q:22 2,142 $1.35M $828K
Average Sales Price Median Sales Price500 1,000 1,500 2,000 2,500 3,000 Q1:21 Q2:21 Q3:21 Q4:21 Q1:22 Q2:22 Q3:22 Q4:22 Q1:23 $0 $200,000 $400,000 $600,000 $800,000 $1,000,000 $1,200,000 $1,400,000 $1,600,000 Q1:21 Q2:21 Q3:21 Q4:21 Q1:22 Q2:22 Q3:22 Q4:22 Q1:23 13
Neighborhood Highlights
Upper East Side | north of 58th street and south of 96th Street, Fifth Avenue to East End Avenue
Upper West Side | north of 58th Street and south of 110th Street, CPW to Riverside Drive (including CPS)
new york city
CONDOS Q1 2023 Q1 2022 % Change Closed Sales 187 253 -26% Average Sales Price $4.09M $3.15M 30% Median Sales Price $2.44M $1.73M 42% CONDOS Q1 2023 Q1 2022 % Change Closed Sales 218 294 -26% Average Sales Price $3.44M $3.64M -6% Median Sales Price $1.54M $2.10M -27% COOPS Q1 2023 Q1 2022 % Change Closed Sales 425 593 -28% Average Sales Price $1.56M $1.70M -8% Median Sales Price $1.00M $960K 4% COOPS Q1 2023 Q1 2022 % Change Closed Sales 275 445 -38% Average Sales Price $1.29M $1.52M -16% Median Sales Price $898K $975K -8%
Midtown | north of 34th Street and south of 57th Street
Uptown | north of 96th Street on the East Side and north of 110th Street on the West Side
Neighborhood Highlights / New York City Q1 Market Update
CONDOS Q1 2023 Q1 2022 % Change Closed Sales 95 253 -62% Average Sales Price $2.01M $1.60M 26% Median Sales Price $1.15M $1.21M -5% CONDOS Q1 2023 Q1 2022 % Change Closed Sales 90 211 -57% Average Sales Price $910K $1.03M -12% Median Sales Price $799K $875K -9% COOPS Q1 2023 Q1 2022 % Change Closed Sales 170 327 -48% Average Sales Price $673K $818K -18% Median Sales Price $563K $615K -9% COOPS Q1 2023 Q1 2022 % Change Closed Sales 164 165 -1% Average Sales Price $553K $658K -16% Median Sales Price $500K $570K -12% 15
Neighborhood Highlights
Downtown | South of 34th Street through TriBeCa
Financial District / Battery Park
new york city
CONDOS Q1 2023 Q1 2022 % Change Closed Sales 386 728 -47% Average Sales Price $3.14M $3.42M -8% Median Sales Price $1.98M $2.60M -24% CONDOS Q1 2023 Q1 2022 % Change Closed Sales 82 151 -46% Average Sales Price $1.50M $1.68M -10% Median Sales Price $1.01M $1.17M -14% COOPS Q1 2023 Q1 2022 % Change Closed Sales 358 593 -40% Average Sales Price $1.22M $1.38M -12% Median Sales Price $843K $915K -8% COOPS Q1 2023 Q1 2022 % Change Closed Sales 42 19 119% Average Sales Price $1.27M $748K 70% Median Sales Price $970K $700K 39%
Total Number of Sales by Neighborhood
Average Sales Price by Neighborhood
Neighborhood Highlights / New York City Q1 Market Update
Uptown Upper East Side Midtown FiDi / Battery Park Upper West Side Downtown Uptown Upper East Side Midtown FiDi / Battery Park Upper West Side Downtown 0 200 400 600 800 1,000 1,200 1,400 1,600 Q1:21 Q2:21 Q3:21 Q4:21 Q1:22 Q2:22 Q3:22 Q4:22 Q1:23 $0 $500,000 $1,000,000 $1,500,000 $2,000,000 $2,500,000 $3,000,000 Q1:21 Q2:21 Q3:21 Q4:21 Q1:22 Q2:22 Q3:22 Q4:22 Q1:23 17


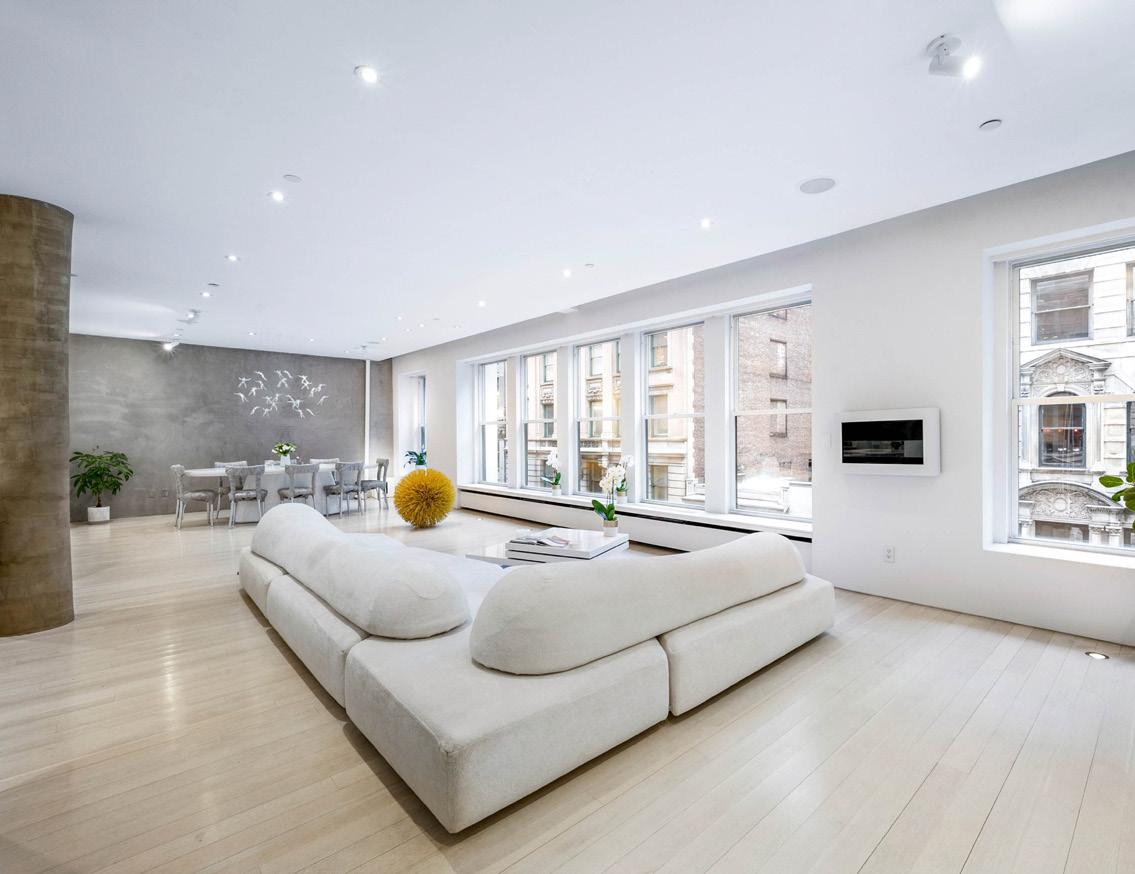
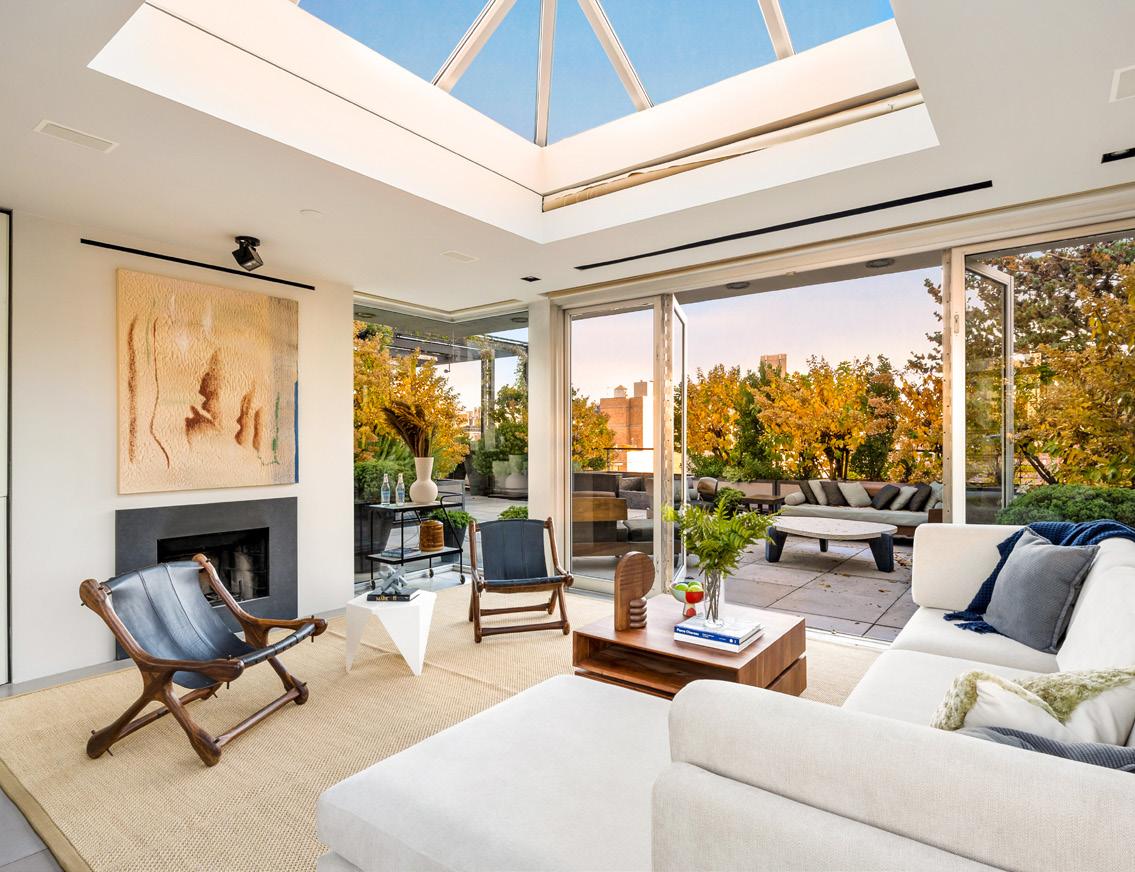

7 Current Offerings PUCK PENTHOUSE: 293 LAFAYETTE STREET, PH IV SoHo | $35,000,000 Select Current Offerings 10 SULLIVAN STREET, APT. 7A SoHo | $8,750,000 147 WEST 15 th STREET, PH Flatiron | $5,600,000 435 E AST 5 2 nd STR EET AP T 8/9C Sutton Place | $6,950,000 40 EAST 1 9 th STREE T, AP T 5 Flatiron | For Sale: $5,495,000 | For Rent: $25,000/mo. THE STEIN TEAM
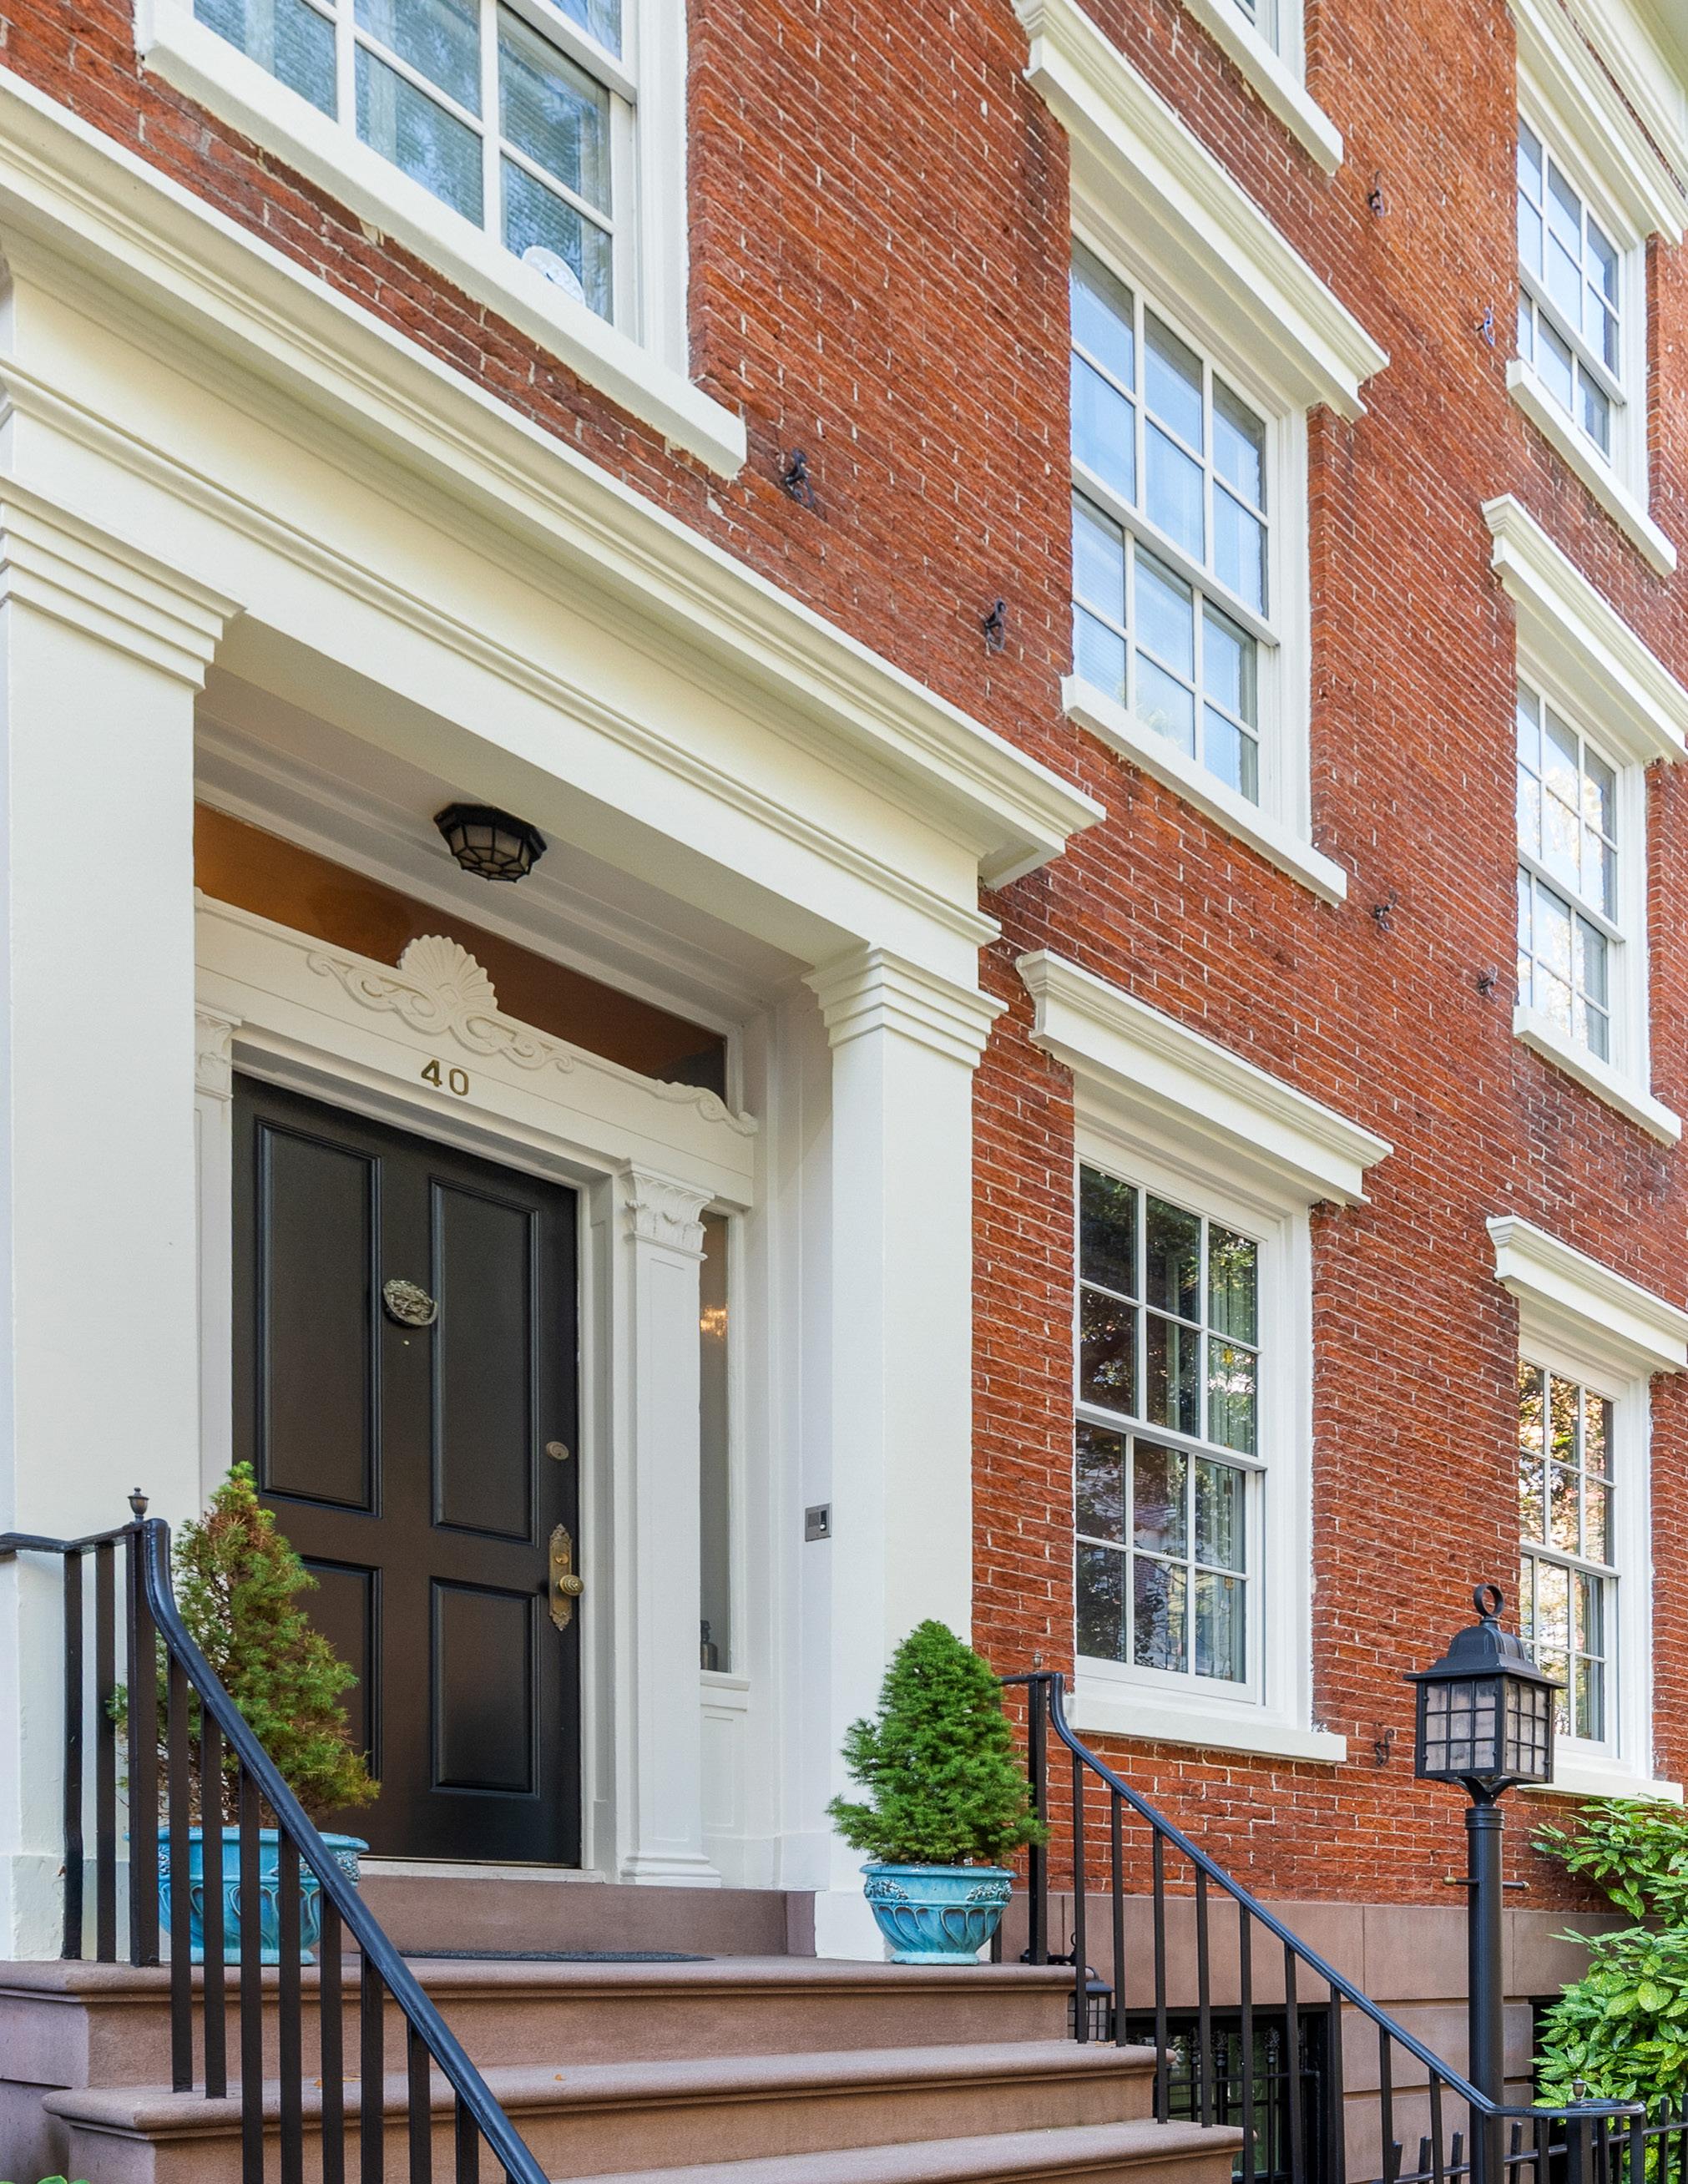


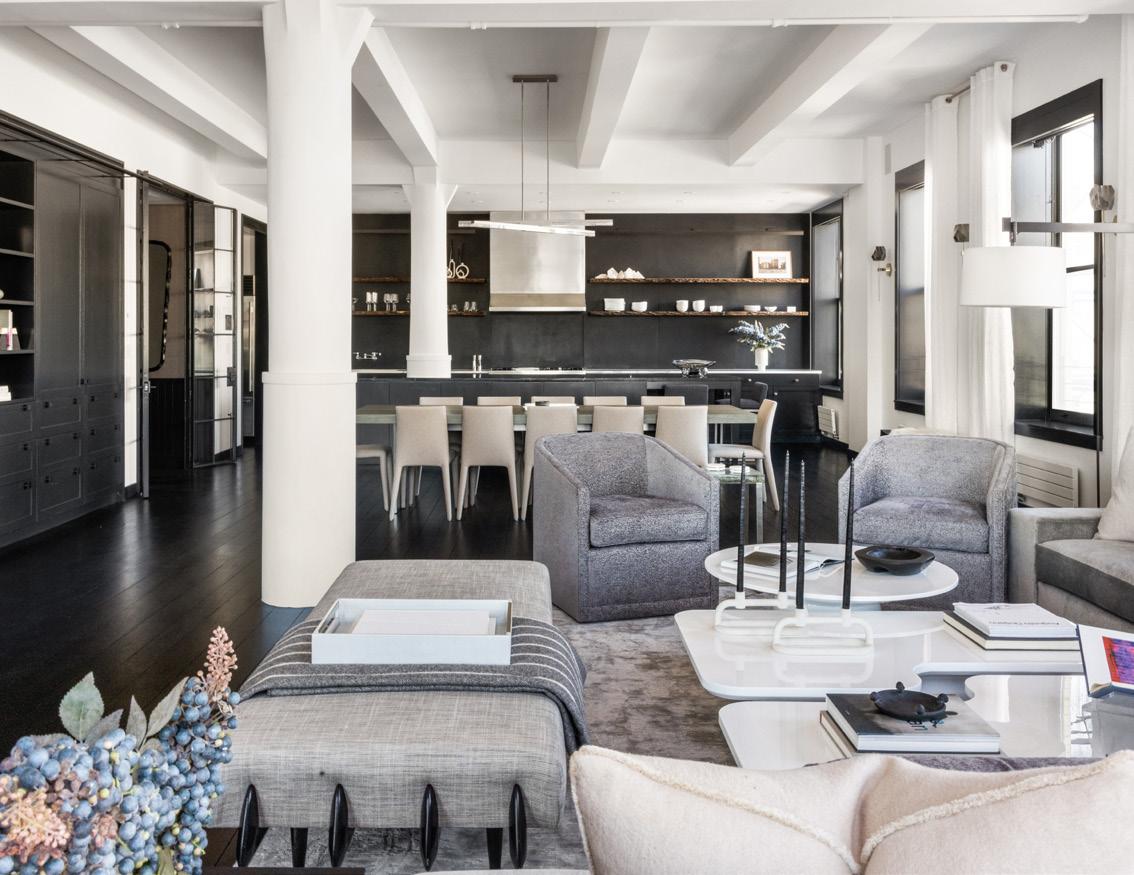
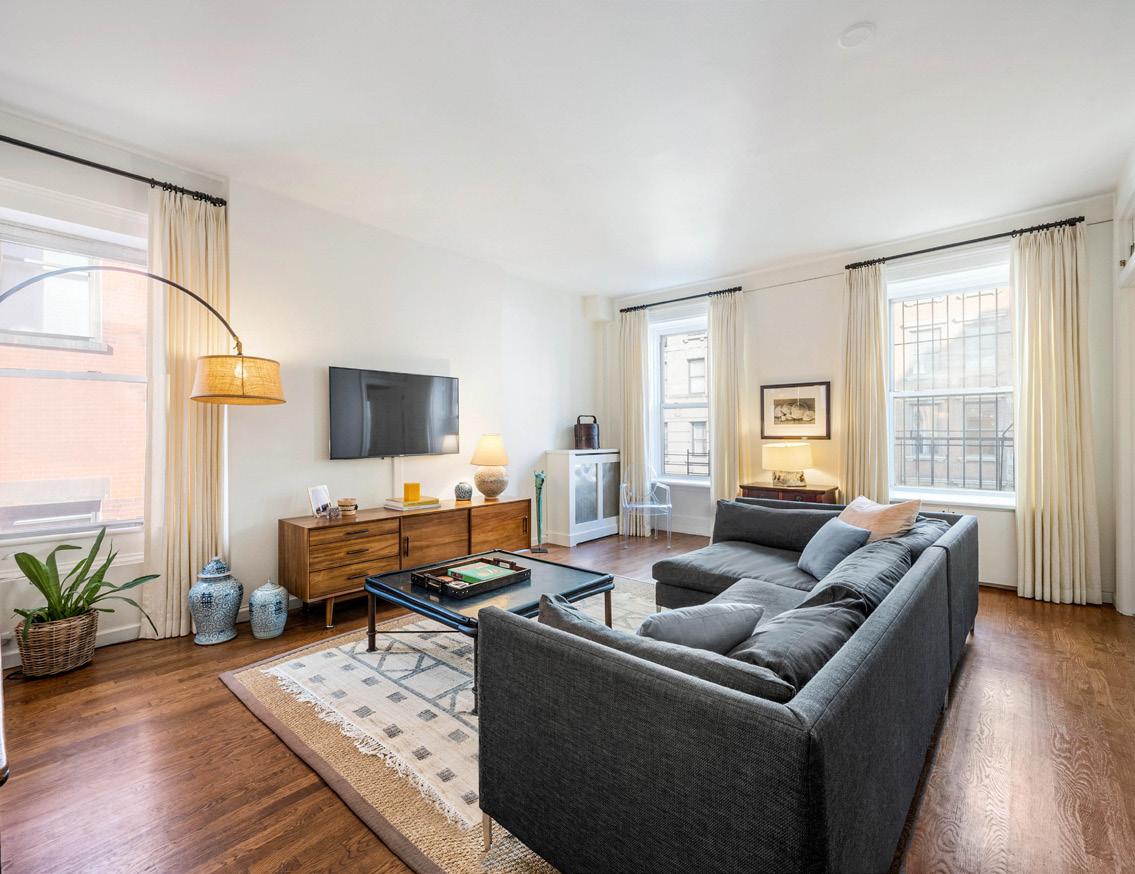
9 Select Sales 40 WEST 11 th STREET Greenwich Village | Closed for $9,750,000 Select Sales 161 HUDSON STREET, PH TriBeCa | In Contract - Last Asking $16,495,000 907 FIFTH AVENUE, MAISONETTE Upper East Side In Contract - Last Asking $6,650,000 3 GREAT JONES, 4 th FLOOR NoHo | Closed for $1,750,000 1 EAST 62 nd STREET, APT. 5B Lenox Hill Closed for $2,280,000 THE STEIN TEAM

STEINNEWYORK.COM © 2023 Sotheby’s International Realty. All Rights Reserved. Sotheby’s International Realty® is a registered trademark and used with permission. Each Sotheby’s International Realty office is independently owned and operated, except those operated by Sotheby’s International Realty, Inc. This material is based upon information which we consider reliable but because it has been supplied by third parties, we cannot represent that it is accurate or complete and it should not be relied upon as such. All offerings are subject to errors, omissions, changes including price or withdrawal without notice. If your property is listed with a real estate broker, please disregard. It is not our intention to solicit the offerings of other real estate brokers. We are happy to work with them and cooperate fully. Equal Housing Opportunity.
THE STEIN TEAM


 - THOMAS


