1 2
Dr.RachnaJawa,Ms.Monika1
1

1 2
Dr.RachnaJawa,Ms.Monika1
1
ThefastergrowthinIndianmutualfundindustryismakingitoneofthemostcompetitivesegmentsofthefinancialsector AccordingtotheAssociationofMutual FundsinIndia(AMFI),thetotalAssetUnderManagement(AUM)ofIndianMutualFundIndustrystoodatapprox.Rs.40trillion.ThejourneyofthisAUMsizefrom Rs.10trilliontoRs.40trillionhavebeenjustcoveredwithinaspanoflasteightyears(i.e.,fromyear2014toyear2022).ThegrowthofIndianMutualfundIndustry hasbeenphenomenal.Indianmutualfundindustryhascoveredalongwayfromasingleschemei.e.,US-64industryto43operationalmutualfundsandaround1500 operationsmutualfundschemes.ThispapertriestocoversvariousaspectofmutualfundsindustryinIndia,startingwiththebasicconceptofmutualfundandits advantages.Ithighlights,growthtrendsofAverageAssetUnderManagement(AAUM)andinvestorfolios,statewisecontributionsintheAAUM.
KEYWORDS:AssetUnderManagement(AUM),LiquidSchemes,DebtorientedSchemes,EquityorientedSchemes,HybridSchemesandETFs/FoFsSchemes.
Theeconomicprogressofacountryisheavilyinfluencedbythecapitalmarket financialsecuritiesorbythecredit-basedfinancingbythefinancialinstitutions. These financing mechanisms proved to be the real indicators of the economic developmentasthereisinstantinformationprocessingtakesplaceandwhichis ultimatelyreflectedinthewholeeconomythroughstockmarketandcapitalmarkets.
Thefinancialreformsof1991bythegovernmentofIndiabroughtmanychanges inthefinancialmarketsthroughlayingthefoundationsofarobustfinancialsystem.Thedoorsofthefinancialmarketswereopenedupforeveryoneeitheraprivateplayerorforeignplayer Thecapitalmarketgainedmomentumafterthese financial reforms. These financial reforms try to change the face of the Indian mutualfundindustryandmutualfundsbecomesanewinvestmentoptionforthe investors.
Amutualfundisacollectiveinvestmentschemeprofessionallymanagedbythe financialexpertswhocollectsandpoolsmoneyfromalargenumberofinvestors and invests the pooled money in equities, bonds, government securities and moneymarketinstrumentsetc.Themoneysocollectedinmutualfundschemeis investedbyprofessionalfundmanagersinequity,debtandequity-debtmixsecuritiesetc.inlinewiththemutualfundscheme'sinvestmentobjective.Thereturns generatedfromthiscollectiveinvestmentschemeareproportionatelydistributed amongst the investors, after deducting all the applicable expenses and levies incurredwhilemanagingtheparticularscheme.
Thus,mutualfundisoneoftheimportantfinancialintermediaries'classeswhich tries to enable millions of small and large investors/savers from the country as well as abroad to participate in collectively and derive the benefits from the growthofthecapitalmarket.Mutualfundsarebecomingincreasinglypopularin Indiaduetohigherreturnandrelativitylowriskandcosttotheinvestors.Thus, the Mutual funds are transforming the face of Indian economy by mobilising huge resources for the economy and providing better returns than any other investmentoptionsavailabletotheinvestors.
Ÿ
Ÿ
Ÿ
Ÿ
theassetsmanagedbyIndianfunds,accordingtoMaheshNayak(2007)?It's moreofasociologicalissue;unlikeintheWest,ourcountry'slackofsocial securityhasledtoMutualFundinvestmentsbeingusedasthesixthorseventh layer of saving." Mahesh Nayak concludes that if the mutual fund industryisseriousaboutattractingindividualinvestors,itmustconcentrate on two fronts: performance and products, which are areas on which most fundmanagersagree.
AccordingtostudiesbyS.Mohanan(2006),theIndianmutualfundindustry isoneofthefastestexpandingindustriesintheIndiancapitalandfinancial markets.Inrecentyears,themutualfundbusinessinIndiahasseensubstantial increases in both the quantity and quality of product and service offerings. Between the end of 1997 and June 2003, mutual funds' assets under administrationincreasedby96percent,increasingfrom8%to15%ofGDP Theindustryhasincreasedinsize,nowmanagingmorethan$30351million inassets.Theprivatesectoraccountsforroughly91percentoftheresources mobilisedacross allsectors,demonstratingitsmarketdominance.Individual investors account for 98.04 percent of all investors and contribute $12062million,whichis55.16%ofthenetassetsundermanagement.
Ÿ
Whilediscussingthemutualfundproblem,Sethu.G(1999)studiedtheperformanceof18open-marketfunds.Despitepoorperformance,hefoundthat mutual funds' appeal may be attributed to investor behaviour and institutionalfactorsinthecapitalmarket,ratherthantherisk-rewardtrade-off.

Debasish(2009)attemptedtoevaluatetheoperationofafewselectedmutual fundplansonthebasisofrisk-returnaffiliationrepresentationsandwaysin hisresearch.BetweenApril1996andMarch2009,23planswereanalysed, six of which were supported by the private sector and three of which were supported by the public sector Mean return, coefficient of determination, betarisk,Treynorratio,JensenAlpha,andSharperatiowereusedtoconduct the inquiry When measured against the risk-return affiliation representations, Franklin Templeton and UTI were assessed as good executors, whereas Birla Sun Life, LIC mutual funds, and HDFC were adjudged as firmsperformingbelowpar,accordingtothegeneralinquiryreport.
Ÿ
Apex Institute (2000) examined investor portfolios. For 78.97 percent of investors,mutualfundswereapartoftheirportfolios,anditwasrankedthird in the list, behind savings bank accounts and fixed deposits. The capital's securitywasunderlinedasamotivatingelement.
According to Dr Sanjay Kant Khare (2007), the mutual fund business has grown by 100% in the recent six years. He comes to the conclusion that mutualfundswillbethefinancialtoolsofthefutureforourcountry'sinvestors.
Somashekar(2008)conductedafinancialexaminationintothefunctioning anddirectionofmutualfundsinIndiainhisresearch.Intheend,itwasdetermined that many mutual funds in India could not be compared to mutual fundsintheUnitedStatesorotherindustrialisedcountriesduetotheirsize. However,mutualfundshavethepotentialtoimproveinasimilarwayasUS funds, despite the fact that the standard functioning of funds, both market and beta adapted, seldom shows dis-economies. The more well-known mutualfundsdonotappeartoperformwell,especiallyduringgloomymarket phases. When the phase isn't negative or bullish, it appears that wellknownmutualfundsperformbetter
Ÿ
Ÿ
P Hamumantha Rao, (2007) believes that the Indian Mutual Fund (IMF) businesshasundergoneanumberofstructuralandregulatoryreforms,and examinessomeofthesechangesmoreclosely TheIMFhasmaturedsignificantlyduringthelastdecade,andthefundamentalreasonforthisisthe1991 liberalization,privatization,andglobalizationprocess.(LPG)
Whydoinstitutionsandhighnetworthpeopleaccountfor85-90percentof
Ÿ
SinghVirk&Singh(2021)studiedthecurrentstateofthemutualfundsector aswellasitsfutureprospects.Inthelastfewdecades,theindustryhasexperienced tremendous expansion. It was not a straight line from 25 crores in March 1965 to 825240 crores in March 2014, but a sequence of ups and downs. The industry's attention has been drawn to the industry's push to expand from tier 1 cities to smaller towns and cities. Household finances
Ÿ
shouldbeeffectivelychannelledforimprovement,andinvestorsshouldbe educatedaboutmutualfundsinordertodoso.Inaddition,growinginvestor participation, product innovation, and other factors can all contribute to inclusivegrowth.
ToUnderstandtheideaandconceptofMutualFundinIndia
Ÿ
Ÿ
ToexaminethegrowthtrendsofmutualfundindustryinIndia
To describe the various prospects of Indian Mutual Fund Industry so as to helptheinvestors.
Theresearchdesignforthispaperwasprimarilyexploratoryinnature.Thestudy beganwithexploratoryresearchdesigninordertohaveabetterunderstandingof themutualfundindustryinbrief. Consideringtheobjectivesofstudy,descriptivetyperesearchdesignisadoptedtohavemoreaccuracyandrigorousanalysis ofresearchstudy Thisstudyispurelybasedonsecondarydata.Thesecondary dataavailableisintensivelyusedforresearchstudy Datawascollectedfromthe financialreports,AMFIwebsites,newspaper,magazinesetc.
Descriptive tools like bar diagrams, pie charts, tables have been used for deep analysisofindustryandgivingaclearpictureofmutualfunds'investmentsinvariousschemesandstates.
ThestudyhasbeenmadeonthebasisofsecondarydatacollectedfromtheAMFI officialwebsiteandwebsiteofmutualfundindia.com.Inthestudy,past10years (i.e.,years2012toyear2022)datahasbeentakentoanalysethegrowthtrendsin theincreaseintheAssetUnderManagement(AUM)sizeandtheincreaseinthe folioaccounts.
ThedataofmonthFebruary2022hasbeentakentorepresentthegeographical spreadofIndianMutualFundIndustry ThedataofthemonthMarch2022has beentakentogiveoverviewaboutthevarioustypesofmutualfundschemesand theircontributioninAAUM.
TheanalysisofdataiscarriedoutusingMSExceleithertomakecalculationsof dataortographicallyrepresentthedatainfigures/graph/bars/tabularformat.
Ÿ
Theanalysisispurelybasedonthepastperformanceanddoesnotvalidate thefutureperformance.
Source: AMFI
Figure2
Figure3
Ÿ
Ÿ
The research is completely based on secondary data collected from other sourceslikemagazines,newspapersandwebsitesetc.
Recommendationswillbegivenfrominvestorspointofview.
AverageAssetUnderManagement(AAUM)wiseMutualFund:
Therearearound1500mutualfundschemesareoperatingunder43mutualfunds st inIndia(ason31 March2022)havingatotalAAUMofapprox.Rs.38.38trillion.
Topfivemutualfunds(AAUMwise):

Figure1
Source: AMFI
TheabovefigureshowstopfivemutualfundsasSBIMutualFund,ICICIPrudential Mutual Fund, HDFC Mutual Fund,Aditya Birla Sun Life Mutual Fund andKotakMahindraMutualFund.Thesefivehaveamarketshareof56percent ofIndianMutualFundIndustrywith(totalAAUMofapprox.Rs.21.28trillion).
Source: AMFI
There are three types of mutual fund schemes as open-ended schemes, close ended scheme and interval schemes as shown in above diagram. It is observed thattheopen-endedschemesconstitutearound75percentoftotalschemesindicatingthattheinvestorspreferforopenendedschemesduetoflexibilityofentry andexitintheseschemes.
Open-endedschemes: Theopen-endedschemes(1120schemesas31.03.2022)arefurthercategorised into Equity oriented schemes (365 schemes), Income/ debt-oriented schemes (312 schemes), Hybrid schemes (135 schemes), solution-oriented schemes (35 schemes)andotherschemes(273schemes).
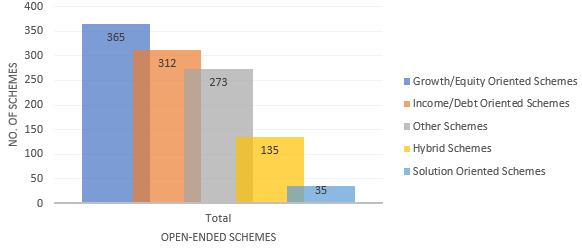
Figure4
Source: AMFI
Itisobservedfromtheabovefigurethattheopen-endedinvestorsprefertoinvestoreitherinequity-orientedschemesordebt-orientedschemes(bothconstitute around60percentoftotalopenedendedschemes).Themainreasonofthismay be either investors want to grow their capital or at least to protect their capital withriskfreereturns.
Close-endedschemes: The close-ended schemes (354 schemes as 31.03.2022) are further categorised intoEquityorientedschemes(36schemes)andIncome/debt-orientedschemes

(318schemes).
Figure5
Source: AMFI
Itisobservedfromtheabovefigurethatthecloseendedinvestorsprefertoinvestorintheincome/debt-orientedschemesastheseconstitutearound90percentof totalcloseendedschemes.Thismayduetoentryandexitconstraintsintheclose endedschemesasinvestorsprefertheseforinterestincomeaswellascapitalprotection.
Schemeswisefolios/investors: The following table shows the open-ended schemes, close ended schemes and intervalschemeswiththenumberofaccountorfolioholdersintheseschemes.

Table1
Typesofschemes
No.ofschemes Investors(%) No.offolio
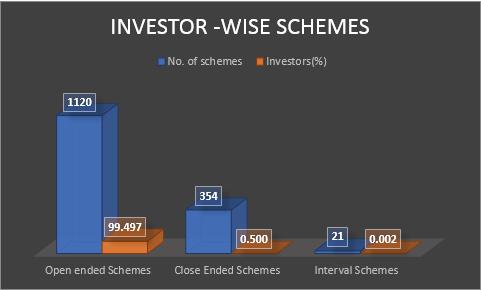
OpenendedSchemes 1120 99.497 128853769
CloseEndedSchemes 354 0.500 647833
IntervalSchemes 21 0.002 3050
Source:AMFI
Figure5
Source: AMFI
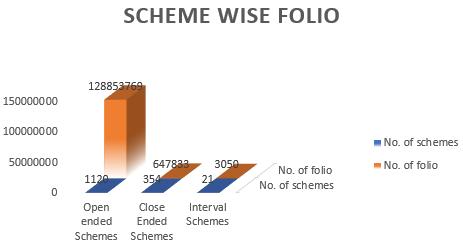
Itisobservedintheabovefigurethattheopen-endedschemeshavelargestnumber of account holders (128853769 folios), followed by close ended schemes (647833folios)andintervalschemes(only3050folios).
It is analysed from the above figure that around 99.5 percent investors have invested in the open-ended schemes due to flexibility nature of these schemes fromthepointofviewofentryandexit.
Typeofscheme-wisefolios/accounts: In this categorisation, the following table summarises the account holders in thesesub-typesofschemesas:
Table2
Typesofschemes
No.of schemes Investors(%) No.offolio
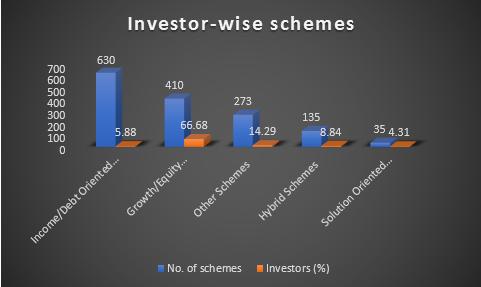
Income/DebtOrientedSchemes 630 5.88 7608846
Growth/EquityOrientedSchemes 410 66.68 86355947 OtherSchemes 273 14.29 18507554 HybridSchemes 135 8.84 11450510
SolutionOrientedSchemes 35 4.31 5578745
Source:AMFI
Figure7
Source: AMFI
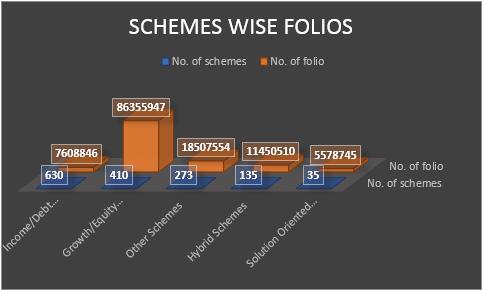
Fromtheabovefigure,itisevidentthattheequity/growth-orientedschemeshave largest number of accounts (86355947 folios), followed by other schemes (18507554 folios), hybrid schemes (11450510 folios), income/debt-oriented schemes (7608846 folios) and least in solution-oriented schemes (5558745 folios).
Source: AMFI
Figure8
It is analysed that despite maximum number of schemes under income/debtoriented schemes, only 5.88 percent of total investor have invested in these schemes.However,thegrowth/equity-orientedschemeshavethelargestnumber ofinvestorsi.e.,66.68%ofthetotalnumberofinvestorsindicatingthatthemost ofinvestorwantstotakemoreriskformorereturns.
Scheme-wiseAAUMandInvestors: Thefollowingtableshowstheschemes-wiseAAUMandinvestorsas:
Figure6:
Source: AMFI
Source:AMFI
Figure10
Source: AMFI
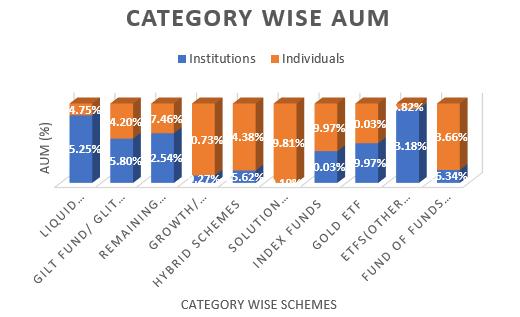
CustomersegmentwiseAAUMincategorywiseschemes: ThefollowingtableshowstheAAUMcontributionbytheindividualandinstitutionalinvestorsinthevariouscategoriesoftheschemesas:
Table5
Figure9
Source: AMFI
Fromtheabovediagram,itisobservedthatincome/debt-orientedschemeshave largest percentage ofAAUM (37.94 percent of totalAAUM of Indian Mutual fund industry), followed by growth/equity-oriented schemes (35.12 percent), otherschemes(13.16percent),hybridschemes(13percent)andrestwithsolution-oriented schemes. It is analysed that only 5.88 percent investors of income/debt-orientedschemescontributehighesttowardsAAUManditisvery lessfromtheequityinvestors.



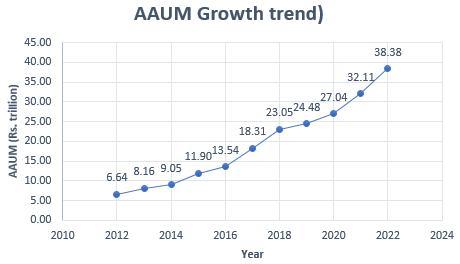
AAUMGrowthTrends: ThefollowingtablerepresentstheAverageAssetUnderManagement(AAUM) dataforthepast10yearsstartingfromtheyear2012totheyear2022as:
Table4
Source:AMFI
The following figure shows the growth trends ofAAUM for the past 10 years (i.e.,year2012toyear2022)as:
Source:AMFI
Figure11
Source: AMFI
Fromtheabovefigure,itisobservedthatAAUMcontributionbytheinstitutional investors in heavily in the liquid fund/money market fund/floater fund and exchangetradedfunds(ETFs).However,fromtheindividualinvestorspointof view, higherAAUM contributions are in growth-oriented funds, hybrid funds andsolution-orientedfunds.
Investorsegmentcompositionofvariouscategoriesoftheschemes: The following table contains the investor segment i.e., individual and institutionalinvestorsinthevariouscategoriesofschemesas:
Table6
Source:AMFI
Figure14
Source: AMFI
Figure12
It is observed from the above figure that institutional investors prefer to invest mostly in the liquid funds/money market funds and income/debt-oriented schemes/fundseithertohaveliquidityofthecapitalorcapitalprotectionalong withinterestincome


Source: AMFI
From the above figure, it is observed that the investors growth is exponential from the year 2014 onwards. In the past 10 years (i.e., from year 2012 to year 2022), the folio accounts have almost tripled. During, the past five years (i.e., fromyear2017onwards),themutualfundaccountholdersinIndiahavedoubled showingtheinclinationofinvestorstowardsthemutualfundsastheirinvestment option.

StateswiseAUMcompositioninIndia: Thefollowingfiguresshowsthetop20StatesofIndia(downwardtoupwards) AUM wise and their contributions in AUM of different types of mutual fund schemesas:

Figure13
Source: AMFI
Itisobservedfromtheabovefigurethattheindividualinvestorsgivepreference toalltypesofschemesinordertodiversifytheirportfoliotominimisetherisk andmaximisethereturnsfromtheirinvestments.
InvestorsAccounts/foliosTrends: Thefollowingtablecontainsthedataofnumberoffolioaccountsforthepast10 years(i.e.,fromyear2012toyear2022)as:

Table7
Figure15
Source: AMFI
It is observed from the above figure that Maharashtra contribute maximum towardstotalAUM(43.1percentoftotalAUM),followedbyNewDelhi(8.4percentoftotalAUM),Karnataka(6.9percentoftotalAUM),Gujarat(6.9percent oftotalAUM),WestBengal(5.1percentoftotalAUM)andsoon.
Top5Statesinvarioustypesofschemes: The schemes have been categorised mainly into five types as Liquid schemes, debt-orientedschemes,equity-orientedschemes,hybrid/balancedschemesand ETFs/FoFsinordertolistouttopfivestatesintheseschemesandtheirAUMcontributionintheseschemes.
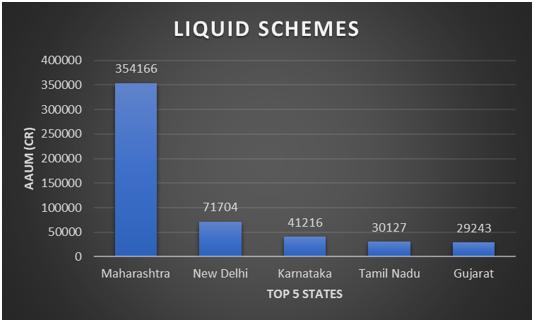
Top5StatesinLiquidSchemes: ThefollowingfigureshowsthetopfivestatesandtheirAUMcontributioninthe liquidschemesas:
Source:AMFI
Figure16
Figure19
Source: AMFI
Itisobservedthatintheliquidschemes,thehighestAUMcontributionisfrom theMaharashtra,followedbyNewDelhi,Karnataka,TamilNaduandGujarat.
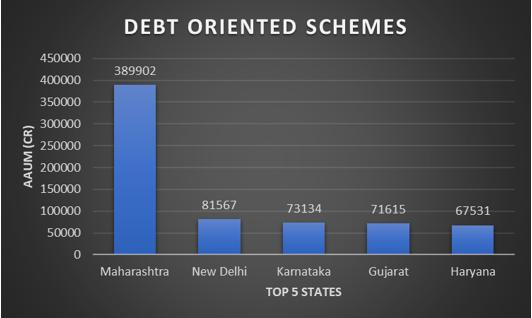
Top5StatesinDebt-orientedSchemes: ThefollowingfigureshowsthetopfivestatesandtheirAUMcontributioninthe debt-orientedschemesas:
Source: AMFI
Itisobservedthatinthehybridschemes,thehighestAUMcontributionisfrom theMaharashtra,followedbyWestBengal,Gujarat,UttarPradeshandothers.
Top5StatesinETFs/FoFsSchemes: ThefollowingfigureshowsthetopfivestatesandtheirAUMcontributioninthe ETFS/FoFsschemesas:
Figure17
Figure20
Source: AMFI
Itisobservedthatinthedebt-orientedschemes,thehighestAUMcontributionis fromtheMaharashtra,followedbyNewDelhi,Karnataka,GujaratandHaryana.
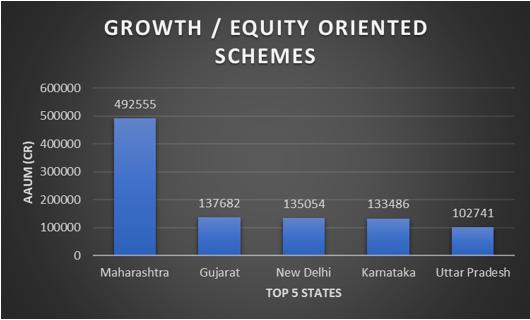
Top5StatesinGrowth/equity-orientedSchemes: ThefollowingfigureshowsthetopfivestatesandtheirAUMcontributioninthe growth/equity-orientedschemesas:
Source: AMFI
ItisobservedthatintheETFs/FoFsschemes,thehighestAUMcontributionis from the Maharashtra, followed by New Delhi, West Bengal, Karnataka, and Gujarat.

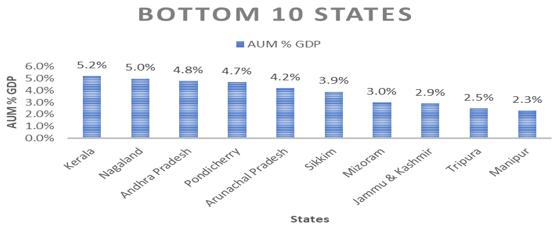
AUMpercentageofState'sGDP: Top10States(AUM%GDPwise):

Source: AMFI
Figure18
Source: AMFI
Itisobservedthatintheequity-orientedschemes,thehighestAUMcontribution isfromtheMaharashtra,followedbyGujarat,NewDelhi,Karnataka,andUttar Pradesh.
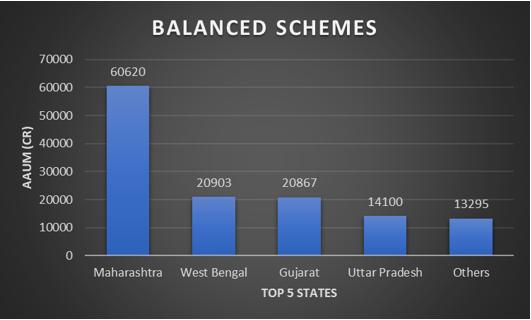
Top5StatesinHybrid/balancedSchemes: ThefollowingfigureshowsthetopfivestatesandtheirAUMcontributioninthe hybrid/balancedschemesas:
Figure20
ItisobservedfromtheabovefigurethatthestatesofMaharashtracontributehighesttowardsAUMasapercentageofstate'sGDP(63.1percent),followedbyNew Delhi (38.0 percent), Goa (29.8 percent), Chandigarh (25.9 percent), Haryana (18.4percent)andsoon.
Ÿ
Ÿ
Ÿ
Ÿ
Ÿ
Ÿ
Ÿ
Figure21
Itisobservedfromtheabovefigurethatinthebottom10states,theNorthEastern statesandJammu&KashmircontributeleasttowardsAUMasapercentageof state'sGDP
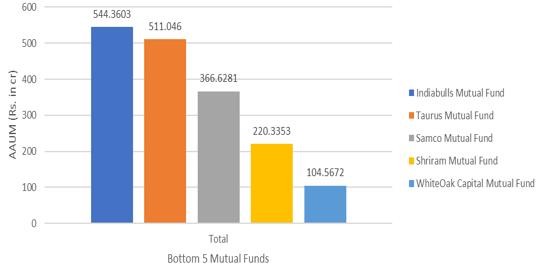
Thetop5mutualfundshaveamarketshareof56%ofthemutualfundindustrywithtotalAAUMofapprox.Rs.21.28trillionandbottom5haveashare ofjust0.04percentofIndianMutualFundIndustry
Theopen-endedschemesconstitutearound75percentoftotalschemesindicating that the investors prefer open-ended schemes due to flexibility of entryandexitintheseschemes.Themainreasonofthismaybeeitherinvestorswanttogrowtheircapitaloratleasttoprotecttheircapitalwithriskfree returns. Whereas the close ended investors prefer to invest in income and debt-orientedschemes.
Itisevidentthattheequity/growth-orientedschemeshavelargestnumberof accountsfollowedbyotherschemes,hybridschemes,income/debt-oriented andleastinsolution-orientedschemes.Thegrowth/equity-orientedschemes have the largest number of investors i.e., 66.68% of the total number of investors indicating that the most of investor wants to take more risk for morereturns.
Itisobservedthatincome/debt-orientedschemeshavelargestpercentageof AAUM, followed by growth/equity-oriented schemes, other schemes, hybridschemesandrestwithsolution-orientedschemes.Itisanalyzedthat only 5.88 percent investors of income/debt-oriented schemes contribute highesttowardsAAUManditisverylessfromtheequityinvestors.
ItisobservedthatthereisanexponentialincreaseintheAAUMoftheIndian MutualFundIndustryoverthepast10years(period2012to2022).ItisanalyzedthattrendsindicatesthattheAAUMhasdoubledi.e.,fromRs.20trilliontonearRs. 40 trillioninjust5 yearsspan (i.e.,fromyear2017 toyear 2022).However,ittookaround50years(i.e.,fromyear1963toyear2014) tocrossthemilestoneofAAUMsizeofRs.10trillionsincetheinceptionof IndianMutualFundIndustry
Itisobservedthatinstitutionalinvestorsprefertoinvestmostlyintheliquid funds/moneymarketfundsandincome/debt-orientedschemes/fundseither to have liquidity of the capital or capital protection along with interest income.
ItisobservedfromtheabovefigurethatMaharashtracontributemaximum towardstotalAUM(43.1percentoftotalAUM),followedbyNewDelhi(8.4 percentoftotalAUM),Karnataka(6.9percentoftotalAUM),Gujarat(6.9 percentoftotalAUM),WestBengal(5.1percentoftotalAUM)andsoon.
Equity funds are mutual funds with the potential to yield multi-fold returns, which can help investors in creating a large enough wealth corpus over time. Investorscaninvestinavarietyofequityfundstoachieveanumberoflong-term financialgoals,suchasretirementandbuildingamulti-crore,multi-purposecorpus.
Equitymutualfundsareagoodideatoputmoneyinifinvestorswanttomaximizetheirwealthwhilesavingmoneyontaxes.However,keepinmindthatto get the most out of equity investments, you'll need a longer time horizon of at least5andpreferably10yearsormore.
Mutualfundinvestinghasundoubtedlyhadasignificantimpactontheeconomy However,thereisstillalongwayfortheIndianmutualfundindustrytoachieve itspotential.Toattractinvestors,fundcompaniesmuststriveformoreinnovative plansandabetterstrategy Withthesupportofvariousrisk-returnpreferences, mutualfundinvestmentmaysatisfyawiderangeofinvestors.
By2030,theindustryisestimatedtohaveamarketcapitalizationofoverRs.90 trillion,withinvestorsupportofabout100croreaccounts.TheMutualFundbusiness has the potential to be a vital element of our emerging economy provided governmentandmarketauthoritiestakeafocusedandtargetedapproach.
I. Somashekar,T (2008)PerformanceandRegulationofMutualFundsinIndia:AnEconomicAnalysis,Thesis, Department of Studies in Economics and Cooperation, UniversityofMysore.
II. Debasish, S. S. (2009) ‘Investigating Performance of Equity-based Mutual Fund SchemesinIndianScenario’,KCAJournalofBusinessManagement,2(2),pp.1-15.
III. Parmar,C.T (2010)AnempiricalinvestigationonperformanceofmutualfundsindustryinIndia,Thesis,SaurashtraUniversity
IV Sethu.G.(1999)ThemutualFundPuzzleUTIInstituteofcapitalMarketBombay1999
V Mohanan.S (2006) Mutual fund industry in India: development and growth Global BusinessandEconomicsReview(GBER),Vol.8,No.3⁄4.
VI. ManishaPillai,(2007)“ScopeofMutualFundsAmongSME’S”,PortfolioOrganizer, Volume:VIII,Issue:IV,pp37–39.
VII. MaheshNayak,(2007)“TheGreatIndianIllusion”,BusinessToday,August12,pp68
VIII.Sanjay Kant Khare (2007), “Mutual Funds:Arefuge for Small Investors”, Southern Economist,Volume:VIII,Issue:III,ppNo:21-24.
IX. P.HamumanthaRao,(2007)“MutualFundIndustryinIndia”-AttainingMaturity,PortfolioOrganizer,Volume:VIII,Issue:III,PPNo:21-24
X. ApexInstitute(2000),“ASurveyreport”TamilNaduinvestorDigest,Volume2-Issue 6,ppno.5-11
Websites:
I. www.amfiindia.com
II. www.mutualfundindia.com
III. www.nseindia.gov.in