


FISCAL YEARS 2023- 2027

This budget will raise more revenue from property taxes than last year's budget by an amount of $5,596,969 which is an 18.93 percent increase, and of that amount $2,432,764 is tax revenue to be raised from new property added to the tax roll this year.
Mayor Cornelious Yea Yea Mayor Pro Tem Norman Yea Yea Council Member Singh Absent Absent Council Member Blais Yea Yea Council Member Lukas Yea Yea Council Member McClellan Yea Yea Council Member Johnson Yea Yea
TAX RATE
ADOPTED FISCAL YEAR 2021 – 2022 PROPOSED FISCAL YEAR 2022 – 2023 ADOPTED FISCAL YEAR 2022 – 2023
Property Tax Rate $ 0.643948 $ 0.629900 $ 0.629900
No New Revenue Rate $ 0.631493 $ 0.568265 $ 0.568265
No New Revenue M&O Rate $ 0.506313 $ 0.469968 $ 0.469968
Voter Approval Tax Rate $ 0.643948 $ 0.629900 $ 0.629900 Debt Rate $ 0.119913 $ 0.143484 $ 0.143484
The total amount of municipal debt obligation secured by property taxes for the Town of Little Elm is $71,490,000
The above information is presented on the cover page of the Town’s Fiscal Year 2023 Annual Budget to comply with Section 102.005 of the Texas Local Government Code
In accordance with Section 140.0045 of the Texas Local Government Code expense line items for public notices and lobbying efforts are provided below:
Description
Adopted FY 2021 2022 Adopted FY 2022 2023
Public notices required by law $ 33,325 $ 32,325
Lobbying Services $ 6,000 $ 6,000
Consolidated 32-34 35-37 Fund 38-40 41-42 43-44
Special 45-46 47-48 49-50
PEG 51-52 53-54 Occupancy 55-56 57-58 59-60
TIRZ Number 61-62 63-65 67-68 69-71 73-74 75-77 79-80 81-82 83-84 85-86 8


 Neil Blais
Mayor Pro Tem District 3
Mayor Curtis J. Cornelious
Tony Singh District 2
Lisa Norman District 4
Jeremy Lukas District 5
Jamell Johnson At Large, Place 1
Michael McClellan At Large, Place 6
Neil Blais
Mayor Pro Tem District 3
Mayor Curtis J. Cornelious
Tony Singh District 2
Lisa Norman District 4
Jeremy Lukas District 5
Jamell Johnson At Large, Place 1
Michael McClellan At Large, Place 6
Matt Mueller
Doug Peach
Joe Florentino
Kelly Wilson
Caitlan Biggs
Town Attorney Boards and Commissions
Mayor and Council Town Manager
Municipal Court Judge and Prosecutor Economic Development Corporation (EDC)
Community Development Corporation (CDC)
Finance Utility Customer Service Purchasing Municipal Court Budget Accounting Human Resources Personnel Admin Risk Management
Director of Administrative Services/Town Secretary
Assistant to the Town Manager
Deputy Town Manager
Development Services Engineering Community Integrity Planning/GIS Building Inspection
Public Works Fleet Services Water & Wastewater Stormwater Solid Waste Streets
Community Services Library Parks Senior Center Recreation Marketing Facilities Animal Services Special Events Aquatics
Assistant Town Manager/Director of Public Safety Police Department Patrol Traffic CID Fire Department Fire & Emergency Medical Services Information Technology Emergency Management Services
Message from the Town Manager, Matt Mueller
A municipal budget is more than a book of numbers. A budget is a tool for prioritizing, communicating, and allocating resources toward implementing programs, projects, and services that fit the needs of a community’s residents and businesses. It is the duty of those fortunate enough to serve the residents of Little Elm to operate in a transparent, efficient, and ethical manner. The budget is also a tool that allows us to do just that.
Little Elm is still a rapidly growing community, and with that comes a tremendous number of challenges and outstanding opportunities. With this growth, new sources and higher amounts of revenue are allocated in the budget. Still, there is a mounting list of needs for programs and services to accommodate growth and meet the community's expectations.
Town staff develops the operating and capital budgets to achieve strategic goals and long term objectives defined in the Town Council's adopted Strategic Plan. This Strategic Plan approved in 2013 and updated in 2022 through a series of workshops with the Town Council, Community Development Corporation, Planning Commission, Economic Development Corporation, and Town staff, sets the vision and charts the course for the community. The staff's job is to accomplish the Strategic Plan's goals through budgeting and project implementation.
The internal value system at the Town of Little Elm stems from the philosophy of Servant Leadership and the belief that as public employees, all actions stem from the obligation to put the needs of the resident first and dedicate our decision making and actions to the idea that Town employees exist to serve others. This is further emphasized in our organization's Core Values of Efficiency, Innovation, Customer Service, and Integrity. These values are the organization’s foundation and are the bedrock on which the departmental budgets are built.
The overall budget philosophy of the Town of Little Elm is to provide the highest level of service at the greatest value. This approach means that the Town must operate in the most effective and efficient way possible to accomplish this goal. Therefore, the internal budgeting and review process is very stringent, with department heads dissecting each other's budgets in a peer review process that seeks to ensure that every line item is carefully planned and all projects are justified.
As part of the Town's budgeting philosophy and commitment to respect the Taxpayer's money, priorities in the budget process are to maintain a competitive tax rate, realize the long term impacts of financial decisions, expect a business minded approach to many of our functions, and keep fund balances and reserves at a healthy level
Beginning with the 2016 2017 budget, our goal has been to successfully present a five year balanced budget (technically a one year budget and a four year financial plan) to the Council for consideration. The approach aims to ensure that we are providing sustainable services in Little Elm’s high growth environment. This is particularly important as we continue expanding services in the northern part of the community and extend contractual services to various partners in our region
Growing municipal services to provide for the needs of our residents in the northern part of the community has been a big part of planning operational growth over the past few years This area will continue to be the area of highest growth as the existing residential developments along the U.S. 380 corridor continue to build houses, and Spiritas Ranch, the approved 2,200 lot subdivision, breaks ground and begins to build. The five- year budget looks at the cost of those services and the revenues coming due to the growth. A multi year plan is very helpful since the expenses for these services are in the very near future, yet the revenues will be delayed as the area grows and new taxable values are added to the tax rolls. The multi year plan is reviewed annually and revised as needed.
As we expect, all of the growth and constant change in the area conditions have changed certain needs and assumptions in the planning years, and we addressed these needs in the new budget. The greatest value in the financial plan is that this multi year approach lets us see how today spending decisions will affect the budget in the future and ensure that we can sustain our services. Knowing the long term impacts allows us to be nimble in our decision making and allows us to take advantage of opportunities while still having confidence that we are not selling out long term stability for short term gain
The total Fiscal Year (FY) 2022-2023 budget, including all funds and transfers, is $130,897,724 compared to $116,195,806 initially budgeted in FY 2021 2022. The budget for all funds will increase by $1,792,629, or 1.39%, over the FY 2021 2022 amended budget. From an operational perspective, the budget will increase by $6,724,658 or 10.01% over FY 2021 2022. FY 2022 2023, total revenue does not cover the total expenditure within the town wide budget by ($26,763,759). This is primarily due to debt proceeds issued in FY 2020 2021 and capital expenditures being spent from prior year debt proceeds. The Capital Project funds located within the General Governmental and Enterprise Utility classifications have budgeted expenditures of $21,296,977 and $8,512,097 and the available beginning fund balance being spent on projects, in addition to
revenue in FY 2022-2023 of $9,036,658. Thefollowing matrix reflects changes in sources and uses of all funds by category (town-wide):
Expenditures Uses of Funds
Amended FY 2021 - 2022 Adopted FY 2022 - 2023
% of Total Change Year Over Year % Change
Operations $ 67,167,662 $ 73,892,320 56.45% $ 6,724,658 10.01%
Debt 11,054,447 12,323,291 9.41% 1,268,844 11.48%
Capital Equipment 3,263,167 2,774,363 2.12% (488,804) 14.98%
Capital Projects 34,764,406 29,809,074 22.77% (4,955,332) 14.25%
Transfers Out 12,855,413 12,098,676 9.24% (756,737) 5.89%
Total Uses $ 129,105,095 $ 130,897,724 100.00% $ 1,792,629 1.39%
During the five year budget period, the town wide budget (excluding major capital equipment and projects) is expected to grow, as represented by the chart below.
Adopted FY 2022-2023
Planning Year FY 2023-2024
Planning Year FY 2024-2025
Planning Year FY 2025-2026
Planning Year FY 2026-2027
The Town of Little Elm’s primary source of revenue is property tax. Due to the highly residential makeup of this community, Little Elm’s dependence on this revenue source is higher than many in our area. This year, $30,083,171 has been budgeted for all property tax collections, including delinquents, penalties, and payments to the tax increment financing zones and municipal management district. Property tax revenue, including the items above, is expected to grow by $3,334,193or12.46% over last year. The Town is seeing significant growth in the tax increment financing zones and municipal management district, which is reflected in the budget netted against a total gross property tax revenue of $34,114,096.Considering the gross property tax, the Town will collect, before the payments to the zones and district, an increase of $5,596,969 or 18.93% over last year.
As a result of strategic planning initiatives, retail recruitment has been a huge priority over the past decade. Due to retail growth and favorable economic conditions, Little Elm’s sales tax growth has continued to be strong. However, sales tax is generally a source of revenue that is highly volatile and dependent on economic conditions, so we continue to be conservative about our projections in the coming years. Although retail growth has been strong, the highly residential nature of the community means that online sales make up a large segment of our sales tax collections, and we $100,166,063 $97,547,504 $95,229,074 $94,826,377 $98,314,287
continue to have a lower sales tax per capita than our comparison communities. Sales tax collections in the FY 2021 2022 have exceeded expectations. The Town budgeted sales tax for marginal growth of 2% over estimated FY 2022 receipts in the FY 2022 2023 budget. The total amount of sales tax ($.015) budgeted for FY 2022 2023 is $9,761,198, which is a $1,470,546 or 17.74% increase over what was budgeted last year. The sales tax revenue reported includes revenue receipts, contractual payments attributable to 380 economic development, and performance agreements where the sales tax has been previously pledged.
Little Elm has been growing rapidly over the past two decades, resulting in strong revenue from building permits and other growth-related activities. Anticipated building permit revenue for FY 2021-2022 is $3,575,066. This revenue source will eventually see a great reduction as Little Elm reaches the end of its growth phase. We are conservative in our permit revenue projections and show a reduction in revenue over the five year planning horizon due to permit revenue being subject to highly volatile economic conditions and anticipation of certain neighborhoods approaching build out.
The licenses, permits, and fees revenue in FY 2022 2023 is $8,425,904 and includes projected revenues of $2,800,000 in building permits and solid waste service fees of $3,909,328. The remaining income is attributable to other types of permitting and registrations required by development services.
Other major sources of revenue come from rates, fees, and charges. These sources are for services rendered and user fees charged, such as ambulance, alarm monitoring, municipal court, recreational use fees, and utility related services. This category is budgeted for FY 2022 2023 at $28,155,667 The increase in rates, fees, and charges over FY 2021 2022 is $973,922 or about 3.58%. Most of this increase is attributed to the Town’s utility water and wastewater rate plan approved in 2020 and growth in customers to provide charges for services Water rates will be increasing by 2%, as outlined in this plan. For FY 2022 2023, a total of $20,368,431 has been budgeted for utility sales and other charges for services. Of this amount, $11,647,483 comes from water sales, $7,583,638 comes from sewer, and $1,620,310 comes from other charges, fees, and wholesale contracts
Transfers between funds are part of the total sources of revenue. Transfers assist in funding infrastructure improvements and reimbursement for in kind services across funds The total transfers budgeted in FY 2022 2023 is $12,098,676
Total revenue from all sources is broken down in the following table:
Ad Valorem Taxes
Amended FY 2021-2022 Adopted FY 2022-2023 % of Total Change % Change
$ 26,748,978 $ 30,083,171 29% 3,334,193 12.46%
Sales and Use Taxes 8,290,652 9,761,198 9% 1,470,546 17.74%
Franchise and Other Taxes 2,417,000 2,631,730 3% 214,730 8.88%
Fines and Forfeitures 675,000 805,000 1% 130,000 19.26%
Impact Fees 1,000,000 900,000 1% (100,000) 10.00%
Licenses, Permits & Fees 7,430,137 8,425,904 8% 995,767 13.40%
Charges for Services 27,181,745 28,155,667 27% 973,922 3.58%
Intergovernmental 10,335,434 9,155,158 9% (1,180,276) 11.42%
Interest Earnings 918,800 828,750 1% (90,050) 9.80%
Debt Proceeds 10,000,000 0% (10,000,000) 100.00%
Miscellaneous 935,739 1,288,711 1% 352,972 37.72%
Transfers In 12,855,413 12,098,676 12% (756,737) 5.89%
Total Uses $ 108,788,898 $ 104,133,965 29% $ (4,654,932) 4.28%
The five- year revenue total revenue projections (excluding funding for major capital projects) for the Town of Little Elm are as follows:
Adopted FY 2022-2023
Planning Year FY 2023-2024
Planning Year FY 2024-2025 Planning Year FY 2025-2026 Planning Year FY 2026-2027
According to the Denton County Central Appraisal District (DCAD), the certified estimated taxable value after the homesteads with a tax ceiling is $5.583 billion. This value is 9.40% or $411 million more in assessed valuation than the 2021 tax year adjusted taxable value of $5.172 billion. DCAD has the responsibility of providing all taxing entities a certified tax roll.At the time of this budget message, DCAD is unable to reach the required task of certifying the appraisal roll over 95%. Therefore, the Texas Property Tax Code allows appraisal districts that are unable to produce certified values byJuly 25th to prepare certified estimates of the taxable value of the property in that taxing unit. Therefore, a taxing unit that receives a certified estimates taxable roll shallcalculate the no new revenue tax rate and the voter approval tax rate using this roll.
The roll does reflect approximately $373.4 million attributable to new taxable values added to the tax roll, which includes improvements and personal property. This becomes very important $98,663,058 $96,915,625 $96,063,734 $95,285,200 $95,122,307
because when calculating the no new revenue rate and the voter approval tax rate, new taxable values are deducted from the calculation. The following graph reflects historical growth in taxable property values, including the current year (2022) certified totals:
Source: Denton CAD Certified Totals 2012 - 2022
50,000 100,000 150,000 200,000 250,000 300,000 350,000 400,000 1,000
It is worth noting that most of the Town of Little Elm’s new growth is occurring in neighborhoods that are part of a Tax Increment Reinvestment Zone (TIRZ) or a Municipal Management District (MMD), which means that the Town only receives a portion of the property tax revenue collected in those areas. It also has an impact on the property tax rate calculation coming from new values added to the roles as opposed to new revenue due to higher values.
Little Elm has an adopted tax ceiling, or “tax freeze”, for homesteads of homeowners above the age of 65 or disabled person, including an exemption of $10,000. The tax bills for senior citizens 65 years and older are frozen.
For the last several years, it has been the goal to keep the tax rate competitive with other cities and towns while still providing adequate revenue to fund the needs of a rapidly growing community now and into the future. This year, once again, the Town can propose a lower tax rate of $.629900 and still meet those objectives. This is the lowest tax rate reduction in 14 years.
The Town was able to maintain the voter approval tax rate, prepare for its future obligations, and adhere to the Town’s long and short term operational plan. The adopted tax rate still provides an anticipated revenue in the tax levy for operations and debt service commitments. Of the total tax rate of $0.629900, $0.486416 or 77.22% is dedicated to general operations and maintenance (O&M) in the General Fund, and $0.143484 or 22.78% is dedicated to general obligation debt service.
The following table is a history of the Town’s property tax levy and collections: HISTORY BY YEAR
The average taxable single family home value is currently $349,901 compared to $313,635 last year. At the adopted property tax rate of $0.6299000, the Town tax paid on the average single family home will be $2,204.03. For comparison purposes, a single family home valued at $100,000 will pay $629.90
The operating budget is a combination of all costs to do business except for major capital improvement projects (CIP), transfers, and debt service payments. The combined operating budgets for the FY 2022 2023 budget are $73,892,320, compared with $64,682,885 originally budgeted in FY 2021 2022. This is an increase of $9,209,435 or 14.24%
Operating costs are broken down in the following chart for the Town’s core operating funds comparing this year to last year:
General Government Public Safety Community Services Public Works Culture and Recreation Utilities
FY 2021-2022 FY2022 - 2023
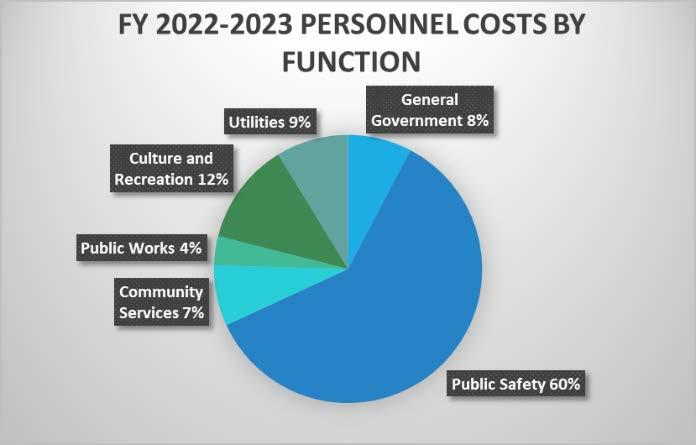
The following charts reflect the percentage cost of operations by operational function of the Town: $$5,000,000 $10,000,000 $15,000,000 $20,000,000 $25,000,000 $30,000,000
FY 2022-2023 OPERATING BUDGET TOWN WIDE
Utilities $18,158,561 (25%)
Culture and Recreation $8,850,578 (12%)
Public Works, $6,331,488 (8%)
General Government $8,214,088 (11%)
Community Services $4,342,541 (6%)
Public Safety $27,995,064 (38%)
The major increase in operations costs over last year’s adopted budget are as follows:
• 18.5 New FTEs $2,547,402*
• Compensation Plan Study Implementation $1,469,344
• Phase II of Fire Station 4/Police Substation on West Side $1,067,494 (includes Police and Fire personnel and equipment)
• NTMWD rate increase from $3.04 to $3.44 $626,052
• Insurance Increase $436,239
• Increase expense in Janitorial Services for all Town facilities $100,000
* Costs for new FTEs include salaries and benefits, uniforms, equipment, vehicles, etc.
The significant one-time expenses and new programs that have been placed in the budget for the current and future years are as follows:
Department Item FY 2023 FY 2024 FY 2025 FY 2026 FY 2027
Building Services Granicus Short Term Rental Tracking $ 6,500 $ 6,500 $ 7,000 $ 7,000 $ 7,000
CDC Small Equipment $ 3,200 $ $ 3,500 $ $ 3,700
Dippin' Dots Product Purchase For Resale $ 65,000 $ 68,000 $ 71,000 $ 71,000 $ 71,000
Cove
Janitorial/Porter Services For The Cove $ 48,000 $ 48,000 $ 48,000 $ 48,000 $ 48,000
Window Cleaning At The Cove $ 18,000 $ 18,000 $ 18,000 $ 18,000 $ 18,000
Finance Debt And Lease Management Web Based System $ 15,000 $ 15,000 $ 15,000 $ 15,000 $ 15,000
Fire Utilities for Station 4 $ $ $ 6,898 $ 13,796 $ 13,796
Fleet JPRO Fault Guidance & Next Step Repair Kits $ 7,999 $ 2,000 $ 2,000 $ 2,000 $ 2,000
LEPD Dell Rugged Laptops Replacement Program $ 83,000 $ $ $ 83,000 $ Cyber Security Assessment $ 65,000 $ $ 68,000 $ $ Arctic Wolf Security $ 55,000 $ 56,000 $ 57,000 $ 58,000 $ 59,000
Information Technology
Phone Managed Services Monitoring $ 44,000 $ 44,000 $ 44,000 $ 44,000 $ 44,000
Point to Point Fiber Connection Fire Station 3 $ 19,920 $ 20,920 $ 21,920 $ 22,920 $ 23,920
Active Directory Audit Software $ 8,700 $ 8,700 $ 8,700 $ 8,700 $ 8,700
VMWare Support Public Safety $ 8,700 $ 8,700 $ 8,700 $ 8,700 $ 8,700
Department Item FY 2023 FY 2024 FY 2025 FY 2026 FY 2027
VMWare Support
LEPD Servers $ 6,900 $ 6,900 $ 6,900 $ 6,900 $ 6,900
LE Park WAP Upgrades $ 6,000 $ 600 $ 600 $ 600 $ 600
Auto Elevate Software $ 5,000 $ 5,000 $ 5,000 $ 5,000 $ 5,000
Wireless Access Point Senior Center $ 1,000 $ 100 $ 100 $ 100 $ 100
Switch Upgrade $ $ 231,000 $ $ $ 250,000
Police Contracts WatchGuard Cloud Storage $ 85,995 $ 85,995 $ 85,995 $ 85,995 $ 85,995
Training Women Of Law Enforcement Conference $ 4,500 $ 4,500 $ 4,500 $ 4,500 $ 4,500
Defensive Tactics Training $ 10,000 $ 10,000 $ 10,000 $ 10,000 $ 10,000
Solid Waste 30 YD Roll Off Open Top $ 8,134 $ 8,378 $ 8,629 $ 8,888 $ 9,155
Special Events
Storm Drainage
Brew & Que VIP Experience $ 24,000 $ 24,000 $ 24,000 $ 24,000 $ 24,000
Juneteenth $ 8,000 $ 8,000 $ 8,000 $ 8,000 $ 8,000
Inlet Box Repairs/Replacement $ 53,400 $ 55,002 $ 56,652 $ 58,352 $ 60,102
Progression Plan $ 8,150 $ 2,080 $ 2,080 $ 8,150 $ 2,080
Inlet Curb Markers and Adhesive $ 1,250 $ 1,250 $ 1,287 $ 1,287 $ 1,326
LED Double Cobra Head Sl Drivers $ 30,000 $ 30,000 $ 30,000 $ 30,000 $ 30,000
Progression Plan Training $ 13,540 $ 1,630 $ 13,540 $ 1,630 $ 13,540
Replacing Streetlight Poles, Signs, to adhere to Dev. Agreements $ 9,624 $ 9,913 $ 10,210 $ 10,516 $ 10,832
Avery TJ Printer Head & Assembly $ 5,500 $ $ $ 5,500 $
CDL Mandatory Training $ 5,400 $ 1,800 $ 5,400 $ 1,800 $ 5,400
Town Council Council Special Projects $ 3,000 $ 3,000 $ 3,000 $ 3,000 $ 3,000
Additional Parade Float $ 2,500 $ 2,500 $ 2,500 $ 2,500 $ 2,500
Utility Billing Tyler Software Training $ $ 5,000 $ $ 5,000 $ Wastewater Treatment Lift Station Maintenance ILA Frisco West $ 30,000 $ 30,000 $ 30,000 $ 30,000 $ 30,000
Increased Projections For Water Purchases NTWMD $ 626,052 $ 1,040,011 $ 1,310,807 $1,552,332 $
CDL Training Requirement $ 3,600 $ 1,800 $ 1,800 $ 1,800 $ 1,800 Expenses
Admin Council Redistricting $ 46,150 $ $ $ $ Pay Plan Design Study $ $ $ 25,000 $ $ Animal Services Security Cameras (Animal Control) $ 11,400 $ $ $ $
CDC Park Projects Improvements $ 2,000,000 $ $ $ $ Toro 5900 Mower Addition $ 145,000 $ $ $ $
LE Playground Pour In Place Surface Replacement $ 105,000 $ $ $ $
Department Item FY 2023 FY 2024 FY 2025 FY 2026 FY 2027
Cricket Fields $ 100,000 $ $ $ $
Increase Truck Fleet Chevy 3500 $ 50,000 $ $ $ $
Sports Complex Improvements $ 49,000 $ $ $ $ Toro 7210 Mower Addition $ 45,500 $ $ $ $
John Deere Hx15 Bushhog Replacement $ 40,265 $ $ $ $
Cove
Development Services
Cottonwood Expansion Toro Workman $ 38,000 $ $ $ $
Kubota RTV Replacement Vehicles $ 32,000 $ $ $ $
Splash Pad Maintenance $ 26,000 $ $ $ $
Cottonwood Playground Surface $ 19,000 $ $ $ $ John Deere Tx 4X2 Addition $ 16,000 $ $ $ $
Trash Receptacle Additions $ 14,000 $ $ $ $
Dog Park Gate Hinges $ 6,000 $ $ $ $
Install Storefront Wall In Cove Lobby $ 45,000 $ $ $ $
Install Exterior Door To Patio Near Flowrider $ 15,000 $ $ $ $
CRM License Tool $ 4,000 $ 4,000 $ 4,000 $ 4,000 $ 4,000
Special Planning Study $ 100,000 $ $ $ $
Update Subdivision And Zoning Ordinances $ $ 300,000 $ $ $
Community Center Renovations $ 100,000 $ $ $ $
Engineering
Facilities
Community Center Feasibility Study $ 40,000 $ $ $ $
Generator Fire Station 2 $ 150,000 $ $ $ $ Two New Sirens $ 60,000 $ $ $ $ Walker Siren Upgrade $ 33,000 $ $ $ $ Stove Fire Station 2 $ 16,000 $ $ $ $ Scissor Lift $ 12,000 $ $ $ $
Plumbing Chase Space Heaters $ 8,000 $ $ $ $
Fire Lucas Device (Fire) $ 23,066 $ $ $ $
Training Structure Improvements $ 15,000 $ $ $ $
Fleet Table Top Tire Changer And Tire Balancer $ 17,533 $ $ $ $ CDL Training (New Hires) $ 3,600 $ $ $ $
Complete Access Control Upgrade $ 281,000 $ $ $ $ Rec Center And Senior Center Cam Upgrades $ 68,000 $ $ $ $
Public Safety Camera Upgrades $ 52,000 $ $ $ $
Information Technology
Town Hall Camera Upgrades $ 20,000 $ $ $ $
Open Shortest Path First Configuration $ 19,000 $ $ $ $
NVR Replacement At The Cove $ 16,000 $ $ $ $
Department Item FY 2023 FY 2024 FY 2025 FY 2026 FY 2027
Landscape
Screening Wall At Eldorado Well $ $ 200,000 $ $ $
Fence Repair/Staining $ $ $ 60,000 $ $
Radio Equipment Spare Radios $ 15,700 $ $ $ $
Evidence Drug Incinerator $ 5,330 $ $ $ $
Evidence Drying Cabinet $ 4,487 $ $ $ $
Take Home Patrol Vehicles $ 244,500 $ 244,500 $ $ $
Solid Waste 30 Yard Open Top Container X2 $ 18,000 $ $ $ $
Hilltown Drainage Study $ 100,000 $ $ $ $ McCord Park Trail Drainage $ 50,000 $ $ $ $
Tailgate Sand & Salt Spreader $ 5,800 $ $ $ $
Shell Beach Drainage Project $ $ $ 75,000 $ $ Wynfield Farms Outfalls with Debris Separators $ $ $ $ 120,000 $
Street Maintenance Woodrow Circle Utility & Pavement Reconstruction $ 515,000 $ $ $ $
Amphitheater Improvements $ 600,000 $ $ $ $ The Lawn at the Lakefront™ $ 500,000 $ $ $ $
Christmas Tree For The Lawn $ 83,000 $ $ $ $
Placemaking and Public Art $ 80,000 $ $ $ $
Speakers At LE Beach $ 20,000 $ $ $ $
Utility Billing Support Equipment And Upgrades $ 5,000 $ $ $ $
Replacement Cloth For Filters $ 42,000 $ $ $ $
Wastewater Collection
Replacement Drying Bed Tiles $ 30,000 $ $ $ $
Vibration Sensors For Blowers $ 18,000 $ $ $ $
Headsets For Confined Space Entry $ 5,000 $ $ $ $
Mini Excavator $ 70,000 $ $ $ $
Mini Dump Truck $ 40,000 $ $ $ $
Water Operations
Confined Space Entry Equipment $ 15,000 $ $ $ $
12 Foot Enclosed Trailer $ 10,000 $ $ $ $ Gas Powered Steel Pipe And Concrete Chainsaw $ 4,000 $ $ $ $
(Many of these projects cover many years, so they may not be limited to one fiscal year’s budget)
A large part of this five-year budget is dedicated to growth-related expansion of Police and Fire Services. We had begun to plan for this in previous budgets by setting aside contingencies to fund future needs, but due to some new opportunities, implementation has started and will continue in the coming budgets.
This budget and five year plan plans the implementation of a new Public Safety Center, which includes Fire Station 4 and a Police Substation that is expected to be completed in the spring of 2025.
As part of our commitment to compensate our team members in the middle of our market, Public Sector Public Consulting (PSPC) conducted a compensation study. The last time a Town wide compensation study was conducted was in 2013.
The first part of this project was to establish a comparator market that consisted of cities of similar size and demographics, as well as cities that are in close proximity. The cities that make up our comparator market are: Celina Corinth Denton Frisco Grapevine Lewisville Prosper Rockwall Rowlett The Colony
Additionally, Trophy Club Municipal Utility District and Upper Trinity Water District were used in comparisons for Public Works positions.
After establishing this market, PSPC surveyed over 100 positions and provided the market midpoint for each. Results showed that 40% of positions were more than 5% below the market midpoint. This indicates that the positions need to be reclassified to a grade where the midpoint of the range is aligned with the market midpoint. Sworn Police positions ranged between 8 13% below market and Sworn Fire positions ranged between 2 7% below market.
The total cost to implement this plan in Fiscal Year 2023 is $1.469 million.
In 2020, Little Elm entered into a long term lease with the Little Elm Independent School District to use the land at Lakeside Middle School. A Lakeside Sports Master Plan has been developed, showing the potential improvements to expand the Town’s youth sports facilities.
This project is part of the 2021 CO issuance and will include improvements to the Lakeside Middle School Softball facilities. These improvements will consist of a youth softball complex made up of three softball fields and a concession stand. Construction for this project started in July 2022.
Cost estimates are $5,900,000 depending on the selected bid alternatives and are anticipated to be complete by Spring of 2023.
In 2016, the Council adopted a master plan for camping improvements in Little Elm Park. Although we incorporated many of the recommended improvements into the Cottonwood Park Master Plan, the recommendations for improving primitive camping in Little Elm Park are still relevant.
This project is part of the 2021 CO issuance and also has funding allocated from TIRZ #3. It will include improvements to the Little Elm Park Camping and amphitheater area. Proposed improvements include upgrading campsites, a restroom and shower facility, and a boardwalk connection to the amphitheater, and amphitheater updates. The Town is also seeking grant funding through the Texas Parks and Wildlife Department. The initial budget for this project is $2,100,000.
This project will install approximately 5,600 feet of 8” reuse water lines, extending from the recently built 100,000 gallon reuse water tank located at the wastewater treatment plant to the intersection of Witt Road and King Road (near the entrance of the McCord Park Splash Pad). The estimated cost of construction is $800,000 The Town received a grant, and will pay the remainder of the project from the Utility Fund. The plans are complete and The Town is awaiting final grant funding agreements before bidding the project.
The Town Council adopted the master plan for Cottonwood Park in 2019. The project is currently under design and is expected to break ground in the middle of 2023. The first phase of this project will include new trails, pavilions, parking, a playground, restrooms, site amenities, and general improvements. The total estimated construction cost is $8,000,000 and includes funding from the Community Development Corporation, debt issuance from the 2021 COs, utility contributions, and grant funding from the Texas Parks and Wildlife Department. The adopted budget includes staffing for Parks Maintenance to ensure proper maintenance resources.
The Lawn at The Lakefront is a central part of the mixed use development happening in The Lakefront™ District. The Lawn will consist of a grand lawn area, playground, amphitheater, yard games, and event space for potential food truck events or farmer’s markets. The budget for this project is $4.5 million and comes from a combination of TIRZ #3 debt service payments, TIRZ #3 one time transfer, and developer contributions.
The project includes remodeling and expanding the existing Public Works Service Center to provide additional meeting, office, and training space. The project will also include a new water testing laboratory and bunkroom The Public Works Building Expansion is currently under design. Construction is expected to begin in FY 2022 2023. Initial construction estimates are approximately $2,000,000. Funding has been established in the 2021 CO.
This project will provide an emergency interconnection with Mustang Special Utility District to provide emergency water access if there are failures in the line that runs under Lewisville Lake. The estimate for design is $33,000 in FY 2020 2021, and the estimate for improvements is $390,910 is programmed in FY 2023 2024 CIP plan.
This project will provide additional fire and police resources around the US 380 Corridor and will be located within the Spiritas Ranch development that is currently under construction. Funding is provided through a development agreement between the Town and Centurion American, the developer of Spiritas Ranch. The Town is currently conducting a needs assessment and will begin design in FY 2022 2023 Funding is planned from the issuance of the 2022 CO.
This project will expand Hill Lane from Oak Grove Parkway to Dickson Lane to a collector level thoroughfare. The Town is seeking funding assistance from Denton County. Design is expected to be completed by the end of 2022. Estimated construction cost is approximately $6,753,600.
This project will expand King Road to a four lane divided thoroughfare from Witt Road to Rose Lane. The Town has received $4,500,000 in funding assistance from Denton County and assistance from the City of Frisco through an interlocal agreement. The project is currently in design and will be constructed by the City of Frisco. The road improvements are estimated to be complete by the Fall of 2023.
In FY 2013-2014, the Vehicle Equipment Replacement Fund (VERF) was established. User departments make annual payments to the fund on all pieces of equipment and vehicles so that
when the item reaches the end of its useful life, the money is there to purchase its replacement. The total transfer to this fund in the FY 2022 2023 budget is $2,973,504.
This is the third year the Town has collaborated with Enterprise Fleet. We have seen over this last year successful utilization of when to hit the market to sell the current fleet and what the best fit for replacements. This year, with the assistance of Enterprise Fleet, we can utilize the VERF’s balance to purchase new fleet vehicles for the Police Department. We have purchased six new units this year; plan to purchase three new units in FY 2023, and three new units in FY 2024 to provide each police officer a unit to drive home. The result will provide less wear and tear on vehicles and provide a better rate of return on resale value due to lower mileage.
As we move forward with Enterprise, we plan to reduce the contributions to the VERF with the offset of auction proceeds earnings to minimize a fund balance growth, but still maintain a balance that will be able to replace future fleet and equipment.
The total number of budgeted employees or FTEs (full time equivalents) is 392 for a salary with a benefits cost of $37 899 million in FY 2022 2023
We will be experiencing cost increases in personnel due to new positions, increasing cost of insurance premiums, and pay increases due to the compensation plan implementation.
In FY 2022-2023, employees will receive a raise based on the implementation of the compensation plan. In future years, employees will receive a step increase and a 2.5% cost of living adjustment planned for FY 2023-2024 and FY 2025-2026. The new positions proposed within the five-year budget include the following:
FY 2022 2023 Positions
• 3 Detectives (Paloma Creek), Police
• 4 Patrol Officers (mid- year), Police
• 1 Detective, LEISD, Police
• 1 School Resource Officer, LEISD, Police
• 1 School Resource Officers, DISD, Police
• Reclassify Captain to Assistant Police Chief, Police
• 1 Detective, Police
• PT Intern, Finance
• 1 Fleet Specialist, Fleet
• 1 Equipment Operator, Parks Maintenance (mid year)
• Phase II 4 Fire Fighters and reclassify six positions, Fire
• Director of Innovation and Technology, IT (mid year)
TOTAL FTEs 18.5
FY 2023 2024 Positions
• Traffic Officer, Police
• Warrant Officer, Police
• PT Intern, Finance
• Equipment Operator, Parks
• Maintenance Worker, Parks
TOTAL FTEs 4.5
FY 2024-2025 Positions
• Phase III 7 Fire Fighters, Fire
• Animal Services Officer, Animal Services
TOTAL FTEs 8
FY 2025-2026 Positions
• NONE
FY 2026-2027 Positions
• Equipment Operator, Parks Maintenance Insurance
Little Elm is facing the issue that many employers are facing, which is increasing costs to provide insurance. A 10% increase in premiums ($436,239) has been budgeted As we move into looking at cost reductions, the health insurance coverage will be reviewed annually. The Town initiated a bid on our health insurance provider to ensure the best cost and benefits to the employees. After going through the various costs and benefits to employees and the Town, we are seeing an increase of 3.85% for health insurance, 21.10% in dental, and a decrease of 4.99% for vision insurance.
Texas Municipal Retirement System (“TMRS”), a statewide administered pension plan, is a “cash balance plan” in which members make regular contributions to individual accounts that are matched with employer contributions and supplemented with investment income. TMRS covers more than 900 cities, and each municipality can design a benefit plan to meet its needs and cost structure.
The Town provides pension benefits for all of its full-time employees through TMRS. The Town continues to contribute 100% of its annual required contribution (ARC) at an actuarially determined rate and is solid. Both the employees and the Town make contributions monthly. The Town’s TMRS plan is a 2 to 1 matching ratio with a five- year vesting period. Service eligibility for retirement is age 60 with five years of service or any age with 20 years of service. In addition, the Town has updated service credits and COLA, all annual repeating.
The Town’s FY 2021 2022 contribution rate is 13.85%, with the FY 2022 2023 rate at 13.47%, which is about a 2.74% decrease As a result, the budgetary impact of the TMRS contribution rate based on the Town’s estimated wage and compensation budget for FY 2022 2023 will increase by approximately $188,261 due to increased FTEs. The following table reflects the Town’s historical contribution rates:
The General Fund is the fund that houses the basic services of municipal government. These services include Police, Fire, Streets, Development Services, Parks and Recreation, Governmental Administration, and all internal services. The total amount of expenditures in this fund adopted for FY 2022 2023 is $49,711,480. Without transfers to the other funds, the amount is $46,517,958 General Fund revenues and budgeted transfers are estimated at $47,134,341 for FY 2022 2023 This is an increase of 11.16% or ($4,732,367) over amended FY 2020 2021 The sales tax maximum rate is 8.25%, with 1% contributed to the Town of Little Elm’s General Fund The sales tax is projected to be approximately $6.311 million or 18.56% more than last year’s budget in the General Fund. This growth results from continued commercial development, population growth in the area, and a continued shift to online shopping for many residents
Revenue from permitting activity continues to provide sustaining support to general purpose operations. Single family residential dwelling permitting activity was budgeted to reflect 1,200 new construction permits in FY 2021 2022. Building permit revenues in FY 2021 2022 have exceeded the budgeted revenue of $2.5 million due to the growth. A new estimate of $3.575 million will be reported this year, including all permit fees for residential, commercial, and multi-
family. The Town is forecasting conservative growth in new construction permits for residential at 1,350 units in FY 2022 2023. With residential and commercial permitting, the anticipated revenue for building permits will be approximately $2.80 million.
As discussed above, property tax represents 47% of the total funding sources of the General Fund at $22.139 million and is approximately $1.116 million or 5% more than FY 2021 2022 The growth is from new construction values and appreciation in property values. The transfers into the General Fund represent 5% of total sources of funds and include payment for General and Administrative services from the Utility Fund.
General Fund operating expenditures total $46,517,958 before transfers out. With transfers, the total General Fund budget for FY 2022-2023 is $49,711,480. This budget is a 5.33% increase or $2,516,267 more than FY 2021 2022 amended budget. This budget without transfers is an 8.06% increase or $3,469,334 more than FY 2021 2022 amended budget.
A comparison of the General Fund budgeted expenses for FY 2021 2022 and FY 2022 2023 is illustrated in the table below:
General $3,193,522 ($953,066) Total $47,195,212
Like most municipal organizations, Public Safety makes up the most significant cost center of general purpose operations with a combined budget of $27.904 million or 56% of the total General Fund operating budget. These services include Police, Fire, Municipal Court, Animal Services, and ambulance costs. By category, total personnel costs represent about 69.22% or $32.2 million of General Fund operation costs.
The total ending fund balance for the General Fund is projected to be $29.8 million for FY 2022 2023. This estimated and projected ending fund balance is approximately 59.97% of operating expenditures The Town’s fund balance legal reserve requirement by town ordinance is 25% and is equal to approximately $12.4 million, leaving a budgeted amount that will be rolled forward for use in future years while the tax base grows in the northern part of the community
The Town of Little Elm utilizes a conservative strategy when projecting revenues and expenditures. Revenue and expenditure patterns to make adjustments as needed
The Utility Fund (“the utility system”) is 100% self supporting with rates and charges sufficient to cover operating, debt and various scheduled capital outlay purchases and capital infrastructure projects. The Town operates a full service utility with water production and distribution, sewer collection, treatment, and meter billing and collection. The Utility Fund serves as a business enterprise and utilizes full accrual accounting. The Utility Fund segregates and distinguishes water operations and sewer function and works toward making each operation self supporting.
The FY 2022 2023 budget for Water and Sewer combined operations incorporates the multi year rate package approved by the Town Council on September 15, 2020. The rate plan provided a rate freeze for the FY 2020 2021 but includes rate adjustments commencing in October 2021, October 2022, October 2023, and October 2024. The adopted rate plan is sufficient to fund operating, debt, and capital expenditures to be incurred by the Town over the forecasted period and maintain minimum required fund balances and debt obligation coverage Staff does plan to review our rate plan later this fall due to the various factors that can impact rates.
The Water and Sewer Fund is expected to begin FY 2022 2023 with a $19.8 million working capital balance The Town is maintaining working capital per policy of a minimum of 120 days reserves. As a result, the expected ending working capital balance will be in excess of the required reserve at $12.7 million. A healthy fund balance is necessary to help fund future capital projects and one time maintenance infrastructure costs planned within the five year balanced budget. The fund balance is programmed to be reduced in the five year financial plan due to the increased costs of operations and future debt issuance for capital infrastructure
The total Utility Fund revenues from rates, fees, and charges are expected to be $20.8 million, and with interest earnings of $225,000, the total revenues of the system are estimated at $21,277,929. It is expected that total revenues will be 3.43% more than the prior- year budget due to a growth in residential, multi family and commercial connections to the Town’s utility system and the 2% water rate increase planned in the multi year rate plan. The Town assesses and collects water and sewer developer impact fees to help pay the costs of the infrastructure associated with new development for commercial and residential development.
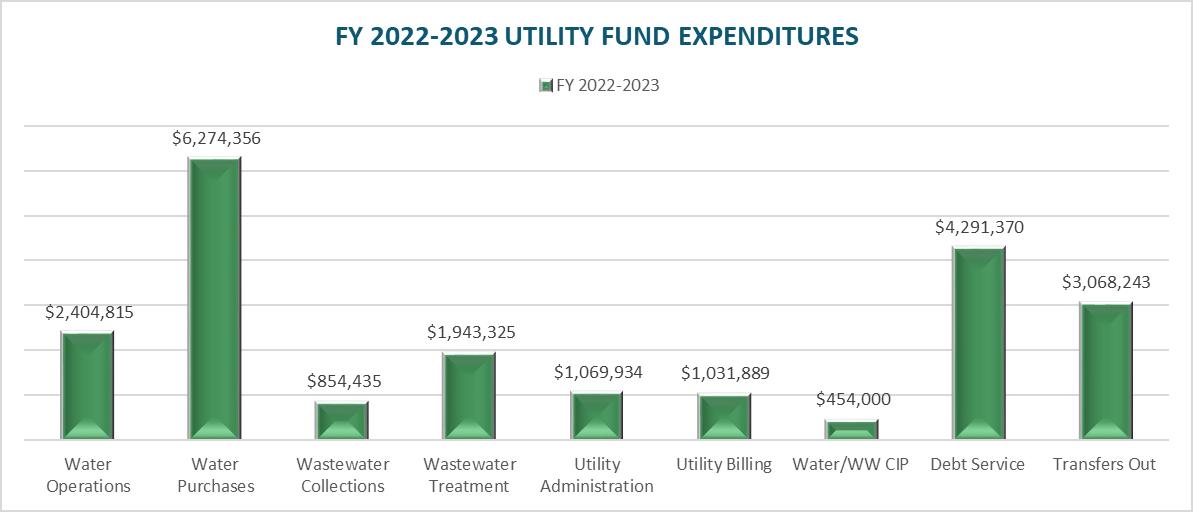
Other fees are related to services performed in the field for new connections, penalties, and interest on late payments and disconnects. Other financing sources include impact fees and other developer contributions. The Utility Fund expenses for operations, debt, transfers, infrastructure improvements, and capital items total $21,392,367 The following graph reflects the uses of funds in the Town’s utility system:
The budget includes a pass through increase for water purchased through the North Texas Municipal Water District (NTMWD). The rate for purchased water will see a significant increase based on the information the Town has received from NTMWD. This rate will go from $3.04 to $3.44 per 1,000 gallons. Wholesale water costs for FY 2021 2022 were $5,371,954, while FY 2022 2023 is projected to be $6,274,356, which represents a 16.80% increase.
This fund is a business type fund that accounts for the Town’s solid waste activities (refuse, hazardous waste, and recycling materials). The Town contracts for solid waste collection with Community Waste Disposal, Inc. (CWD). Due to the closure of the DFW Landfill in Lewisville in late 2019, CWD requested an amendment to the contract to address the disposal cost increase. The amended agreement was approved effective February 1, 2020, and included an extension of the contract to 2025. The residential rates are frozen until September 2022 and can only be allowed to increase for disposal costs if approved by the Town annually. Residents currently pay $18.03 for household refuse collection and disposal. The Town’s commercial accounts are billed directly by CWD.
The Town operates its courtesy disposal site with franchise and user fees generated through this fund. The Solid Waste Fund accounts for the Town’s semi-annual clean-up events and the cost of disposal of household hazardous waste collection and disposal. The annual contract for waste collection and disposal estimated at $3.103 million. With this amount, the FY 2022-2023 budget for the Town’s Solid Waste Fund is $3,463,338 before transfers and supported by franchise fees, billing, and collection fees and sales of service of $4,125,881.
The budgeted amount out of the ¼ cent Street Maintenance Fund for FY2022 2023 is $2,250,000. The Street Maintenance Fund is budgeted toward neighborhood street repairs and construction annually. The fund is typically spent down each year to complete as many street maintenance projects as possible.
Little Elm voters renewed a ¼ cent sales tax in May 2021 to construct and maintain the Town's streets. The Town issues an annual competitive bid for street maintenance and awards the bid for street repairs based on a comprehensive street maintenance inventory grid maintained by the Town's engineer. The first election was in 2005. Street Maintenance Project Inventory is updated annually by Public Works and Engineering, and projects are prioritized and placed out to bid. The bids are value engineered and tailored to the Street Maintenance Sales Tax Budget.
Several years ago, the decision was made to separate the revenue-generating functions of the Parks and Recreation Department into a special revenue fund. This allows staff to take more of a business philosophy towards functions such as The Rec at The Lakefront™, Special Events, and Athletic Programming. This philosophy has been paying off as we see early success at The Cove at The Lakefront®, a considerable increase in membership at The Rec™, a much higher level of cost recovery in Special Events, Athletics, and Aquatics, and a drastic reduction in the General Fund subsidy to the Parks and Recreation Fund.
The Rec at The Lakefront™ has continued to recover from the COVID 19 pandemic, which significantly affected operations and membership. It is anticipated that the facility will end FY 2022 2023, with a strong level of cost recovery for operations.
This fund has seen a significant change in revenues and expenses due to the opening of Little Elm's new aquatic park, The Cove at the Lakefront™ in Spring of 2021. The Cove® is fully showing cost recovery in next year’s budget and helps offset the operations of The Rec at The Lakefront™
We are continuing to place a great emphasis on special events and have been moving forward with bringing our events back and growing them now that COVID 19 seems to have leveled out. The planned events include Autumn Fest, Pumpkin Hollow/Haunted Trail, Lights on The Lake, The Big Easy in Little Elm, Brew & Que, and July Jubilee.
Over the course of the five year budget, it is not anticipated that the General Fund will have to lend any subsidy to this fund. This means that all of the direct operating costs to provide recreation
services to the Town of Little Elm are self supporting. To meet fund balance requirements, revenues in this fund must exceed expenses by 25% to avoid a subsidy from the General Fund. We feel that this fund is in a strong position and it allows user fees to cover the cost of recreation programming and facilities so that very little tax money, if any, is utilized. We have no plans in this five year financial plan for the General Fund assist in the fund balance requirement.
The funding for this fund comes predominantly from leases the Town has on its tower facilities and funds that developers escrow for landscape and sidewalks. The revenue from the leases total approximately $165,000, and there is a small amount of $2,500 for tree mitigation. In addition to tower lease proceeds, the fund is supported with a transfer from the Solid Waste Fund for $391,000 and $50,000 from the Community Development Corporation (CDC). This fund will also receive annual payments from various Homeowner Associations (HOAs) as they fulfill contractual agreements to pay back their matching portion of the now expired Neighborhood Integrity Grant program
The Landscape Fund also includes the Town’s right of way mowing contract with a budgeted allocation of $500,000 Other budgeted expenses include:
• Digital signs data line $2,000 per year
• Miscellaneous landscape and signage $50,00 per year
• West side screen wall FY 2024; $200,000
• Fence repair/staining FY 2025; $60,000
The Landscape Fund will begin the year with a balance of $44,284 and is estimated to end the fiscal year with a balance of $151,797.
On November 1, 2011, the Town Council adopted Ordinance #1087, implementing the stormwater management program. Beginning in January 2012, Little Elm utility customers were assessed a drainage fee as established and determined by Town staff and a consulting team. The purpose of the fee is to provide more effective stormwater management throughout Little Elm. It will also help protect Lake Lewisville, the community, private property, and the environment from stormwater problems such as pollution, damage to aquatic habitat, creek erosion, and flooding. The stormwater s ystem is a network of structures, channels, and underground pipes that carry stormwater (rainwater) to ponds, lakes, streams, and rivers. The network consists of both public and private systems. It is an integral part of the stormwater management system in the Town that
is designed to control the quantity, quality, timing, and distribution of storm runoff. It is not part of the wastewater (sanitary) sewer system, which carries water and waste from drains (sinks, bathtubs, showers, etc.) and toilets to a treatment plant to be treated and filtered. Stormwater does not flow to a treatment plant.
The Town’s drainage fee is based on a drainage master plan as approved by the Town Council and is calculated on impervious service areas. There is a standard square footage assessment for each residential property with commercial properties based on square footage plus concrete parking. Residents pay a base fee of $3.35, and commercial accounts pay a calculated rate on their impervious area per their equivalent residential units of $3.35.
The total budget for the Storm Drainage Fund for FY 2022 2023 is $703,181 and funds vehicles, equipment, and personnel to oversee drainage work There is also funding of various drainage projects to improve the creeks and channels within the Town, including:
• McCord Park Trail Drainage, FY 23 $50,000
• Hilltown Drainage Study, FY23 $100,000
• Shell Beach Drainage Project, FY25 $75,000
• Wynfield Farms Outfalls with debris separators, FY26 $120,000
This fund was established by Council in FY 2012 2013 to provide funding for the Town’s future public access and educational channel. The estimated balance at the fiscal year ending September 30, 2022, will be approximately $22,478. The annual revenue to support the fund will be approximately $32,300 for FY 2022 2023. In the coming years, the PEG fund will be utilized to make improvements to improve the broadcast and viewing quality of the Council meetings and public information.
The CDC is supported by a .25 cent sales tax and is utilized to support parks and recreation improvements and programs in the Town of Little Elm. The CDC typically covers the debt service for portions of parks projects completed in previous years, such as Little Elm Park improvements, Beard Park improvements, and improvements at The Rec at The Lakefront and the Cove at the Lakefront. It has also been a critical funding source for many trail and lighting projects. In the coming budget, the major expenses of the CDC are as follows:
• Park Improvements (One time transfer) FY23, $2,000,000
• Park Maintenance Equipment FY23; $389,965
• Cricket Field FY 23, $100,000
• Little Elm Park Playground surface replacement, FY23 $105,000
• Parks plan study, FY23 $60,000
• Miscellaneous Park Projects, FY23 FY27 $50,000
• Sports Complex Improvements FY23; $49,000
• Splash Pad maintenance, FY23 $26,000
• Cottonwood Park playground surface repair, FY23 $19,000
• Christmas Lights and LED bows FY23; $10,000
• Lightning Detection System, FY23 FY27 $8,000
The TIRZ for The Lakefront District was established a few years ago to benefit and enhance the development of this unique area in Little Elm. The Town, EDC, CDC, and Denton County all participate in this TIRZ with the contribution of revenues earmarked for improvements in this area. The funding that is supporting the TIRZ is based on the incremental increase of property taxes and sales taxes generated within the boundaries of the TIRZ. There was very little revenue for the first couple of years, but now that many new projects have occurred in the Lakefront District, revenue sufficient to begin going towards improvements is beginning to be generated. The following are the items funded out of the TIRZ #3 Budget in FY 2022 2023:
• Website/Marketing $107,567
• Transfer to General Fund for Marketing Administration, FY23 FY27 $100,000
• Christmas tree for The Lawn™ $83,000
• Placemaking and Public Art $80,000
• July Jubilee Sponsorship $50,000
• Little Elm Park seasonal security, FY23-FY27 - $40,000
• Beach Sand, FY23 FY27 $30,000
• Local Business Incentive-$25,000
• Speakers at Little Elm Beach $20,000
• efrogs, FY23 FY27 $17,400
• Seasonal Banners, FY23 FY27 $15,000
• Lakefront building lights maintenance, FY23 27 $12,100
• Professional Services Property Tax Collection Analysis and Reporting $10,000
• Little Elm Park Amphitheater $600,000
• The Lawn at the Lakefront™ $500,000
The purpose of this fund is to record property taxes levied and collected to pay annual principal and interest payments on debt obligations with a legally binding pledge to repay with a commitment of a yearly tax levy against property values certified by the Denton County Appraisal District. The following is a list of all debt obligations:

Total Outstanding 9/30/2022 P&I Due FY 2022-2023
2012 General Obligation Refunding Bonds - $6.958M 8/1/2024 8/1/2021 170,000$ 5,100$ 175,100$ 175,100$
2012A General Obligation Refunding Bonds - $2.735M 8/1/2027 8/1/2022 1,020,000 64,790 1,084,790 216,318
2013 Certificates of Obligations - $6M (CDC) 8/1/2033 8/1/2023 3,705,000 779,550 4,484,550 406,700
2013A Certificates of Obligations -$3M 8/1/2033 8/1/2023 1,915,000 457,775 2,372,775 217,925
2014 General Obligations Refunding - $4.550M 8/1/2029 8/1/2024 1,050,000 163,725 1,213,725 177,750
2015 Certificates of Obligations - $9.655M 2/1/2036 2/1/2025 7,260,000 1,686,918 8,946,918 641,338
2016 General Obligations Refunding - $6.725M 8/1/2027 8/1/2025 3,175,000 202,094 3,377,094 738,619
2018 Certificates of Obligations - $15.460M 2/1/2038 2/1/2028 10,910,000 3,373,716 14,283,716 893,731
2019 General Obligations Refunding - $7.230M 8/1/2029 5,515,000 709,600 6,224,600 869,600
2019 Certificiates of Obligations - $6.640M 2/1/2039 2/1/2028 5,895,000 1,817,775 7,712,775 456,000
2020 General Obligations Refunding - $5.725M 8/1/2030 4,470,000 220,050 4,690,050 588,276
2020 Certificates of Obligations - $4.085M 8/1/2040 8/1/2029 3,745,000 811,150 4,556,150 252,600
2021 Certificates of Obligations - $15M 8/1/2041 8/1/2030 13,100,000 4,014,482 17,114,482 904,869
2022 Certificates of Obligations - $10M 8/1/2042 9,560,000 4,253,500 13,813,500 1,508,650
TOTAL DEBT FOR PRIMARY GOVERNMENT (TAX SUPPORTED) 71,490,000$ 18,560,224$ 90,050,224$ 8,047,476$
2012 General Obligation Refunding Bonds - $6.985M 8/1/2024 8/1/2021 595,000$ 26,850$ 621,850$ 312,850$
2012 Certificate of Obligations - $6.0M 8/1/2027 8/1/2022 2,325,000$ 161,231$ 2,486,231$ 486,176$
2013 General Obligation Refunding Bonds - $3.040M 9/1/2025 9/1/2022 995,000 47,569 1,042,569 255,556
2014 General Obligations Refunding - $4.550M 8/1/2029 8/1/2024 1,315,000 198,200 1,513,200 222,075
2016 Certificate of Obligations - $7.640M 8/1/2036 8/1/2025 5,935,000 1,416,800 7,351,800 524,094
2017 Certificate of Obligations - $11.830M 8/1/2037 8/1/2026 9,375,000 2,590,737 11,965,737 799,888
2017 General Obligations - $13.645M 8/1/2034 8/1/2026 10,960,000 2,489,088 13,449,088 1,122,875
2021 Certificates of Obligations - $9M 8/1/2041 8/1/2030 7,860,000 2,408,394 10,268,394 542,856
TOTAL SELF-SUPPORTING DEBT (UTILITY) 39,360,000$ 9,338,868$ 48,698,868$ 4,266,370$
TOTAL DEBT OBLIGATIONS 110,850,000$ 27,899,093$ 138,749,093$ 12,313,846$
This completes the highlights of the FY 2022 2023 budget and a balanced financial plan through FY 2026 2027. We feel that we have done our best to listen to the directives set forth by the Town Council at the beginning of the budgeting process and met all the needs communicated. The Town of Little Elm staff and department heads have put a tremendous amount of effort into building a budget that is conservative and respectful of the taxpayers’ resources while still addressing the needs and challenges that are presented by the unprecedented growth the community is experiencing. I am proud that this is a document put together by a team who all had the community’s best interests at heart.
Respectfully submitted,
Matt Mueller Town Manager
BEGINNING FUND BALANCE $34,446,928 $1,073,555 $7,408,580 $3,081,850 $35,788,293 $81,799,206
Ad Valorem Taxes $22,139,362 $7,161,155 $782,654 $- $- $30,083,171
Sales and Use Taxes 6,310,933 - 1,825,791 - - 8,136,723
Franchise and Other Taxes 2,247,500 - 172,677 - - 2,420,177
Fines and Forfeitures 805,000 - - - - 805,000
Impact Fees - - - 300,000 - 300,000
Licenses, Permits & Fees 3,293,576 - - - 740,000 4,033,576
Charges for Services 6,784,200 - $1,003,035 - - 7,787,235
Intergovernmental 7,609,168 109,973 4,600 - 1,431,417 9,155,158
Interest Earnings 220,000 30,000 36,750 21,000 225,000 532,750
Debt Proceeds - - - - - -
Miscellaneous 96,000 - 41,213 500,000 637,213
Transfers In 2,306,802 - 441,000 - 3,235,000 5,982,802
TOTAL REVENUES $51,812,541 $7,301,128 $4,307,720 $321,000 $6,131,417 $69,873,805
TOTAL FUNDS AVAILABLE $86,259,469 $8,374,683 $11,716,300 $3,402,850 $41,919,710 $151,673,012
General Government $7,643,846 $14,000 $491,067 $- $- $8,148,913
Public Safety 27,904,324 - 90,740 - 1,500,000 29,495,064
Community Services 4,342,541 - - - - 4,342,541
Public Works 3,529,488 - 2,802,000 - 2,787,851 9,119,339
Culture and Recreation 7,998,413 - 25,000 - 17,009,126 25,032,539
Utilities - - 662,469 - - 662,469
Debt Service - 8,031,921 - - - 8,031,921
Transfers Out 3,194,922 - 1,297,712 135,000 - 4,627,634
TOTAL EXPENDITURES $54,613,534 $8,045,921 $5,368,988 $135,000 $21,296,977 $89,460,419
NET INCOME/(LOSS) $(2,800,993) $(744,793) $(1,061,268) $186,000 $(15,165,560) $(19,586,614)
ENDING FUND BALANCE $31,645,935 $328,762 $6,347,313 $3,267,850 $20,622,733 $62,212,593
BEGINNING FUND BALANCE $20,496,731 $5,480,460 $12,383,730 $3,534,374 $2,082,084 $125,776,584
Ad Valorem Taxes $- $- $- $- $- $30,083,171
Sales and Use Taxes - - - - 1,624,475 9,761,198
Franchise and Other Taxes 211,553 - - - - 2,631,730
Fines and Forfeitures - - - - - 805,000
Impact Fees - 600,000 - - - 900,000
Licenses, Permits & Fees 4,392,328 - - - - 8,425,904
Charges for Services 20,368,431 - - - - 28,155,667
Intergovernmental - - - - - 9,155,158
Interest Earnings 230,000 - 25,000 32,000 9,000 828,750
Debt Proceeds - - - -
Miscellaneous 201,498 - - 450,000 - 1,288,711
Transfers In - - 2,880,241 3,235,634 - 12,098,676
TOTAL REVENUES $25,403,810 $600,000 $2,905,241 $3,717,634 $1,633,475 $104,133,965
TOTAL FUNDS AVAILABLE $45,900,541 $6,080,460 $15,288,971 $7,252,007 $3,715,559 $229,910,549
General Government $- $- $- $65,175 $- $8,214,088
Public Safety - - - 1,942,358 - 31,437,422
Community Services - - - 155,144 - 4,497,685
Public Works - - - 382,390 - 9,501,729
Culture and Recreation - - - 294,471 827,165 26,154,175
Utilities 17,496,092 - 8,512,097 - - 26,670,658
Debt Service 4,291,370 - - - - 12,323,291
Transfers Out 3,634,243 1,771,800 - - 2,065,000 12,098,676
TOTAL EXPENDITURES $25,421,705 $1,771,800 $8,512,097 $2,839,538 $2,892,165 $130,897,724
NET INCOME/(LOSS) $(17,894) $(1,171,800) $(5,606,856) $878,096 $(1,258,690) $(26,763,759)
ENDING FUND BALANCE $20,478,836 $4,308,660 $6,776,874 $4,412,469 $823,394 $99,012,826
The General Fund is the fund that houses the basic services of municipal government. These services include Police, Fire, Streets, Public Works, Development Services, Engineering, Building Inspections, Parks Maintenance, Senior Center, Library, and General Governmental Administration.
Town Council $203,307
Town Manager $1,769,783 $2,458,359
Information Technology $2,291,342
Town $340,000 $480,555
Non-Departmental $100,500
Total $7,643,846
Municipal $699,411 $414,292 $14,857,977 $11,932,644
Total $27,904,324
Total
Actual Amended Budget Estimated Budget Adopted Budget Planning Years 2020 - 2021 2021 - 2022 2021 - 2022 2022 - 2023 2023 - 2024 2024 - 2025 2025 - 2026 2026 - 2027
BEGINNING FUND BALANCE $22,425,013 $29,259,887 $29,259,887 $32,390,636 $29,813,496 $27,578,824 $23,747,735 $18,542,991
Ad Valorem Taxes $22,340,029 $21,022,917 $22,734,766 $22,139,362 $22,258,465 $23,258,966 $23,587,704 $24,146,427
Sales and Use Taxes 5,688,827 5,322,918 6,372,610 6,310,933 6,411,072 6,512,713 6,512,713 6,512,713
Franchise and Other Taxes 2,223,898 2,180,000 2,327,403 2,247,500 2,255,000 2,285,000 2,312,500 2,312,500
Fines and Forfeitures 788,368 675,000 923,905 805,000 805,000 805,000 805,000 805,000
Licenses and Permits 6,685,946 2,947,576 4,146,886 3,293,576 3,263,576 2,443,576 2,193,576 2,193,576
Charges for Services 2,817,557 2,273,000 2,303,046 2,176,000 2,177,500 2,112,500 2,062,500 2,062,500
Intergovernmental 5,077,672 4,912,730 6,716,048 7,609,168 7,384,019 6,173,063 6,416,761 6,549,279
Interest Earnings 143,902 200,000 174,215 200,000 225,000 250,000 250,000 250,000
Miscellaneous 2,446,244 646,826 241,216 96,000 96,000 96,000 96,000 96,000
Transfers In 2,098,803 2,221,006 2,221,006 2,256,802 2,307,028 2,403,924 2,420,514 2,429,183
TOTAL REVENUES $50,311,246 $42,401,973 $48,161,101 $47,134,341 $47,182,660 $46,340,742 $46,657,268 $47,357,178
TOTAL FUNDS AVAILABLE $72,736,259 $71,661,860 $77,420,988 $79,524,976 $76,996,156 $73,919,567 $70,405,003 $65,900,169
EXPENDITURES
General Government $5,256,910 $7,137,510 $6,447,113 $7,643,846 $6,961,272 $6,582,272 $6,895,748 $7,245,796
Public Safety 23,042,029 25,714,559 $25,097,697 27,904,324 28,468,661 29,728,442 30,787,084 31,099,523
Community Services 2,794,028 3,719,277 $3,354,923 4,342,541 4,411,496 4,040,680 4,168,059 4,195,272
Public Works 2,635,974 3,415,290 $3,184,612 3,529,488 3,509,792 3,590,527 3,682,869 3,747,896 Culture and Recreation 2,617,655 3,061,989 $2,819,419 3,097,759 3,339,009 3,415,159 3,517,792 3,635,595
TOTAL EXPENDITURES $36,346,596 $43,048,624 $40,903,764 $46,517,958 $46,690,230 $47,357,080 $49,051,552 $49,924,082
Transfers Out $7,129,776 $4,146,588 $4,126,588 $3,193,522 $2,727,101 2,814,751 2,810,460 2,796,053
TOTAL TRANSFERS $7,129,776 $4,146,588 $4,126,588 $3,193,522 $2,727,101 $2,814,751 $2,810,460 $2,796,053
TOTAL EXPENDITURES INCL. TRANSFERS $43,476,372 $47,195,212 $45,030,352 $49,711,480 $49,417,331 $50,171,831 $51,862,013 $52,720,135
NET INCOME/(LOSS) $6,834,874 ($4,793,239) $3,130,749 ($2,577,139) ($2,234,672) ($3,831,089) ($5,204,745) ($5,362,957)
ENDING FUND BALANCE $29,259,887 $24,466,648 $32,390,636 $29,813,496 $27,578,824 $23,747,735 $18,542,991 $13,180,034
COMMITTED

Fiscal Year 2022 – 2023 Budget
General Fund revenue is made up of several categories of revenue from across multiple Town departments. These include:
• Ad Valorem (Property) Taxes – Property Taxes are based on the appraised values provided by Denton County Central Appraisal District.
• Sales and Use Tax – Of the two percent sales tax on taxable sales within the Town, one cent is recorded as revenue in the General Fund.
• Franchise Fees – Includes fees assessed for private use of public property.

• Fines and Forfeiture – Includes all court fines and fees, and contractor and constructions fees, and other Town fees.
• Licenses and Permits – Includes permits and licenses required by the Town for homes and businesses.
• Charges for Service – Includes all revenues collected for services provided through the departments funded through the General Fund.
• Intergovernmental – Activities of two or more governments providing assistance for a program.

• Miscellaneous – Items not covered above.


Actual Amended Budget Estimated Budget Adopted Budget Planning Years
Description 2020 - 2021 2021 - 2022 2021 - 2022 2022 - 2023 2023 - 2024 2024 - 2025 2025 - 2026 2026 - 2027
Ad Valorem - Current $23,688,059 $24,393,411 $26,529,879 $26,343,296 $28,798,877 $30,817,572 $31,800,413 $32,733,851
Contra Property Tax (TIRZ/ MMD) (1,529,403) (3,445,494) (3,950,000) (4,281,934) (6,123,325) (7,092,010) (7,609,964) (7,780,455)
Potential 1% HS exemption (495,087) (544,596) (680,745) (884,969)
Penalty and Interest Earnings on Delinquent 81,226 50,000 57,464 50,000 50,000 50,000 50,000 50,000
Ad Valorem - Prior Year 98,298 25,000 95,164 25,000 25,000 25,000 25,000 25,000
Ad Valorem - Prior Year Contra (1,739) - - - - -
Vehicle Inventory Tax 1,849 - 3,997 3,000 3,000 3,000 3,000 3,000
Total Ad Valorem Tax $22,340,029 $21,022,917 $22,734,766 $22,139,362 $22,258,465 $23,258,966 $23,587,704 $24,146,427
Town Sales Tax $5,792,064 $5,772,918 $6,545,032 $6,675,933 $6,776,072 $6,877,713 $6,877,713 $6,877,713
Contra Sales Tax (181,076) (525,000) (256,790) (450,000) (450,000) (450,000) (450,000) (450,000)
Mixed Drink Tax 77,840 75,000 84,369 85,000 85,000 85,000 85,000 85,000
Total Sales and Use Tax $5,688,827 $5,322,918 $6,372,610 $6,310,933 $6,411,072 $6,512,713 $6,512,713 $6,512,713
Franchise Fee - Electric $1,906,578 $1,850,000 $1,924,411 $1,900,000 $1,900,000 $1,925,000 $1,950,000 $1,950,000
Franchise Fee - Gas 207,221 200,000 280,489 225,000 225,000 225,000 225,000 225,000
Franchise Fee - Cable 82,972 100,000 90,400 90,000 95,000 100,000 100,000 100,000
Franchise Fee - Telephone 27,127 30,000 27,103 27,500 27,500 27,500 27,500 27,500
Franchise Fee - Cell Nodes - - 5,000 5,000 7,500 7,500 10,000 10,000
TOTAL Franchise Fees $2,223,898 $2,180,000 $2,327,403 $2,247,500 $2,255,000 $2,285,000 $2,312,500 $2,312,500
Municipal Court Fines $760,913 $650,000 $892,419 $775,000 $775,000 $775,000 $775,000 $775,000 Court Credit Card Fees 27,455 25,000 31,487 30,000 30,000 30,000 30,000 30,000
TOTAL FINES AND FORFEITURES $788,368 $675,000 $923,905 $805,000 $805,000 $805,000 $805,000 $805,000
Mobile Home Park Licenses $14,076 $14,076 $14,076 $14,076 $14,076 $14,076 $14,076 $14,076
Annual Permits 39,925 35,000 48,775 45,000 45,000 45,000 45,000 45,000 Certificate of Occupancy 8,500 4,000 7,100 7,500 7,500 7,500 7,500 7,500
Building Permits 6,055,840 2,500,000 3,575,066 2,800,000 2,800,000 2,000,000 1,750,000 1,750,000
Plumbing Permits 200 - 75 - - - -Contractor Regs and Reinspec tions 172,725 125,000 199,946 150,000 120,000 100,000 100,000 100,000
Other Permits 2,050 2,000 12,025 2,000 2,000 2,000 2,000 2,000 Irrigation Permits 305,052 200,000 202,419 200,000 200,000 200,000 200,000 200,000 Sign Permits 7,960 7,500 14,890 10,000 10,000 10,000 10,000 10,000
Engineering Contractor Regis tration 3,160 - 3,200 - - - - -
Alarm Permits 60,000 69,314 65,000 65,000 65,000 65,000 65,000 Total Licenses and Permits $6,685,946 $2,947,576 $4,146,886 $3,293,576 $3,263,576 $2,443,576 $2,193,576 $2,193,576
Rental Registrations $296,552 $265,000 $224,056 $225,000 $250,000 $250,000 $250,000 $250,000
Infrastructure Inspection Fees 120,701 125,000 66,343 75,000 75,000 75,000 75,000 75,000
Fire Code Inspection Fees 15,000 15,959 15,000 15,000 15,000 15,000 15,000
Platting Fees 50,000 50,902 45,000 40,000 25,000 25,000 25,000 Planning and Zoning Fees 8,000 6,250 6,000 5,000 5,000 5,000 5,000
Plan Review Fees 875,563 600,000 514,242 475,000 450,000 400,000 350,000 350,000 Animal Control Revenue 20,000 24,873 25,000 25,000 25,000 25,000 25,000
Actual Amended Budget Estimated Budget Adopted Budget Years
2020 - 2021 2021 - 2022 2021 - 2022 2022 - 2023 2023 - 2024 2024 - 2025 2025 - 2026 2026 - 2027
Charges for Services Cont.
Senior Travel/Entertainment Funds - - 2,673 10,000 10,000 10,000 10,000 10,000
Cottonwood Creek Marina - Land USE 3,125 2,500 2,500 10,000 10,000 10,000 10,000 10,000
Library Revenue 5,149 7,500 7,621 7,500 7,500 7,500 7,500 7,500
Concession Proceeds 110,197 40,000 111,986 100,000 100,000 100,000 100,000 100,000
Cottonwood Creek Marina - Sales 46,079 85,000 48,048 50,000 50,000 50,000 50,000 50,000
Boat Ramp Fees 72,505 80,000 80,312 80,000 85,000 85,000 85,000 85,000 Park and Wildlife Fees 129 - 444 - - - - -
Ambulance/Fire Runs 1,072,496 925,000 1,086,416 1,000,000 1,000,000 1,000,000 1,000,000 1,000,000 Fire Runs/Collection 21,925 20,000 30,420 22,500 25,000 25,000 25,000 25,000
Transfer from LEEDC 30,000 30,000 30,000 30,000 30,000 30,000 30,000 30,000
Total Charges for Services $2,817,557 $2,273,000 $2,303,046 $2,176,000 $2,177,500 $2,112,500 $2,062,500 $2,062,500
Library Qtr Pledge Denton County $45,000 $45,000 $47,600 $47,600 $47,600 $47,600 $47,600 $47,600
Fire Services Pledge Denton County 144,400 100,000 121,400 115,000 118,000 120,950 124,000 124,000 Ambulance Pledge Denton County 69,905 70,000 72,422 72,500 73,000 73,500 74,000 74,500 DCFWS-Police Service Agreement 602,008 665,072 665,072 695,319 743,992 762,591 800,721 820,739
Contract: Lakewood Village-Fire/EMS 36,450 53,000 53,000 53,000 53,000 53,000 53,000 53,000
Contract: City of Hackberry-PD 101,530 106,606 106,606 117,267 125,476 128,612 135,043 138,419 Paloma Creek Police Services 1,658,917 1,871,452 1,868,952 2,143,693 2,293,751 2,351,095 2,468,650 2,530,366 Paloma Creek static costs 446,841 248,841 248,841 248,841 248,841 Other Grants/Reimbursements 113,673 123,350 273,858 - - - - -
SRO Contracts - LEISD, DISD 909,441 909,395 938,722 1,206,352 1,290,796 1,323,066 1,389,220 1,423,950
SRO Contracts - ONE TIME COSTS 148,155
MUTUAL AID REIMBURSEMENTS 93,742 - 382,756 - - - - -
FISD Miller/Roberts 73,500 2,500 2,500 2,500 2,500 2,500 2,500 2,500
DCFWS - Fire Services 67,068 204,370 216,145 338,935 421,109 421,109 421,109 421,109 Reimbursement 402,092 165,000 125,338 165,000 165,000 165,000 165,000 165,000
CRF CARES Act Funding 688,649 - - - - - -American Recovery Act Funds 71,297 144,685 1,389,377 1,604,706 1,337,347 - -Crossroads Fire/Police Services - 452,300 452,300 452,300 463,608 475,198 487,078 499,255
Total Intergovernmental Revenue $5,077,672 $4,912,730 $6,716,048 $7,609,168 $7,384,019 $6,173,063 $6,416,761 $6,549,279
Interest Earnings $143,902 $200,000 $174,215 $200,000 $225,000 $250,000 $250,000 $250,000
Auction Proceeds $46,041 $- $4,899 $- $- $- $- $Insurance Riembursements 159,356 40,000 141,137 40,000 40,000 40,000 40,000 40,000 Abatement Reimbursements 11,036 6,000 4,527 6,000 6,000 6,000 6,000 6,000
Miscellaneous Revenue 129,579 600,826 90,653 50,000 50,000 50,000 50,000 50,000
TIRZ 5 contribution revenue 2,100,233 - - - - - - -
Total Miscellaneous Revenue $2,446,244 $646,826 $241,216 $96,000 $96,000 $96,000 $96,000 $96,000
TRANSFERS
Transfer from Water Utility Fund $1,810,000 $1,924,506 $1,924,506 $1,959,802 $1,985,028 $2,081,924 $2,098,514 $2,107,183
Transfer from Solid Waste Fund 175,000 175,000 175,000 200,000 200,000 200,000 200,000
Transfer from CDC 15,000 15,000 15,000 15,000 15,000 15,000 15,000
Transfer from Other Funds 106,500 106,500 107,000 107,000 107,000 107,000 107,000
Total Transfers $2,098,803 $2,221,006 $2,221,006 $2,256,802 $2,307,028 $2,403,924 $2,420,514 $2,429,183
TOTAL $42,401,973 $48,161,101 $47,134,341 $47,182,660 $46,340,742 $46,657,268 $47,357,178
This fund is the fiscal and accounting entity used to record financial transactions and balances related to the operation of the Town’s recreation programs. The Fund has four divisions – Aquatic Facility, Recreation Programming, Special Events and Athletics. Special events include July Jubilee, Brew and Que, AutumnFest and more. The two-story recreation center spans over 26,000 square feet, and includes elements such as a large state of the art fitness area, full-size gym, recreation classrooms, multi-purpose room, craft room, outdoor terrace, and spacious men’s and women’s locker rooms. The facility offers memberships, group exercise, programs and classes of all types, amenities, and facility rentals.
The Cove at The Lakefront™ aquatic park opened in 2021. The aquatics facility is over 42,000 square feet, with a retractable roof that provides year-round entertainment and activities for all ages. The Cove™ has a FlowRider® Double, a zerodepth splash pad, a large play structure, multiple slides, an activity pool, entertainment areas, party rooms, and cabanas.
Actual Amended Budget Estimated Budget Adopted Budget Planning Years 2020 - 2021 2021 - 2022 2021 - 2022 2022 - 2023 2023 - 2024 2024 - 2025 2025 - 2026 2026 - 2027
BEGINNING FUND BALANCE $1,292,457 $2,024,650 $2,024,650 $2,056,292 $1,832,438 $1,671,921 $1,545,679 $1,387,954
Events $755,098 $903,000 $853,270 $1,005,400 $968,400 $975,900 $975,900 $975,900 Fees 2,247,428 3,235,104 3,245,800 3,602,800 3,751,450 3,875,434 3,923,163 3,989,735
Interest Earnings 10,567 20,000 14,783 20,000 25,000 25,000 25,000 30,000 Transfers In 572,173 50,000 50,000 50,000 50,000 50,000 50,000 118,000
TOTAL REVENUES 3,585,267 4,208,104 4,163,853 4,678,200 4,794,850 4,926,334 4,974,063 5,113,635
TOTAL FUNDS AVAILABLE $4,877,724 $6,232,754 $6,188,503 $6,734,492 $6,627,288 $6,598,255 $6,519,742 $6,501,590
Aquatic Center $1,205,039 $2,072,670 $2,203,883 $2,689,672 $2,690,196 $2,743,652 $2,795,342 $2,845,373
Park Recreation Programming 689,341 895,184 912,892 1,054,153 1,092,330 1,131,517 1,150,624 1,165,246 Special Events 876,342 973,061 935,565 1,064,903 1,078,827 1,081,265 1,089,297 1,093,017 Athletic Programs 82,351 92,521 79,871 91,926 92,614 94,742 95,125 95,517
TOTAL EXPENDITURES $2,853,074 $4,033,436 $4,132,211 $4,900,654 $4,953,967 $5,051,176 $5,130,388 $5,199,153
Transfers $1,400 $1,400 $1,400 $1,400 $1,400 $1,400 $1,400 $1,400 $1,400 $1,400
TOTAL $2,853,074 $4,033,436 $4,132,211 $4,902,054 $4,955,367 $5,052,576 $5,131,788 $5,200,553 RESERVES MAINTENANCE $106,765 $256,765 $166,765 $316,765 $473,765 $634,765 $799,765 $968,765 ENDING $1,917,885 $1,942,553 $1,889,527 $1,515,673 $1,198,156 $910,914 $588,189 $332,272 COMMITTED
Fiscal Year 2022 – 2023 Budget
The purpose of this fund is to record property taxes levied and collected for the purpose of paying annual principal and interest payments on debt obligations with a legally binding pledge to repay with a commitment of an annual tax levy against property values certified by the Denton County Appraisal District.
The Town has utilized two different rating agencies over the years – Standard and Poor’s and Moody’s Investor Services. The AA+ and Aa2 ratings from S&P and Moody’s respectively are considered high investment grade ratings of each agency and reflect the Town’s very strong economy, rapidly growing tax base, and strong financial position due to significant ongoing development while maintaining through conservative budgeting and formal policies, which will attract investors. The chart below reflects ratings since 2008.
Rating Entity Current Rating Prior Rating Period Prior Rating
Standard & Poor’s AA+ August 2021 AA
Moody’s Aa2 June 2021 Aa3 Standard & Poor’s AA August 2020 AA Standard & Poor’s AA January 2017 AAStandard & Poor’s AA- June 2013 A+
Moody’s Aa3 April 2010 A2 Moody’s A2 December 2008 A3 Standard & Poor’s A+ November 2008 NR
Actual Amended Budget Estimated Budget Adopted Budget Planning Years 2020 - 2021 2021 - 2022 2021 - 2022 2022 - 2023 2023 - 2024 2024 - 2025 2025 - 2026 2026 - 2027
BEGINNING FUND BALANCE $570,334 $877,554 $877,554 $1,073,555 $328,762 $253,068 $469,058 $661,105
Ad Valorem Taxes $6,160,419 $5,293,000 $5,652,703 $7,161,155 $5,743,802 $6,047,365 $6,025,237 $6,204,042
Intergovernmental 103,670 95,000 107,816 109,973 111,622 112,738 113,866 115,004
Interest Earnings Earnings 17,603 40,000 21,793 30,000 45,000 50,000 50,000 50,000
Transfers In 216,887 1,160,000 1,157,113 - 1,131,938 1,140,113 1,141,913 1,149,213
TOTAL REVENUES 6,498,578 6,588,000 6,939,425 7,301,128 7,032,362 7,350,216 7,331,016 7,518,259
TOTAL FUNDS AVAILABLE $7,068,911 $7,465,554 $7,816,979 $8,374,683 $7,361,124 $7,603,284 $7,800,074 $8,179,365
Principal Cost $4,460,000 $4,670,000 $4,670,000 $5,715,000 $4,950,000 $5,135,000 $5,305,000 $5,100,000
Interest Earnings Cost 1,721,788 2,058,307 2,058,424 2,316,921 2,143,057 1,984,226 1,818,969 1,660,567
Other Debt Services Cost 9,569 15,000 15,000 14,000 15,000 15,000 15,000 15,000 Reserve - - - 1,000,000
TOTAL EXPENDITURES $6,191,357 $6,743,307 $6,743,424 $8,045,921 $7,108,057 $7,134,226 $7,138,969 $7,775,567
ENDING FUND BALANCE $877,554 $722,247 $1,073,555 $328,762 $253,068 $469,058 $661,105 $403,798
This fund was established to collect funds that must be used for a specific project. Special revenue funds provide an extra level of accountability and transparency to insure funding will go toward an intended purpose. Types of subaccounts included in this fund include the Municipal Court Technology, Court Security, Child Safety, Police Training -LEOSE, Fire Training -TCLEOSE, and designated parks and recreation funds collected through grants for specific purpose.
Actual Amended Budget Estimated Budget Adopted Budget Planning Years 2020 - 2021 2020 - 2021 2021 - 2022 2022 - 2023 2023 - 2024 2024 - 2025 2025 - 2026 2026 - 2027
BEGINNING FUND BALANCE $408,227 $418,410 $418,410 $403,363 $388,673 $393,983 $399,293 $404,603
Rates, Fees and Charges $106,702 $68,450 $94,360 $76,450 $76,450 $76,450 $76,450 $76,450 Intergovernmental Funds 5,139 4,900 4,882 4,600 4,600 4,600 4,600 4,600
Interest Earnings 2,890 5,000 2,002 2,000 2,000 2,000 2,000 2,000
TOTAL REVENUES 114,731 78,350 101,243 83,050 83,050 83,050 83,050 83,050
TOTAL FUNDS AVAILABLE $522,958 $496,760 $519,654 $486,413 $471,723 $477,033 $482,343 $487,653
Municipal Court $22,855 $29,000 $23,510 $46,250 $46,250 $46,250 $46,250 $46,250 Public Safety 71,889 96,362 84,388 44,490 24,490 24,490 24,490 24,490
TOTAL EXPENDITURES $94,745 $125,362 $107,898 $90,740 $70,740 $70,740 $70,740 $70,740
Transfers Out $9,803 $6,500 $8,392 $7,000 $7,000 $7,000 $7,000 $7,000
TOTAL TRANSFER $9,803 $6,500 $8,392 $7,000 $7,000 $7,000 $7,000 $7,000
TOTAL EXPENDITURES INCL.
TRANSFERS $104,547 $131,862 $116,290 $97,740 $77,740 $77,740 $77,740 $77,740
ENDING BALANCE $418,410 $364,899 $403,363 $388,673 $393,983 $399,293 $404,603 $409,913
The Town voted to continue the 1/4 cent sales tax street maintenance allocation in May 2021. The town issues an annual competitive bid for street maintenance and awards the bid for street repairs based on a comprehensive street maintenance inventory grid maintained by the Town’s engineer. Street Maintenance Project inventory is updated annually by Public Works and the Town Engineer and projects are prioritized and placed out to bid; the bids are value engineered and tailored to the budget resources.
Actual Amended Budget Estimated Budget Adopted Budget Planning Years 2020 - 2021 2021 - 2022 2021 - 2022 2022 - 2023 2023 - 2024 2024 - 2025 2025 - 2026 2026 - 2027
BEGINNING FUND BALANCE $1,359,040 $1,650,068 $1,650,068 $1,747,559 $1,176,542 $880,560 $609,989 $339,417
Sales Tax 1,448,016 1,443,229 1,636,258 1,668,983 1,694,018 1,719,428 1,719,428 1,719,428
Interest Earnings 11,305 10,000 12,932 10,000 10,000 10,000 10,000 10,000
TOTAL REVENUES 1,459,321 1,453,229 1,649,190 1,678,983 1,704,018 1,729,428 1,729,428 1,729,428
TOTAL FUNDS AVAILABLE $2,818,362 $3,103,297 $3,299,259 $3,426,542 $2,880,560 $2,609,989 $2,339,417 $2,068,845
Street Maintenance 1,168,293 2,421,178 1,499,288 2,250,000 2,000,000 2,000,000 2,000,000 1,900,000
Captial Outlay - 55,000 52,411 - - - - -
TOTAL EXPENDITURES $1,168,293 $2,421,178 $1,551,699 $2,250,000 $2,000,000 $2,000,000 $2,000,000 $1,900,000
ENDING FUND BALANCE $1,650,068 $682,120 $1,747,559 $1,176,542 $880,560 $609,989 $339,417 $168,845
This fund was set up by resolution of Council whereby all funds from lease/rental payments received from broadband and cellular providers is set aside for landscape improvements throughout the Town.
Actual Amended Budget Estimated Budget Adopted Budget Planning Years 2020 - 2021 2021 - 2022 2021 - 2022 2022 - 2023 2023 - 2024 2024 - 2025 2025 - 2026 2026 - 2027
BEGINNING FUND BALANCE $1,100,010 $811,058 $811,058 $44,284 $151,797 $23,260 $39,822 $121,635
Rates, Fees and Charges $181,192 $165,000 $163,364 $181,300 $186,250 $191,349 $196,600 $202,009
Reimbursements 155,635 59,494 64,494 30,213 30,213 30,213 30,213 30,213
Interest Earnings 6,800 8,500 7,189 7,000 7,000 7,000 7,000 7,000
Transfer In 441,000 441,000 441,000 441,000 450,000 450,000 450,000 450,000
TOTAL REVENUES $ 784,626 $ 673,994 $676,047 $659,513 $673,463 $678,562 $ 683,813 $689,222
TOTAL FUNDS AVAILABLE $1,884,636 $1,485,052 $1,487,105 $703,797 $825,260 $701,822 $723,635 $810,857
Streetscape/Landscape 1,073,579 1,145,831 1,442,821 552,000 802,000 662,000 602,000 602,000
TOTAL EXPENDITURES $1,073,579 $1,145,831 $1,442,821 $552,000 $802,000 $662,000 $602,000 $602,000
Transfers Out - - - - - - - -
TOTAL TRANSFER $- $- $- $- $- $- $- $-
ENDING FUND BALANCE $811,058 $339,221 $44,284 $151,797 $23,260 $39,822 $121,635 $208,857
Public Access Television is a form of non-commercial mass media where ordinary people can create content television programming which is cablecast through cable TV specialty channels. Public access television was created between 1969 and 1971 by the Federal Communications Commission (FCC). Publicaccess television is often grouped with public, educational, and government access television channels, by the acronym PEG.
Texas Statutes 66.009 Public , Educational, and Governmental access channels: Cable and Video companies doing business in a municipality and holding a state-issued certificate of franchise authority shall provide the municipality with capacity in its communications net work to allow public, educational, and governmental PEG access channels for noncommer cial programming.
Actual Amended Budget Estimated Budget Adopted Budget Planning Years 2020 - 2021 2021 - 2022 2021 - 2022 2022 - 2023 2023 - 2024 2024 - 2025 2025 - 2026 2026 - 2027
BEGINNING FUND BALANCE $63,962 $68,946 $68,946 $22,478 $14,778 $7,078 $9,378 $6,678
Franchise Fees $33,745 $42,000 $32,000 $32,000 $32,000 $32,000 $32,000 $32,000
Interest Earnings 394 500 200 300 300 300 300 300
TOTAL REVENUES 34,139 42,500 32,200 32,300 32,300 32,300 32,300 32,300
TOTAL FUNDS AVAILABLE $98,101 $111,446 $101,146 $54,778 $47,078 $39,378 $41,678 $38,978
PEG Expenditures $9,155 $50,000 $2,920 $40,000 $40,000 $30,000 $35,000 $35,000
TOTAL EXPENDITURES $9,155 $50,000 $2,920 $40,000 $40,000 $30,000 $35,000 $35,000
Transfers Out $20,000 $110,000 $75,748 $- $- $- $- $TOTAL TRANSFERS $20,000 $110,000 $75,748 $- $- $- $- $-
TOTAL EXPENDITURES INCL.
TRANSFERS $29,155 $160,000 $78,668 $40,000 $40,000 $30,000 $35,000 $35,000
ENDING FUND BALANCE $68,946 $(48,554) $22,478 $14,778 $7,078 $9,378 $6,678 $3,978
The fund accounts for proceeds and expenditures relating to the Coronavirus Relief Fund and the American Rescue Plan Act of 2021. The American Rescue Plan Act of 2021, signed into law March 11, 2021, established the Coronavirus State and Local Fiscal Recovery Funds (“SLFRF”). The Fiscal Recovery Funds are intended to provide support to State, Local, and Tribal governments in responding to the impact of COVID-19 and in their efforts to contain COVID-19 on their communities, residents and businesses. The Fiscal Recovery Funds build on and expand the support provided to these governments over the last year including through the Coronavirus Relief Fund (CRF).
Actual Amended Budget Estimated Budget Adopted Budget Planning Years 2020 - 2021 2021 - 2022 2021 -2022 2022 - 2023 2023 - 2024 2024 - 2025 2025 - 2026 2026 - 2027
BEGINNING FUND BALANCE $- $(1,640) $(1,640) $2,942,053 $1,337,347 $- $- $-
Grant Proceeds-CARES Act $70,426 $- $- $- $- $- $- $Interest Earnings-CARES Act $1,024
Grant Proceeds-American Recovery Act - 2,056,678 4,030,418Interest Earnings-American Recovery 5,076 - (5,076) - - - - -
TOTAL REVENUES $76,526 $2,056,678 $4,025,342 $- $- $- $- $-
TOTAL FUNDS AVAILABLE $76,526 $2,055,038 $4,023,702 $2,942,053 $1,337,347 $- $- $-
Professional Services $51,176 $50,000 $- $- $- $- $- $PPE 6,716 - (6,716) - - - - -
Capital Expenditures 20,274 815,000 - - - - -Transfer Out - 244,685 1,088,365 1,604,706 1,337,347 - - -
TOTAL EXPENDITURES $78,165 $1,109,685 $1,081,649 $1,604,706 $1,337,347 $- $- $-
ENDING FUND BALANCE $(1,640) $945,353 $2,942,053 $1,337,347 $- $- $- $-
This fund accounts for all hotel occupancy taxes collected. Council amended the Town’s Code of Ordinances May 5, 2020 to include short-term rentals to pay a hotel occupancy tax. The Town’s hotel occupancy tax rate is 7%. The five-year budget includes the first hotel to come online in the spring of 2023.
Actual Amended Budget Estimated Budget 2020 - 2021 2021 - 2022 2021 - 2022 2022 - 2023 2023 - 2024 2024 - 2025 2025 - 2026 2026 - 2027
BEGINNING FUND BALANCE $21,841 $21,841 $9,321 $124,998 $331,352 $537,706 $744,060
Hotel Tax $21,794 $15,000 $17,860 $140,677 $231,354 $231,354 $231,354 $231,354 Interest Earnings 47 - 50 - - - - -
TOTAL REVENUES $21,841 $15,000 $17,910 140,677 231,354 231,354 231,354 231,354
TOTAL FUNDS AVAILABLE $21,841 $36,841 $39,751 $149,998 $356,352 $562,706 $769,060 $975,414
Marketing $- $25,000 $25,000 $25,000 $25,000 $25,000 $25,000 $25,000 Professional Services - - 5,430 - - - -Transfer Out - - - - - - -
TOTAL EXPENDITURES $- $25,000 $30,430 $25,000 $25,000 $25,000 $25,000 $25,000
ENDING FUND BALANCE $21,841 $11,841 $9,321 $124,998 $331,352 $537,706 $744,060 $950,414
The Donation Funds purpose is to account for the donations made by civic organizations, businesses, and citizens for specific uses.
Actual 2020 - 2021 2021 - 2022 2021 - 2022 2022 - 2023 2023 - 2024 2024 - 2025 2025 - 2026 2026 - 2027
BEGINNING FUND BALANCE $46,342 $51,242 $51,242 $41,466 $41,916 $42,366 $42,816 $43,266
Fire Donations $- $- $- $- $- $- $- $Police Donations - - - - - - - -
Senior Center Donations 2,000 - - - - - - -
Animal Shelter Donations 999 11,000 10,783 1,000 1,000 1,000 1,000 1,000
Library Donations 7,400 10,000 8,844 10,000 10,000 10,000 10,000 10,000
Interest Earnings 389 300 489 450 450 450 450 450
TOTAL REVENUES 10,788 21,300 20,115 11,450 11,450 11,450 11,450 11,450
TOTAL FUNDS AVAILABLE $57,130 $72,542 $71,357 $52,916 $53,366 $53,816 $54,266 $54,716
Fire $- $13,458 $13,458 $- $- $- $- $Police 956 899 - - - - - -
Senior Center - - - - - - -Animal Shelter 575 11,000 11,433 1,000 1,000 1,000 1,000 1,000 Library 4,357 10,000 5,000 10,000 10,000 10,000 10,000 10,000
TOTAL EXPENDITURES $5,888 $35,357 $29,891 $11,000 $11,000 $11,000 $11,000 $11,000
ENDING FUND BALANCE $51,242 $37,185 $41,466 $41,916 $42,366 $42,816 $43,266 $43,716
A Municipal Drainage Utility System and consequently the Stormwater Drainage Fund was created in November 2011 by Council approval of Ordinance 1087. The Stormwater Drainage Fund’s purpose is to protect the public health and safety of the Town’s residents from the loss of life and property caused by surface water overflows, surface water stagnation, and pollution arising from on point source runoff with boundaries of the Town of Little Elm.
Actual Amended Budget Estimated Budget Adopted Budget Planning Years 2020 - 2021 2021 - 2022 2021 -2022 2022 - 2023 2023 - 2024 2024 - 2025 2025 - 2026 2026 - 2027
BEGINNING FUND BALANCE $1,254,515 $1,168,120 $1,168,120 $1,182,514 $1,234,618 $1,450,858 $1,584,384 $1,654,303
Rates, Fees, and Charges $690,000 $699,717 $733,232 $745,285 $760,191 $760,191 $760,191 $760,191
Intergovernmental Revenue 1,456 - - - - - - -
Interest Earnings 7,469 10,000 7,666 10,000 10,000 10,000 10,000 10,000
Miscellaneous 24,000 31,968 31,968 - - - - -
TOTAL REVENUES $722,925 $741,685 $772,865 $755,285 $770,191 $770,191 $770,191 $770,191
TOTAL FUNDS AVAILABLE $1,977,440 $1,909,805 $1,940,986 $1,937,799 $2,004,809 $2,221,049 $2,354,575 $2,424,494
Storm Drainage Operations $376,094 $471,609 $452,667 $512,469 $512,660 $520,373 $538,980 $540,264
Storm Drainage Capital Projects 405,249 323,128 287,828 150,000 - 75,000 120,000 -
TOTAL EXPENDITURES $781,342 $794,737 $740,495 $662,469 $512,660 $595,373 $658,980 $540,264
Transfers Out 27,977 17,977 17,977 40,712 41,292 41,292 41,292 41,292
TOTAL TRANSFERS $27,977 $17,977 $17,977 $40,712 $41,292 $41,292 $41,292 $41,292
TOTAL EXPENDITURES INCL. TRANSFERS $809,319 $812,714 $758,472 $703,181 $553,952 $636,665 $700,272 $581,556
NET INCOME/NET CHANGE ($86,394) ($71,029) $14,393 $52,105 $216,239 $133,526 $69,919 $188,636
ENDING FUND BALANCE $1,168,120 $1,097,092 $1,182,514 $1,234,618 $1,450,858 $1,584,384 $1,654,303 $1,842,939
In October 2013, the Town Council of the Town of Little Elm approved Ordinance No. 1175 designating a contiguous geographic area within the Town of Little Elm, as a Tax Increment Reinvestment Zone to known as Reinvestment Zone Number Three.
Actual - 2021 2021 - 2022 2021 -2022 2022 - 2023 2023 - 2024 2024 - 2025 - 2026 2026 - 2027
BEGINNING FUND BALANCE $1,003,443 $1,084,894 $1,084,894 $1,015,542 $271,936 $823,088 $1,639,026 $2,506,222
Ad Valorem Taxes $421,853 $433,061 $438,665 $782,654 $1,167,383 $1,445,425 $1,492,975 $1,735,567
Sales Taxes 128,739 119,600 142,552 156,807 161,512 166,357 170,516 173,926
Interest Earnings 6,884 8,500 6,961 7,000 8,500 10,000 15,000 15,000 Other Agencies & Sources 2,243 - - - - -Transfers In - - - - - -
TOTAL REVENUES $559,719 $561,161 $588,178 $946,462 $1,337,395 $1,621,782 $1,678,491 $1,924,493
TOTAL FUNDS AVAILABLE $1,563,162 $1,646,055 $1,673,073 $1,962,003 $1,609,331 $2,444,870 $3,317,516 $4,430,716
EXPENDITURES
Economic Development $131,380 $260,710 $205,137 $440,067 $322,999 $339,750 $342,750 $322,750 Debt Service 216,887 326,700 322,394 - 313,244 316,094 318,544 317,844
TOTAL EXPENDITURES $348,267 $587,410 $527,531 $440,067 $636,243 $655,844 $661,294 $640,594 Transfers Out 130,000 130,000 130,000 1,250,000 150,000 150,000 150,000 150,000
TOTAL TRANSFERS $130,000 $130,000 $130,000 $1,250,000 $150,000 $150,000 $150,000 $150,000
TOTAL EXPENDITURES INCL. TRANSFERS $478,267 $717,410 $657,531 $1,690,067 $786,243 $805,844 $811,294 $790,594
NET INCOME/NET CHANGE $81,452 ($156,249) ($69,353) ($743,605) $551,152 $815,938 $867,197 $1,133,899
RESTRICTED RESERVE - DEBT SERVICE $200,000 $200,000 $200,000 $- $- $- $- $ENDING FUND BALANCE $884,894 $728,645 $815,542 $271,936 $823,088 $1,639,026 $2,506,222 $3,640,122
Impact Fees were established to assure the availability of funds for major capital projects needed as a result of development. The laws governing the collection and disbursement of impact fees require separate accounting and reporting of these funds. Additionally, an analysis and update of the fee structure is required every five years. Appropriations from these funds are being utilized to provide supplemental funding for eligible capital improvement projects.
BEGINNING FUND BAL ANCE $114,863 $977,520 $977,520 $1,057,444 $1,108,444 $1,129,444 $1,150,444 $1,171,444
Park Impact Fees 859,917 50,000 74,496 50,000 20,000 20,000 20,000 20,000 Interest Earnings 2,741 1,000 5,428 1,000 1,000 1,000 1,000 1,000 Transfers In - - -
TOTAL REVENUES $862,658 $51,000 $79,924 $51,000 $21,000 $21,000 $21,000 $21,000
Transfers Out - 114,000 - - - -
TOTAL EXPENDITURES $- $114,000 $- $- $- $- $- $-
ENDING FUND BALANCE $977,520 $914,520 $1,057,444 $1,108,444 $1,129,444 $1,150,444 $1,171,444 $1,192,444
Actual Amended Budget Estimated Budget Adopted Budget Planning Years 2020 - 2021 2021 - 2022 2021 - 2022 2022 - 2023 2023 - 2024 2024 -2025 2025 - 2026 2026 - 2027
BEGINNING FUND BALANCE $1,271,181 $2,631,436 $2,631,436 $2,024,406 $2,159,406 $2,429,406 $2,699,406 $2,919,406
North Roadway Impact Fees $440,504 $- $- $- $- $- $- $South Roadway Impact Fees 1,170,874 250,000 420,053 250,000 250,000 250,000 200,000 150,000 Interest Earnings 13,572 20,000 14,566 20,000 20,000 20,000 20,000 20,000 Transfers In - - - - - - - -
TOTAL REVENUES $1,624,949 $270,000 $434,620 $270,000 $270,000 $270,000 $220,000 $170,000
TOTAL FUNDS AVAILABLE $2,896,130 $2,901,436 $3,066,055 $2,294,406 $2,429,406 $2,699,406 $2,919,406 $3,089,406
Capital - - -Transfers Out 264,695 1,041,650 1,041,650 135,000 - - -TOTAL EXPENDITURES $264,695 $1,041,650 $1,041,650 $135,000 $- $- $- $-
North Roadway Impact Fee Fund Balance 845,466 855,466 684,099 664,099 674,099 684,099 694,099 704,099
South Roadway Impact Fee Fund Balance 1,785,970 1,004,320 1,340,306 1,495,306 1,755,306 2,015,306 2,225,306 2,385,306
ENDING FUND BALANCE $2,631,436 $1,859,786 $2,024,406 $2,159,406 $2,429,406 $2,699,406 $2,919,406 $3,089,406
Fiscal Year 2022 – 2023 Budget
The Governmental Capital Improvement Project Fund accounts for the acquisition, construction, or improvement of major capital facilities or projects throughout the Town of Little Elm. This dedicated Fund is used to tract the revenue and expenses during the life of each project. Projects are not necessarily completed during one budget cycle but may be carried over from one budget cycle to the next.
Examples of Governmental Capital Projects include the construction and improvement of:
• Parks
• Town Facilities (Fire Stations, Community Center, etc)
• Roadways, Sidewalks, Bridges, etc.
• Drainage
Actual Amended Budget Estimated Budget Adopted Budget Planning Years 2020 - 2021 2021 - 2022 2021 - 2022 2022 - 2023 2023 - 2024 2024 - 2025 2025 - 2026 2026 - 2027
BEGINNING FUND BALANCE $14,194,947 $29,762,644 $29,762,644 $35,788,293 $20,622,733 $15,612,733 $11,837,733 $12,212,733
Bond Proceeds $15,000,000 $10,000,000 $10,000,000 $- $- $- $- $Contributions 1,133,392 - $- 500,000 4,000,000 - -Intergovernmental 521,822 3,260,000 $802,636 1,431,417 7,503,600 - -Interest Earnings 85,340 225,000 $125,000 225,000 150,000 125,000 125,000 200,000 Licenses and Permits 1,379,893 740,000 $575,000 740,000 500,000 350,000 250,000 200,000 Other Sources 322,167 105,151 $105,151Transfers In 6,571,440 3,655,650 $3,376,505 3,235,000 - - - -
TOTAL REVENUES 25,014,053 17,985,801 14,984,292 6,131,417 12,153,600 475,000 375,000 400,000
TOTAL FUNDS AVAILABLE $39,209,000 $47,748,445 $44,746,937 $41,919,710 $32,776,333 $16,087,733 $12,212,733 $12,612,733
General Government $674,405 $961,295 $967,793 $- $- $- $- $Public Safety - 599,853 599,853 1,500,000 4,250,000 4,250,000 -Community Services - - - - - - - -
Public Works-Streets/Signs/ Signals 3,577,546 4,062,238 1,898,450 2,787,851 12,913,600 - -Culture and Recreation 5,194,404 19,907,281 5,492,547 17,009,126 - - -Transfers Out - - - - - - -
TOTAL EXPENDITURES $9,446,355 $25,530,666 $8,958,643 $21,296,977 $17,163,600 $4,250,000 $- $-
ENDING FUND BALANCE $29,762,644 $22,217,779 $35,788,293 $20,622,733 $15,612,733 $11,837,733 $12,212,733 $12,612,733

This fund is a business-enterprise fund accounting for the Town’s water and sewer utilities including water distribution, sewer plan operations and treatment, water billing and meter reading. The system is self-supporting with rates and charges determined by an annual rate analysis to determine the adequacy of revenue to support operations, capital improvements and debt commitments.


Water Operations
Debt Service
Water Purchases
Capital Improvement Projects
Utility Billing
Wastewater Collections

Utility Administration


• Water Operations - Personnel and water operation expenses

• Wastewater Collections - Personnel and wastewater operation expenses
• Wastewater Treatment - Personnel and expenses for the wastewater treatment plant
• Utility Administration - Personnel who oversee water and wastewater operations


• Utility Billing - Personnel and operations that oversee the meter billing and collection for water and wastewater services.

• Capital Improvement Projects - Water and Wastewater infrastructure
• Debt Service - Expenditures supporting bond payments for capital improvement projects to support new residential and commercial connections


• Water Purchases - Water purchased from the North Texas Municipal Water District for distribution by the Town
• Transfers - Payment in lieu of taxes for services provided by the Town
Actual Amended Budget Estimated Budget Adopted Budget Planning Years 2020 - 2021 2021 - 2022 2021 - 2022 2022 - 2023 2023 - 2024 2024 - 2025 2025 - 2026 2026 - 2027
BEGINNING FUND BALANCE $16,154,250 $18,707,864 $18,707,864 $19,856,046 $19,741,609 $18,660,726 $17,470,617 $16,340,793
Water Sales $10,637,432 $11,241,359 $11,551,119 $11,647,483 $12,014,379 $12,386,824 $12,576,343 $12,764,988
Sewer Sales 7,053,380 7,491,589 7,471,565 7,583,638 7,697,393 7,774,367 7,852,110 7,930,632
Fees 631,912 463,500 605,555 483,000 458,000 433,000 428,000 418,000
Charges for Service 905,379 1,104,526 1,115,010 1,137,310 1,153,274 1,162,638 1,169,802 1,174,650
Interest Earnings 214,605 200,000 226,176 225,000 225,000 225,000 225,000 225,000
Miscellaneous 271,754 71,000 - 201,498 - - -Transfers In - - - - - - - -
TOTAL REVENUES $19,714,462 $20,571,974 $20,969,425 $21,277,929 $21,548,045 $21,981,830 $22,251,256 $22,513,269
TOTAL FUNDS AVAILABLE $35,868,712 $39,279,838 $39,677,289 $41,133,975 $41,289,654 $40,642,555 $39,721,872 $38,854,063
Water Operations $1,740,566 $2,455,726 $2,169,845 $2,284,815 $1,925,867 $1,987,794 $2,020,128 $2,058,037
Wastewater Collections 689,923 812,498 823,949 854,435 833,748 852,321 882,011 907,467
Wastewater Treatment 1,419,553 1,763,675 1,854,048 1,943,325 1,972,374 2,001,754 2,069,738 2,150,692
Water Administration 759,912 802,570 759,855 1,069,934 943,709 959,872 994,408 1,011,367
Utility Billing 630,811 1,202,689 1,160,064 1,031,889 773,745 777,420 819,847 824,792
TOTAL OPERATION EXPENDI TURES $5,240,764 $7,037,158 $6,767,761 $7,184,398 $6,449,443 $6,579,161 $6,786,132 $6,952,355
WATER PURCHASES $4,741,680 $5,379,337 $5,371,954 $6,274,356 $6,970,730 $7,538,062 $8,090,950 $8,495,498
DEBT SERVICE $3,870,048 $4,326,140 $4,330,120 $4,291,370 $5,743,121 $5,722,009 $5,196,972 $5,194,132
CAPITAL $788,655 $306,000 $277,537 $574,000 $263,000 $74,000 $39,500 $115,000
Transfers Out $2,519,701 $3,073,871 $3,073,871 $3,068,243 $3,202,634 $3,258,707 $3,267,525 $3,329,884
TOTAL $2,519,701 $3,073,871 $3,073,871 $3,068,243 $3,202,634 $3,258,707 $3,267,525 $3,329,884
TOTAL $17,160,848 $20,122,506 $19,821,243 $21,392,367 $22,628,928 $23,171,939 $23,381,079 $24,086,868
Net $2,553,614 $449,468 $1,148,182 $(114,437) $(1,080,883) $(1,190,109) $(1,129,823) $(1,573,599)
ENDING $18,707,864 $19,157,332 $19,856,046 $19,741,609 $18,660,726 $17,470,617 $16,340,793 $14,767,195
AMOUNT
Debt
Fiscal Year 2022 – 2023 Budget
This fund is a business-enterprise fund accounting for the Town’s water and sewer utilities including water distribution, sewer plan operations and treatment, water billing and meter reading. The system is self-supporting with rates and charges determined by an annual rate analysis to determine the adequacy of revenue to support operations, capital improvements and debt commitments.
Actual Amended Budget Estimated Budget Adopted Budget Planning Years 2020 - 2021 2021 - 2022 2021 - 2022 2022 - 2023 2023 - 2024 2024 - 2025 2025 - 2026 2026 - 2027
BEGINNING FUND BALANCE $470,097 $672,663 $672,663 $640,685 $737,228 $1,208,195 $1,682,606 $2,163,714
Franchise Taxes $187,207 $180,000 $205,391 $211,553 $217,900 $222,258 $226,703 $231,237
Service Fees 3,110,283 3,279,061 3,335,688 3,909,328 4,384,986 4,742,088 5,069,586 5,339,318
Interest Earnings 3,733 5,000 4,354 5,000 6,600 6,600 6,600 6,600
Other Revenue 458 - - - - - - -
TOTAL REVENUES 3,301,681 3,464,061 3,545,433 4,125,881 4,609,486 4,970,946 5,302,889 5,577,155
TOTAL FUNDS AVAILABLE $3,771,778 $4,136,724 $4,218,096 $4,766,566 $5,346,713 $6,179,141 $6,985,495 $7,740,868
Solid Waste Personnel $66,650 $70,709 $69,582 $71,909 $74,267 $75,391 $77,898 $79,094
Solid Waste Services 2,436,324 2,489,429 2,836,583 3,171,318 3,416,387 3,766,450 4,093,566 4,594,068
Solid Waste Operations and Maintenance 30,141 55,994 52,793 70,111 47,864 54,694 50,317 57,619
Solid Waste Capital Outlay - 55,000 52,453 150,000 - - - -
TOTAL OPERATION EXPENDITURES $2,533,115 $2,671,132 $3,011,411 $3,463,338 $3,538,518 $3,896,535 $4,221,781 $4,730,781
Transfers Out to General Fund $175,000 $175,000 $175,000 $175,000 $200,000 $200,000 $200,000 $200,000 Transfers Out to Streetscape Fund 391,000 391,000 391,000 391,000 400,000 400,000 400,000 400,000
TOTAL TRANSFER $566,000 $566,000 $566,000 $566,000 $600,000 $600,000 $600,000 $600,000
TOTAL EXPENDITURES $3,099,115 $3,237,132 $3,577,411 $4,029,338 $4,138,518 $4,496,535 $4,821,781 $5,330,781
ENDING FUND BALANCE $672,663 $899,592 $640,685 $737,228 $1,208,195 $1,682,606 $2,163,714 $2,410,087
Fiscal Year 2022 – 2023 Budget
Impact Fees were established to assure the availability of funds for major capital projects needed as a result of development. The laws governing the collection and disbursement of impact fees require separate accounting and reporting of these funds. Additionally, an analysis and update of the fee structure is required every five years. Appropriations from these funds are being utilized to provide supplemental funding for eligible capital improvement projects.
Actual Amended Budget Estimated Budget Adopted Budget Planning Years 2020 - 2021 2021 - 2022 2021 - 2022 2022 - 2023 2023 - 2024 2024 -2025 2025 - 2026 2026 - 2027
BEGINNING FUND BALANCE $2,504,308 $2,498,335 $2,498,335 $2,845,792 $2,650,792 $2,484,882 $2,659,882 $2,784,882
Water Impact Fees $495,981 $300,000 $347,457 $250,000 $225,000 $175,000 $125,000 $125,000
Interest Earnings - - -
TOTAL REVENUES $495,981 $300,000 $347,457 $250,000 $225,000 $175,000 $125,000 $125,000
TOTAL FUNDS AVAILABLE $3,000,289 $2,798,335 $2,845,792 $3,095,792 $2,875,792 $2,659,882 $2,784,882 $2,909,882
Transfers Out 501,954 935,910 - 445,000 390,910 - - -
TOTAL EXPENDITURES $501,954 $935,910 $- $445,000 $390,910 $- $- $-
ENDING FUND BALANCE $2,498,335 $1,862,425 $2,845,792 $2,650,792 $2,484,882 $2,659,882 $2,784,882 $2,909,882
Actual Amended Budget Estimated Budget Adopted Budget Planning Years 2020 - 2021 2021 - 2022 2021 - 2022 2022 - 2023 2023 - 2024 2024 - 2025 2025 - 2026 2026 - 2027
BEGINNING FUND BALANCE $1,867,237 $2,206,085 $2,206,085 $2,634,668 $1,657,868 $1,957,868 $2,257,868 $2,507,868
Waste Water Impact Fees $703,583 $400,000 $572,783 $350,000 $300,000 $300,000 $250,000 $250,000
Interest Earnings - - -
TOTAL REVENUES $703,583 $400,000 $572,783 $350,000 $300,000 $300,000 $250,000 $250,000
TOTAL FUNDS AVAILABLE $2,570,820 $2,606,085 $2,778,868 $2,984,668 $1,957,868 $2,257,868 $2,507,868 $2,757,868
Transfers Out 364,735 1,571,000 144,200 1,326,800 - - - -
TOTAL EXPENDITURES $364,735 $1,571,000 $144,200 $1,326,800 $- $- $- $-
ENDING FUND BALANCE $2,206,085 $1,035,085 $2,634,668 $1,657,868 $1,957,868 $2,257,868 $2,507,868 $2,757,868
Fiscal Year 2022 – 2023 Budget
The Capital Improvement Project Fund accounts for the acquisition, construction, or improvement of major capital facilities or projects throughout the Town of Little Elm. This dedicated Fund is used to tract the revenue and expenses during the life of each project. Projects are not necessarily completed during one budget cycle but may be carried over from one budget cycle to the next.
Examples of Utility Capital Projects include the construction/improvement of:
• Wastewater Treatment Plant
• Water and Sewer Lines
• Lift Stations
Actual Amended Budget Estimated Budget Adopted Budget Planning Years 2020 - 2021 2021 - 2022 2021 - 2022 2022 - 2023 2023 - 2024 2024 - 2025 2025 -2026 2026 - 2027
BEGINNING FUND BALANCE $2,171,494 $12,383,429 $12,383,429 $12,383,730 $6,776,874 $8,211,610 $2,791,368 $3,985,379
Bond Proceeds $9,000,000 $- $- $- $10,800,000 $- $- $Transfers In 2,001,940 1,149,365 1,293,565 2,880,241 1,217,606 1,176,782 1,169,011 1,222,701 Interest Revenue 14,664 125,000 25,380 25,000 25,000 25,000 25,000 25,000
TOTAL REVENUES $11,016,604 $1,274,365 $1,318,945 $2,905,241 $12,042,606 $1,201,782 $1,194,011 $1,247,701
TOTAL FUNDS AVAILABLE $13,188,098 $13,657,794 $13,702,374 $15,288,971 $18,819,480 $9,413,393 $3,985,379 $5,233,080
Water Capital Improvement Projects $571,588 $3,564,635 $424,371 $3,259,900 $6,004,745 $- $- $Wastewater Capital Improvement Projects 233,080 4,548,105 894,272 5,252,197 4,603,125 6,622,025 -Transfers Out - - - - - - - -
TOTAL EXPENDITURES $804,668 $8,112,740 $1,318,644 $8,512,097 $10,607,870 $6,622,025 $- $-
ENDING FUND BALANCE $12,383,429 $5,545,055 $12,383,730 $6,776,874 $8,211,610 $2,791,368 $3,985,379 $5,233,080
Fiscal Year 2022 – 2023 Budget
The Vehicle Equipment Replacement Fund (VERF) operates under the principle that the funds are collected and segregated, over a period of time, to cover the replacement cost of existing vehicles and equipment.
Actual Amended Budget Estimated Budget Adopted Budget Planning Years 2020 - 2021 2021 - 2022 2021 - 2022 2022 - 2023 2023 - 2024 2024 - 2025 2025 -2026 2026 - 2027
BEGINNING FUND BALANCE $3,760,866 $4,423,393 $4,423,393 $3,104,689 $3,852,491 $5,035,724 $4,674,707 $4,886,297
Intergovernmental Transfers $1,309,084 $1,430,671 $1,430,671 $2,973,504 $2,501,171 $2,587,133 $2,581,795 $2,566,249 Interest Earnings 27,545 $30,000 24,414 30,000 30,000 30,000 30,000 30,000 Auction/Insurance Proceeds 679,109 - 102,183 450,000 - - - -
TOTAL REVENUES 2,015,738 1,460,671 1,557,268 3,453,504 2,531,171 2,617,133 2,611,795 2,596,249
TOTAL FUNDS AVAILABLE $5,776,604 $5,884,064 $5,980,660 $6,558,193 $6,383,662 $7,652,857 $7,286,501 $7,482,547
Contractural Services $- $25,000 $25,000 $30,000 $34,320 $38,640 $42,960 $47,280 Capital Expenditures 1,353,212 3,068,688 2,850,971 2,675,702 1,313,618 2,939,510 2,357,244 2,438,030
TOTAL EXPENDITURES $1,353,212 $3,093,688 $2,875,971 $2,705,702 $1,347,938 $2,978,150 $2,400,204 $2,485,310
ENDING FUND BALANCE $4,423,393 $2,790,376 $3,104,689 $3,852,491 $5,035,724 $4,674,707 $4,886,297 $4,997,237
Fiscal Year 2022 – 2023 Budget
The Fire Equipment Replacement Fund (FERF) operates under the principle that the funds are collected and segregated, over a period of time, to cover the replacement cost of existing fire equipment.
Actual Amended Budget Estimated Budget Adopted Budget Planning Years 2020 - 2021 2021 - 2022 2021 - 2022 2022 - 2023 2023 - 2024 2024 - 2025 2025 - 2026 2026 - 2027
BEGINNING FUND BALANCE $218,919 $318,490 $318,490 $429,684 $559,978 $702,703 $746,157 $808,332
Internal Contributions $202,923 $213,894 $213,894 $262,130 $268,622 $270,310 $271,357 $272,495
Interest Earnings 1,986 2,000 2,478 2,000 2,000 2,000 2,000 2,000
TOTAL REVENUES 204,909 215,894 216,372 264,130 270,622 272,310 273,357 274,495
TOTAL FUNDS AVAILABLE $423,828 $534,384 $534,862 $693,814 $830,600 $975,013 $1,019,514 $1,082,827
Fire Equipment 105,338 169,479 105,178 133,836 127,897 228,856 211,182 206,846
TOTAL EXPENDITURES $105,338 $169,479 $105,178 $133,836 $127,897 $228,856 $211,182 $206,846
ENDING FUND BALANCE $318,490 $364,905 $429,684 $559,978 $702,703 $746,157 $808,332 $875,981
Fiscal Year 2022 – 2023 Budget
The Little Elm Community Development Corporation (CDC) is a 4B Corporation established under the Development Corporation Act of 1979. The corporation is tasked with the promotion and development of new or expanded business enterprises, parks, and other community projects. The CDC derives funding from a one-quarter cent sales tax collected in the Town of Little Elm. The CDC was established in October 2007 and has an independent board appointed by Town Council to govern the corporation. The CDC’s focus is the planning and growth of the parks and recreation system by applying the one-quarter cent sales tax towards capital projects that benefit parks and other related projects.
Actual Amended Budget Estimated Budget Adopted Budget Planning Years 2020 - 2021 2021 - 2022 2021 - 2022 2022 - 2023 2023 - 2024 2024 - 2025 2025 - 2026 2026 - 2027
BEGINNING FUND BALANCE $1,053,800 $1,236,779 $1,236,779 $2,082,084 $823,394 $1,528,284 $2,247,673 $2,969,008
Sales and Use Taxes $1,411,233 $1,404,905 $1,595,796 $1,624,475 $1,647,284 $1,670,358 $1,667,904 $1,665,328 Interest Earnings 8,918 8,000 9,020 9,000 9,500 9,750 10,000 10,000
TOTAL REVENUES 1,420,152 1,412,905 1,604,816 1,633,475 1,656,784 1,680,108 1,677,904 1,675,328
TOTAL FUNDS AVAILABLE $2,473,952 $2,649,684 $2,841,595 $3,715,559 $2,480,178 $3,208,392 $3,925,577 $4,644,336
Community Services $173 $99,800 $100,685 $827,165 $68,200 $71,700 $68,200 $71,900 Transfers Out 1,237,000 898,300 658,826 2,065,000 883,694 889,019 888,369 964,369
TOTAL EXPENDITURES $1,237,173 $998,100 $759,511 $2,892,165 $951,894 $960,719 $956,569 $1,036,269
ENDING FUND BALANCE $1,236,779 $1,651,584 $2,082,084 $823,394 $1,528,284 $2,247,673 $2,969,008 $3,608,067
This summary represents the governmental and utility system supported debt principal and interest.
Bond Series Obligation
Maturity Date Callable Date Principal Interest
Total Outstanding 9/30/2022 P&I Due FY 2022-2023
2012 General Obligation Refunding Bonds - $6.958M 8/1/2024 8/1/2021 $170,000 $5,100 $175,100 $175,100
2012A General Obligation Refunding Bonds - $2.735M 8/1/2027 8/1/2022 1,020,000 64,790 1,084,790 216,318
2013 Certificates of Obligations - $6M (CDC) 8/1/2033 8/1/2023 3,705,000 779,550 4,484,550 406,700
2013A Certificates of Obligations -$3M 8/1/2033 8/1/2023 1,915,000 457,775 2,372,775 217,925
2014 General Obligations Refunding - $4.550M 8/1/2029 8/1/2024 1,050,000 163,725 1,213,725 177,750
2015 Certificates of Obligations - $9.655M 2/1/2036 2/1/2025 7,260,000 1,686,918 8,946,918 641,338
2016 General Obligations Refunding - $6.725M 8/1/2027 8/1/2025 3,175,000 202,094 3,377,094 738,619
2018 Certificates of Obligations - $15.460M 2/1/2038 2/1/2028 10,910,000 3,373,716 14,283,716 893,731
2019 General Obligations Refunding - $7.230M 8/1/2029 - 5,515,000 709,600 6,224,600 869,600
2019 Certificiates of Obligations - $6.640M 2/1/2039 2/1/2028 5,895,000 1,817,775 7,712,775 456,000
2020 General Obligations Refunding - $5.725M 8/1/2030 - 4,470,000 220,050 4,690,050 588,276
2020 Certificates of Obligations - $4.085M 8/1/2040 8/1/2029 3,745,000 811,150 4,556,150 252,600
2021 Certificates of Obligations - $15M 8/1/2041 8/1/2030 13,100,000 4,014,482 17,114,482 904,869
2022 Certificates of Obligations - $10M 8/1/2042 - 9,560,000 4,253,500 13,813,500 1,508,650
TOTAL DEBT FOR PRIMARY GOVERNMENT (TAX SUPPORTED) $71,490,000 $18,560,224 $90,050,224 $8,047,476
2012 General Obligation Refunding Bonds - $6.985M 8/1/2024 8/1/2021 $595,000 $26,850 $621,850 $312,850
2012 Certificate of Obligations - $6.0M 8/1/2027 8/1/2022 $2,325,000 $161,231 $2,486,231 $486,176
2013 General Obligation Refunding Bonds - $3.040M 9/1/2025 9/1/2022 995,000 47,569 1,042,569 255,556
2014 General Obligations Refunding - $4.550M 8/1/2029 8/1/2024 1,315,000 198,200 1,513,200 222,075
2016 Certificate of Obligations - $7.640M 8/1/2036 8/1/2025 5,935,000 1,416,800 7,351,800 524,094
2017 Certificate of Obligations - $11.830M 8/1/2037 8/1/2026 9,375,000 2,590,737 11,965,737 799,888
2017 General Obligations - $13.645M 8/1/2034 8/1/2026 10,960,000 2,489,088 13,449,088 1,122,875
2021 Certificates of Obligations - $9M 8/1/2041 8/1/2030 7,860,000 2,408,394 10,268,394 542,856
TOTAL SELF-SUPPORTING DEBT (UTILITY) $39,360,000 $9,338,868 $48,698,868 $4,266,370
TOTAL DEBT OBLIGATIONS $110,850,000 $27,899,093 $138,749,093 $12,313,846
Planning
Jan. Feb.
Adopted
Adopted
Department's
March June
Town Manager's Aug.
Town Council's Budget
Aug. Sept.
May 7 General Election for Town Council Place 1 at Large, District 2 and District 4 Seats
July 15 TIRZ 3 Board Meeting
July 26-28
August 1
Finance Calculates FY 2023 Proposed Property Tax Rates
Finance Sends FY 2023 Proposed Budget, Tax Rates, and Public Hearing Information to Marketing for Website Publication
August 2 Council Meeting Presenting Proposed Budget and Proposed Tax Rates
August 3-4 Council Workshop Presenting Proposed Budget and Proposed Tax Rates
August 7
Proposed Tax Rates, Public Hearing Dates, and Pro posed Budget in Denton Chroncile and on TOLE Website (Tax Code 26.04(e))
January 18 Town Council Adopts Strategic Plan
February 22 Budget Kickoff Meetings
February 26 Town Council and Department Heads Strategic Planning Retreat
Department’s Budget
February 25 Departments enter FY 2022 Estimates, FY 2027 Budget, and Supplementals into mBudget
February 28
Staffing Requests Tuition Reimbursement Requests submitted, reviewed and approved by Town Manager
March 28 VERF Committee Meeting
April 18 mBudget Data Completed and Locked for Editing
June 13 Finance Revenue Projections Completed
June 20-24 Budget Week for Directors and Staff
June 27 CIP Budget Meeting with Directors
July 12 CDC Board Meeting for FY 2023 Budget Approval
Town Council’s Budget
August 2 Council Meeting Presenting Proposed Budget and Proposed Tax Rates/Recorded Vote on Proposed Tax Rates and Public Hearings
August 3 Council Workshop on the Proposed Budget and Proposed Tax Rates
August 16 TIRZ 3, 4 , and 6 Board Meeting to Approve FY 2023 Budget
Agenda for Council Meeting:
-First Public Hearing on Proposed Budget (No Vote Taken)
August 16
-Approve TIRZ 3, 4 ,5 and 6 Budgets
-Valencia, Hillstone and Rudman PID Annual Service Plans
September 6 Second Public Hearing and Vote on Approving Proposed Budget and Tax Rates
The Town of Little Elm, Texas financial policies set forth the basic framework for the fiscal management of the Town. These policies were developed within the parameters established by applicable provisions of the Texas Local Government Code and the Town of Little Elm Town Charter. The policies are to be reviewed on an annual basis and modified to accommodate changing circumstances or conditions.
1. The fiscal year of the Town shall begin on the first day of October each year and shall end on the thirtieth day of September of each year.
2. On or before the fifteenth day of August of each year, the Town Manager shall submit to the Town Council a balanced budget of the revenues of the Town and the expense of conducting the affairs thereof for the ensuing fiscal year. The Town is committed to a balanced operating budget under normal circumstances. Any deviations from a balanced budget are to be presented with full disclosure and justification. Fund Balance (reserves) can be used to balance the budget (see section on Fund Balance). The Budget as submitted by the Town Manager shall be legally adopted for all governmental fund types of the Town by Ordinance.
3. The Town Manager leads the Budget Process with the Mayor and Town Council, Chief Finance Officer, Town Departments, and the public participating during various stages of the budget process. Throughout the process, the Town Manager provides the Town’s Department Heads with policy direction in formulating the budget and discusses areas of concern with Town Council.
4. Role of Department Heads and Directors. Each Department Head and Director is responsible for the effective, efficient, and economical use of all resources made available to his or her department or division. After direction from the Town Manager, all department and division managers are given formal budget packets to complete electronically. Once packets and budgets are submitted electronically to the Finance Department, the Chief Finance Officer and Town Manager reviews the Department baseline requests and will determine whether changes are required based on funds availability and priorities. Interviews with Department Heads and Directors are conducted with the Town Manager and Finance to review budget requests and justifications for new programs or expansion of programs. Department Heads and Directors must present with their budget submissions base budget justifications along with supplemental request explanations for operational expenses as well as requests for additional personnel. These requests are weighed against financial constraints.
5. Town Manager’s Proposed Budget. Once the budget reviews are completed and revisions are made to the requested budget, the result becomes the Town Manager’s proposed budget of programs and services. The Town Manager’s proposed budget is filed with the Town Secretary and distributed to Town Council to set in motion work sessions, public hearings and ultimate approval.
The Town Manager’s proposed budget must be an itemized estimate (by line -item) of the expense of conducting each department, division, office and/or fund. The Town Manager’s proposed budget must be submitted to Town Council with a concise summary of the budget summarizing major changes in priorities or service levels from current years and the factors leading to those changes. Additionally, the Proposed Budget must include:
a. Priorities and key issues for the new budget period
b. Major financial factors and trends affecting the budget
c. Significant changes in revenue functions including property taxes
d. Current and future debt obligations
e. Rate changes for Utilities as well as other fees and charges summarized
f. Significant use of or increase in unreserved fund balances.
g. Provide for financial summary at the Fund level that reflects at least a three-year period, including prior year actual, current year budget and/or estimated current year actual, and proposed budget.
6. Final Budget. The budget for all funds shall be balanced in that the appropriations from each fund shall not exceed the resources available for the fiscal year. These resources include estimated revenues and the unreserved balance in the fund at the beginning of the year. There shall be a least one public hearing on the operating budget prior to adoption of the budget by ordinance. The Town Council can amend the Town Manager’s proposed budget prior to adoption by ordinance. The Budget shall be approved by ordinance prior to the last day of the fiscal year with or without amendment.
7. Tax Levy. The proposed budget shall contain a suggested tax rate to be levied to support the operational plan of expenditures and debt requirements for the ensuing fiscal year. All applicable laws pertaining to the adoption of the tax rate must be complied with including the adherence to the Truth-in-Taxation time table and events as outlined by the State Comptroller in the Truth-in-Taxation Handbook.
a. The applied property tax rate will not exceed the no-new-revenue tax rate by more than 3.5% or more commonly referred to as the “voter approval” tax rate unless public hearings and notices are done in compliance with Property Tax Codes.
b. The Town will strive to maintain the percentage of the tax rate allocated to the general fund at a minimum of 65%. Conversely, the allocation of the tax rate for debt purposes will be no more than 35%.
1. All expenses of the Town shall be made in accordance with the adopted annual budget or as legally amended.
2. The legal level of budgetary control is at the fund level. The Town Manager is authorized to transfer budgeted amounts between departments within any fund. Any revision(s) that increases the total expenditures of any fund greater than the original budget must be approved by ordinance of Town Council.
3. Transfers between expenditure accounts (line-items) in one department or division may occur with the approval of the Chief Finance Officer. Transfers between operating departments may occur with the approval of the Town Manager and Chief Finance Officer provided that a department’s total budget is not changed. Transfers betwee n funds must be accomplished by budget amendment approved by ordinance of the Town Council. However, budgeted operating transfers are authorized within the authority given in the annual budget ordinance.
4. Budget Delivery and Execution. After the budget and tax levy are adopted by Town Council by ordinances, the Finance Department distributes the adopted budget, capital
outlay schedules and personnel schedules denoting the expenditure and staffing authority that each department has in order to carry out its mission and provide services to the Town. The Finance Department monitors revenues and expenditures through the fiscal year for reportable conditions of major fluctuations in revenues and/or expenditures.
No money shall be drawn from the Town Depository, nor shall any obligation for the expenditure of money be incurred, except in pursuance of appropriations made by the Town Council. At the close of each fiscal year, the unencumbered balance of each appropriation shall revert to the fund from which it was appropriated and shall be subject to future appropriations.
5. Budget Reports. The Finance Department will generate reports to the Town Manager and Departments on a routine basis or upon request. The Finance Department will prepare quarterly budget reports to Town Council identifying and highlighting sources and uses of funds in a summary format with narrative explanations of significant changes and fluctuations.
1. The Town shall establish and maintain a Capital Reserve Fund to be used to renovate, repair and replace fixed assets of the Town, including public buildings, streets, storm sewers, park facilities and water and wastewater improvements. The Town shall establish and maintain an Equipment Replacement and Reserve Fund to be used to replace movable fixed assets of the Town, including vehicles, off road equipment, and other equipment with an average life of more than three years and valued over $10,000. There shall be established and maintained, within the Capital Reserve Fund and Equipment Replacement and Reserve Fund such accounts as shall be deemed appropriate by the Town Manager as evidenced in the Town’s annual budget. The Capital Reserve Fund and Equipment Replacement and Reserve Fund shall be funded with contributions made from nonrecurring revenues as available and other revenues detailed in the budget submitted to the Town Council by the Town Manager.
2. The Capital Budget or Capital Improvement Plan (CIP) is a separate and distinct process of planning and budgeting but connects to the operating budget for future potential of adding operational expenditures (see section below on Capital Project Expenditures). The annual budget will be developed to fund services of benefit for just one or two years and expenditures with long-term benefits will be put into a Capital Budget which takes a multiyear perspective. The Town Manager will submit as an appendix to the Town’s operational budget a Capital Budget outlining capital improvement projects. The Town’s Capital Improvement Plan is developed as a five-year plan for both Utility and General Governmental purposes.
1. The Town will strive to obtain franchise agreements that incorporate a franchise or rental fee with all public utilities (including municipally owned utilities). The fee structure will be similar to other cities in the area and allowed by the Public Utility Commission. In addition the Town will seek the “most favored nations’ clause” in its franchise agreements with public utilities operating within the Town.
2. The Town will strive to maintain revenue diversification in order to improve the ability to
handle fluctuations in individual sources such as property taxes, sales and other taxes. Fees and Charges for services will be reviewed annually to the extent to which they cover the cost of the service being provided.
3. The Town will pursue an aggressive policy of collecting all moneys due to the Town.
4. The Town will continue an aggressive program to reduce the level of delinquent taxes. The minimum collection rate objective is 98%.
5. The Town will strive to maintain total delinquent taxes outstanding at an aggregate level not to exceed 10% of the current tax levy.
6. Tax exemptions presently allowed by the Town will be monitored to include the Senior Tax Ceiling and the 65 year old and disabled person’s homestead exemption. Additional residential or non-profit property exemptions must be approved by the Town Council.
Fund FY 2023 FY 2024 FY 2025 FY 2026 FY 2027
General Fund $208,450 $- $- $- $Recreation Fund $- $- $- $- $Utility Fund $- $- $- $- $Solid Waste Fund $- $- $- $- $Drainage Fund $- $- $- $- $TIRZ #3 (Lakefront) $80,000 $- $- $- $CDC $- $- $- $- $-
Landscape $- $- $- $- $Streetscape $- $- $- $- $-
TOTAL $288,450 $- $- $- $-
Fund FY 2023 FY 2024 FY 2025 FY 2026 FY 2027
General Fund $701,278 $940,948 $697,546 $703,854 $951,946
Recreation Fund $446,250 $456,250 $467,300 $467,300 $421,350
Utility Fund $781,132 $1,210,429 $1,493,418 $1,749,793 $150,270
Solid Waste Fund $8,134 $8,378 $8,629 $8,888 $9,155
Drainage Fund $3,050 $3,050 $14,675 $14,675 $3,126
TIRZ #3 (Lakefront) $12,100 $12,100 $12,100 $12,100 $12,100
CDC $2,000 $2,000 $2,000 $2,000 $2,000
Landscape $- $- $- $- $Streetscape $- $- $- $- $-
TOTAL $1,953,944 $2,633,155 $2,695,668 $2,958,610 $1,549,947
NON-DISCRETIONARY SUMMARY $1,749,793 $150,270 $8,378 $8,629 $8,888 $9,155 $3,050 $3,050 $14,675 $14,675 $3,126
TIRZ $12,100 $12,100 $12,100 $12,100 $2,000 $2,000 $2,000 $2,958,610 $1,549,947
Fund FY 2023 FY 2024 FY 2025 FY 2026 FY 2027
General Fund $1,507,615 $- $25,000 $- $Recreation Fund $60,000 $- $- $- $Utility Fund $239,000 $- $- $- $Solid Waste Fund $23,800 $- $- $- $Drainage Fund $150,000 $- $- $- $TIRZ #3 (Lakefront) $1,208,000 $- $- $- $CDC $2,685,765 $- $- $- $Landscape $- $200,000 $- $- $Streetscape $515,000 $- $- $- $-
TOTAL $6,389,180 $200,000 $25,000 $- $-
Fund 2023 2024 2025 2026 2027
General Fund $4,182,002 $3,684,347 $4,650,029 $4,881,339 $5,030,863
Recreation Fund $161,655 $163,450 $164,498 $166,493 $167,480
Utility Fund $5,000 $- $5,000 $- $Solid Waste Fund $- $- $- $- $Drainage Fund $72,951 $69,000 $70,889 $79,211 $75,147
TIRZ #3 (Lakefront) $- $- $- $- $CDC $20,000 $- $- $- $Landscape $- $- $- $- $Streetscape $- $- $- $- $-
TOTAL $4,441,608 $3,916,797 $4,890,416 $5,127,043 $5,273,490
Fund 2027
General Fund $5,689,617 $3,684,347 $4,675,029 $4,881,339 $5,030,863
Recreation Fund $221,655 $163,450 $164,498 $166,493 $167,480
Utility Fund $244,000 $- $5,000 $- $Solid Waste Fund $23,800 $- $- $- $Drainage Fund $222,951 $69,000 $70,889 $79,211 $75,147
TIRZ #3 (Lakefront) $1,227,000 $4,000 $4,000 $4,000 $4,000 CDC $2,705,765 $- $- $- $Landscape $- $200,000 $- $- $Streetscape $515,000 $- $- $- $-
TOTAL $10,849,788 $4,120,797 $4,919,416 $5,131,043 $5,277,490
Fund FY 2023 FY 2024 FY 2025 FY 2026 FY 2027
General Fund $1,716,065 $- $25,000 $- $Recreation Fund $60,000 $- $- $- $Utility Fund $239,000 $- $- $- $Solid Waste Fund $23,800 $- $- $- $Drainage Fund $150,000 $- $- $- $TIRZ #3 (Lakefront) $1,288,000 $- $- $- $CDC $2,685,765 $- $- $- $Landscape $- $200,000 $- $- $Streetscape $515,000 $- $- $- $-
TOTAL $6,677,630 $200,000 $25,000 $- $-
Fund FY 2023 FY 2024 FY 2025 FY 2026 FY 2027
General Fund $4,883,280 $4,625,295 $5,347,575 $5,585,193 $5,982,809
Recreation Fund $607,905 $619,700 $631,798 $633,793 $588,830
Utility Fund $786,132 $1,210,429 $1,498,418 $1,749,793 $150,270
Solid Waste Fund $8,134 $8,378 $8,629 $8,888 $9,155
Drainage Fund $76,001 $72,050 $85,564 $93,886 $78,273
TIRZ #3 (Lakefront) $12,100 $12,100 $12,100 $12,100 $12,100 CDC $22,000 $2,000 $2,000 $2,000 $2,000 Landscape $- $- $- $- $Streetscape $- $- $- $- $-
TOTAL $6,395,552 $6,549,952 $7,586,084 $8,085,653 $6,823,437
General $4,625,295 $5,372,575 $5,585,193 $5,982,809
Recreation Fund $667,905 $619,700 $631,798 $633,793 $588,830
Utility Fund $1,025,132 $1,210,429 $1,498,418 $1,749,793 $150,270
Solid Waste Fund $31,934 $8,378 $8,629 $8,888 $9,155
Drainage Fund $226,001 $72,050 $85,564 $93,886 $78,273
TIRZ #3 $1,300,100 $12,100 $12,100 $12,100 $12,100 $2,707,765 $2,000 $2,000 $2,000 $2,000
Landscape $- $200,000 $- $- $Streetscape $515,000 $- $- $- $-
TOTAL $13,073,182 $6,749,952 $7,611,084 $8,085,653 $6,823,437
Town Council
FY 2023 FY 2024 FY 2025 FY 2026 FY 2027
COUNCIL SPECIAL PROJECTS $ 3,000 $ 3,000 $ 3,000 $ 3,000 $ 3,000
ADDITIONAL PARADE FLOAT $ 2,500 $ 2,500 $ 2,500 $ 2,500 $ 2,500
COUNCIL REDISTRICTING $ 46,150 $ - $ - $ - $ -
ADDITIONAL FUNDS FOR DRUG SCREENING $ 5,000 $ 5,000 $ 5,000 $ 5,000 $ 5,000
ADDITIONAL FUNDS FOR SMARTBEN $ 12,500 $ 12,500 $ 12,500 $ 12,500 $ 12,500
ENTERPRISE LICENSE FOR DOCUSIGN $ 7,230 $ 7,230 $ 7,230 $ 7,230 $ 7,230
ADDITIONAL PHONES FOR COUNCIL MEMBERS $ 2,400 $ 2,400 $ 2,400 $ 2,400 $ 2,400 Town Admin
ADDITIONAL FUNDING FOR LYNN, PHAM, AND ROSS LEGAL $ 2,500 $ 2,500 $ 2,500 $ 2,500 $ 2,500
ADDITIONAL FUNDS FOR BACKGROUND CHECKS $ 1,000 $ 1,000 $ 1,000 $ 1,000 $ 1,000 FUNDS FOR GOVQA - OPEN RECORDS REQUEST SOFTWARE $ 600 $ 600 $ 600 $ 600 $ 600
Court COURT PRINTING AND MAILING LINE ITEM INCREASE $ 7,000 $ 7,000 $ 7,000 $ 7,000 $ -
INCREASE DENTON COUNTY APPRAISAL DISTRICT SER VICES $ 26,745 $ 28,000 $ 28,000 $ 28,000 $ 28,000
DEBT AND LEASE MANAGEMENT WEB-BASED SYSTEM $ 15,000 $ 15,000 $ 15,000 $ 15,000 $ 15,000
ARBITRAGE $ 7,500 $ 18,000 $ 500 $ 500 $ -
INCREASE TO OCLC ANNUAL SOFTWARE LICENSING AGREEMENT $ 100 $ 100 $ 100 $ 100 $ 100
INCREASE TO ENVISIONWARE ANNUAL LICENSE $ 100 $ 100 $ 100 $ 100 $ 100
BIBLIOTHECA ANNUAL SOFTWARE AND EQUIPMENT $ 400 $ 400 $ 400 $ 400 $ 400
BOOK COLLECTION FUND INCREASE FOR DIGITAL ITEMS $ 7,500 $ 7,500 $ 7,500 $ 7,500 $ 7,500
SECURITY OPERATION CENTER SERVICES - WOLF $ 55,000 $ 56,000 $ 57,000 $ 58,000 $ 59,000 $ 14,000 $ 14,000 $ 14,000 $ 14,000 $ 14,000 $ 7,680 $ 7,680 $ 7,680 $ 7,680 $ 7,680 $ 11,000 $ 12,000 $ 13,000 $ 14,000 $ 15,000 $ 6,900 $ $ 6,900 $ 6,900 $ 6,900 $ $ $ $ $ $ $ $ $ $ $ - $ - $ $ 1,500 $ 1,500 $ 1,500 $ 1,500 $ 1,500
DEPT
Police
FY FY
FUEL - PRICE INCREASE $125,000 $123,000 $121,000 $119,000 $117,000
SSL CERTIFICATE FOR ATHENA SOFTWARE EVERY 2 YEARS $- $1,158 $- $1,158 $-
CONTRACTS WATCHGUARD CLOUD STORAGE $85,995 $85,995 $85,995 $85,995 $85,995
20 ADDITIONAL NETMOTION LICENSES $1,700 $1,700 $1,700 $1,700 $1,700
POLICE SUBSTATION CABLE INTERNET CONNECTION $4,500 $4,500 $4,500 $4,500 $4,500
NETMOTION YEARLY SUBSCRIPTION $15,000 $15,000 $15,000 $15,000 $15,000
OTHER AGENCY SVCS / CACDC FAIR SHARE $16,275 $16,275 $16,275 $16,275 $16,275
CONTRACTS - FLOCK GROUP CAMERA SYSTEM $5,000 $5,000 $5,000 $5,000 $5,000
FY 2023 DETECTIVE VEHICLE DIFFERENCE $4,500 $- $- $- $-
UNIFORMS - BODY ARMOR $4,200 $- $- $- $-
RECOGNITION - INCREASED PRICING $2,500 $2,500 $2,500 $2,500 $2,500
TRAINING - BACKGROUND INVESTIGATIONS $2,500 $2,500 $2,500 $2,500 $2,500
UNIFORMS - COMMAND STAFF DRESS UNIFORM $2,100 $2,100 $2,100 $2,100 $2,100
UNIFORM - POLICE CADET $1,950 $1,950 $1,950 $1,950 $1,950
CONTRACTS F1RST RESPONDERS STRESS & TRAUMA $1,698 $1,698 $1,698 $1,698 $1,698
TRAINING - HOSTAGE NEGOTIATION $1,000 $1,000 $1,000 $1,000 $1,000
CONTRACTS SOFTWARE INTERFACE WITH BRA ZOS TO ICS $3,836 $911 $911 $911 $911 $500 $500 $500 $500 $500 $500 $500 $500 $1,000 $1,500 - $200 $200 $200 $200 $200 $100 $300 $500 $750 $1,000 $100 $100 $150 $150 $50 $50 $50 $50 $100 $150 $200 $250 $250 $450 $700 $950 $75 $125 $225 $325
Fleet
Facilities
Streets
FY
FUEL ADJUSTMENT $2,000 $2,000 $2,000 $2,000 $2,000
CDL TRAINING ( ONE TIME DEPENDENT ON NEW HIRES) $3,600 $- $- $- $UNIFORM UPDATES $495 $495 $495 $495 $495
GENERATOR FIRE STATION 2 $150,000 $- $- $- $HVAC REPAIRS $50,000 $50,000 $50,000 $50,000 $50,000
BACKFLOW TESTING COST INCREASE $9,000 $8,250 $7,500 $7,500 $7,500
GASOLINE AND OIL $3,000 $3,000 $3,000 $3,000 $3,000
ELECTRICTY INCREASE $19,500 $19,000 $19,000 $19,000 $19,000
NATURAL GAS INCREASE $7,943 $7,100 $6,263 $6,263 $6,263
CONSTRUCTION MATERIALS INCREASE $15,700 $15,700 $15,700 $15,700 $15,700
CDL A MANDATORY TRAINING $5,400 $1,800 $5,400 $1,800 $5,400
Marketing 2022-23 INCREASE IN MARKETING IT SERVICES $5,000 $5,000 $5,000 $5,000 $5,000
VEHICLE MAINTENANCE $8,500 $8,500 $9,000 $9,000 $10,000
Park Maintenance
GAS & OIL $5,000 $5,000 $7,000 $7,000 $8,000
PARK FACILITIES MAINTENANCE $3,000 $3,000 $3,000 $3,000 $3,000
IRRIGATION PARTS $2,000 $2,000 $2,000 $2,500 $2,500
Senior Center SENIOR PROGRAMS - GENERAL $1,700 $1,700 $1,700 $1,700 $1,700
Fire
DALLAS MORNING NEWS SENIOR CENTER $550 $550 $550 $550 $550
FUEL - COST OF SERVICE INCREASE $40,202 $52,402 $52,402 $52,402 $52,402
UTILITIES FOR STATION 4 $- $- $6,898 $13,796 $13,796
PPE - COST OF SERVICE INCREASE $7,440 $7,440 $7,440 $7,440 $7,440
UNIFORMS - COST OF SERVICE INCREASE $4,053 $4,053 $4,053 $4,053 $4,053
EMS SUPPLIES FOR 4TH AMBULANCE $21,919 $13,569 $7,914 $8,066 $8,066
AMBULANCE BILLING - COST OF SERVICE IN CREASE $10,000 $10,000 $10,000 $10,000 $10,000
PUBLIC SAFETY RADIO USAGE FEE - DENTON COUNTY $2,275 $2,275 $2,275 $2,275 $2,275
ACTIVENET PROCESSING FEES $120,000 $120,000 $120,000 $120,000 $120,000
Cove
INCREASE FOR NATURAL GAS AND PROPANE $70,000 $72,000 $74,000 $74,000 $74,000
DIPPIN’ DOTS PRODUCT PURCHASE FOR RESALE $65,000 $68,000 $71,000 $71,000 $71,000
DEPT SUPPLEMENT TITLE
FY 2023 FY 2024 FY 2025 FY 2026 FY 2027
INCREASE FOR ELECTRICITY $42,000 $43,000 $46,000 $46,000 $-
INCREASED PARTY PACKAGE SUPPLIES AND EXPENSES $36,000 $38,000 $40,000 $40,000 $40,000
Cove
INCREASE FOR SODIUM HYPOCHLORITE (CHLORINE) $12,000 $14,000 $15,000 $15,000 $15,000
BULK CARBON DIOXIDE FOR ALKALINITY AND PH TREATMENT $6,000 $6,000 $6,000 $6,000 $6,000
QUARTERLY PREVENTATIVE MAINTENANCE $2,000 $2,000 $2,000 $2,000 $2,000
Rec Programming
SERVICE CONTRACTS - JOLT $250 $250 $300 $300 $350
ACTIVENET PROCESSING FEES $75,000 $75,000 $75,000 $75,000 $75,000
2022-23 INCREASE IN PRINTING AND MAILING $10,000 $10,000 $10,000 $10,000 $10,000
Special Events
Water Operations
CHRISTMAS AT THE BEACH BARRICADES & RENTALS $4,500 $4,500 $4,500 $4,500 $4,500
BEER AND ICE - BREW AND QUE $3,500 $3,500 $3,500 $3,500 $3,500
CDL TRAINING REQUIREMENT $3,600 $1,800 $1,800 $1,800 $1,800
COMMUNICATIONS INCREASE $2,400 $2,500 $2,600 $2,700 $-
INCREASED PROJECTIONS FOR WATER PURCHASES-NTMWD $626,052 $1,040,011 $1,310,807 $1,552,332 $-
Wastewater Collection ADDITIONAL ELECTRICITY COST FOR LIFT STATION OPERATION $15,000 $20,000 $22,000 $24,000 $28,000
PRICE INCREASE FOR 25% CAUSTIC FOR ODOR SCRUBBERS $47,985 $49,425 $50,907 $52,434 $54,007
LIFT STATION MAINTENANCE - ILA FRISCO WEST $30,000 $30,000 $30,000 $30,000 $30,000
Wastewater Treatment
PRICE INCREASE FOR 12.5% BLEACH FOR ODOR SCRUBBERS $13,295 $13,693 $14,104 $14,527 $14,963
ADDITIONAL FUNDING FOR TCEQ LAB INCREASES $12,000 $13,000 $14,000 $14,500 $15,000
SLUDGE DISPOSAL INCREASES $10,000 $15,000 $20,000 $25,000 $-
INCREASE IN FUEL USAGE $5,500 $5,700 $5,900 $6,200 $6,500 $15,000 $19,000 $21,000 $26,000 $$300 $300 $300 $300 $$8,134 $8,378 $8,629 $8,888 $9,155 $1,250 $1,250 $12,875 $12,875 $1,326 $1,800 $1,800 $1,800 $1,800 $1,800 $44,100 $38,200 $38,200 $38,200 $38,200 $12,100 $12,100 $12,100 $12,100 $12,100 $80,000 $- $- $- $$2,000 $2,000 $2,000 $2,000 $2,000
DEPT SUPPLEMENT TITLE FY 2023 FY 2024 FY 2025 FY 2026 FY 2027
COMPENSATION STUDY IMPLEMENTATION $1,268,212 $1,325,587 $1,352,187 $1,413,479 $1,441,836
ANNUAL EMPLOYEE SHIRT $2,500 $2,500 $2,500 $2,500 $2,500
ADDITIONAL FUNDING FOR TMHRA CONFERENCE $1,000 $1,000 $1,000 $1,000 $1,000
PAY PLAN DESIGN STUDY $- $- $25,000 $- $-
Finance FINANCE INTERN $15,600 $15,600 $- $- $-
PROPERTY TAX ANALYSIS SOFTWAREZACTAX $3,000 $3,000 $3,000 $3,000 $3,000
Library INCREASE TO LIBRARY ADVERTISING FUND $3,250 $3,250 $3,250 $3,250 $3,250
SPECIAL PLANNING STUDY $100,000 $- $- $- $UPDATE SUBDIVISION AND ZONING ORDINANCES $- $350,000 $- $- $-
SECONDARY INTERNET CONNECTION UP GRADE TO 500MBS $19,176 $20,176 $21,176 $22,176 $23,176
BACKUP DEVICE FOR LEPD CASE FILES DATTO $25,000 $25,000 $25,000 $25,000 $25,000
LEPD DELL RUGGED LAPTOPS WITH DOCKING STATIONS $83,000 $- $- $83,000 $-
COMPLETE ACCESS CONTROL UPGRADE $281,000 $- $- $- $-
OPEN SHORTEST PATH FIRST CONFIGURATION ON NETWORK $19,000 $- $- $- $-
AUTO ELEVATE SOFTWARE $5,000 $5,000 $5,000 $5,000 $5,000
2ND NETMOTION SERVER FOR REDUNDANCY $3,500 $1,000 $1,000 $1,000 $1,000
NVR REPLACEMENT AT THE COVE $16,000 $- $- $- $WIRELESS ACCESS POINT - SENIOR CENTER $1,000 $100 $100 $100 $100
POINT TO POINT FIBER CONNECTION - FIRE STATION 3 $19,920 $20,920 $21,920 $22,920 $23,920
PHONE MANAGED SERVICES MONITORING $44,000 $44,000 $44,000 $44,000 $44,000 ACTIVE DIRECTORY AUDIT SOFTWARE $8,700 $8,700 $8,700 $8,700 $8,700
LE PARK WAP UPGRADES $6,000 $600 $600 $600 $600
TOWN HALL CAMERA UPGRADES $20,000 $- $- $- $REC CENTER AND SENIOR CENTER CAM UPGRADES $68,000 $- $- $- $-
DIRECTOR OF INNOVATION AND TECHNOLOGY $124,903 $205,244 $210,249 $220,459 $225,941
PUBLIC SAFETY CAMERA UPGRADES $52,000 $- $- $- $Building Services
THIRD PARTY BUILDING INSPECTIONS $500,000 $500,000 $500,000 $500,000 $500,000
GRANICUS SHORT TERM RENTAL TRACKING $6,500 $6,500 $7,000 $7,000 $7,000 CERTIFIED PUBLIC MANAGER COURSE $5,000 $- $- $- $-
DEPT SUPPLEMENT TITLE
FY 2023 2024 FY 2025 FY 2026 FY 2027
NEW PERSONNEL (3 DETECTIVES / (PALOMA) $510,351 $321,840 $340,818 $373,314 $370,761
NEW PERSONNEL - 4 PATROL OFFICERS (MID-YEAR) $581,477 $360,176 $378,428 $419,044 $412,960
NEW EMPLOYEE - 1 LEISD SRO/DETECTIVE $173,617 $110,780 $117,106 $127,938 $127,087
NEW PERSONNEL - (1 SRO -DISD) $192,505 $93,194 $87,757 $108,301 $106,390
NEW EMPLOYEE - 2 LEISD SRO $383,010 $186,388 $195,514 $216,602 $212,780
RADIO EQUIPMENT - SPARE RADIOS $15,700 $- $- $- $TRAINING - DEFENSIVE TACTICS TRAINING $10,000 $10,000 $10,000 $10,000 $10,000 EVIDENCE SUPPLIES & EQUIPMENT $7,500 $7,500 $7,500 $7,500 $7,500
DRUG INCINERATOR $5,330 $- $- $- $TRAINING -TEXAS POLICE CHIEF’S CONFERENCE $4,750 $4,750 $4,750 $4,750 $4,750
TRAINING - WOMEN OF LAW ENFORCEMENT CONFERENCE $4,500 $4,500 $4,500 $4,500 $4,500
EVIDENCE SUPPLIES & EQUIPMENT - DRYING CABINET $4,487 $- $- $- $-
TRAINING - IACP $3,000 $3,000 $3,000 $3,000 $3,000 EVIDENCE - DRUG TESTING $1,500 $1,500 $1,500 $1,500 $1,500
ACCIDENT INVESTIGATION TRAINING $1,250 $1,500 $1,500 $1,500 $1,500
MISC - ADDITIONAL FUNDS $1,000 $1,000 $1,000 $1,000 $1,000
UNIFORMS - OUTER CARRIER $935 $935 $935 $935 $935 CONTRACTS MICROSOFT POWER BI LICENSE $690 $690 $690 $690 $690
UNIFORMS - MOTORS $590 $590 $590 $590 $590
UNIFORMS - K9 / CMV $535 $535 $535 $535 $535 CONTRACTS K9 TRACKING SOFTWARE $348 $348 $348 $348 $348
MEMERSHIP DUES - NEW PROFESSIONAL MEMBERSHIPS $325 $325 $325 $325 $325
POLE CAMERA YEAR FEES $321 $321 $321 $321 $321
IT HARDWARE- RECORDS FAX LINE $300 $300 $300 $300 $300
ANIMAL CONTROL EQUIPMENT $3,775 $3,775 $3,775 $3,775 $3,775 BOOTS $200 $200 $200 $200 $400
CLEANING SUPPLIES $100 $400 $600 $1,100 $1,600
Animal Services
UNIFORMS - SAFETY EQUIPMENT, GLOVES, SAFETY GLASSES $50 $50 $50 $50 $50
ANIMAL SERVICES OFFICER $- $- $71,574 $75,495 $78,063 EXTRA SECURITY CAMERAS FOR ANIMAL CONTROL $11,400 $- $- $- $-
FY 2023 FY 2024 FY 2025 FY 2026 FY 2027
TABLE TOP TIRE CHANGER AND TIRE BALANCER $17,533 $- $- $- $JPRO W/ FAULT GUIDANCE & NEXT STEP REPAIR FLEET SERVICE KITS $7,999 $2,000 $2,000 $2,000 $2,000
CERTIFIED PUBLIC MANAGER PROGRAM $5,500 $- $- $- $PUBLIC WORKS INSTITUTE OF TEXAS CERTIFICATION $3,500 $- $- $- $FLEET SPECIALIST $81,826 $85,548 $88,332 $93,265 $95,865
ONE TIME OFFICE SUPPLY INCREASE $600 $- $- $- $-
ADD FOR JANITORIAL BID $100,000 $100,000 $100,000 $100,000 $100,000
TWO NEW SIRENS $60,000 $- $- $- $WALKER SIREN UPGRADE $33,000 $- $- $- $COMMUNITY CENTER RENOVATIONS $100,000 $- $- $- $VETERANS BRIDGE LIGHTING $25,000 $- $- $- $PARKING LOT STRIPING $20,000 $20,000 $20,000 $20,000 $20,000 STOVE-FIRE STATION 2 $16,000 $- $- $- $SCISSOR LIFT $12,000 $- $- $- $-
PAINTING FOR COMMON AREAS AT ALL TOWN BUILDINGS $10,000 $10,000 $10,000 $10,000 $10,000
PLUMBING CHASE SPACE HEATERS $8,000 $- $- $- $LIBRARY PROGRAM ROOM FLOORING REPLACEMENT $6,000 $- $- $- $PM FOR FIRE FITNESS EQUIPMENT $3,000 $3,000 $3,000 $3,000 $3,000
LED DOUBLE COBRA HEAD SL DRIVERS $30,000 $30,000 $30,000 $30,000 $30,000 PROGRESSION PLAN TRAINING $13,540 $1,630 $13,540 $1,630 $13,540
Streets
REPLACE STREET POLES AND SIGNS TO ADHERE TO DEV AGREEMENTS $9,624 $9,913 $10,210 $10,516 $10,832
AVERY TJ PRINTER HEAD & ASSEMBLY $5,500 $- $- $5,500 $Marketing
2022-23 INCREASE IN PROFESSIONAL SERVICES $6,000 $- $- $- $2022-23 ADDITIONAL TAMIO CONFERENCE MEMBERSHIP $400 $400 $400 $400 $400
AERIFICATION OF ATHLETIC FIELDS $8,500 $8,500 $8,500 $8,500 $8,500 BEARD PARK TURF MAINTENANCE $7,200 $7,200 $7,200 $7,200 $7,200
Parks Maintenance
EQUIPMENT OPERATOR FY23 MID-YEAR $27,105 $55,176 $59,202 $62,557 $64,865
EQUIPMENT OPERATOR FY24 $- $57,616 $59,642 $62,997 $65,305 EQUIPMENT OPERATOR FY27 $- $- $- $- $65,125
MAINTENANCE WORKER FY24 $- $52,483 $54,409 $57,524 $59,722
Senior Center SENIOR PROGRAMS - SPECIAL EVENTS $5,000 $5,000 $5,000 $6,000 $6,000
DEPT SUPPLEMENT TITLE
FY 2023 FY 2024 FY 2025 FY 2026 FY 2027
FIRE STATION 4 - PHASE II (4 FTES) $486,017 $498,707 $510,301 $531,520 $542,732
FIRE STATION 4 - PHASE III (7 FTES) $- $- $793,595 $790,533 $823,694
LUCAS DEVICE $23,066 $1,000 $1,000 $1,000 $1,000
TACTICAL MEDIC UNIFORM REPLACEMENT $1,900 $1,900 $1,900 $1,900 $1,900
CONSOLIDATION OF FIREFIGHTER WELLNESS PROGRAMS $3,000 $3,000 $3,000 $3,000 $3,000
TRAINING STRUCTURE IMPROVEMENTS $15,000 $- $- $- $Cove JANITORIAL/PORTER SERVICES FOR THE COVE $48,000 $48,000 $48,000 $48,000 $48,000
INSTALLATION OF STOREFRONT WALL $45,000 $- $- $- $WINDOW CLEANING AT THE COVE $18,000 $18,000 $18,000 $18,000 $18,000
INSTALLATION OF AN EXTERIOR DOOR TO PATIO NEAR FLOWRIDER $15,000 $- $- $- $COMPENSATION STUDY IMPLEMENTATION $39,855 $41,650 $42,498 $44,393 $45,280
CONCESSIONS POS SYSTEM $4,800 $4,800 $4,800 $4,800 $4,800
CRM LICENSE TOOL $4,000 $4,000 $4,000 $4,000 $4,000
Rec Programs SERVICE CONTRACTS - MONDAY.COM $1,000 $1,000 $1,200 $1,300 $1,400
BREW & QUE VIP EXPERIENCE $24,000 $24,000 $24,000 $24,000 $24,000 ICE MACHINE MAINTENANCE $5,700 $5,700 $5,700 $5,700 $5,700
JULY JUBILEE RENTALS $4,700 $4,700 $4,700 $4,700 $4,700
BREW & QUE RAIN INSURANCE $4,500 $4,500 $4,500 $4,500 $4,500 CHRISTMAS AT THE BEACH REINDEER $1,500 $1,500 $1,500 $1,500 $1,500 SANTA & MRS. CLAUS WAGES $1,500 $1,500 $1,500 $1,500 $1,500
BREW & QUE ADVERTISEMENT $1,200 $1,200 $1,200 $1,200 $1,200 BEACH CART MAINTENANCE $1,000 $1,000 $1,000 $1,000 $1,000 EGGTASTIC EASTER EGGS $1,000 $1,000 $1,000 $1,000 $1,000 BREW $500 $500 $500 $500 $500 $400 $400 $400 $400 $400 $515,000 $- $- $- $$- $200,000 $- $- $$70,000 $- $- $- $MINI-DUMP $40,000 $- $- $- $$10,000 $- $- $- $$4,000 $- $- $- $$15,000 $- $- $- $-
HEADSETS FOR CONFINED SPACE ENTRY $5,000 $- $- $- $REPLACEMENT DRYING BED TILES $30,000 $- $- $- $REPLACEMENT CLOTH FOR FILTERS $42,000 $- $- $- $VIBRATION SENSORS FOR BLOWERS $18,000 $- $- $- $-
SUPPORT EQUIPMENT AND UPGRADES $5,000 $- $- $- $TYLER SOFTWARE TRAINING $- $5,000 $- $5,000 $-
INLET BOX REPAIRS/REPLACEMENT $53,400 $55,002 $56,652 $58,352 $60,102
PROGRESSION PLAN $8,150 $2,080 $2,080 $8,150 $2,080
COMPENSATION STUDY IMPLEMENTATION $11,401 $11,918 $12,157 $12,709 $12,965
TAILGATE SAND & SALT SPREADER $5,800 $- $- $- $MCCORD PARK TRAIL DRAINAGE $50,000 $- $- $- $HILLTOWN DRAINAGE STUDY $100,000 $- $- $- $-
TIRZ 3 Lakefront
AMPHITHEATER IMPROVEMENTS $600,000 $- $- $- $THE LAWN AT THE LAKEFRONT™ $500,000 $- $- $- $CHRISTMAS TREE FOR THE LAWN $83,000 $- $- $- $SPEAKERS AT THE LE BEACH $20,000 $- $- $- $CDC PARK PROJECT IMPROVEMENTS $2,000,000 $- $- $- $CRICKET FIELDS $100,000 $- $- $- $TORO 5900 MOWER ADDITION $145,000 $- $- $- $LITTLE ELM PLAYGROUND POUR-IN-PLACE SURFACE REPLACEMENT $105,000 $- $- $- $INCREASE TRUCK FLEET - CHEVY 3500 $50,000 $- $- $- $TORO 7210 MOWER ADDITION $45,500 $- $- $- $JOHN DEERE HX15 BUSHHOG REPLACEMENT $40,265 $- $- $- $COTTONWOOD EXPANSION TORO WORKMAN $38,000 $- $- $- $KUBOTA RTV REPLACEMENT VEHICLES $32,000 $- $- $- $SPLASH PAD MAINTENANCE $26,000 $- $- $- $COTTONWOOD PLAYGROUND SURFACE $19,000 $- $- $- $BEACH VOLLEYBALL POLE STRAIGHTENING $16,000 $- $- $- $JOHN DEERE TX 4X2 ADDITION $16,000 $- $- $- $NETTING AT LITTLE ELM PARK $15,000 $- $- $- $TRASH RECEPTACLE ADDITIONS $14,000 $- $- $- $NETTING COTTONWOOD SPORTS COMPLEX $12,000 $- $- $- $BACKSTOP PADDING COTTONWOOD SPORTS COMPLEX $6,000 $- $- $- $DOG PARK GATE HINGES $6,000 $- $- $- $SMALL EQUIPMENT $3,200 $- $3,500 $- $3,700
Utility Admin COMPENSATION STUDY IMPLEMENTATION $115,613 $120,840 $123,260 $128,834 $131,412
Solid Waste 30 YARD OPEN TOP CONTAINER X2 $18,000 $- $- $- $-
Project Description
Prior Years FY 2021-2022 FY 2022-2023 FY 2023-2024 FY 2024-2025 FY 2025-2026 FY 2026 - 2027
FY 2028 - 2033 PLANNING YEARS TOTAL PROJECT
King Road 13,685 65,528 665,000 5,460,000 6,204,213
Button Street 1,180,174 1,180,174
French Settlement/Dickson
Lane Signal 2,222,248 2,222,248
Contract Street Maintenance 4,298,787 1,499,288 1,735,000 2,000,000 2,000,000 2,000,000 1,900,000 9,500,000 24,933,075
Roadway Impact Fee Study 60,000 60,000
2931 Connector 700,000 6,618,110 7,318,110 2931 Extension (4 Lane) Ryan
Spiritas Parkway - 10,802,368 10,802,368
Fishtrap Road 11,000,000 11,000,000
Hill Lane 615,000 - 6,753,600 - 7,368,600
North Oak Grove Parkway 1,501,966 1,501,966
Gammon Road 2,394,079 2,394,079
Woodrow Circle 515,000 - 515,000
Lakefront Parking Lot 2,334,408 1,024,811 3,359,220
Town Hall Parking Lot Expansion 175,099 175,099
Lobo Lane Technology Park 33,459 107,863 1,673,579 1,814,900
Subtotal Street Projects 10,257,860 3,312,490 4,648,579 14,913,600 2,000,000 2,000,000 1,900,000 41,816,523 80,849,052
Project Description Prior Years FY 2021-2022 FY 2022-2023 FY 2023-2024 FY 2024-2025 FY 2025-2026 FY 2026 - 2027 FY 2028 - 2033 PLANNING YEARS TOTAL PROJECT Signalization Projects 343,679 - 343,679
US 380 Lighting - 314,273 314,273
US 380 Plan Revisions 441,238 441,238
423 Traffic Signal - 450,000 450,000 Oakgrove Parkway/Eldorado
Parkway Traffic Study 17,500 75,000 92,500 Oakgrove Parkway
North Lighting 1,000,000 1,000,000 HEB/720 Traffic Signals 500,000 500,000
Subtotal Traffic Projects 784,917 17,500 1,339,273 - - - - 1,000,000 3,141,690
Project Description
Prior Years FY 2021-2022 FY 2022-2023 FY 2023-2024 FY 2024-2025 FY 2025-2026 FY 2026 - 2027 FY 2028 - 2033 PLANNING YEARS TOTAL PROJECT
Lakefront Trails 3,631,431 3,631,431
McCord Park Splash Pad 2,503,811 2,503,811
McCord Park Dog Park 1,914,684 1,914,684
McCord Park Dog Park
Playground Expansion 150,000 150,000
McCord Park Trail 11,303 11,303
Hartsbranch Trail 2,546,032 2,546,032
Brent Elementary Trail 469,825 469,825
Cottonwood Park Improvements 388,234 95,667 7,516,100 17,600,000 25,600,000
Little Elm Park Kayak/Surf Structure - 50,000 50,000
Little Elm Park Parking Expansion 42,000 - 504,000 546,000
Little Elm Park Trash
Management System 31,417 31,417
Little Elm Pedestrian Bridge - 300,000 300,000
Trails Regional Connections 1,000,000 1,000,000
The Lawn @ Lakefront 223,184 509,788 3,773,531 4,506,503
Screen Wall (Palladium) - The Lawn - 189,526 189,526
TxDOT Green Ribbon 85,300 1,429,012 - 1,514,312
Youth Softball Fields - Lakeside Middle 1,937,563 4,987,113 6,924,676
Youth Baseball Field Improvements 1,500,000 1,500,000
Little Elm Park Camping Improvements 275,175 2,561,225 2,836,400
Cottonwood Park Phase II RV and Camping - 12,000,000 - 12,000,000
Subtotal Park Projects 11,773,804 5,820,621 19,327,495 12,000,000 504,000 - - 18,800,000 68,225,920
Project Description Prior Years FY 2021-2022 FY 2022-2023 FY 2023-2024 FY 2024-2025 FY 2025-2026 FY 2026 - 2027 FY 2028 - 2033 PLANNING YEARS TOTAL PROJECT
Recreation Center Expansion 5,821,708 5,821,708
Aquatics Center 24,335,688 137,803 24,473,490 Rec/Aquatic Center Electric Car
Charging Station 67,748 67,748
Firestation Settlement 570,245 570,245
Multi-Use Center 2,839,627 81,720 2,000,000 4,921,347
Town Hall Remodel 34,343 - 34,343
Public Safety Buildouts 128,000 128,000 Marketing Department
Buildouts 110,000 110,000
McCord Park Warning Siren 10,800 10,800
Town Hall Remodel Phase II 356,893 961,073 1,317,966
Wayfinding Project 516,818 516,818
Fire Station # 4/Police Substation 1,500,000 4,250,000 4,250,000 - 10,000,000
Aquatic Center Expansion-Phase II 7,000,000 7,000,000
Aquatic Center Expansion-Phase III 9,200,000 9,200,000
Subtotal Facility Projects 34,207,304 1,765,162 1,500,000 4,250,000 4,250,000 - - 18,200,000 64,172,466
Project Description Prior Years FY 2021-2022 FY 2022-2023 FY 2023-2024 FY 2024-2025 FY 2025-2026 FY 2026 - 2027 FY 2028 - 2033 PLANNING YEARS TOTAL PROJECT
Public Safety Command Vehicle 599,853 599,853
Radio Communications 2,250,000 2,250,000
Subtotal Equipment Projects - 599,853 - - 2,250,000 - - 2,849,853
Project Description Prior Years FY 2021-2022 FY 2022-2023 FY 2023-2024 FY 2024-2025 FY 2025-2026 FY 2026 - 2027 FY 2028 - 2033 PLANNING YEARS TOTAL PROJECT
Wynfield Farms Outfalls-debri seperators - 120,000 120,000
Canyon Lake Retaining Walls 295,000 295,000
Crescant Lake Retaining Walls 18,500 287,828 306,328
Shell Beach Drainage-debri seperators - 75,000 75,000 Beach Drainage 159,025 159,025
McCord Park Trail Drainage 95,000 - 50,000 500,000 645,000 Lakefront Trail Drainage 35,300 35,300 Waterview Drive Repair 63,549 63,549 Hilltown (Cedar, Cottonwood, Post Oak) - study 100,000 100,000 Morning Song - outfall pipe improvements
Subtotal Drainage Projects 631,074 323,128 150,000 - 75,000 120,000 - 500,000 1,699,202
Total Governmental Projects Prior Years FY 2021-2022 FY 2022-2023 FY 2023-2024 FY 2024-2025 FY 2025-2026 FY 2026 - 2027 FY 2028 - 2033 PLANNING YEARS TOTAL PROJECT
Project Description
Prior Years FY 2021-2022 FY 2022-2023 FY 2023-2024 FY 2024-2025
FY 2025-2026 FY 2026 - 2027
FY 2028 - 2033 PLANNING YEARS TOTAL PROJECT
French Settlement 253,903 253,903
Meters 1,501,937 1,501,937
FM 423 Repaint/Mansell Tank/Pro 1,461,308 1,461,308
West Side Lift Station No. 2 679,350 679,350
Waste Water Treatment Plant 10,807,634 10,807,634
Service Center Expansion 2,021,495 - 1,322,500 3,343,995
Impact Fee Study - 75,000 75,000
King Road Utility Work 353,426 283,646 637,072
West Side Water Pressure Study 5,212 94,788 100,000
West Side Interconnection Design/Agreements - 33,000 33,000
West Side Water Emergency Interconnect - - 390,910 390,910
12-Inch Water Along West Eldorado Parkway 1,725,000 1,725,000
Mansell Pump Station Improvements Phase II 1,650,000 1,650,000
Mansell 24-Inch Transmission Lines - 370,000 2,463,835 2,833,835
Mansell Tank Rehabilitation 2,000,000 2,000,000
West Side Water Pressure Improvements - 5,000,000 5,000,000 10,000,000
Woodrow Circle Water 215,000 215,000
TX AWIA Resiliency Plan & Implementation 62,204 249,796 312,000
Retrofit Meter Vaults - Greenwood, Lobo, Main
Street 119,400 119,400
Cottonwood Park water line extension - 300,000 300,000
SCADA Improvements 24,988 750,000 774,988
Total Water Projects 17,146,470 653,217 3,184,900 4,504,745 5,000,000 5,000,000 - 3,725,000 39,214,332
Wastewater Projects
Project Description Prior Years FY 2021-2022 FY 2022-2023 FY 2023-2024 FY 2024-2025 FY 2025-2026 FY 2026 - 2027 FY 2028 - 2033 PLANNING YEARS TOTAL PROJECT
WWTP Lab Building Expansion-Design 225,000 1,500,000 1,725,000
King Road Utility Work - 117,622 117,622
WWTP UV Module Upgrade 12,630 144,200 755,800 912,630
WWTP Fine Screen - Design 88,614 247,323 496,000 831,938
WWTP Clarifier Rehab/Increase Capacity 48,300 2,601,700 - 2,650,000
WWTP Lift Station Upgrade - - 7,617,025 7,617,025
I&I Evaluation - PACP and Cleaning 1,750,000 1,750,000
Stardust Lift Station Rehabilitation -Garza Lift Station (west side project) 6,603,041 - 6,603,041
Lakewood Lift Station Rehabilitation 538,200 538,200
WWTP Generator Upgrades - 1,308,125 1,308,125 McCord/Brent Elementary Reuse Improvements 62,190 25,135 833,697 921,022
Sunset Pointe Lift Station Improvements 650,325 650,325
Woodrow Circle Sewer 215,000 215,000 Repairs per I&I Evaluation 600,000 600,000 Hillside Beach Sewer 19,320 19,320
WWTP Re-Rating Study and TPDES
Permit Amendment 80,000 80,000
Cottonwood Manhole Rehabilitation 82,958 1,863 50,000 134,821
Cottonwood Creek Improvements - 50,000 50,000 Harvey Circle Manhole/Sewer Line 86,692 86,692
WWTP Filter System Upgrade 59,374 59,374
Cottonwood Park WW line extension - 300,000 300,000 Impact Fee Study - 75,000 75,000
SCADA Improvements 24,988 750,000 774,988
Total Wastewater Projects 325,087 921,123 7,627,197 1,308,125 6,603,041 - - 11,235,550 28,020,123


Brought to you by the Town of Little Elm Finance Team
