
13 minute read
Pensacola–Ferry Pass–Brent ..................................................... 105


Short Term Outlook for Pensacola-Ferry Pass-Brent, FL December 2021 Forecast
2021:Q4 2022:Q1 2022:Q2 2022:Q3 2022:Q4 2023:Q1 2023:Q2 2023:Q3 2023:Q4 2024:Q1 2024:Q2 2024:Q1 2024:Q2
Personal Income (Billions $)
Total Personal Income 26.0 26.0 26.3 26.6 26.8 27.0 27.3 27.6 27.9 28.2 28.5 28.8 29.1
Pct Chg Year Ago Wages and Salaries
5.2 -6.3 0.3 2.0 3.3 3.8 3.9 3.9 4.2 4.4 4.3 4.2 4.3 11.5 11.7 11.9 12.0 12.1 12.2 12.4 12.5 12.6 12.8 12.9 13.0 13.1 Nonwage Income 14.4 14.3 14.5 14.6 14.7 14.8 15.0 15.1 15.3 15.5 15.6 15.8 16.0 Real Personal Income (12$) 24.2 24.1 24.3 24.4 24.5 24.6 24.8 24.9 25.1 25.2 25.3 25.5 25.6 Pct Chg Year Ago 0.5 -9.9 -2.6 -0.3 1.4 2.0 2.0 2.1 2.3 2.4 2.2 2.1 2.1 Per Capita Income (Ths) 49.8 49.9 50.3 50.7 51.0 51.3 51.8 52.2 52.6 53.1 53.5 53.9 54.4 Real Per Capita Income (12$) 46.4 46.3 46.4 46.6 46.7 46.7 46.9 47.1 47.3 47.4 47.5 47.7 47.9 Average Annual Wage (Ths) 56.8 57.2 57.4 57.6 57.9 58.2 58.5 58.8 59.3 59.8 60.4 60.9 61.5 Pct Chg Year Ago 3.9 3.9 2.1 1.5 1.9 1.7 1.9 2.1 2.4 2.8 3.2 3.6 3.7
Establishment Employment (Place of Work, Thousands, SA)
Total Employment 188.5 189.9 191.9 193.3 194.4 195.5 197.2 198.1 198.6 199.0 199.3 199.6 199.9 Pct Chg Year Ago 3.0 2.5 3.3 3.5 3.1 2.9 2.7 2.5 2.1 1.8 1.1 0.8 0.6 Manufacturing 7.1 7.1 7.2 7.2 7.2 7.2 7.2 7.2 7.1 7.1 7.0 7.0 6.9 Pct Chg Year Ago 3.8 2.8 4.0 1.0 1.1 1.2 0.4 0.4 -0.6 -1.4 -2.2 -2.8 -3.2 Nonmanufacturing 181.4 182.8 184.8 186.1 187.2 188.3 190.0 190.9 191.4 191.9 192.3 192.6 192.9 Pct Chg Year Ago 2.9 2.5 3.3 3.6 3.2 3.0 2.8 2.6 2.2 1.9 1.2 0.9 0.8 Construction & Mining 12.4 12.2 12.1 12.0 11.9 11.8 11.7 11.5 11.4 11.3 11.2 11.1 11.1 Pct Chg Year Ago 3.6 1.5 -0.4 -3.8 -3.8 -3.7 -3.9 -4.4 -4.5 -4.5 -4.0 -3.3 -2.6 Trade, Trans, & Utilities 34.6 34.3 34.0 33.9 33.2 32.9 33.4 33.3 33.3 33.0 32.3 32.1 32.0 Pct Chg Year Ago 1.9 0.3 0.6 -0.7 -4.0 -4.2 -1.8 -1.9 0.2 0.2 -3.4 -3.6 -3.8 Wholesale Trade 6.0 6.0 6.1 6.2 6.2 6.3 6.3 6.3 6.3 6.4 6.5 6.5 6.6 Retail Trade 23.9 23.6 23.3 22.9 22.2 21.9 22.4 22.3 22.2 21.8 21.0 20.7 20.6 Trans, Wrhsng, & Util 4.7 4.7 4.7 4.8 4.8 4.8 4.7 4.7 4.7 4.7 4.8 4.8 4.8 Information 1.6 1.6 1.6 1.6 1.6 1.6 1.6 1.6 1.7 1.7 1.7 1.7 1.7 Pct Chg Year Ago 4.6 4.0 4.3 3.1 0.4 0.8 2.2 3.3 6.0 6.5 6.2 4.7 1.7 Financial Activities 16.1 16.4 16.8 17.1 17.1 17.4 17.6 17.8 18.0 18.3 18.6 18.8 18.9 Pct Chg Year Ago 4.0 6.5 10.0 8.0 6.7 6.5 4.9 4.1 5.1 5.0 5.9 5.7 5.0 Prof & Business Services 25.0 25.9 26.4 26.7 26.8 27.0 26.8 26.8 26.8 27.1 27.3 27.4 27.5 Pct Chg Year Ago -1.6 -1.1 2.7 7.2 7.1 4.3 1.6 0.4 0.1 0.2 1.8 2.5 2.4 Educ & Health Services 31.6 31.8 32.5 32.5 32.4 32.6 32.6 32.6 32.8 33.1 33.3 33.5 33.6 Pct Chg Year Ago 2.9 2.9 4.8 4.0 2.7 2.3 0.3 0.3 1.1 1.7 2.3 2.6 2.4 Leisure & Hospitality 24.7 24.7 24.9 25.4 27.1 27.9 29.1 30.0 30.1 30.0 30.2 30.2 30.3 Pct Chg Year Ago 9.1 6.2 1.2 3.9 9.7 12.9 16.6 17.9 11.0 7.7 3.8 0.8 0.6 Other Services 6.8 6.9 7.1 7.4 7.4 7.4 7.3 7.3 7.3 7.4 7.4 7.5 7.5 Pct Chg Year Ago 4.2 4.8 8.0 11.9 9.5 7.5 2.6 -0.7 -0.9 -0.4 1.1 1.8 2.3 Federal Government 6.8 6.9 7.0 7.1 7.2 7.3 7.3 7.3 7.3 7.4 7.4 7.4 7.4 Pct Chg Year Ago -0.7 1.8 6.1 8.7 7.0 6.0 4.5 3.1 1.7 1.0 0.4 0.2 0.1 State & Local Government 22.0 22.1 22.3 22.4 22.5 22.5 22.6 22.7 22.7 22.8 22.9 23.0 23.1 Pct Chg Year Ago 3.0 2.8 3.6 2.4 2.1 1.8 1.5 1.2 1.2 1.3 1.3 1.4 1.5
Other Economic Indicators
Population (Ths) 520.7 521.8 523.1 524.3 525.4 526.7 528.0 529.4 530.6 531.7 532.8 534.0 535.1 Pct Chg Year Ago 1.2 1.1 1.1 0.9 0.9 0.9 0.9 1.0 1.0 1.0 0.9 0.9 0.9 Labor Force (Ths) 243.3 246.0 247.9 249.4 250.6 251.1 251.7 251.9 251.8 251.7 251.8 251.9 251.9 Pct Chg Year Ago 7.0 5.4 3.9 3.8 3.0 2.1 1.5 1.0 0.5 0.3 0.0 0.0 0.1 Unemployment Rate (%) 5.0 4.9 4.8 4.8 4.8 4.5 4.4 4.3 4.1 3.9 3.8 3.7 3.4 Total Housing Starts 4222.3 3857.3 3375.2 3000.8 2879.5 2744.6 2636.0 2594.4 2571.2 2509.0 2467.9 2432.2 2396.1 Single-Family 2690.9 2489.7 2430.9 2390.1 2406.3 2410.5 2388.4 2399.9 2375.9 2315.0 2279.1 2247.4 2221.3 Multifamily 1531.4 1367.5 944.3 610.7 473.1 334.1 247.6 194.5 195.2 194.0 188.7 184.8 174.8
PROFILES
The Port St. Lucie MSA is a city on the Atlantic coast of southern Florida. Located in St. Lucie county, this municipality is the most populous in the county. Known for its Botanical Gardens and the waterways of the North Fork St. Lucie Aquatic Preserve which are home to manatees, river otters, egrets and alligators.
QUICK FACTS
• Metro population estimate of 472,012 as of 2019 (5-Year Estimate) (U.S. Census Bureau). • Martin County population estimate of 159,065 as of 2019 (5-Year Estimate) (U.S. Census Bureau). • St. Lucie County population estimate of 312,947 as of 2019 (5-Year Estimate) (U.S. Census
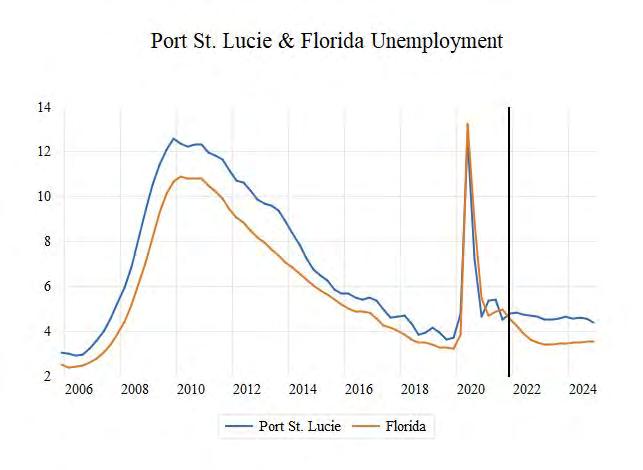
Bureau). • Civilian labor force of 232,941 in August 2021 (Florida Research and Economic Database). • An unemployment rate of 4.9% as of August 2021, not seasonally adjusted. This amounts to 11,300 unemployed people (Florida Research and
Economic Database).
OUTLOOK SUMMARIES
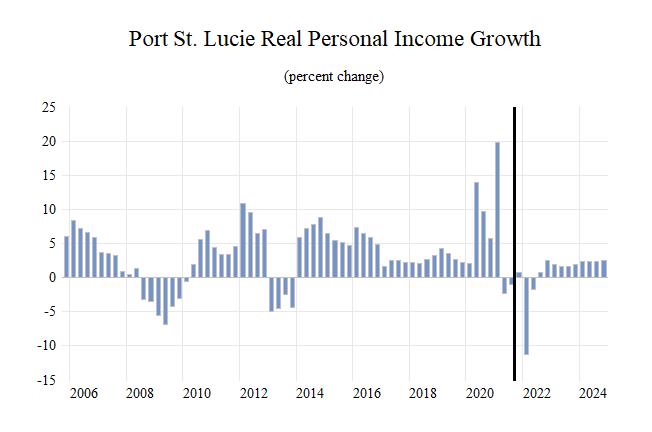
The Port St. Lucie Metropolitan Statistical Area (MSA) is expected to show slightly below average levels of growth in its economic indicators. Port St. Lucie’s Gross Metro Product will be the tenth highest in the state at a level of $16,981.50 million. Average annual wage growth of 3.6 percent will lead to an average annual wage of $55,500, ranking 20th in the state. Personal incomes will grow by 3.6 percent. This will lead to a per capita income level of $55,300, the 6th highest in the state. Population growth will average 1.2 percent.
Employment growth is expected to average a rate of 3.2 percent annually. The unemployment rate is estimated to average 4.7 percent.
The Leisure sector will lead Port St. Lucie at an average annual growth rate at 7.6 percent. The Professional & Business Services sector and the Information sector will expand at respective rates of 7.4 percent and 6.7 percent.
METRO NEWS SUMMARIES
Fort Pierce Eyes New Law to Regulate Short-Term Rentals; City May Impose $250 Annual Fee
• Property owners looking to post their homes on popular websites such as Airbnb may face new costs as the city tries to enforce its short-term and vacation-rental regulations. • The proposed law comes with an annual $250 registration fee for property owners and could generate at least $49,000 annually. • While some people said the $250 annual fee was a reasonable cost of doing business here, others argued it still was too high and would deter people from legally registering rentals. Source: TC Palm, July 6, 2021
More People Joined the Workforce in June on the Treasure Coast, Pushing Unemployment Higher
• Almost 3,100 people joined the Treasure Coast’s available workforce in June, pushing up the region’s combined unemployment rate. The
Treasure Coast jobless rate rose in June to 5.7% from 4.8% in May. • Both the available workforce total of 300,862 and the 283,818 employed residents are all-time highs for the Treasure Coast. • In terms of sector growth, The Port St. Lucie
Metropolitan Statistical Area had the state’s fastest annual growth rate in professional and business services. Source: TC Palm, July 19, 2021
Amazon Fulfillment Center in Port St. Lucie to Bring 500 Full-Time Jobs
• A 1.1-million-square-foot Amazon Fulfillment
Center is coming to northern Port St. Lucie, bringing more than 500 full-time jobs to the area. • Construction is expected to be done by late summer or early fall 2022. Vice Mayor Martin said the structure is a $100 million capital
investment in the community and would be the largest structure in Port St. Lucie. • The center is known as a “first-mile” facility and will work with larger items to be sent to a delivery service station before final delivery. Source: TC Palm, August 5, 2021
Treasure Coast Real Estate: Properties in High Demand, but Low Supply, Spur Unprecedented Market
• An increase in newcomers to the area combined with a lack of availability has caused a jump in housing prices. • Most newcomers are from more expensive markets in South Florida and New York and are willing to spend more money. As of June, the median sale prices of single-family homes in St.
Lucie and Martin have increased by 13% and 8.9% respectively. • An influx of new residents could generate more revenue but could also price out longtime residents. Source: TC Palm, August 13, 2021
Origin Construction to Build $75M Seniors Housing Community in Port St. Lucie, Florida
• Miami-based Origin Construction will build
America Walks, an active adult rental community in Port St. Lucie spanning 60 acres and more than 400 residences. • The project is expected to cost $75 million to develop and deliver in the third quarter of 2023. • The community will feature residential and recreational components, including walking and biking trails, a restaurant, exercise facilities and community amenities like a pool, spas and fire pits. Source: RE Business Online, September 7, 2021
FedEx to Hire Hundreds of Employees Ahead of Treasure Coast Facility’s Opening
• FedEx is hiring about 900 full-time and parttime employees in the next few weeks ahead of opening a new state-of-the-art, regional sortation facility in St. Lucie County. • The 245,000 square foot facility comes with an estimated capital investment of $45 million • According to Pete Tesch, president of the
Economic Development Council of St. Lucie
County, “Having this regional sort center in our community will provide job opportunities for a lot of the residents in the immediate Treasure
Community, providing high-wage, high-skilled jobs”. Source: WPBF 25 News, September 27, 2021
More Hispanics, Latinos moving to St. Lucie County, census data shows
• According to 2020 census data, St. Lucie County had a 44.2% population increase of Hispanics and Latinos compared to 2010. • County commissions director Erick Gill points to affordable housing, job growth and a diversified economy as some of the main reasons for immigration. • St. Lucie County is adapting to these changes in a variety of ways. Emergency briefings are now translated in Spanish and Creole, and there is now an Internal Diversion and Inclusion
Committee for the county. Source: WPTV 5 West Palm Beach, October 13, 2021
Port St. Lucie leaders want to help small businesses affected by pandemic
• On Monday, October 25, city leaders finalized an application to the Florida Department of
Economic Development for $1.5 million in
COVID-19 assistance. • If approved, it would provide grants of up to $25,000 to local businesses impacted by the pandemic, showing a loss of revenue between 2019 and 2020. • Assistance would be targeted toward applicants in moderate income areas or with low-to-moderate household incomes. Lorraine Pannozzo, a small business owner who received assistance last year, says “...it can go towards pretty much any losses due to COVID”. Source: WPTV West Palm Beach, October 25, 2021
Port St. Lucie MSA Industry Loca�on Quo�ents
Total Nonagricultural Employment
Total Private
Goods Producing
Service Producing
Private Service Providing
Mining, Logging, and Construc�on
Manufacturing
Trade, Transporta�on, and U�li�es
Wholesale Trade
Retail Trade
Transporta�on, Warehousing and U�li�es
Informa�on
Financial Ac�vi�es
Professional and Business Services
Educa�onal and Health Services
Leisure and Hospitality
Other Services
Government
0 0.2 0.4 0.6 0.8 1 1.2 1.4

Long Term Outlook for Port St. Lucie, FL December 2021 Forecast
2016 2017 2018 2019 2020 2021 2022 2023 2024
Personal Income (Billions $)
Total Personal Income Pct Chg Year Ago Wages and Salaries Nonwage Income Real Personal Income (12$) Pct Chg Year Ago Per Capita Income (Ths) Real Per Capita Income (12$) Average Annual Wage (Ths) Pct Chg Year Ago 23.8 25.2 26.4 27.7 29.3 31.3 31.2 32.5 33.7 7.0 6.3 4.8 4.7 5.7 6.8 -0.3 4.1 4.0 6.2 6.5 6.9 7.3 7.6 8.5 9.1 9.6 9.9 17.6 18.7 19.5 20.4 21.7 22.8 22.1 22.9 23.8 23.7 24.7 25.2 26.2 27.4 28.3 27.4 28.0 28.5 4.9 4.4 1.9 4.0 4.5 3.1 -3.0 2.2 1.9 51.8 54.1 55.9 57.5 59.7 62.7 61.8 63.7 65.6 51.6 53.0 53.2 54.4 55.8 56.7 54.3 54.9 55.5 43.2 44.3 45.4 46.9 50.2 53.4 54.8 55.9 57.7 1.5 2.7 2.4 3.3 7.0 6.5 2.5 2.0 3.2
Establishment Employment (Place of Work, Thousands, SA)
Total Employment 143.0 146.1 151.3 155.6 151.2 157.3 165.4 170.1 171.2 Pct Chg Year Ago 3.8 2.2 3.5 2.9 -2.8 4.0 5.2 2.8 0.7
Manufacturing Pct Chg Year Ago Nonmanufacturing Pct Chg Year Ago Construction & Mining Pct Chg Year Ago Trade, Trans, & Utilities Pct Chg Year Ago
6.6 6.8 7.0 7.5 7.4 7.8 8.0 8.1 7.9 3.8 3.4 2.5 8.3 -1.2 4.4 2.9 1.1 -1.6 136.4 139.3 144.3 148.1 143.8 149.6 157.5 162.0 163.3 3.8 2.1 3.6 2.6 -2.9 4.0 5.3 2.9 0.8 9.8 10.2 11.3 12.0 12.3 13.2 13.5 13.3 12.9 13.7 4.1 10.6 5.9 2.3 7.4 2.1 -1.3 -2.6 30.8 31.0 31.2 31.0 30.8 30.8 30.5 30.2 29.3 2.8 0.6 0.6 -0.8 -0.6 0.1 -0.9 -1.1 -3.0
Wholesale Trade Retail Trade Trans, Wrhsng, & Util Information Pct Chg Year Ago
5.2 5.3 5.1 5.2 5.0 4.8 5.2 5.4 5.7 21.2 21.3 21.5 21.2 20.8 20.6 19.8 19.2 17.9 4.4 4.5 4.6 4.5 5.0 5.4 5.5 5.5 5.6 1.3 1.3 1.2 1.2 1.1 1.2 1.3 1.3 1.4 4.7 -1.2 -5.2 -1.4 -11.1 13.1 8.3 1.1 4.2
Financial Activities Pct Chg Year Ago Prof & Business Services Pct Chg Year Ago Educ & Health Services Pct Chg Year Ago Leisure & Hospitality Pct Chg Year Ago Other Services Pct Chg Year Ago Federal Government Pct Chg Year Ago State & Local Government Pct Chg Year Ago
5.4 5.6 5.5 5.9 6.0 6.1 6.6 6.9 7.0 3.4 2.4 -0.6 7.1 0.3 2.8 7.5 4.4 2.7 17.0 17.6 19.2 20.7 21.6 24.0 26.7 27.9 28.7 3.9 3.5 9.0 8.1 4.2 11.3 11.2 4.4 2.8 25.7 26.8 27.5 28.6 27.7 28.1 29.8 30.0 30.7 3.6 4.3 2.8 3.7 -3.0 1.3 6.1 0.7 2.3 18.6 19.3 20.5 20.9 17.8 19.7 21.0 23.5 23.8 3.9 3.9 6.0 2.3 -14.9 10.7 6.4 11.8 1.5 8.2 8.0 8.2 8.0 7.4 7.6 8.5 8.8 9.0 3.0 -2.0 2.3 -2.1 -7.7 3.4 11.0 3.8 2.5 1.0 1.0 1.0 1.0 1.1 1.0 1.0 1.0 1.0 -0.1 0.1 0.0 2.5 5.4 -8.5 2.4 2.2 -1.1 18.5 18.5 18.6 18.7 18.1 17.8 18.6 19.2 19.4 1.8 -0.1 0.7 0.6 -3.3 -1.6 4.5 3.0 1.5
Other Economic Indicators
Population (Ths) Pct Chg Year Ago Labor Force (Ths) Pct Chg Year Ago Unemployment Rate (%) Total Housing Starts Single-Family Multifamily
458.7 466.4 473.5 481.3 490.8 498.5 504.5 509.9 514.2 2.1 1.7 1.5 1.6 2.0 1.6 1.2 1.1 0.8 206.8 211.0 215.4 219.9 217.4 228.1 238.4 240.1 239.9 2.6 2.0 2.1 2.1 -1.1 4.9 4.5 0.7 -0.1 5.5 4.9 4.2 3.9 7.3 5.0 4.7 4.6 4.5 1882.1 2159.2 3582.6 4092.4 4955.8 6610.6 5030.1 4118.7 3885.0 1713.3 2085.9 2794.3 3572.6 4605.5 5439.0 4101.6 3340.0 3102.7 168.9 73.2 788.3 519.7 350.3 1171.6 928.4 778.7 782.3


