11 minute read
Tampa–St. Petersburg–Clearwater ..........................................135


Short Term Outlook for Tampa-St. Petersburg-Clearwater, FL December 2021 Forecast
2021:Q4 2022:Q1 2022:Q2 2022:Q3 2022:Q4 2023:Q1 2023:Q2 2023:Q3 2023:Q4 2024:Q1 2024:Q2 2024:Q1 2024:Q2
Personal Income (Billions $)
Total Personal Income 179.7 180.8 182.9 185.1 186.7 188.2 189.9 191.7 193.6 195.8 198.0 200.1 202.3
Pct Chg Year Ago Wages and Salaries
5.4 -5.5 1.2 2.8 3.9 4.1 3.8 3.6 3.7 4.0 4.3 4.4 4.5 93.3 95.1 96.4 97.5 98.3 99.2 99.9 100.7 101.6 102.6 103.7 104.8 105.9 Nonwage Income 86.4 85.7 86.4 87.6 88.4 89.0 90.0 91.0 92.0 93.2 94.3 95.3 96.5 Real Personal Income (12$) 156.8 157.1 158.2 159.3 160.0 160.6 161.2 162.1 162.9 163.9 164.9 165.8 166.8 Pct Chg Year Ago 0.6 -9.2 -1.8 0.5 2.1 2.2 1.9 1.8 1.8 2.1 2.3 2.3 2.4 Per Capita Income (Ths) 55.7 55.9 56.3 56.9 57.2 57.5 57.9 58.3 58.7 59.2 59.7 60.2 60.8 Real Per Capita Income (12$) 48.6 48.5 48.7 48.9 49.0 49.1 49.1 49.3 49.4 49.6 49.8 49.9 50.1 Average Annual Wage (Ths) 65.2 65.7 66.1 66.5 66.8 67.1 67.5 67.8 68.3 68.8 69.4 69.9 70.5 Pct Chg Year Ago 2.7 2.5 2.1 2.2 2.5 2.2 2.1 2.0 2.3 2.5 2.8 3.1 3.3
Establishment Employment (Place of Work, Thousands, SA)
Total Employment 1418.9 1435.7 1446.8 1454.4 1460.2 1465.6 1468.7 1471.7 1475.1 1479.0 1482.7 1486.0 1488.3 Pct Chg Year Ago 5.0 5.2 5.1 3.7 2.9 2.1 1.5 1.2 1.0 0.9 1.0 1.0 0.9 Manufacturing 67.8 67.8 68.2 68.3 68.5 68.5 68.4 68.1 68.0 67.8 67.6 67.4 67.2 Pct Chg Year Ago 0.3 0.3 2.4 0.9 1.0 1.0 0.2 -0.2 -0.8 -1.1 -1.2 -1.1 -1.1 Nonmanufacturing 1351.1 1367.9 1378.6 1386.1 1391.7 1397.1 1400.3 1403.6 1407.2 1411.2 1415.1 1418.7 1421.1 Pct Chg Year Ago 5.2 5.5 5.2 3.9 3.0 2.1 1.6 1.3 1.1 1.0 1.1 1.1 1.0 Construction & Mining 86.6 86.2 85.7 85.5 85.2 85.1 84.9 84.9 84.8 84.9 84.9 84.8 84.9 Pct Chg Year Ago 3.0 0.3 -0.4 -1.6 -1.6 -1.2 -0.9 -0.7 -0.4 -0.2 -0.1 0.0 0.1 Trade, Trans, & Utilities 261.3 259.0 258.2 258.9 255.4 254.8 258.1 257.0 257.0 255.0 250.8 249.8 248.8 Pct Chg Year Ago 3.5 1.8 1.2 0.8 -2.2 -1.6 0.0 -0.7 0.6 0.1 -2.8 -2.8 -3.2 Wholesale Trade 56.9 57.8 58.7 61.0 61.6 62.1 61.9 62.0 62.2 62.8 63.6 64.1 64.6 Retail Trade 159.8 156.1 153.8 151.0 146.8 145.4 149.1 148.0 147.8 144.9 139.4 137.7 136.1 Trans, Wrhsng, & Util 44.6 45.1 45.7 46.9 47.0 47.3 47.1 46.9 47.0 47.3 47.8 47.9 48.1 Information 26.3 26.8 26.8 27.5 26.9 27.1 27.3 27.4 27.9 28.2 28.5 28.5 28.5 Pct Chg Year Ago 8.8 11.1 11.5 7.3 2.5 1.1 1.9 -0.3 3.4 4.2 4.4 4.0 2.2 Financial Activities 129.1 131.8 135.0 137.9 138.0 138.1 136.7 136.2 136.6 137.6 138.9 139.9 140.7 Pct Chg Year Ago 2.1 4.0 9.3 7.3 6.9 4.8 1.2 -1.2 -1.0 -0.4 1.6 2.7 3.1 Prof & Business Services 264.1 278.3 279.7 277.6 278.2 279.5 278.0 278.5 280.0 282.6 286.0 287.7 289.0 Pct Chg Year Ago 4.1 7.7 6.9 4.5 5.3 0.4 -0.6 0.3 0.7 1.1 2.9 3.3 3.2 Educ & Health Services 218.1 218.7 224.6 225.2 223.2 223.7 222.4 222.3 222.7 224.4 226.1 227.6 228.4 Pct Chg Year Ago 2.5 2.8 6.5 4.5 2.3 2.3 -1.0 -1.3 -0.2 0.3 1.6 2.4 2.5 Leisure & Hospitality 161.0 160.1 158.5 161.0 170.9 174.7 178.9 183.4 183.9 183.6 184.2 184.0 183.8 Pct Chg Year Ago 22.4 18.3 4.6 4.4 6.1 9.1 12.9 13.9 7.6 5.1 3.0 0.3 0.0 Other Services 50.8 51.8 53.8 55.6 56.3 56.4 56.0 55.8 55.9 56.2 56.7 57.1 57.4 Pct Chg Year Ago 14.2 12.9 11.7 11.6 10.8 8.8 4.0 0.4 -0.6 -0.3 1.2 2.3 2.7 Federal Government 27.9 27.9 27.9 27.9 28.0 28.0 28.0 28.0 28.1 28.1 28.2 28.3 28.3 Pct Chg Year Ago -2.6 -1.6 0.9 0.4 0.3 0.3 0.3 0.3 0.4 0.7 0.8 0.9 0.9 State & Local Government 126.1 127.4 128.3 129.0 129.6 129.9 130.0 130.0 130.3 130.6 130.8 131.0 131.2 Pct Chg Year Ago 0.4 1.9 5.4 4.2 2.8 1.9 1.3 0.7 0.5 0.5 0.6 0.8 0.7
Other Economic Indicators
Population (Ths) 3227.0 3236.5 3246.0 3255.6 3264.9 3273.7 3282.0 3289.6 3297.5 3305.5 3313.8 3322.2 3330.7 Pct Chg Year Ago 1.0 1.1 1.2 1.2 1.2 1.1 1.1 1.0 1.0 1.0 1.0 1.0 1.0 Labor Force (Ths) 1646.7 1659.3 1668.4 1675.1 1680.5 1684.6 1688.1 1689.7 1691.0 1691.4 1692.9 1694.8 1697.5 Pct Chg Year Ago 7.0 5.4 3.6 2.7 2.0 1.5 1.2 0.9 0.6 0.4 0.3 0.3 0.4 Unemployment Rate (%) 4.7 4.4 4.0 3.8 3.6 3.5 3.5 3.5 3.4 3.4 3.4 3.4 3.4 Total Housing Starts 21870.221323.620479.920327.920415.220562.720622.020857.821034.420774.520413.020309.520002.2 Single-Family 18527.317737.316974.616302.815990.315688.215401.215406.815391.215063.614833.714838.114675.7 Multifamily 3342.9 3586.4 3505.3 4025.0 4424.9 4874.5 5220.9 5451.0 5643.2 5710.9 5579.4 5471.4 5326.5
PROFILES
The Villages MSA is located in the north central portion of the state and is comprised of Sumter County. The villages shares its name with a broader master-planned age-restricted community that spreads into portions of Lake and Marion Counties.
QUICK FACTS
• Metro population estimate of 125,044 as of 2019 (5-Year Estimate) (U.S. Census Bureau). • Sumter County population estimate of 125,044 as of 2019 (5-Year Estimate) (U.S.
Census Bureau). • Civilian labor force of 33,640 in August 2021 (Florida Research and Economic Database). • An unemployment rate of 56.4% as of August 2021, not seasonally adjusted. This amounts to 2,159 unemployed people (Florida Research and Economic Database).
OUTLOOK SUMMARIES
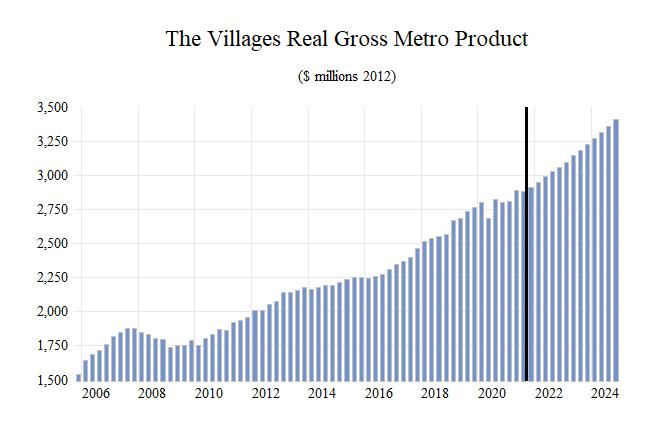
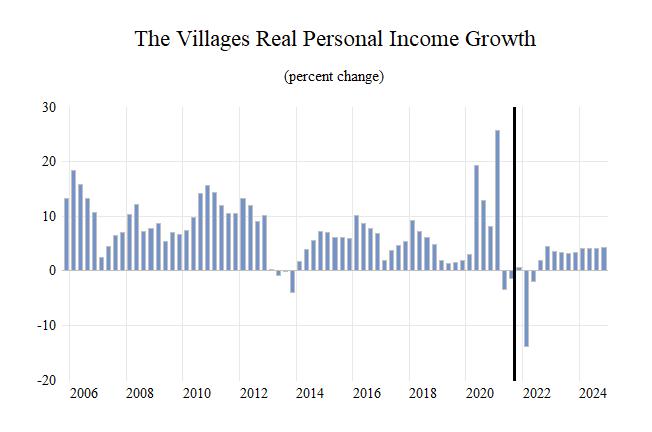
The Villages Metropolitan Statistical Area (MSA) is expected to show mixed levels of growth in its economic indicators. The Villages Gross Metro Product will be the second lowest in the state at a level of $3,094.83 million. Average annual wage growth of 3.6 percent will lead to an average annual wage of $56,600. Personal incomes will grow by 4.2 percent, the 5th highest rate of growth in the state. This will lead to a per capita income level of $51,400. Population growth will average 3.3 percent, the highest in the State.
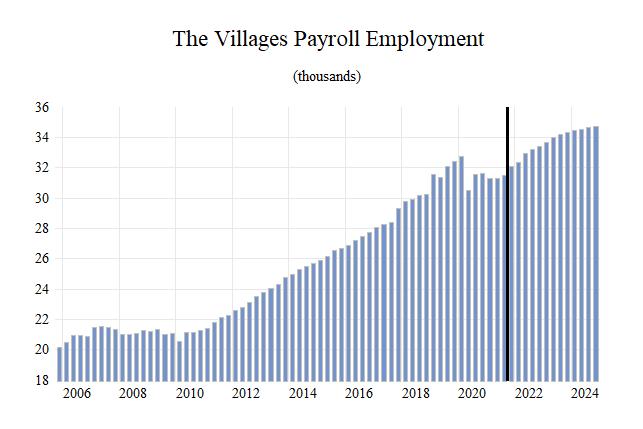
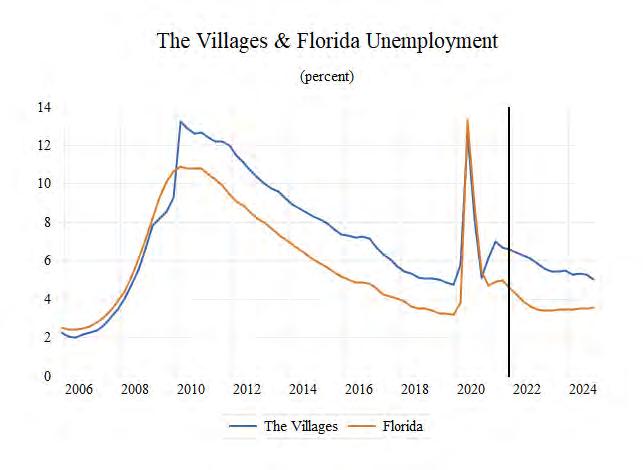
Employment growth is expected to average a rate of 2.3 percent annually. The unemployment rate is estimated to average 5.9 percent, the third highest in the state. Housing Starts will contract at -9.3%, the second lowest in the state.
The Information sector will lead The Villages at an average annual growth rate at 8.0 percent. The Leisure sector and the Professional & Business Services sector will expand at respective rates of 6.9 percent and 6.3 percent.
METRO NEWS SUMMARIES
Sumter commissioners move forward to 2022 with balanced budget
• Sumter County commissioners approved a property tax rate decrease, as officials move to finalize the county’s 2022-2023 fiscal year budget. Residents will now pay $6.24 per $1,000 of taxable property value, effective October 1st of this year. • This value translates to a 3% cut from the previous rate. In 2020, commissioners cut the property tax rate 4%. These cuts come after the first hike the county had seen in 14 years, as commissioners raised the property tax rate by 25% in 2019. • County Commission Chairman Garry Breeden stated that the new rate “gives us a balanced budget that allows us to maintain our current level of service and to keep moving forward with projects we have on the books…” Source: The Villages Daily Sun, July 14, 2021
Lake County approves The Villages’ request for grant for medical center
• The Villages received approval from the
Lake County Board of Commissioners for a property tax rebate request regarding a planned $100-million development project in the works off the Florida Turnpike near Leesburg. • The development, codenamed the Go West
Project, will include a regional hospital, along with space for retail, commercial, and residential tenants. While the grant does not apply toward residential tax purposes, the Villages may qualify for a tax rebate based on a certain percentage of commercial property taxes paid. • The grant, which was approved under the Lake
County Economic Development and Business
Incentive program, will require the development to produce at least 100 new jobs at or above the county average wage. Source: Villages-News, July 27, 2021
159 more single-family homes at Beaumont development to be built near The Villages
• Local officials have approved two large developments, both planned to be constructed near the Villages, to continue to the next stage of the permitting and planning process. • The Beaumont development will be located off
County Road 466A in Wildwood, adjacent to the
Trailwinds Village development. The Beaumont project will build 159 new single-family homes. • • Another project planned near County Road 462 that is projected to add 182 residential units was also approved. The plans will be submitted to the Wildwood Commission for further review. Source: Villages-News, August 3, 2021
$10 million loan extended to fund new hotel across from The Villages
• Liberty Group CEO Punit Shah, a real estate investor and developer based out of Tampa Bay, continues to move forward with plans to develop a new Home2 Suites hotel right outside the
Villages. • Shah, who recently secured a construction financing deal with Centennial Bank for $10 million for the project, has worked on similar projects, including a Hampton Inn/Home2
Suites property in downtown Tampa that recently sold for $57.5 million. • The new hotel will be the first extended-stay hotel in close proximity to the massive retirement living community, aimed at meeting the lodging needs of residents’ visitors as well as business travel for the surrounding area. Source: Villages-News, August 26, 2021
Sumter County and The Villages battling over $2 to $5 million in fire department funding
• A dispute between the Villages and Sumter
County officials may jeopardize efforts by
Villages officials to establish an independent fire district for the Villages, which currently falls under the jurisdictions of Sumter, Lake, and
Marion Counties. • Sumter County officials claim that the Villages broke a stipulation in a 2019 fire department funding agreement with the county requiring that unused county funds be returned. The outstanding balance is said to be between $2 million and $5 million. • Until a resolution is reached, Sumter County
Chairman Garry Breeden notified the Villages that 2022 funding for the fire department will be withheld. This comes at a time when Villages’ district officials are planning a proposal to county and state leaders for a separate Villages fire district, which could affect taxing authority in the district. Source: Villages-News, September 24, 2021
Total Nonagricultural Employment
Total Private
The Villages MSA Industry Loca�on Quo�ents
Goods Producing
Service Producing
Private Service Providing
Government
0 0.2 0.4 0.6 0.8 1 1.2 1.4 1.6
Long Term Outlook for The Villages, FL December 2021 Forecast
2016 2017 2018 2019 2020 2021 2022 2023 2024
Personal Income (Billions $)
Total Personal Income Pct Chg Year Ago Wages and Salaries Nonwage Income Real Personal Income (12$) Pct Chg Year Ago Per Capita Income (Ths) Real Per Capita Income (12$) Average Annual Wage (Ths) Pct Chg Year Ago
5.4 5.8 6.3 7.1 7.6 8.0 8.0 8.5 8.9 10.5 7.8 9.4 12.9 6.1 5.7 -0.6 6.2 5.5 1.2 1.3 1.4 1.5 1.6 1.7 1.9 2.0 2.1 4.2 4.5 4.9 5.6 6.0 6.3 6.1 6.5 6.9 5.5 5.9 6.3 6.9 7.2 7.3 7.1 7.4 7.6 7.2 5.9 6.5 9.6 4.9 2.1 -3.4 4.3 3.4 45.9 48.4 51.6 56.5 57.6 58.7 56.3 58.0 59.7 47.4 49.1 51.0 54.2 54.6 53.7 50.1 50.7 51.1 42.6 44.5 45.9 47.5 51.2 54.6 56.0 57.1 58.9 2.9 4.5 3.1 3.5 7.9 6.5 2.6 1.9 3.2
Establishment Employment (Place of Work, Thousands, SA)
Total Employment 27.3 28.5 30.0 31.9 31.6 31.5 33.0 34.0 34.6 Pct Chg Year Ago 3.7 4.4 5.3 6.2 -0.8 -0.1 4.5 3.2 1.7
Manufacturing Pct Chg Year Ago Nonmanufacturing Pct Chg Year Ago Construction & Mining Pct Chg Year Ago
0.9 1.0 1.1 1.2 1.2 1.2 1.2 1.2 1.2 -12.9 5.7 12.0 9.4 0.6 3.7 0.9 0.2 -1.2 26.4 27.5 28.9 30.7 30.4 30.3 31.7 32.8 33.4 4.4 4.4 5.1 6.0 -0.9 -0.3 4.6 3.3 1.8 2.9 3.3 3.5 3.8 3.7 3.8 3.8 3.8 3.8 -0.6 12.2 5.9 8.2 -0.9 1.6 1.0 -0.5 -0.1
Trade, Trans, & Utilities Pct Chg Year Ago 5.5 5.5 6.2 6.3 6.3 5.7 5.7 6.0 5.9 4.7 0.5 13.0 1.5 0.0 -9.7 0.5 3.9 -1.5
Wholesale Trade Retail Trade Trans, Wrhsng, & Util Information Pct Chg Year Ago
0.8 0.8 0.9 0.9 0.9 0.8 0.9 1.0 1.0 3.8 3.8 4.3 4.4 4.4 3.9 3.8 3.9 3.7 0.9 0.9 1.0 1.1 1.1 1.0 1.0 1.1 1.1 0.2 0.2 0.2 0.2 0.2 0.2 0.2 0.2 0.2 141.2 -1.7 5.4 13.1 -16.8 17.4 4.0 4.6 5.9
Financial Activities Pct Chg Year Ago Prof & Business Services Pct Chg Year Ago Educ & Health Services Pct Chg Year Ago Leisure & Hospitality Pct Chg Year Ago Other Services Pct Chg Year Ago Federal Government Pct Chg Year Ago State & Local Government Pct Chg Year Ago
1.1 1.1 1.3 1.4 1.6 1.6 1.7 1.8 1.8 -1.4 2.2 9.6 14.8 9.0 -0.6 7.9 4.3 1.8 1.7 1.8 2.0 2.1 2.3 2.5 2.7 2.7 2.9 4.7 8.8 8.0 6.6 7.5 10.5 6.6 2.6 5.5 5.2 5.6 5.7 6.5 6.7 6.1 6.6 6.9 7.2 10.5 7.1 2.0 13.1 3.3 -8.5 7.9 4.6 4.8 4.2 4.3 4.5 4.6 3.9 4.7 4.9 5.0 5.1 2.2 2.5 4.9 1.7 -14.8 20.5 3.5 2.6 0.8 0.5 0.5 0.5 0.6 0.5 0.5 0.6 0.6 0.6 8.5 2.4 -10.4 21.1 -10.3 -5.3 14.2 5.8 3.1 1.6 1.7 1.6 1.6 1.7 1.7 1.8 1.9 1.9 3.5 3.4 -6.0 0.1 6.1 -1.1 6.5 5.8 1.5 3.4 3.4 3.5 3.6 3.5 3.5 3.8 3.9 4.0 0.8 1.5 1.5 2.9 -2.0 0.7 6.2 3.7 1.6
Other Economic Indicators
Population (Ths) Pct Chg Year Ago Labor Force (Ths) Pct Chg Year Ago Unemployment Rate (%) Total Housing Starts Single-Family Multifamily
117.0 119.5 122.6 126.5 131.6 136.6 141.4 145.8 149.6 3.3 2.1 2.6 3.1 4.0 3.8 3.5 3.1 2.6 29.5 30.2 31.3 32.6 32.2 33.0 35.1 36.3 36.8 2.6 2.6 3.6 4.1 -1.4 2.7 6.3 3.3 1.6 7.2 6.2 5.2 4.9 7.9 6.6 6.2 5.5 5.2 1090.1 1773.0 2046.0 2857.0 3447.4 4111.4 2940.9 2317.6 2158.8 1088.6 1773.0 2046.0 2696.2 2898.5 3692.4 2843.6 2251.3 2106.6 1.5 0.1 0.0 160.8 548.9 419.0 97.3 66.3 52.2


