11 minute read
Sebastian–Vero Beach...................................................................120


Short Term Outlook for Sebastian-Vero Beach, FL December 2021 Forecast
2021:Q4 2022:Q1 2022:Q2 2022:Q3 2022:Q4 2023:Q1 2023:Q2 2023:Q3 2023:Q4 2024:Q1 2024:Q2 2024:Q1 2024:Q2
Personal Income (Billions $)
Total Personal Income 14.2 14.3 14.5 14.7 14.9 15.0 15.2 15.4 15.6 15.7 15.9 16.0 16.2
Pct Chg Year Ago Wages and Salaries
6.9 -7.8 0.4 3.0 4.7 5.1 5.0 4.6 4.6 4.7 4.4 4.3 4.2 3.1 3.1 3.2 3.2 3.2 3.3 3.3 3.3 3.4 3.4 3.5 3.5 3.5 Nonwage Income 11.2 11.2 11.3 11.5 11.7 11.8 11.9 12.0 12.2 12.3 12.4 12.5 12.7 Real Personal Income (12$) 13.2 13.2 13.3 13.5 13.6 13.6 13.7 13.8 13.9 14.0 14.1 14.2 14.2 Pct Chg Year Ago 2.1 -11.4 -2.5 0.7 2.8 3.2 3.1 2.7 2.7 2.7 2.4 2.2 2.1 Per Capita Income (Ths) 86.9 87.1 88.1 89.3 90.1 90.7 91.5 92.3 93.1 93.9 94.5 95.3 96.1 Real Per Capita Income (12$) 80.7 80.6 81.1 81.9 82.2 82.4 82.7 83.1 83.4 83.7 83.8 84.1 84.4 Average Annual Wage (Ths) 55.7 56.1 56.2 56.4 56.6 56.8 57.1 57.4 57.9 58.4 58.9 59.5 60.1 Pct Chg Year Ago 2.4 2.5 0.9 0.9 1.5 1.3 1.6 1.7 2.3 2.8 3.2 3.7 3.8
Establishment Employment (Place of Work, Thousands, SA)
Total Employment 54.7 55.2 56.0 56.4 56.7 57.1 57.7 58.1 58.3 58.4 58.4 58.5 58.6 Pct Chg Year Ago 4.8 5.6 5.2 4.4 3.7 3.3 3.1 3.0 2.7 2.3 1.2 0.8 0.6 Manufacturing 2.3 2.3 2.3 2.3 2.4 2.4 2.4 2.4 2.4 2.4 2.4 2.3 2.3 Pct Chg Year Ago 4.4 4.0 5.3 5.1 5.1 5.2 3.2 1.8 0.5 -0.5 -1.5 -2.1 -2.2 Nonmanufacturing 52.5 53.0 53.6 54.1 54.4 54.7 55.3 55.7 55.9 56.0 56.1 56.2 56.3 Pct Chg Year Ago 4.8 5.6 5.2 4.4 3.7 3.2 3.1 3.0 2.8 2.4 1.3 0.9 0.7 Construction & Mining 4.7 4.7 4.6 4.6 4.5 4.5 4.5 4.4 4.4 4.4 4.3 4.3 4.3 Pct Chg Year Ago 4.8 1.6 -1.5 -3.7 -3.3 -3.3 -3.2 -3.5 -3.4 -3.3 -2.6 -1.9 -1.2 Trade, Trans, & Utilities 10.6 10.5 10.4 10.4 10.2 10.1 10.3 10.3 10.3 10.2 9.9 9.8 9.7 Pct Chg Year Ago 1.8 0.6 0.3 -0.3 -4.2 -3.4 -0.8 -0.8 1.2 0.5 -4.4 -5.1 -5.6 Wholesale Trade 1.0 1.1 1.1 1.1 1.1 1.1 1.1 1.1 1.1 1.1 1.2 1.2 1.2 Retail Trade 8.7 8.5 8.4 8.3 8.1 8.0 8.2 8.1 8.1 8.0 7.6 7.5 7.4 Trans, Wrhsng, & Util 0.9 0.9 1.0 1.0 1.0 1.0 1.0 1.0 1.0 1.1 1.1 1.1 1.1 Information 0.5 0.5 0.5 0.5 0.5 0.6 0.6 0.6 0.6 0.6 0.6 0.6 0.6 Pct Chg Year Ago 1.0 6.1 11.4 8.7 4.2 3.0 4.5 4.1 8.3 9.3 8.9 6.9 3.3 Financial Activities 2.7 2.8 2.9 2.9 2.9 3.0 3.0 3.0 3.0 3.1 3.1 3.1 3.1 Pct Chg Year Ago -0.4 3.5 6.2 8.3 7.2 7.2 4.9 3.5 3.7 3.0 3.4 3.1 2.3 Prof & Business Services 6.7 7.1 7.2 7.2 7.3 7.3 7.3 7.3 7.4 7.5 7.6 7.7 7.8 Pct Chg Year Ago 6.6 10.4 9.0 7.7 8.2 3.4 1.8 2.0 2.2 2.5 4.1 4.9 4.8 Educ & Health Services 11.0 11.2 11.4 11.4 11.4 11.4 11.4 11.4 11.4 11.5 11.6 11.7 11.8 Pct Chg Year Ago 1.8 3.5 6.1 5.0 3.2 2.1 -0.4 -0.7 0.1 0.7 2.0 3.1 3.5 Leisure & Hospitality 8.1 8.1 8.2 8.4 8.9 9.0 9.5 9.8 9.9 9.9 9.9 9.9 9.9 Pct Chg Year Ago 16.8 15.8 6.8 5.4 9.4 12.2 16.0 17.7 12.0 9.5 4.5 0.7 -0.2 Other Services 2.8 2.9 3.1 3.2 3.3 3.3 3.3 3.3 3.3 3.4 3.4 3.5 3.5 Pct Chg Year Ago 7.5 9.6 15.3 16.8 14.3 11.6 6.2 2.7 2.2 2.5 4.0 4.8 5.3 Federal Government 0.4 0.4 0.4 0.4 0.4 0.4 0.4 0.4 0.4 0.5 0.5 0.5 0.5 Pct Chg Year Ago -1.4 2.7 7.4 9.6 7.9 7.0 5.5 4.2 2.8 2.0 1.4 1.1 1.0 State & Local Government 4.8 4.9 4.9 5.0 5.0 5.0 5.1 5.1 5.1 5.1 5.1 5.1 5.1 Pct Chg Year Ago 1.0 3.3 5.3 4.9 4.4 3.7 3.0 2.3 1.7 1.2 1.0 0.5 0.4
Other Economic Indicators
Population (Ths) 163.6 164.1 164.4 164.7 165.1 165.7 166.2 166.7 167.1 167.5 167.9 168.3 168.7 Pct Chg Year Ago 1.3 1.3 1.1 0.9 0.9 1.0 1.1 1.2 1.2 1.1 1.0 1.0 1.0 Labor Force (Ths) 68.2 69.0 69.5 69.8 70.0 70.0 70.1 70.1 70.0 70.1 70.2 70.3 70.4 Pct Chg Year Ago 7.6 7.1 5.4 3.8 2.6 1.5 0.9 0.4 0.1 0.0 0.1 0.3 0.5 Unemployment Rate (%) 4.8 4.9 5.0 5.1 5.0 4.9 4.9 4.9 5.0 4.8 4.9 4.8 4.6 Total Housing Starts 1351.2 1364.5 1344.6 1348.3 1410.7 1429.8 1454.6 1454.0 1443.2 1413.8 1384.0 1377.5 1355.9 Single-Family 1322.1 1299.1 1247.4 1207.5 1215.4 1225.0 1238.5 1237.7 1226.0 1196.3 1170.3 1167.9 1153.0 Multifamily 29.1 65.3 97.2 140.8 195.3 204.8 216.1 216.3 217.2 217.4 213.7 209.5 203.0
PROFILES
The Sebring MSA is comprised of Highlands County and is located in the South central portion of the state. Sebring is nicknamed “The City of the Circle” in reference to Circle Drive, the center of the Sebring Downtown Historic District. Sebring is the home of the Sebring International Raceway, created on a former airbase and it is currently known as the host of the 12 Hours of Sebring, an annual WeatherTech SportsCar Championship Race.
QUICK FACTS
• Metro population estimate of 103,437 as of 2019 (5-Year Estimate) (U.S. Census Bureau).
Census Bureau).
• Civilian labor force of 36,624 in August 2021 (Florida Research and Economic Database).
• An unemployment rate of 6.5% as of August 2021, not seasonally adjusted. This amounts to 2,391 unemployed people (Florida Research and
Economic Database).
OUTLOOK SUMMARIES
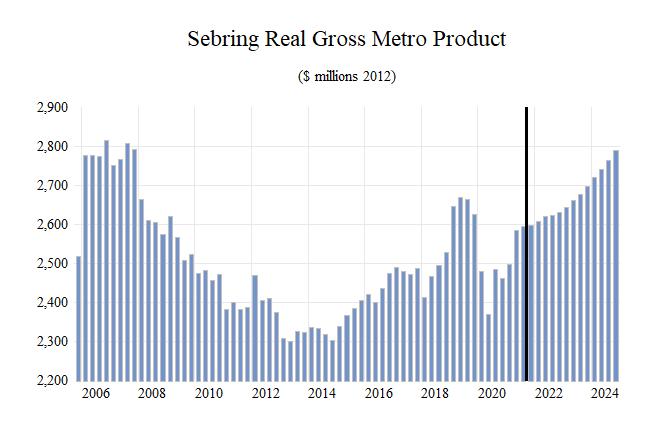
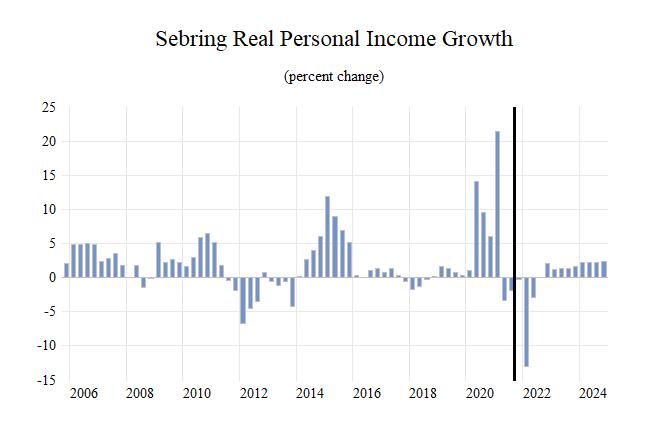
The Sebring Metropolitan Statistical Area (MSA) is expected to low levels of growth in its economic indicators. Sebring’s Gross Metro Product will be the lowest in the state at a level of $2,651.87 million. Average annual wage growth of 3.9 percent will lead to an average annual wage of $51,400, the secondlowest level in the state. Personal incomes will grow by 3.1 percent. This will lead to a per capita income level of $41,700, the third lowest in the state. Population growth will average -0.1 percent.
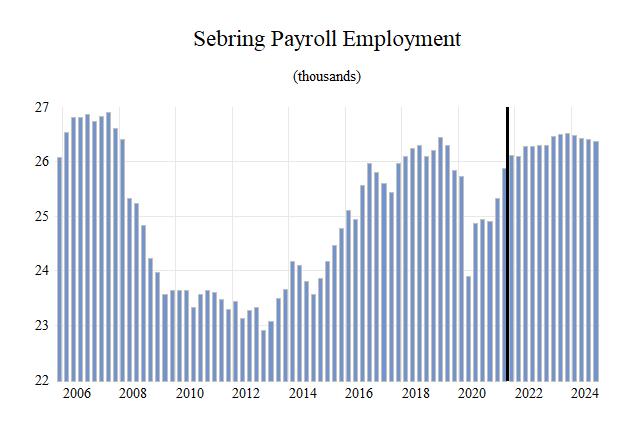
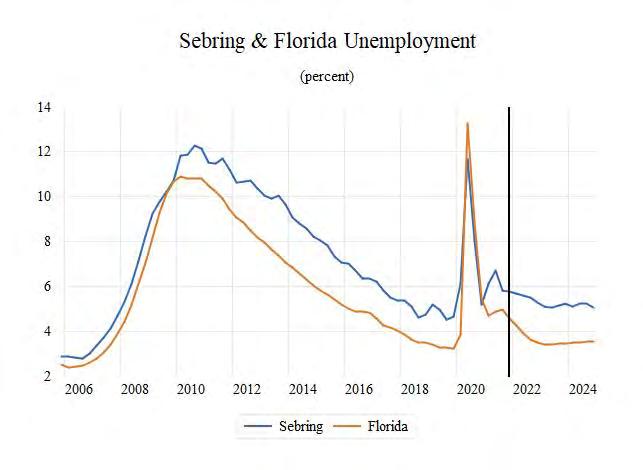
Employment growth is expected to average a rate of 1.5 percent annually. The unemployment rate is estimated to average 5.5 percent.
The Federal Government sector will lead Sebring at an average annual growth rate at 7.5 percent. Construction & Mining sector and the Leisure sector will expand at respective rates of 2.8 percent and 2.1 percent.
METRO NEWS SUMMARIES
New Florida COVID cases spike to highest number in 10 weeks
• A total of 45,603 new COVID-19 cases were reported in Florida from July 9 to July 15 – nearly double the amount reported over the previous week, according to data from the Florida
Department of Health. • As delta variant cases surge and Florida has outright blocked local options for mask mandates and virus restrictions, the positivity rate for new cases rose by nearly 4% – going from 7.8% reported July 2 through July 8 to 11.5% from July 9 through July 15. • In Highlands county 49,048 residents are vaccinated with a case positivity rate of 17.8%.
The total number of cases for the county is 9,000. Source: WFLA, July 16, 2021
Florida river gets curves back in 22-year, $980m restoration
• The 22-year project to restore Florida’s
Kissimmee River from a straight man made channel to its natural meandering state has marked a major milestone. Officials involved in the $980 million project said that 44 miles of the waterway have been restored to its natural path. • The project began in 1999 amid evidence that converting the river to a straight flood control canal in the 1970s damaged the environment, dumping more polluted water into Lake
Okeechobee, sharply reducing waterfowl and bald eagle populations and harming fish and invertebrates. • TC Palm newspapers reported that the
Kissimmee River’s restored floodplains and oxbows will help clean water laden with nitrogen and phosphorus from agricultural runoff, which has fed harmful algal blooms, plaguing the lake for decades. Source: Associated Press, July 30, 2021
AdventHealth Sebring Suspends elective procedures amid surge in COVID-19 cases
• This decision allows the hospital to further plan for the increased need for hospital beds, resources, and advocate for patients and team members. Patients will be notified if their procedure will be canceled. • All AdventHealth West Florida Division hospital locations will continue with time-sensitive urgent and emergent surgeries and procedures as scheduled. • To date, more than 600 COVID-positive patients are currently hospitalized in the West Florida
Division’s 10 hospitals and has far surpassed its highest peak at any point in the pandemic. Source: WFLA, August 24, 2021
LMP to buy dealerships in Florida and Texas
• LMP said it would buy an 85 percent stake in the
Alan Jay Automotive Network of Sebring, Fla., paying $50 million for the dealerships’ goodwill and about $44.1 million for real estate. LMP said in addition to cash and debt it could finance the deal with as much as $25 million of common stock. • The transaction includes 10 new-vehicle franchised dealerships, a used-vehicle store and a commercial fleet operations center, said Alan
Jay Wildstein, CEO of the Alan Jay Automotive
Network. • “It’s just the right timing and they’re the right partner,” Wildstein told Automotive News about his decision to sell a majority stake in his business. He noted he’s looking forward to working with the LMP executive team. Source: Automotive News, September 13, 2021
Total Nonagricultural Employment
Total Private
Sebring MSA Industry Loca�on Quo�ents
Goods Producing
Service Producing
Private Service Providing
Government
0 0.2 0.4 0.6 0.8 1 1.2 1.4 1.6
Long Term Outlook for Sebring, FL December 2021 Forecast
2016 2017 2018 2019 2020 2021 2022 2023 2024
Personal Income (Billions $)
Total Personal Income Pct Chg Year Ago Wages and Salaries Nonwage Income Real Personal Income (12$) Pct Chg Year Ago Per Capita Income (Ths) Real Per Capita Income (12$) Average Annual Wage (Ths) Pct Chg Year Ago
3.3 3.4 3.5 3.6 4.0 4.3 4.2 4.3 4.5 2.9 4.8 0.9 5.6 8.7 8.2 -2.2 2.8 3.6 1.0 1.1 1.1 1.1 1.2 1.3 1.3 1.4 1.4 2.2 2.4 2.4 2.5 2.8 3.0 2.9 2.9 3.0 3.8 3.9 3.7 3.9 4.1 4.3 4.1 4.1 4.2 -0.3 2.4 -3.2 2.8 7.4 4.5 -4.9 1.0 1.6 33.0 34.2 34.4 36.0 39.2 42.5 41.6 42.8 44.2 38.1 38.6 37.3 38.1 40.9 42.8 40.8 41.2 41.8 40.4 41.4 41.8 43.4 46.2 49.4 50.7 51.8 53.8 0.8 2.5 0.8 3.9 6.5 7.0 2.5 2.3 3.9
Establishment Employment (Place of Work, Thousands, SA)
Total Employment 25.4 25.7 26.2 26.2 24.9 25.6 26.2 26.4 26.4 Pct Chg Year Ago 4.4 1.2 1.9 0.0 -5.1 2.8 2.7 0.8 -0.1
Manufacturing Pct Chg Year Ago Nonmanufacturing Pct Chg Year Ago Construction & Mining Pct Chg Year Ago Trade, Trans, & Utilities Pct Chg Year Ago
0.3 0.3 0.3 0.3 0.4 0.6 0.6 0.5 0.4 29.2 -2.0 -7.1 9.6 25.1 44.4 -4.6 -12.5 -13.6 25.1 25.4 25.9 25.9 24.4 25.0 25.7 25.9 26.0 4.2 1.3 2.0 -0.1 -5.5 2.1 2.8 1.1 0.2 1.7 1.7 1.8 1.8 1.8 1.7 1.7 1.7 1.7 7.9 1.4 4.3 1.6 -1.0 -3.5 2.1 -1.6 -1.5 5.6 5.6 5.8 5.7 5.6 5.6 5.5 5.4 5.2 2.7 0.2 2.8 -0.7 -3.0 1.6 -1.7 -2.3 -3.6
Wholesale Trade Retail Trade Trans, Wrhsng, & Util Information Pct Chg Year Ago 0.8 0.8 0.8 0.8 0.8 0.8 0.9 0.9 0.9 3.9 3.9 4.0 4.0 3.8 3.9 3.7 3.6 3.3 0.9 0.9 1.0 1.0 0.9 0.9 1.0 1.0 1.0 0.2 0.2 0.2 0.2 0.1 0.2 0.2 0.2 0.2 -0.9 3.9 2.5 -11.8 -7.5 30.7 -4.4 -5.3 -2.9
Financial Activities Pct Chg Year Ago Prof & Business Services Pct Chg Year Ago Educ & Health Services Pct Chg Year Ago Leisure & Hospitality Pct Chg Year Ago Other Services Pct Chg Year Ago Federal Government Pct Chg Year Ago State & Local Government Pct Chg Year Ago 0.8 0.8 0.9 0.9 0.9 0.9 1.0 1.0 1.0 2.5 1.7 3.6 6.7 -4.7 5.6 6.0 2.8 1.4 2.8 2.8 2.4 2.2 2.0 2.3 2.6 2.6 2.7 7.5 -0.1 -13.9 -8.7 -6.7 14.6 9.1 2.5 4.3 6.1 6.2 6.2 6.4 6.1 6.2 6.4 6.2 6.3 5.9 2.0 0.9 2.6 -4.1 0.1 3.4 -1.8 0.4 3.1 3.3 3.6 3.6 3.1 3.1 3.3 3.7 3.8 4.7 6.2 9.9 0.0 -14.3 0.5 3.9 13.1 3.0 0.6 0.7 0.7 0.7 0.6 0.6 0.7 0.7 0.7 -2.0 8.7 5.8 -1.5 -8.4 -5.1 10.5 2.1 0.3 0.3 0.3 0.3 0.3 0.3 0.3 0.3 0.3 0.3 3.4 -0.2 -2.4 6.7 9.1 -14.7 1.5 5.9 3.1 4.0 3.9 4.1 4.1 3.9 4.0 4.1 4.1 4.1 1.1 -2.7 5.5 -0.2 -5.1 3.8 2.8 0.3 -0.1
Other Economic Indicators
Population (Ths) Pct Chg Year Ago Labor Force (Ths) Pct Chg Year Ago Unemployment Rate (%) Total Housing Starts Single-Family Multifamily
99.1 100.2 100.5 101.2 101.1 100.9 100.7 100.5 100.9 1.3 1.0 0.3 0.7 -0.1 -0.2 -0.3 -0.1 0.3 35.8 36.4 36.4 35.8 34.7 35.8 36.8 36.8 36.9 1.0 1.5 0.2 -1.6 -3.3 3.3 2.6 0.1 0.2 6.6 5.7 5.0 4.8 7.8 6.1 5.5 5.1 5.2 152.4 156.3 197.2 228.9 312.8 460.7 416.4 398.6 377.6 152.4 156.3 197.2 228.9 312.8 462.4 415.4 353.0 324.3 0.0 0.0 0.0 0.0 0.0 -1.7 1.0 45.6 53.3


