FLORIDA’S HOUSING MARKET
Inventories depleted but rising, sales plummeting, and prices slipping in the last six months.
The November 2022 single-family home report released by Florida Realtors shows a market for existing housing that remains depleted of inventory: a shortage that was responsible for fueling rapid price appreciation over the previous two years. The median price has been pushed $142,200 above the peak price of the housing bubble in June 2006. The median sales price for single-family homes increased by $35,100 in November 2022, year-over-year, and now stands at $400,000—a year-over-year price appreciation of 9.6%. Price appreciation in the townhome/ condominium market continues as well, with an increase in the median sales price of $33,730 yearover-year, registering at $307,000 in November of this year. This price-increase represents a 12.3% increase in median prices year-over-year.
Inventories of single-family homes in November are up from 1.2 months of supply a year ago to 2.8 months of supply this year. This indicates an inventory balance that is still skewed heavily in favor of the sellers in the single-family market, according to the Florida Realtors report.1 From November 2021 to this November, inventories of condominiums rose from 1.5 months to 2.7 months, indicating that the condo market is also still tilted in the seller’s favor. Put another way, there are still severe shortages in both the existing single-family home and condo markets.
Distressed sales of single-family homes in the
1 According to Florida Realtors, the benchmark for a balanced market (favoring neither buyer nor seller) is 5.5 months of inventory. Numbers above that indicate a buyers’ market, numbers below a sellers’ market. Other real-estate economists suggest a 6-to-9-month inventory as being a balanced market.
form of short sales remain at very low levels despite the impact of the recession. They have decreased from 64 in November of 2021 to 16 in November of 2022, a decrease of 75.0%. Foreclosure/REO sales also continued to decline year-over-year by 17.2% versus November 2021. Traditional sales are down 38.2% year-over-year versus November 2021 as rapid price appreciation exacerbates affordability problems amid depleted inventories that are worsened by high mortgage rates. Distressed sales of condos in the form of short sales are still at very low levels in November 2022 (7). Foreclosure/REO sales are down from November 2021 (-35.3%). Traditional sales of condos are down 38.9% in November 2022 when compared to November 2021.
In November 2022, the percentage of closed sales of single-family homes that were cash transactions stood at 30.6%. For condos, that figure is much higher, as 54.0% of all closings were cash transactions. The condo market’s shares of cash transactions increased by 6.3% year-over-year, but the single-family home market share of cash transactions has declined 1.6%, which may indicate a decreasing role of cash investors in Florida’s single-family housing market. This is occurring amidst a sharp decline in mortgage availability. 2
Figure 1 depicts the monthly realtor sales of existing single-family homes, as well as the 12-month moving average of these sales. The smoother moving average line evens out the seasonality and other statistical noise in monthly housing market data. Sales have been on a strong upward path over the past few years, and the 12-month moving average and monthly sales have
2 The Mortgage Credit Availability Index (MCAI), put out by the Mortgage Bankers Association, fell by 0.1% to 103.3 in December from November 2022. The decrease in the index from November to December indicates that mortgage lending standards continue to tighten. The index is benchmarked to 100 in March 2012. Relative to that month, mortgages in December 2022 were only 3.3% more available. In 2006, the value of this same index approached 900 and at the start of 2020, the index was near 185. Despite rising mortgage rates, financing is not available to all comers.
F LORIDA S UMMAR y Institute for Economic Forecasting 7
greatly exceeded their peak value during the housing bubble. Sales growth coming out of the bottom has been on a stronger trend than the pre-bubble housing market, but over the past seven months, the 12-month moving average is declining sharply. This reflects decreasing affordability in the face of the rapid price appreciation over the past several years, the depleted inventory of houses for sale, tighter mortgage credit markets, and higher mortgage rates. The COVID-19 plunge in sales during April and May pulled down the moving average in 2020, but the immediate post-shutdown rebound was strong, fueled by pent-up demand and recordlow mortgage rates at the time.
The housing market in Florida is weakening under the burden of high prices and rising mortgage rates. Economic and job growth in Florida is forecasted to slow as the economy enters recession. More baby boomers continue to reach the end of their working lives, and this bodes well for continued population growth via the in-migration of retirees as well as job seekers to Florida. We expect this upward trend in sales to resume as increases in the supply of new housing coupled with the recession will reverse price appreciation in an environment with continuing strength in the demographic drivers of housing demand and despite higher mortgage rates.
Figure 2 displays median sales prices for existing single-family homes. Median sales prices continue to climb since bottoming out in 2011. The doubledigit pace of price increases in 2016 and 2017, which eased in 2018 and 2019, resumed in 2020. Over the past year, the 12-month moving average of median sales prices has risen by more than $60,000.
Low inventories of existing homes for sale and lagging housing starts growth since 2016 contributed to an environment where home prices rose at a rapid pace. The shortage in the singlefamily market will be partially ameliorated as high prices, due to the rapid appreciation of the past several years, have prompted sellers to get off the sidelines. However, the recession will result in a slowdown in housing starts. A tight housing market may be a persistent feature of Florida’s economy over the next several years.
This period of unsustainable multi-year price appreciation has ended. The recession, coupled with rising mortgage rates and a last-minute rush of sellers trying to get in before the market cools down, will bring an end to the spike in prices. This will likely lead to some price depreciation but not anything compared to the 2008-09 cycle.
Single-family housing starts in 2025 are expected to increase to nearly 153,000 after falling to 133,830 in 2023. This level is 38,400 fewer than the pre-pandemic level of starts.
FLORIDA SUMMAR y 8 Florida & Metro Forecast / Winter 2023
0 5,000 10,000 15,000 20,000 25,000 30,000 35,000 40,000 Florida
Realtor
Moving Average
Single-Family,
Exis
�ng Homes
Sales
Source: Florida Realtors
Figure 1. Single-Family Existing-Home Sales
GROSS STATE PRODUCT
Public health lockdowns caused a plunge in real Gross State Product (GSP) in 2020 of 1.6% year-over-year. This decline was smaller than both annual declines that occurred during the Great Recession (-3.9% in 2008 and -5.5% in 2009.) However, the second quarter’s year-overyear decline in 2020 was steeper than any quarter during the Great Recession. Fortunately, the COVID-19 recession, while deeper than the previous recessions, was also very short-lived at just two months. The next recession will be significantly longer.
During 2023-2026, Florida’s real GSP is expected to grow an average of just 0.6% annually. This growth will follow a 2023 contraction of 1.3%. This contraction was preceded by a sharp acceleration of growth in 2021 to 8.4% and followed by 3.4% growth in 2022. The 0.6% average growth from 2023 through 2026 will be a significantly slower pace for growth compared to the prior four years (when growth averaged 3.2%) thanks to the recession slowing growth to -1.3%
in 2023 and 0.3% in 2024. This projected average rate of growth for Florida’s economy over the next four years is slower than the average of our forecasted real GDP growth for the U.S. economy (1.1%) over the same time frame.
Housing prices have made extensive progress from the bottom of the housing crisis. During the crisis, median existing-home prices fell to a low of $122,200 but now stand at $400,000. This price appreciation has improved household balance sheets in Florida. With the price appreciation to date, Florida has more than recovered the aggregate housing value lost during the housing market collapse, but rougher housing waters and a decline in prices loom ahead for this market. Fortunately, they will not look remotely like the collapse of 2008-09.
In 2017, Florida’s economy broke the $1 trillion threshold with a nominal Gross State Product (GSP) of $1.002 trillion which increased to $1.226 trillion in 2021. Looking forward, GSP will reach $1.38 trillion in 2022, $1.42 trillion in 2023, $1.46 in 2024, $1.51 in 2025, and $1.57 in 2026.
Real GSP (adjusted for inflation) exceeded $1 trillion in 2021 and will climb to nearly $1.09 trillion in 2025.
PERSONAL INCOME, RETAIL SALES, AND AUTO SALES
Personal income growth surged to 6.1% (thanks to stimulus and unemployment payments offsetting the recession’s impact) in 2020 and 9.8% in 2021, amid additional federal stimulus spending and tax
FLORIDA SUMMAR y Institute for Economic Forecasting 9
$0 $50,000 $100,000 $150,000 $200,000 $250,000 $300,000 $350,000 $400,000 $450,000 Florida Single-Family, Exis�ng Homes Median Sales Price Moving Average
Figure
Source: Florida Realtors
2. Median Sales Price, Single-Family Existing Homes
credits. Real personal income contracted by 2.2% in 2022, but then rose by 0.3% in 2023, 1.4% in 2024, 3.2% in 2025, and 2.9% in 2026 as the recession and inflation get further in the rear-view mirror. Real personal income growth during 2023-2026 will average just 2.0% in Florida, weighed down by the recession and inflation in the near term.
Nominal personal income will be slightly below $1.67 trillion in 2025, marking an increase in personal income of nearly $943 billion from its Great Recession nadir in 2009. In 2018, real disposable income growth averaged 6.2% and 6.9% in 2019. Growth decelerated in 2020-21 before inflation turned growth negative at -5.3% in 2022. Average growth in Florida during 20232026 will be 3.0% with inflation slowing steadily, accompanied by still solid wage and salary growth, recession notwithstanding.
Financial markets experienced a strong rebound since the low point of the COVID-19 financial crisis, thanks in large part to the Federal Reserve Bank’s resumption of zero-interest-rate policy, quantitative easing, and other federal stimulus programs. The Dow Jones Industrial Average fell to 18,214 in March of 2020 but then surged to a new record high of 36,953 in January 2022. The impending recession and additional headwinds as the Fed continues to pursue tightening of monetary policy have financial markets falling significantly from those highs, with the likelihood of more room to fall as both the Fed and the economy continue down this path.
Home equity in Florida did not recover as rapidly as financial asset wealth during the 2007-2009 recession, but housing prices have been climbing over the past five years and median prices have significantly exceeded the highs of the housing bubble. The housing market did not suffer the pandemic pain that financial markets experienced during the COVID-19 recession nor will it during
this recession. Home prices will continue to fall as this recession plays itself out, but nothing close to the carnage of the housing bubble’s collapse.
Unlike the recovery that followed the Great Recession, the housing market will not be an albatross around the neck of Florida’s economy during that recovery. Housing may not be a large driver of the economy for the next few years. However, housing will still be an important economic driver as builders work to replenish stilldepleted inventories.
Retail spending was hurt by the public health shutdowns and the effective collapse of the tourism industry in Florida from the pandemic response. Retail spending in the second quarter of 2020 contracted by 4.2% versus the same quarter in 2019. Spending levels began recovering after the short but deep recession and economic lockdowns, to fully counter the plunge and drive full-year growth into positive territory for the year. In 2021, retail sales grew robustly versus 2020, rising nearly 16.0% year over year. Sales came back down to earth from the post-lockdown growth, and after a few quarters of negative growth during the recession, growth will average 1.1% during 2023-2026.
Consumers began to purchase light vehicles at a faster pace after the Great Recession ended, releasing several years of pent-up demand, and continued to do so through 2016, though the pace slowed considerably by 2016. The 2020 recession once again caused a contraction of new passenger car and truck registrations of 9.6% for 2020 versus 2019. This contraction was not as pronounced nor as long-lasting as the one that took place during the Great Recession. Supply chain disruptions injected chaos into light vehicle markets, and prices for both new and used vehicles soared in the wake of these problems. New cars were selling for thousands above sticker price and used vehicle inflation hit 40%.
F LORIDA S UMMAR y 10 Florida & Metro Forecast / Winter 2023
Pent-up demand and the economic recovery boosted registrations coming out of the recession and vehicle registration growth in Florida surged in 2021 with growth rising to 9.3%. Registration growth in Florida during 2023-2026 will average -1.8%. Over this period, depleted inventories, along with very high prices, will lead to registrations contracting nearly 14.0% in 2022, then contracting again by 10.1% in 2023, rising by 1.5% in 2024 before contracting further by 1.3% in 2025 and rising 2.6% in 2026. In 2026, Florida’s new passenger car and truck registrations will be 1.05 million.
EMPLOYMENT
Business payrolls were decimated by COVID-19 lockdowns as layoffs happened in a massive, but thankfully short-lived, wave. Florida’s total business payrolls, however, surpassed their prepandemic levels late in 2021. The pace of Florida’s labor market recovery has exceeded the recovery of the national job market since the end of the lockdowns. The impending recession will change that.
Payroll job growth decelerated in 2017 to 2.2%, before it rose to 2.5% in 2018. Job growth eased to 2.1% in 2019 as Florida’s economy closed in on full employment.
Then came COVID-19 and the lockdowns, closures, and travel restrictions which were followed by federal spending policies and aggressive monetary policy to try and counter the disastrous effects of shutting down the economy.
Job growth plummeted in March and April, contributing to a 4.9% year-over-year contraction in 2020, but Florida’s decision to open the economy up and eschew further lockdowns caused job growth to roar back to 4.6% in 2021, accelerating to 5.2% in 2022.
In 2023, the effects of the recession will turn job growth negative. Total payroll jobs will contract by 0.8% in 2023, and again by 2.1% in 2024. Florida’s job growth will resume in the second half of 2024, and in 2025, job growth will be 0.5% rising to 1.1% in 2026. Florida’s labor market will slightly underperform the national economy until 2026.
Construction job growth turned negative in 2020 but accelerated in 2021 with housing starts rising amid depleted inventories and as large-scale public works projects carried on uninterrupted by the pandemic. Despite the episodic plateauing in new home construction growth and the COVID-19 shakeup, growth rates in housing starts over the forecast horizon supported construction job growth of 4.2% in 2019, before falling to -0.4% in 2020, and then recovering to 2.2% in 2021. Job growth rose to 3.0% in 2022, before the effect of any housing and economic recession. Once this recession kicks in, construction jobs will contract by 2.4% in 2023 and again by 4.5% in 2024, before job losses slow to 1.6% in 2025, and then turn positive to 0.3% in 2026. Average annual job growth during 2023-2026 will be -2.1%. Construction employment will average 545,159 in 2026—a level that is nearly 135,000 fewer jobs than the 2006 peak employment in the Construction sector.
The Professional and Business Services sector, one of the fastest-growing sectors coming out of the 2020 recession, is in for a slowdown as the recession looms. Job losses in this sector are expected to average 2.4% during 2023-2026. Growth in this sector decelerated to 2.1% in 2019, and then fell to -2.5% in 2020 because of the pandemic and lockdowns. Growth surged to 7.4% in 2021 and then slowed to 5.6% in 2022. It will plunge to -6.5% in 2023, and to -9.3% in 2024 before rebounding to 1.8% in 2025 and 4.4% in 2026. The Professional and Business Services sector is comprised principally of white-
F LORIDA S UMMAR y Institute for Economic Forecasting 11
collar, service-providing businesses. The sector includes accounting firms, financial management companies, advertising agencies, computer systems design firms, law firms, architectural and engineering companies, and temporary employment agencies. Job losses during the COVID-19 recession were heavily concentrated in employment services and other business support services as many businesses were forcibly closed and these will also be the areas hit most hard by the recession.
The Information sector is a mix of high-tech ventures, including computer programming and software development, but job growth in this sector has long been weighed down by traditional media, which has been decimated by structural and technological changes in the gathering and disseminating of information, and most importantly, who pays for it. Sources of growth within this sector in Florida, such as software development, data processing and hosting, wireless telecommunications, and content creation have offset the slowing but still lingering loss of jobs in traditional media and publishing. Job growth was flat in 2019, -6.1% in 2020, but recovered to 5.9% in 2021, and hit 7.3% in 2022—boosted by the continued roll-out of 5G wireless services. The recession will impact job growth as it will turn negative to -0.5% in 2023, then further to -1.2% in 2024, before rebounding to 1.6% in 2025, and then contracting by 0.6% in 2026. The projected growth path implies an average growth rate of -0.2% during 2023-2026.
The Education and Health Services sector in Florida grew consistently even during the worst part of the 2007-2009 Great Recession. However, the pandemic hit the sector hard, as most elective procedures, screenings, and early interventions were postponed, schools closed, and employment contracted by 2.4% in 2020. The state’s growing population with a larger share of older residents,
who have a higher demand for health services, has and will continue to support growth in this sector. Job growth will continue, though decelerate, through the recession. During 2023-2026, employment in this sector is expected to continue to expand at an average rate of 1.6%.
Manufacturing employment expanded in Florida at an average rate of 3.2% in 2019, one of the best growth rates in the past 18 years. During 20162019, job growth averaged 2.9% in Florida as the Trump administration pushed policies that helped level the playing field for U.S. manufacturers. The economic environment for the manufacturing sector is increasingly uncertain as recessions loom over the U.S. and other world economies. After job losses of 2.1% in manufacturing in 2020, the economy roared back to life. Job growth accelerated to 3.0% in 2021 and rose by 6.0% in 2022. After this burst, job growth will decelerate, and the sector will once again lose jobs from 2023 through 2026. Average job growth during 2023-2026 will come in at -2.8%.
The State and Local Government sector in Florida is enjoying higher revenues from increasing property values even as COVID-19 took only a brief chunk out of sales tax revenues, albeit much smaller than was being predicted in Tallahassee as revenue continues to exceed forecasts. As housing prices continued to soar during 2020-22, property tax revenues rose as well. Though prices are starting to slip, there will not be a repeat of the local government budget shortfalls which led to job losses in this sector that persisted for six years from 2009 through 2014. As Florida’s population and economy continue to grow, the demand for state and local government services will continue to grow as well. To meet this demand, growth in state and local government employment will be necessary but will not rise to the levels seen during the housing boom. Average job growth in State and Local Government during 2023-2026 will be
F LORIDA S UMMAR y 12 Florida & Metro Forecast / Winter 2023
1.3%, with annual growth rising to 1.7% in 2023 and decelerating thereafter. The recession will put some pressure on both sales tax and property tax revenues, but this should not result in any severe budgetary issues or layoffs in the sector.
Federal Government employment growth in Florida strengthened to 4.9% in 2020 because of the Decennial Census, with growth having turned negative during 2021 after the temporary hiring surge during the 2020 census year. However, historic deficits and a national debt of over $31.4 trillion will become a factor going forward. Average job growth in the Federal Government sector in Florida will average just 0.6% during 2023-2026.
UNEMPLOYMENT
The unemployment rate in Florida has fallen from its May 2020 peak of 14.2% and stands at 2.6% as of November 2022. When unemployment spiked to 14.2% in May of 2020, it was 2.9 percentage points higher than the peak level of unemployment from the Great Recession. This unprecedented surge in unemployment occurred over just three months, while it took two-and-a-half years for the unemployment rate to reach its peak in the Great Recession. The November unemployment rate is 0.9 percentage points lower than it was a year ago.
Nationally, and in Florida, the level of workers who are working part-time but not by choice, and workers marginally attached to the labor force— defined as workers who are neither working nor currently looking for work but indicate that they want and are available for a job and have looked for work in the past 12 months—spiked during the public health shutdowns. When adding these workers and discouraged workers—defined as workers who are currently not working and did
not look for a job in the four weeks preceding the Bureau of Labor Statistics’ monthly survey of households—to the headline unemployment figure, U-3, we get the broadest measure of unemployment estimated by the BLS, known as U-6.
Looking at U-6, we see a labor market that is still impacted by the trauma of public health measures. U-6 in Florida averaged 6.3% during the 4th quarter of 2021 through the 3rd quarter of 2022. Meanwhile, the national rate of U-6 averaged 7.1% during the same period. U-6 unemployment in Florida during the 4th quarter of 2021 through the 3rd quarter of 2022 was 65 percentage points below the rate in 2014, 9.7 points lower than the 16% rate in 2012, and down 13.0 percentage points from its peak average rate of 19.3% in 2010 (the nation’s U-6 averaged 16.7% in 2010). As the economy continues to recover and the COVID-19 pandemic abates, these numbers will stabilize in Florida, but they will begin climbing again because of the recession.
Analysis of how U-6 behaves relative to the headline unemployment rate (U-3) continues to provide important information necessary to fully understand the health of the labor market. The gap between these two measures continues to narrow. The average spread between U-6 and U-3 over the past year was hovering at 3.4 percentage points at the national level. That gap was the same at 3.3 percentage points in Florida.
F LORIDA S UMMAR y Institute for Economic Forecasting 13
FLORIDA TABLES 14 Florida & Metro Forecast / Winter 2023
2018 2019 2020 2021 2022 2023 2024 2025 2026 Personal Income (Bil. $) 1088.8 1165.1 1235.8 1356.3 1404.7 1455.4 1509.3 1590.4 1668.5 Florida.(%Ch Year ago) 6.3 7.0 6.1 9.8 3.6 3.6 3.7 5.4 4.9 U.S.(%Ch Year ago) 5.0 5.1 6.7 7.4 2.2 4.0 3.4 4.5 4.4 Personal Income (Bil. 2012$) 998.3 1060.5 1103.3 1160.9 1131.0 1134.8 1150.7 1187.9 1222.4 Florida.(%Ch Year ago) 4.7 6.2 4.0 5.2 -2.6 0.3 1.4 3.2 2.9 U.S.(%Ch Year ago) 2.8 3.6 5.5 3.3 -3.9 -0.2 1.0 2.9 2.9 Disp. Income (Bil. 2012$) 893.9 949.0 992.1 1026.8 972.2 996.5 1026.2 1061.5 1092.8 Florida.(%Ch Year ago) 6.3 6.2 4.5 3.5 -5.3 2.5 3.0 3.4 3.0 U.S.(%Ch Year ago) 3.3 3.5 6.2 1.9 -6.3 1.7 2.4 3.0 2.9 GSP (Bil. $) 1057.3 1111.4 1116.7 1255.6 1379.1 1418.2 1458.3 1511.6 1574.8 (%Ch Year ago) 5.4 5.1 0.5 12.4 9.8 2.8 2.8 3.7 4.2 GSP (Bil. 2012$) 941.6 965.7 950.2 1029.6 1064.6 1050.4 1053.9 1068.8 1089.2 (%Ch Year ago) 3.2 2.6 -1.6 8.4 3.4 -1.3 0.3 1.4 1.9 Employment 2.5 2.1 -4.9 4.6 5.2 -0.8 -2.1 0.5 1.1 Labor Force 1.3 1.5 -1.7 2.2 3.0 1.4 0.4 0.6 0.8 FL Unemployment Rate (%) 3.7 3.2 8.3 4.6 2.9 4.6 5.8 5.4 5.0 U.S. Unemployment Rate (%) 3.9 3.7 8.1 5.4 3.7 4.9 5.3 4.8 4.6 Total Nonfarm U.S. 1.6 1.3 -5.8 2.8 4.1 0.0 -0.3 0.7 0.5 Florida 2.5 2.1 -4.9 4.6 5.2 -0.8 -2.1 0.5 1.1 Mining 2.2 -1.6 -4.0 -1.2 -1.1 3.3 0.9 0.2 0.2 Construction 7.4 4.2 -0.4 2.2 3.0 -2.4 -4.5 -1.6 0.3 Manufacturing 2.6 3.2 -2.1 3.0 6.0 -1.9 -7.0 -2.3 -0.2 Nondurable Goods 1.2 2.8 -2.9 3.3 5.1 -1.9 -3.8 -1.5 -0.7 Durable Goods 3.2 3.4 -1.7 2.9 6.4 -1.8 -8.4 -2.7 0.1 Trans. Warehs. & Utility 2.4 1.5 -3.1 5.2 5.2 -2.3 -2.5 -0.5 0.1 Wholesale Trade 2.5 2.0 -2.6 3.4 7.5 1.1 1.4 0.7 0.6 Retail Trade 1.0 -0.5 -4.7 3.9 4.0 -4.5 -5.4 -1.3 -0.4 Financial Activities 2.3 2.9 0.2 4.7 5.5 0.8 1.9 1.1 0.6 Prof. and Business Services 2.8 2.1 -2.5 7.4 5.6 -6.5 -9.3 1.8 4.4 Edu & Health Services 2.3 2.9 -2.4 2.2 3.3 3.6 2.2 0.2 0.4 Leisure & Hospitality 2.4 2.4 -19.8 11.2 10.9 0.8 -2.2 1.5 1.3 Information 0.7 0.0 -6.1 5.9 7.3 -0.5 -1.2 1.4 -0.6 Federal Gov't. 0.6 2.4 4.9 -1.1 0.9 0.5 0.5 0.6 0.6 State & Local Gov't. 0.9 0.7 -2.8 -1.0 0.5 1.7 1.4 1.1 1.0 Population (ths) 21164.1 21390.9 21595.0 21803.1 22054.5 22314.8 22569.8 22817.3 23060.1 (%Ch Year ago) 1.2 1.1 1.0 1.0 1.2 1.2 1.1 1.1 1.1 Net Migration (ths) 57.2 55.3 56.6 68.1 67.5 65.1 63.6 61.8 60.9 (%Ch Year ago) -17.9 -3.4 2.3 20.4 -1.0 -3.5 -2.3 -2.9 -1.4 Housing Starts Tot. Private (ths) 130.6 146.3 156.7 191.3 192.3 133.8 134.8 149.9 152.9 Housing Starts Single Family (ths) 93.7 101.8 112.0 144.1 130.7 89.8 97.1 103.9 102.8 Housing Starts Multi-Family (ths) 36.9 44.5 44.7 47.2 61.6 44.0 37.6 46.0 50.1 (%Ch Year ago) 2.5 1.7 0.9 5.5 9.2 5.0 2.4 1.7 1.6 Consumer Prices Housing Population
Migration Nonfarm Employment (Payroll Survey % Change Year Ago) Employment and Labor Force (Household Survey % Change Year Ago) Personal Income and GSP
Table 1. Annual Summary of the University of Central Florida's Forecast for Florida
and
F LORIDA T ABLES Institute for Economic Forecasting 15
2023Q2 2023Q3 2023Q4 2024Q1 2024Q2 2024Q3 2024Q4 2025Q1 2025Q2 2025Q3 2025Q4 2026Q1 2026Q2 Personal Income (Bil. $) 1450.4 1457.0 1465.1 1482.6 1498.6 1518.2 1537.7 1560.5 1581.0 1600.7 1619.4 1638.8 1658.8 Florida.(%Ch Year ago) 0.1 0.5 0.6 1.2 1.1 1.3 1.3 1.5 1.3 1.2 1.2 1.2 1.2 U.S.(%Ch Year ago) 0.4 0.5 0.4 1.1 1.0 1.0 1.0 1.2 1.1 1.1 1.0 1.2 1.1 Personal Income (Bil. 2012$) 1134.9 1133.0 1132.3 1139.2 1146.2 1154.7 1162.8 1174.1 1183.7 1192.8 1200.9 1209.4 1218.4 Florida.(%Ch Year ago) -0.4 -0.2 -0.1 0.6 0.6 0.7 0.7 1.0 0.8 0.8 0.7 0.7 0.7 U.S.(%Ch Year ago) -0.3 -0.2 -0.3 0.5 0.6 0.6 0.6 0.9 0.7 0.7 0.7 0.8 0.7 Disp. Income (Bil. 2012$) 992.9 997.9 1003.1 1013.5 1022.1 1030.7 1038.4 1048.5 1057.8 1066.1 1073.6 1081.2 1089.3 Florida.(%Ch Year ago) 0.1 0.5 0.5 1.0 0.8 0.8 0.7 1.0 0.9 0.8 0.7 0.7 0.8 U.S.(%Ch Year ago) 0.1 0.4 0.2 0.9 0.8 0.6 0.6 0.9 0.8 0.7 0.7 0.8 0.7 GSP (Bil. $) 1413.5 1418.9 1428.4 1438.6 1451.9 1464.3 1478.4 1489.8 1504.5 1518.1 1534.0 1550.4 1567.6 (%Ch Year ago) 0.1 0.4 0.7 0.7 0.9 0.9 1.0 0.8 1.0 0.9 1.0 1.1 1.1 GSP (Bil. 2012$) 1050.1 1046.9 1047.4 1048.3 1052.1 1055.3 1059.9 1062.3 1066.7 1070.6 1075.7 1081.2 1087.2 (%Ch Year ago) -0.7 -0.3 0.0 0.1 0.4 0.3 0.4 0.2 0.4 0.4 0.5 0.5 0.6 Employment -1.1 -1.2 -0.9 -0.5 -0.1 0.1 0.1 0.1 0.2 0.2 0.3 0.3 0.3 Labor Force 0.2 0.1 0.1 0.0 0.1 0.1 0.1 0.1 0.2 0.2 0.2 0.2 0.2 FL Unemployment Rate (%) 4.3 5.1 5.6 5.8 5.8 5.7 5.7 5.6 5.5 5.4 5.2 5.1 5.0 U.S. Unemployment Rate (%) 4.7 5.3 5.7 5.6 5.4 5.2 5.0 4.9 4.8 4.8 4.7 4.6 4.6 Total Nonfarm U.S. -0.6 -0.6 -0.4 0.0 0.2 0.3 0.2 0.1 0.1 0.1 0.1 0.1 0.1 Florida -1.1 -1.2 -0.9 -0.5 -0.1 0.1 0.1 0.1 0.2 0.2 0.3 0.3 0.3 Mining 0.7 0.3 0.5 0.1 0.0 0.0 0.2 0.1 0.1 -0.1 -0.2 -0.2 0.3 Construction -1.9 -2.0 -0.8 -1.3 -1.2 -0.6 -0.3 -0.6 -0.2 -0.2 -0.1 0.1 0.3 Manufacturing -1.0 -2.4 -2.9 -1.9 -1.1 -1.2 -0.8 -0.4 -0.3 -0.3 -0.2 0.0 0.0 Nondurable Goods -0.6 -1.5 -1.5 -1.0 -0.7 -0.6 -0.4 -0.3 -0.2 -0.3 -0.2 -0.2 -0.2 Durable Goods -1.1 -2.7 -3.6 -2.3 -1.3 -1.5 -1.0 -0.5 -0.3 -0.3 -0.1 0.0 0.1 Trans. Warehs. & Utility -0.6 -1.7 -0.5 -0.5 -0.7 -0.1 -0.2 -0.2 0.0 0.1 -0.1 -0.1 0.1 Wholesale Trade -0.7 0.1 0.4 0.6 0.5 0.4 0.1 0.0 0.1 0.1 0.2 0.2 0.1 Retail Trade -0.7 -3.0 -1.2 -1.5 -1.6 -0.3 -0.4 -0.4 -0.2 0.1 -0.3 -0.3 0.0 Financial Activities -0.9 -0.1 0.7 0.8 0.7 0.4 0.3 0.4 0.1 -0.1 0.1 0.3 0.2 Prof. and Business Services -4.3 -4.9 -4.1 -2.2 -0.8 -0.2 0.1 0.7 0.8 1.0 1.1 1.1 1.1 Edu & Health Services 0.4 0.9 0.5 0.8 0.6 0.3 -0.1 0.0 -0.1 0.1 0.0 0.2 0.1 Leisure & Hospitality -0.6 -0.7 -1.5 -1.2 0.3 0.4 0.8 0.1 0.5 0.2 0.5 0.2 0.4 Information -1.1 -0.5 -1.4 -0.1 0.5 0.2 0.1 0.7 0.3 0.5 -0.3 -0.3 -0.4 Federal Gov't. 0.1 0.1 0.1 0.1 0.1 0.2 0.2 0.2 0.1 0.2 0.2 0.1 0.1 State & Local Gov't. 0.5 0.4 0.4 0.3 0.3 0.3 0.2 0.3 0.3 0.2 0.3 0.2 0.2 Population (ths) 22,282.4 22,347.3 22,411.9 22,475.6 22,538.7 22,601.4 22,663.7 22,725.5 22,787.1 22,848.1 22,908.4 22,968.8 23,029.4 (%Ch Year ago) 0.3 0.3 0.3 0.3 0.3 0.3 0.3 0.3 0.3 0.3 0.3 0.3 0.3 Net Migration (ths) 65.1 65.2 64.9 64.2 63.8 63.4 63.1 62.5 62.3 61.6 60.7 60.7 60.7 (%Ch Year ago) 0.0 0.1 -0.4 -1.1 -0.6 -0.7 -0.5 -0.9 -0.3 -1.2 -1.5 0.1 0.0 Housing Starts Tot. Private (ths) 133.9 127.4 124.2 127.0 131.0 136.9 144.0 147.6 150.1 150.5 151.5 153.1 154.8 Housing Starts Single Family (ths) 88.1 86.9 88.0 91.0 95.2 99.2 103.2 104.1 104.4 103.5 103.8 103.8 104.2 Housing Starts Multi-Family (ths) 45.8 40.4 36.2 36.0 35.8 37.7 40.9 43.5 45.7 47.0 47.7 49.3 50.6 (%Ch Year ago) 0.9 0.8 0.9 0.5 0.3 0.5 0.5 0.4 0.4 0.3 0.4 0.4 0.4 *Quarterly at an annual rate Housing Consumer Prices Personal Income and GSP Employment and Labor Force (Household Survey % Change Year Ago) Nonfarm Employment (Payroll Survey % Change Year Ago) Population and Migration
Table 2. Quarterly Summary of the University of Central Florida's Forecast for Florida*
*Quarterly at an annual rate
Florida Payroll Employment (Thousands)
F LORIDA T ABLES 16 Florida & Metro Forecast / Winter 2023
2023Q2 2023Q3 2023Q4 2024Q1 2024Q2 2024Q3 2024Q4 2025Q1 2025Q2 2025Q3 2025Q4 2026Q1 2026Q2 Total Nonfarm 9,357.0 9,241.6 9,159.5 9,114.5 9,105.3 9,111.2 9,118.7 9,130.8 9,147.9 9,168.8 9,191.7 9,215.2 9,244.7 Manufacturing 410.5 400.9 389.1 381.7 377.6 373.1 370.1 368.5 367.6 366.4 365.8 365.6 365.7 Durable Goods 283.3 275.5 265.6 259.4 256.1 252.3 249.9 248.6 248.0 247.1 246.8 246.8 247.1 Wood Products 12.7 11.1 10.0 9.5 9.4 9.3 9.4 9.7 10.0 10.4 10.7 11.0 11.4 Computer & Electronics 46.4 46.4 46.4 46.6 46.7 46.8 46.9 47.0 47.1 47.2 47.3 47.3 47.3 Transportation Equipment 53.1 51.0 48.4 46.9 46.3 45.6 44.7 43.8 43.0 42.2 41.3 40.7 40.4 Nondurables 127.2 125.3 123.5 122.3 121.5 120.7 120.2 119.9 119.6 119.2 119.0 118.8 118.6 Foods 35.9 35.7 35.5 35.5 35.4 35.3 35.3 35.3 35.3 35.4 35.4 35.4 35.5 Non-Manufacturing 8,946.5 8,840.7 8,770.4 8,732.8 8,727.7 8,738.1 8,748.6 8,762.3 8,780.3 8,802.4 8,826.0 8,849.6 8,879.0 Mining 5.5 5.5 5.5 5.5 5.5 5.5 5.5 5.5 5.5 5.5 5.5 5.5 5.5 Construction 582.4 571.0 566.6 559.5 552.9 549.7 548.2 544.9 544.1 542.7 542.2 542.5 544.3 Trans. Warehs. & Utility 1,907.2 1,874.7 1,865.9 1,856.1 1,843.2 1,841.9 1,838.2 1,835.2 1,834.3 1,836.8 1,835.9 1,834.1 1,835.3 Wholesale Trade 384.9 385.3 387.0 389.3 391.2 392.7 393.2 393.4 393.9 394.3 395.2 395.9 396.4 Retail Trade 1,106.6 1,073.9 1,061.1 1,045.6 1,028.5 1,025.8 1,021.6 1,017.9 1,016.0 1,017.5 1,014.5 1,011.5 1,011.3 Information 148.3 147.7 145.5 145.4 146.2 146.4 146.6 147.5 148.0 148.7 148.3 147.9 147.3 Prof. & Bus. Services 1,470.4 1,397.8 1,340.6 1,311.0 1,300.4 1,298.0 1,299.1 1,308.0 1,317.9 1,330.9 1,345.5 1,359.9 1,374.2 Admin. & Support 705.3 699.7 694.7 689.7 685.4 682.3 679.4 680.9 681.5 683.3 685.2 686.4 689.6 Prof. Sci & Tech 125.8 126.3 127.0 128.4 129.8 130.0 130.2 130.4 130.4 130.3 130.2 130.0 129.8 Mgmt. of Co. 639.3 571.8 518.9 492.9 485.3 485.7 489.4 496.7 506.0 517.2 530.0 543.4 554.9 Financial Activities 658.4 657.9 662.6 667.6 672.4 675.2 677.5 680.0 680.7 680.2 680.5 682.6 684.1 Real Estate & Rent 453.5 454.2 458.5 462.4 465.8 467.6 469.0 470.8 471.5 471.2 471.7 473.3 474.2 Fin. & Insurance 204.9 203.7 204.1 205.2 206.6 207.6 208.5 209.2 209.3 209.0 208.8 209.2 209.9 Edu. & Health Service 1,428.6 1,441.7 1,448.2 1,459.2 1,468.4 1,472.2 1,470.4 1,470.8 1,469.3 1,470.4 1,470.9 1,474.4 1,476.0 Education Services 191.3 194.1 196.7 198.8 200.0 200.5 200.5 200.5 200.3 200.6 200.8 201.5 201.9 Health Services 1,237.3 1,247.6 1,251.6 1,260.4 1,268.5 1,271.7 1,269.9 1,270.3 1,269.0 1,269.8 1,270.0 1,272.8 1,274.1 Leisure & Hospitality 1,262.0 1,253.0 1,234.7 1,220.2 1,223.8 1,228.2 1,237.6 1,238.8 1,244.4 1,247.4 1,253.5 1,255.4 1,261.0 Other Services 369.7 373.2 378.3 382.7 386.1 388.8 391.0 393.4 394.9 396.1 397.2 398.4 399.7 Government 1,114.0 1,118.1 1,122.5 1,125.8 1,128.8 1,132.2 1,134.7 1,138.2 1,141.2 1,143.6 1,146.5 1,149.0 1,151.6 Federal Gov't. 150.3 150.4 150.5 150.7 150.9 151.2 151.5 151.7 151.9 152.1 152.4 152.6 152.8 State & Local Gov't 963.8 967.7 972.0 975.1 977.8 981.0 983.2 986.5 989.3 991.5 994.2 996.4 998.8
Table 3. Employment Quarterly*
Table 4. Employment Annual
Florida Payroll Employment (Thousands)
F LORIDA T ABLES Institute for Economic Forecasting 17
2018 2019 2020 2021 2022 2023 2024 2025 2026 Total Nonfarm 8,781.0 8,964.7 8,523.7 8915.37 9,374.8 9,303.6 9,112.4 9,159.8 9,261.4 Manufacturing 372.9 384.8 376.8 388.1 411.4 403.7 375.6 367.0 366.5 Durable Goods 254.5 263.0 258.5 265.9 282.9 277.7 254.4 247.6 247.9 Wood Products 14.4 14.0 13.9 14.2 15.0 12.0 9.4 10.2 11.7 Computer & Electronics 41.9 44.0 44.3 44.4 45.7 46.4 46.7 47.2 47.3 Transportation Equipment 44.9 47.8 48.3 50.4 54.6 51.8 45.9 42.6 40.7 Nondurables 118.4 121.8 118.3 122.2 128.4 126.0 121.2 119.4 118.6 Foods 32.8 34.2 33.4 34.2 36.0 35.8 35.4 35.3 35.5 Non-Manufacturing 8,408.0 8,579.8 8,146.8 8,527.3 8,963.5 8,899.9 8,736.8 8,792.8 8,895.0 Mining 5.7 5.6 5.4 5.4 5.3 5.5 5.5 5.5 5.5 Construction 542.8 565.4 563.1 575.6 592.7 578.4 552.5 543.5 545.2 Trans. Warehs. & Utility 1,779.9 1,805.7 1,750.1 1,840.3 1,935.4 1,891.7 1,844.8 1,835.6 1,837.3 Wholesale Trade 345.7 352.7 343.6 355.3 381.9 386.2 391.6 394.2 396.5 Retail Trade 1,114.0 1,108.4 1,055.8 1,096.9 1,140.5 1,088.9 1,030.4 1,016.5 1,012.9 Information 139.5 139.4 130.9 138.6 148.6 147.9 146.1 148.1 147.2 Prof. & Bus. Services 1,361.8 1,390.6 1,356.0 1,455.7 1,536.7 1,436.4 1,302.1 1,325.5 1,383.6 Admin. & Support 570.4 594.7 602.0 655.3 702.9 703.5 684.2 682.7 691.7 Prof. Sci & Tech 108.7 115.0 110.6 115.0 122.0 126.2 129.6 130.3 129.7 Mgmt. of Co. 682.6 680.9 643.3 685.4 711.9 606.7 488.3 512.5 562.2 Financial Activities 575.8 592.6 593.8 621.8 655.9 660.9 673.2 680.4 684.2 Real Estate & Rent 387.3 396.4 406.6 425.5 448.6 455.8 466.2 471.3 474.2 Fin. & Insurance 188.5 196.2 187.2 196.3 207.3 205.1 207.0 209.1 209.9 Edu. & Health Service 1,305.1 1,343.3 1,311.2 1,340.3 1,385.2 1,435.5 1,467.5 1,470.3 1,476.5 Education Services 168.1 173.0 164.5 173.0 184.4 193.5 199.9 200.5 202.0 Health Services 1,136.9 1,170.3 1,146.7 1,167.2 1,200.8 1,242.0 1,267.6 1,269.8 1,274.4 Leisure & Hospitality 1,229.4 1,259.0 1,009.9 1,122.7 1,245.4 1,254.8 1,227.4 1,246.0 1,262.7 Other Services 353.1 353.3 322.6 334.0 359.0 372.8 387.2 395.4 400.0 Government 1,115.0 1,124.9 1,104.0 1,093.1 1,099.3 1,116.0 1,130.4 1,142.4 1,152.9 Federal Gov't. 139.6 142.9 149.9 148.2 149.6 150.3 151.1 152.0 152.9 State & Local Gov't 975.4 982.0 954.1 944.9 949.7 965.7 979.3 990.4 1,000.0
Table 5. Personal Income-Quarterly*
Billions Current Dollars
Billions 2012 $
F LORIDA T ABLES 18 Florida & Metro Forecast / Winter 2023
2023Q2 2023Q3 2023Q4 2024Q1 2024Q2 2024Q3 2024Q4 2025Q1 2025Q2 2025Q3 2025Q4 2026Q1 2026Q2 Personal Income 1450.4 1457.0 1465.1 1482.6 1498.6 1518.2 1537.7 1560.5 1581.0 1600.7 1619.4 1638.8 1658.8 Wages & Salaries 653.2 651.4 651.8 655.7 661.5 668.4 674.3 680.6 687.3 694.4 701.9 710.0 718.3 Other Labor Income 124.5 124.4 124.6 125.3 126.2 127.3 128.3 129.8 131.1 132.8 134.2 136.1 137.4 Nonfarm 73.8 76.0 77.1 77.5 78.2 78.9 79.7 80.1 80.9 82.0 83.0 84.0 85.3 Farm 3.8 3.7 3.7 3.7 3.7 3.6 3.5 3.5 3.5 3.4 3.4 3.3 3.3 Property Income 411.7 414.6 417.4 423.7 430.1 438.7 447.8 458.1 466.8 473.6 480.1 486.1 492.2 Transfer Payments 279.2 282.5 286.3 293.3 296.3 299.3 302.9 308.5 312.5 316.6 319.9 324.1 328.2 Social Insurance 99.7 99.6 99.8 100.8 101.5 102.3 103.0 104.4 105.3 106.3 107.4 109.0 110.1 Personal Income 1134.9 1133.0 1132.3 1139.2 1146.2 1154.7 1162.8 1174.1 1183.7 1192.8 1200.9 1209.4 1218.4 Wages & Salaries 511.1 506.6 503.8 503.8 505.9 508.4 509.9 512.1 514.6 517.4 520.5 523.9 527.6 Other Labor Income 97.4 96.8 96.3 96.3 96.5 96.8 97.0 97.7 98.2 98.9 99.5 100.5 100.9 Nonfarm 57.8 59.1 59.6 59.6 59.8 60.0 60.3 60.3 60.6 61.1 61.6 62.0 62.6 Farm 2.9 2.8 2.8 2.8 2.9 2.7 2.7 2.6 2.6 2.6 2.5 2.5 2.4 Property Income 322.1 322.4 322.6 325.6 329.0 333.7 338.6 344.7 349.5 352.9 356.1 358.7 361.5 Transfer Payments 218.4 219.7 221.2 225.4 226.6 227.7 229.0 232.1 234.0 235.9 237.2 239.2 241.0 Social Insurance 78.0 77.5 77.1 77.4 77.6 77.8 77.9 78.5 78.9 79.2 79.6 80.4 80.9 New Passenger Car & Truck Registrations 1022.9 1028.0 1029.3 1034.6 1042.3 1045.6 1041.4 1033.1 1027.2 1024.7 1024.2 1029.9 1044.0 Retail Sales (Billions $) 479.8 478.9 479.9 480.0 479.6 481.5 484.3 486.7 489.7 492.9 496.6 499.7 502.9 Real Retail Sales (Billions 2012$) 375.4 372.4 370.9 368.8 366.8 366.2 366.2 366.2 366.6 367.3 368.2 368.7 369.3
at an annual rate
*Quarterly
Billions Current Dollars
F LORIDA T ABLES Institute for Economic Forecasting 19
2018 2019 2020 2021 2022 2023 2024 2025 2026 Personal Income 1088.8 1165.1 1235.8 1356.3 1404.7 1455.4 1509.3 1590.4 1668.5 Wages & Salaries 473.1 499.7 511.5 576.5 642.4 652.8 665.0 691.0 722.4 Other Labor Income 101.5 106.7 106.1 114.5 122.7 124.5 126.8 132.0 138.2 Nonfarm 63.7 65.2 68.0 73.1 72.0 75.2 78.6 81.5 86.0 Farm 1.0 1.0 0.6 0.3 2.1 3.8 3.6 3.5 3.3 Property Income 314.6 349.7 352.2 364.8 388.5 413.0 435.1 469.7 494.7 Transfer Payments 205.2 218.1 274.9 311.1 270.0 281.8 297.9 314.4 330.3 Social Insurance 73.8 78.9 81.1 87.8 96.9 99.7 101.9 105.9 110.7 Personal Income 998.3 1060.5 1103.3 1160.9 1131.0 1134.8 1150.7 1187.9 1222.4 Wages & Salaries 433.8 454.8 456.6 493.0 517.2 509.0 507.0 516.1 529.3 Other Labor Income 93.1 97.2 94.7 98.0 98.8 97.1 96.7 98.6 101.3 Nonfarm 58.4 59.3 60.7 62.6 58.0 58.6 59.9 60.9 63.0 Farm 0.9 0.9 0.5 0.3 1.7 2.9 2.8 2.6 2.4 Property Income 288.5 318.3 314.4 312.1 312.8 322.0 331.7 350.8 362.4 Transfer Payments 188.1 198.5 245.5 266.9 217.4 219.7 227.2 234.8 242.0 Social Insurance 67.7 71.8 72.4 75.1 78.1 77.7 77.7 79.1 81.1 New Passenger Car & Truck Registrations 1339.1 1340.7 1212.5 1325.9 1141.0 1025.8 1041.0 1027.3 1053.9 Retail Sales (Billions $) 358.1 367.5 375.1 446.6 481.5 480.4 481.3 491.5 504.2 Real Retail Sales (Billions 2012$) 328.4 334.5 334.8 382.0 387.7 374.6 367.0 367.1 369.4
Table 6. Personal Income-Annual
Billions 2012 $
F lo r id a & U.S . Un em p lo ym en t Rate (pe rc e nt)
Co n str
ctio
F lo r id a Co n su mer P r ice I n d ex (percent change)
F lo r id a Ed u catio n & Health S er v ices Emp lo ymen t
F lo r id a F ed er al Go v er n men t Emp lo ymen t
F lo r id a F in an cial Activ ities Emp lo ymen t
F LORIDA C HARTS 20 Florida & Metro Forecast / Winter 2023 2 4 6 8 10 12 14 2008 2010 2012 2014 2016 2018 2020 2022 2024 2026 U S Une
mployme nt
mployme nt Florida Une
320 360 400 440 480 520 560 600 640 680 2008 2010 2012 2014 2016 2018 2020 2022 2024 2026 F lo r
a
u
n
lo ymen t (thousands) -2 -1 0 1 2 3 4 5 6 2008 2010 2012 2014 2016 2018 2020 2022 2024 2026
id
Emp
900 1,000 1,100 1,200 1,300 1,400 1,500 2008 2010 2012 2014 2016 2018 2020 2022 2024 2026
(thousands) 125 130 135 140 145 150 155 160 2008 2010 2012 2014 2016 2018 2020 2022 2024 2026
(thousands) 440 480 520 560 600 640 680 720 2008 2010 2012 2014 2016 2018 2020 2022 2024 2026
(thousands)
F lo r id a Real Gr o ss S tate P r o d u ct
F lo r id a Ho u sin g S tar ts
F lo r id a I n f o r matio n Emp lo ymen t
F lo r id a Leisu r e & Ho sp itality Emp lo ymen t
F lo r id a Man u f actu r in g Emp lo ymen t
New Car & Ligh t Tr u ck Registr atio n s
F LORIDA C HARTS -8 -4 0 4 8 12 16 2008 2010 2012 2014 2016 2018 2020 2022 2024 2026
(percent change) 0 40 80 120 160 200 240 2008 2010 2012 2014 2016 2018 2020 2022 2024 2026
(hundreds) 125 130 135 140 145 150 155 160 165 2008 2010 2012 2014 2016 2018 2020 2022 2024 2026
(thousands) 700 800 900 1,000 1,100 1,200 1,300 2008 2010 2012 2014 2016 2018 2020 2022 2024 2026
(thousands) 300 320 340 360 380 400 420 2008 2010 2012 2014 2016 2018 2020 2022 2024 2026
(thousands) -50 -40 -30 -20 -10 0 10 20 30 2008 2010 2012 2014 2016 2018 2020 2022 2024 2026
(percent change)
F lo r id a P er so n al I n co me (percent change)
F lo r id a P r o f essio n al & Bu sin ess S er v ices Emp lo ymen t
Flo rid a Real Gro ss State Pro d u ct
F lo r id a S tate & Lo cal Go v er n men t Emp lo ymen
F lo r id a Tr ad e, Tr an sp o r tatio n & Utilities Emp lo ymen t
F LORIDA C HARTS 22 Florida & Metro Forecast / Winter 2023 -10 -5 0 5 10 15 20 2008 2010 2012 2014 2016 2018 2020 2022 2024 2026
18,000 19,000 20,000 21,000 22,000 23,000 24,000 2008 2010 2012 2014 2016 2018 2020 2022 2024 2026 Flo r id a Po p u latio n (thousands) 900 1,000 1,100 1,200 1,300 1,400 1,500 1,600 2008 2010 2012 2014 2016 2018 2020 2022 2024 2026
(thousands) 750,000 800,000 850,000 900,000 950,000 1,000,000 1,050,000 1,100,000 2008 2010 2012 2014 2016 2018 2020 2022 2024 2026
($ millions 2009) 940 950 960 970 980 990 1,000 1,010 2008 2010 2012 2014 2016 2018 2020 2022 2024 2026
(thousands) 1,400 1,500 1,600 1,700 1,800 1,900 2,000 2008 2010 2012 2014 2016 2018 2020 2022 2024 2026
(thousands)
t
Ian deals blow to Florida’s teetering insurance sector
• For many Floridians whose homes were destroyed, they now face the arduous task of rebuilding without insurance or paying even steeper prices in an insurance market that was already struggling. Wind and storm-surge losses from the hurricane could reach between $28 billion and $47 billion, making it Florida’s costliest storm since Hurricane Andrew in 1992.
• Even before Hurricane Ian, the annual cost of an average Florida homeowners insurance policy was expected to reach $4,231 in 2022, nearly three times the U.S. average of $1,544. About 12% of Florida homeowners don’t have property insurance — or more than double the U.S. average of 5%.
• As of July, 27 Florida insurers were on a state watchlist for their precarious financial situation; Mark Friedlander, the head of communications for the Insurance Information Institute, expects Hurricane Ian will cause at least some of those to tip into insolvency.
Source: AP News, October 5, 2022
Governor Ron DeSantis announces nearly $5 million for infrastructure in rural northwest Florida communities
• Today, Governor Ron DeSantis announced $4.9 million in infrastructure investments to eight rural Northwest Florida communities through the Rural Infrastructure Fund (RIF) program.
• Awards include upgrading water and wastewater utilities, constructing public roadways, and public building renovations.
• In 2022, the Legislature appropriated $30 million for eligible communities under the RIF program to assist in economic development projects in rural communities, of which $5 million is specifically for local governments in Calhoun, Gadsden, Holmes, Jackson, Liberty, and Washington counties and all municipalities within their boundaries.
Source: FL Gov, October 27, 2022
Florida ranks #1 in the nation for attracting and developing skilled workforce
• Florida’s focus on training workers with the technical skills and credentials is paying off as the Sunshine State has been named number one in the U.S. for attracting and developing a skilled
F LORIDA C HARTS
2 4 6 8 10 12 14 2008 2010 2012 2014 2016 2018 2020 2022 2024 2026 F lo r id a Un emp lo ymen t Rate (percent) 7,000 7,500 8,000 8,500 9,000 9,500 10,000 2008 2010 2012 2014 2016 2018 2020 2022 2024 2026 Flo r id a Payr o ll Emp lo ymen t (thousands)
FLORIDA NEWS SUMMARIES
workforce, as a part of Lightcast’s 2022 Talent Attraction Scoreboard.
• Florida led the nation’s states in talent attraction with fifteen large counties in the top 50, led by Hillsborough County (#8), Polk (#10), Lee (#12), St Johns (#18), and Pasco (#20).
• Florida also led all states in net migration, adding more than 388,000 residents between 2016-20, more than double that of Texas, the next highest. Lee, Pasco, and Polk counties are among the top ten large counties nationally in net migration.
Source: FL Gov, November 8, 2022
Florida’s November consumer sentiment defies national figures, rises despite inflation
• Consumer sentiment among Floridians increased in November to 64.7, up 1.8 points from a revised figure of 62.9 in October. However, national sentiment decreased by over three points.
• Opinions as to whether now is a good time to buy a major household item like an appliance increased by 3.7 points from 50.1 to 53.8, the greatest increase of any reading this month.
• Outlooks about expected economic conditions were also positive. Expectations of personal finances a year from now increased slightly by one-tenth of a point, Expectations about U.S. economic conditions over the next year increased 2.5 points, and views of U.S. economic conditions over the next five years increased by nine-tenths of a point.
Source: University of Florida News, November 28, 2022
Florida Senate passes property insurance overhaul
• The Florida Senate on Tuesday approved sweeping legislation that would overhaul the state’s property insurance system, which has struggled due to insolvencies, high costs, and major storms.
• The bill would create a $1 billion reinsurance fund, reduce litigation costs and compel some customers to leave a state-created insurer. It also would force insurers to respond more promptly
to claims and increase state oversight of insurers’ conduct following hurricanes.
• The insurance industry has seen two straight years of net underwriting losses exceeding $1 billion, which it blames in part on excessive litigation. The legislation would remove “oneway” attorney fees for property insurance, which require property insurers to pay the attorney fees of policyholders who successfully sue over claims while shielding policyholders from paying insurers’ attorney fees when they lose. Attorneys groups argue that this will hurt policyholders who don’t frivolously sue but do so as a last resort.
Source: AP News, December 13, 2022
Florida is the fastest-growing state in the nation, Census estimates show
• The Sunshine State had the fastest-growing population in the country last year — the first time the state has taken the top spot since 1957, according to U.S. Census Bureau estimates released last week. The nation’s third-largest state grew by 1.9% from July 2021 to July 2022 — netting over 400,000 new residents to reach an estimated population of 22,244,823.
• Florida’s population growth is typically driven by more people moving to the state than leaving. The state’s natural change — calculated as births minus deaths — is usually flat.
• Most people moving to Florida last year were older U.S. adults at or near retirement age, said UF demographer Stefan Rayer. Florida already has one of the oldest populations in the nation, and the influx of older adults only exacerbates the state’s age imbalance.
Source: Tampa Bay Times, December 28, 2022
F LORIDA N EWS S UMMARIES 24 Florida & Metro Forecast / Winter 2023
PROFILES
The Cape Coral MSA is comprised of Lee County. It is in the southwest coast. It is known for its many canals having over 400 miles of canals. Cape Coral has the most extensive canal system of any city in the world and is the largest master-planned community in the U.S.
QUICK FACTS
• Metro population estimate of 737,468 as of 2019 (5-Year Estimate) (U.S. Census Bureau).
• Lee County population estimate of 737,468 as of 2019 (5-Year Estimate) (U.S. Census Bureau).
• Civilian labor force of 375,701 in November 2022 (Florida Research and Economic Database).
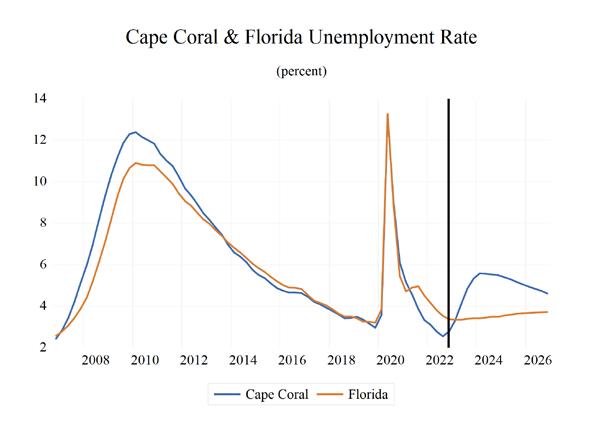
• An unemployment rate of 3.5% as of November 2022, not seasonally adjusted. This amounts to 13,200 unemployed people (Florida Research and Economic Database).
OUTLOOK SUMMARIES
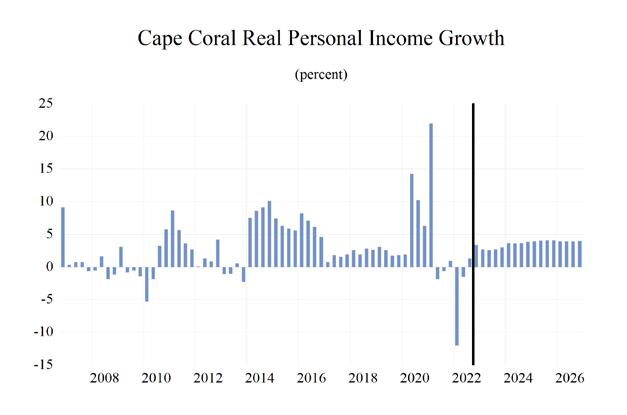
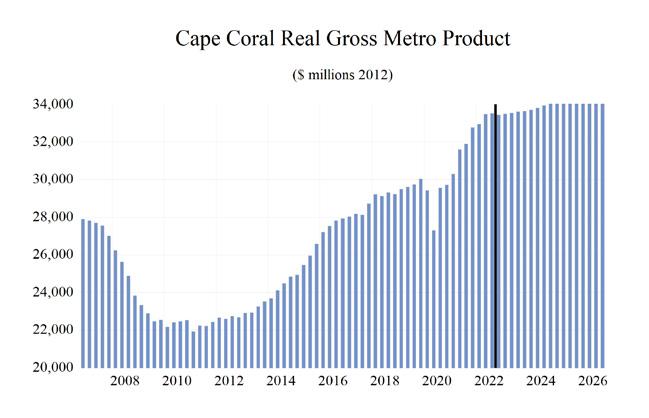
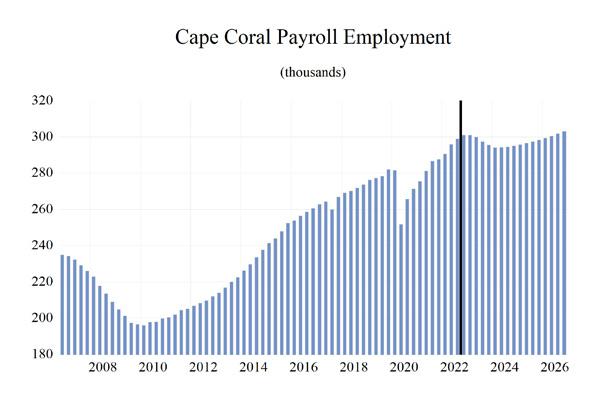
The studied economic indicators are predicted to show high levels of growth in the Cape Coral Metropolitan Statistical Area (MSA). Gross Metro Product for the MSA will come in at $34,289.01 million. The MSA will rank 3rd in personal income growth at 5.7 percent, and 9th in per capita income at $53,000. The average annual wage will grow at an annual rate of 3.6 percent to $67,700. Cape Coral’s population will grow at the 2nd highest rate, at an annual rate of 2.0 percent. Employment growth is expected to average 0.4 percent, the 2th highest, and Cape Coral will experience a relatively average unemployment rate in the state at 5.0 percent.
The Other Service sector will lead the MSA in average annual growth at 4.5 percent. The Leisure and Hospitality sector will follow at 2.2 percent. Its two lowest sectors in average annual growth, Construction and Mining along with Manufacturing, will see growth rates of -2.8% and -2.4%, respectively.
METRO NEWS SUMMARIES
Amazon no longer plans on building a facility in Fort Myers
• Amazon has canceled the construction of a new facility it had planned in Fort Myers. Mayor Kevin Anderson and City Councilman Fred Burson have confirmed that the deal is off.
• The mayor and Burson both said the city was all in on the facility because the warehouse would’ve created anywhere from 1,000-2,000 jobs, all with a starting salary of $18 an hour.
• The mayor said the door is still open to Amazon. “There’s a lot of other economic development going on in Lee County, so that would have been a nice boost, but it’s not going to, you know, shut us down or anything.”
Source: WINK, September 6, 2022
Hurricane Ian batters Fort Myers economy
• As the path of destruction of Hurricane Ian was revealed, the prolonged economic effects were just starting to be revealed.
• Normally the winter season is the busiest time for business in Southwest Florida due to the influx of snowbirds and toursits. The scenes of destruction in southwestern Florida however will keep many winter tourists and snowbirds away as well as tasking residents with rebuilding for months or more, said Michael Maguire, a manager for a group of family-owned restaurants, including a couple on hard-hit Fort Myers Beach.
• Lee County’s population is almost 788,000 people. It’s difficult to say exactly how much the population increases from snowbirds, but a substitute measurement — gross retail sales — historically jumps by almost a third during the height of the season in January compared to the dog days of late summer.
Source: WUFT, October 13, 2022
CAPE CORAL - FORT M y ERS Institute for Economic Forecasting 25
Local business owner creates mobile laundromat to help community
• After a story of a woman without clean clothes due to the destruction of Hurricane Ian, Rob Whyte, owner of Fort Myers brewing company, decided to help. He set up an old trailer with washers and dryers to help his community.
• In a facebook post, Whyte asked his fellow community members to help in donating washers and dryers to help in his efforts and soon he had enough appliances to make his idea a reality.
• Whyte says the community delivered, not just with appliances but with supplies as well, once he receives the last piece for the truck, he plans to drive through communities and offer his mobile washing unit.
Source: Fox 4, October 6, 2022
First business reopens on Fort Myers Beach after Hurricane Ian
• In November, Bywater Bistro became the first business to reopen on Fort Myers Beach following the destruction of Hurricane Ian.
• Bob Rommell is the co-owner of Bayfront Bistro, which saw extensive damage by Hurricane Ian. “You can see that water line right here. That’s how high Ian was, just about nine feet,” Rommel said. The restaurant held a grand opening event to commemorate the occasion after a lengthy rebuilding process.
• “We got the debris cleaned up; we have it repainted we have new equipment. If you look past the garbage on the water, you see water and you see sunshine,” Rommel said.
Source: WINK, November 11, 2022
Fort Myers Beach shrimping industry tries salvaging 43 boats after Hurricane Ian
• The Sept. 28 storm devastated the Fort Myers Beach shrimping industry. The two largest companies, Trico Shrimp Company and Erickson and Jensen, discovered in the storm’s aftermath all but one of their shrimping boats washed ashore from storm surge.
• Of the 43 shrimping boats grounded by the storm, only one has been placed back in the water during the seven weeks since. It took about six weeks for a barge and the necessary crane to arrive.
• “Every boat that gets in the water is a huge economic impact to the community. If one, two, three boats, four boats, each one is going to be a big impact,” said Joel Andrews of Erickson and Jensen
Source: Gulfshore Business, November 16, 2022
CAPE CORAL - FORT M y ERS 26 Florida & Metro Forecast / Winter 2023
Cape Coral-Ft. Myers MSA Industry Loca�on Quo�ents
CAPE CORAL - FORT M y ERS Institute for Economic Forecasting 27 0 0.2 0.4 0.6 0.8 1 1.2 1.4 1.6 1.8 2 Total Nonagricultural Employment Total Private Goods Producing Service Producing Private Service Providing Mining, Logging, and Construc�on Manufacturing Trade, Transporta�on, and U�li�es Wholesale Trade Retail Trade Transporta�on, Warehousing and U�li�es Informa�on Financial Ac�vi�es Professional and Business Services Educa�onal and Health Services Leisure and Hospitality Other Services Government
Long-Term Outlook for Cape Coral-Fort Myers, FL December 2022 Forecast
CAPE CORAL - FORT M y ERS 28 Florida & Metro Forecast / Winter 2023
2018 2019 2020 2021 2022 2023 2024 2025 2026 Personal Income (Billions $) Total Personal Income 39.5 42.4 45.3 49.6 51.4 54.2 56.9 60.6 64.1 Pct Chg Year Ago 5.2 7.4 7.0 9.3 3.7 5.5 5.0 6.5 5.8 Wages and Salaries 13.3 14.1 14.6 16.5 18.5 19.1 19.7 20.6 21.6 Nonwage Income 26.2 28.3 30.7 33.1 32.9 35.1 37.2 40.0 42.5 Real Personal Income (12$) 36.2 39.0 41.2 43.2 42.1 43.0 44.1 46.1 47.8 Pct Chg Year Ago 3.7 7.7 5.5 4.8 -2.5 2.2 2.6 4.4 3.8 Per Capita Income (Ths) 53.7 56.6 59.1 62.7 63.4 65.4 67.2 70.3 73.0 Real Per Capita Income (12$) 49.3 52.1 53.6 54.6 51.9 51.9 52.1 53.4 54.4 Average Annual Wage (Ths) 48.8 50.4 54.3 57.9 62.1 63.6 66.7 69.1 71.5 Pct Chg Year Ago 2.9 3.3 7.8 6.6 7.4 2.4 4.7 3.6 3.5 Establishment Employment (Place of Work, Thousands, SA) Total Employment 271.2 278.5 267.6 282.7 296.6 298.5 294.5 297.0 301.2 Pct Chg Year Ago 2.9 2.7 -3.9 5.7 4.9 0.6 -1.3 0.8 1.4 Manufacturing 6.3 6.5 6.4 7.1 7.4 7.3 6.8 6.6 6.7 Pct Chg Year Ago 6.1 2.8 -1.4 9.8 4.7 -0.7 -7.6 -2.3 0.8 Nonmanufacturing 264.9 272.0 261.1 275.7 289.2 291.1 287.7 290.3 294.5 Pct Chg Year Ago 2.9 2.7 -4.0 5.6 4.9 0.7 -1.2 0.9 1.4 Construction & Mining 30.7 32.6 32.7 34.3 35.3 35.1 33.1 31.9 31.5 Pct Chg Year Ago 11.6 6.2 0.2 4.8 3.0 -0.5 -5.9 -3.5 -1.1 Trade, Trans, & Utilities 54.1 54.8 53.5 56.0 58.8 58.3 56.7 56.5 56.8 Pct Chg Year Ago 0.8 1.2 -2.4 4.8 5.0 -0.9 -2.8 -0.2 0.5 Wholesale Trade 7.5 7.7 7.9 8.3 8.5 8.9 9.2 9.4 9.6 Retail Trade 41.4 41.3 39.5 41.5 43.6 42.4 40.2 39.8 39.9 Trans, Wrhsng, & Util 5.3 5.8 6.1 6.3 6.7 7.0 7.3 7.3 7.4 Information 2.8 2.8 2.9 3.0 3.1 3.1 3.0 3.0 3.0 Pct Chg Year Ago -1.1 1.8 0.8 6.5 2.0 -1.5 -2.2 0.8 -1.1 Financial Activities 13.6 14.0 13.5 14.2 15.7 16.7 16.9 16.9 16.8 Pct Chg Year Ago 1.7 3.3 -3.3 5.0 10.8 6.2 1.3 -0.3 -0.9 Prof & Business Services 37.2 37.6 36.6 40.2 42.0 39.9 37.2 38.4 40.5 Pct Chg Year Ago 4.6 1.2 -2.7 9.8 4.3 -4.9 -6.9 3.4 5.4 Educ & Health Services 30.1 31.4 30.7 32.0 34.7 36.9 37.6 37.3 37.0 Pct Chg Year Ago 3.2 4.2 -2.4 4.3 8.5 6.3 1.9 -0.7 -0.7 Leisure & Hospitality 41.9 43.6 37.1 41.1 42.7 41.9 42.9 44.7 46.5 Pct Chg Year Ago 1.9 4.1 -14.9 10.8 3.8 -1.7 2.2 4.3 4.0 Other Services 11.6 11.7 10.8 11.4 12.1 12.8 13.6 14.1 14.5 Pct Chg Year Ago -0.8 0.7 -7.2 5.1 6.8 5.8 6.0 4.0 2.5 Federal Government 2.4 2.4 2.6 2.4 2.4 2.4 2.4 2.5 2.5 Pct Chg Year Ago -2.4 1.1 7.9 -7.4 0.7 2.0 -0.2 1.1 1.3 State & Local Government 40.5 41.1 40.8 41.1 42.4 43.9 44.4 44.9 45.3 Pct Chg Year Ago 0.7 1.4 -0.7 0.7 3.1 3.7 1.2 1.1 0.9 Other Economic Indicators Population (Ths) 734.6 749.5 767.8 790.3 810.7 828.5 846.6 862.7 878.0 Pct Chg Year Ago 1.7 2.0 2.5 2.9 2.6 2.2 2.2 1.9 1.8 Labor Force (Ths) 338.7 346.0 345.1 357.0 368.0 376.7 377.8 379.6 381.9 Percent Change, Year Ago 1.8 2.2 -0.3 3.5 3.1 2.4 0.3 0.5 0.6 Unemployment Rate (%) 3.6 3.2 8.0 4.2 2.8 4.4 5.5 5.2 4.8 Total Housing Starts 7972.6 8107.5 10752.6 12011.2 12745.4 8695.7 8509.6 9583.5 9752.9 Single-Family 5574.3 5786.4 6640.3 10673.7 9836.4 6112.1 5665.8 5944.7 5808.0 Multifamily 2398.3 2321.1 4112.3 1337.5 2909.0 2583.6 2843.8 3638.9 3944.9
Short-Term Outlook for Cape Coral-Fort Myers, FL December 2022 Forecast
CAPE CORAL - FORT M y ERS Institute for Economic Forecasting 29
2022:4 2023:1 2023:2 2023:3 2023:4 2024:1 2024:2 2024:3 2024:4 2025:1 2025:2 2025:3 2025:4 Personal Income (Billions $) Total Personal Income 52.8 53.6 53.9 54.4 55.0 55.7 56.4 57.3 58.2 59.3 60.2 61.1 62.0 Pct Chg Year Ago 7.5 7.7 5.6 4.8 4.1 4.0 4.6 5.3 6.0 6.3 6.7 6.7 6.4 Wages and Salaries 19.0 19.0 19.1 19.1 19.2 19.4 19.6 19.9 20.1 20.3 20.5 20.7 21.0 Nonwage Income 33.8 34.6 34.8 35.3 35.8 36.4 36.8 37.4 38.2 39.0 39.7 40.4 41.0 Real Personal Income (12$) 42.5 42.9 42.9 43.0 43.2 43.6 43.9 44.3 44.8 45.4 45.8 46.3 46.7 Pct Chg Year Ago 1.6 2.9 2.3 1.9 1.6 1.6 2.3 3.0 3.7 4.1 4.5 4.5 4.3 Per Capita Income (Ths) 64.6 65.2 65.3 65.5 65.8 66.3 66.8 67.5 68.3 69.2 69.9 70.7 71.3 Real Per Capita Income (12$) 52.0 52.2 52.0 51.8 51.7 51.8 52.0 52.2 52.5 52.9 53.3 53.6 53.8 Average Annual Wage (Ths) 62.7 62.8 63.3 63.8 64.7 65.5 66.3 67.1 67.7 68.3 68.8 69.3 69.9 Pct Chg Year Ago 3.5 2.7 1.8 2.1 3.1 4.3 4.8 5.1 4.7 4.2 3.7 3.3 3.3 Establishment Employment (Place of Work, Thousands, SA) Total Employment 301.0 300.9 300.0 297.4 295.5 294.1 294.2 294.6 295.0 295.6 296.5 297.4 298.3 Pct Chg Year Ago 4.6 3.6 1.4 -0.5 -1.8 -2.3 -1.9 -0.9 -0.2 0.5 0.8 0.9 1.1 Manufacturing 7.5 7.5 7.5 7.3 7.1 6.9 6.8 6.7 6.7 6.6 6.6 6.6 6.6 Pct Chg Year Ago 4.2 3.6 2.5 -2.3 -6.3 -8.0 -8.8 -7.7 -5.7 -4.0 -2.8 -1.8 -0.8 Nonmanufacturing 293.4 293.4 292.5 290.1 288.4 287.2 287.4 287.9 288.4 289.0 289.8 290.8 291.7 Pct Chg Year Ago 4.7 3.6 1.4 -0.5 -1.7 -2.1 -1.8 -0.8 0.0 0.6 0.9 1.0 1.2 Construction & Mining 36.1 36.1 35.5 34.7 34.3 33.7 33.1 32.8 32.5 32.2 32.0 31.8 31.6 Pct Chg Year Ago 3.4 4.0 2.1 -2.9 -4.9 -6.6 -6.6 -5.4 -5.1 -4.5 -3.5 -3.1 -2.8 Trade, Trans, & Utilities 59.4 58.8 58.9 58.0 57.6 57.1 56.6 56.5 56.4 56.4 56.5 56.6 56.7 Pct Chg Year Ago 4.4 1.6 0.0 -2.1 -3.0 -2.9 -3.9 -2.5 -2.0 -1.3 -0.2 0.2 0.4 Wholesale Trade 8.7 8.8 8.9 8.9 9.0 9.1 9.1 9.2 9.3 9.3 9.4 9.4 9.5 Retail Trade 43.8 43.1 43.1 42.0 41.5 40.8 40.1 40.0 39.9 39.8 39.8 39.9 39.9 Trans, Wrhsng, & Util 6.8 6.9 6.9 7.0 7.1 7.2 7.3 7.3 7.3 7.3 7.3 7.3 7.3 Information 3.1 3.1 3.1 3.1 3.0 3.0 3.0 3.0 3.0 3.0 3.0 3.0 3.0 Pct Chg Year Ago 1.9 0.4 -0.3 -1.7 -4.4 -3.7 -2.5 -2.2 -0.4 0.6 0.8 1.1 0.7 Financial Activities 16.4 16.7 16.8 16.7 16.8 16.8 17.0 17.0 17.0 17.0 16.9 16.9 16.8 Pct Chg Year Ago 12.8 11.7 7.3 4.1 2.2 0.8 1.2 1.9 1.3 0.8 -0.2 -0.7 -0.9 Prof & Business Services 42.1 42.1 40.6 39.1 37.8 37.1 37.0 37.1 37.3 37.8 38.2 38.6 39.2 Pct Chg Year Ago 2.8 0.5 -3.3 -6.5 -10.2 -11.8 -8.9 -5.1 -1.1 1.7 3.0 4.2 4.9 Educ & Health Services 35.9 36.3 36.8 37.1 37.2 37.4 37.6 37.7 37.6 37.5 37.3 37.2 37.2 Pct Chg Year Ago 9.5 10.2 7.8 4.0 3.5 3.0 2.1 1.6 1.0 0.2 -0.7 -1.2 -1.1 Leisure & Hospitality 42.3 41.6 41.9 42.2 42.1 42.0 42.7 43.1 43.7 44.0 44.5 44.9 45.4 Pct Chg Year Ago 1.8 -0.2 -4.6 -1.2 -0.6 0.9 2.0 2.2 3.7 4.8 4.3 4.2 4.1 Other Services 12.5 12.7 12.7 12.9 13.1 13.3 13.5 13.7 13.8 14.0 14.1 14.2 14.3 Pct Chg Year Ago 8.5 8.7 5.7 4.4 4.5 5.4 6.8 6.3 5.5 4.9 4.2 3.6 3.2 Federal Government 2.4 2.4 2.5 2.5 2.4 2.4 2.4 2.4 2.4 2.5 2.5 2.5 2.5 Pct Chg Year Ago -1.9 -1.9 2.6 5.0 2.4 0.6 -0.9 -0.6 0.1 0.6 1.2 1.4 1.3 State & Local Government 43.2 43.6 43.9 44.0 44.2 44.3 44.4 44.5 44.6 44.7 44.9 45.0 45.1 Pct Chg Year Ago 3.7 3.8 5.1 3.4 2.3 1.6 1.1 1.1 1.0 1.1 1.1 1.0 1.1 Other Economic Indicators Population (Ths) 817.5 821.5 826.1 830.9 835.4 840.1 844.6 848.8 852.9 856.7 860.8 864.7 868.6 Pct Chg Year Ago 2.4 2.2 2.2 2.2 2.2 2.3 2.2 2.2 2.1 2.0 1.9 1.9 1.8 Labor Force (Ths) 373.3 375.2 376.8 377.3 377.4 377.4 377.5 377.8 378.3 378.7 379.3 380.1 380.5 Pct Chg Year Ago 3.1 3.5 3.1 1.8 1.1 0.6 0.2 0.1 0.2 0.4 0.5 0.6 0.6 Unemployment Rate (%) 2.8 3.3 4.1 4.8 5.3 5.6 5.6 5.5 5.5 5.4 5.3 5.2 5.0 Total Housing Starts 11636.4 10084.4 8770.0 8078.3 7850.1 7953.1 8237.3 8705.5 9142.5 9396.4 9605.3 9635.1 9697.3 Single-Family 8950.0 7312.6 6136.5 5590.2 5409.2 5475.0 5576.1 5705.8 5906.2 5955.3 5970.9 5925.8 5926.6 Multifamily 2686.5 2771.8 2633.6 2488.2 2440.9 2478.1 2661.3 2999.7 3236.3 3441.1 3634.4 3709.4 3770.6
PROFILES
The Crestview MSA is comprised of Okaloosa and Walton counties and is located in the northwest corner of the state. Crestview is known as the “Hub City” because of the convergence of interstate 1, State Road 85, U.S. Highway 90, the Florida Gulf & Atlantic Railroad and the Yellow River and Shoal River in or near the city.
QUICK FACTS
• Metro population estimate of 272,056 as of 2019 (5-Year Estimate) (U.S. Census Bureau).
• Okaloosa County population estimate of 203,794 as of 2019 (5-Year Estimate) (U.S. Census Bureau).
• Walton County population estimate of 68,262 as of 2019 (5-Year Estimate) (U.S. Census Bureau).
• Civilian labor force of 136,241 in November 2022 (Florida Research and Economic Database).
• An unemployment rate of 2.3% as of November 2022, not seasonally adjusted. This amounts to 3,105 unemployed people (Florida Research and Economic Database).
OUTLOOK SUMMARIES
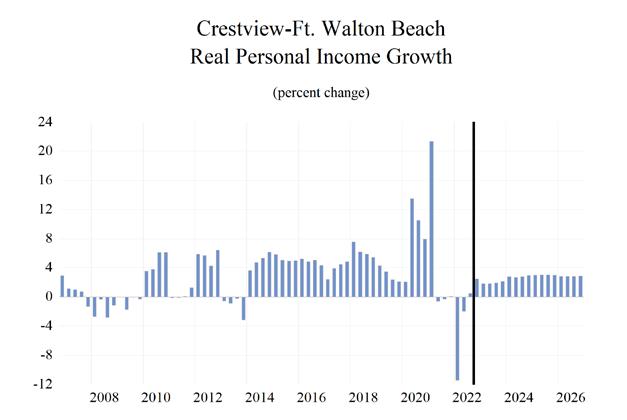
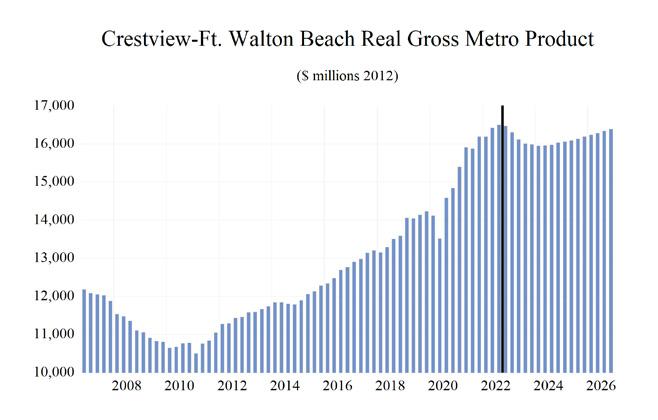
The studied economic indicators are predicted to show above-average levels of growth in the Crestview Metropolitan Statistical Area (MSA). Gross Metro Product for the MSA will come in at $ 16,126.58 million. The MSA will experience average personal income growth of 4.4 percent, and real per capita income will be relatively high in the state at $55,100. The average annual wage will grow at an annual rate of 3.8 percent (the 6th highest) to $71,900. Crestview’s population will grow at an annual rate of 1.3 percent. Employment growth is expected to average -0.3 percent, and Crestview will experience the lowest Unemployment rate in the state at 3.9 percent.
The Other Services sector will lead the MSA in average annual growth at 2.7 percent. The Financial sector will follow at 1.7 percent. The Construction and Mining, and Manufacturing sectors will see respective contractions in growth of -4.3 percent and -2.4 percent, respectively.
METRO NEWS SUMMARIES
Joe Bruner takes down ‘biggest eyesore’ in Destin; promises something ‘magnificent’
• The land on the northeastern side of the Marler Bridge was bought by BK of Destin Inc. in June for $5.5 million. The 2.1-acre property has 250 feet of shoreline, 800 feet deep, with 125 feet on Calhoun Avenue and 175 feet on U.S. 98.
• According to Bruner, he wants to create something that is both awe-inspiring and not overtly commercial. He wants to create something that inspires admiration for Destin.
• He said it will be modernistic and will be a “Dubai type project that will be No. 1 in Destin and give people something to talk about when they come over the bridge.”
Source: The Destin Log, September 12, 2022
Gulf Air selects Crestview’s Bob Sikes Airport for $16 million expansion, creating 55 jobs
• The Bob Sikes Airport in Crestview will get a brand-new, cutting-edge hangar as part of a $16 million expansion project, and 55 new jobs will be created for locals.
• The 55 new workers will be hired at an average salary of $89,000, which is 179% more than the average salary in Okaloosa County. These roles will be added to the 102 workers who are already working at their facility at Bob Sikes Airport.
• Additionally, at the Destin-Fort Walton Beach Airport, a brand-new $11.4 million concourse was opened on September 19 by Tracy Stage, director of Okaloosa County Airports. The department’s collaboration with Gulf Air will be expanded, according to Stage.
Source: NWFdailynews, September 26, 2022
CRESTVIEW - FT. WALTON BEACH - DESTIN 30 Florida & Metro Forecast / Winter 2023
New Publix shopping center coming to downtown Destin
• A major development order for the construction of a new Publix shopping center along Main Street was approved by the Destin City Council on the 20-acre lot located at 757 & 761 Harbor Boulevard.
• All existing structures, pavement, and most of the existing utilities will be removed and demolished. A Publix grocery store, a Publix liquor store, and more retail spaces to the east will be built in its place.
• The town’s old movie theatre and lots to the Southwest of the Old Time Pottery building are also to be demolished.
Source: WKRG, October 4, 2022
Businessman pledges $1M to Destin High School athletics program
• To support the development of Destin High School’s athletic department, Fred Tripp Tolbert will donate $1 million over the next four years. The initial $250,000 installment will be utilized to build a cutting-edge weight room and athletic facility.
• Tolbert stated that he hopes to create a new stadium for the Sharks and Marlins through a collaboration with Okaloosa County School District or raise $5 million to upgrade the Destin Middle School football field, which is presently used by DHS.
• Tolbert hopes his donation will inspire others to back the growing charter school.
Source: WKRG, October 18, 2022
$1.29M in oil spill money given to Okaloosa County School District
• Choctawhatchee High School, Fort Walton Beach High School, and Niceville High School will be served by a $3,664,923 healthcare academy that is being funded in part by the Deepwater Horizon Oil Spill grant money. Beginning with the 2022–2023 academic year, the healthcare academy will begin certifying students in collaboration with nearby hospitals.
• When completed, OCSD says the academy will offer 432 industry-recognized Florida Department of Education-approved CAPE certificates to Sophomore-Senior students.
Source: WKRG, November 3, 2022
Florida Designates 114 Purple Star Schools
• While visiting Fort Walton Beach High School in Okaloosa County, which has the highest percentage of military child enrollment of any school district in the state, Governor DeSantis announced Florida’s first class of Purple Star campuses in recognition of their support for the children of military families.
• At the Purple Star campuses in Okaloosa and Walton County, the Department of Education will assist veterans in obtaining their teaching certification and instruct other teachers on how to best assist military families.
Source: Florida Department of Education, November 15, 2022
CRESTVIEW - FT. WALTON BEACH - DESTIN Institute for Economic Forecasting 31
Crestview-Ft. Walton Beach-Des�n MSA Industry Loca�on Quo�ents


32 Florida & Metro Forecast / Winter 2023 0 0.2 0.4 0.6 0.8 1 1.2 1.4 1.6 Total Nonagricultural Employment Total Private Goods Producing Service Producing Private Service Providing Mining, Logging, and Construc�on Manufacturing Trade, Transporta�on, and U�li�es Wholesale Trade Retail Trade Transporta�on, Warehousing and U�li�es Informa�on Financial Ac�vi�es Professional and Business Services Educa�onal and Health Services Leisure and Hospitality Other Services Government
CRESTVIEW - FT. WALTON BEACH - DESTIN
Long-Term Outlook for Crestview-Fort Walton Beach-Destin, FL
CRESTVIEW - FT. WALTON BEACH - DESTIN Institute for Economic Forecasting 33
2018 2019 2020 2021 2022 2023 2024 2025 2026 Personal Income (Billions $) Total Personal Income 14.7 16.1 17.3 19.0 19.4 20.0 20.8 22.0 23.1 Pct Chg Year Ago 7.1 10.0 7.2 9.5 2.4 3.2 4.0 5.6 4.9 Wages and Salaries 6.7 7.3 7.8 8.7 9.4 9.6 9.8 10.3 10.7 Nonwage Income 8.0 8.9 9.6 10.3 10.0 10.5 11.0 11.7 12.4 Real Personal Income (12$) 14.0 15.3 16.2 17.0 16.4 16.4 16.7 17.2 17.7 Pct Chg Year Ago 4.7 9.0 6.0 5.0 -3.7 -0.1 1.7 3.4 2.9 Per Capita Income (Ths) 52.8 56.8 60.0 64.6 65.2 66.2 67.8 70.8 73.7 Real Per Capita Income (12$) 50.5 53.8 56.2 58.0 55.0 54.2 54.2 55.5 56.6 Average Annual Wage (Ths) 50.4 53.2 57.5 61.8 65.7 67.4 70.7 73.4 76.1 Pct Chg Year Ago 2.0 5.5 8.1 7.4 6.3 2.6 4.9 3.8 3.7 Establishment Employment (Place of Work, Thousands, SA) Total Employment 115.6 118.3 116.1 122.2 125.5 124.2 121.8 122.7 123.8 Pct Chg Year Ago 2.4 2.3 -1.8 5.2 2.7 -1.1 -1.9 0.8 0.9 Manufacturing 3.0 3.2 3.4 3.4 3.5 3.5 3.2 3.2 3.2 Pct Chg Year Ago -7.4 4.4 8.7 -0.6 3.0 -1.5 -5.9 -1.7 -0.7 Nonmanufacturing 112.6 115.2 112.7 118.8 122.0 120.8 118.6 119.5 120.7 Pct Chg Year Ago 2.7 2.3 -2.1 5.4 2.7 -1.0 -1.8 0.8 0.9 Construction & Mining 6.9 6.9 7.0 7.2 7.4 7.2 6.6 6.3 6.2 Pct Chg Year Ago 4.7 -0.2 1.3 3.7 1.6 -2.7 -7.3 -4.4 -2.8 Trade, Trans, & Utilities 21.1 21.2 20.5 21.5 22.7 22.0 21.3 21.1 21.2 Pct Chg Year Ago 2.8 0.5 -3.3 5.2 5.5 -3.0 -3.4 -0.7 0.4 Wholesale Trade 1.7 1.8 1.7 1.8 2.0 2.0 2.0 2.1 2.1 Retail Trade 17.2 17.1 16.5 17.2 18.1 17.5 16.7 16.4 16.4 Trans, Wrhsng, & Util 2.1 2.3 2.3 2.5 2.6 2.5 2.6 2.6 2.7 Information 1.2 1.3 1.3 1.3 1.4 1.4 1.4 1.3 1.3 Pct Chg Year Ago 6.5 4.8 -1.3 3.0 6.5 -0.5 -1.9 -0.4 -2.1 Financial Activities 7.0 7.1 7.0 7.5 7.8 8.0 8.2 8.3 8.4 Pct Chg Year Ago 4.5 2.3 -2.3 8.2 4.1 2.4 1.9 1.6 1.1 Prof & Business Services 17.0 17.9 18.5 20.4 20.4 19.2 17.8 18.3 18.9 Pct Chg Year Ago 8.3 5.4 3.0 10.4 0.2 -5.9 -7.3 2.9 3.0 Educ & Health Services 11.9 12.5 12.3 12.4 12.7 13.2 13.5 13.5 13.4 Pct Chg Year Ago -0.3 4.8 -1.6 1.1 2.4 3.6 2.6 -0.3 -0.1 Leisure & Hospitality 22.3 22.6 20.7 22.4 23.0 22.3 22.1 22.8 23.4 Pct Chg Year Ago 2.2 1.5 -8.6 8.2 2.8 -3.1 -0.7 3.2 2.7 Other Services 4.8 4.9 4.8 5.0 5.2 5.3 5.5 5.6 5.8 Pct Chg Year Ago -1.7 2.3 -1.5 3.9 4.2 1.8 3.2 3.3 2.6 Federal Government 8.7 8.9 9.2 9.3 9.5 9.9 9.9 9.8 9.6 Pct Chg Year Ago 0.6 2.1 3.5 1.3 1.5 4.7 -0.3 -1.1 -1.3 State & Local Government 11.8 11.9 11.6 11.7 12.0 12.3 12.4 12.4 12.4 Pct Chg Year Ago -0.1 1.3 -2.3 0.6 2.1 2.9 0.4 0.3 0.1 Other Economic Indicators Population (Ths) 278.0 284.2 288.5 293.8 298.1 302.6 307.4 310.5 313.3 Pct Chg Year Ago 2.3 2.2 1.5 1.8 1.5 1.5 1.6 1.0 0.9 Labor Force (Ths) 125.3 127.7 127.6 133.0 135.8 137.2 136.9 137.0 137.4 Percent Change, Year Ago 1.6 1.9 -0.1 4.3 2.1 1.1 -0.2 0.1 0.3 Unemployment Rate (%) 3.1 2.8 6.1 3.4 2.4 3.6 4.4 4.0 3.7 Total Housing Starts 2193.2 3171.4 2952.3 3605.8 3914.5 2927.9 2324.3 2353.2 2357.8 Single-Family 2064.1 2364.2 2418.5 3219.7 2893.0 1931.4 1879.9 1932.0 1862.6 Multifamily 129.1 807.2 533.7 386.1 1021.5 996.5 444.4 421.2 495.3
December 2022 Forecast
Short-Term Outlook for Crestview-Fort Walton Beach-Destin, FL December 2022 Forecast
CRESTVIEW - FT. WALTON BEACH - DESTIN 34 Florida & Metro Forecast / Winter 2023
2022:4 2023:1 2023:2 2023:3 2023:4 2024:1 2024:2 2024:3 2024:4 2025:1 2025:2 2025:3 2025:4 Personal Income (Billions $) Total Personal Income 19.8 20.0 20.0 20.0 20.2 20.4 20.7 21.0 21.3 21.6 21.8 22.1 22.4 Pct Chg Year Ago 5.0 5.0 3.5 2.3 2.0 2.4 3.6 4.6 5.3 5.5 5.7 5.6 5.4 Wages and Salaries 9.6 9.6 9.6 9.5 9.6 9.7 9.8 9.9 10.0 10.1 10.2 10.3 10.4 Nonwage Income 10.2 10.4 10.4 10.5 10.6 10.8 10.9 11.1 11.3 11.5 11.7 11.8 12.0 Real Personal Income (12$) 16.4 16.5 16.4 16.3 16.4 16.5 16.6 16.7 16.9 17.0 17.2 17.3 17.4 Pct Chg Year Ago -0.7 0.4 0.2 -0.5 -0.4 0.1 1.2 2.3 3.0 3.3 3.5 3.5 3.4 Per Capita Income (Ths) 66.1 66.4 66.1 66.1 66.3 66.9 67.3 68.1 68.9 69.7 70.4 71.2 72.0 Real Per Capita Income (12$) 54.9 54.7 54.2 53.9 53.7 53.9 54.0 54.3 54.6 55.0 55.3 55.7 56.0 Average Annual Wage (Ths) 66.3 66.5 67.0 67.6 68.5 69.4 70.3 71.2 71.8 72.4 72.9 73.7 74.4 Pct Chg Year Ago 3.3 2.9 2.0 2.3 3.3 4.4 5.1 5.3 4.9 4.3 3.7 3.5 3.6 Establishment Employment (Place of Work, Thousands, SA) Total Employment 126.9 126.2 124.9 123.4 122.3 121.7 121.6 121.8 122.2 122.4 122.6 122.9 123.2 Pct Chg Year Ago 2.7 1.4 0.4 -2.4 -3.6 -3.6 -2.6 -1.3 -0.1 0.5 0.8 0.8 0.8 Manufacturing 3.6 3.5 3.5 3.4 3.3 3.3 3.3 3.2 3.2 3.2 3.2 3.2 3.2 Pct Chg Year Ago 1.6 1.1 1.9 -2.8 -6.0 -7.1 -7.3 -5.7 -3.5 -2.3 -1.6 -1.5 -1.2 Nonmanufacturing 123.3 122.6 121.4 120.0 119.0 118.4 118.4 118.6 118.9 119.1 119.4 119.7 120.0 Pct Chg Year Ago 2.7 1.4 0.3 -2.4 -3.5 -3.5 -2.5 -1.1 -0.1 0.6 0.9 0.9 0.9 Construction & Mining 7.5 7.4 7.2 7.0 6.9 6.8 6.7 6.6 6.5 6.4 6.4 6.3 6.3 Pct Chg Year Ago 4.6 3.1 0.4 -6.2 -7.8 -8.7 -8.1 -6.3 -5.8 -5.2 -4.2 -4.1 -4.0 Trade, Trans, & Utilities 22.7 22.4 22.3 21.8 21.6 21.5 21.3 21.2 21.2 21.1 21.1 21.2 21.2 Pct Chg Year Ago 3.0 -0.5 -2.2 -4.4 -4.8 -4.0 -4.7 -2.6 -2.1 -1.7 -0.7 -0.4 -0.1 Wholesale Trade 2.0 2.0 2.0 2.0 2.0 2.0 2.0 2.1 2.1 2.1 2.1 2.1 2.1 Retail Trade 18.1 17.8 17.7 17.2 17.1 16.9 16.6 16.6 16.5 16.4 16.4 16.4 16.4 Trans, Wrhsng, & Util 2.6 2.6 2.5 2.5 2.5 2.6 2.6 2.6 2.6 2.6 2.6 2.6 2.6 Information 1.4 1.4 1.4 1.4 1.4 1.4 1.4 1.4 1.3 1.4 1.4 1.4 1.3 Pct Chg Year Ago 3.9 1.9 0.0 -0.4 -3.5 -2.6 -1.7 -2.3 -1.1 -0.5 -0.7 -0.1 -0.4 Financial Activities 7.9 8.0 8.0 8.0 8.0 8.1 8.2 8.2 8.2 8.3 8.3 8.3 8.3 Pct Chg Year Ago 1.1 0.9 4.5 2.8 1.3 0.8 1.4 2.6 2.7 2.3 1.8 1.4 1.0 Prof & Business Services 20.6 20.4 19.6 18.8 18.1 17.8 17.7 17.8 17.9 18.1 18.2 18.4 18.6 Pct Chg Year Ago 0.2 0.6 -3.2 -8.8 -12.0 -12.9 -9.5 -5.0 -1.0 1.6 2.9 3.3 3.6 Educ & Health Services 13.0 13.1 13.1 13.2 13.3 13.4 13.5 13.5 13.5 13.5 13.5 13.5 13.4 Pct Chg Year Ago 5.6 5.7 3.9 2.8 2.1 2.7 3.4 2.5 1.7 0.6 -0.5 -0.7 -0.6 Leisure & Hospitality 23.0 22.5 22.3 22.3 22.1 21.8 22.0 22.2 22.5 22.6 22.8 22.9 23.1 Pct Chg Year Ago 1.9 -1.8 -2.5 -4.0 -4.2 -3.0 -1.2 -0.4 1.8 3.5 3.4 3.3 2.8 Other Services 5.3 5.3 5.2 5.3 5.3 5.4 5.4 5.5 5.5 5.6 5.6 5.7 5.7 Pct Chg Year Ago 4.2 3.4 2.8 0.3 0.6 1.9 3.5 3.7 3.7 3.6 3.5 3.3 2.9 Federal Government 9.7 9.8 9.9 9.9 9.9 9.9 9.9 9.9 9.8 9.8 9.8 9.8 9.7 Pct Chg Year Ago 3.4 5.0 6.4 5.0 2.6 0.7 -0.6 -0.7 -0.8 -0.9 -1.1 -1.2 -1.3 State & Local Government 12.2 12.3 12.3 12.3 12.3 12.3 12.3 12.4 12.4 12.4 12.4 12.4 12.4 Pct Chg Year Ago 3.4 4.2 4.4 2.1 1.1 0.6 0.3 0.5 0.3 0.3 0.3 0.2 0.2 Other Economic Indicators Population (Ths) 299.6 300.7 301.9 303.2 304.6 305.9 307.0 308.0 308.8 309.5 310.2 310.9 311.6 Pct Chg Year Ago 1.3 1.4 1.5 1.6 1.7 1.7 1.7 1.6 1.4 1.2 1.0 0.9 0.9 Labor Force (Ths) 136.5 137.0 137.3 137.3 137.1 137.0 136.8 136.8 136.9 136.9 136.9 137.1 137.1 Pct Chg Year Ago 1.8 1.2 1.3 1.2 0.5 0.0 -0.4 -0.3 -0.2 -0.1 0.1 0.2 0.2 Unemployment Rate (%) 2.4 2.7 3.4 4.0 4.3 4.5 4.4 4.3 4.3 4.2 4.1 4.0 3.9 Total Housing Starts 4328.2 3539.6 3041.2 2726.1 2404.8 2358.3 2339.1 2263.7 2335.9 2355.6 2362.4 2347.0 2347.8 Single-Family 2632.2 2174.9 1920.8 1838.8 1791.3 1806.2 1868.9 1895.3 1949.0 1950.2 1945.3 1919.6 1912.7 Multifamily 1696.0 1364.8 1120.4 887.4 613.5 552.1 470.2 368.4 386.9 405.4 417.1 427.4 435.1
PROFILES
The Deltona–Daytona–Ormond Beach MSA is comprised of Volusia and Flagler Counties. It is located on the east coast of Florida and is notable for special events that occur throughout the year such as Bike Week. It is home to NASCAR headquarters and the Daytona International Speedway, which hosts popular races such as the Daytona 500.
QUICK FACTS
• Metro population estimate of 646,288 as of 2019 (5-Year Estimate) (U.S. Census Bureau).
• Volusia County population estimate of 553,284 as of 2019 (5-Year Estimate) (U.S. Census Bureau).
• Civilian labor force of 317,575 in November 2022 (Florida Research and Economic Database).
• An unemployment rate of 2.9% as of November 2022, not seasonally adjusted. This amounts to 9,364 unemployed people (Florida Research and Economic Database).
OUTLOOK SUMMARIES
Growth in the economic indicators studied in this forecast is expected to be about average for the Deltona – Daytona – Ormond Beach Metropolitan Statistical Area (MSA). Gross Metro Product in the Deltona MSA will be $21,136.51 million, placing it 12th in the state for metro output. Personal income levels will grow by the 13th fastest rate in the state of 4.6 percent, driven by a 3.8 percent increase in the average annual real wage to $59,800. Though Deltona ranks 5th in average annual wage increase, it ranks 4th to last in average annual wage. Per capita income levels will come in at $46,500, placing it 18th out of the studied MSAs. We expect population growth of 1.2 percent per year.
The Deltona – Daytona – Ormond Beach MSA labor market will experience an about-average level of annual employment growth in the state at -0.1 percent, the 13th highest of the studied MSAs, leading to an unemployment rate of 5.5 percent.
The Other services sector will experience the fastest growth rate in this MSA with an annual growth rate
of 3.8 percent. The Information sector will follow at 3.1 percent. Deltona will see the largest contraction in growth in the Construction and Mining and The Manufacturing sector, at -2.9% and -2.4% respectively.
METRO NEWS SUMMARIES
Deltona moratorium pauses new developments as leaders update zoning codes
• Just like the rest of Florida, Deltona has found itself in need of more housing. Demand for housing keeps increasing as more families decide to settle down in the city, but new constructions have been halted.
• Concerns have been raised by residents and officials regarding the outdated regulations and zoning classifications. After the updates, new developments will be more integrated into current neighborhoods and the city.
• The new zoning codes will consider property owners’ rights, environmental needs, and smaller housing trends. Although the pause will last until January 1, 2023, neighborhoods already approved will be unaffected.
Source: ClickOrlando, September 1, 2022
Volusia joins call for study of SunRail expansion
• Volusia County has voiced its support behind a study that would look at the future expansion of the SunRail. The County Council hesitated on their decision, with concerns about the SunRail running on a $45 million annual deficit.
• The expansion, dubbed the SunRail Corridor, will connect Orlando International Airport and the International Drive tourist district. With the expansion having little to do with Volusia County, officials voiced concerns that the plan will bring added costs to their taxpayers.
• Volusia County Council was assured that the current resolution does not bind them financially to the plan, and so they felt safe to support the expansion. In the meantime, they acknowledge the importance of their regional partnerships and
D ELTONA – D A y TONA B EACH – O RMOND B EACH Institute for Economic Forecasting 35
the mutual benefits it brings, such as the rail line from Deland to Debary expected to be completed in the summer of 2024.
Source: The West Volusia Beacon, September 28, 2022
Residential growth in Volusia County helps all property value surge 24% to $85 billion
• A record high has been reached in Volusia County as the total value of all property has exceeded $84 billion. This represents an astonishing 23.7% year-over-year increase resulting from a growing cost of living and demand for housing.
• In 2021, the County’s total value was $68.6 billion. Volusia County Property Appraiser Larry Bartlett believes the growth comes from increased demand for people to live in Volusia County. Bartlett said, “We just reflect the market and the market tells us a lot of people want to come here and have a business here.”
• The county has seen a 12% population increase from 2010, having a population of 564,412 as of July 1, 2021. However, annual projections from the University of Florida believe that the County will expand by only 5% between 2021 and 2025.
Source: The Daytona Beach News-Journal, October 10, 2022
Sheriff’s Office Lands $1.3 Million Grant to Expand Drug-Abuse Treatment at the County Jail
• Flagler County currently has only one facility for the treatment toward drug-addicted individuals, and unfortunately, it’s at the County jail. However, their services will be seeing an improvement and expansion through outpatient services.
• The Flagler County Sheriff’s Office has received a 3-year $1.3 million federal grant to widen the drug-treatment operation at the county jail dubbed “Smart.” The funding will provide an additional deputy sheriff to provide support, a clinician for re-entry therapy, and a peer specialist for follow-up and assist in funding for former inmates.
• The current program boasts a 70% success rate,
with hopes that the grant will bolster their success rate while also helping inmates get back on their feet as productive citizens.
Source: FlaglerLive, October 12, 2022
‘Astounding damage’ from Nicole reported in Volusia; DeSantis pledges aid to help beaches
• Volusia County was the site of even more devastation, as Hurricane Nicole eclipsed the damage done by Hurricane Ian. Hurricane Ian’s damage was an already astounding $377 million, but this latest storm caused damages over $481 million. The damage has not been fully assessed, so the numbers may keep growing.
• Condominiums alone account for $277 million in damages. The coast remained dangerous as many buildings eroded into the ocean. DeSantis directed the Florida Department of Environment Protection to provide $20 million to local governments to address the erosion.
• The funds are an immediate emergency relief to help stabilize the situation at the beaches, which act as the first line of defense against storms. Legislators are also looking for additional funds to go towards infrastructure and to help rebuild the affected areas.
Source: The Daytona Beach News-Journal, November 12, 2022
D ELTONA – D A y TONA B EACH – O RMOND B EACH 36 Florida & Metro Forecast / Winter 2023
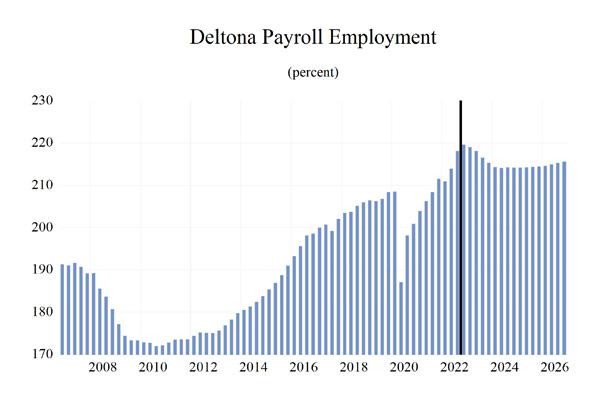


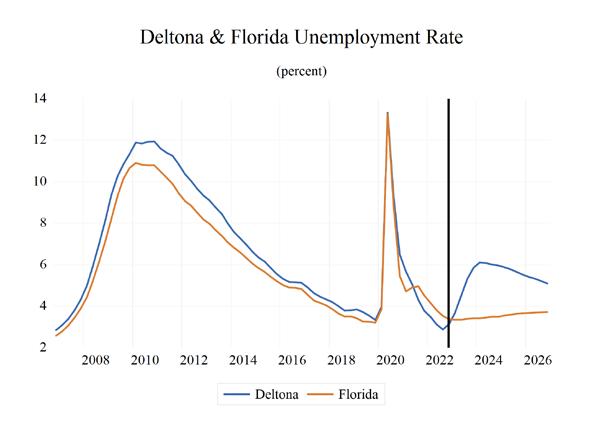
D ELTONA – D A y TONA B EACH – O RMOND B EACH Institute for Economic Forecasting 37 0.0 0.2 0.4 0.6 0.8 1.0 1.2 1.4 Total Nonagricultural Employment Total Private Goods Producing Service Producing Private Service Providing Mining, Logging, and Construction Manufacturing Trade, Transportation, and Utilities Wholesale Trade Retail Trade Transportation, Warehousing and Utilities Information Financial Activities Professional and Business Services Educational and Health Services Leisure and Hospitality Other Services Government Deltona - Daytona Beach - Ormond Beach MSA Industry Location Quotients
Long-Term Outlook for Deltona-Daytona Beach-Ormond Beach, FL December 2022 Forecast
D ELTONA – D A y TONA B EACH – O RMOND B EACH 38 Florida & Metro Forecast / Winter 2023
2018 2019 2020 2021 2022 2023 2024 2025 2026 Personal Income (Billions $) Total Personal Income 28.7 31.3 33.1 36.7 38.0 39.7 41.3 43.4 45.4 Pct Chg Year Ago 5.8 9.0 5.7 11.0 3.4 4.5 4.2 5.1 4.6 Wages and Salaries 8.9 9.3 9.5 10.7 11.9 12.3 12.6 13.1 13.7 Nonwage Income 19.9 22.0 23.6 26.0 26.1 27.4 28.7 30.3 31.7 Real Personal Income (12$) 27.2 29.7 31.0 33.0 32.1 32.5 33.1 34.0 34.9 Pct Chg Year Ago 5.0 9.1 4.4 6.4 -2.7 1.2 1.9 2.9 2.6 Per Capita Income (Ths) 44.0 47.3 49.2 53.5 54.3 55.9 57.4 59.7 61.8 Real Per Capita Income (12$) 41.7 44.8 46.1 48.0 45.9 45.7 45.9 46.8 47.5 Average Annual Wage (Ths) 43.0 44.5 47.6 51.0 54.7 56.2 58.7 61.0 63.4 Pct Chg Year Ago 3.1 3.4 6.8 7.3 7.1 2.8 4.4 3.9 4.0 Establishment Employment (Place of Work, Thousands, SA) Total Employment 204.6 207.0 198.7 207.5 215.7 217.2 214.2 214.3 215.1 Pct Chg Year Ago 2.0 1.2 -4.0 4.5 3.9 0.7 -1.4 0.0 0.4 Manufacturing 11.8 11.4 10.7 11.4 12.1 12.1 11.2 11.0 11.0 Pct Chg Year Ago 1.2 -3.4 -6.2 6.8 6.1 -0.2 -7.1 -2.3 0.0 Nonmanufacturing 192.8 195.6 188.0 196.1 203.6 205.2 203.0 203.3 204.1 Pct Chg Year Ago 2.1 1.4 -3.9 4.3 3.8 0.8 -1.1 0.2 0.4 Construction & Mining 13.8 14.2 14.0 14.2 14.6 14.4 13.6 13.2 13.0 Pct Chg Year Ago 6.9 2.7 -1.4 1.4 3.1 -1.6 -5.5 -3.1 -1.5 Trade, Trans, & Utilities 39.1 39.5 38.9 42.4 44.0 43.3 41.7 41.1 40.7 Pct Chg Year Ago 1.8 1.0 -1.5 9.0 3.9 -1.7 -3.7 -1.4 -0.8 Wholesale Trade 5.2 5.2 4.9 5.1 5.2 5.5 5.6 5.7 5.8 Retail Trade 30.9 31.0 30.2 31.7 32.9 31.7 30.1 29.6 29.5 Trans, Wrhsng, & Util 3.0 3.3 3.7 5.6 5.9 6.1 6.0 5.8 5.5 Information 2.4 2.4 2.0 1.8 1.8 1.8 1.9 2.0 2.0 Pct Chg Year Ago 0.1 -0.7 -16.7 -8.9 -1.6 1.9 5.3 3.8 1.3 Financial Activities 8.5 8.7 9.0 9.6 9.9 10.4 10.5 10.6 10.6 Pct Chg Year Ago 0.9 2.2 4.2 6.2 3.0 5.0 1.6 0.6 0.1 Prof & Business Services 23.2 23.4 23.0 23.3 24.5 23.5 21.9 22.2 22.8 Pct Chg Year Ago -2.4 1.1 -1.7 1.3 5.0 -4.0 -7.1 1.7 2.6 Educ & Health Services 39.8 40.7 39.8 40.3 40.3 42.7 44.1 44.3 44.5 Pct Chg Year Ago 2.5 2.2 -2.3 1.3 -0.1 6.1 3.1 0.5 0.5 Leisure & Hospitality 33.0 32.9 27.8 30.8 33.1 32.5 32.5 33.0 33.6 Pct Chg Year Ago 5.0 -0.3 -15.4 10.6 7.7 -1.8 -0.2 1.6 1.7 Other Services 9.0 8.9 8.2 8.3 8.8 9.2 9.7 9.9 10.2 Pct Chg Year Ago 0.1 -0.8 -7.9 0.9 5.5 5.6 4.4 2.8 2.3 Federal Government 1.4 1.5 1.6 1.5 1.5 1.5 1.5 1.5 1.5 Pct Chg Year Ago 0.7 5.3 5.3 -5.4 -0.8 1.1 -0.1 0.9 1.3 State & Local Government 22.6 23.4 23.6 23.9 25.1 25.7 25.7 25.5 25.2 Pct Chg Year Ago 1.4 3.7 1.0 1.1 5.0 2.6 -0.2 -0.8 -1.2 Other Economic Indicators Population (Ths) 653.0 662.4 672.9 686.6 698.7 709.6 719.7 727.3 734.2 Pct Chg Year Ago 1.5 1.4 1.6 2.0 1.8 1.6 1.4 1.1 1.0 Labor Force (Ths) 297.0 299.3 295.8 303.1 311.4 316.7 315.6 314.8 314.6 Percent Change, Year Ago 1.1 0.8 -1.2 2.5 2.7 1.7 -0.4 -0.3 0.0 Unemployment Rate (%) 3.9 3.6 8.3 4.7 3.2 4.8 6.0 5.7 5.3 Total Housing Starts 3563.6 4519.7 5820.3 7086.3 8524.8 5185.5 4625.2 5044.6 5087.8 Single-Family 3270.5 3871.3 4649.9 6569.2 6276.6 3987.1 3666.9 3843.4 3790.7 Multifamily 293.1 648.4 1170.4 517.2 2248.2 1198.4 958.3 1201.1 1297.1
Short-Term Outlook for Deltona-Daytona Beach-Ormond Beach, FL December 2022 Forecast
D ELTONA – D A y TONA B EACH – O RMOND B EACH Institute for Economic Forecasting 39
2022:4 2023:1 2023:2 2023:3 2023:4 2024:1 2024:2 2024:3 2024:4 2025:1 2025:2 2025:3 2025:4 Personal Income (Billions $) Total Personal Income 38.8 39.3 39.5 39.8 40.2 40.6 41.0 41.5 42.1 42.6 43.2 43.7 44.2 Pct Chg Year Ago 5.4 6.1 4.6 3.8 3.5 3.5 3.9 4.4 4.8 4.9 5.2 5.1 5.0 Wages and Salaries 12.2 12.2 12.3 12.3 12.3 12.4 12.6 12.7 12.8 13.0 13.1 13.2 13.3 Nonwage Income 26.6 27.0 27.2 27.5 27.8 28.2 28.5 28.8 29.2 29.7 30.1 30.5 30.8 Real Personal Income (12$) 32.2 32.4 32.4 32.5 32.6 32.8 32.9 33.2 33.4 33.7 33.9 34.1 34.4 Pct Chg Year Ago -0.3 1.5 1.4 0.9 1.0 1.2 1.6 2.1 2.5 2.8 3.0 3.0 2.9 Per Capita Income (Ths) 55.2 55.6 55.7 56.0 56.3 56.7 57.1 57.6 58.2 58.8 59.4 60.0 60.5 Real Per Capita Income (12$) 45.9 45.9 45.8 45.7 45.6 45.7 45.8 46.0 46.2 46.5 46.7 46.9 47.1 Average Annual Wage (Ths) 55.3 55.5 55.9 56.4 57.0 57.7 58.4 59.1 59.6 60.2 60.7 61.2 61.9 Pct Chg Year Ago 3.8 3.3 2.3 2.4 3.1 4.1 4.4 4.7 4.5 4.3 4.0 3.7 3.8 Establishment Employment (Place of Work, Thousands, SA) Total Employment 219.6 219.0 218.1 216.5 215.3 214.3 214.1 214.2 214.2 214.1 214.2 214.3 214.5 Pct Chg Year Ago 3.8 3.8 1.9 -0.7 -2.0 -2.1 -1.9 -1.1 -0.5 -0.1 0.1 0.0 0.1 Manufacturing 12.4 12.4 12.3 12.0 11.6 11.4 11.3 11.1 11.1 11.0 11.0 10.9 10.9 Pct Chg Year Ago 5.2 5.1 2.8 -2.0 -6.3 -7.7 -8.3 -7.2 -4.9 -3.5 -2.8 -1.8 -1.1 Nonmanufacturing 207.2 206.7 205.8 204.5 203.6 202.9 202.8 203.1 203.1 203.1 203.2 203.4 203.5 Pct Chg Year Ago 3.7 3.8 1.9 -0.7 -1.7 -1.8 -1.5 -0.7 -0.2 0.1 0.2 0.1 0.2 Construction & Mining 14.9 14.8 14.5 14.2 14.1 13.8 13.6 13.6 13.5 13.3 13.2 13.1 13.1 Pct Chg Year Ago 3.9 2.3 0.8 -3.7 -5.4 -6.6 -6.3 -4.5 -4.3 -3.7 -2.8 -3.0 -2.9 Trade, Trans, & Utilities 44.4 43.7 43.7 43.0 42.6 42.2 41.6 41.6 41.4 41.2 41.1 41.1 41.0 Pct Chg Year Ago 2.1 1.0 -0.1 -3.8 -4.0 -3.6 -4.9 -3.2 -2.9 -2.2 -1.2 -1.2 -1.0 Wholesale Trade 5.4 5.4 5.4 5.5 5.5 5.5 5.6 5.6 5.6 5.6 5.7 5.7 5.7 Retail Trade 32.9 32.2 32.2 31.4 31.0 30.5 30.0 29.9 29.8 29.7 29.6 29.7 29.6 Trans, Wrhsng, & Util 6.1 6.1 6.1 6.1 6.1 6.1 6.1 6.0 6.0 5.9 5.8 5.8 5.7 Information 1.8 1.8 1.8 1.9 1.9 1.9 1.9 2.0 2.0 2.0 2.0 2.0 2.0 Pct Chg Year Ago -5.3 -1.8 1.1 4.5 4.0 5.7 6.2 4.5 5.0 4.6 3.6 3.9 3.2 Financial Activities 10.2 10.4 10.4 10.3 10.4 10.5 10.5 10.6 10.6 10.6 10.6 10.6 10.6 Pct Chg Year Ago 3.6 6.9 6.6 4.3 2.4 1.0 1.3 2.2 1.8 1.4 0.8 0.3 0.0 Prof & Business Services 24.9 24.9 23.9 23.0 22.3 21.9 21.8 21.8 21.9 22.0 22.2 22.3 22.5 Pct Chg Year Ago 4.1 4.3 -2.2 -7.1 -10.6 -11.9 -8.9 -5.1 -1.8 0.4 1.5 2.2 2.7 Educ & Health Services 41.7 42.1 42.5 43.0 43.3 43.7 44.1 44.3 44.2 44.3 44.2 44.3 44.3 Pct Chg Year Ago 3.9 7.6 7.9 5.5 3.7 3.7 3.7 3.0 2.2 1.3 0.4 0.1 0.2 Leisure & Hospitality 33.2 32.6 32.5 32.7 32.4 32.2 32.4 32.5 32.7 32.8 32.9 33.0 33.2 Pct Chg Year Ago 4.4 0.8 -3.3 -2.3 -2.2 -1.1 -0.1 -0.6 0.9 1.8 1.6 1.7 1.5 Other Services 9.1 9.1 9.2 9.3 9.4 9.5 9.6 9.7 9.8 9.8 9.9 10.0 10.0 Pct Chg Year Ago 8.4 8.5 6.5 3.9 3.7 4.3 5.1 4.6 3.8 3.2 2.8 2.7 2.6 Federal Government 1.5 1.5 1.5 1.5 1.5 1.5 1.5 1.5 1.5 1.5 1.5 1.5 1.5 Pct Chg Year Ago -2.5 -3.2 -0.3 5.4 3.0 1.2 -0.3 -0.9 -0.3 0.2 0.8 1.3 1.3 State & Local Government 25.6 25.7 25.8 25.7 25.7 25.7 25.7 25.7 25.6 25.6 25.5 25.4 25.3 Pct Chg Year Ago 4.4 4.8 4.3 1.0 0.4 0.0 -0.4 -0.1 -0.4 -0.5 -0.6 -1.0 -1.0 Other Economic Indicators Population (Ths) 702.8 705.7 708.3 711.0 713.6 716.2 718.6 721.0 723.0 724.7 726.5 728.1 729.9 Pct Chg Year Ago 1.6 1.6 1.6 1.6 1.5 1.5 1.5 1.4 1.3 1.2 1.1 1.0 1.0 Labor Force (Ths) 314.9 316.0 317.0 317.1 316.9 316.3 315.7 315.3 315.1 314.8 314.8 314.8 314.6 Pct Chg Year Ago 2.6 2.5 2.4 1.3 0.6 0.1 -0.4 -0.6 -0.6 -0.5 -0.3 -0.2 -0.1 Unemployment Rate (%) 3.1 3.7 4.5 5.3 5.9 6.1 6.1 6.0 6.0 5.9 5.8 5.7 5.5 Total Housing Starts 7229.7 6125.6 5193.4 4868.1 4555.1 4430.4 4482.6 4688.0 4899.7 4985.1 5062.3 5051.9 5078.9 Single-Family 5384.6 4618.4 3967.7 3742.5 3619.9 3566.0 3602.8 3679.1 3819.8 3850.5 3861.7 3826.0 3835.6 Multifamily 1845.1 1507.2 1225.7 1125.6 935.2 864.4 879.8 1008.9 1079.9 1134.6 1200.6 1226.0 1243.4
PROFILES
The Broward County MSA Is located in Southeastern Florida. It is estimated to be the second-most populous county in the State of Florida and the 17th Most populous county in the United States.
QUICK FACTS
• Metro population estimate of 1,952,778 as of 2019 (5-Year Estimate) (U.S. Census Bureau).
• Broward County population estimate of 1,952,778 as of 2019 (5-Year Estimate) (U.S. Census Bureau).
• Civilian labor force of 1,073,628 in November 2022 (Florida Research and Economic Database).
• An unemployment rate of 2.5% as of November 2022, not seasonally adjusted. This amounts to 27,331 unemployed people (Florida Research and Economic Database).
OUTLOOK SUMMARIES
The Fort Lauderdale–Pompano Beach area is expected to show average levels of growth in the economic indicators. Personal income is expected to grow an average of 3.7 percent annually, the lowest of the MSAs. It will experience an average real per capita income level of $49,200. Average annual wage growth will be 3.2 percent. The annual wage level is expected to be $79,200, the 4th highest of the studied areas. Fort Lauderdale is expected to average a population growth of 0.9 percent each year. The area has the 5th highest Gross Metro Product of the MSAs studied at an average level of $106,419.32 million. Employment is expected to grow at an average rate of -0.4 percent each year, while Unemployment is expected to be 5.1 percent.
Fort Lauderdale’s fastest growing sector is expected to be the Other Services sector, which will experience 2.4 percent average annual growth, followed by the Federal Government sector, which will grow at an average of 1.7 percent annually.
METRO NEWS SUMMARIES
530-foot tower could become Fort Lauderdale’s tallest building
• The city’s Development Review Committee on Sept. 13 will consider plans for the 1.7-acre site at 633 S.E. Third Ave. It currently has a 14,773-square-foot office building called the Trial Lawyer’s Building, which was constructed in 1977. It would be demolished.
• The new tower would rise nearly 530 feet in 47 stories, being the tallest building in Fort Lauderdale. It would have 830 apartments, 12,798 square feet of commercial space, and 951 parking spaces.
• Currently, the tallest building in Fort Lauderdale is the 100 Las Olas condo at 499 feet. Kushner Cos. and Aimco won approval for a 546-foot tower at 300 W. Broward Blvd., although it has yet to break ground. The same group has a pending application for a 572-foot tower at 200 W. Broward Blvd.
Source: South Florida Business Journal, September 12, 2022
‘Bleisure’ travelers give some Fort Lauderdale hotels a lift by lingering for longer stays
• So-called “bleisure” visitors — business travelers who extend their trips for a few extra days so they can take in local attractions — are making their presence felt as the COVID-19 pandemic fades and companies again underwrite the cost of sending employees out of town on business, downtown hoteliers say.
• This trend has created ripple effects throughout the local economy benefiting not only hotels, but also coworking spaces, restaurants, and the Brightline rail service. Coworking spaces in particular are adapting to the changes by rapidly expanding their presence throughout the region.
F ORT L AUDERDALE - P OMPANO B EACH - S UNRISE 40 Florida & Metro Forecast / Winter 2023
• Broward County’s Visit Lauderdale tourism promotional agency has designed its marketing to move past its traditional beach-centric appeals “to highlighting the diversity of the community and the downtown experience,” said Jenni Morejon, CEO of the Downtown Development Authority.
Source: South Florida Sun Sentinel, September 26, 2022
New Fort Lauderdale office tower 92% leased
• One Financial Plaza in Fort Lauderdale is nearly 92% leased after eight companies and firms signed contracts to move into the 28-story building.
• Slated to take up the largest space is Oppenheimer, a full-service brokerage and investment bank with $46.2 billion in assets under management and branches across the U.S. The 140-year-old, New York-based financial company will move into 11,213 square feet (One Financial Plaza’s entire 21st floor) in the second quarter of 2023.
• In the later months of the pandemic, local and out-of-state companies have been searching for quality office space within South Florida. This trend has helped, particularly in Class A and Class B buildings, pushing many landlords to make renovations.
Source: South Florida Business Journal, October 7, 2022
Fort Lauderdale International Boat Show draws crowds and economic activity
• The 63rd Fort Lauderdale International Boat Show, the largest in-water boat show in the world, took place in October at its six different venues, including the Broward County Convention Center and the Bahia Mar Yachting Center.
• Amid rising economic challenges confronting both boat sellers and boat lovers, some say the show didn’t reach the same level of excitement as last year. Many see the Fort Lauderdale Boat Show as a signal for how the rest of the year will fare for the industry.
• This year, The Fort Lauderdale Boat Show hosted an estimated 800 vendors and debuted 30 new vessels. The show is a huge driver of wealth on a local and state level. A recent study suggested that the 2021 show pumped $1.79 billion into Florida’s economy, with $24.5 million in sales taxes going to Broward County alone.
Source: South Florida Sun Sentinel, October 29, 2022
F ORT L AUDERDALE - P OMPANO B EACH - S UNRISE Institute for Economic Forecasting 41
Broward County MSA Industry Location Quotients
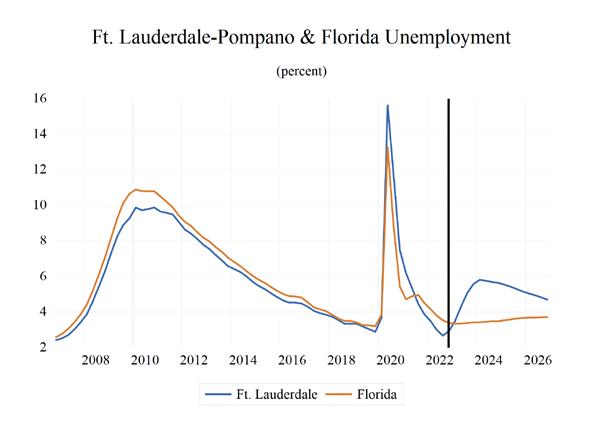
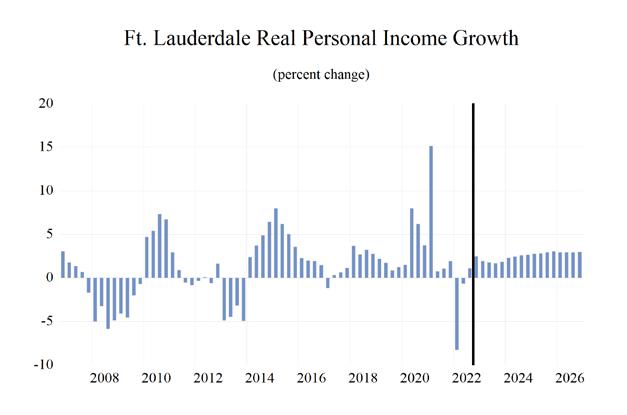

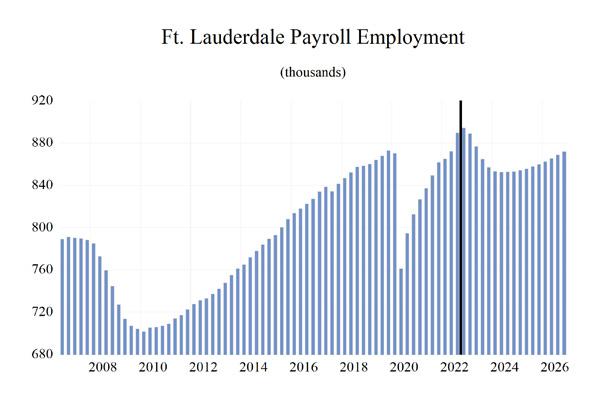
F ORT L AUDERDALE - P OMPANO B EACH - S UNRISE 42 Florida & Metro Forecast / Winter 2023 0 0.2 0.4 0.6 0.8 1 1.2 1.4 1.6 1.8 Total Nonagricultural Employment Total Private Goods Producing Service Producing Private Service Providing Mining, Logging, and Construction Manufacturing Trade, Transportation, and Utilities Wholesale Trade Retail Trade Transportation, Warehousing and Utilities Information Financial Activities Professional and Business Services Educational and Health Services Leisure and Hospitality Other Services Government
Long-Term Outlook for Fort Lauderdale-Pompano Beach-Deerfield Beach, FL (Division of Miami MSA)
December 2022 Forecast
F ORT L AUDERDALE - P OMPANO B EACH - S UNRISE Institute for Economic Forecasting 43
2018 2019 2020 2021 2022 2023 2024 2025 2026 Personal Income (Billions $) Total Personal Income 98.7 105.6 112.4 124.5 129.5 132.7 136.4 143.2 149.8 Pct Chg Year Ago 5.0 7.0 6.4 10.8 4.1 2.5 2.7 5.0 4.6 Wages and Salaries 49.1 51.6 52.0 58.5 64.9 65.6 66.7 69.4 72.5 Nonwage Income 49.6 54.0 60.4 65.9 64.6 67.1 69.6 73.8 77.3 Real Personal Income (12$) 82.8 88.1 91.9 97.5 95.5 94.8 95.2 98.0 100.5 Pct Chg Year Ago 1.6 6.4 4.2 6.2 -2.1 -0.7 0.5 2.9 2.6 Per Capita Income (Ths) 50.8 54.3 57.9 64.5 67.0 68.3 69.4 72.2 74.7 Real Per Capita Income (12$) 42.7 45.3 47.4 50.5 49.4 48.7 48.5 49.4 50.1 Average Annual Wage (Ths) 57.2 59.3 63.9 69.0 73.4 74.9 77.9 80.7 83.2 Pct Chg Year Ago 3.6 3.6 7.9 7.9 6.3 2.1 4.0 3.5 3.2 Establishment Employment (Place of Work, Thousands, SA) Total Employment 853.6 866.2 809.6 843.7 880.3 871.8 852.9 856.8 867.0 Pct Chg Year Ago 2.0 1.5 -6.5 4.2 4.3 -1.0 -2.2 0.5 1.2 Manufacturing 28.1 29.0 27.5 28.1 29.0 28.3 26.4 25.9 26.0 Pct Chg Year Ago 2.1 3.2 -5.1 2.4 3.2 -2.5 -6.6 -2.2 0.6 Nonmanufacturing 825.5 837.2 782.1 815.6 851.3 843.5 826.4 830.9 841.0 Pct Chg Year Ago 2.0 1.4 -6.6 4.3 4.4 -0.9 -2.0 0.5 1.2 Construction & Mining 48.6 50.0 48.9 48.8 50.1 49.4 47.2 46.1 46.1 Pct Chg Year Ago 4.2 2.8 -2.1 -0.2 2.7 -1.3 -4.6 -2.2 -0.1 Trade, Trans, & Utilities 192.6 195.4 185.9 193.5 200.8 195.8 192.4 192.6 193.7 Pct Chg Year Ago 2.8 1.4 -4.9 4.1 3.8 -2.5 -1.7 0.1 0.6 Wholesale Trade 49.8 51.1 49.7 50.7 52.2 52.3 53.8 55.0 56.1 Retail Trade 111.8 111.2 103.1 106.4 109.8 104.7 99.2 97.9 97.5 Trans, Wrhsng, & Util 31.0 33.1 33.1 36.4 38.9 38.8 39.4 39.7 40.1 Information 20.1 19.8 18.8 20.5 21.5 21.3 21.2 21.6 21.5 Pct Chg Year Ago -0.3 -1.4 -5.2 9.4 4.9 -1.0 -0.5 1.8 -0.3 Financial Activities 61.7 64.8 63.7 65.2 67.7 67.7 69.2 69.9 70.2 Pct Chg Year Ago 2.6 4.9 -1.6 2.4 3.7 0.1 2.2 0.9 0.4 Prof & Business Services 151.8 153.5 146.7 157.4 165.9 155.2 139.8 141.8 148.2 Pct Chg Year Ago 2.2 1.1 -4.4 7.3 5.4 -6.4 -9.9 1.4 4.5 Educ & Health Services 111.2 112.5 108.1 111.1 114.2 118.4 120.9 121.1 121.6 Pct Chg Year Ago 0.9 1.1 -3.9 2.8 2.8 3.7 2.1 0.2 0.4 Leisure & Hospitality 96.0 97.5 75.9 84.8 95.0 97.2 94.1 94.1 94.3 Pct Chg Year Ago 1.7 1.6 -22.2 11.7 12.0 2.4 -3.2 0.0 0.2 Other Services 38.0 37.4 31.4 32.7 34.3 35.5 36.6 37.3 37.7 Pct Chg Year Ago -0.7 -1.7 -15.9 3.9 5.0 3.3 3.4 1.7 1.1 Federal Government 7.0 7.0 7.4 7.1 7.1 6.8 7.0 7.3 7.5 Pct Chg Year Ago 0.9 0.5 5.8 -4.4 -0.2 -4.1 3.1 3.9 3.7 State & Local Government 98.5 99.4 95.2 94.5 94.7 96.3 98.1 99.3 100.3 Pct Chg Year Ago 1.6 1.0 -4.2 -0.7 0.2 1.6 1.9 1.2 1.0 Other Economic Indicators Population (Ths) 1941.3 1946.0 1939.7 1930.1 1932.3 1944.5 1963.6 1984.6 2004.3 Pct Chg Year Ago 0.6 0.2 -0.3 -0.5 0.1 0.6 1.0 1.1 1.0 Labor Force (Ths) 1024.0 1032.5 1021.2 1028.9 1054.4 1058.3 1065.0 1077.9 1092.8 Percent Change, Year Ago 1.0 0.8 -1.1 0.8 2.5 0.4 0.6 1.2 1.4 Unemployment Rate (%) 3.5 3.1 9.6 5.0 3.0 4.6 5.7 5.4 4.9 Total Housing Starts 2984.3 4346.9 4605.4 3324.2 2292.1 1887.5 3292.2 4626.3 5238.2 Single-Family 1498.1 1656.3 1425.3 1550.9 1155.5 914.7 1254.5 1459.1 1517.0 Multifamily 1486.2 2690.5 3180.1 1773.2 1136.6 972.8 2037.7 3167.2 3721.3
Short-Term Outlook for Fort Lauderdale-Pompano Beach-Deerfield Beach, FL (Division of Miami MSA) December 2022 Forecast
F ORT L AUDERDALE - P OMPANO B EACH - S UNRISE 44 Florida & Metro Forecast / Winter 2023
2022:4 2023:1 2023:2 2023:3 2023:4 2024:1 2024:2 2024:3 2024:4 2025:1 2025:2 2025:3 2025:4 Personal Income (Billions $) Total Personal Income 131.9 132.6 132.4 132.8 133.1 134.2 135.4 137.1 138.8 140.7 142.5 144.1 145.6 Pct Chg Year Ago 4.4 4.8 3.0 1.3 1.0 1.2 2.2 3.2 4.2 4.8 5.2 5.1 5.0 Wages and Salaries 66.2 66.0 65.7 65.4 65.3 65.8 66.3 67.1 67.7 68.4 69.0 69.7 70.4 Nonwage Income 65.6 66.6 66.8 67.4 67.8 68.5 69.0 70.0 71.0 72.4 73.4 74.4 75.2 Real Personal Income (12$) 95.6 95.4 94.9 94.6 94.2 94.5 94.8 95.5 96.1 97.0 97.7 98.3 98.9 Pct Chg Year Ago -1.2 0.2 -0.2 -1.5 -1.4 -1.0 -0.1 1.0 2.0 2.6 3.0 3.0 2.9 Per Capita Income (Ths) 68.1 68.4 68.2 68.2 68.2 68.6 69.0 69.7 70.4 71.2 71.9 72.5 73.1 Real Per Capita Income (12$) 49.4 49.2 48.9 48.6 48.3 48.3 48.3 48.6 48.7 49.0 49.3 49.5 49.6 Average Annual Wage (Ths) 73.8 74.0 74.6 75.3 75.9 76.7 77.5 78.4 79.1 79.7 80.4 81.0 81.6 Pct Chg Year Ago 1.8 1.7 1.6 2.2 2.9 3.7 3.9 4.1 4.1 3.9 3.7 3.3 3.2 Establishment Employment (Place of Work, Thousands, SA) Total Employment 894.3 888.8 876.6 864.9 856.9 853.3 852.3 852.8 853.1 854.0 855.6 857.6 859.8 Pct Chg Year Ago 3.8 2.8 0.5 -2.8 -4.2 -4.0 -2.8 -1.4 -0.5 0.1 0.4 0.6 0.8 Manufacturing 29.4 29.1 28.7 28.1 27.3 26.9 26.6 26.3 26.1 25.9 25.9 25.8 25.8 Pct Chg Year Ago 1.8 1.0 0.1 -4.1 -6.9 -7.6 -7.5 -6.4 -4.7 -3.5 -2.6 -1.7 -0.9 Nonmanufacturing 864.9 859.7 847.9 836.8 829.6 826.4 825.7 826.5 827.0 828.1 829.7 831.8 834.0 Pct Chg Year Ago 3.8 2.8 0.5 -2.7 -4.1 -3.9 -2.6 -1.2 -0.3 0.2 0.5 0.6 0.8 Construction & Mining 51.1 50.7 49.7 48.8 48.5 47.9 47.3 46.9 46.7 46.3 46.2 46.0 45.9 Pct Chg Year Ago 3.1 2.8 1.6 -4.4 -5.0 -5.7 -4.9 -3.9 -3.7 -3.2 -2.2 -1.9 -1.6 Trade, Trans, & Utilities 201.5 198.9 197.0 193.9 193.3 192.9 192.1 192.4 192.3 192.3 192.4 192.8 192.9 Pct Chg Year Ago 1.7 -0.5 -1.9 -3.5 -4.1 -3.0 -2.5 -0.8 -0.5 -0.3 0.1 0.2 0.3 Wholesale Trade 52.5 52.3 52.0 52.2 52.6 53.1 53.6 54.0 54.3 54.6 54.8 55.1 55.4 Retail Trade 109.8 107.5 106.3 103.1 101.8 100.5 99.0 98.8 98.5 98.1 97.9 98.0 97.7 Trans, Wrhsng, & Util 39.3 39.1 38.7 38.6 38.8 39.2 39.4 39.5 39.5 39.6 39.6 39.7 39.8 Information 21.7 21.6 21.4 21.3 21.0 21.0 21.2 21.2 21.3 21.5 21.5 21.7 21.6 Pct Chg Year Ago 0.3 0.9 0.0 -1.7 -3.3 -2.4 -0.8 -0.2 1.5 2.1 1.7 2.0 1.5 Financial Activities 68.5 67.8 67.4 67.6 68.2 68.7 69.2 69.4 69.6 69.9 69.9 69.8 69.8 Pct Chg Year Ago 2.6 0.2 1.0 -0.4 -0.4 1.3 2.7 2.7 2.1 1.7 1.1 0.6 0.3 Prof & Business Services 167.8 166.3 158.8 151.0 144.6 141.1 139.7 139.2 139.1 139.9 140.9 142.3 143.9 Pct Chg Year Ago 4.2 2.7 -3.8 -10.5 -13.8 -15.2 -12.1 -7.8 -3.8 -0.8 0.9 2.2 3.4 Educ & Health Services 117.5 118.1 117.7 118.6 119.1 120.1 120.9 121.3 121.2 121.2 121.0 121.1 121.1 Pct Chg Year Ago 3.6 6.0 5.7 1.8 1.4 1.7 2.8 2.3 1.7 0.9 0.1 -0.1 0.0 Leisure & Hospitality 99.1 98.5 98.1 97.0 95.2 94.0 94.0 94.0 94.2 93.9 94.1 94.1 94.2 Pct Chg Year Ago 14.2 10.2 3.6 0.3 -3.9 -4.6 -4.2 -3.1 -1.0 -0.1 0.1 0.1 0.0 Other Services 35.4 35.3 35.1 35.4 35.9 36.3 36.6 36.8 36.9 37.1 37.2 37.3 37.4 Pct Chg Year Ago 7.5 7.0 3.9 1.3 1.4 2.7 4.1 3.9 2.8 2.3 1.8 1.5 1.3 Federal Government 6.8 6.8 6.7 6.8 6.8 6.9 7.0 7.0 7.1 7.2 7.2 7.3 7.4 Pct Chg Year Ago -5.2 -7.9 -5.7 -2.2 -0.2 1.5 3.2 3.9 3.9 3.9 3.9 3.9 3.8 State & Local Government 95.5 95.7 95.9 96.4 97.0 97.5 97.9 98.3 98.5 98.8 99.1 99.4 99.7 Pct Chg Year Ago 0.1 0.9 2.5 1.5 1.6 1.9 2.1 1.9 1.6 1.3 1.2 1.1 1.2 Other Economic Indicators Population (Ths) 1934.9 1938.0 1942.2 1946.5 1951.3 1956.0 1960.9 1966.1 1971.5 1976.9 1982.1 1987.3 1992.2 Pct Chg Year Ago 0.3 0.4 0.6 0.7 0.8 0.9 1.0 1.0 1.0 1.1 1.1 1.1 1.1 Labor Force (Ths) 1061.0 1059.9 1057.2 1057.0 1059.2 1061.2 1063.4 1066.2 1069.3 1072.4 1076.0 1080.0 1083.3 Pct Chg Year Ago 2.3 1.5 0.6 -0.5 -0.2 0.1 0.6 0.9 1.0 1.1 1.2 1.3 1.3 Unemployment Rate (%) 2.9 3.5 4.3 5.1 5.6 5.8 5.8 5.7 5.6 5.5 5.4 5.3 5.2 Total Housing Starts 1416.7 1537.6 1760.2 2012.0 2240.1 2668.4 3034.6 3481.9 3983.9 4330.2 4556.4 4747.6 4871.2 Single-Family 871.2 857.5 863.3 926.9 1011.0 1106.7 1210.7 1306.0 1394.6 1435.3 1456.4 1459.8 1485.1 Multifamily 545.5 680.1 896.9 1085.1 1229.0 1561.8 1823.9 2175.9 2589.3 2894.9 3100.0 3287.9 3386.0
PROFILES
The Gainesville MSA is comprised of Alachua and Gilchrist Counties and is located in the central north portion of the state. This metro is home to the University of Florida and the Florida Museum of Natural History, Florida’s official natural history museum.
QUICK FACTS
• Metro population estimate of 323,799 as of 2019 (5-Year Estimate) (U.S. Census Bureau).
• Alachua County population estimate of 269,043 as of 2019 (5-Year Estimate) (U.S. Census Bureau).
• Gilchrist County population estimate of 18,582 as of 2019 (5-Year Estimate) (U.S. Census Bureau).
• Civilian labor force of 152,346 in November 2022 (Florida Research and Economic Database).
• An unemployment rate of 2.6% as of November 2022, not seasonally adjusted. This amounts to 3,936 unemployed people (Florida Research and Economic Database).
OUTLOOK SUMMARIES
The Gainesville Metropolitan Statistical Area (MSA) will show above-average levels of growth in the studied economic indicators. Gross Metro Product of $14,895.80 million will place the MSA 18th in the state for metro output. Relatively strong average annual wage growth of 4.0 percent will help drive personal income growth up 4.8 percent, the 9th of the MSAs studied. The average real annual wage will be $67,600, and per capita income will be $47,100, both around the state average level. Population growth will be 0.7 percent, ranking Gainesville among the lowest in population growth.
Gainesville will be the 8th highest in average annual employment growth, at 0.1 percent, as well as second lowest in unemployment rate, at 4.1 percent.
The Financial Service sector will see the largest annual growth at 2.5 percent. The Other Services sector will follow with a growth rate of 2.3 percent. The sectors experiencing the largest contractions will be the Construction and Mining sector, at -3.8 percent and the Information sector at -2.9 percent.
METRO NEWS SUMMARIES
Alachua County considers plan to partner with Newberry to establish new meat processing center
• Alachua County’s new potential partnership with the city of Newberry for a new meat processing center is hoped to serve the entire county and more.
• Covid-19 has brought concerns to the county, as nationwide supply chain issues have become apparent. County officials are now planning to reorganize the city’s food supply lines and localize it, and so Newberry was chosen.
• The most prominent supporter of this initiative is the county’s 3rd district representative, Anna Prizzia. She believes this initiative will strengthen the local supply lines, and as of this article’s release, an operator has not been chosen. There are hopes that this will help livestock owners as they are dealing with delays at nearby private meat processors.
Source: WUFT, September 27, 2022
Gainesville agribusinesses challenge the inflation struggle
• Inflation has become noticeably worse in 2022, with increasing prices in nearly all produce and products. Not only are consumers starting to worry, so too are agribusinesses (the industry revolving around agriculture).
• Specialized agribusinesses often see slim margins, and “hiccups” such as inflation, can quickly deteriorate those margins. Not only that, but the policies being enacted are being criticized by some of these small businesses as adding more hurdles to the mess.
• The Gainesville City Commission had voted to increase Gainesville Regional Utility rates. While these businesses remain optimistic for the future, they asked the community, particularly the students, to learn the importance of homegrown produce and products and supporting them as a community.
Source: WUFT, September 27, 2022
G AINESVILLE Institute for Economic Forecasting 45
AI center coming to Gulf Coast Research and Education Center
• Artificial Intelligence will be used at University of Florida Institute of Food and Agricultural Sciences to help protect crop yields and the environment. To further this goal, the Institute of Food and Agricultural Sciences at UF (UF/ IFAS) will be building a 19,000 square foot AI hub at the Gulf Coast Research and Education Center (GCREC) in Balm.
• Angle from the UF/IFAS says that “[the center] will be a declaration that Florida’s farmers are in the vanguard of feeding the world in a more sustainable way and the epicenter of accelerated evolution of agriculture from human-laborintensive to technology driven.”
• $1.5 million has already been pledged from Hillsborough County to support the center, with many confident that the center will strengthen the agricultural industry and support the manufacturing industry.
Source: Morning Ag Clips, October 25, 2022
The City of Archer receives $546k in grants and plans on building a new community center
• The city of Archer received grants totaling $546,000, most of which came from The Florida Department of State African American cultural and historical grant.
• A new community center is planned to be constructed in Holly Hills, a historically black neighborhood. Residents found themselves with few recreational sites in that location, and City Manager Tony Hammond says that “This is going to be a gathering place that they can go to and have activities and meetings.”
• The center will have an indoor basketball court, meeting rooms, and a kitchen. City leaders believe the funding will help Archer’s historic identity and provide more opportunities for the residents.
Source: WCJB, October 25, 2022
Florida Department of Economic Opportunity files lawsuit against Gainesville over single-family zoning
• The removal of single-family zoning has been a controversial decision by the Gainesville City Commission. Now the city faces two lawsuits simultaneously.
• The Florida Department of Economic Opportunity along with Faye Williams and Margaret Carr, who are a part of Gainesville Neighborhood Voices, are filing suit against the city. They cite the ordinance’s inconsistencies and outdated data and research, with the DEO further arguing that such ordinances are actually under the State’s authority and not the city’s.
• Due to the lawsuits, development has halted. Not only that, but the overwhelming public backlash has also caused County Commissioner Ken Cornell to state, “Even when you have a good idea, If nine out of ten of your citizens that you work for disagree with that idea, you have to pause.” It is unclear as of now if the two lawsuits will merge into a single lawsuit.
Source: The Alligator, November 30, 2022
Duke Energy Florida, Greater Gainesville Chamber of Commerce power community projects with $160,000 in revitalization grants to cities and towns in Alachua County
• The Duke Energy Foundation is providing 8 Alachua County projects with grants totaling $160,000 to go towards aiding revitalization and local economic developments.
• The company worked with the Greater Gainesville Chamber of Commerce power to identify local projects, each to receive $20,000. The projects ranged from park revitalization to equipment and plan upgrades.
• Many of the small towns receiving these grants are thankful to Duke Energy, as many of these projects are out of their budgets. The company reiterates that it wishes to uplift communities throughout Florida through their grants.
Source: Duke Energy, November 29, 2022
G AINESVILLE 46 Florida & Metro Forecast / Winter 2023
Gainesville MSA Industry Location Quotients
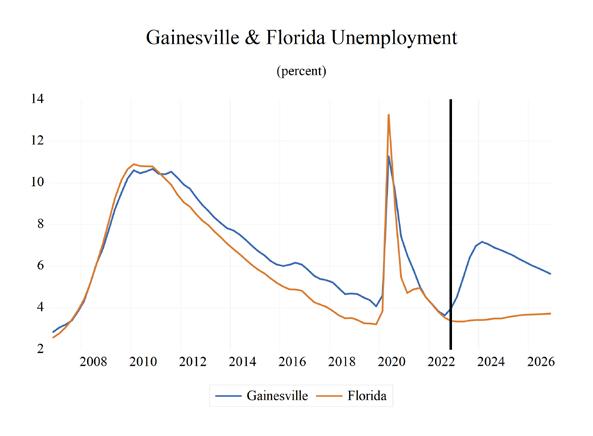
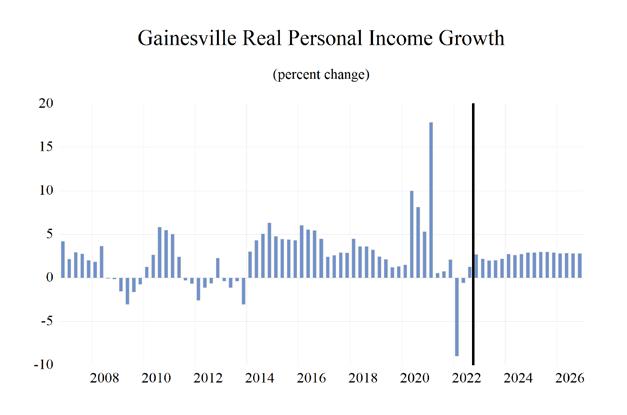
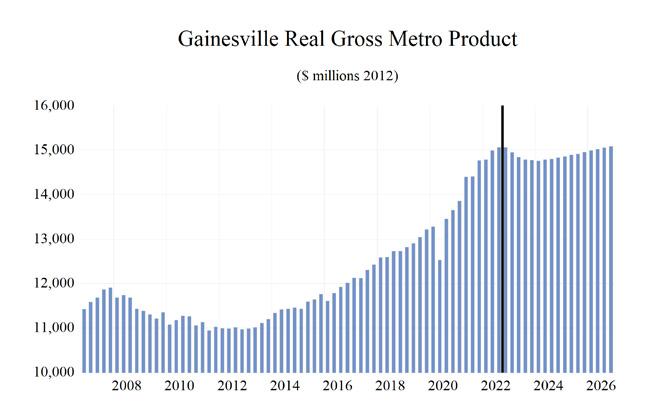
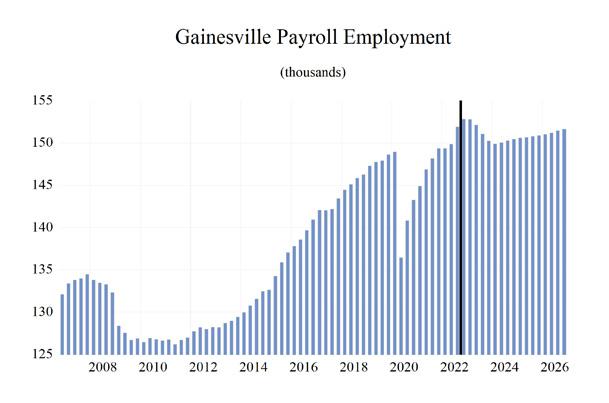
G AINESVILLE Institute for Economic Forecasting 47 0 0.5 1 1.5 2 2.5 3 Total Nonagricultural Employment Total Private Goods Producing Service Producing Private Service Providing Mining, Logging, and Construction Manufacturing Trade, Transportation, and Utilities Wholesale Trade Retail Trade Transportation, Warehousing and Utilities Information Financial Activities Professional and Business Services Educational and Health Services Leisure and Hospitality Other Services Government
Long-Term Outlook for Gainesville, FL December 2022 Forecast
G AINESVILLE 48 Florida & Metro Forecast / Winter 2023
2018 2019 2020 2021 2022 2023 2024 2025 2026 Personal Income (Billions $) Total Personal Income 12.6 13.3 14.3 15.4 15.9 16.6 17.4 18.3 19.2 Pct Chg Year Ago 5.8 5.6 7.5 7.5 3.2 4.3 4.7 5.3 4.8 Wages and Salaries 7.2 7.5 7.9 8.6 9.3 9.6 10.0 10.4 10.9 Nonwage Income 5.4 5.8 6.5 6.8 6.6 7.0 7.3 7.8 8.3 Real Personal Income (12$) 12.1 12.8 13.6 14.1 13.7 13.8 14.1 14.6 15.0 Pct Chg Year Ago 3.8 6.3 6.3 3.1 -2.9 1.0 2.4 3.2 2.8 Per Capita Income (Ths) 43.1 45.2 48.3 51.7 53.2 54.9 57.0 59.6 62.2 Real Per Capita Income (12$) 41.2 43.6 46.0 47.3 45.7 45.7 46.4 47.6 48.7 Average Annual Wage (Ths) 49.1 50.6 55.0 57.8 61.3 63.1 66.4 69.0 71.8 Pct Chg Year Ago 4.6 3.0 8.7 5.1 6.0 3.0 5.1 3.9 4.1 Establishment Employment (Place of Work, Thousands, SA) Total Employment 145.4 147.9 142.4 147.3 151.0 151.6 150.2 150.7 151.3 Pct Chg Year Ago 2.1 1.7 -3.7 3.5 2.5 0.4 -0.9 0.4 0.4 Manufacturing 4.7 4.8 4.5 4.6 4.9 4.8 4.4 4.3 4.3 Pct Chg Year Ago 2.3 2.9 -6.7 3.2 5.6 -2.5 -7.2 -1.9 0.2 Nonmanufacturing 140.7 143.1 137.9 142.7 146.1 146.8 145.8 146.4 147.0 Pct Chg Year Ago 2.1 1.7 -3.6 3.5 2.4 0.5 -0.7 0.4 0.4 Construction & Mining 5.9 6.0 6.1 6.3 6.4 6.3 5.9 5.6 5.5 Pct Chg Year Ago 5.0 3.1 0.6 2.9 2.7 -2.1 -6.7 -4.0 -2.3 Trade, Trans, & Utilities 21.2 21.0 20.4 21.4 22.0 21.4 20.8 20.7 20.8 Pct Chg Year Ago 1.5 -0.8 -3.2 5.2 3.0 -2.7 -3.0 -0.5 0.2 Wholesale Trade 3.0 3.2 3.1 3.1 3.2 3.3 3.3 3.3 3.3 Retail Trade 14.9 14.5 13.8 14.3 14.7 14.1 13.2 12.8 12.6 Trans, Wrhsng, & Util 3.3 3.3 3.5 4.1 4.2 4.1 4.3 4.6 4.8 Information 1.6 1.7 1.6 1.9 2.0 1.9 1.8 1.8 1.8 Pct Chg Year Ago 8.9 7.1 -8.9 20.9 3.8 -4.4 -3.3 -0.9 -3.1 Financial Activities 6.8 6.9 6.6 6.4 6.6 7.0 7.2 7.2 7.2 Pct Chg Year Ago -2.8 1.4 -4.2 -3.1 2.4 6.5 2.8 0.7 -0.1 Prof & Business Services 14.9 15.4 15.6 17.6 17.9 17.3 16.2 16.8 17.5 Pct Chg Year Ago 4.6 3.6 1.5 12.6 1.7 -3.5 -6.2 3.7 4.3 Educ & Health Services 26.4 27.5 27.1 27.5 28.2 29.3 29.8 29.8 29.8 Pct Chg Year Ago 3.5 4.2 -1.3 1.4 2.4 3.9 1.8 -0.1 0.0 Leisure & Hospitality 16.0 16.1 13.2 14.7 15.5 15.1 15.1 15.3 15.3 Pct Chg Year Ago 3.6 1.0 -18.1 11.0 5.9 -3.0 0.4 1.3 -0.5 Other Services 4.4 4.3 3.9 4.0 4.2 4.3 4.5 4.5 4.6 Pct Chg Year Ago 1.1 -1.1 -9.7 1.5 5.6 2.5 3.4 2.1 1.1 Federal Government 4.5 4.6 4.9 4.8 4.8 5.0 4.9 4.9 4.8 Pct Chg Year Ago -3.2 1.9 6.9 -1.7 0.1 3.0 -0.9 -1.1 -1.2 State & Local Government 39.1 39.4 38.4 38.1 38.4 39.2 39.5 39.6 39.7 Pct Chg Year Ago 0.9 0.8 -2.5 -0.8 0.8 2.1 0.7 0.4 0.2 Other Economic Indicators Population (Ths) 293.0 294.7 296.6 297.5 298.9 301.7 304.4 306.4 307.9 Pct Chg Year Ago 1.1 0.6 0.7 0.3 0.5 0.9 0.9 0.7 0.5 Labor Force (Ths) 143.2 145.0 141.5 145.6 148.8 151.5 151.8 152.4 153.3 Percent Change, Year Ago 1.4 1.3 -2.4 2.9 2.1 1.8 0.2 0.4 0.6 Unemployment Rate (%) 3.4 3.0 5.8 3.8 2.6 3.9 4.6 4.2 3.8 Total Housing Starts 1343.3 2202.7 1860.0 2207.1 2523.6 1524.8 1341.6 1505.1 1556.1 Single-Family 726.6 842.6 920.8 1300.3 1402.3 864.4 836.3 887.0 873.6 Multifamily 616.7 1360.1 939.2 906.8 1121.3 660.3 505.3 618.0 682.4
Short-Term Outlook for Gainesville, FL
G AINESVILLE Institute for Economic Forecasting 49
December
2022:4 2023:1 2023:2 2023:3 2023:4 2024:1 2024:2 2024:3 2024:4 2025:1 2025:2 2025:3 2025:4 Personal Income (Billions $) Total Personal Income 16.2 16.4 16.5 16.6 16.8 17.0 17.2 17.5 17.7 17.9 18.2 18.4 18.6 Pct Chg Year Ago 5.0 5.5 4.5 3.8 3.5 3.8 4.5 5.1 5.3 5.4 5.5 5.3 5.2 Wages and Salaries 9.5 9.5 9.6 9.6 9.7 9.8 9.9 10.1 10.2 10.3 10.4 10.5 10.6 Nonwage Income 6.7 6.9 6.9 7.0 7.1 7.2 7.3 7.4 7.5 7.7 7.8 7.9 8.0 Real Personal Income (12$) 13.7 13.8 13.8 13.8 13.9 14.0 14.1 14.2 14.3 14.4 14.5 14.6 14.7 Pct Chg Year Ago -0.7 0.8 1.2 0.9 1.1 1.5 2.1 2.8 3.1 3.2 3.2 3.1 3.2 Per Capita Income (Ths) 54.1 54.5 54.7 55.0 55.5 56.1 56.6 57.3 57.9 58.7 59.3 60.0 60.6 Real Per Capita Income (12$) 45.7 45.8 45.7 45.7 45.8 46.0 46.2 46.5 46.8 47.1 47.4 47.7 48.0 Average Annual Wage (Ths) 61.8 62.1 62.7 63.4 64.3 65.3 66.0 66.8 67.3 68.0 68.6 69.3 70.0 Pct Chg Year Ago 2.6 2.4 2.3 3.2 4.2 5.2 5.3 5.4 4.6 4.2 3.9 3.7 4.0 Establishment Employment (Place of Work, Thousands, SA) Total Employment 152.8 152.8 152.1 151.1 150.3 149.9 150.1 150.3 150.5 150.6 150.7 150.8 150.9 Pct Chg Year Ago 2.3 2.3 1.5 -0.5 -1.7 -1.9 -1.4 -0.5 0.1 0.5 0.4 0.3 0.3 Manufacturing 4.9 4.9 4.9 4.7 4.6 4.5 4.4 4.4 4.4 4.4 4.3 4.3 4.3 Pct Chg Year Ago 2.9 1.9 -1.4 -3.6 -6.7 -7.9 -8.4 -7.3 -4.9 -3.3 -2.3 -1.3 -0.8 Nonmanufacturing 147.9 147.9 147.3 146.3 145.7 145.4 145.6 145.9 146.1 146.3 146.3 146.5 146.6 Pct Chg Year Ago 2.3 2.3 1.6 -0.4 -1.5 -1.7 -1.1 -0.3 0.3 0.6 0.5 0.4 0.3 Construction & Mining 6.5 6.5 6.4 6.2 6.1 6.0 5.9 5.8 5.8 5.7 5.7 5.6 5.6 Pct Chg Year Ago 2.0 2.5 -0.4 -4.3 -6.0 -7.5 -7.4 -6.2 -5.6 -4.9 -3.8 -3.6 -3.5 Trade, Trans, & Utilities 22.0 21.7 21.7 21.3 21.1 21.0 20.8 20.8 20.7 20.7 20.7 20.7 20.7 Pct Chg Year Ago 1.6 -1.3 -2.2 -3.4 -3.9 -3.4 -4.1 -2.4 -1.9 -1.4 -0.5 -0.2 0.0 Wholesale Trade 3.2 3.2 3.3 3.3 3.3 3.3 3.3 3.3 3.3 3.3 3.3 3.3 3.3 Retail Trade 14.6 14.3 14.3 13.9 13.7 13.5 13.2 13.1 13.0 12.9 12.9 12.8 12.7 Trans, Wrhsng, & Util 4.1 4.1 4.1 4.1 4.2 4.2 4.3 4.3 4.4 4.5 4.5 4.6 4.7 Information 2.0 1.9 1.9 1.9 1.9 1.9 1.9 1.8 1.8 1.8 1.8 1.8 1.8 Pct Chg Year Ago -3.7 -3.4 -3.6 -4.1 -6.5 -5.0 -3.5 -3.3 -1.1 -0.5 -0.9 -0.8 -1.4 Financial Activities 6.8 6.9 7.0 7.0 7.1 7.1 7.2 7.2 7.2 7.2 7.2 7.2 7.2 Pct Chg Year Ago 3.9 7.0 8.1 6.4 4.5 2.8 2.9 3.1 2.5 1.7 0.7 0.3 -0.1 Prof & Business Services 18.2 18.3 17.6 16.9 16.4 16.1 16.1 16.2 16.4 16.5 16.7 16.9 17.1 Pct Chg Year Ago 2.3 2.3 0.1 -6.1 -10.0 -11.6 -8.4 -4.0 0.0 2.5 3.6 4.1 4.5 Educ & Health Services 28.9 29.1 29.2 29.4 29.5 29.7 29.8 29.9 29.9 29.8 29.8 29.8 29.8 Pct Chg Year Ago 4.5 5.2 5.1 3.5 2.1 2.0 2.2 1.6 1.3 0.6 -0.2 -0.4 -0.3 Leisure & Hospitality 15.7 15.2 15.0 15.0 14.9 14.9 15.1 15.2 15.4 15.4 15.4 15.3 15.3 Pct Chg Year Ago 4.9 1.6 -3.9 -4.9 -4.5 -2.5 0.1 1.2 2.9 3.5 2.0 0.6 -0.5 Other Services 4.3 4.3 4.3 4.3 4.4 4.4 4.4 4.5 4.5 4.5 4.5 4.6 4.6 Pct Chg Year Ago 4.8 4.9 2.2 1.3 1.8 3.0 4.4 3.4 2.9 2.5 2.1 2.1 1.6 Federal Government 4.9 5.0 5.0 5.0 5.0 5.0 5.0 4.9 4.9 4.9 4.9 4.9 4.9 Pct Chg Year Ago 1.3 1.6 4.1 4.5 1.9 0.3 -1.3 -1.3 -1.1 -1.1 -1.1 -1.1 -1.1 State & Local Government 38.8 39.0 39.2 39.3 39.4 39.4 39.4 39.5 39.5 39.6 39.6 39.6 39.7 Pct Chg Year Ago 0.1 1.8 3.4 1.6 1.5 1.0 0.6 0.6 0.5 0.4 0.4 0.3 0.3 Other Economic Indicators Population (Ths) 299.9 300.7 301.3 302.0 302.7 303.5 304.1 304.7 305.2 305.7 306.2 306.6 307.0 Pct Chg Year Ago 0.7 0.9 0.9 1.0 1.0 0.9 0.9 0.9 0.8 0.7 0.7 0.6 0.6 Labor Force (Ths) 150.3 151.0 151.6 151.7 151.7 151.7 151.7 151.8 152.0 152.1 152.3 152.6 152.7 Pct Chg Year Ago 2.4 2.5 2.3 1.7 0.9 0.4 0.1 0.1 0.2 0.3 0.4 0.5 0.5 Unemployment Rate (%) 2.6 3.0 3.6 4.2 4.6 4.7 4.7 4.5 4.5 4.4 4.3 4.2 4.1 Total Housing Starts 2166.4 1782.8 1556.5 1429.5 1330.3 1288.3 1286.8 1362.8 1428.7 1471.0 1503.6 1516.3 1529.4 Single-Family 1122.2 930.7 872.4 835.0 819.6 798.4 809.0 855.4 882.5 889.1 890.9 883.8 884.3 Multifamily 1044.2 852.0 684.1 594.5 510.7 489.9 477.8 507.4 546.2 581.9 612.7 632.5 645.1
2022 Forecast
PROFILES
The Homosassa Springs MSA is located in the central northwest portion of the state. Homosassa Springs is a Census designated place in Citrus county and is known for and named after the warm spring located in Homosassa Springs Wildlife State Park which attracts manatees to the area.
QUICK FACTS
• Metro population estimate of 145,169 as of 2019 (5-Year Estimate) (U.S. Census Bureau).
• Citrus County population estimate of 145,169 as of 2019 (5-Year Estimate) (U.S. Census Bureau).
• Civilian labor force 47,124 in November 2022 (Florida Research and Economic Database).
• An unemployment rate of 4.1% as of November 2022, not seasonally adjusted. This amounts to 1,909 unemployed people (Florida Research and Economic Database).
OUTLOOK SUMMARIES
The Homosassa Springs Metropolitan Statistical Area (MSA) is expected to see mixed growth in most of the economic indicators, relative to the other MSAs studied. Homosassa’s expected Gross Metro Product of $4,165.41 million will be second lowest in the state. Personal income growth of 5.2 percent will put the MSA’s per capita income level at $40,800, the fourth lowest in the state. Average annual wage growth of 3.2 percent, the 17th highest, will push the average real annual wage up to $55,600, the lowest in the state. Population growth will be at the state’s average of 1.1 percent.
Employment growth is expected to average 0.0 percent annually. Homosassa’s unemployment rate will come in at 6.8 percent, tied with Sebring as the highest in the state.
The fastest growing sector in the Homosassa Springs MSA will be the Federal Government sector, which will see an average annual growth rate of 4.3 percent.
The Other Services sector will come in second at a growth rate of 3.2 percent. The Manufacturing sector will see the largest contraction in growth, at -4.1 percent.
METRO NEWS SUMMARIES
Homosassa Springs, FL ranks as one of the poorest big cities in the country
• The typical household in the Homosassa Springs metro area in Florida earns $47,197 a year - the 15th lowest among the 384 U.S. metropolitan areas with available data. This is about $22,520 less than the national median household income of $69,717.
• Homosassa Springs also has a higher-thanaverage poverty rate. An estimated 16.1% of the metro area population live below the poverty line, compared to 12.8% of all Americans nationwide.
• All data in this story is based on one-year estimates from the U.S. Census Bureau’s 2021 American Community Survey.
Source: The Center Square, September 24, 2022
Renovations on Monkey Island underway to upgrade primates’ sandy home on Homosassa River
• The three spider monkeys living on Monkey Island at Florida Cracker Riverside Resort moved to Boyett’s Grove in Hernando County in midOctober.
• The goal is to complete the renovations before next summer’s scalloping season, explained Marie Straight, secretary of the Historic Monkey Island board.
• The renovation of Monkey Island has been a couple of years in the making. Wednesday, their wooden house was knocked down, starting months of construction projects before the three primates can return. The renovations are long overdue.
Source: Fox 13 News, October 26, 2022
HOMOSASSA SPRINGS 50 Florida & Metro Forecast / Winter 2023
Citrus County’s October jobless rate unchanged at 4%
• Citrus County’s unemployment rate for October was 4%, the same as in September and 0.6 percentage points lower than a year ago.
• The jobless rate in the CareerSource Citrus Levy Marion region was 3.4% in October, unchanged over the month and 0.8 percentage points lower than the region’s rate one year ago, which was 4.2%. The labor force was 210,238, up 3,193 (+1.5%) over the year. There were 7,169 unemployed residents in the region.
• In the Homosassa Springs metro area, 200 new government jobs were added over the year for a 4.4% growth rate, the second fastest annual growth rate compared to all metro areas.
Source: Chronicle Online, November 18, 2022
Starbucks is coming to Inverness
• The Insight Credit Union off State Road 44 will be torn down to make way for a new standalone Starbucks in Inverness.
• The concept plan provided by the city shows the new Starbucks will contain 2,500 square feet, have 72 seats inside and on the patio and employ six employees. The site is 1.62 acres.
• Inverness is Insight’s lone Citrus County facility. George Davis, president, and CEO of Insight Credit Union, was mum about where a future credit union might open in Citrus County. “We routinely evaluate our branch footprint and explore opportunities that could afford for expansion/growth in a market,” Davis said in a statement. “While the process may at times preclude us from sharing particulars, Insight Credit Union remains committed to serving our members in Citrus County and intends to for many years to come.”
Source: Chronicle Online, November 18, 2022
Tourism tax revenue up 21% over last year
• Tourism tax collections in Citrus County this fiscal year were up 21%. The county netted $3.12 million from Oct. 1, 2021, to Sept. 30, 2022, compared to $2.44 million during the same period the previous year, according to Citrus County Tourist Development Council data. The $2.44 million from the 2020-21 fiscal year was itself a huge increase (29%) from the previous year.
• So, what’s driving this increase? “It’s a combination of things,” said John Pricher, director of Citrus County Tourist Development. “Coming out of the pandemic, more people have discovered what we have to offer. There’s been a shift in travel a little bit.”
• Visit Florida estimates the state attracted 35 million travelers during the 2022 third quarter, a 6.9% increase from 2021. The estimate was 8% above the same period of 2019, before the pandemic.
Source: Chronicle Online, December 8, 2022
Gulf Coast Marine owners close shop after 45-plus years
• On Friday, the owners, Skip and Linda Turvaville, closed their doors after 45 years and headed off to retirement.
• The Turvavilles bought the property in 1977, and it had been vacant for quite some time. The old Homosassa Post Office operated on the site until 1969. They built the structure that would house their outboard engine repair business.
• Skip said he will fulfill existing work orders, but unless someone decides to take over the business, it’s closed for good.
Source: Chronicle Online, December 23, 2022
HOMOSASSA SPRINGS Institute for Economic Forecasting 51
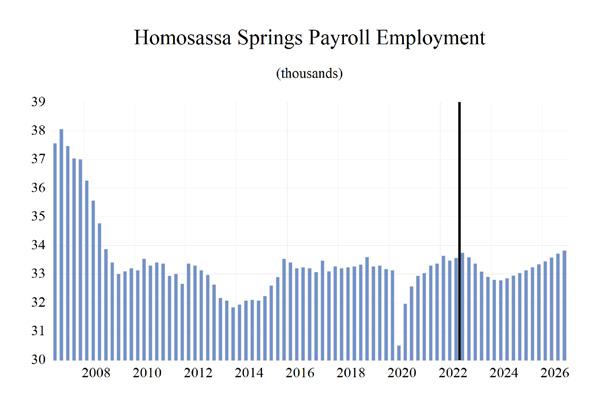
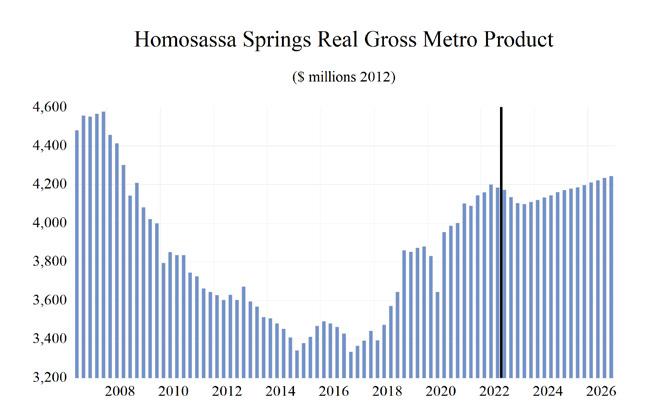

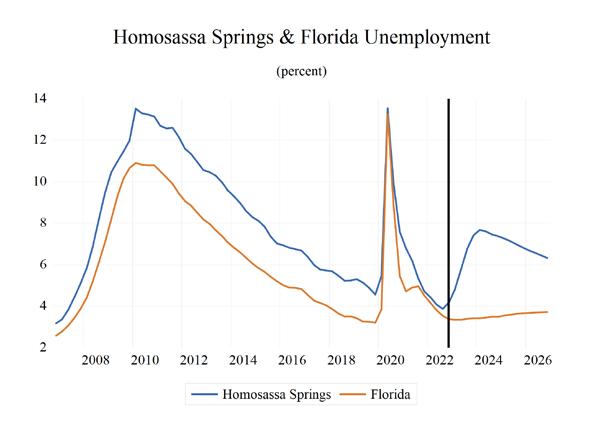
HOMOSASSA SPRINGS 52 Florida & Metro Forecast / Winter 2023 0 0.2 0.4 0.6 0.8 1 1.2 1.4 Total Nonagricultural Employment Total Private Goods Producing Service Producing Private Service Providing Government Homosassa Springs MSA Industry Loca�on Quo�ents
Long-Term Outlook for Homosassa Springs, FL December 2022 Forecast
HOMOSASSA SPRINGS Institute for Economic Forecasting 53
2018 2019 2020 2021 2022 2023 2024 2025 2026 Personal Income (Billions $) Total Personal Income 5.7 6.1 6.5 7.1 7.3 7.6 8.0 8.5 8.9 Pct Chg Year Ago 4.5 7.1 7.8 9.1 2.1 5.0 4.6 6.0 5.3 Wages and Salaries 1.4 1.4 1.4 1.6 1.7 1.8 1.8 1.9 2.0 Nonwage Income 4.3 4.6 5.1 5.5 5.5 5.9 6.2 6.6 6.9 Real Personal Income (12$) 5.6 6.0 6.4 6.7 6.4 6.5 6.6 6.9 7.1 Pct Chg Year Ago -2.4 7.2 6.8 4.6 -4.0 1.7 2.3 3.9 3.3 Per Capita Income (Ths) 37.9 39.9 42.2 45.0 45.0 46.6 48.1 50.7 53.0 Real Per Capita Income (12$) 37.2 39.2 41.1 42.0 39.6 39.6 40.0 41.3 42.3 Average Annual Wage (Ths) 41.2 42.1 44.7 47.8 51.4 52.6 54.9 56.5 58.2 Pct Chg Year Ago 2.6 2.2 6.2 6.9 7.4 2.5 4.3 3.0 2.9 Establishment Employment (Place of Work, Thousands, SA) Total Employment 33.3 33.3 32.0 33.2 33.6 33.2 32.8 33.2 33.6 Pct Chg Year Ago 0.1 0.2 -3.9 3.5 1.3 -1.1 -1.2 1.0 1.4 Manufacturing 0.5 0.5 0.5 0.6 0.6 0.6 0.5 0.5 0.5 Pct Chg Year Ago 1.5 4.6 0.8 7.4 2.9 -2.8 -9.8 -3.7 -0.3 Nonmanufacturing 32.8 32.8 31.5 32.6 33.0 32.7 32.3 32.7 33.1 Pct Chg Year Ago 0.1 0.2 -3.9 3.4 1.3 -1.1 -1.0 1.1 1.4 Construction & Mining 3.0 3.0 3.0 3.1 3.1 3.1 3.0 2.9 2.9 Pct Chg Year Ago 3.5 1.5 -0.2 3.3 0.8 -0.8 -4.4 -1.9 0.1 Trade, Trans, & Utilities 7.5 7.4 7.2 7.3 7.4 7.2 7.0 7.0 7.0 Pct Chg Year Ago -0.1 -1.1 -2.7 1.5 1.3 -2.9 -2.2 -0.6 0.0 Wholesale Trade 1.0 1.0 1.0 1.0 1.0 1.0 1.1 1.1 1.1 Retail Trade 5.2 5.1 5.0 5.0 5.1 4.9 4.7 4.7 4.6 Trans, Wrhsng, & Util 1.2 1.2 1.2 1.2 1.2 1.2 1.2 1.2 1.2 Information 0.3 0.3 0.3 0.3 0.3 0.3 0.3 0.3 0.3 Pct Chg Year Ago -7.5 -6.2 -7.5 -7.9 6.4 -3.4 -2.1 -0.5 -2.5 Financial Activities 1.2 1.3 1.3 1.4 1.4 1.5 1.5 1.5 1.5 Pct Chg Year Ago 3.1 4.2 -0.8 10.2 4.2 1.2 1.1 1.1 0.7 Prof & Business Services 3.2 3.2 3.2 3.5 3.7 3.5 3.3 3.4 3.5 Pct Chg Year Ago -3.6 -0.3 -0.2 10.9 4.7 -5.1 -5.3 3.3 2.7 Educ & Health Services 7.4 7.7 7.3 7.2 6.8 7.0 7.2 7.3 7.5 Pct Chg Year Ago -1.8 4.3 -6.0 -1.3 -4.9 2.7 2.8 1.6 2.4 Leisure & Hospitality 4.8 4.6 4.2 4.6 4.8 4.6 4.5 4.7 4.8 Pct Chg Year Ago 2.4 -3.9 -8.4 9.4 4.5 -3.8 -2.1 3.3 2.9 Other Services 1.1 0.9 0.9 0.9 1.0 1.0 1.1 1.1 1.1 Pct Chg Year Ago 2.5 -11.7 -9.3 9.3 7.5 2.2 5.1 3.5 2.1 Federal Government 0.2 0.2 0.2 0.2 0.2 0.2 0.2 0.2 0.2 Pct Chg Year Ago 3.6 3.6 -8.2 -12.5 -5.6 -8.3 2.3 11.4 11.9 State & Local Government 4.1 4.2 4.1 4.1 4.3 4.3 4.3 4.3 4.3 Pct Chg Year Ago 0.8 1.2 -2.2 1.5 3.6 1.3 -0.3 0.1 -0.2 Other Economic Indicators Population (Ths) 149.2 151.7 154.9 158.4 161.4 163.9 165.8 167.1 168.4 Pct Chg Year Ago 1.7 1.7 2.1 2.3 1.9 1.5 1.1 0.8 0.8 Labor Force (Ths) 47.2 47.0 46.6 47.3 47.5 48.1 48.0 47.8 47.7 Percent Change, Year Ago -0.8 -0.4 -0.8 1.6 0.4 1.3 -0.2 -0.4 -0.3 Unemployment Rate (%) 5.4 5.0 9.1 5.8 4.1 6.2 7.5 7.0 6.5 Total Housing Starts 845.0 869.6 892.4 1845.6 1580.7 1154.0 1070.5 1146.6 1140.3 Single-Family 823.7 724.6 860.8 1835.9 1565.2 1149.6 1054.3 1121.2 1106.4 Multifamily 21.3 144.9 31.6 9.7 15.5 4.4 16.2 25.4 33.9
Short-Term Outlook for Homosassa Springs, FL
HOMOSASSA SPRINGS 54 Florida & Metro Forecast / Winter 2023
2022:4 2023:1 2023:2 2023:3 2023:4 2024:1 2024:2 2024:3 2024:4 2025:1 2025:2 2025:3 2025:4 Personal Income (Billions $) Total Personal Income 7.4 7.6 7.6 7.7 7.7 7.8 7.9 8.0 8.1 8.3 8.4 8.5 8.6 Pct Chg Year Ago 6.2 6.4 5.1 4.6 3.9 3.8 4.4 4.8 5.3 5.7 6.2 6.3 6.0 Wages and Salaries 1.8 1.8 1.8 1.8 1.8 1.8 1.8 1.8 1.8 1.9 1.9 1.9 1.9 Nonwage Income 5.7 5.8 5.8 5.9 6.0 6.1 6.1 6.2 6.3 6.4 6.5 6.6 6.7 Real Personal Income (12$) 6.4 6.5 6.5 6.5 6.5 6.6 6.6 6.7 6.7 6.8 6.9 6.9 7.0 Pct Chg Year Ago 0.4 1.7 1.8 1.7 1.5 1.5 2.0 2.5 3.0 3.5 3.9 4.1 4.0 Per Capita Income (Ths) 45.9 46.3 46.4 46.6 47.0 47.5 47.8 48.3 49.0 49.7 50.4 51.0 51.6 Real Per Capita Income (12$) 39.6 39.7 39.6 39.6 39.6 39.8 39.9 40.1 40.4 40.8 41.1 41.4 41.7 Average Annual Wage (Ths) 51.8 51.9 52.3 52.8 53.4 54.1 54.7 55.2 55.6 56.0 56.3 56.7 57.1 Pct Chg Year Ago 3.7 2.9 1.7 2.1 3.1 4.1 4.5 4.6 4.0 3.5 3.0 2.7 2.8 Establishment Employment (Place of Work, Thousands, SA) Total Employment 33.7 33.6 33.4 33.1 32.9 32.8 32.8 32.9 32.9 33.0 33.1 33.2 33.3 Pct Chg Year Ago 1.1 -0.1 -0.3 -1.4 -2.5 -2.3 -1.7 -0.7 0.1 0.7 1.0 1.1 1.2 Manufacturing 0.6 0.6 0.6 0.6 0.5 0.5 0.5 0.5 0.5 0.5 0.5 0.5 0.5 Pct Chg Year Ago 5.6 1.6 0.2 -4.1 -8.5 -10.3 -11.1 -9.9 -7.6 -5.4 -4.2 -3.0 -1.9 Nonmanufacturing 33.2 33.0 32.8 32.5 32.4 32.3 32.3 32.4 32.5 32.5 32.6 32.7 32.9 Pct Chg Year Ago 1.1 -0.2 -0.3 -1.4 -2.4 -2.2 -1.6 -0.5 0.3 0.8 1.1 1.2 1.2 Construction & Mining 3.2 3.2 3.1 3.1 3.0 3.0 3.0 2.9 2.9 2.9 2.9 2.9 2.9 Pct Chg Year Ago 1.5 1.6 1.4 -2.2 -4.1 -5.4 -5.0 -3.7 -3.4 -2.8 -1.9 -1.5 -1.4 Trade, Trans, & Utilities 7.3 7.2 7.2 7.1 7.1 7.0 7.0 7.0 7.0 7.0 6.9 7.0 7.0 Pct Chg Year Ago -1.2 -2.7 -1.7 -3.5 -3.5 -2.7 -3.3 -1.7 -1.3 -1.2 -0.5 -0.4 -0.3 Wholesale Trade 1.0 1.1 1.0 1.0 1.0 1.1 1.1 1.1 1.1 1.1 1.1 1.1 1.1 Retail Trade 5.1 5.0 5.0 4.9 4.8 4.8 4.7 4.7 4.7 4.7 4.7 4.7 4.7 Trans, Wrhsng, & Util 1.2 1.2 1.2 1.2 1.2 1.2 1.2 1.2 1.2 1.2 1.2 1.2 1.2 Information 0.3 0.3 0.3 0.3 0.3 0.3 0.3 0.3 0.3 0.3 0.3 0.3 0.3 Pct Chg Year Ago 3.2 -2.4 -4.5 -2.1 -4.7 -3.3 -2.0 -2.4 -0.8 -0.3 -0.8 -0.3 -0.8 Financial Activities 1.5 1.5 1.5 1.5 1.5 1.5 1.5 1.5 1.5 1.5 1.5 1.5 1.5 Pct Chg Year Ago 2.2 2.0 1.4 1.4 0.1 -0.1 0.6 2.0 2.0 1.7 1.4 0.8 0.6 Prof & Business Services 3.7 3.7 3.6 3.4 3.3 3.3 3.3 3.3 3.4 3.4 3.4 3.5 3.5 Pct Chg Year Ago 3.2 0.6 -3.8 -7.1 -10.1 -10.9 -7.3 -3.1 0.5 2.7 3.4 3.6 3.7 Educ & Health Services 6.9 6.9 7.0 7.0 7.1 7.1 7.2 7.2 7.2 7.3 7.3 7.3 7.4 Pct Chg Year Ago -1.4 1.4 2.6 4.0 2.9 3.5 3.5 2.3 1.9 1.5 1.2 1.6 2.0 Leisure & Hospitality 4.8 4.7 4.6 4.6 4.6 4.5 4.5 4.5 4.6 4.6 4.7 4.7 4.7 Pct Chg Year Ago 3.0 -2.5 -4.1 -3.7 -4.7 -4.3 -2.9 -1.8 0.7 3.0 3.6 3.5 3.1 Other Services 1.0 1.0 1.0 1.0 1.1 1.1 1.1 1.1 1.1 1.1 1.1 1.1 1.1 Pct Chg Year Ago 8.9 2.2 1.5 2.4 2.8 4.1 5.6 5.7 5.0 4.4 4.0 3.1 2.7 Federal Government 0.2 0.2 0.2 0.2 0.2 0.2 0.2 0.2 0.2 0.2 0.2 0.2 0.2 Pct Chg Year Ago -18.6 -21.1 -14.9 5.2 3.0 1.8 0.7 1.7 5.1 8.1 11.2 13.5 13.0 State & Local Government 4.3 4.3 4.3 4.3 4.3 4.3 4.3 4.3 4.3 4.3 4.3 4.3 4.3 Pct Chg Year Ago 3.4 2.3 3.5 0.1 -0.7 -0.6 -0.6 -0.1 0.0 0.1 0.2 -0.1 -0.1 Other Economic Indicators Population (Ths) 162.4 163.0 163.6 164.2 164.8 165.2 165.6 166.0 166.3 166.6 166.9 167.3 167.6 Pct Chg Year Ago 1.7 1.6 1.6 1.5 1.5 1.3 1.2 1.1 0.9 0.8 0.8 0.8 0.8 Labor Force (Ths) 47.7 47.9 48.1 48.2 48.2 48.1 48.0 47.9 47.9 47.8 47.8 47.8 47.7 Pct Chg Year Ago 0.7 0.9 1.3 1.8 1.2 0.5 -0.2 -0.6 -0.7 -0.6 -0.5 -0.3 -0.3 Unemployment Rate (%) 4.2 4.8 5.8 6.8 7.4 7.7 7.6 7.5 7.4 7.3 7.1 7.0 6.8 Total Housing Starts 1478.2 1272.5 1158.7 1119.6 1065.3 1030.9 1037.2 1083.8 1130.0 1145.7 1143.1 1147.4 1150.1 Single-Family 1485.7 1273.4 1154.8 1113.0 1057.4 1019.8 1023.4 1065.0 1109.1 1122.6 1118.5 1120.8 1122.9 Multifamily -7.6 -0.9 3.9 6.6 8.0 11.2 13.8 18.9 20.9 23.1 24.5 26.7 27.2
December 2022 Forecast
PROFILES
The Jacksonville MSA is comprised of Baker, Clay, Duval, Nassau, and St. Johns counties. It is located on the northeast coast of Florida and is home to several major U.S. military bases, such as the Jacksonville Naval Air Station, as well as shipyards, the University of North Florida, and the Jacksonville International Airport.
QUICK FACTS
• Metro population estimate of 1,503,574 as of 2019 (5-Year Estimate) (U.S. Census Bureau).
• Baker County population estimate of 29,201 as of 2019 (5-Year Estimate) (U.S. Census Bureau).
• Clay County population estimate of 219,252 as of 2019 (5-Year Estimate) (U.S. Census Bureau).
• Duval County population estimate of 957,755 as of 2019 (5-Year Estimate) (U.S. Census Bureau).
• Nassau County population estimate of 88,625 as of 2019 (5-Year Estimate) (U.S. Census Bureau).
• St. John County population estimate of 264,672 as of 2019 (5-Year Estimate) (U.S. Census Bureau).
• Civilian labor force of 842,323 in November 2022 (Florida Research and Economic Database).
• An unemployment rate of 2.5% as of November 2022, not seasonally adjusted. This amounts to 21,144 unemployed people (Florida Research and Economic Database).
OUTLOOK SUMMARIES
The Jacksonville Metropolitan Statistical Area (MSA) is expected to see a relatively high growth in most of the economic indicators, relative to the other MSAs studied. Jacksonville’s expected Gross Metro Product of $85,434.61 million will be sixth in the state. Personal income growth of 4.9 percent will put the MSA’s per capita income level at $51,400. Average annual wage growth of 3.9 percent will push the average real annual wage to $75,900, the 5th highest in the state. Population growth will be 1.5 percent.
Employment growth is expected to average an above average 0.1 percent annually. Jacksonville’s unemployment rate will come in at 4.9 percent. The fastest growing sector in the Jacksonville MSA will be the Other Services sector, which will see an average annual growth rate of 3.8 percent. The Education and Health sector will come in second at a growth rate of 2.0 percent, followed by the Financial Services sector at 1.8 percent. The Professional and Business Services sector, and the Construction & Mining sector will see respective contractions in growth of -3.0 percent, and -2.6 percent.
METRO NEWS SUMMARIES
Family Promise of Jacksonville expands to offer lifesaving support to more homeless families
• Executive Director of Family Promise of Jacksonville Mark Landshoot said, “The whole rent market is horrible. Families we had stabilized are not stable anymore.”
• First founded in 2006, Family Promise of Jacksonville, has helped over 400 families including nearly 100 families just in 2021.
• To be able to serve more people, the agency has moved to a bigger space at Arlington Congregational Church.
Source: Jacksonville, September 16, 2022
Amid labor shortages, Jacksonville employers turn to paid apprenticeships to help staff the workforce
• Florida has been promoting apprenticeships, particularly focusing on apprenticeships in the hospitality and healthcare industries.
• Such programs have received $15 million in funding, an increase from $10 million in previous years.
• Northeast Florida Builders Association has had one of its largest cohorts in recent years this year and Independent Electrical Contractors has added an additional class in Jacksonville.
Source: Jacksonville, September 23, 2022
J ACKSONVILLE Institute for Economic Forecasting 55
Jacksonville is mecca for warehouse industry, including $51.8 million growth at Imeson Park
• As industrial development continues to expand in Jacksonville, a new distribution warehouse is set to open.
• The warehouse will be 1 million square feet and will cost $51.8 million to build.
• The permits related to the project have already been approved by the city.
Source: Jacksonville, October 2, 2022
Fortune 500 company FIS opens new Jacksonville headquarters in Riverside
• FIS, which is a company that offers financial products and services, has just opened its headquarters in Jacksonville.
• The company has almost $14 billion in revenue each year.
• In 2019, the company said that it would be at least 500 new jobs in the area over the next 10 years, and the company is already over halfway to achieving that goal.
Source: Jacksonville, October 14, 2022
New JEA headquarters in Jacksonville sells before employees even move in
• JEA’s new headquarters in downtown Jacksonville has been sold to Real Capital Solutions.
• The 153,000 square foot building is owned by Ryan Companies Inc., which will still manage the building after the sale.
• “Ryan does a lot of things,” Doug Dieck, the Southeast Regional President of Ryan Companies, said. He continued, “Ryan has built a great relationship with JEA and has been selected and will be managing the building for our buyer.”
Source: Jacksonville, November 6, 2022
After White House event, Jacksonville firm targets cybersecurity need in local governments
• Melissa Boutwell, the Jacksonville CEO of Automation Strategy & Performance, attended an event at the White House to talk about cybersecurity and jobs.
• Now, she hopes that her company can help fill cybersecurity job vacancies starting with Florida and the first coast.
• Automation Strategy & Performance is launching an initiative in January that will hopefully allow employers to be able to pinpoint and enhance their cybersecurity gaps.
Source: Jacksonville, November 25, 2022
Breeze Airways adding new flights from Jacksonville
• Breeze Airways, a low-cost airline, had its inaugural flight from Jacksonville just seven months ago.
• Now, the airline is adding new destinations including non-stop flights to Raleigh-Durham International Airport.
• “In less than one year, Breeze Airways has added a considerable number of new nonstop flights to some of our largest unserved markets,” said Mark VanLoh, CEO of Jacksonville Aviation Authority. “Today’s announcement means much-needed service to Raleigh-Durham and the welcome return of flights to several cities,” he continued.
Source: Jacksonville, December 8, 2022
Popular Jacksonville Beach amusement park gets a reprieve from the wrecking ball — for now
• Adventureland has reached an agreement with its landlord allowing them to continue to operate through the 2023 season.
• The amusement park is slated to close by the end of September unless the landlord agrees to another lease extension.
• Permanently closing the amusement park would allow for redevelopment, which will convert the amusement park into a luxury apartment community.
Source: Jacksonville, December 21, 2022
J ACKSONVILLE 56 Florida & Metro Forecast / Winter 2023
Jacksonville MSA Industry Location Quotients
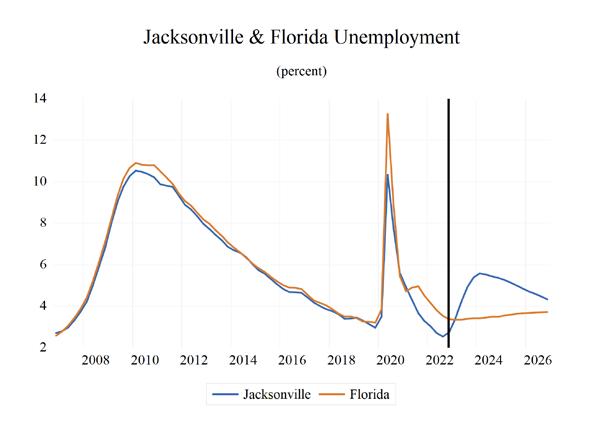


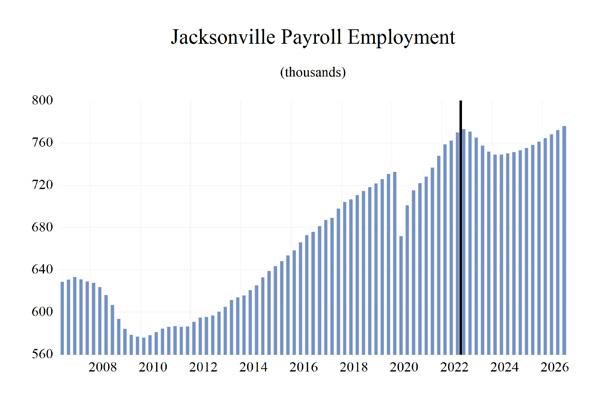
J ACKSONVILLE Institute for Economic Forecasting 57 0 0.2 0.4 0.6 0.8 1 1.2 1.4 1.6 Total Nonagricultural Employment Total Private Goods Producing Service Producing Private Service Providing Mining, Logging, and Construction Manufacturing Trade, Transportation, and Utilities Wholesale Trade Retail Trade Transportation, Warehousing and Utilities Information Financial Activities Professional and Business Services Educational and Health Services Leisure and Hospitality Other Services Government
Long-Term Outlook for Jacksonville, FL December 2022 Forecast
J ACKSONVILLE 58 Florida & Metro Forecast / Winter 2023
2018 2019 2020 2021 2022 2023 2024 2025 2026 Personal Income (Billions $) Total Personal Income 77.2 82.5 88.9 97.1 101.3 105.6 110.4 116.6 122.6 Pct Chg Year Ago 5.3 6.9 7.8 9.2 4.3 4.3 4.5 5.6 5.1 Wages and Salaries 40.2 42.1 44.0 48.5 53.8 55.6 57.2 59.8 62.9 Nonwage Income 37.0 40.4 44.9 48.6 47.4 50.0 53.2 56.8 59.7 Real Personal Income (12$) 73.2 77.9 83.0 86.9 85.3 86.1 88.0 91.1 94.0 Pct Chg Year Ago 5.0 6.5 6.4 4.7 -1.8 1.0 2.2 3.5 3.1 Per Capita Income (Ths) 49.6 52.0 55.0 59.1 60.5 61.8 63.6 66.3 69.0 Real Per Capita Income (12$) 47.1 49.2 51.4 52.9 50.9 50.4 50.7 51.8 52.8 Average Annual Wage (Ths) 55.4 56.9 61.0 64.5 68.7 71.5 74.7 77.5 80.1 Pct Chg Year Ago 3.1 2.7 7.0 5.8 6.5 4.0 4.6 3.6 3.4 Establishment Employment (Place of Work, Thousands, SA) Total Employment 709.0 724.1 705.1 733.6 766.0 761.3 749.8 756.9 770.2 Pct Chg Year Ago 2.9 2.1 -2.6 4.0 4.4 -0.6 -1.5 1.0 1.7 Manufacturing 31.4 32.6 32.5 32.4 32.8 32.3 30.9 30.8 31.2 Pct Chg Year Ago 1.4 3.6 -0.2 -0.2 1.2 -1.6 -4.4 -0.2 1.4 Nonmanufacturing 677.6 691.6 672.6 701.1 733.2 729.0 718.9 726.2 739.0 Pct Chg Year Ago 3.0 2.1 -2.7 4.2 4.6 -0.6 -1.4 1.0 1.8 Construction & Mining 45.1 46.5 46.1 48.4 50.1 47.4 45.6 44.8 44.9 Pct Chg Year Ago 6.6 3.1 -0.8 4.8 3.5 -5.3 -3.9 -1.6 0.2 Trade, Trans, & Utilities 152.3 157.9 155.6 160.1 163.9 161.6 161.3 163.5 166.3 Pct Chg Year Ago 7.1 3.7 -1.5 2.9 2.3 -1.4 -0.2 1.4 1.7 Wholesale Trade 25.8 27.3 26.5 27.5 29.6 29.9 30.5 30.8 31.2 Retail Trade 82.2 81.7 78.2 81.2 84.3 80.7 77.3 77.2 77.5 Trans, Wrhsng, & Util 44.3 48.9 50.8 51.4 50.0 51.0 53.5 55.4 57.6 Information 9.3 9.0 8.7 8.8 9.1 8.9 9.0 9.3 9.4 Pct Chg Year Ago -0.8 -3.3 -2.8 0.9 3.4 -2.1 0.8 3.4 1.2 Financial Activities 67.1 67.1 68.0 70.9 72.6 72.9 74.5 76.1 77.9 Pct Chg Year Ago 0.1 -0.1 1.3 4.3 2.3 0.5 2.1 2.1 2.5 Prof & Business Services 107.3 109.2 107.7 115.4 129.3 121.9 108.3 108.9 113.8 Pct Chg Year Ago 1.9 1.7 -1.3 7.1 12.0 -5.8 -11.1 0.6 4.4 Educ & Health Services 107.5 110.3 110.0 112.8 115.9 120.3 123.7 124.3 125.2 Pct Chg Year Ago 1.9 2.7 -0.4 2.6 2.8 3.8 2.9 0.5 0.7 Leisure & Hospitality 85.6 86.9 73.6 80.3 88.1 89.7 87.3 87.7 88.0 Pct Chg Year Ago 1.2 1.4 -15.2 9.1 9.7 1.9 -2.8 0.5 0.4 Other Services 26.4 27.0 25.7 27.1 27.4 28.1 29.7 30.9 31.7 Pct Chg Year Ago 4.4 2.1 -4.8 5.6 1.1 2.6 5.7 3.8 2.9 Federal Government 18.0 18.6 19.2 19.0 18.7 18.6 18.9 19.3 19.6 Pct Chg Year Ago 1.3 3.5 2.9 -0.6 -2.0 -0.4 1.9 1.7 1.7 State & Local Government 58.9 59.1 58.1 58.2 58.2 59.6 60.7 61.4 62.1 Pct Chg Year Ago 0.6 0.4 -1.8 0.3 0.0 2.3 1.8 1.3 1.1 Other Economic Indicators Population (Ths) 1555.6 1585.5 1614.4 1641.1 1674.6 1709.6 1735.2 1758.2 1778.4 Pct Chg Year Ago 2.0 1.9 1.8 1.7 2.0 2.1 1.5 1.3 1.2 Labor Force (Ths) 765.6 778.0 775.7 796.3 824.5 846.7 851.9 856.8 863.1 Percent Change, Year Ago 1.8 1.6 -0.3 2.7 3.5 2.7 0.6 0.6 0.7 Unemployment Rate (%) 3.5 3.2 6.8 4.0 2.8 4.5 5.5 5.1 4.5 Total Housing Starts 14137.0 15453.0 16066.9 21241.9 21128.3 14772.4 15459.4 16651.2 16457.2 Single-Family 10454.0 11666.5 12687.0 15895.7 14079.5 10704.4 12224.6 12940.0 12680.0 Multifamily 3683.0 3786.5 3379.8 5346.1 7048.8 4068.0 3234.9 3711.2 3777.2
Short-Term Outlook for Jacksonville, FL
J ACKSONVILLE Institute for Economic Forecasting 59
2022:4 2023:1 2023:2 2023:3 2023:4 2024:1 2024:2 2024:3 2024:4 2025:1 2025:2 2025:3 2025:4 Personal Income (Billions $) Total Personal Income 103.4 104.7 105.1 106.0 106.8 108.3 109.6 111.1 112.7 114.4 116.0 117.4 118.8 Pct Chg Year Ago 5.1 5.7 4.5 3.8 3.4 3.4 4.2 4.9 5.5 5.6 5.8 5.7 5.5 Wages and Salaries 55.0 55.3 55.5 55.7 55.9 56.3 56.9 57.5 58.2 58.8 59.5 60.2 60.9 Nonwage Income 48.4 49.4 49.6 50.3 50.9 52.0 52.7 53.6 54.5 55.6 56.4 57.2 57.9 Real Personal Income (12$) 85.6 86.0 86.0 86.2 86.3 87.0 87.6 88.4 89.1 90.0 90.8 91.5 92.1 Pct Chg Year Ago -0.6 1.0 1.2 0.9 0.9 1.1 1.9 2.6 3.2 3.4 3.6 3.5 3.4 Per Capita Income (Ths) 61.2 61.7 61.6 61.8 62.1 62.7 63.3 63.9 64.6 65.4 66.1 66.7 67.3 Real Per Capita Income (12$) 50.7 50.7 50.4 50.3 50.2 50.4 50.6 50.8 51.1 51.4 51.7 51.9 52.2 Average Annual Wage (Ths) 69.5 70.1 71.0 71.9 72.8 73.6 74.3 75.1 75.8 76.5 77.2 77.8 78.4 Pct Chg Year Ago 3.0 3.4 3.8 4.3 4.7 5.0 4.7 4.5 4.2 3.9 3.8 3.5 3.3 Establishment Employment (Place of Work, Thousands, SA) Total Employment 773.1 770.8 765.1 757.5 751.8 748.9 748.9 750.1 751.3 753.1 755.4 758.2 761.2 Pct Chg Year Ago 3.4 1.6 0.4 -1.6 -2.8 -2.8 -2.1 -1.0 -0.1 0.6 0.9 1.1 1.3 Manufacturing 33.1 32.9 32.7 32.2 31.4 31.1 30.9 30.8 30.7 30.7 30.8 30.8 30.9 Pct Chg Year Ago 0.8 0.3 0.7 -2.3 -5.0 -5.5 -5.4 -4.3 -2.4 -1.2 -0.5 0.1 0.6 Nonmanufacturing 740.1 737.9 732.4 725.4 720.4 717.8 718.0 719.3 720.6 722.4 724.6 727.3 730.3 Pct Chg Year Ago 3.5 1.7 0.4 -1.6 -2.7 -2.7 -2.0 -0.8 0.0 0.6 0.9 1.1 1.3 Construction & Mining 49.2 48.6 47.7 46.8 46.6 46.1 45.6 45.4 45.2 45.0 44.9 44.8 44.7 Pct Chg Year Ago -2.1 -5.1 -5.2 -5.6 -5.2 -5.1 -4.4 -3.2 -3.0 -2.5 -1.6 -1.3 -1.1 Trade, Trans, & Utilities 163.2 162.3 162.4 160.8 160.9 160.9 160.8 161.5 162.0 162.5 163.1 164.0 164.6 Pct Chg Year Ago 0.5 -1.6 -1.0 -1.5 -1.4 -0.9 -1.0 0.4 0.7 1.0 1.4 1.5 1.6 Wholesale Trade 29.9 29.8 29.8 29.9 30.1 30.3 30.5 30.6 30.7 30.7 30.8 30.9 31.0 Retail Trade 83.4 82.1 81.9 79.8 79.0 78.0 77.0 77.2 77.2 77.1 77.1 77.4 77.3 Trans, Wrhsng, & Util 49.9 50.4 50.7 51.1 51.8 52.6 53.3 53.7 54.1 54.7 55.2 55.7 56.3 Information 9.1 9.0 8.9 8.9 8.8 8.8 8.9 9.0 9.1 9.2 9.2 9.3 9.3 Pct Chg Year Ago -1.1 -2.3 -1.6 -1.6 -3.0 -1.4 0.2 1.3 3.1 3.7 3.3 3.6 3.0 Financial Activities 73.5 73.2 72.5 72.8 73.3 73.8 74.3 74.7 75.0 75.5 75.9 76.2 76.6 Pct Chg Year Ago 1.1 1.3 1.2 -0.2 -0.2 0.9 2.5 2.6 2.4 2.3 2.1 2.0 2.1 Prof & Business Services 132.0 130.8 125.1 118.6 113.0 109.8 108.4 107.8 107.4 107.7 108.3 109.3 110.4 Pct Chg Year Ago 9.9 4.9 -2.6 -10.3 -14.4 -16.0 -13.3 -9.1 -4.9 -1.9 -0.1 1.4 2.9 Educ & Health Services 117.7 118.5 119.6 121.1 121.8 122.9 123.7 124.1 124.1 124.2 124.2 124.4 124.5 Pct Chg Year Ago 3.2 3.1 4.5 3.9 3.5 3.7 3.5 2.5 1.8 1.1 0.4 0.2 0.3 Leisure & Hospitality 90.8 90.5 90.5 89.7 88.2 87.1 87.1 87.2 87.6 87.5 87.7 87.6 87.8 Pct Chg Year Ago 12.0 7.9 2.3 0.5 -2.8 -3.8 -3.7 -2.8 -0.7 0.5 0.6 0.5 0.3 Other Services 27.6 27.7 27.8 28.2 28.7 29.2 29.6 29.9 30.2 30.5 30.8 31.0 31.2 Pct Chg Year Ago -0.6 1.5 2.0 2.6 4.2 5.4 6.4 6.0 5.0 4.5 4.0 3.6 3.3 Federal Government 18.5 18.4 18.5 18.6 18.7 18.8 18.9 19.0 19.1 19.1 19.2 19.3 19.4 Pct Chg Year Ago -4.1 -4.0 -0.2 1.1 1.5 2.0 2.1 1.8 1.7 1.7 1.7 1.7 1.7 State & Local Government 58.6 58.9 59.4 59.8 60.2 60.4 60.6 60.8 60.9 61.2 61.4 61.5 61.7 Pct Chg Year Ago 0.5 0.9 3.1 2.7 2.6 2.5 2.0 1.6 1.3 1.3 1.3 1.2 1.3 Other Economic Indicators Population (Ths) 1689.0 1697.8 1706.3 1713.8 1720.6 1726.7 1732.3 1738.0 1743.9 1749.9 1755.5 1761.2 1766.1 Pct Chg Year Ago 2.2 2.2 2.2 2.1 1.9 1.7 1.5 1.4 1.4 1.3 1.3 1.3 1.3 Labor Force (Ths) 833.8 840.6 846.2 849.3 850.6 850.8 851.2 852.2 853.4 854.5 856.0 857.8 859.0 Pct Chg Year Ago 3.7 3.5 2.9 2.3 2.0 1.2 0.6 0.3 0.3 0.4 0.6 0.7 0.7 Unemployment Rate (%) 2.7 3.3 4.2 4.9 5.4 5.6 5.5 5.4 5.4 5.3 5.1 5.0 4.9 Total Housing Starts 17340.5 15770.9 14712.2 14362.7 14243.8 14605.2 15119.0 15731.5 16382.0 16611.1 16733.4 16630.8 16629.8 Single-Family 11592.9 10660.2 10457.2 10690.8 11009.3 11448.5 12012.9 12499.2 12937.7 13003.7 13002.9 12876.1 12877.4 Multifamily 5747.6 5110.6 4255.0 3672.0 3234.5 3156.7 3106.1 3232.3 3444.3 3607.3 3730.5 3754.7 3752.4
December 2022 Forecast
PROFILES
The Lakeland–Winter Haven MSA is comprised only of Polk County. It is located in the westerncenter of the state and is heavily agriculturally based, especially in citrus. Lakeland is the home to Legoland Florida and is also the location of Publix Supermarket headquarters. Each year the Detroit Tigers host spring training at Joker Marchant Stadium. Lakeland is also home to Florida Polytechnic University, the newest member of the State University System.
QUICK FACTS
• Metro population estimate of 724,777 as of 2019 (5-Year Estimate) (U.S. Census Bureau).
• Polk County population estimate of 724,777 as of 2019 (5-Year Estimate) (U.S. Census Bureau).
• Civilian labor force of 341,965 in November 2022 (Florida Research and Economic Database).
• An unemployment rate of 3.2% as of November 2022, not seasonally adjusted. This amounts to 10,992 unemployed people (Florida Research and Economic Database).
OUTLOOK SUMMARIES
The studied economic indicators are predicted to show relatively high levels of growth in the Lakeland Metropolitan Statistical Area (MSA). Gross Metro Product for the MSA will come in at $28,717.37. The MSA will experience the 10nd highest personal income growth of 4.7 percent, but per capita income will be the 2nd lowest in the state at $37,900. The average annual wage will have the fastest growth in the state at an annual rate of 4.3 percent to $63,900 in 2012 dollars. Lakeland’s population will grow at an annual rate of 1.9 percent, the 3rd highest in the state. Employment growth is expected to average -0.6 percent, and Lakeland will experience a relatively high unemployment rate at 5.8 percent compared to the other MSA’s.
The Other Services sector will lead the MSA in average annual growth at 3.2 percent. The Education and Health sector will follow at 1.8 percent. The Constructing and Mining sector, and the Professional and Business Services sector will see respective contractions in growth of -3.1 percent, and -2.3 percent.
METRO NEWS SUMMARIES
Lakeland adopts $730 million budget, aims to improve public safety
• Lakeland commissioners have set their new goals and budgets for 2023 with a large emphasis on public safety. A hefty $9.2 million will be allocated for public safety improvements, some of which will go towards hiring 13 new officers for the Lakeland Police Department.
• Despite advertising that the city’s tax rates would increase, it will remain at $5.43 per $1,000. Rather, property taxes are expected to increase for residents.
• Some notable highlights of the budget include $2 million on infrastructure improvements, $1.5 million for roadway improvements to the South Wabash Avenue extension, $3.4 billion to economic development projects, and $534,000 on educational initiatives.
Source: Lakeland Ledger, September 23, 2022
‘This is exciting’: Legislative panel awards $6.2 million in local grants for Polk County
• Florida’s Legislative Budget Committee voted to award 13 grants to projects in Polk County. Thanks to a surplus of extra funds for the state, 238 grants were given statewide. These grants went to local governments, education entities or privately-operated programs to support local initiatives.
• For Polk County, the largest local grant of $950,000 will go towards building the longawaited Lakeland Se7en Wetlands Park. Another notable grant will be going towards the Lakeland-based nonprofit One More Child. They received $5 million for a campus in Sarasota
L AKELAND – W INTER H AVEN 60 Florida & Metro Forecast / Winter 2023
on top of a $300,000 grant for an educational program.
• The city will also update its SewerCAD wastewater hydraulic model to industry standards, thanks to a $247,500 grant. The software, which will be able to predict the effects on the sewer system of additional wastewater flows, will help develop a 20-year wastewater master plan to guide the planning of capital projects.
Source: Lakeland Ledger, September 14, 2022
Florida Poly breaks ground on Citrus Innovation Center
• Research and development company, IFF (International Flavors and Fragrances) is partnering with Florida Polytechnic University, which will help in creating a research park on the Lakeland campus.
• IFF, which plays an important role in the food, beverage, and beauty market, wants to provide internships and job opportunities to Florida Poly students. New student scholarships and research funds will also be available with this partnership.
• IFF will be the first to come to the University’s research park. However, University President, Dr. Randy K. Avent, said his vision is to bring more high-paying, hi-tech jobs to the area.
Source: ABC WFTS, October 25, 2022
Developer buys 22 acres in Lakeland for new mixeduse project
• On the western edge of downtown Lakeland, Atlanta developers bought 22 acres of land for mixed-use projects. The purchase was made at 608 Prospect St. fronting Lake Wire.
• The Purchase was made by Real Estate Agency, Carter, which has partnered with Hunt Cos. Inc. for the developments. The first phase will include over 300 apartments alongside 15,000 square feet of street-level retail space.
• Phase 2 will follow similarly to phase 1, once again adding over 300 apartments and 15,000 square feet of retail space. At least 4 large buildings will be constructed, and hopes are that
it will gain the attraction of the greater Lakeland community to its amenities.
Sources: Tampa Bay Business Journal, October 18, 2022; LALtoday, October 18, 2022
Global Fish Canning Company opening a plant in Lakeland
• A new global company based in Spain has docked itself on Lakeland’s shores. Global seafood canning company, Frinsa, has been working with the Lakeland Economic Development Council to create a canning plant in Florida.
• The company is investing $21 million into the plant and was drawn to Lakeland thanks to the warm welcome they received from the city.
• Once the manufacturing is complete, Frinsa may receive a $400,000 incentive intended to mitigate a portion of the city’s water and wastewater impact fees for the project. The plant will be providing nearly a hundred new jobs with an average annual salary of $54,206.
Source: LkldNow, November 17, 2022
Keymark’s $36 million expansion includes a new facility
• Lakeland manufacturing business, Keymark, is looking to gain a $400,000 incentive from the city by investing $36 million in capital improvements. The grant comes from the city’s Economic Development Infrastructure Incentive Program.
• The company claims that at least 25 new jobs will be created, with an annual salary at 100% of Polk County’s average: $46,763.
• The expansion will include the addition of new equipment at the existing facilities along with a new 76,000 square foot building. The money from the grant will help with the relocation of electric lines and wastewater extensions. A few days later, on November 21, the incentive was approved.
Source: LkldNow, November 19, 2022
L AKELAND – W INTER H AVEN Institute for Economic Forecasting 61
Lakeland - Winter Haven MSA
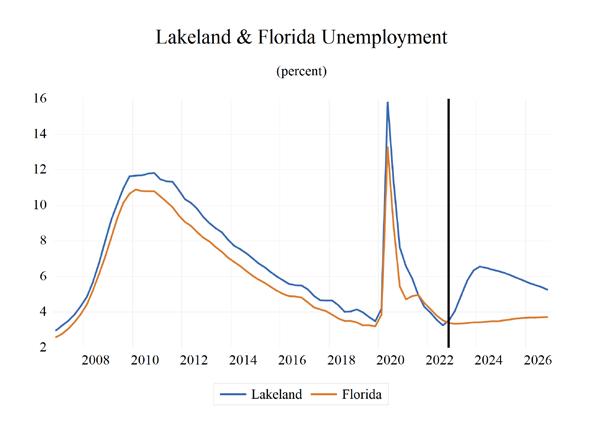
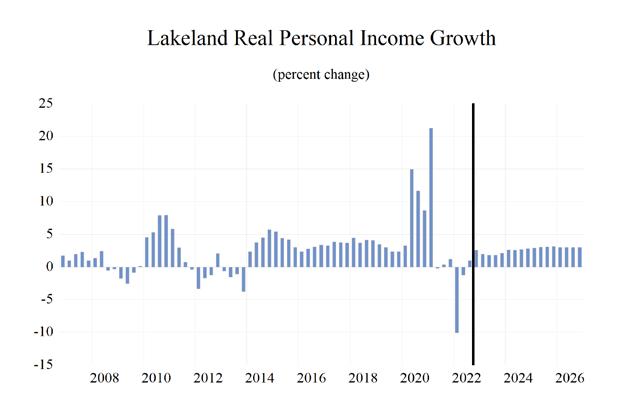
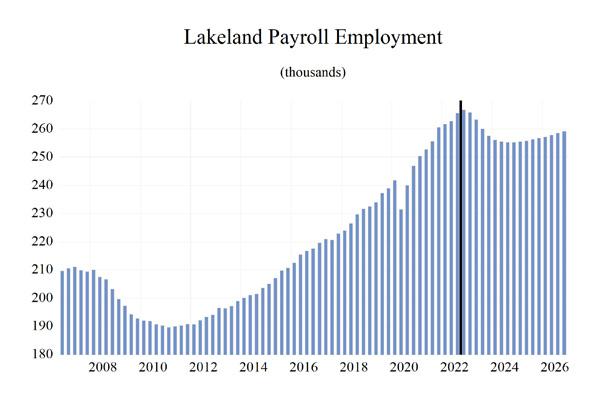
Industry Location Quotients
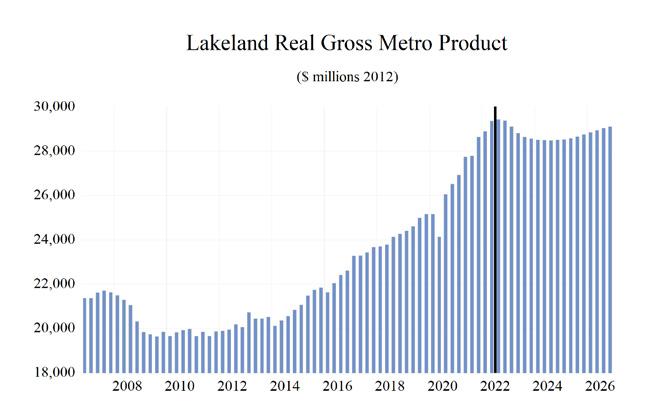
L AKELAND – W INTER H AVEN 62 Florida & Metro Forecast / Winter 2023 0 0.5 1 1.5 2 2.5 3 3.5 Total Nonagricultural Employment Total Private Goods Producing Service Producing Private Service Providing Mining, Logging, and Construction Manufacturing Trade, Transportation, and Utilities Wholesale Trade Retail Trade Transportation, Warehousing and Utilities Information Financial Activities Professional and Business Services Educational and Health Services Leisure and Hospitality Other Services Government
Long-Term Outlook for Lakeland-Winter Haven, FL December 2022 Forecast
L AKELAND – W INTER H AVEN Institute for Economic Forecasting 63
2018 2019 2020 2021 2022 2023 2024 2025 2026 Personal Income (Billions $) Total Personal Income 25.4 27.2 29.9 32.8 34.3 35.8 37.2 39.2 41.2 Pct Chg Year Ago 5.3 7.2 9.9 9.8 4.5 4.2 4.1 5.4 5.1 Wages and Salaries 10.8 11.5 12.4 13.6 15.3 15.7 16.1 16.8 17.6 Nonwage Income 14.6 15.7 17.5 19.2 19.1 20.1 21.1 22.4 23.6 Real Personal Income (12$) 24.7 26.3 28.6 30.1 29.6 29.9 30.4 31.4 32.4 Pct Chg Year Ago 5.2 6.6 8.8 5.3 -1.7 0.9 1.8 3.2 3.1 Per Capita Income (Ths) 36.5 38.2 40.8 43.4 44.1 44.9 45.9 47.5 49.1 Real Per Capita Income (12$) 35.5 36.9 39.0 39.9 38.1 37.6 37.5 38.1 38.6 Average Annual Wage (Ths) 47.0 48.5 51.3 53.0 57.4 59.6 62.8 65.2 67.9 Pct Chg Year Ago 2.5 3.2 5.7 3.3 8.4 3.8 5.3 3.9 4.1 Establishment Employment (Place of Work, Thousands, SA) Total Employment 227.9 235.6 240.0 254.8 264.2 261.6 255.5 256.0 258.1 Pct Chg Year Ago 3.1 3.4 1.9 6.1 3.7 -1.0 -2.4 0.2 0.8 Manufacturing 17.6 18.0 17.9 18.0 18.1 17.9 17.0 16.7 16.7 Pct Chg Year Ago 3.0 2.0 -0.5 0.3 0.8 -1.0 -5.5 -1.7 -0.1 Nonmanufacturing 210.3 217.6 222.1 236.8 246.1 243.7 238.5 239.4 241.5 Pct Chg Year Ago 3.2 3.5 2.1 6.6 3.9 -1.0 -2.1 0.4 0.9 Construction & Mining 13.7 14.3 14.9 15.3 14.7 14.3 13.4 13.1 12.9 Pct Chg Year Ago 4.6 4.6 4.3 2.3 -4.0 -2.8 -5.7 -2.9 -1.1 Trade, Trans, & Utilities 58.2 61.2 67.5 75.6 78.6 76.7 73.9 73.3 73.2 Pct Chg Year Ago 2.4 5.2 10.2 12.0 3.9 -2.4 -3.6 -0.8 -0.2 Wholesale Trade 10.6 11.2 11.2 11.4 11.8 12.3 12.8 12.9 13.1 Retail Trade 27.7 28.2 29.3 31.5 33.0 31.4 29.2 28.8 28.7 Trans, Wrhsng, & Util 20.0 21.9 27.0 32.8 33.7 32.9 31.9 31.6 31.4 Information 1.9 1.9 1.8 2.0 2.1 2.1 2.0 2.0 2.0 Pct Chg Year Ago 1.8 -0.4 -6.0 7.7 7.6 -2.3 -2.4 -0.4 -2.4 Financial Activities 12.5 13.3 14.1 14.5 14.8 15.4 15.6 15.8 15.9 Pct Chg Year Ago 2.8 5.8 6.0 3.0 2.2 4.2 1.1 1.2 0.6 Prof & Business Services 31.3 32.5 32.9 35.3 37.1 35.0 31.8 32.3 33.6 Pct Chg Year Ago 4.6 3.8 1.3 7.3 5.1 -5.6 -9.3 1.7 4.0 Educ & Health Services 33.7 34.5 34.6 35.4 37.5 39.0 39.9 40.1 40.2 Pct Chg Year Ago 4.1 2.4 0.2 2.2 5.9 4.0 2.4 0.3 0.4 Leisure & Hospitality 24.1 24.6 21.3 24.0 26.0 24.9 24.5 25.0 25.5 Pct Chg Year Ago 2.4 2.1 -13.6 12.9 8.3 -4.4 -1.5 1.9 1.9 Other Services 6.3 6.6 6.3 6.8 7.3 7.6 7.9 8.1 8.3 Pct Chg Year Ago 6.6 5.4 -5.5 8.0 7.7 4.3 4.3 2.5 1.8 Federal Government 1.2 1.2 1.4 1.3 1.3 1.3 1.3 1.3 1.3 Pct Chg Year Ago 8.4 2.0 13.6 -9.3 3.5 -0.3 -1.5 0.4 0.7 State & Local Government 27.3 27.4 27.4 26.8 26.8 27.5 28.2 28.5 28.7 Pct Chg Year Ago 1.3 0.3 0.0 -2.2 0.0 2.7 2.4 1.0 0.8 Other Economic Indicators Population (Ths) 694.6 711.9 732.5 756.0 777.8 795.9 811.6 825.6 839.7 Pct Chg Year Ago 2.8 2.5 2.9 3.2 2.9 2.3 2.0 1.7 1.7 Labor Force (Ths) 296.5 304.0 319.6 328.3 336.4 341.8 342.5 342.7 343.0 Percent Change, Year Ago 1.8 2.5 5.1 2.7 2.5 1.6 0.2 0.0 0.1 Unemployment Rate (%) 4.3 3.8 9.7 5.4 3.6 5.3 6.4 6.0 5.5 Total Housing Starts 5059.9 8046.7 9384.5 12425.2 12148.7 7695.4 7126.3 7129.1 6771.5 Single-Family 5059.9 6530.6 7127.3 10257.0 9403.1 6013.1 6086.8 5919.6 5504.5 Multifamily 0.0 1516.0 2257.2 2168.1 2745.6 1682.3 1039.6 1209.5 1267.0
Short-Term Outlook for Lakeland-Winter Haven, FL December 2022 Forecast
L AKELAND – W INTER H AVEN 64 Florida & Metro Forecast / Winter 2023
2022:4 2023:1 2023:2 2023:3 2023:4 2024:1 2024:2 2024:3 2024:4 2025:1 2025:2 2025:3 2025:4 Personal Income (Billions $) Total Personal Income 35.1 35.5 35.6 35.8 36.2 36.6 37.0 37.4 37.9 38.5 39.0 39.5 40.0 Pct Chg Year Ago 6.0 5.7 4.5 3.7 3.1 3.2 3.9 4.5 4.8 5.1 5.4 5.4 5.5 Wages and Salaries 15.6 15.6 15.7 15.6 15.7 15.9 16.0 16.2 16.3 16.5 16.7 16.9 17.1 Nonwage Income 19.5 19.8 19.9 20.2 20.4 20.7 20.9 21.2 21.6 22.0 22.3 22.6 22.9 Real Personal Income (12$) 29.8 29.9 29.9 29.9 30.0 30.2 30.3 30.5 30.7 31.0 31.3 31.5 31.8 Pct Chg Year Ago 0.2 1.1 1.2 0.8 0.7 0.9 1.5 2.2 2.6 2.9 3.2 3.3 3.4 Per Capita Income (Ths) 44.6 44.9 44.8 44.9 45.1 45.4 45.6 46.0 46.4 46.9 47.3 47.7 48.1 Real Per Capita Income (12$) 37.9 37.8 37.6 37.4 37.4 37.4 37.4 37.5 37.6 37.8 38.0 38.1 38.3 Average Annual Wage (Ths) 58.2 58.6 59.2 59.9 60.8 61.7 62.4 63.2 63.7 64.3 64.9 65.5 66.2 Pct Chg Year Ago 5.2 3.6 3.1 3.7 4.6 5.4 5.5 5.5 4.6 4.3 3.9 3.6 3.9 Establishment Employment (Place of Work, Thousands, SA) Total Employment 266.8 265.8 263.3 260.0 257.5 256.1 255.4 255.2 255.2 255.4 255.8 256.2 256.7 Pct Chg Year Ago 2.4 1.6 0.2 -2.1 -3.5 -3.6 -3.0 -1.8 -0.9 -0.3 0.2 0.4 0.6 Manufacturing 18.3 18.3 18.2 17.8 17.4 17.2 17.0 16.9 16.8 16.7 16.7 16.6 16.6 Pct Chg Year Ago 1.9 1.4 1.3 -1.8 -5.0 -6.2 -6.4 -5.4 -3.8 -2.6 -2.0 -1.3 -0.9 Nonmanufacturing 248.5 247.5 245.1 242.2 240.1 238.9 238.4 238.4 238.4 238.7 239.1 239.6 240.1 Pct Chg Year Ago 2.5 1.6 0.1 -2.1 -3.4 -3.5 -2.7 -1.6 -0.7 -0.1 0.3 0.5 0.7 Construction & Mining 14.7 14.7 14.4 14.1 13.9 13.7 13.5 13.3 13.3 13.2 13.1 13.0 13.0 Pct Chg Year Ago -2.3 -0.6 -1.6 -3.8 -5.4 -6.6 -6.4 -5.2 -4.7 -4.0 -2.8 -2.3 -2.3 Trade, Trans, & Utilities 78.8 78.0 77.3 76.1 75.3 74.7 73.8 73.7 73.4 73.3 73.3 73.3 73.3 Pct Chg Year Ago 0.6 -0.5 -1.0 -3.7 -4.4 -4.3 -4.5 -3.1 -2.6 -1.8 -0.7 -0.5 -0.2 Wholesale Trade 12.1 12.2 12.3 12.4 12.5 12.6 12.8 12.8 12.9 12.9 12.9 12.9 13.0 Retail Trade 32.6 32.2 31.9 31.0 30.5 29.9 29.1 29.0 28.8 28.8 28.8 28.8 28.7 Trans, Wrhsng, & Util 34.1 33.7 33.1 32.7 32.3 32.2 31.9 31.8 31.7 31.7 31.6 31.6 31.5 Information 2.1 2.1 2.1 2.1 2.0 2.0 2.0 2.0 2.0 2.0 2.0 2.0 2.0 Pct Chg Year Ago 2.8 0.3 -3.6 -1.4 -4.3 -3.1 -2.3 -2.9 -1.2 -0.5 -0.6 -0.1 -0.6 Financial Activities 15.2 15.5 15.5 15.4 15.4 15.5 15.6 15.6 15.7 15.8 15.8 15.8 15.8 Pct Chg Year Ago 3.1 4.9 6.1 4.0 1.8 0.3 0.6 1.8 1.8 1.8 1.4 0.9 0.6 Prof & Business Services 37.4 37.4 35.9 34.1 32.7 32.0 31.7 31.6 31.7 31.9 32.1 32.4 32.8 Pct Chg Year Ago 4.0 2.7 -3.8 -8.3 -12.5 -14.3 -11.5 -7.2 -3.2 -0.4 1.3 2.5 3.5 Educ & Health Services 38.5 38.7 38.8 39.1 39.3 39.6 39.9 40.1 40.1 40.1 40.0 40.1 40.1 Pct Chg Year Ago 7.0 5.7 5.6 3.0 2.0 2.4 2.8 2.4 2.0 1.1 0.3 0.0 0.0 Leisure & Hospitality 25.9 25.1 24.9 24.9 24.6 24.3 24.5 24.5 24.7 24.8 24.9 25.0 25.2 Pct Chg Year Ago 2.3 -2.1 -4.5 -5.6 -5.1 -3.3 -1.6 -1.5 0.6 2.0 1.9 2.0 1.7 Other Services 7.5 7.6 7.5 7.6 7.7 7.8 7.9 8.0 8.0 8.1 8.1 8.2 8.2 Pct Chg Year Ago 7.6 7.4 4.5 2.8 2.8 3.7 5.1 4.6 3.8 3.2 2.5 2.3 2.2 Federal Government 1.3 1.3 1.3 1.3 1.3 1.3 1.3 1.3 1.3 1.3 1.3 1.3 1.3 Pct Chg Year Ago -1.9 -4.6 -0.8 3.6 0.9 -0.7 -2.2 -1.9 -1.1 -0.3 0.4 0.8 0.8 State & Local Government 27.0 27.2 27.4 27.5 27.8 28.0 28.2 28.2 28.3 28.4 28.4 28.5 28.6 Pct Chg Year Ago 1.1 2.1 2.9 3.0 2.7 2.7 2.6 2.5 1.9 1.4 0.9 0.9 1.0 Other Economic Indicators Population (Ths) 785.4 789.7 793.8 797.9 802.0 806.0 809.8 813.5 817.0 820.3 823.8 827.3 830.9 Pct Chg Year Ago 2.7 2.6 2.4 2.2 2.1 2.1 2.0 2.0 1.9 1.8 1.7 1.7 1.7 Labor Force (Ths) 338.8 340.3 341.8 342.5 342.6 342.6 342.5 342.5 342.6 342.6 342.6 342.8 342.8 Pct Chg Year Ago 1.9 1.8 1.9 1.6 1.1 0.7 0.2 0.0 0.0 0.0 0.0 0.1 0.1 Unemployment Rate (%) 3.5 4.1 4.9 5.8 6.3 6.6 6.5 6.4 6.3 6.2 6.1 5.9 5.8 Total Housing Starts 10453.2 8891.7 7751.1 7256.2 6882.6 6886.7 6989.2 7277.9 7351.5 7273.9 7203.4 7058.4 6980.7 Single-Family 7366.2 6522.6 6027.6 5810.8 5691.5 5789.7 6037.0 6257.9 6262.5 6126.7 5997.7 5821.2 5732.8 Multifamily 3087.0 2369.1 1723.5 1445.4 1191.1 1097.0 952.2 1020.0 1089.0 1147.2 1205.7 1237.2 1247.9
PROFILES
The area is expected to show mixed levels of growth in the economic indicators. Personal income is expected to grow an average of 5.2 percent annually, a moderate level compared to all MSAs studied. The average real per capita income level of $55,400 is the seventh highest in the areas studied. Average annual wage growth will be 4.9. The average annual wage level is expected to be $75,100, the second highest of the studied areas. Miami is expected to average a population growth of 0.3 percent each year. The area has the highest Gross Metro Product of the MSAs studied at an average level of $348,718.15 million. Employment is expected to grow at an average rate of 2.4 percent each year, while unemployment is expected to be moderate at an average rate of 4.1 percent. Miami’s fastest growing sector is expected to be the Leisure & Hospitality sector, which will experience 9.0 percent average annual growth, followed by the Professional and Business Services sector, which will grow at an average of 3.4 percent annually.
QUICK FACTS
• Metro population estimate of 6,090,660 as of 2019 (5-Year Estimate) (U.S. Census Bureau).
• Miami-Dade County population estimate of 2,716,940 as of 2019 (5-Year Estimate) (U.S. Census Bureau).
• Broward County population estimate of 1,952,778 as of 2019 (5-Year Estimate) (U.S. Census Bureau).
• Palm Beach County population estimate of 1,496,770 as of 2019 (5-Year Estimate) (U.S. Census Bureau).
• Civilian labor force of 3,165,671 in November 2022 (Florida Research and Economic Database).
• An unemployment rate of 2.1% as of November 2022, not seasonally adjusted. This amounts to 67,112, not seasonally adjusted. This amounts to 75,967 unemployed people (Florida Research and Economic Database).
OUTLOOK SUMMARIES
The Miami–Fort Lauderdale–Palm Beach area is expected to show relatively low levels of growth in the economic indicators. Personal income is expected to grow an average of 3.9 percent annually, a low level compared to all MSAs studied. The average real per capita income level of $56,300 is the 5th highest in the areas studied. Average annual wage growth will be 2.8. The average annual wage level is expected to be $81,200, the third highest of the studied areas. Miami is expected to average a population growth of 0.7 percent each year. The area has the highest Gross Metro Product of the MSAs studied at an average level of $349,013.14 million.
Employment is expected to grow at an average rate of -0.5 percent each year, while unemployment is expected to be moderate at an average rate of 5.2 percent.
Miami’s fastest growing sector is expected to be the Other Services sector, which will experience 3.2 percent average annual growth, followed by the Financial Services and Education and Heath sectors, which will both grow at an average of 1.8 percent, respectively.
METRO NEWS SUMMARIES
Richman Group buys Miami development site for $23M
• Richman Group has purchased a development site located near the Culmer Metrorail Station for $23 million.
• The development site was previously bought in 2019 for $9.5 million. The increase in value is a demonstration of high demand for such sites in Miami.
• There will be two towers, one of which will be affordable housing that is reserved for people who are making between 20 to 80% of the median income in the area.
Source: South Florida Business Journal, September 23, 2022
M IAMI – F ORT L AUDERDALE – W EST P ALM B EACH Institute for Economic Forecasting 65
Future Knotel building in Wynwood obtains $11M mortgage
• New York-based Knotel is in the process of transforming a warehouse in the Wynwood Arts District into a co-working office building.
• Wyncatcher Holding LLC has received an $11 million mortgage to help complete the project.
• The company purchased the warehouse in 2019 for $9.3 million.
Source: South Florida Business Journal, September 27, 2022
Demand for new industrial space high in MiamiDade
• According to a recent report by brokerage JLL, over 40% of the Class A industrial spaces in Miami-Dade County that are currently being built have already been leased even though they are not yet built.
• Given such demand, this has increased the rent for such space to over $15 per square foot.
• The demand for such space is particularly high in Miami-Dade because of the large population and the massive cargo ports located at the Miami International Airport and PortMiami.
Source: South Florida Business Journal, October 26, 2022
Richman Group to build Miami-Dade County apartments with $44M loan
• The Richman Group has received a $44.48 construction loan from PNC Bank, allowing them to begin building the Water Side apartments.
• The Water Side apartments will have 266 apartments as well as nearly 3,000 square feet of retail space and almost 300 parking spaces.
• In addition, there will be 29 workforce housing units, which will be devoted to people that are making up to 140% of the median income in the area, which is $53,975.
Source: South Florida Business Journal, October 30, 2022
Private soccer facility to be redeveloped into selfstorage
• Triangle Soccer LLC has sold its soccer facility to Hialeah Gardens Storage Associates for $4.7 million.
• They have received approval to transform the soccer facility into a 97,000 square foot selfstorage facility.
• “There’s a lot of momentum in Hialeah Gardens with a lot of projects,” Daniel Masveyraud, a principal at H&M Development said. He continued, “There’s a huge Publix and Homegoods coming and there are also close to 600 apartments coming up. The market is ripe for self-storage.”
Source: South Florida Business Journal, November 28, 2022
Genting lists former Miami Herald site in Miami for $1B
• Genting Group wanted to turn the former headquarters of the Miami Herald into a gambling resort but was unable to get approval from Florida lawmakers.
• As a result, the Genting Group has decided to list the property for $1 billion after purchasing it for $236 million in 2011.
• Michael T. Fay, who has the listing, said, “This site is among the most valuable in the United States, let alone South Florida.” He continued, “The rarity of this opportunity coupled with the potential to build a landmark office, retail, residential, hospitality, and entertainment destination will attract prospective buyers from all over the world.”
Source: South Florida Business Journal, November 30, 2022
M IAMI – F ORT L AUDERDALE – W EST P ALM B EACH 66 Florida & Metro Forecast / Winter 2023
Miami-Fort Lauderdale-West Palm Beach MSA Industry Location Quotients
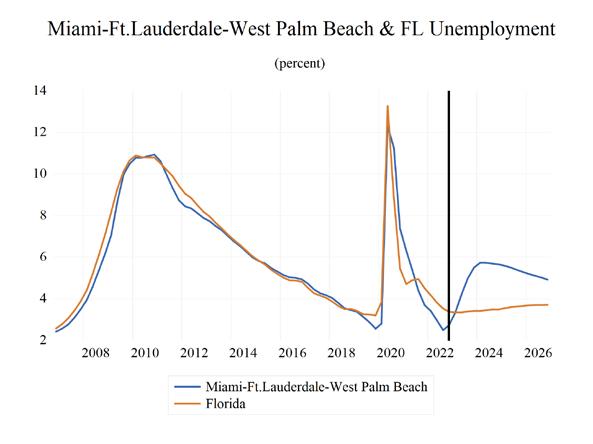
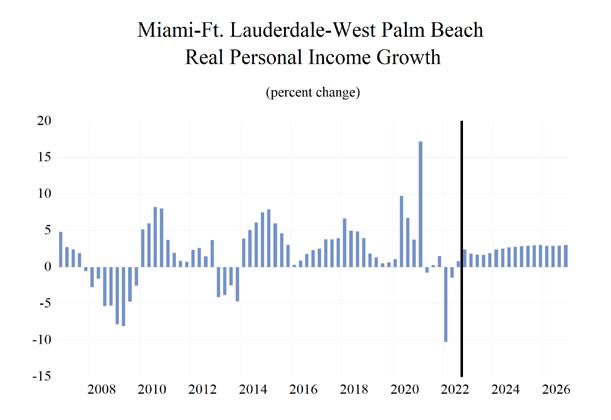
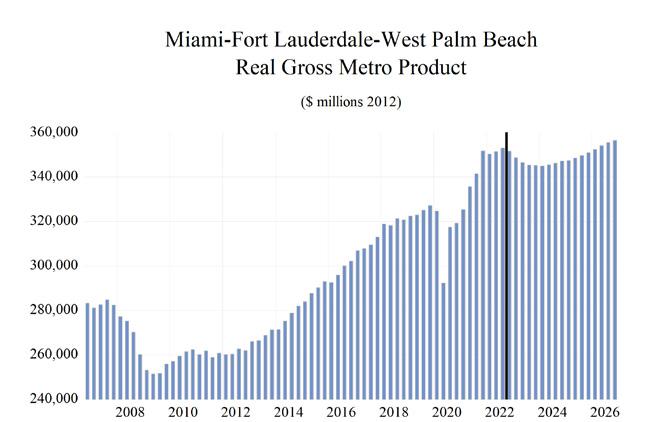
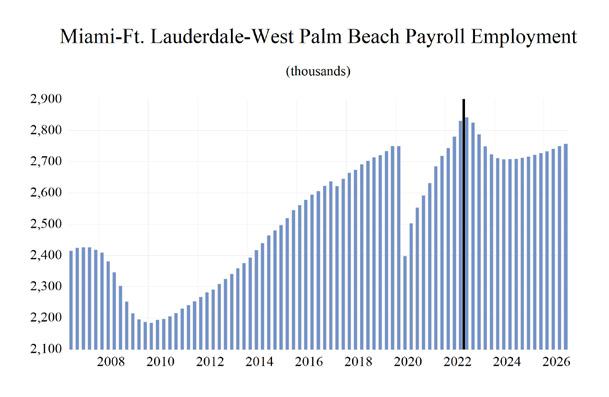
M IAMI – F ORT L AUDERDALE – W EST P ALM B EACH Institute for Economic Forecasting 67 0 0.2 0.4 0.6 0.8 1 1.2 1.4 1.6 Total Nonagricultural Employment Total Private Goods Producing Service Producing Private Service Providing Mining, Logging, and Construction Manufacturing Trade, Transportation, and Utilities Wholesale Trade Retail Trade Transportation, Warehousing and Utilities Information Financial Activities Professional and Business Services Educational and Health Services Leisure and Hospitality Other Services Government
Long-Term Outlook for Miami-Fort Lauderdale-Pompano Beach, FL December 2022 Forecast
M IAMI – F ORT L AUDERDALE – W EST P ALM B EACH 68 Florida & Metro Forecast / Winter 2023
2018 2019 2020 2021 2022 2023 2024 2025 2026 Personal Income (Billions $) Total Personal Income 365.4 389.6 406.2 447.9 462.3 475.9 489.3 513.8 537.6 Pct Chg Year Ago 7.2 6.6 4.3 10.2 3.2 3.0 2.8 5.0 4.6 Wages and Salaries 157.6 165.8 167.4 191.7 214.0 215.8 217.6 224.9 234.2 Nonwage Income 207.8 223.8 238.9 256.2 248.3 260.1 271.7 288.9 303.5 Real Personal Income (12$) 306.7 325.2 332.1 351.0 340.8 339.8 341.6 351.4 360.7 Pct Chg Year Ago 3.7 6.0 2.1 5.7 -2.9 -0.3 0.5 2.9 2.6 Per Capita Income (Ths) 59.6 63.4 66.4 73.6 75.9 77.8 79.4 82.7 85.8 Real Per Capita Income (12$) 50.1 52.9 54.3 57.6 56.0 55.6 55.5 56.6 57.6 Average Annual Wage (Ths) 58.4 60.5 65.3 71.8 76.1 77.5 79.9 82.3 84.9 Pct Chg Year Ago 3.3 3.4 8.1 9.8 6.1 1.9 3.1 3.0 3.1 Establishment Employment (Place of Work, Thousands, SA) Total Employment 2682.9 2729.5 2550.8 2656.5 2799.0 2771.4 2709.1 2719.1 2745.4 Pct Chg Year Ago 1.9 1.7 -6.5 4.1 5.4 -1.0 -2.2 0.4 1.0 Manufacturing 89.8 91.5 87.4 89.4 94.8 92.7 85.7 83.2 82.7 Pct Chg Year Ago 1.4 2.0 -4.5 2.2 6.1 -2.2 -7.6 -2.9 -0.5 Nonmanufacturing 2593.1 2638.0 2463.5 2567.2 2704.1 2678.7 2623.4 2635.9 2662.7 Pct Chg Year Ago 2.0 1.7 -6.6 4.2 5.3 -0.9 -2.1 0.5 1.0 Construction & Mining 138.7 143.1 140.0 140.3 144.2 141.4 135.8 134.0 134.9 Pct Chg Year Ago 6.4 3.1 -2.1 0.2 2.8 -1.9 -4.0 -1.4 0.7 Trade, Trans, & Utilities 609.7 619.1 585.7 605.8 639.8 624.9 612.5 610.3 611.6 Pct Chg Year Ago 2.0 1.5 -5.4 3.4 5.6 -2.3 -2.0 -0.3 0.2 Wholesale Trade 148.0 148.8 143.0 147.2 156.0 155.7 158.2 160.2 162.1 Retail Trade 338.4 335.1 310.1 319.8 330.5 314.0 298.1 294.2 293.5 Trans, Wrhsng, & Util 123.4 135.2 132.5 138.8 153.3 155.2 156.2 155.9 155.9 Information 51.0 51.0 47.6 50.7 52.8 52.3 52.1 53.2 53.2 Pct Chg Year Ago -0.1 -0.1 -6.6 6.4 4.3 -1.0 -0.4 2.1 0.1 Financial Activities 184.7 189.8 187.8 195.7 203.1 202.3 205.7 207.6 208.2 Pct Chg Year Ago 1.9 2.7 -1.0 4.2 3.8 -0.4 1.7 0.9 0.3 Prof & Business Services 444.4 452.0 436.2 465.9 487.5 452.1 409.1 416.6 435.2 Pct Chg Year Ago 2.2 1.7 -3.5 6.8 4.6 -7.3 -9.5 1.8 4.4 Educ & Health Services 400.7 411.6 397.8 407.0 424.9 439.1 447.5 447.6 448.5 Pct Chg Year Ago 2.0 2.7 -3.4 2.3 4.4 3.3 1.9 0.0 0.2 Leisure & Hospitality 328.0 334.1 255.5 289.9 331.8 339.5 326.0 326.5 326.6 Pct Chg Year Ago 1.5 1.9 -23.5 13.5 14.4 2.3 -4.0 0.1 0.0 Other Services 122.4 120.8 107.1 110.3 118.9 122.4 125.2 126.6 127.1 Pct Chg Year Ago -0.3 -1.3 -11.3 3.0 7.8 2.9 2.3 1.2 0.4 Federal Government 33.9 34.5 36.1 35.2 35.1 33.6 34.1 34.9 35.7 Pct Chg Year Ago 0.6 1.7 4.6 -2.5 -0.3 -4.1 1.6 2.3 2.3 State & Local Government 279.5 282.1 269.6 266.5 266.2 271.2 275.4 278.6 281.7 Pct Chg Year Ago 1.5 0.9 -4.4 -1.2 -0.1 1.9 1.6 1.2 1.1 Other Economic Indicators Population (Ths) 6127.2 6142.9 6121.0 6088.8 6089.3 6114.4 6159.8 6212.8 6266.7 Pct Chg Year Ago 0.4 0.3 -0.4 -0.5 0.0 0.4 0.7 0.9 0.9 Labor Force (Ths) 3100.1 3138.9 3007.6 3070.0 3140.4 3132.6 3144.8 3175.9 3211.7 Percent Change, Year Ago 0.6 1.2 -4.2 2.1 2.3 -0.2 0.4 1.0 1.1 Unemployment Rate (%) 3.7 3.0 8.4 5.0 2.9 4.5 5.7 5.4 5.1 Total Housing Starts 17111.3 18900.6 20023.2 20017.6 18807.9 15178.1 16849.0 20293.4 21681.4 Single-Family 6724.1 7351.3 7546.1 8270.3 7077.1 6522.1 7670.9 8261.1 8264.0 Multifamily 10387.3 11549.3 12477.1 11747.3 11730.7 8656.1 9178.1 12032.3 13417.5
Short-Term Outlook for Miami-Fort Lauderdale-Pompano Beach, FL December 2022 Forecast
M IAMI – F ORT L AUDERDALE – W EST P ALM B EACH Institute for Economic Forecasting 69
2022:4 2023:1 2023:2 2023:3 2023:4 2024:1 2024:2 2024:3 2024:4 2025:1 2025:2 2025:3 2025:4 Personal Income (Billions $) Total Personal Income 471.4 476.2 475.2 475.7 476.5 481.5 486.1 491.9 497.7 504.8 511.0 517.0 522.6 Pct Chg Year Ago 4.8 5.7 3.5 1.7 1.1 1.1 2.3 3.4 4.4 4.8 5.1 5.1 5.0 Wages and Salaries 218.4 217.8 216.3 214.9 214.3 215.2 216.6 218.5 220.1 221.9 223.8 225.9 228.0 Nonwage Income 253.0 258.4 259.0 260.9 262.2 266.3 269.5 273.5 277.6 282.9 287.2 291.1 294.6 Real Personal Income (12$) 341.7 342.7 340.5 338.8 337.2 338.8 340.5 342.6 344.6 347.8 350.3 352.7 354.9 Pct Chg Year Ago -0.9 1.0 0.2 -1.1 -1.3 -1.1 0.0 1.1 2.2 2.7 2.9 3.0 3.0 Per Capita Income (Ths) 77.4 78.1 77.8 77.7 77.7 78.4 79.0 79.8 80.5 81.5 82.3 83.1 83.8 Real Per Capita Income (12$) 56.1 56.2 55.7 55.4 55.0 55.2 55.3 55.6 55.8 56.2 56.5 56.7 56.9 Average Annual Wage (Ths) 76.5 76.7 77.2 77.8 78.3 79.0 79.6 80.3 80.9 81.4 82.0 82.6 83.2 Pct Chg Year Ago 1.7 1.6 1.5 1.9 2.4 3.0 3.1 3.2 3.3 3.1 3.0 2.9 2.9 Establishment Employment (Place of Work, Thousands, SA) Total Employment 2842.2 2825.3 2787.7 2749.1 2723.5 2710.9 2707.7 2708.6 2709.4 2712.1 2716.0 2721.2 2727.0 Pct Chg Year Ago 4.6 3.0 0.3 -2.9 -4.2 -4.0 -2.9 -1.5 -0.5 0.0 0.3 0.5 0.7 Manufacturing 96.7 95.5 94.3 91.9 89.2 87.3 86.2 85.0 84.2 83.7 83.3 83.0 82.7 Pct Chg Year Ago 5.9 3.4 0.3 -4.6 -7.8 -8.5 -8.5 -7.5 -5.6 -4.2 -3.4 -2.4 -1.7 Nonmanufacturing 2745.6 2729.8 2693.4 2657.2 2634.3 2623.6 2621.4 2623.5 2625.2 2628.4 2632.7 2638.3 2644.3 Pct Chg Year Ago 4.5 3.0 0.3 -2.8 -4.1 -3.9 -2.7 -1.3 -0.3 0.2 0.4 0.6 0.7 Construction & Mining 146.0 145.2 142.1 139.6 138.9 137.4 135.9 135.2 134.9 134.2 134.1 133.8 133.8 Pct Chg Year Ago 2.5 1.8 -0.5 -4.0 -4.9 -5.4 -4.4 -3.1 -2.9 -2.3 -1.4 -1.0 -0.8 Trade, Trans, & Utilities 642.8 634.3 629.0 619.0 617.1 615.0 612.0 611.8 611.0 610.1 609.9 610.7 610.7 Pct Chg Year Ago 3.6 0.5 -1.9 -3.9 -4.0 -3.0 -2.7 -1.2 -1.0 -0.8 -0.3 -0.2 0.0 Wholesale Trade 157.7 156.9 155.0 155.0 155.8 156.8 157.9 158.7 159.2 159.5 160.0 160.4 161.0 Retail Trade 328.4 321.3 318.9 309.6 306.3 302.2 297.6 296.9 295.8 294.7 294.0 294.5 293.7 Trans, Wrhsng, & Util 156.7 156.2 155.1 154.5 155.0 155.9 156.5 156.2 155.9 155.9 155.8 155.8 155.9 Information 53.2 52.9 52.5 52.2 51.6 51.6 52.0 52.2 52.4 52.8 53.1 53.5 53.4 Pct Chg Year Ago 1.4 1.2 -0.6 -1.6 -3.1 -2.3 -0.8 0.0 1.7 2.3 2.0 2.3 1.8 Financial Activities 205.4 203.8 201.5 201.3 202.6 204.0 205.5 206.3 206.9 207.6 207.7 207.5 207.4 Pct Chg Year Ago 2.4 1.0 0.4 -1.5 -1.3 0.1 2.0 2.5 2.1 1.7 1.1 0.6 0.2 Prof & Business Services 489.4 485.0 462.8 439.3 421.3 411.9 408.6 407.9 408.2 411.0 414.2 418.3 423.0 Pct Chg Year Ago 2.0 0.5 -4.9 -10.6 -13.9 -15.1 -11.7 -7.2 -3.1 -0.2 1.4 2.6 3.6 Educ & Health Services 436.1 437.4 437.1 440.1 441.9 445.1 447.8 448.9 448.2 448.1 447.4 447.5 447.4 Pct Chg Year Ago 5.7 5.4 4.8 1.9 1.3 1.8 2.5 2.0 1.4 0.7 -0.1 -0.3 -0.2 Leisure & Hospitality 347.2 345.5 343.0 338.3 331.0 326.3 325.6 325.6 326.6 326.1 326.7 326.4 326.8 Pct Chg Year Ago 15.2 11.7 4.0 -0.6 -4.7 -5.6 -5.1 -3.8 -1.3 -0.1 0.3 0.2 0.1 Other Services 122.8 122.5 121.5 122.0 123.3 124.3 125.0 125.5 125.9 126.4 126.6 126.7 126.8 Pct Chg Year Ago 9.4 7.4 3.9 0.3 0.4 1.4 2.8 2.9 2.1 1.7 1.3 1.0 0.7 Federal Government 34.1 33.8 33.5 33.5 33.7 33.8 34.0 34.2 34.5 34.6 34.8 35.0 35.2 Pct Chg Year Ago -4.9 -7.0 -5.4 -2.5 -1.3 0.2 1.7 2.2 2.4 2.4 2.4 2.3 2.3 State & Local Government 268.5 269.4 270.3 271.8 273.0 274.1 275.0 275.9 276.5 277.5 278.3 278.9 279.7 Pct Chg Year Ago -0.1 1.4 2.8 1.6 1.7 1.7 1.7 1.5 1.3 1.2 1.2 1.1 1.1 Other Economic Indicators Population (Ths) 6093.4 6099.9 6108.6 6118.9 6130.3 6141.4 6153.2 6165.6 6178.9 6192.9 6206.2 6219.5 6232.6 Pct Chg Year Ago 0.2 0.2 0.3 0.5 0.6 0.7 0.7 0.8 0.8 0.8 0.9 0.9 0.9 Labor Force (Ths) 3149.9 3140.5 3130.1 3127.9 3132.1 3136.1 3140.7 3147.4 3155.0 3162.4 3171.1 3181.1 3188.8 Pct Chg Year Ago 1.8 0.8 -0.3 -0.9 -0.6 -0.1 0.3 0.6 0.7 0.8 1.0 1.1 1.1 Unemployment Rate (%) 2.7 3.3 4.2 5.0 5.5 5.7 5.7 5.7 5.7 5.6 5.5 5.4 5.3 Total Housing Starts 17154.8 16252.3 15142.1 14742.3 14575.8 15380.9 16110.4 17250.7 18654.0 19558.6 20178.8 20581.7 20854.3 Single-Family 6968.3 6553.8 6299.4 6470.9 6764.2 7117.7 7513.0 7861.2 8191.8 8272.5 8283.1 8226.2 8262.4 Multifamily 10186.5 9698.5 8842.7 8271.4 7811.6 8263.2 8597.4 9389.5 10462.3 11286.1 11895.7 12355.5 12592.0
PROFILES
The Miami-Miami Beach-Kendall MSA is located in the southeastern section of the state. Miami-Dade County is estimated to be the most populous county in Florida and the seventh-most populous county in the United States.
QUICK FACTS
• Metro population estimate of 2,716,940 as of 2019 (5-Year Estimate) (U.S. Census Bureau).
• Miami-Dade County population estimate of 2,716,940 as of 2019 (5-Year Estimate) (U.S. Census Bureau).
• Civilian labor force of 1,332,028 in November 2022 (Florida Research and Economic Database).
• An unemployment rate of 1.5% as of November 2022, not seasonally adjusted. This amounts to 19,872 unemployed people (Florida Research and Economic Database).
OUTLOOK SUMMARIES
The Miami Dade–Kendall area is expected to show mixed levels of growth in the economic indicators. Personal income is expected to grow an average of 3.7 percent annually, the lowest of the MSAs studied. The average real per capita income level of $50,700 ranks eleventh in the areas studied. Average annual wage growth will be 2.8 percent, the second lowest of the MSAs, and the average annual wage level is expected to be $81,700, the 2nd highest of the studied areas. Miami is expected to average a population growth of 0.5 percent each year. The area has the 3rd highest Gross Metro Product of the MSAs studied at an average level of $158,452.91 million.
Employment is expected to grow at an average rate of -0.4 percent each year, about average in the state, while unemployment is expected to be 5.1 percent.
Miami’s fastest growing sector is expected to be the State and Local Government sector, which will experience 1.6 percent average annual growth, followed by the Education-Health sector, which will
grow at an average of 1.4 percent annually. We expect the Manufacturing sector to experience the largest contraction at -4.4 percent.
METRO NEWS SUMMARIES
Richman Group buys Miami development site for $23M
• Richman Group has purchased a development site located near the Culmer Metrorail Station for $23 million.
• The development site was previously bought in 2019 for $9.5 million. The increase in value is a demonstration of high demand for such sites in Miami.
• There will be two towers, one of which will be affordable housing that is reserved for people who are making between 20 to 80% of the median income in the area.
Source: South Florida Business Journal, September 23, 2022
Future Knotel building in Wynwood obtains $11M mortgage
• New York-based Knotel is in the process of transforming a warehouse in the Wynwood Arts District into a co-working office building.
• Wyncatcher Holding LLC has received an $11 million mortgage to help complete the project.
• The company purchased the warehouse in 2019 for $9.3 million.
Source: South Florida Business Journal, September 27, 2022
Demand for new industrial space high in MiamiDade
• According to a recent report by brokerage JLL, over 40% of the Class A industrial spaces in Miami-Dade County that are currently being built have already been leased even though they are not yet built.
• Given such demand, this has increased the rent for such space to over $15 per square foot.
• The demand for such space is particularly high
M IAMI - M IAMI B EACH - K ENDALL 70 Florida & Metro Forecast / Winter 2023
in Miami-Dade because of the large population and the massive cargo ports located at the Miami International Airport and PortMiami.
Source: South Florida Business Journal, October 26, 2022
Richman Group to build Miami-Dade County apartments with $44M loan
• The Richman Group has received a $44.48 construction loan from PNC Bank, allowing them to begin building the Water Side apartments.
• The Water Side apartments will have 266 apartments as well as nearly 3,000 square feet of retail space and almost 300 parking spaces.
• In addition, there will be 29 workforce housing units, which will be devoted to people that are making up to 140% of the median income in the area, which is $53,975.
Source: South Florida Business Journal, October 30, 2022
Private soccer facility to be redeveloped into selfstorage
• Triangle Soccer LLC has sold its soccer facility to Hialeah Gardens Storage Associates for $4.7 million.
• They have received approval to transform the soccer facility into a 97,000 square foot selfstorage facility.
• “There’s a lot of momentum in Hialeah Gardens with a lot of projects,” Daniel Masveyraud, a principal at H&M Development said. He continued, “There’s a huge Publix and Homegoods coming and there are also close to 600 apartments coming up. The market is ripe for self-storage.”
Source: South Florida Business Journal, November 28, 2022
Genting lists former Miami Herald site in Miami for $1B
• Genting Group wanted to turn the former headquarters of the Miami Herald into a gambling resort but was unable to get approval
from Florida lawmakers.
• As a result, the Genting Group has decided to list the property for $1 billion after purchasing it for $236 million in 2011.
• Michael T. Fay, who has the listing, said, “This site is among the most valuable in the United States, let alone South Florida.” He continued, “The rarity of this opportunity coupled with the potential to build a landmark office, retail, residential, hospitality, and entertainment destination will attract prospective buyers from all over the world.”
Source: South Florida Business Journal, November 30, 2022
Dolphin Commerce Center sold for $198M
• The Dolphin Commerce Center, which was originally bought in 2004 for $45 million, has now been sold for $198 million.
• The significant increase in value is in part due to a rise in demand for space that has contributed to record-high industrial rents in Miami-Dade County.
• To make the purchase, the buyer took out a mortgage with Northwest Mutual Insurance Co. in the amount of $50 million.
Source: South Florida Business Journal, December 29, 2022
Leasing Roundup: San Francisco proptech company relocates to Miami
• Bungalow, a company that helps renters and property owners, has decided to relocate its headquarters from San Francisco to Miami.
• The company plans to begin hiring for a variety of roles including operations and legal immediately.
• Co-founder and CEO of Bungalow, Andrew Collins, said, “We closed our San Francisco office and downsized recently to a shared space, but now most of the Bay Area team is moving to Miami.”
Source: South Florida Business Journal, December 29, 2022
M IAMI - M IAMI B EACH - K ENDALL Institute for Economic Forecasting 71
Miami-Miami Beach-Kendall Division MSA Industry Location Quotients
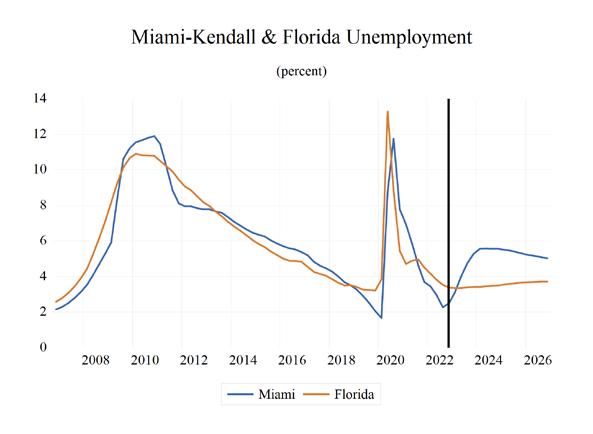
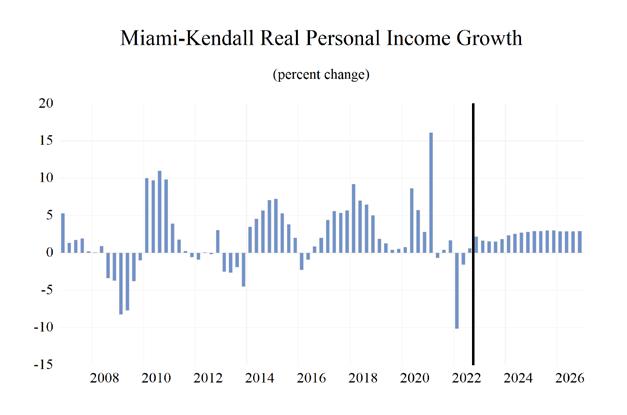

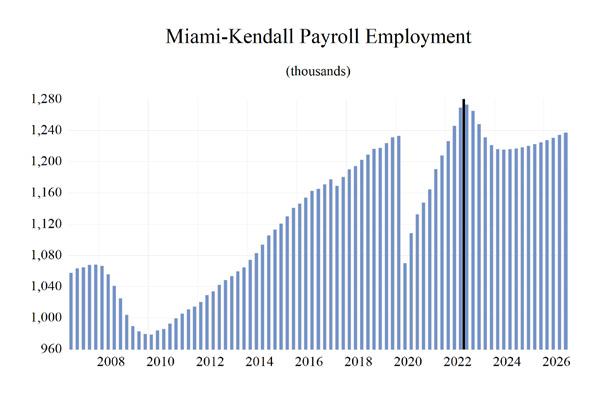
M IAMI - M IAMI B EACH - K ENDALL 72 Florida & Metro Forecast / Winter 2023 0 0.2 0.4 0.6 0.8 1 1.2 1.4 1.6 1.8 2 Total Nonagricultural Employment Total Private Goods Producing Service Producing Private Service Providing Mining, Logging, and Construction Manufacturing Trade, Transportation, and Utilities Wholesale Trade Retail Trade Transportation, Warehousing and Utilities Information Financial Activities Professional and Business Services Educational and Health Services Leisure and Hospitality Other Services Government
Long-Term Outlook for Miami-Miami Beach-Kendall, FL (Division of Miami-Fort Lauderdale MSA)
M IAMI - M IAMI B EACH - K ENDALL Institute for Economic Forecasting 73
December
2018 2019 2020 2021 2022 2023 2024 2025 2026 Personal Income (Billions $) Total Personal Income 144.6 151.5 155.4 172.7 180.1 185.9 190.6 199.4 208.3 Pct Chg Year Ago 8.9 4.8 2.6 11.1 4.3 3.2 2.5 4.6 4.5 Wages and Salaries 70.9 74.8 74.5 85.5 96.5 97.5 98.4 101.6 105.8 Nonwage Income 73.7 76.7 80.9 87.2 83.6 88.5 92.3 97.7 102.5 Real Personal Income (12$) 121.4 126.5 127.0 135.3 132.8 132.8 133.1 136.4 139.7 Pct Chg Year Ago 5.4 4.2 0.4 6.5 -1.9 0.0 0.2 2.5 2.5 Per Capita Income (Ths) 53.3 55.9 57.8 64.9 68.0 70.2 71.6 74.4 77.1 Real Per Capita Income (12$) 44.8 46.7 47.3 50.9 50.1 50.1 50.0 50.9 51.7 Average Annual Wage (Ths) 58.8 60.8 65.3 72.1 76.6 78.1 80.5 82.8 85.4 Pct Chg Year Ago 3.4 3.5 7.3 10.5 6.1 2.0 3.0 2.9 3.2 Establishment Employment (Place of Work, Thousands, SA) Total Employment 1199.0 1222.3 1136.1 1177.7 1253.7 1241.4 1216.3 1221.6 1232.4 Pct Chg Year Ago 2.1 1.9 -7.1 3.7 6.5 -1.0 -2.0 0.4 0.9 Manufacturing 41.5 42.3 40.4 40.7 44.4 43.3 39.4 37.8 37.0 Pct Chg Year Ago 0.6 2.2 -4.6 0.8 9.1 -2.4 -9.1 -4.2 -1.9 Nonmanufacturing 1157.5 1180.0 1095.8 1136.9 1209.2 1198.1 1176.9 1183.9 1195.4 Pct Chg Year Ago 2.1 1.9 -7.1 3.8 6.4 -0.9 -1.8 0.6 1.0 Construction & Mining 52.4 54.3 53.3 52.4 54.0 53.0 51.1 50.8 51.4 Pct Chg Year Ago 9.7 3.7 -1.8 -1.7 3.1 -2.0 -3.5 -0.7 1.3 Trade, Trans, & Utilities 300.0 307.0 287.5 294.8 316.3 310.5 304.9 303.5 303.5 Pct Chg Year Ago 1.9 2.3 -6.3 2.5 7.3 -1.8 -1.8 -0.5 0.0 Wholesale Trade 73.9 74.1 70.5 73.2 79.8 79.5 79.9 80.3 80.6 Retail Trade 146.7 144.4 132.4 136.3 140.2 132.6 126.3 125.0 125.0 Trans, Wrhsng, & Util 79.4 88.5 84.6 85.3 96.3 98.4 98.7 98.2 97.9 Information 20.0 20.6 19.0 20.1 20.7 20.4 20.4 20.9 21.0 Pct Chg Year Ago 3.2 3.0 -7.5 5.6 3.2 -1.6 -0.1 2.5 0.5 Financial Activities 81.2 81.9 80.7 84.7 88.3 87.9 88.6 88.9 88.4 Pct Chg Year Ago 0.7 0.9 -1.4 4.9 4.2 -0.4 0.8 0.3 -0.5 Prof & Business Services 178.3 182.2 174.8 184.7 196.7 182.2 166.6 171.0 178.8 Pct Chg Year Ago 2.9 2.2 -4.0 5.6 6.5 -7.4 -8.5 2.6 4.6 Educ & Health Services 187.6 193.1 187.4 192.5 202.6 209.2 213.4 213.6 214.1 Pct Chg Year Ago 2.3 3.0 -3.0 2.8 5.2 3.3 2.0 0.1 0.3 Leisure & Hospitality 143.3 146.1 105.8 123.2 143.9 146.3 140.1 140.8 141.1 Pct Chg Year Ago 1.3 1.9 -27.6 16.4 16.8 1.7 -4.3 0.5 0.3 Other Services 51.3 50.4 45.5 46.7 50.2 51.1 52.0 52.6 52.7 Pct Chg Year Ago -0.2 -1.7 -9.8 2.7 7.5 1.9 1.8 1.1 0.2 Federal Government 20.1 20.5 21.5 21.2 21.1 20.2 20.4 20.9 21.3 Pct Chg Year Ago 0.5 1.9 4.6 -1.3 -0.2 -4.5 1.2 2.1 2.0 State & Local Government 123.4 123.9 120.3 116.6 115.4 117.3 119.3 121.0 123.0 Pct Chg Year Ago 1.3 0.4 -2.9 -3.0 -1.1 1.6 1.7 1.5 1.6 Other Economic Indicators Population (Ths) 2710.7 2709.5 2688.4 2660.4 2648.9 2650.0 2663.2 2681.0 2700.9 Pct Chg Year Ago 0.1 0.0 -0.8 -1.0 -0.4 0.0 0.5 0.7 0.7 Labor Force (Ths) 1354.9 1377.5 1270.9 1307.6 1329.7 1312.5 1315.8 1329.7 1345.3 Percent Change, Year Ago 0.4 1.7 -7.7 2.9 1.7 -1.3 0.3 1.1 1.2 Unemployment Rate (%) 3.9 2.7 7.5 5.3 2.8 4.3 5.6 5.4 5.1 Total Housing Starts 9593.2 9594.5 8535.3 9847.1 10005.8 6584.8 7164.7 8704.1 9175.7 Single-Family 2337.6 2404.3 2068.2 2436.2 2552.8 1899.9 2181.7 2354.5 2368.1 Multifamily 7255.7 7190.2 6467.1 7410.9 7453.0 4684.9 4982.9 6349.6 6807.6
2022 Forecast
Short-Term Outlook for Miami-Miami Beach-Kendall, FL (Division of Miami-Fort Lauderdale MSA) December 2022 Forecast
M IAMI - M IAMI B EACH - K ENDALL 74 Florida & Metro Forecast / Winter 2023
2022:4 2023:1 2023:2 2023:3 2023:4 2024:1 2024:2 2024:3 2024:4 2025:1 2025:2 2025:3 2025:4 Personal Income (Billions $) Total Personal Income 183.9 186.3 186.0 185.7 185.7 187.7 189.5 191.7 193.6 196.0 198.3 200.5 202.6 Pct Chg Year Ago 5.4 6.2 4.0 1.9 1.0 0.7 1.9 3.2 4.2 4.5 4.6 4.6 4.6 Wages and Salaries 98.6 98.4 97.7 97.0 96.8 97.3 97.9 98.8 99.5 100.3 101.1 102.0 103.0 Nonwage Income 85.3 87.9 88.3 88.7 88.9 90.4 91.6 92.9 94.1 95.8 97.2 98.5 99.5 Real Personal Income (12$) 133.3 134.1 133.3 132.2 131.5 132.0 132.8 133.5 134.1 135.1 136.0 136.8 137.6 Pct Chg Year Ago -0.4 1.6 0.7 -0.9 -1.4 -1.5 -0.4 0.9 2.0 2.3 2.4 2.5 2.6 Per Capita Income (Ths) 69.5 70.4 70.2 70.1 70.0 70.6 71.2 71.9 72.5 73.3 74.0 74.7 75.4 Real Per Capita Income (12$) 50.4 50.7 50.3 49.9 49.5 49.7 49.9 50.1 50.2 50.5 50.8 51.0 51.2 Average Annual Wage (Ths) 77.1 77.4 77.8 78.3 78.8 79.5 80.2 80.8 81.3 81.9 82.4 83.0 83.7 Pct Chg Year Ago 2.0 1.9 1.8 2.1 2.3 2.8 3.0 3.1 3.2 2.9 2.9 2.8 2.9 Establishment Employment (Place of Work, Thousands, SA) Total Employment 1273.2 1265.0 1248.2 1231.2 1221.2 1216.3 1215.6 1216.2 1217.0 1218.5 1220.4 1222.7 1225.0 Pct Chg Year Ago 5.4 3.2 0.2 -3.0 -4.1 -3.9 -2.6 -1.2 -0.3 0.2 0.4 0.5 0.7 Manufacturing 45.6 44.8 44.2 42.9 41.4 40.4 39.7 39.0 38.5 38.2 37.9 37.6 37.4 Pct Chg Year Ago 9.6 5.6 0.1 -5.5 -9.3 -10.0 -10.2 -9.1 -7.0 -5.4 -4.6 -3.6 -3.0 Nonmanufacturing 1227.6 1220.2 1204.0 1188.3 1179.8 1176.0 1175.8 1177.2 1178.5 1180.4 1182.5 1185.0 1187.7 Pct Chg Year Ago 5.3 3.1 0.2 -2.9 -3.9 -3.6 -2.3 -0.9 -0.1 0.4 0.6 0.7 0.8 Construction & Mining 54.6 54.4 53.3 52.2 52.0 51.6 51.1 50.9 50.9 50.7 50.8 50.8 50.8 Pct Chg Year Ago 2.5 2.0 -1.6 -3.5 -4.6 -5.2 -4.0 -2.5 -2.1 -1.6 -0.7 -0.4 -0.2 Trade, Trans, & Utilities 318.9 314.8 312.2 307.7 307.1 306.2 304.9 304.6 304.0 303.6 303.4 303.6 303.5 Pct Chg Year Ago 5.5 1.8 -1.5 -3.9 -3.7 -2.7 -2.4 -1.0 -1.0 -0.9 -0.5 -0.3 -0.2 Wholesale Trade 81.3 80.6 79.3 79.0 79.1 79.5 79.8 80.1 80.2 80.2 80.3 80.3 80.5 Retail Trade 138.5 135.3 134.5 130.7 129.8 128.0 126.0 125.8 125.4 125.0 124.9 125.2 124.9 Trans, Wrhsng, & Util 99.1 98.9 98.5 98.0 98.2 98.7 99.0 98.7 98.5 98.4 98.2 98.1 98.1 Information 20.8 20.6 20.5 20.4 20.1 20.2 20.4 20.5 20.5 20.7 20.8 21.0 21.0 Pct Chg Year Ago 1.5 0.1 -1.4 -2.0 -3.2 -2.2 -0.5 0.4 2.0 2.6 2.3 2.7 2.3 Financial Activities 89.4 88.8 87.8 87.3 87.7 88.1 88.6 88.8 89.0 89.1 89.0 88.7 88.6 Pct Chg Year Ago 3.2 2.0 0.8 -2.4 -2.0 -0.9 0.9 1.7 1.5 1.2 0.5 -0.1 -0.5 Prof & Business Services 197.0 195.2 186.3 177.0 170.3 167.1 166.2 166.3 166.9 168.4 169.9 171.8 173.8 Pct Chg Year Ago 2.5 -0.4 -5.0 -10.5 -13.6 -14.4 -10.8 -6.0 -2.0 0.8 2.3 3.3 4.1 Educ & Health Services 207.8 208.3 208.3 209.6 210.6 212.1 213.5 214.0 213.8 213.7 213.5 213.6 213.5 Pct Chg Year Ago 6.6 5.5 4.5 1.9 1.3 1.8 2.5 2.1 1.5 0.8 0.0 -0.2 -0.1 Leisure & Hospitality 151.0 149.8 147.8 145.5 142.3 140.1 139.9 139.9 140.6 140.4 140.8 140.8 141.1 Pct Chg Year Ago 16.5 12.0 3.7 -1.9 -5.8 -6.5 -5.4 -3.8 -1.2 0.3 0.7 0.6 0.4 Other Services 51.6 51.4 50.9 50.9 51.4 51.7 52.0 52.2 52.3 52.5 52.6 52.6 52.7 Pct Chg Year Ago 8.3 6.1 3.0 -0.6 -0.5 0.5 2.2 2.5 1.9 1.6 1.2 0.9 0.7 Federal Government 20.6 20.3 20.1 20.1 20.2 20.3 20.4 20.5 20.6 20.7 20.8 20.9 21.0 Pct Chg Year Ago -4.9 -7.0 -5.8 -3.1 -1.9 -0.3 1.3 1.9 2.1 2.1 2.1 2.1 2.1 State & Local Government 115.8 116.4 116.9 117.6 118.1 118.6 119.0 119.5 119.9 120.4 120.8 121.2 121.7 Pct Chg Year Ago -1.1 0.2 2.5 1.7 2.1 1.9 1.9 1.6 1.5 1.5 1.5 1.4 1.5 Other Economic Indicators Population (Ths) 2646.7 2646.9 2648.0 2650.8 2654.3 2657.6 2661.1 2664.9 2669.2 2674.1 2678.6 2683.2 2688.0 Pct Chg Year Ago -0.3 -0.2 -0.1 0.1 0.3 0.4 0.5 0.5 0.6 0.6 0.7 0.7 0.7 Labor Force (Ths) 1326.4 1319.2 1311.9 1308.8 1309.9 1311.8 1314.0 1317.0 1320.5 1323.8 1327.7 1332.1 1335.5 Pct Chg Year Ago 1.0 -0.4 -1.9 -1.7 -1.2 -0.6 0.2 0.6 0.8 0.9 1.0 1.1 1.1 Unemployment Rate (%) 2.5 3.1 4.0 4.7 5.3 5.5 5.6 5.6 5.6 5.5 5.4 5.4 5.3 Total Housing Starts 7408.9 7183.5 6619.7 6345.6 6190.6 6510.5 6819.0 7349.1 7980.1 8401.3 8689.9 8814.0 8911.1 Single-Family 2109.5 1957.9 1841.9 1864.3 1935.6 2028.5 2134.0 2232.6 2332.0 2358.9 2359.2 2344.6 2355.2 Multifamily 5299.4 5225.6 4777.8 4481.3 4255.0 4482.0 4685.0 5116.5 5648.1 6042.4 6330.6 6469.3 6556.0
PROFILES
The Naples–Immokalee–Marco Island MSA is comprised of Collier County only. Located on the southwest coast of Florida it is notable for numerous recreation and leisure activities. This region is sometimes referred to as the “Crown Jewel of Southwest Florida.”
QUICK FACTS
• Metro population estimate of 371,453 as of 2019 (5-Year Estimate) (U.S. Census Bureau).
• Collier County population estimate of 384,902 as of 2019 (5-Year Estimate) (U.S. Census Bureau).
• Civilian labor force of 189,559 in November 2022 (Florida Research and Economic Database).
• An unemployment rate of 2.7% as of November 2022, not seasonally adjusted. This amounts to 5,057 unemployed people (Florida Research and Economic Database).
OUTLOOK SUMMARIES
The Naples—Marco Island Metropolitan Statistical Area (MSA) is expected to show above-average performance in most of the economic indicators studied in this forecast. Gross Metro Product will come in at $19,966.26. Average annual wage growth of 2.9 percent will push the average annual wage level to $75,200, the 7th highest in the state. Personal income growth of 6.0 percent will lead to the highest per capita income level in the state at $99,800. The Naples – Marco Island MSA will experience a population growth of 1.2 percent.
The Naples area will experience an employment growth rate of 0.1 percent. This will lead to an unemployment rate of 5.0 percent, the 6th lowest in the state.
The Other Services sector will lead Naples with the highest average annual growth rate of 3.5 percent. This is followed by the Education – Health and Financial Services sectors at respective rates of 2.6 percent and 1.8 percent.
METRO NEWS SUMMARIES
After long search, national resort company zeroes in on Florida expansion
• After long consideration, Great Wolf Resort will be building their new 20-acre resort in the perfect location, Naples. Great Wolf, one of the largest indoor water park resorts in North America, plans to build a $250 million resort and indoor water park on the eastern end of Collier County.
• The resort will feature 500 suites, a 100,000 square foot indoor water park, and a 62,000 square foot entertainment center. Collier County Officials are enthusiastic to work with Great Wolf, providing a $15 million incentive that would be repaid in 4-5 years.
• A financial feasibility study found that over the next 30 years, the resort would generate over $5 billion in net new spending, $2.4 billion in net new earnings and bring more than 1,400 new full-time equivalent jobs. Construction has begun, and will hopefully be completed by spring 2024.
Source: Business Insider, September 16, 2022
Naples, FL will be among the fastest growing cities by 2060
• From 2010 to 2020, 80% of U.S metropolitan areas saw a growth in population. While this general growth trend may not continue going forward, Washington D.C.-based economic and demographic data firm, Woods & Poole Economics, Inc., has released a new report that expects several metro areas to have population booms in the upcoming decades.
• The Naples-Marco Island metropolitan area is one such area, with the report anticipating a 78.5% population growth from 2022 to 2060. The area currently has a population of 392,600 in 2022, which is expected to reach 700,700 in 2060. This makes Naples the 12th highest growing metro area in the U.S.
• The large population growth is attributed to positive projections about the area’s economy. Naples is expected to have employment growth of
N APLES – I MMOKALEE – M ARCO I SLAND Institute for Economic Forecasting 75
90.2% by 2060 and a personal income per capita growth from $126,157 in 2022 to $761,019 in 2060.
Source: The Center Square, September 16, 2022
How the SWFL tourism season might take a hit after Ian
• Just like the rest of Florida, tourism is a strong economic driver in Southwest Florida, especially during summer and winter seasons. With winter coming soon, this makes getting the tourism industry back up and running after Hurricane Ian a priority.
• Paul Beirnes, the executive director of the Everglades Convention Visitors Bureau in Naples and Marco Island, makes this explicitly clear, saying “We know tourism and the economic impact is really what’s going to drive recovery long-term.”
• While there is not much optimism for the tourist season for the 2022 year, hopes are that by 2023 the tourism season will come by in full force and help the economic recovery that Naples and many other Southwest Florida cities are waiting for.
Source: Wink News, October 17, 2022
Home buyers flock to Florida cities devastated by Hurricane Ian
• Merely a month after Hurricane Ian, investors and buyers are looking to scour the market for cheap deals on properties that have historically been highly valued. In recent years, Naples along with other Southwestern cities have seen home prices continue to rise.
• Residential Real Estate agents in Naples reveal that despite the Hurricane’s catastrophic aftermath, demand remains high from both instate and out-of-state buyers. Many long-time residents have felt the pressure of rising costs and are now considering leaving. Buyers are hoping to snatch these hurricane damaged properties at great discount prices.
• Prices are expected to be erratic for the months following the hurricane, with prices increasing in the short term due to hurricane-induced inventory shortage along with the strong demand. This demand will hopefully help Naples and
nearby cities in their economic recoveries as they have in the past.
Source: The Wall Street Journal, October 18, 2022
Multifamily report: 20,000 units headed to three counties in the region
• Demand for homes post Hurricane Ian remains strong in Southwest Florida. Despite the rising interest rates, new housing units are still being built. Collier County alone has 1,829 units under construction with another 759 in the pipeline
• Vacancy rates, which impact the supply of homes, have remained the same at 8.5% in Collier County. This despite the average rent price in the area increasing to $2,431, up 7.5% from 2021. This makes Collier County along with Lee County have some of the highest rental rates in Florida.
• For developers in the area, their biggest challenge has turned to finding ready-to-go sites that are capable of handling large projects. As demand continues to win the tug of war with rising interest rates, Southwest Florida continues to need more multifamily units.
Source: Business Observer, November 27, 2022
Collier County tourism continues to thrive as most hotels reopen
• After 2 months of recovery, most Collier County hotels are back to being fully operational. Collier County Tourism Director Paul Biernes stated, “... it was really difficult to see a lot of the hotels that were struggling to get back online [after the storm].”
• According to Biernes, 88% of the county hotel room inventory is now open to visitors, with most of the remaining closed rooms coming from 2 hotels that suffered major damages from the hurricane.
• Compared to last month (October), hotels were at an occupancy rate of 70% and brought in $2.3 billion so far in 2022. Surprisingly, the occupancy rate is 25% higher than October 2021. The high occupancy rate is being attributed to people displaced due to Hurricane Ian.
Source: Gulfshore Business, November 30, 2022
N APLES – I MMOKALEE – M ARCO I SLAND 76 Florida & Metro Forecast / Winter 2023
Naples - Immokalee - Marco Island MSA Industry Location Quotients
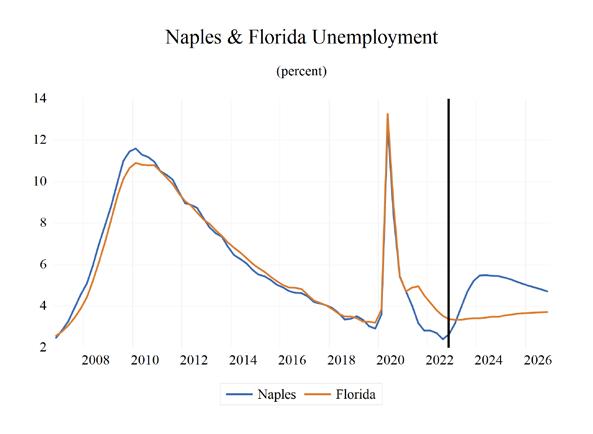
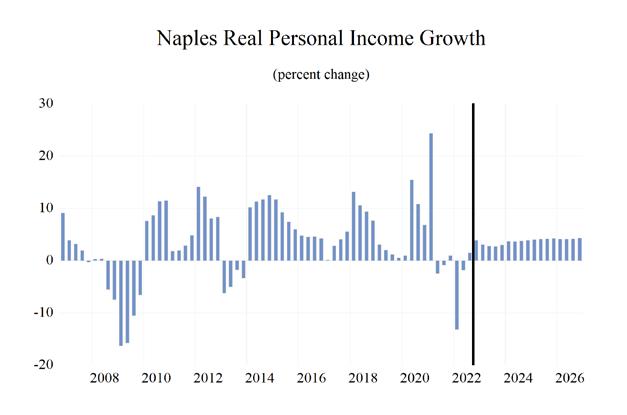

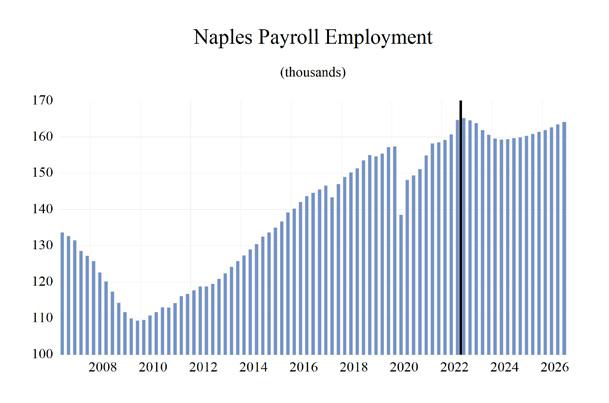
N APLES – I MMOKALEE – M ARCO I SLAND Institute for Economic Forecasting 77 0 0.5 1 1.5 2 2.5 Total Nonagricultural Employment Total Private Goods Producing Service Producing Private Service Providing Mining, Logging, and Construction Manufacturing Trade, Transportation, and Utilities Wholesale Trade Retail Trade Transportation, Warehousing and Utilities Information Financial Activities Professional and Business Services Educational and Health Services Leisure and Hospitality Other Services Government
Long-Term Outlook for Naples-Immokalee-Marco Island, FL December 2022 Forecast
N APLES – I MMOKALEE – M ARCO I SLAND 78 Florida & Metro Forecast / Winter 2023
2018 2019 2020 2021 2022 2023 2024 2025 2026 Personal Income (Billions $) Total Personal Income 38.1 41.0 42.4 45.5 46.5 49.2 51.9 55.4 58.7 Pct Chg Year Ago 12.1 7.8 3.4 7.4 2.1 5.9 5.3 6.8 6.0 Wages and Salaries 8.1 8.6 9.0 10.4 11.4 11.7 11.9 12.3 12.9 Nonwage Income 29.9 32.4 33.4 35.2 35.0 37.6 39.9 43.0 45.8 Real Personal Income (12$) 34.2 37.1 37.8 38.9 37.4 38.3 39.5 41.3 42.9 Pct Chg Year Ago 10.9 8.6 2.0 3.0 -4.0 2.5 3.0 4.6 3.9 Per Capita Income (Ths) 103.9 110.2 112.1 117.8 118.0 123.4 128.4 135.7 142.2 Real Per Capita Income (12$) 93.2 99.7 100.0 100.7 94.9 96.1 97.7 101.2 104.0 Average Annual Wage (Ths) 53.6 55.3 60.3 66.4 70.2 71.4 74.5 76.5 78.6 Pct Chg Year Ago 4.7 3.2 9.0 10.0 5.8 1.7 4.4 2.8 2.7 Establishment Employment (Place of Work, Thousands, SA) Total Employment 151.0 155.5 148.3 155.7 162.4 162.7 159.5 160.6 163.0 Pct Chg Year Ago 3.7 3.0 -4.6 5.0 4.3 0.2 -2.0 0.7 1.5 Manufacturing 4.3 4.7 4.9 5.1 5.4 5.4 5.0 5.0 5.1 Pct Chg Year Ago 7.8 10.1 5.2 2.9 6.3 -0.2 -6.3 -0.5 1.3 Nonmanufacturing 146.8 150.8 143.4 150.6 157.0 157.3 154.4 155.6 158.0 Pct Chg Year Ago 3.6 2.8 -5.0 5.0 4.3 0.2 -1.8 0.8 1.5 Construction & Mining 17.2 17.7 17.2 18.1 19.5 19.7 18.5 17.7 17.4 Pct Chg Year Ago 11.6 2.6 -2.8 5.3 8.1 0.8 -6.2 -4.0 -1.8 Trade, Trans, & Utilities 28.6 29.2 28.3 29.1 29.7 29.2 28.5 28.4 28.6 Pct Chg Year Ago 2.5 2.1 -3.0 2.9 1.8 -1.7 -2.4 -0.2 0.6 Wholesale Trade 4.4 4.8 4.8 5.0 5.1 5.3 5.4 5.6 5.7 Retail Trade 22.1 22.2 21.4 21.8 22.1 21.4 20.5 20.2 20.3 Trans, Wrhsng, & Util 2.1 2.2 2.1 2.3 2.4 2.5 2.5 2.6 2.6 Information 1.4 1.4 1.2 1.2 1.3 1.3 1.3 1.3 1.3 Pct Chg Year Ago -4.0 0.0 -13.2 2.1 4.5 0.7 0.2 1.4 -0.8 Financial Activities 8.4 8.7 8.7 9.4 9.6 10.0 10.1 10.2 10.3 Pct Chg Year Ago 1.1 4.6 -0.7 8.0 2.3 4.4 0.5 1.3 1.0 Prof & Business Services 16.7 17.3 17.3 18.8 19.6 17.9 16.0 16.3 17.4 Pct Chg Year Ago 3.8 3.7 0.2 8.4 4.4 -8.6 -11.1 2.2 6.6 Educ & Health Services 22.3 23.1 23.0 23.7 24.6 26.0 26.8 26.9 27.2 Pct Chg Year Ago 3.6 3.3 -0.4 3.2 3.7 5.7 3.1 0.6 1.0 Leisure & Hospitality 29.0 30.0 25.5 28.0 30.1 29.8 29.4 30.3 30.9 Pct Chg Year Ago 2.7 3.1 -15.0 9.9 7.6 -1.1 -1.1 2.7 2.2 Other Services 9.2 9.2 8.7 9.1 9.5 10.0 10.5 10.7 10.9 Pct Chg Year Ago 3.6 0.3 -6.1 4.6 5.1 5.2 4.1 2.7 1.7 Federal Government 0.7 0.7 0.8 0.7 0.7 0.7 0.7 0.7 0.7 Pct Chg Year Ago 0.0 2.3 6.8 -8.1 -1.7 -0.7 -0.4 3.1 3.5 State & Local Government 13.2 13.6 12.8 12.5 12.4 12.7 12.8 13.0 13.2 Pct Chg Year Ago 0.9 2.6 -5.8 -2.1 -0.8 2.5 0.9 1.4 1.3 Other Economic Indicators Population (Ths) 366.4 372.0 378.3 386.8 393.9 398.8 403.8 408.2 412.7 Pct Chg Year Ago 1.2 1.5 1.7 2.2 1.8 1.2 1.3 1.1 1.1 Labor Force (Ths) 176.3 179.0 176.3 180.8 186.7 191.5 192.3 193.5 195.5 Percent Change, Year Ago 2.5 1.6 -1.5 2.6 3.3 2.6 0.4 0.6 1.0 Unemployment Rate (%) 3.6 3.2 7.5 3.7 2.6 4.3 5.5 5.2 4.9 Total Housing Starts 4230.1 4010.5 4221.5 5861.9 4816.2 4134.6 4750.1 5403.2 5585.6 Single-Family 3118.8 3376.8 3149.3 4247.7 3445.3 2690.9 2972.5 3134.0 3106.2 Multifamily 1111.4 633.6 1072.3 1614.2 1370.9 1443.7 1777.6 2269.2 2479.4
Short-Term Outlook for Naples-Immokalee-Marco Island, FL
2022 Forecast
N APLES – I MMOKALEE – M ARCO I SLAND Institute for Economic Forecasting 79
December
2022:4 2023:1 2023:2 2023:3 2023:4 2024:1 2024:2 2024:3 2024:4 2025:1 2025:2 2025:3 2025:4 Personal Income (Billions $) Total Personal Income 47.8 48.6 48.9 49.4 50.0 50.7 51.4 52.2 53.1 54.1 55.0 55.8 56.6 Pct Chg Year Ago 7.5 7.9 6.2 5.0 4.4 4.3 4.9 5.7 6.4 6.7 7.1 6.9 6.6 Wages and Salaries 11.7 11.7 11.7 11.6 11.7 11.7 11.8 12.0 12.1 12.2 12.3 12.4 12.5 Nonwage Income 36.1 36.9 37.3 37.8 38.3 39.0 39.5 40.2 41.0 41.9 42.7 43.4 44.1 Real Personal Income (12$) 37.8 38.1 38.2 38.4 38.6 38.9 39.2 39.6 40.1 40.6 41.1 41.5 41.9 Pct Chg Year Ago 1.7 3.2 2.9 2.1 2.0 2.0 2.6 3.3 4.1 4.4 4.8 4.8 4.5 Per Capita Income (Ths) 120.8 122.5 122.9 123.7 124.7 126.2 127.3 129.1 131.0 133.0 134.9 136.6 138.1 Real Per Capita Income (12$) 95.5 96.1 96.0 96.1 96.2 96.8 97.3 98.0 98.9 99.9 100.8 101.6 102.3 Average Annual Wage (Ths) 70.6 70.6 71.0 71.5 72.3 73.3 74.1 74.9 75.6 76.0 76.3 76.7 77.2 Pct Chg Year Ago 1.6 1.5 1.1 1.6 2.5 3.8 4.4 4.8 4.5 3.7 3.0 2.4 2.1 Establishment Employment (Place of Work, Thousands, SA) Total Employment 165.2 164.6 163.8 161.9 160.6 159.6 159.2 159.5 159.7 159.9 160.3 160.8 161.4 Pct Chg Year Ago 4.2 3.4 1.9 -1.7 -2.8 -3.0 -2.8 -1.5 -0.6 0.2 0.7 0.9 1.1 Manufacturing 5.5 5.5 5.5 5.3 5.2 5.1 5.0 5.0 5.0 5.0 5.0 5.0 5.0 Pct Chg Year Ago 5.8 5.2 3.5 -2.8 -6.5 -7.9 -8.1 -5.7 -3.3 -1.6 -0.6 -0.2 0.3 Nonmanufacturing 159.6 159.0 158.3 156.6 155.4 154.5 154.2 154.4 154.7 154.9 155.3 155.8 156.3 Pct Chg Year Ago 4.1 3.3 1.9 -1.6 -2.6 -2.9 -2.6 -1.4 -0.5 0.3 0.7 0.9 1.1 Construction & Mining 20.3 20.3 19.9 19.4 19.2 18.8 18.5 18.3 18.1 17.9 17.8 17.7 17.5 Pct Chg Year Ago 9.4 7.5 4.5 -2.6 -5.4 -7.1 -6.9 -5.5 -5.3 -4.8 -3.9 -3.7 -3.4 Trade, Trans, & Utilities 29.7 29.4 29.4 28.9 28.9 28.7 28.4 28.4 28.3 28.3 28.4 28.5 28.5 Pct Chg Year Ago 1.2 0.3 -0.8 -3.2 -3.0 -2.5 -3.4 -1.9 -1.8 -1.3 -0.3 0.3 0.5 Wholesale Trade 5.2 5.3 5.3 5.3 5.3 5.4 5.4 5.5 5.5 5.5 5.6 5.6 5.6 Retail Trade 22.1 21.7 21.7 21.1 21.0 20.8 20.5 20.4 20.3 20.2 20.2 20.3 20.3 Trans, Wrhsng, & Util 2.5 2.5 2.5 2.5 2.5 2.5 2.6 2.6 2.6 2.6 2.6 2.6 2.6 Information 1.3 1.3 1.3 1.3 1.3 1.3 1.3 1.3 1.3 1.3 1.3 1.3 1.3 Pct Chg Year Ago -0.3 2.7 1.8 0.5 -2.0 -1.0 0.0 0.4 1.7 2.1 1.4 1.4 0.8 Financial Activities 9.9 10.0 10.1 10.0 10.0 10.0 10.0 10.1 10.1 10.2 10.2 10.2 10.2 Pct Chg Year Ago 3.4 5.4 7.1 3.9 1.2 0.4 -0.2 0.9 1.1 1.3 1.7 1.3 1.1 Prof & Business Services 19.6 19.4 18.5 17.4 16.5 16.1 15.9 15.9 15.9 16.0 16.2 16.4 16.6 Pct Chg Year Ago 1.9 -0.9 -5.5 -11.9 -15.9 -17.3 -13.6 -8.4 -3.6 -0.4 1.4 3.0 4.6 Educ & Health Services 25.2 25.4 25.9 26.2 26.4 26.6 26.8 26.9 26.9 26.9 26.9 26.9 27.0 Pct Chg Year Ago 5.5 5.9 7.2 5.0 4.7 4.6 3.3 2.5 1.9 1.1 0.5 0.2 0.5 Leisure & Hospitality 30.4 29.9 29.9 29.8 29.6 29.2 29.3 29.5 29.8 30.0 30.2 30.3 30.5 Pct Chg Year Ago 4.7 2.2 -0.3 -3.3 -2.8 -2.3 -2.0 -1.2 1.0 2.7 3.1 2.8 2.4 Other Services 10.0 10.0 9.9 10.0 10.2 10.3 10.4 10.5 10.6 10.7 10.7 10.8 10.8 Pct Chg Year Ago 9.6 10.7 6.4 2.2 2.2 3.2 4.7 4.6 3.9 3.4 3.0 2.4 2.1 Federal Government 0.7 0.7 0.7 0.7 0.7 0.7 0.7 0.7 0.7 0.7 0.7 0.7 0.7 Pct Chg Year Ago -6.2 -6.6 -2.1 4.5 2.1 0.1 -1.7 -0.7 0.7 1.8 3.0 3.7 3.7 State & Local Government 12.5 12.6 12.7 12.7 12.8 12.8 12.8 12.8 12.9 12.9 13.0 13.0 13.1 Pct Chg Year Ago 0.3 2.0 3.5 2.8 1.7 1.1 0.6 0.8 0.9 1.2 1.5 1.4 1.5 Other Economic Indicators Population (Ths) 395.9 397.0 398.1 399.4 400.6 401.9 403.2 404.5 405.6 406.6 407.7 408.7 409.9 Pct Chg Year Ago 1.6 1.4 1.2 1.1 1.2 1.2 1.3 1.3 1.3 1.2 1.1 1.0 1.0 Labor Force (Ths) 189.7 190.7 191.5 191.9 192.0 192.1 192.1 192.4 192.6 192.9 193.3 193.8 194.2 Pct Chg Year Ago 3.6 3.8 3.3 1.9 1.3 0.7 0.3 0.2 0.3 0.4 0.6 0.7 0.8 Unemployment Rate (%) 2.6 3.2 3.9 4.7 5.2 5.5 5.5 5.5 5.5 5.4 5.3 5.2 5.1 Total Housing Starts 4588.5 4237.9 4066.2 4082.6 4151.6 4390.9 4632.1 4863.2 5114.1 5271.9 5399.3 5436.7 5504.7 Single-Family 3070.9 2749.3 2614.4 2679.8 2720.2 2815.4 2947.0 3014.9 3112.6 3134.5 3146.8 3122.6 3132.0 Multifamily 1517.6 1488.7 1451.8 1402.8 1431.4 1575.5 1685.0 1848.3 2001.5 2137.4 2252.5 2314.1 2372.7
PROFILES
The North Port-Sarasota-Bradenton is located in Sarasota County in the southwest segment of the state. North Port Encompasses fourteen miles of interstate 1-75 within its boundaries and it has two international airports within 45 minutes.
QUICK FACTS
• Metro population estimate of 803,709 as of 2019 (5-Year Estimate) (U.S. Census Bureau).
• Sarasota County population estimate of 384,213 as of 2019 (5-Year Estimate) (U.S. Census Bureau).
• Manatee County population estimate of 419,496 as of 2019 (5-Year Estimate) (U.S. Census Bureau).
• Civilian labor force of 393,846 in November 2022 (Florida Research and Economic Database).
• An unemployment rate of 2.6% as of November 2022, not seasonally adjusted. This amounts to 10,201 unemployed people (Florida Research and Economic Database).
OUTLOOK SUMMARIES
The North Port area is expected to show average levels of growth in the economic indicators. Personal income is expected to grow an average of 4.6 percent annually, ranking 12th of the 25 MSA’s studied. The average real per capita income level of $56,200 is the 6th highest in the state. Average annual wage growth will be 2.8 percent, the 4th lowest in the state; however, the average real annual wage level is expected to be $66,400. North Port is expected to average a population growth of 1.4 percent each year. The area has one of the highest Gross Metro Product of the MSAs studied at an average level of $37,136.99 million.
Employment is expected to contract at an average rate of -0.4 percent each year while unemployment is expected to be moderate at an average rate of 5.1 percent.
North Port’s fastest growing sector is expected to be
the Other Services sector, which will experience 2.6 percent average annual growth, followed by the Federal Government sector which will grow at an average of 2.3 percent annually.
METRO NEWS SUMMARIES
Nearly 200 acres of Old Miakka land to be preserved as developments push East in Sarasota County
• In Sarasota County, the rural way of life is gradually vanishing as urbanization moves further east. Now, in Old Miakka, over 200 acres of land will be preserved perminantly. The Crowley Museum and Nature Center are situated on this land.
• As an immersive and interactive learning experience in Florida’s natural and cultural heritage, the museum and nature center offer a variety of exhibits.
• The local ecology and watershed depend heavily on the land. The site has a range of distinct natural habitats and species, according to Nicole Rissler, director of parks, recreation, and natural resources for Sarasota County.
Source: FOX 13 News, September 7, 2022
Manatee reports more than $14.9M in damage from Hurricane Ian
• According to early reports, Hurricane Ian damaged residential properties to the tune of more than $10.5 million and commercial buildings to the tune of more than $4.4 million.
• Manatee County Administrator Scott Hopes cautioned that the amounts are very preliminary and are expected to rise.
• Manatee County had 95 intersections that had signals that were either damaged or without power and Manatee County’s 311 line received 9,000 calls on Thursday.
Source: Your Observer, September 30, 2022
N ORTH P ORT - S ARASOTA - B RADENTON 80 Florida & Metro Forecast / Winter 2023
HCA Florida has purchased 22 acres for a new hospital in Manatee County
• The six-story hospital will feature 125,000 square feet of physician offices in addition to an emergency room, acute treatment center, and at least 150 beds.
• The hospital will be a component of a medical district envisioned for Neal Land & Neighborhoods’ North River Ranch development near Parrish, the land developers said.
• Gainesville, Jacksonville, and Orange Park hospitals were redesigned by the firm earlier this year to reflect the HCA brand. HCA announced in December that it would construct hospitals in Fort Myers, The Villages, and Gainesville.
Source: WUSF, October 25, 2022
Sarasota County Commissioners unanimously approve 5,000-home development in Lakewood Ranch
• Following the unanimous approval by the Sarasota County Commission, up to 5,000 houses will be constructed on land on more than 4,100 acres east of I-75 between University Parkway and Fruitville Road in Eastern Sarasota County.
• Many locals are making a significant effort to attempt and halt the construction as they hope they can keep the country, country.
• Despite objections from the public, the Sarasota County Commissioners unanimously authorized it saying there is a need for this housing.
Source: WWSB, October 26, 2022
TDC recommends $950,000 for water taxi
• On November 4, the Manatee County Tourist Development Council (TDC) overwhelmingly decided to urge the county commissioners to designate up to $950,000 in resort tax income to assist in funding a water taxi venture.
• It is intended for the water taxi service to travel from its primary stop immediately east of the Green Bridge, to the City Pier in Anna Maria, then travel south to the Bridge Street Pier in Bradenton Beach, and lastly arrive at the South Coquina Boat Launch.
• The service will run from 10:30 a.m. until 9:30 p.m. Friday through Sunday.
Source: AMI Sun, November 14, 2022
Sarasota County sets new record with ‘bed tax’ revenue
• For the most recent fiscal year, which ran from October 2021 to September 2022, the county’s bed tax revenue (collected on short-term rentals of six months or less) reached a record high of more than $40 million ($40,273,993.36).
• According to county officials, that figure represents an increase of 30% or almost $9 million. More than 3 million visitors, they claimed, paid for lodging while visiting the county for leisure or business.
• The bed tax keeps residents from needing to contribute to the upkeep of the county’s 16 beaches and other significant assets like portions of bonds, debt payments, and contracts.
Source: WTSP, November 25, 2022
N ORTH P ORT - S ARASOTA - B RADENTON Institute for Economic Forecasting 81
North Port-Sarasota-Bradenton MSA Industry Loca�on Quo�ents
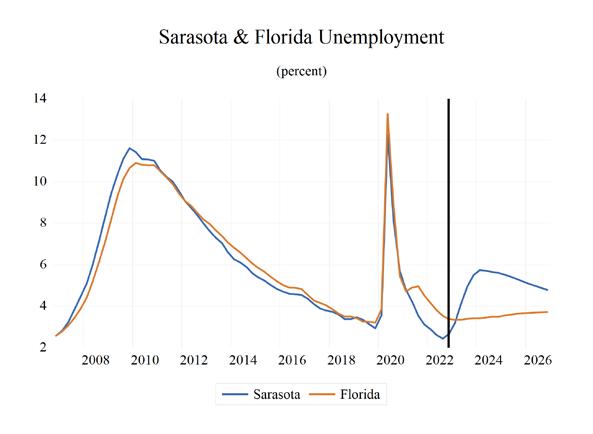
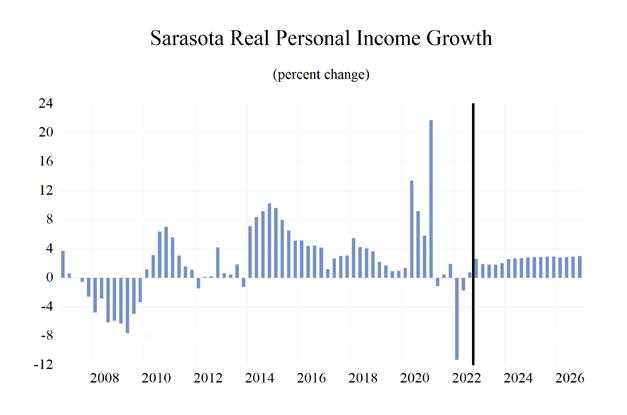

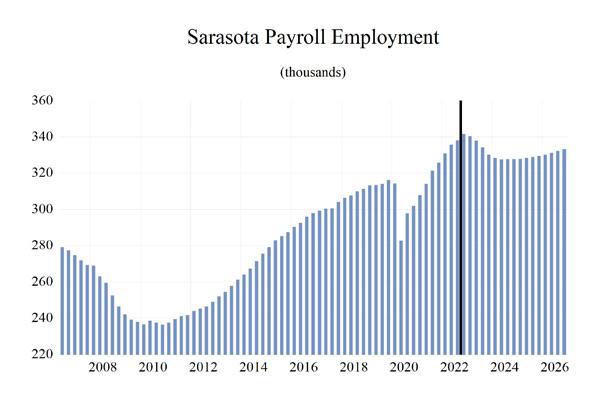
N ORTH P ORT - S ARASOTA - B RADENTON 82 Florida & Metro Forecast / Winter 2023 0 0.2 0.4 0.6 0.8 1 1.2 1.4 1.6 Total Nonagricultural Employment Total Private Goods Producing Service Producing Private Service Providing Mining Logging and Construc�on Manufacturing Trade, Transporta�on, and U�li�es Wholesale Trade Retail Trade Transporta�on, Warehousing and U�li�es Informa�on Financial Ac�vi�es Professional and Business Services Educa�onal and Health Services Leisure and Hospitality Other Services Government
Long-Term Outlook for North Port-Sarasota-Bradenton, FL December 2022 Forecast
N ORTH P ORT - S ARASOTA - B RADENTON Institute for Economic Forecasting 83
2018 2019 2020 2021 2022 2023 2024 2025 2026 Personal Income (Billions $) Total Personal Income 47.7 52.1 55.0 59.7 60.9 63.4 66.1 69.6 72.9 Pct Chg Year Ago 6.1 9.2 5.7 8.5 2.2 4.0 4.2 5.4 4.7 Wages and Salaries 15.2 15.9 16.4 18.7 21.0 21.4 21.6 22.2 23.1 Nonwage Income 32.4 36.1 38.6 41.0 40.0 42.0 44.5 47.4 49.8 Real Personal Income (12$) 43.3 47.3 49.2 51.2 49.2 49.5 50.5 52.1 53.5 Pct Chg Year Ago 5.8 9.3 3.9 4.0 -3.9 0.7 1.9 3.2 2.7 Per Capita Income (Ths) 59.0 63.2 65.5 69.2 69.2 70.7 72.7 75.6 78.2 Real Per Capita Income (12$) 53.6 57.5 58.6 59.4 55.8 55.2 55.6 56.6 57.4 Average Annual Wage (Ths) 49.1 50.4 54.5 58.5 62.0 63.4 65.5 67.4 69.3 Pct Chg Year Ago 4.5 2.6 8.1 7.4 5.9 2.2 3.4 2.8 2.9 Establishment Employment (Place of Work, Thousands, SA) Total Employment 308.9 314.3 299.2 317.3 336.6 335.8 327.9 328.8 331.8 Pct Chg Year Ago 2.6 1.7 -4.8 6.0 6.1 -0.2 -2.3 0.3 0.9 Manufacturing 16.8 17.1 16.3 17.7 18.6 17.8 16.4 16.0 16.0 Pct Chg Year Ago 1.0 2.1 -4.5 8.1 5.4 -4.4 -7.8 -2.3 -0.1 Nonmanufacturing 292.1 297.2 282.9 299.7 318.0 318.0 311.5 312.7 315.8 Pct Chg Year Ago 2.7 1.7 -4.8 5.9 6.1 0.0 -2.0 0.4 1.0 Construction & Mining 25.4 26.4 26.4 27.3 28.4 28.4 27.4 27.2 27.4 Pct Chg Year Ago 8.1 4.2 -0.1 3.3 4.3 0.0 -3.6 -0.6 0.6 Trade, Trans, & Utilities 59.5 60.0 58.0 61.2 63.2 61.6 60.1 60.4 61.1 Pct Chg Year Ago 3.6 0.9 -3.4 5.6 3.2 -2.5 -2.4 0.5 1.1 Wholesale Trade 8.7 8.9 8.4 9.1 9.5 9.6 10.0 10.2 10.4 Retail Trade 44.9 44.6 42.7 44.5 45.8 43.8 41.7 41.6 41.9 Trans, Wrhsng, & Util 6.0 6.5 6.8 7.6 7.9 8.2 8.4 8.6 8.8 Information 3.4 3.5 3.3 3.4 3.5 3.5 3.6 3.7 3.7 Pct Chg Year Ago -1.0 1.7 -5.1 1.7 4.7 0.5 0.6 3.2 1.0 Financial Activities 14.8 15.4 15.6 16.5 16.7 16.9 17.4 17.7 17.9 Pct Chg Year Ago -0.5 3.9 1.5 5.3 1.2 1.2 3.1 1.9 1.2 Prof & Business Services 47.4 46.2 42.9 48.7 50.9 47.9 43.3 44.1 46.4 Pct Chg Year Ago 0.3 -2.5 -7.2 13.5 4.6 -6.0 -9.6 2.0 5.1 Educ & Health Services 54.5 56.3 55.2 56.2 60.9 63.3 64.3 63.6 63.2 Pct Chg Year Ago 3.0 3.2 -1.9 1.9 8.3 4.0 1.5 -1.0 -0.7 Leisure & Hospitality 44.9 46.1 39.0 43.1 48.5 49.7 48.0 48.0 48.0 Pct Chg Year Ago 1.1 2.7 -15.4 10.4 12.5 2.6 -3.4 0.0 0.0 Other Services 14.2 14.8 14.1 14.5 15.3 16.0 16.6 16.8 17.0 Pct Chg Year Ago 6.9 3.9 -4.8 3.1 5.3 4.6 3.7 1.5 0.6 Federal Government 2.0 2.0 2.1 2.0 2.0 2.0 2.0 2.1 2.2 Pct Chg Year Ago 0.0 0.8 4.4 -4.9 0.0 -1.1 3.5 3.4 3.3 State & Local Government 26.0 26.5 26.4 26.9 28.6 28.7 28.8 29.0 28.9 Pct Chg Year Ago 2.2 1.7 -0.4 1.9 6.5 0.4 0.3 0.4 0.0 Other Economic Indicators Population (Ths) 807.7 823.1 840.2 861.7 881.0 896.8 908.7 920.5 931.7 Pct Chg Year Ago 1.7 1.9 2.1 2.6 2.2 1.8 1.3 1.3 1.2 Labor Force (Ths) 362.4 366.4 359.8 373.5 391.1 403.5 404.5 404.3 405.0 Percent Change, Year Ago 1.6 1.1 -1.8 3.8 4.7 3.2 0.2 0.0 0.2 Unemployment Rate (%) 3.5 3.2 7.4 3.9 2.7 4.4 5.7 5.4 4.9 Total Housing Starts 9654.8 9233.2 9693.9 13876.6 14187.7 8177.4 8404.3 9129.4 8868.4 Single-Family 6227.8 6663.8 8107.8 11582.1 10804.8 6458.8 6895.2 7291.8 6923.0 Multifamily 3427.0 2569.4 1586.1 2294.5 3382.9 1718.6 1509.1 1837.6 1945.4
Short-Term Outlook for North Port-Sarasota-Bradenton, FL December 2022 Forecast
N ORTH P ORT - S ARASOTA - B RADENTON 84 Florida & Metro Forecast / Winter 2023
2022:4 2023:1 2023:2 2023:3 2023:4 2024:1 2024:2 2024:3 2024:4 2025:1 2025:2 2025:3 2025:4 Personal Income (Billions $) Total Personal Income 62.1 62.9 63.1 63.5 64.1 64.8 65.7 66.5 67.3 68.4 69.2 70.1 70.9 Pct Chg Year Ago 5.2 5.9 3.9 3.3 3.1 3.0 4.1 4.7 5.1 5.4 5.5 5.4 5.3 Wages and Salaries 21.4 21.4 21.4 21.4 21.3 21.4 21.5 21.7 21.8 22.0 22.1 22.3 22.5 Nonwage Income 40.8 41.6 41.7 42.2 42.8 43.5 44.2 44.8 45.5 46.4 47.1 47.7 48.3 Real Personal Income (12$) 49.3 49.6 49.5 49.5 49.6 49.9 50.3 50.7 51.0 51.5 51.9 52.3 52.7 Pct Chg Year Ago -0.5 1.3 0.7 0.4 0.6 0.7 1.7 2.4 2.8 3.2 3.2 3.2 3.2 Per Capita Income (Ths) 70.0 70.6 70.5 70.7 71.0 71.7 72.4 73.1 73.7 74.6 75.3 76.0 76.6 Real Per Capita Income (12$) 55.5 55.6 55.2 55.1 55.0 55.2 55.5 55.7 55.9 56.2 56.5 56.7 56.9 Average Annual Wage (Ths) 62.3 62.5 63.1 63.7 64.2 64.8 65.3 65.8 66.3 66.7 67.1 67.6 68.0 Pct Chg Year Ago 1.8 1.7 1.7 2.3 2.9 3.6 3.5 3.3 3.3 3.0 2.8 2.7 2.7 Establishment Employment (Place of Work, Thousands, SA) Total Employment 341.6 340.5 338.0 334.2 330.3 328.4 327.7 327.7 327.8 327.9 328.4 329.0 329.7 Pct Chg Year Ago 4.8 2.9 0.7 -1.2 -3.3 -3.6 -3.0 -1.9 -0.8 -0.1 0.2 0.4 0.6 Manufacturing 18.7 18.4 18.1 17.6 17.1 16.7 16.5 16.3 16.2 16.1 16.1 16.0 16.0 Pct Chg Year Ago 2.4 -0.7 -2.8 -5.6 -8.5 -9.1 -8.9 -7.6 -5.4 -3.7 -2.8 -1.8 -1.1 Nonmanufacturing 322.9 322.2 319.9 316.6 313.3 311.7 311.2 311.4 311.6 311.9 312.4 313.0 313.7 Pct Chg Year Ago 5.0 3.1 0.9 -0.9 -3.0 -3.3 -2.7 -1.6 -0.5 0.1 0.4 0.5 0.7 Construction & Mining 29.3 29.1 28.6 28.2 27.8 27.6 27.4 27.4 27.3 27.2 27.3 27.2 27.2 Pct Chg Year Ago 5.5 4.9 2.7 -2.3 -5.1 -5.2 -4.4 -3.0 -1.6 -1.2 -0.5 -0.4 -0.3 Trade, Trans, & Utilities 63.0 62.4 62.2 61.0 60.7 60.3 60.0 60.1 60.1 60.2 60.3 60.6 60.7 Pct Chg Year Ago 1.3 -1.5 -2.1 -2.9 -3.7 -3.3 -3.7 -1.5 -0.9 -0.3 0.6 0.8 0.9 Wholesale Trade 9.5 9.6 9.5 9.6 9.7 9.9 9.9 10.0 10.1 10.1 10.2 10.2 10.3 Retail Trade 45.4 44.7 44.5 43.2 42.6 42.1 41.6 41.6 41.6 41.5 41.6 41.7 41.7 Trans, Wrhsng, & Util 8.1 8.1 8.2 8.2 8.3 8.4 8.4 8.4 8.5 8.5 8.6 8.6 8.7 Information 3.6 3.6 3.5 3.5 3.5 3.5 3.5 3.6 3.6 3.6 3.7 3.7 3.7 Pct Chg Year Ago 0.4 1.4 1.7 0.5 -1.4 -1.2 0.0 0.9 2.7 3.4 3.1 3.4 2.9 Financial Activities 16.9 16.9 16.7 16.8 17.0 17.2 17.3 17.4 17.5 17.6 17.7 17.7 17.7 Pct Chg Year Ago 1.5 1.5 2.1 0.6 0.6 1.7 3.6 3.7 3.3 2.8 2.1 1.5 1.2 Prof & Business Services 51.1 50.9 49.1 46.8 44.7 43.6 43.2 43.1 43.2 43.5 43.9 44.3 44.9 Pct Chg Year Ago 0.7 -0.3 -3.2 -8.0 -12.6 -14.4 -12.0 -7.8 -3.3 -0.2 1.5 2.9 3.9 Educ & Health Services 62.5 62.7 63.0 63.7 63.8 64.2 64.4 64.4 64.1 63.9 63.7 63.5 63.4 Pct Chg Year Ago 9.0 6.2 4.3 3.3 2.2 2.4 2.3 1.1 0.4 -0.4 -1.1 -1.3 -1.1 Leisure & Hospitality 50.3 50.2 50.2 49.8 48.7 48.1 48.0 48.0 48.1 48.0 48.0 48.0 48.1 Pct Chg Year Ago 12.5 10.2 2.3 1.5 -3.0 -4.2 -4.3 -3.6 -1.4 -0.2 0.1 0.1 -0.1 Other Services 15.7 15.8 15.8 16.0 16.3 16.4 16.6 16.6 16.7 16.8 16.8 16.9 16.9 Pct Chg Year Ago 8.1 7.2 5.0 3.1 3.5 4.0 4.5 3.8 2.7 2.2 1.7 1.3 1.0 Federal Government 1.9 2.0 2.0 2.0 2.0 2.0 2.0 2.1 2.1 2.1 2.1 2.1 2.1 Pct Chg Year Ago -2.4 -5.8 -3.5 2.4 2.8 3.4 3.6 3.6 3.5 3.5 3.5 3.4 3.4 State & Local Government 28.7 28.7 28.7 28.7 28.8 28.8 28.8 28.8 28.9 28.9 28.9 29.0 29.0 Pct Chg Year Ago 1.5 -0.1 0.7 0.7 0.4 0.3 0.2 0.3 0.2 0.4 0.5 0.4 0.4 Other Economic Indicators Population (Ths) 887.6 891.7 895.3 898.6 901.5 904.4 907.2 910.1 913.1 916.1 919.0 922.0 924.7 Pct Chg Year Ago 2.1 2.0 1.9 1.7 1.6 1.4 1.3 1.3 1.3 1.3 1.3 1.3 1.3 Labor Force (Ths) 397.0 399.9 403.6 405.2 405.4 404.9 404.5 404.3 404.2 404.1 404.2 404.5 404.5 Pct Chg Year Ago 4.5 4.1 3.6 2.9 2.1 1.3 0.2 -0.2 -0.3 -0.2 -0.1 0.1 0.1 Unemployment Rate (%) 2.7 3.2 4.1 4.9 5.5 5.7 5.7 5.6 5.6 5.5 5.4 5.3 5.2 Total Housing Starts 10058.5 9115.1 8164.9 7779.6 7649.8 7848.3 8171.2 8578.6 9019.0 9178.3 9204.5 9097.5 9037.3 Single-Family 7827.0 7039.6 6376.7 6192.7 6226.1 6421.1 6740.3 7058.4 7361.0 7416.3 7370.9 7225.1 7154.9 Multifamily 2231.5 2075.5 1788.2 1587.0 1423.6 1427.3 1430.8 1520.2 1658.0 1762.0 1833.6 1872.4 1882.4
PROFILES
Comprised of Marion County only, the Ocala MSA is located northwest of the Orlando area and is in the center of the state. The second largest national forest in Florida, the Ocala National Forest, and Silver Springs are two main outdoor attractions in the area.
QUICK FACTS
• Metro population estimate of 353,526 as of 2019 (5-Year Estimate) (U.S. Census Bureau).
• Marion County population estimate of 365,579 as of 2019 (5-Year Estimate) (U.S. Census Bureau).
• Civilian labor force of 144,970 in November 2022 (Florida Research and Economic Database).
• An unemployment rate of 3.2% as of November 2022, not seasonally adjusted. This amounts to 4,680 unemployed people (Florida Research and Economic Database).
OUTLOOK SUMMARIES
The Ocala Metropolitan Statistical Area (MSA) is expected to show weak levels of growth in its economic indicators. Ocala’s Gross Metro Product is $10,786.32. Average annual wage growth of 3.4 percent will lead to an average annual wage of $58,000, among the lowest in the state. Personal incomes will grow by 5.2 percent, the 5th highest in the state. This will lead to a per capita income level of $40,700, the 3rd lowest in the state. Population growth will average 1.4 percent. Employment growth is expected to average a rate of 0.4 percent annually. The unemployment rate is estimated to average 6.2 percent.
The Other Services sector will lead Ocala at an average annual growth rate of 5.1 percent. The Education & Health Services sector and the Financial Services sector will expand at rates of 3.0 percent and 2.7 percent respectively.
METRO NEWS SUMMARIES
City of Ocala receives $500,000 grant from EPA
• The U.S. Environmental Protection Agency (EPA) has selected the City of Ocala to receive a Brownfield Environmental Assessment grant in the amount of $500,000.
• The grant is intended to be used to conduct outreach, Phase I and Phase II environmental assessments, and cleanup planning. According to the EPA, a brownfield is a property, the expansion, redevelopment, or reuse of which may be complicated by the presence or potential presence of a hazardous substance, pollutant, or contaminant.
• The EPA stated the Brownfields Program targets communities that are economically disadvantaged, and it provides funding and assistance to transform blighted sites into assets that can generate jobs and spur economic growth. “Brownfields investments provide critical funding to empower communities to address and reverse the effects of economic stress, particularly in areas that have experienced disinvestment and decay,” said EPA Region 4 Administrator Daniel Blackman.
Source: Ocala-News, October 20, 2022
Ocala manufacturing plant expands production capacity, adds jobs
• The construction of an expanded manufacturing plant in Ocala could add as many as 70 jobs to the area. The expansion is set to be completed in March. The new jobs will be in the fields of quality assurance and metal working among other fields.
• Champion Manufacturing, a medical device company, is preparing to expand its facility by 54,000 square feet. It will also double the number of production lines at the facility from three to six.
O CALA Institute for Economic Forecasting 85
• Pete Lee, City Manager for City of Ocala, said “the City of Ocala’s investment, through its Economic Investment Program, is made more rewarding because this company is already an important part of our community. The significant capital investment and the jobs created and retained through Champion’s investment are vital to Ocala’s continued economic success.”
Source: WCJB 20, October 26, 2022
Donations, a ribbon cutting and more: Good news in Ocala/Marion County
• Champion Manufacturing LLC held a ceremonial groundbreaking and ribbon cutting event on Oct. 22 to mark the ongoing construction of a 54,000-square-foot expansion to the company’s current Ocala facility, 5516 SW First Lane, according to a press release from Champion Manufacturing.
• The building addition will allow Champion to grow its employee base by 45% (70 new positions) and increase production capacity (going from three production lines to six) of its hand-crafted chairs, the release said.
• Approximately 150 employees and family members were on site for the ceremony. Also there were local dignitaries and the Ocala Metro Chamber & Economic Partnership (CEP) President and CEO Kevin Sheilley and Director of Job Creation Bart Rowland.
Source: Ocala StarBanner, November 6, 2022
Military service, professional honors and more: Good news for Ocala/Marion County
• A team of Ocala PNC Bank employees presented a check for $3,000 to the Friends of the Ocala Public Library recently to help support the Marion County Public Library System’s educational programs for children and families, according to a press release from Marion County Public Relations.
• The College of Central Florida’s Wilton Simpson Citrus Campus Associate Degree Nursing program has been recognized as the 2023 Best RN Program in Florida by RegisteredNursing. org. The nursing advocacy organization evaluated nearly 150 RN programs and ranked the top 20 based on the percentage of graduates who pass the national licensure exam.
• HCA Florida Ocala Hospital and HCA Florida West Marion Hospital both received an “A” Hospital Safety Grade from The Leapfrog Group, an independent national watchdog organization, according to a press release from HCA Florida. This national distinction celebrates the hospitals’ achievements in protecting hospital patients from preventable harm and errors.
Source: Ocala StarBanner, November 19, 2022
Region’s pre-holiday unemployment rate holds steady at 3.4%
• The unemployment rate in the CareerSource Citrus Levy Marion region continued to hold steady at 3.4% in November, which is unchanged over the last two months and 0.4 percentage points lower than the region’s rate from a year ago.
• Across the three-county region, the labor force in November was 209,324, an increase of 3,348 workers (+1.7%) over the year, including a total of 7,094 unemployed residents in the region in November, which is 36 lower than the previous month and 765 fewer than in November 2021.
• Rusty Skinner, CareerSource CLM’s chief executive officer, stated that the preliminary data may point to a tightening labor market as the region continues its post-pandemic economic recovery. “The reality is, today we have more people employed in our region than we did before Covid hit,” said Skinner, noting that the number of employed residents is 16,000 higher than five years ago. “We really don’t see a lot of involuntary unemployment right now.”
Source: Ocala-News, December 16, 2022
O CALA 86 Florida & Metro Forecast / Winter 2023
Ocala MSA Industry Location Quotients
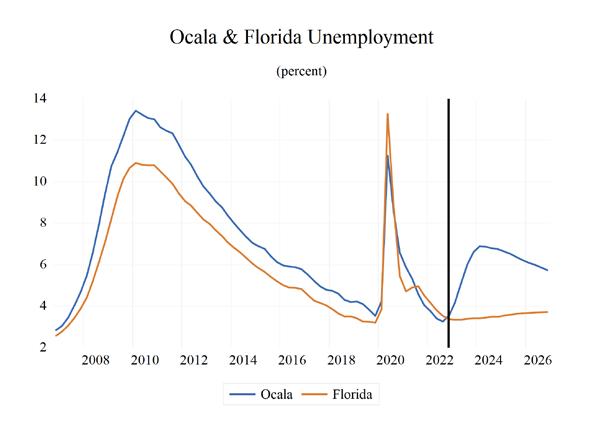
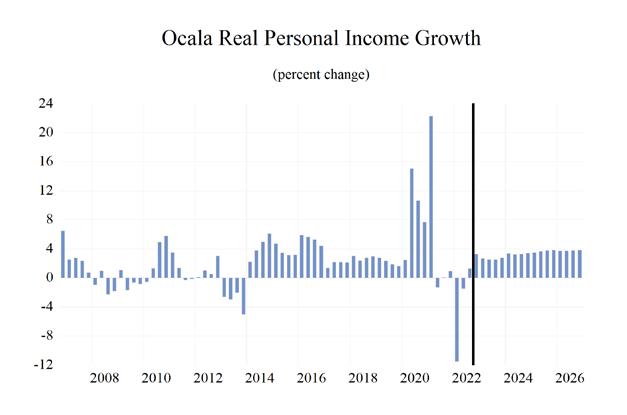
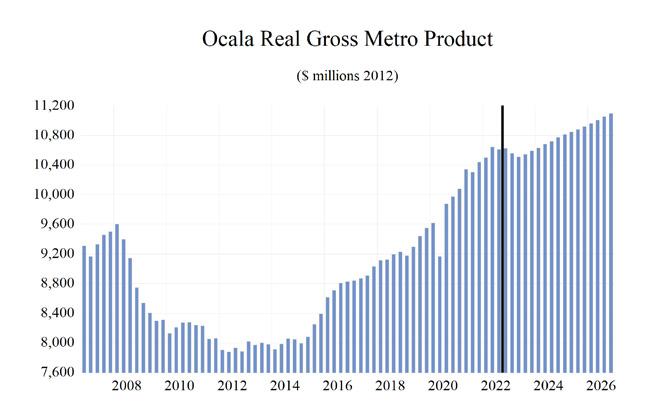
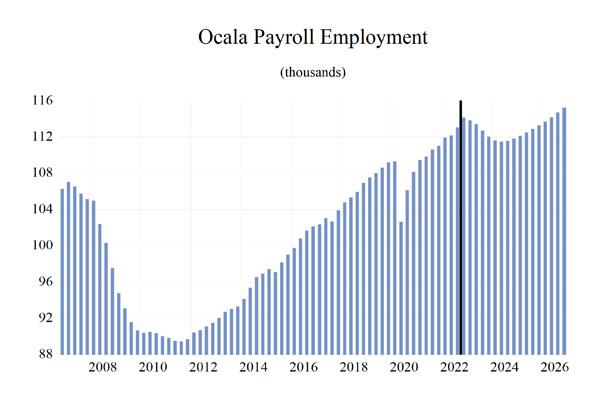
O CALA Institute for Economic Forecasting 87 0 0.5 1 1.5 2 2.5 Total Nonagricultural Employment Total Private Goods Producing Service Producing Private Service Providing Mining, Logging, and Construction Manufacturing Trade, Transportation, and Utilities Wholesale Trade Retail Trade Transportation, Warehousing and Utilities Information Financial Activities Professional and Business Services Educational and Health Services Leisure and Hospitality Other Services Government
Long-Term Outlook for Ocala, FL December 2022 Forecast
O CALA 88 Florida & Metro Forecast / Winter 2023
2018 2019 2020 2021 2022 2023 2024 2025 2026 Personal Income (Billions $) Total Personal Income 13.5 14.5 15.8 17.4 17.9 18.8 19.7 20.8 22.0 Pct Chg Year Ago 4.5 7.5 9.4 10.0 2.8 4.9 4.9 5.7 5.4 Wages and Salaries 4.5 4.8 5.0 5.6 6.1 6.2 6.4 6.7 7.0 Nonwage Income 9.0 9.7 10.8 11.8 11.8 12.6 13.3 14.2 14.9 Real Personal Income (12$) 13.3 14.1 15.3 16.2 15.7 15.9 16.3 16.9 17.5 Pct Chg Year Ago 4.2 6.4 8.5 5.5 -3.3 1.6 2.6 3.6 3.4 Per Capita Income (Ths) 37.1 39.1 41.8 45.1 45.5 46.9 48.4 50.6 52.7 Real Per Capita Income (12$) 36.6 38.2 40.6 41.9 39.8 39.7 40.1 41.0 41.9 Average Annual Wage (Ths) 42.3 43.7 46.7 50.3 53.6 54.7 57.0 59.0 61.2 Pct Chg Year Ago 2.8 3.3 7.0 7.8 6.4 2.1 4.3 3.5 3.7 Establishment Employment (Place of Work, Thousands, SA) Total Employment 105.8 108.3 106.6 110.2 112.8 113.0 111.6 112.7 114.4 Pct Chg Year Ago 2.7 2.5 -1.7 3.4 2.4 0.2 -1.2 1.0 1.6 Manufacturing 8.6 9.3 9.5 9.9 9.9 9.7 9.0 8.9 9.1 Pct Chg Year Ago 5.4 7.8 2.3 4.8 -0.1 -2.2 -7.5 -0.6 2.3 Nonmanufacturing 97.2 99.1 97.1 100.3 102.9 103.3 102.7 103.8 105.3 Pct Chg Year Ago 2.5 2.0 -2.0 3.3 2.6 0.4 -0.6 1.1 1.5 Construction & Mining 7.8 8.5 8.7 8.9 9.2 9.1 8.6 8.3 8.3 Pct Chg Year Ago 8.1 7.9 2.2 3.0 3.1 -1.3 -5.5 -2.7 -0.8 Trade, Trans, & Utilities 25.4 26.1 26.2 27.8 28.6 28.0 27.4 27.5 27.8 Pct Chg Year Ago 2.7 2.7 0.8 5.8 3.0 -2.1 -2.0 0.3 1.0 Wholesale Trade 3.9 4.2 4.1 4.2 4.3 4.5 4.5 4.6 4.7 Retail Trade 16.8 16.7 16.5 17.5 17.9 17.0 16.2 16.1 16.1 Trans, Wrhsng, & Util 4.7 5.2 5.6 6.1 6.4 6.5 6.7 6.9 7.0 Information 0.8 0.6 0.5 0.5 0.6 0.6 0.6 0.6 0.6 Pct Chg Year Ago -5.2 -17.5 -17.1 4.5 9.6 -2.5 -0.7 1.1 -0.6 Financial Activities 3.9 3.9 3.9 4.0 4.1 4.4 4.5 4.6 4.6 Pct Chg Year Ago 0.7 0.6 -1.5 3.9 3.1 5.6 2.7 1.5 1.1 Prof & Business Services 9.5 9.5 9.8 10.6 10.6 10.0 9.4 9.7 10.1 Pct Chg Year Ago 5.3 0.0 3.6 7.3 0.1 -5.1 -6.7 3.4 3.8 Educ & Health Services 18.8 18.8 18.4 18.3 18.8 19.9 20.7 20.9 21.2 Pct Chg Year Ago 1.7 0.1 -2.5 -0.1 2.6 5.7 4.0 0.9 1.6 Leisure & Hospitality 13.1 13.5 11.7 12.5 13.4 13.2 13.1 13.4 13.7 Pct Chg Year Ago 2.1 2.6 -13.5 7.2 6.8 -1.0 -1.1 2.7 2.3 Other Services 2.9 3.0 2.9 2.9 3.1 3.3 3.5 3.6 3.8 Pct Chg Year Ago -2.5 1.4 -3.1 2.9 4.8 5.8 6.4 4.6 3.4 Federal Government 0.7 0.7 0.9 0.8 0.8 0.8 0.7 0.8 0.8 Pct Chg Year Ago 0.0 3.5 18.3 -6.1 -3.0 -2.2 -1.9 1.8 2.7 State & Local Government 14.2 14.5 14.2 13.9 13.8 14.1 14.3 14.4 14.6 Pct Chg Year Ago 0.7 2.2 -2.2 -2.2 -0.9 2.4 1.1 1.2 1.1 Other Economic Indicators Population (Ths) 363.1 370.2 378.5 386.7 393.7 400.9 407.1 412.0 416.7 Pct Chg Year Ago 1.7 2.0 2.2 2.2 1.8 1.8 1.6 1.2 1.2 Labor Force (Ths) 134.7 138.0 139.0 141.9 143.7 146.1 146.2 146.3 146.7 Percent Change, Year Ago 1.4 2.4 0.7 2.1 1.3 1.6 0.1 0.1 0.3 Unemployment Rate (%) 4.5 3.9 7.7 5.0 3.5 5.5 6.8 6.4 5.9 Total Housing Starts 2643.5 2409.5 3616.7 5736.6 6483.4 4100.3 3353.8 3431.6 3402.2 Single-Family 2597.4 2398.3 3600.1 5458.4 5230.6 3537.5 3165.5 3221.2 3168.0 Multifamily 46.1 11.2 16.6 278.2 1252.8 562.8 188.2 210.4 234.2
Short-Term Outlook for Ocala, FL
O CALA Institute for Economic Forecasting 89
2022:4 2023:1 2023:2 2023:3 2023:4 2024:1 2024:2 2024:3 2024:4 2025:1 2025:2 2025:3 2025:4 Personal Income (Billions $) Total Personal Income 18.3 18.6 18.7 18.9 19.1 19.3 19.5 19.8 20.1 20.4 20.7 21.0 21.3 Pct Chg Year Ago 5.9 6.1 5.0 4.7 4.0 4.1 4.6 5.2 5.6 5.6 5.9 5.8 5.6 Wages and Salaries 6.2 6.2 6.2 6.2 6.3 6.3 6.4 6.4 6.5 6.6 6.6 6.7 6.8 Nonwage Income 12.2 12.4 12.5 12.7 12.8 13.0 13.2 13.4 13.6 13.8 14.1 14.3 14.5 Real Personal Income (12$) 15.8 15.8 15.9 15.9 16.0 16.1 16.2 16.4 16.5 16.7 16.8 17.0 17.1 Pct Chg Year Ago 0.2 1.4 1.7 1.8 1.6 1.8 2.3 2.9 3.3 3.4 3.7 3.6 3.6 Per Capita Income (Ths) 46.2 46.7 46.7 47.0 47.3 47.7 48.1 48.7 49.2 49.7 50.3 50.9 51.4 Real Per Capita Income (12$) 39.8 39.8 39.7 39.7 39.7 39.8 39.9 40.2 40.4 40.6 40.9 41.2 41.4 Average Annual Wage (Ths) 53.8 53.9 54.3 54.9 55.5 56.2 56.7 57.3 57.8 58.3 58.7 59.2 59.8 Pct Chg Year Ago 2.3 1.6 1.3 2.2 3.2 4.1 4.4 4.4 4.1 3.8 3.6 3.3 3.4 Establishment Employment (Place of Work, Thousands, SA) Total Employment 114.1 113.8 113.4 112.7 112.0 111.6 111.5 111.6 111.8 112.1 112.5 112.9 113.3 Pct Chg Year Ago 2.8 1.7 1.1 -0.3 -1.9 -2.0 -1.7 -1.0 -0.2 0.5 0.9 1.2 1.3 Manufacturing 10.0 9.9 9.9 9.6 9.3 9.1 9.0 8.9 8.9 8.9 8.9 8.9 9.0 Pct Chg Year Ago 0.0 0.2 0.2 -2.3 -6.6 -8.2 -9.1 -7.6 -4.9 -2.6 -0.9 0.3 1.1 Nonmanufacturing 104.2 103.9 103.5 103.1 102.7 102.5 102.5 102.7 103.0 103.3 103.6 104.0 104.3 Pct Chg Year Ago 3.1 1.9 1.2 -0.1 -1.4 -1.4 -1.0 -0.4 0.3 0.7 1.1 1.2 1.3 Construction & Mining 9.3 9.3 9.2 8.9 8.9 8.7 8.6 8.5 8.5 8.4 8.4 8.3 8.3 Pct Chg Year Ago 4.6 2.4 0.5 -3.0 -5.1 -6.5 -6.2 -4.9 -4.4 -3.7 -2.7 -2.3 -2.2 Trade, Trans, & Utilities 28.6 28.3 28.2 27.8 27.7 27.5 27.4 27.4 27.4 27.4 27.5 27.6 27.6 Pct Chg Year Ago 1.1 -1.7 -1.0 -2.7 -3.2 -2.6 -3.1 -1.4 -1.0 -0.5 0.3 0.7 0.8 Wholesale Trade 4.4 4.4 4.4 4.5 4.5 4.5 4.5 4.5 4.5 4.6 4.6 4.6 4.6 Retail Trade 17.8 17.4 17.3 16.8 16.6 16.4 16.1 16.1 16.1 16.0 16.0 16.1 16.1 Trans, Wrhsng, & Util 6.4 6.4 6.4 6.5 6.6 6.7 6.7 6.8 6.8 6.8 6.8 6.9 6.9 Information 0.6 0.6 0.6 0.6 0.6 0.6 0.6 0.6 0.6 0.6 0.6 0.6 0.6 Pct Chg Year Ago 0.7 -2.3 -5.2 0.3 -2.6 -1.3 0.0 -1.6 0.1 0.9 0.7 1.7 1.2 Financial Activities 4.3 4.3 4.4 4.4 4.4 4.5 4.5 4.5 4.5 4.6 4.6 4.6 4.6 Pct Chg Year Ago 4.3 6.1 7.0 5.7 3.7 2.4 2.5 3.2 2.7 2.2 1.7 1.2 1.0 Prof & Business Services 10.6 10.6 10.2 9.8 9.5 9.4 9.3 9.4 9.4 9.5 9.6 9.7 9.8 Pct Chg Year Ago 1.0 1.2 -3.8 -7.0 -10.5 -11.7 -8.6 -4.9 -0.7 1.9 3.3 4.0 4.3 Educ & Health Services 19.3 19.4 19.7 20.1 20.3 20.5 20.7 20.7 20.7 20.8 20.8 20.9 21.0 Pct Chg Year Ago 5.3 5.5 5.5 6.8 5.2 5.6 5.3 3.0 2.1 1.2 0.5 0.7 1.0 Leisure & Hospitality 13.6 13.3 13.2 13.2 13.1 13.0 13.0 13.1 13.2 13.3 13.4 13.4 13.5 Pct Chg Year Ago 8.0 3.7 -0.1 -3.7 -3.8 -2.8 -1.7 -1.0 1.0 2.6 3.0 2.8 2.3 Other Services 3.2 3.2 3.2 3.3 3.3 3.4 3.5 3.5 3.5 3.6 3.6 3.6 3.7 Pct Chg Year Ago 6.7 6.9 6.9 4.9 4.7 5.7 7.1 6.7 6.0 5.4 4.8 4.3 3.9 Federal Government 0.8 0.8 0.8 0.8 0.8 0.8 0.7 0.7 0.7 0.8 0.8 0.8 0.8 Pct Chg Year Ago -6.4 -7.3 -4.7 5.2 -1.1 -1.1 -2.9 -2.4 -1.2 0.2 1.7 2.6 2.8 State & Local Government 13.9 14.0 14.1 14.1 14.2 14.2 14.2 14.3 14.3 14.4 14.4 14.4 14.5 Pct Chg Year Ago 0.2 1.2 3.4 3.1 2.0 1.5 1.0 1.0 0.9 1.0 1.2 1.2 1.2 Other Economic Indicators Population (Ths) 396.4 398.1 400.0 401.9 403.5 405.0 406.5 407.9 409.2 410.2 411.3 412.5 413.7 Pct Chg Year Ago 1.8 1.8 1.8 1.9 1.8 1.7 1.6 1.5 1.4 1.3 1.2 1.1 1.1 Labor Force (Ths) 144.7 145.4 146.1 146.4 146.5 146.4 146.2 146.1 146.1 146.1 146.2 146.4 146.4 Pct Chg Year Ago 1.7 1.7 1.9 1.7 1.2 0.7 0.1 -0.2 -0.2 -0.1 0.0 0.2 0.2 Unemployment Rate (%) 3.5 4.2 5.1 6.0 6.6 6.9 6.9 6.8 6.8 6.6 6.5 6.4 6.2 Total Housing Starts 6374.9 5001.8 4182.0 3746.7 3470.6 3364.3 3344.6 3298.3 3407.9 3430.7 3443.9 3420.2 3431.6 Single-Family 4879.9 4041.4 3568.6 3355.1 3184.8 3143.8 3169.2 3126.6 3222.5 3233.5 3236.5 3204.0 3210.8 Multifamily 1495.0 960.4 613.5 391.6 285.8 220.5 175.4 171.7 185.4 197.2 207.4 216.2 220.8
December 2022 Forecast
PROFILES
The Orlando–Kissimmee–Sanford MSA is comprised of Lake, Orange, Osceola and Seminole Counties. Located in the southern center of the state, this area is home to numerous tourist attractions such as Walt Disney World, Universal Studios and Sea World. It is also home to the Orlando Magic and the Orlando City Soccer Club. Orlando hosts many conventions utilizing some of the biggest hotels in the country and America’s second largest convention center. The University of Central Florida, the nation’s second largest university, and many other places of higher education also reside in the MSA.
QUICK FACTS
• Metro population estimate of 2,508,970 as of 2019 (5-Year Estimate) (U.S. Census Bureau).
• Lake County population estimate of 367,118 as of 2019 (5-Year Estimate) (U.S. Census Bureau).
• Orange County population estimate of 1,393,452 as of 2019 (5-Year Estimate) (U.S. Census Bureau).
• Osceola County population estimate of 375,751 as of 2019 (5-Year Estimate) (U.S. Census Bureau).
• Seminole County population estimate of 471,826 as of 2019 (5-Year Estimate) (U.S. Census Bureau).
• Civilian labor force of 1,414,146 in November 2022 (Florida Research and Economic Database).
• An unemployment rate of 2.7% as of November 2022, not seasonally adjusted. This amounts to 38,597 unemployed people (Florida Research and Economic Database).
OUTLOOK SUMMARIES
The Orlando—Kissimmee Metropolitan Statistical Area (MSA) is expected to show mixed growth in the economic indicators studied in this forecast. The MSA’s Gross Metro Product level will be at $143,669.75,
the fourth highest in the state. Average annual wage growth of 3.1 percent will push the average annual wage level to $71,900. The per capita income level of $44,200 will be boosted by personal income growth of 4.1 percent. Population growth will be 1.6 percent.
The Orlando MSA will experience an employment growth rate of 0.1 percent annually. Orlando’s unemployment rate should average 5.5 percent.
The Other Services sector is expected to be the fastest growing sector in the area, averaging 2.8 percent growth annually. The state and local government sector will see the second-highest average annual growth rate at 2.2 percent, followed by the Education and Health Services sector at 2.0 percent.
METRO NEWS SUMMARIES
Osceola County getting more than $50M in federal money for NeoCITY development
• NeoCITY, an ambitious technological project for Osceola County, has received funds from a federal grant for $50.8 million. The money has been awarded to Building Central Florida’s Semiconductor Cluster for Broad-Based Prosperity.
• The grant was provided to help with semiconductor production at NeoCITY, and is part of the Build Back Better Regional Challenge.
• The pandemic brought 31% unemployment rates to Osceola County. The county requested aid from the EDA, citing a desire to diversify their economy away from tourism and agriculture.
Source: ClickOrlando, September 2, 2022
Orlando International Airport’s Terminal C opens for business
• Terminal C at the Orlando International Airport has finally opened up to the public. The project cost nearly $2.8 billion and is expected to increase MCO’s passenger capacity by 25% (12 million annual passengers).
O RLANDO – K ISSIMMEE – S ANFORD 90 Florida & Metro Forecast / Winter 2023
• This new terminal will be serviced by Aer Lingus, Azul, British Airways, Caribbean Airlines, Emirates, GOL, Icelandair, Lufthansa, Norse and the anchor airline is JetBlue. Estimates claim that they will have an economic impact of $5.6 billion.
• RFID tags will be implemented on the baggage, and the terminal was engineered to be certified as one of the first LEEDv4 airport campuses.
Source: Airport World, September 21, 2022
Orlando home sales drop nearly 20% as interest rates continue to climb
• The Orlando Regional Realtor Association reported that 2,717 homes were sold in September, a decrease of 18.3%.
• Interest rates have been increasing to combat inflation, now leading home buyers to take a step back. Compared to August, 607 fewer homes were sold.
• Although the median house price has slightly decreased, buyers are far more concerned with the high interest rates. On the other hand, Shonn McCloud, from Keller Williams Classic Realty, says that the housing market is more balanced now.
Source: ClickOrlando, October 17, 2022
Orange County to award another $26M worth of small business grants
• More relief for businesses impacted by COVID-19 is on the way. KPMG LLP has been approved by the Orange County Commission to be the vendor for grants through the federal American Rescue Plan Act.
• The grants are distributed with $20 million going to small businesses, $3 million to home-based businesses, and $3 million to the gig worker program.
• The funds will hopefully reach businesses that were unable to receive prior aid, as many
businesses are still in the “recovery phase,” as said by Eric Ushkowitz, the Orange County economic development administrator.
Source: Orlando Business Journal, October 25, 2022
Orange County receives $24M in Tourist Development Tax collections for September
• Orange County’s Tourist Development Tax (TDT) collections collected an astounding $24,444,200 in September, higher than the prior month by $1 million. It also beat 2021’s September by $17.4 million.
• Comptroller Phil Diamond says that these growths are due to strong hotel demands and an increased Average Daily Rate of $129.
• The TDT is a 6% tax on rents or leases in Orange County for 6 months or less. Expenditure of the TDT revenue is somewhat limited, and commissioners are waiting for the reserves to reach $300 million before making any commitments. There is currently $269 million as of this article’s posting.
Source: ClickOrlando, November 3, 2022
Orlando and Kissimmee line up hundreds of jobs through economic incentives in 2022
• Economic Incentive Programs seem to be working well, with 6 businesses in Orlando and Kissimmee taking full advantage of them and generating 508 new jobs.
• The incentives are performance-based, and many of the job agreements are created over a set period.
• Home Lending Pal agreed to add 275 new local jobs, Eloomi Inc. would add 81 new jobs, Iron Galaxy Studios would add 90 new jobs, New Kissimmee medical office would add 30 new jobs, Granite Telecommunications LLC wants to add 25 new jobs, and Eden Cosmetic and Wellness is expected to produce at least 7 high-wage medical jobs.
Source: Orlando Business Journal, November 8, 2022
O RLANDO – K ISSIMMEE – S ANFORD Institute for Economic Forecasting 91
Orlando - Kissimmee - Sanford MSA Industry Location Quotients
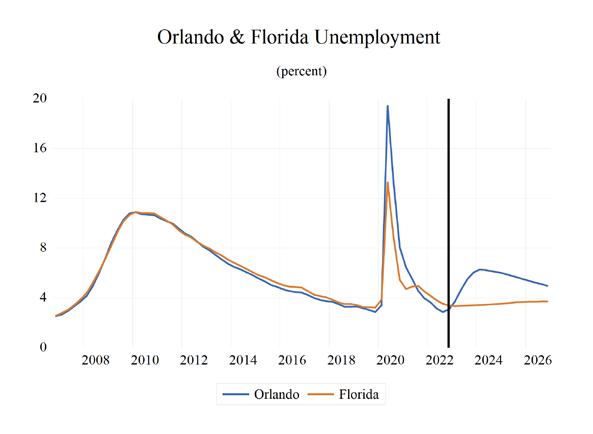
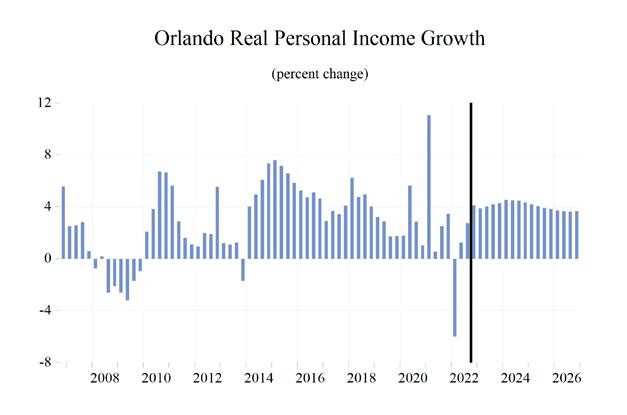
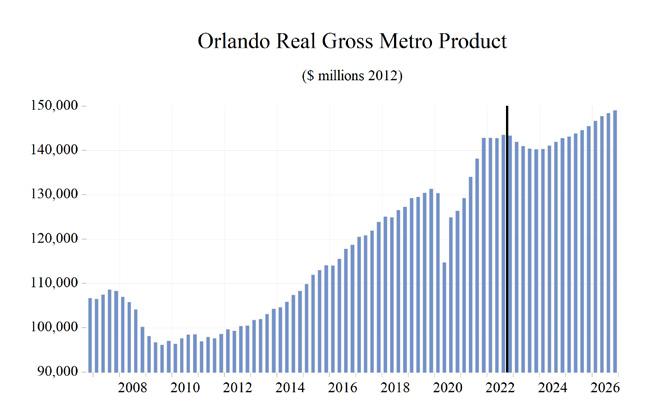
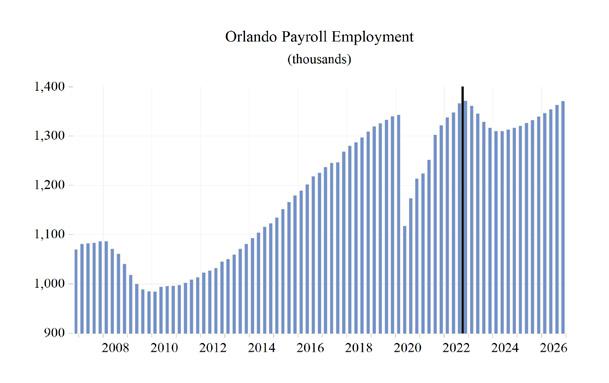
O RLANDO – K ISSIMMEE – S ANFORD 92 Florida & Metro Forecast / Winter 2023 0 0.2 0.4 0.6 0.8 1 1.2 1.4 1.6 Total Nonagricultural Employment Total Private Goods Producing Service Producing Private Service Providing Mining, Logging, and Construction Manufacturing Trade, Transportation, and Utilities Wholesale Trade Retail Trade Transportation, Warehousing and Utilities Information Financial Activities Professional and Business Services Educational and Health Services Leisure and Hospitality Other Services Government
Long-Term Outlook for Orlando-Kissimmee-Sanford, FL
O RLANDO – K ISSIMMEE – S ANFORD Institute for Economic Forecasting 93
December
2018 2019 2020 2021 2022 2023 2024 2025 2026 Personal Income (Billions $) Total Personal Income 113.4 120.4 129.0 142.9 149.5 152.2 157.3 166.3 175.5 Pct Chg Year Ago 6.4 6.2 7.1 10.8 4.6 1.8 3.4 5.8 5.5 Wages and Salaries 67.6 71.6 70.8 80.7 90.8 91.5 93.3 97.7 102.9 Nonwage Income 45.8 48.8 58.2 62.2 58.7 60.7 64.0 68.6 72.6 Real Personal Income (12$) 105.4 111.4 117.5 124.9 122.8 121.1 122.4 126.8 131.2 Pct Chg Year Ago 6.0 5.7 5.5 6.2 -1.6 -1.4 1.1 3.6 3.5 Per Capita Income (Ths) 43.4 45.5 48.1 53.0 54.8 54.9 55.9 58.2 60.3 Real Per Capita Income (12$) 40.4 42.0 43.9 46.3 45.0 43.7 43.5 44.3 45.1 Average Annual Wage (Ths) 52.1 53.7 58.3 63.0 66.7 68.1 70.9 73.2 75.5 Pct Chg Year Ago 3.8 3.1 8.6 8.2 5.8 2.2 4.0 3.3 3.1 Establishment Employment (Place of Work, Thousands, SA) Total Employment 1293.4 1329.7 1212.0 1275.2 1355.9 1338.2 1312.6 1330.0 1358.7 Pct Chg Year Ago 3.5 2.8 -8.9 5.2 6.3 -1.3 -1.9 1.3 2.2 Manufacturing 46.6 49.3 48.5 49.9 53.1 53.0 49.7 48.6 48.4 Pct Chg Year Ago 5.0 5.9 -1.6 2.9 6.5 -0.2 -6.3 -2.2 -0.4 Nonmanufacturing 1246.9 1280.4 1163.5 1225.3 1302.8 1285.2 1262.9 1281.4 1310.3 Pct Chg Year Ago 3.5 2.7 -9.1 5.3 6.3 -1.4 -1.7 1.5 2.3 Construction & Mining 82.2 86.1 83.0 83.0 78.5 75.9 74.7 77.0 81.0 Pct Chg Year Ago 10.8 4.7 -3.6 0.0 -5.5 -3.2 -1.7 3.1 5.2 Trade, Trans, & Utilities 240.5 246.2 235.3 246.1 260.8 252.2 246.3 245.6 247.0 Pct Chg Year Ago 2.8 2.4 -4.4 4.6 6.0 -3.3 -2.3 -0.3 0.6 Wholesale Trade 44.8 45.9 44.8 46.6 49.7 50.2 51.2 51.7 52.2 Retail Trade 150.8 151.0 140.5 145.5 151.2 141.4 133.6 132.1 132.7 Trans, Wrhsng, & Util 44.9 49.3 50.0 54.1 59.9 60.5 61.5 61.7 62.1 Information 25.3 25.6 24.2 25.1 26.3 26.2 26.7 27.7 28.2 Pct Chg Year Ago 3.6 1.1 -5.4 3.6 5.1 -0.3 1.6 4.0 1.8 Financial Activities 76.1 78.3 77.3 82.8 86.0 84.4 85.8 87.0 87.8 Pct Chg Year Ago 2.5 3.0 -1.2 7.1 3.8 -1.9 1.7 1.4 0.9 Prof & Business Services 229.0 235.0 218.0 237.1 250.4 232.4 210.6 215.6 228.2 Pct Chg Year Ago 4.2 2.6 -7.2 8.8 5.6 -7.2 -9.4 2.4 5.9 Educ & Health Services 155.5 160.7 158.2 163.5 165.8 169.9 175.5 176.9 179.1 Pct Chg Year Ago 2.1 3.4 -1.5 3.3 1.4 2.5 3.3 0.8 1.2 Leisure & Hospitality 266.5 276.2 201.9 222.5 266.6 272.0 266.0 270.4 274.4 Pct Chg Year Ago 3.6 3.6 -26.9 10.2 19.8 2.0 -2.2 1.7 1.5 Other Services 44.3 44.8 40.0 40.9 43.5 45.2 47.1 48.1 48.5 Pct Chg Year Ago 1.1 1.2 -10.9 2.3 6.4 3.9 4.3 2.0 0.9 Federal Government 14.7 14.7 15.2 15.2 15.4 15.1 15.6 16.1 16.6 Pct Chg Year Ago 0.7 -0.3 3.7 0.1 1.3 -2.1 3.0 3.2 3.1 State & Local Government 112.8 112.9 110.4 109.0 109.5 111.9 114.6 117.1 119.5 Pct Chg Year Ago 2.0 0.1 -2.2 -1.2 0.4 2.2 2.5 2.2 2.0 Other Economic Indicators Population (Ths) 2611.4 2649.3 2678.5 2694.8 2727.6 2770.2 2813.8 2860.5 2910.8 Pct Chg Year Ago 2.2 1.5 1.1 0.6 1.2 1.6 1.6 1.7 1.8 Labor Force (Ths) 1322.3 1349.5 1326.2 1329.1 1385.6 1405.2 1425.6 1448.9 1475.7 Percent Change, Year Ago 2.5 2.1 -1.7 0.2 4.3 1.4 1.5 1.6 1.9 Unemployment Rate (%) 3.4 3.1 11.0 5.1 3.2 5.0 6.2 5.7 5.2 Total Housing Starts 24707.4 23768.8 23582.8 26878.8 25657.9 16742.3 21238.6 25965.8 27542.0 Single-Family 15896.2 15337.9 15139.5 17077.9 15816.2 12170.1 16238.5 18664.8 19163.5 Multifamily 8811.2 8430.9 8443.3 9800.9 9841.7 4572.2 5000.0 7301.1 8378.5
2022 Forecast
Short-Term Outlook for Orlando-Kissimmee-Sanford, FL December 2022 Forecast
O RLANDO – K ISSIMMEE – S ANFORD 94 Florida & Metro Forecast / Winter 2023
2022:4 2023:1 2023:2 2023:3 2023:4 2024:1 2024:2 2024:3 2024:4 2025:1 2025:2 2025:3 2025:4 Personal Income (Billions $) Total Personal Income 151.7 152.3 151.7 152.1 152.6 154.4 156.1 158.3 160.4 162.8 165.2 167.5 169.8 Pct Chg Year Ago 3.7 4.0 2.0 0.8 0.6 1.4 2.9 4.1 5.1 5.5 5.8 5.8 5.9 Wages and Salaries 92.3 91.8 91.5 91.4 91.3 91.9 92.8 93.9 94.8 95.8 97.1 98.3 99.7 Nonwage Income 59.4 60.4 60.2 60.8 61.3 62.5 63.4 64.4 65.5 67.0 68.2 69.2 70.2 Real Personal Income (12$) 122.6 122.1 121.2 120.8 120.4 121.1 121.9 122.9 123.8 125.0 126.3 127.4 128.5 Pct Chg Year Ago -2.0 -0.6 -1.2 -2.0 -1.8 -0.9 0.6 1.8 2.8 3.3 3.6 3.7 3.8 Per Capita Income (Ths) 55.3 55.3 54.9 54.8 54.8 55.2 55.6 56.2 56.7 57.3 57.9 58.4 59.0 Real Per Capita Income (12$) 44.7 44.4 43.8 43.5 43.2 43.3 43.4 43.6 43.7 44.0 44.2 44.5 44.7 Average Annual Wage (Ths) 67.1 67.2 67.8 68.5 69.1 69.9 70.6 71.3 71.8 72.3 72.9 73.5 74.1 Pct Chg Year Ago 1.8 1.7 1.6 2.3 3.1 4.0 4.1 4.0 3.8 3.4 3.3 3.2 3.3 Establishment Employment (Place of Work, Thousands, SA) Total Employment 1371.4 1361.6 1345.8 1329.1 1316.5 1310.0 1310.4 1313.2 1316.9 1321.1 1326.6 1332.7 1339.7 Pct Chg Year Ago 3.7 1.8 -0.1 -2.8 -4.0 -3.8 -2.6 -1.2 0.0 0.8 1.2 1.5 1.7 Manufacturing 54.7 54.3 53.8 52.8 51.3 50.4 49.9 49.4 49.0 48.8 48.7 48.5 48.4 Pct Chg Year Ago 7.2 5.4 3.7 -3.2 -6.2 -7.1 -7.2 -6.4 -4.5 -3.2 -2.5 -1.8 -1.3 Nonmanufacturing 1316.7 1307.4 1292.0 1276.3 1265.1 1259.5 1260.4 1263.8 1267.8 1272.3 1277.9 1284.2 1291.3 Pct Chg Year Ago 3.6 1.6 -0.3 -2.7 -3.9 -3.7 -2.4 -1.0 0.2 1.0 1.4 1.6 1.9 Construction & Mining 77.3 77.2 76.2 75.4 75.0 74.5 74.2 74.6 75.3 75.8 76.6 77.3 78.2 Pct Chg Year Ago -8.5 -6.0 -1.4 -2.3 -2.9 -3.4 -2.5 -1.1 0.3 1.7 3.2 3.7 3.9 Trade, Trans, & Utilities 259.5 256.0 254.2 249.8 248.9 247.8 246.1 245.9 245.4 245.2 245.3 245.8 246.0 Pct Chg Year Ago 2.0 -1.6 -3.1 -4.5 -4.1 -3.2 -3.1 -1.5 -1.4 -1.1 -0.4 -0.1 0.2 Wholesale Trade 50.5 50.3 50.0 50.1 50.5 50.9 51.2 51.4 51.5 51.6 51.7 51.8 51.9 Retail Trade 148.4 145.0 143.8 139.2 137.7 135.7 133.4 132.9 132.4 132.0 131.9 132.3 132.2 Trans, Wrhsng, & Util 60.6 60.6 60.4 60.4 60.7 61.3 61.6 61.6 61.6 61.6 61.7 61.7 61.8 Information 26.5 26.4 26.3 26.2 26.0 26.2 26.6 26.8 27.1 27.4 27.6 27.9 28.0 Pct Chg Year Ago 0.9 0.3 0.7 -0.6 -1.8 -0.7 1.1 2.2 3.9 4.4 4.0 4.2 3.5 Financial Activities 86.3 85.3 84.0 83.8 84.3 85.0 85.7 86.1 86.4 86.8 87.0 87.0 87.2 Pct Chg Year Ago 0.5 -1.3 -1.5 -2.6 -2.3 -0.3 2.0 2.7 2.5 2.2 1.6 1.1 0.8 Prof & Business Services 251.2 248.5 238.1 226.2 216.9 211.9 210.3 210.0 210.2 211.9 213.9 216.7 219.8 Pct Chg Year Ago 1.0 0.0 -4.6 -10.3 -13.7 -14.7 -11.7 -7.2 -3.1 0.0 1.7 3.2 4.6 Educ & Health Services 167.9 167.8 168.6 170.8 172.3 174.1 175.6 176.3 176.2 176.5 176.6 177.1 177.5 Pct Chg Year Ago 1.4 1.6 3.1 2.6 2.6 3.7 4.1 3.2 2.3 1.4 0.6 0.4 0.7 Leisure & Hospitality 277.4 275.6 273.6 271.5 267.2 264.2 265.1 266.2 268.3 268.6 270.0 270.7 272.1 Pct Chg Year Ago 16.5 10.2 2.8 -0.5 -3.7 -4.1 -3.1 -1.9 0.4 1.7 1.8 1.7 1.4 Other Services 44.6 44.6 44.9 45.3 46.0 46.6 47.0 47.3 47.6 47.9 48.0 48.1 48.2 Pct Chg Year Ago 6.9 5.6 4.6 2.4 3.3 4.5 4.8 4.5 3.4 2.8 2.1 1.7 1.4 Federal Government 15.1 15.0 15.0 15.1 15.3 15.4 15.5 15.6 15.8 15.9 16.0 16.1 16.3 Pct Chg Year Ago -4.0 -5.8 -2.8 -0.6 0.9 2.2 3.1 3.2 3.2 3.2 3.2 3.2 3.1 State & Local Government 110.8 111.0 111.2 112.2 113.1 113.7 114.3 115.0 115.5 116.2 116.8 117.4 118.0 Pct Chg Year Ago 0.8 1.4 3.5 1.8 2.0 2.4 2.8 2.5 2.2 2.2 2.2 2.1 2.2 Other Economic Indicators Population (Ths) 2743.4 2753.8 2764.7 2775.6 2786.6 2797.5 2808.2 2819.2 2830.6 2842.3 2854.4 2866.5 2878.8 Pct Chg Year Ago 1.5 1.5 1.6 1.6 1.6 1.6 1.6 1.6 1.6 1.6 1.6 1.7 1.7 Labor Force (Ths) 1393.7 1396.3 1401.9 1408.2 1414.3 1418.5 1422.7 1427.8 1433.4 1439.1 1445.4 1452.4 1458.5 Pct Chg Year Ago 2.5 1.7 1.3 1.1 1.5 1.6 1.5 1.4 1.4 1.5 1.6 1.7 1.7 Unemployment Rate (%) 3.1 3.7 4.7 5.5 6.0 6.3 6.2 6.1 6.1 5.9 5.8 5.7 5.5 Total Housing Starts 18075.6 17062.3 16183.3 16513.7 17210.0 18704.7 20280.8 22060.4 23908.5 25027.7 25837.9 26265.0 26732.8 Single-Family 12321.1 11653.1 11459.2 12267.9 13300.1 14473.9 15725.9 16859.9 17894.4 18348.0 18629.2 18723.5 18958.4 Multifamily 5754.5 5409.2 4724.1 4245.8 3909.8 4230.8 4554.9 5200.4 6014.1 6679.7 7208.7 7541.4 7774.4
PROFILES
The Palm Bay–Melbourne–Titusville MSA is comprised of Brevard County only. Typically known as “Florida’s Space Coast”, this area is home to the Kennedy Space Center. Located in the central part of Florida’s east coast, the region is home to Cape Canaveral Air Force Base, Patrick Air Force Base, and government contractors such as L3 Harris Technologies. Like much of Florida, this area is growing fast; Port Canaveral is now a leading cruise ship port.
QUICK FACTS
• Metro population estimate of 585,507 as of 2019 (5-Year Estimate) (U.S. Census Bureau).
• Brevard County population estimate of 601,942 as of 2019 (5-Year Estimate) (U.S. Census Bureau).
• Civilian labor force of 302,043 in November 2022 (Florida Research and Economic Database).
• An unemployment rate of 2.6% as of November 2022, not seasonally adjusted. This amounts to 7,769 unemployed people (Florida Research and Economic Database).
OUTLOOK SUMMARIES
The Palm Bay—Melbourne—Titusville Metropolitan Statistical Area (MSA) will show below-average growth in the studied economic indicators when compared to other MSAs. The MSA will have the 11th highest Gross Metro Product at $27,903.08. Average annual wage growth will average 3.7 percent, leading to the 8th highest average annual wage of $73,700. Personal income growth will average 4.5 percent, leading to a per capita income level of $48,600. Population growth will expand at an average annual rate of 0.8%.
Palm Bay will experience negative employment growth that will average -0.6 percent. Palm Bay’s unemployment rate will hover around 5.0 percent.
The Other Services sector will lead the way in Palm Bay with an average annual growth rate of 2.6 percent.
The Financial Services sector will follow with a growth rate of 2.1 percent, Education and Health Services will be third at 1.9 percent average annual growth.
METRO NEWS SUMMARIES
Brevard County breaks ground on new emergency operations center
• The 42,000-square-foot emergency operations center is being built next to the Rockledge Facility, which opened in 1964. The center will be able to withstand Category 5 hurricanestrength winds and have the latest technology to respond to emergencies.
• Staff from organizations around the county won’t have to stay where they work thanks to the new $30 million facility. A central dispatch office will be part of the contemporary EOC.
• The project’s development is expected to be finished by the county sometime in the hurricane season of 2023.
Source: WFTV, September 9, 2022
Palm Bay City Council approves $5M for affordable housing programs
• The City Council allocated $5 million of the $18 million Palm Bay received from the American Rescue Plan Act in May for the purpose of tackling homelessness, affordable housing, and related public services.
• The money was awarded to 6 organizations including Habitat for Humanity, Volunteers of America, and Community of Hope Inc to produce housing communities for people who live under the median income of the region, and public housing and shelters.
• As part of the $5 million, the City Council authorized the allocation of $150,000 from the ARPA money for the monitoring and compliance of these funds.
Source: Florida Today, September 26, 2022
P ALM B A y – M ELBOURNE – T ITUSVILLE Institute for Economic Forecasting 95
Dassault Falcon Jet announces plan to create 400 new jobs at Melbourne airport facility
• At Melbourne Orlando International Airport, Dassault Falcon Jet has announced plans to develop a $115 million aviation servicing complex and provide 400 new jobs.
• The 400 jobs will boast average salaries of $86,120, said Keely Leggett, airport spokesperson.
• The project also received a $6.6 million FDOT grant that would pay for security equipment, an environmental evaluation, site clearing, the building of an apron, utility extensions, stormwater drainage, and an Apollo Boulevard median cut.
Source: Florida Today, October 17, 2022
Brevard County is the first in the state to implement Mutualink’s Enhanced Emergency Response System connecting a dozen of law enforcement agencies and hospitals across the county
• Brevard County is the first county in Florida to have an improved emergency response system in place to aid in direct real-time communication between hospitals and law enforcement during any emergency.
• “Having the ability to instantly communicate and access live stream security cameras and floor plans transforms how law enforcement officers respond during an emergency” said Sheriff Wayne Ivey.
• This system was paid for through the Cares Act Grant and brings full capability to Parrish Medical Center, Rockledge Regional Medical Center, Melbourne Regional Medical Center, and Health First.
Source: Business Wire, October 19, 2022
Crystal Lagoon: Here’s what we know about proposed Melbourne ‘Lakoona Beach’ complex
• The sale of 56 forested airport-owned acres off the south side of NASA Boulevard for $8.93 million to be developed as a Crystal Lagoonanchored attraction was overwhelmingly approved by the airport authority. The aquatic resort complex could create 2,600 direct and indirect jobs.
• The $8.93 million in sale proceeds will be earmarked for future investment in airport revenue-producing projects, not spent on operations and maintenance.
• As the site is a former landfill, Adëlon Capital has a nine-month due-diligence period to perform environmental studies and see if the project is feasible.
Source: Florida Today, October 26, 2022
Tourist Tax Collections come in at record $23.33 million for fiscal year
• September Tourist Development Tax (TDT) for Brevard County has come in at $1.589 million –a record for the month of September, making it the 18th consecutive month of “best month for that given month” results.
• The TDT concluded the year with $23.33 million, making it the strongest fiscal year by approximately $6.4 million (against $16.94 million last year), an exceptional 37.7% rise.
• By type, hotels made up 70% of the total for the month and 67% for the year, while vacation rentals made up 29% of the total for the month, a little down from the average 32% for the year.
Source: Space Coast Daily, November 21, 2022
P ALM B A y – M ELBOURNE – T ITUSVILLE 96 Florida & Metro Forecast / Winter 2023
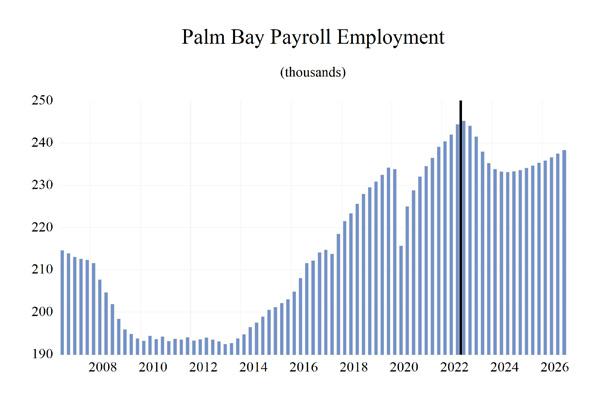
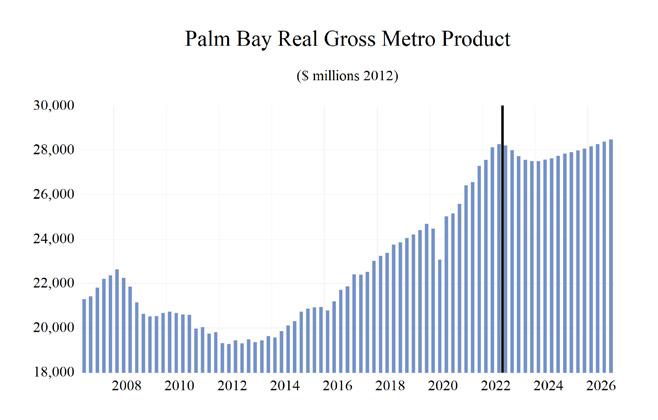
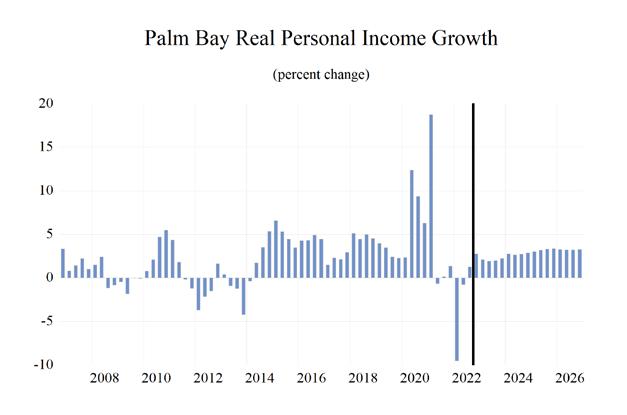
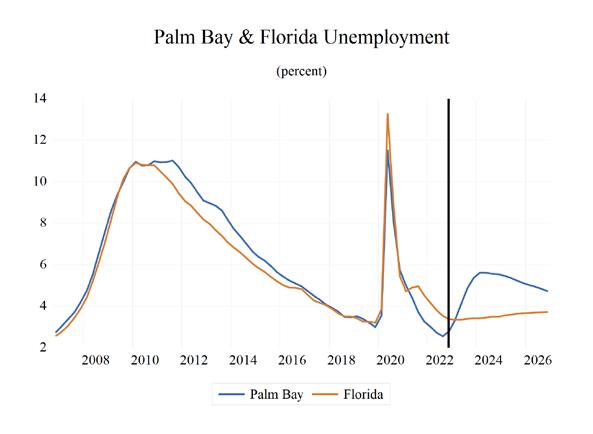
P ALM B A y – M ELBOURNE – T ITUSVILLE Institute for Economic Forecasting 97 0 0.5 1 1.5 2 2.5 3 3.5 Total Nonagricultural Employment Total Private Goods Producing Service Producing Private Service Providing Mining, Logging, and Construction Manufacturing Trade, Transportation, and Utilities Wholesale Trade Retail Trade Transportation, Warehousing and Utilities Information Financial Activities Professional and Business Services Educational and Health Services Leisure and Hospitality Other Services Government
Bay - Melbourne - Titusville MSA Industry Location Quotients
Palm
Long-Term Outlook for Palm Bay-Melbourne-Titusville, FL December 2022 Forecast
P ALM B A y – M ELBOURNE – T ITUSVILLE 98 Florida & Metro Forecast / Winter 2023
2018 2019 2020 2021 2022 2023 2024 2025 2026 Personal Income (Billions $) Total Personal Income 27.4 29.3 31.5 34.2 35.6 36.8 38.2 40.3 42.4 Pct Chg Year Ago 6.2 6.9 7.5 8.7 3.9 3.5 3.8 5.4 5.2 Wages and Salaries 12.1 13.0 13.6 14.9 16.6 16.8 17.1 17.8 18.7 Nonwage Income 15.3 16.2 17.9 19.3 19.0 20.0 21.1 22.5 23.7 Real Personal Income (12$) 25.6 27.5 29.2 30.4 29.7 29.8 30.3 31.3 32.3 Pct Chg Year Ago 4.8 7.3 6.1 4.2 -2.2 0.3 1.5 3.3 3.2 Per Capita Income (Ths) 46.0 48.7 51.7 55.4 57.1 58.6 60.4 63.2 65.9 Real Per Capita Income (12$) 43.1 45.7 47.9 49.3 47.7 47.5 47.8 49.0 50.2 Average Annual Wage (Ths) 53.1 55.6 59.4 62.5 67.3 69.3 72.6 75.2 77.9 Pct Chg Year Ago 2.3 4.6 7.0 5.2 7.7 2.9 4.7 3.6 3.7 Establishment Employment (Place of Work, Thousands, SA) Total Employment 224.6 231.7 225.8 235.6 243.0 239.7 233.3 234.4 237.1 Pct Chg Year Ago 4.3 3.2 -2.6 4.3 3.2 -1.4 -2.6 0.5 1.1 Manufacturing 25.8 27.4 28.7 29.7 30.7 30.6 29.1 28.5 28.2 Pct Chg Year Ago 9.0 6.1 4.7 3.5 3.5 -0.3 -4.9 -2.0 -1.0 Nonmanufacturing 198.8 204.3 197.1 205.9 212.3 209.1 204.2 205.9 208.8 Pct Chg Year Ago 3.8 2.8 -3.5 4.4 3.1 -1.5 -2.3 0.8 1.4 Construction & Mining 14.9 15.4 16.2 17.6 17.4 17.0 16.0 15.5 15.4 Pct Chg Year Ago 11.0 3.7 5.1 8.6 -1.4 -1.8 -6.1 -2.9 -0.8 Trade, Trans, & Utilities 37.9 38.2 37.2 38.9 40.3 38.1 36.1 36.0 36.4 Pct Chg Year Ago 3.8 1.0 -2.8 4.8 3.5 -5.6 -5.1 -0.3 1.2 Wholesale Trade 5.0 5.3 5.2 5.4 5.5 5.8 6.0 6.2 6.3 Retail Trade 28.6 28.4 27.6 28.4 29.2 27.7 26.1 25.9 26.0 Trans, Wrhsng, & Util 4.2 4.6 4.3 5.1 5.6 4.5 4.0 3.9 4.1 Information 2.6 2.4 1.9 2.0 2.1 2.0 2.0 2.0 2.0 Pct Chg Year Ago -0.6 -7.1 -19.3 1.3 7.0 -4.0 -1.1 1.5 -0.4 Financial Activities 8.6 8.6 8.8 9.1 9.3 9.7 9.8 10.0 10.1 Pct Chg Year Ago 6.5 0.8 1.6 3.9 2.1 4.2 0.9 1.7 1.8 Prof & Business Services 33.1 35.3 36.8 38.5 39.6 37.2 34.4 35.4 36.9 Pct Chg Year Ago 3.5 6.6 4.4 4.5 2.9 -5.9 -7.7 3.0 4.1 Educ & Health Services 36.9 38.3 35.4 36.0 36.8 38.5 39.4 39.5 39.7 Pct Chg Year Ago 3.6 3.8 -7.5 1.6 2.4 4.6 2.3 0.3 0.6 Leisure & Hospitality 27.9 28.6 24.4 27.0 28.8 28.0 27.7 28.3 28.9 Pct Chg Year Ago 3.6 2.6 -14.8 10.6 7.0 -3.0 -1.0 2.2 2.2 Other Services 8.9 9.0 8.3 8.5 9.0 9.2 9.5 9.8 10.0 Pct Chg Year Ago 2.3 1.6 -8.8 2.7 6.5 2.2 3.0 2.9 2.3 Federal Government 6.3 6.4 6.7 6.8 6.8 6.8 6.8 6.7 6.6 Pct Chg Year Ago -0.3 1.8 4.7 1.4 -0.4 0.9 -0.8 -1.3 -1.4 State & Local Government 21.9 22.0 21.5 21.6 22.1 22.5 22.6 22.7 22.7 Pct Chg Year Ago 1.4 0.7 -2.5 0.3 2.7 1.5 0.5 0.4 0.1 Other Economic Indicators Population (Ths) 595.3 601.7 609.1 617.1 623.0 627.8 633.0 638.0 643.2 Pct Chg Year Ago 1.2 1.1 1.2 1.3 1.0 0.8 0.8 0.8 0.8 Labor Force (Ths) 274.5 281.4 281.6 289.3 296.1 301.7 303.0 304.8 307.1 Percent Change, Year Ago 2.9 2.5 0.1 2.7 2.3 1.9 0.4 0.6 0.7 Unemployment Rate (%) 3.6 3.3 7.2 4.1 2.8 4.4 5.6 5.3 4.9 Total Housing Starts 2754.5 3548.6 4178.8 5021.4 4752.6 3795.9 3523.9 3706.1 3864.1 Single-Family 2308.8 2512.0 3225.9 4296.6 3969.3 2594.1 2678.7 2834.0 2866.7 Multifamily 445.7 1036.5 952.9 724.8 783.4 1201.8 845.2 872.1 997.4
Short-Term Outlook for Palm Bay-Melbourne-Titusville, FL December 2022 Forecast
P ALM B A y – M ELBOURNE – T ITUSVILLE Institute for Economic Forecasting 99
2022:4 2023:1 2023:2 2023:3 2023:4 2024:1 2024:2 2024:3 2024:4 2025:1 2025:2 2025:3 2025:4 Personal Income (Billions $) Total Personal Income 36.3 36.6 36.7 36.9 37.1 37.6 38.0 38.4 38.9 39.5 40.0 40.6 41.1 Pct Chg Year Ago 5.7 5.4 3.7 2.8 2.4 2.6 3.5 4.3 4.9 5.2 5.5 5.5 5.5 Wages and Salaries 16.9 16.9 16.8 16.7 16.8 16.9 17.0 17.2 17.4 17.5 17.7 17.9 18.1 Nonwage Income 19.4 19.7 19.9 20.1 20.4 20.7 20.9 21.2 21.6 22.0 22.3 22.7 23.0 Real Personal Income (12$) 29.8 29.9 29.8 29.8 29.8 30.0 30.2 30.4 30.6 30.9 31.1 31.4 31.7 Pct Chg Year Ago 0.0 0.8 0.4 -0.1 -0.1 0.3 1.2 2.0 2.6 3.0 3.3 3.4 3.5 Per Capita Income (Ths) 58.1 58.5 58.5 58.6 59.0 59.5 60.0 60.7 61.3 62.1 62.8 63.5 64.2 Real Per Capita Income (12$) 47.8 47.8 47.5 47.4 47.4 47.5 47.7 47.9 48.2 48.6 48.9 49.2 49.5 Average Annual Wage (Ths) 68.0 68.3 68.8 69.5 70.5 71.4 72.2 73.0 73.6 74.2 74.8 75.5 76.2 Pct Chg Year Ago 4.2 3.1 2.3 2.7 3.6 4.6 4.9 5.0 4.4 4.0 3.6 3.3 3.5 Establishment Employment (Place of Work, Thousands, SA) Total Employment 245.2 244.1 241.5 238.0 235.2 233.8 233.2 233.1 233.3 233.6 234.1 234.7 235.3 Pct Chg Year Ago 2.6 1.5 -0.2 -2.6 -4.1 -4.2 -3.4 -2.0 -0.8 -0.1 0.4 0.7 0.8 Manufacturing 31.4 31.3 31.0 30.4 29.7 29.4 29.2 29.0 28.8 28.7 28.6 28.4 28.4 Pct Chg Year Ago 4.3 4.4 2.6 -2.6 -5.5 -5.9 -5.9 -4.7 -3.0 -2.5 -2.2 -1.8 -1.5 Nonmanufacturing 213.8 212.8 210.4 207.6 205.5 204.4 204.0 204.1 204.5 204.9 205.5 206.2 206.9 Pct Chg Year Ago 2.3 1.1 -0.6 -2.6 -3.9 -4.0 -3.1 -1.6 -0.5 0.3 0.7 1.0 1.2 Construction & Mining 17.5 17.5 17.2 16.8 16.6 16.3 16.0 15.9 15.8 15.6 15.6 15.5 15.4 Pct Chg Year Ago 0.0 0.6 0.4 -3.1 -5.3 -7.0 -6.8 -5.5 -4.9 -4.1 -2.9 -2.4 -2.2 Trade, Trans, & Utilities 39.8 39.0 38.6 37.6 37.0 36.6 36.1 36.0 35.9 35.9 35.9 36.1 36.2 Pct Chg Year Ago 0.3 -3.5 -4.9 -7.0 -7.0 -6.3 -6.5 -4.2 -3.1 -1.8 -0.4 0.3 0.7 Wholesale Trade 5.7 5.8 5.8 5.8 5.9 5.9 6.0 6.0 6.1 6.1 6.1 6.2 6.2 Retail Trade 28.9 28.3 28.2 27.4 27.0 26.5 26.1 26.0 25.9 25.9 25.9 26.0 26.0 Trans, Wrhsng, & Util 5.3 4.9 4.6 4.4 4.2 4.1 4.1 4.0 3.9 3.9 3.9 3.9 4.0 Information 2.1 2.0 2.0 2.0 2.0 2.0 2.0 2.0 2.0 2.0 2.0 2.0 2.0 Pct Chg Year Ago -0.4 -4.1 -6.0 -2.0 -3.9 -2.4 -1.1 -1.5 0.7 1.5 1.3 2.0 1.3 Financial Activities 9.5 9.7 9.7 9.7 9.7 9.7 9.8 9.8 9.8 9.9 9.9 10.0 10.0 Pct Chg Year Ago 2.9 5.0 5.5 4.2 2.1 0.5 0.4 1.3 1.3 1.5 1.7 1.8 1.8 Prof & Business Services 39.7 39.6 38.0 36.3 35.0 34.4 34.2 34.3 34.5 34.9 35.2 35.6 36.0 Pct Chg Year Ago 1.5 0.5 -3.8 -8.3 -11.9 -13.2 -9.9 -5.5 -1.4 1.5 2.9 3.6 4.2 Educ & Health Services 37.9 38.1 38.3 38.7 38.9 39.2 39.4 39.5 39.5 39.5 39.5 39.5 39.5 Pct Chg Year Ago 5.0 6.1 5.3 4.2 2.7 2.8 2.8 2.0 1.5 0.8 0.1 0.0 0.2 Leisure & Hospitality 29.0 28.4 28.0 27.9 27.7 27.5 27.6 27.7 28.0 28.1 28.2 28.4 28.5 Pct Chg Year Ago 4.7 0.3 -3.3 -4.4 -4.5 -3.2 -1.4 -0.7 1.2 2.2 2.3 2.3 2.0 Other Services 9.2 9.2 9.2 9.2 9.3 9.4 9.5 9.5 9.6 9.7 9.7 9.8 9.9 Pct Chg Year Ago 7.1 5.3 1.9 0.8 1.0 2.0 3.4 3.4 3.1 3.1 3.0 2.8 2.6 Federal Government 6.8 6.8 6.9 6.8 6.8 6.8 6.8 6.8 6.7 6.7 6.7 6.7 6.7 Pct Chg Year Ago -1.4 0.2 1.3 1.8 0.4 -0.3 -1.1 -0.9 -1.0 -1.2 -1.3 -1.4 -1.4 State & Local Government 22.3 22.4 22.5 22.5 22.5 22.5 22.6 22.6 22.6 22.7 22.7 22.7 22.7 Pct Chg Year Ago 1.2 1.6 2.6 1.1 0.9 0.6 0.3 0.7 0.5 0.6 0.4 0.2 0.3 Other Economic Indicators Population (Ths) 624.8 626.0 627.2 628.5 629.7 630.9 632.3 633.7 634.9 636.1 637.4 638.7 640.0 Pct Chg Year Ago 0.8 0.8 0.7 0.8 0.8 0.8 0.8 0.8 0.8 0.8 0.8 0.8 0.8 Labor Force (Ths) 298.8 300.4 301.7 302.3 302.5 302.6 302.7 303.1 303.6 304.0 304.5 305.2 305.6 Pct Chg Year Ago 2.4 2.2 2.2 1.9 1.2 0.7 0.3 0.3 0.3 0.5 0.6 0.7 0.7 Unemployment Rate (%) 2.8 3.3 4.1 4.9 5.4 5.6 5.6 5.6 5.5 5.5 5.4 5.2 5.1 Total Housing Starts 4704.3 4371.6 3805.3 3549.2 3457.5 3566.3 3561.4 3424.3 3543.7 3626.8 3680.8 3740.1 3777.0 Single-Family 3261.4 2913.8 2556.6 2456.4 2449.6 2548.8 2651.8 2726.8 2787.5 2815.8 2824.0 2840.1 2856.0 Multifamily 1442.9 1457.8 1248.8 1092.8 1008.0 1017.6 909.6 697.5 756.2 810.9 856.8 900.0 921.0
PROFILES
The Panama City MSA, known for its beaches and emerald green water is located in the Northwest portion of the state. Panama City is the largest City between Tallahassee and Pensacola. This area is the more populated of two principal cities of the Panama City-Lynn Haven MSA and it is the county seat of Bay County.
QUICK FACTS
• Metro population estimate of 182,161 as of 2019 (5-Year Estimate) (U.S. Census Bureau).
• Bay County population estimate of 182,161 as of 2019 (5-Year Estimate) (U.S. Census Bureau).
• Civilian labor force of 94,350 in November 2022 (Florida Research and Economic Database).
• An unemployment rate of 2.4% as of November 2022, not seasonally adjusted. This amounts to 2,298 unemployed people (Florida Research and Economic Database).
OUTLOOK SUMMARIES
The Panama City Metropolitan Statistical Area (MSA) will show relatively-low levels of growth in the studied economic indicators when compared to other MSAs. The MSA will have Gross Metro Product at $9,251.16. Average annual wage growth will average 4.1 percent, the 2nd highest, leading to an average annual wage of $63,100. Personal income growth will average 4.4 percent, leading to a per capita income level of $46,300.
Employment growth will average -0.6 percent, ranking as the 3rd lowest of the MSA list. Additionally, Palm Bay’s unemployment rate will hover around 4.8 percent which is below average in the state.
The Other Service sector will lead the way in Panama City with an average annual growth rate of 2.8 percent. The Education and Health Services sector will follow with a growth rate of 1.5 percent, and the Federal Government sector will be third at 0.6 percent average annual growth.
METRO NEWS SUMMARIES
New company coming to Bay County bringing more than 100 jobs
• Marine manufacturing company, Mocama Marine LLC, will be heading to Bay County and establish new manufacturing operations. Their 2 new facilities will be partly stationed on the former “Century Boat” in the original Bay County Industrial Park.
• Barry Skitsko, President of Mocama Marine and its parent company East Bay Capital said, “... we want to thank the Bay County Commission and the Bay Economic Development Alliance for their support during this site selection process.” The company is expected to invest $10.5 million into the community.
• The 2 facilities will cover 7 acres and will be 60,000 square-feet. They will be used to manufacture Action Craft and Southwind boat brands. The manufacturing facilities will also bring around 105 new jobs to Bay County.
Source: WJHG, September 6, 2022
These four Bay County companies were approved for 10-year tax exemptions
• Bay Economic Development Alliance (EDA) has been working to bring 3 new companies to the area. Recently, Bay County Commissioners have not only voted to support these companies but also a fourth company that has already committed to establishing in the County.
• Since the EDA has not finalized their plans with the companies, they are currently going under the codenames Project Ballistic, Project Blue Water and Project Tachyon. Officials believe these projects will provide a significant boost to the area’s workforce. The projects are expected to bring 300, 100, and 209 jobs respectively and will have a collective capital investment of $44 million.
• The fourth company, Macoma Marine LLC, was mentioned just previously. The 105 jobs they will provide will have an average annual salary of $50,000. Their scheduled opening has been announced for early 2023.
Source: Panama City News Herald, September 23, 2022
PANAMA CIT y 100 Florida & Metro Forecast / Winter 2023
New aviation company breaks ground at ECP airport
• A fixed base operation center, or FBO, will soon begin construction at ECP airport in Panama City. Private company Southern Sky Aviation is behind this project, and the FBO will serve as a gas station and maintenance center for noncommercial planes.
• ECP’s Executive Director McClellan said, “We’re going to start out with 20-30 new jobs, well-paying jobs.” He also stated, “Just the opportunity of diversifying our flight line and making it so we can provide a better service to the fine public.”
• The airport is partnering with the Bay Economic Development Council for construction, citing their help with the permitting process. Previous estimates claimed the company would be investing $25 million, with a completion date in December of 2023.
Source: WJHG, October 12, 2022
Port Panama City USA sets all-time high cargo records sees record breaking nine percent revenue increase
• During the 2022 fiscal year, Port Panama City set an all-time record high of 2.03 million tons of cargo (4% increase from 2021) handled at this regional seaport along with a revenue record of $19.04 million (9% increase from 2021).
• More than 450,000 tons of break-bulk forest products and lumber went through the port in 2022, with 230,000 tons of that cargo moving through their recent East Terminal. “...our port has become an attractive option for break-bulk forest products and other cargoes,” said Alex King, Executive Director, Port Panama City. Since last year, Alex King also helped foster trade with the Yucatan State of Mexico.
• The Economic Impact Study, published in May 2022 by Martin Associates, found the following statistics regarding growth in cargo and revenue: 10,790 total jobs for Bay County, Northwest Florida and the Southeastern U.S, $618.8 million in personal income and local consumption, and $1.6 billion in total economic value.
Source: GCaptain, October 21, 2022
Panama City looks to marketing firm to bring in new business
• National marketing firm kglobal has worked with Panama City for over 4 years, however, Bay County seems to shift away from the company and has been advertising on its own.
• The city partnered with the marketing firm to advertise its program, ReHouse Bay, which was aimed to help homeowners fix storm damages and to buy unaffordable homes among other things. The city, partnering with Bay County, spent a total of $600,000 for advertising with kglobal.
• Questions about if this marketing was necessary were raised by the county, and they instead advertised the program on their own and spent only $65,000 to great success. However, kglobal will still have its relevance in the area, as a $100,000 contract with the company has been in the works to help the city attract businesses.
Source: My Panhandle, November 16, 2022
One company’s Bay County expansion falls through, another is on hold. What it means:
• 100 well-paying jobs may no longer be arriving in Bay County as one company, potentially two, will no longer be expanding here.
• County Commissioners voted to repeal property tax exemptions for both Air Temp of America and Clark & Sons Auction & Liquidation. The manufacturing companies were announced to expand into the county over the previous years, but Hurricane Michael in 2018 and the COVID-19 pandemic have caused major delays in these plans.
• It was confirmed that Clark & Sons will no longer be arriving in Bay County, but the door remains open for Air Temp of America, with a potentially smaller scale project. Despite this, county officials are still optimistic due to the still incoming 800 jobs said to come from other expanding companies.
Source: The News Herald, November 18, 2022
PANAMA CIT y Institute for Economic Forecasting 101
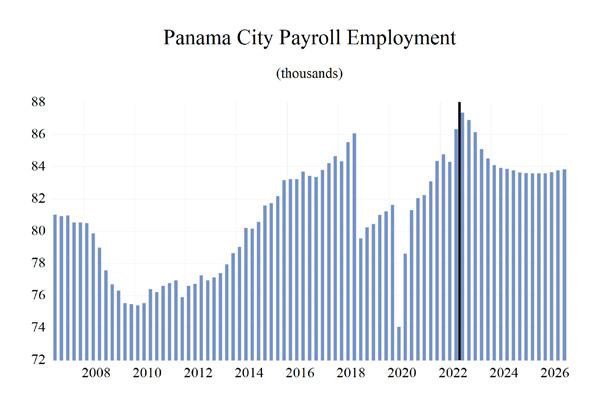

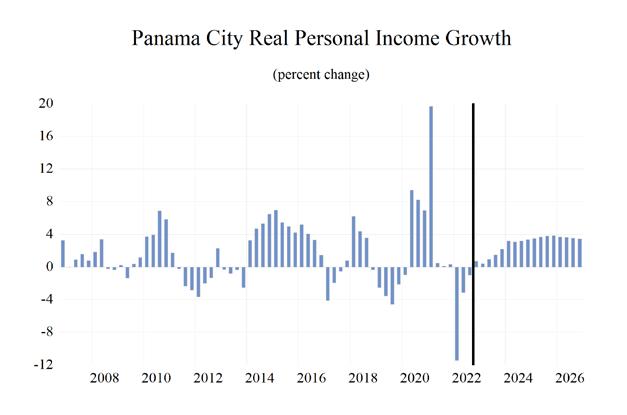
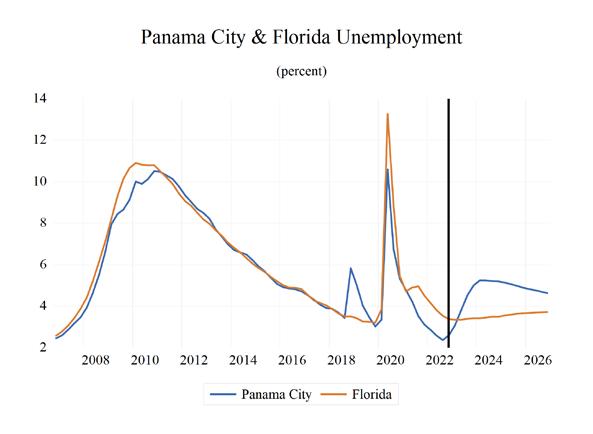
PANAMA CIT y 102 Florida & Metro Forecast / Winter 2023 0 0.2 0.4 0.6 0.8 1 1.2 1.4 1.6 Total Nonagricultural Employment Total Private Goods Producing Service Producing Private Service Providing Mining, Logging, and Construc�on Manufacturing Trade, Transporta�on, and U�li�es Wholesale Trade Retail Trade Transporta�on Warehousing and U�li�es Informa�on Financial Ac�vi�es Professional and Business Services Educa�onal and Health Services Leisure and Hospitality Other Services Government Panama City MSA Industry Loca�on Quo�ents
Long-Term Outlook for Panama City, FL
PANAMA CIT y Institute for Economic Forecasting 103
December
2018 2019 2020 2021 2022 2023 2024 2025 2026 Personal Income (Billions $) Total Personal Income 8.6 8.8 9.4 10.4 10.7 11.1 11.6 12.2 12.7 Pct Chg Year Ago 4.3 2.6 7.0 9.9 3.2 3.9 4.3 5.0 4.7 Wages and Salaries 3.9 4.0 4.1 4.6 5.1 5.2 5.4 5.6 5.8 Nonwage Income 4.7 4.8 5.3 5.8 5.6 5.9 6.2 6.6 6.9 Real Personal Income (12$) 8.4 8.4 8.8 9.3 9.1 9.1 9.3 9.5 9.8 Pct Chg Year Ago 3.5 0.0 5.8 5.4 -2.9 0.6 2.0 2.8 2.7 Per Capita Income (Ths) 42.2 45.9 49.8 53.5 54.0 55.3 57.1 59.4 61.7 Real Per Capita Income (12$) 41.1 43.5 46.7 48.1 45.7 45.3 45.7 46.6 47.5 Average Annual Wage (Ths) 44.5 48.1 50.4 53.5 57.2 59.0 61.9 64.4 67.1 Pct Chg Year Ago 3.3 8.1 4.8 6.2 7.0 3.1 4.9 4.1 4.2 Establishment Employment (Place of Work, Thousands, SA) Total Employment 83.9 80.7 78.9 82.9 85.7 85.7 83.9 83.6 83.7 Pct Chg Year Ago -0.2 -3.8 -2.3 5.1 3.3 0.0 -2.0 -0.4 0.1 Manufacturing 3.1 3.0 3.2 3.4 3.6 3.6 3.4 3.4 3.3 Pct Chg Year Ago -4.8 -1.7 4.6 8.2 4.2 0.1 -3.9 -2.2 -1.6 Nonmanufacturing 80.8 77.7 75.7 79.5 82.1 82.1 80.5 80.2 80.4 Pct Chg Year Ago 0.0 -3.8 -2.5 5.0 3.3 0.0 -2.0 -0.3 0.2 Construction & Mining 5.5 6.9 7.0 7.0 7.3 7.2 6.6 6.1 5.8 Pct Chg Year Ago 7.7 24.9 1.1 -0.4 4.8 -1.6 -8.1 -7.2 -5.8 Trade, Trans, & Utilities 16.1 15.7 15.7 16.3 16.9 16.9 16.3 16.1 16.0 Pct Chg Year Ago -2.4 -2.0 -0.1 3.6 3.8 0.2 -3.6 -1.3 -0.7 Wholesale Trade 2.3 2.3 2.2 2.3 2.4 2.5 2.5 2.5 2.5 Retail Trade 12.0 11.8 11.8 12.1 12.6 12.7 12.1 11.9 11.7 Trans, Wrhsng, & Util 1.8 1.7 1.8 1.9 1.9 1.8 1.8 1.8 1.8 Information 0.9 0.8 0.7 0.7 0.8 0.7 0.7 0.7 0.7 Pct Chg Year Ago 1.2 -10.7 -15.2 6.2 15.4 -8.8 -3.2 0.1 -1.3 Financial Activities 4.6 4.5 4.7 5.3 5.6 5.6 5.5 5.5 5.4 Pct Chg Year Ago 3.0 -1.9 5.5 12.0 5.4 -0.3 -1.7 -0.4 -0.7 Prof & Business Services 10.9 11.1 10.2 10.3 10.0 9.7 9.2 9.6 10.1 Pct Chg Year Ago -1.0 2.1 -8.8 1.3 -2.8 -3.2 -4.5 3.4 5.5 Educ & Health Services 11.6 9.6 9.7 10.2 10.5 10.9 11.1 11.1 11.1 Pct Chg Year Ago -0.1 -17.0 0.7 5.4 2.7 4.3 2.0 -0.2 0.0 Leisure & Hospitality 14.2 12.9 12.0 13.5 14.6 14.1 13.8 14.0 14.3 Pct Chg Year Ago -0.1 -9.0 -7.3 12.4 8.0 -3.3 -1.7 1.6 1.6 Other Services 2.8 2.7 2.6 2.8 2.9 2.9 3.0 3.1 3.2 Pct Chg Year Ago 0.3 -6.2 -1.6 5.2 3.3 1.8 4.1 3.0 2.5 Federal Government 3.9 3.7 3.9 4.0 4.0 4.2 4.2 4.1 4.1 Pct Chg Year Ago 1.6 -4.4 4.9 2.2 0.7 5.2 0.0 -1.2 -1.6 State & Local Government 10.4 9.8 9.3 9.6 9.7 9.9 9.9 9.9 9.8 Pct Chg Year Ago -0.7 -5.9 -4.5 2.9 0.7 2.5 0.4 -0.6 -0.9 Other Economic Indicators Population (Ths) 203.8 192.2 189.7 194.0 198.2 201.2 203.2 204.7 206.4 Pct Chg Year Ago -0.5 -5.7 -1.3 2.3 2.2 1.5 1.0 0.8 0.8 Labor Force (Ths) 93.3 88.9 87.8 91.2 93.1 94.4 94.1 94.1 94.2 Percent Change, Year Ago -0.3 -4.6 -1.3 3.9 2.1 1.4 -0.3 -0.1 0.1 Unemployment Rate (%) 4.2 3.9 6.5 3.9 2.6 4.1 5.2 5.0 4.7 Total Housing Starts 1500.6 1700.8 1927.2 3094.7 2376.4 1545.6 1370.4 1510.9 1551.6 Single-Family 1104.4 1397.0 1523.9 1766.0 2243.2 1290.7 913.6 916.7 892.0 Multifamily 396.2 303.7 403.4 1328.7 133.2 254.9 456.8 594.2 659.6
2022 Forecast
Short-Term Outlook for Panama City, FL December 2022 Forecast
PANAMA CIT y 104 Florida & Metro Forecast / Winter 2023
2022:4 2023:1 2023:2 2023:3 2023:4 2024:1 2024:2 2024:3 2024:4 2025:1 2025:2 2025:3 2025:4 Personal Income (Billions $) Total Personal Income 10.9 11.0 11.1 11.1 11.3 11.4 11.5 11.7 11.8 12.0 12.1 12.2 12.4 Pct Chg Year Ago 5.1 5.0 4.4 3.3 2.8 3.4 4.1 4.7 4.9 4.8 5.0 5.0 4.9 Wages and Salaries 5.2 5.2 5.2 5.2 5.2 5.3 5.3 5.4 5.4 5.5 5.5 5.6 5.7 Nonwage Income 5.7 5.8 5.8 5.9 6.0 6.1 6.2 6.3 6.4 6.5 6.6 6.6 6.7 Real Personal Income (12$) 9.1 9.1 9.1 9.1 9.1 9.2 9.3 9.3 9.4 9.4 9.5 9.6 9.6 Pct Chg Year Ago -0.6 0.4 1.1 0.4 0.3 1.1 1.8 2.4 2.6 2.7 2.8 2.9 2.9 Per Capita Income (Ths) 54.9 55.1 55.1 55.2 55.7 56.3 56.7 57.3 57.9 58.6 59.2 59.8 60.3 Real Per Capita Income (12$) 45.6 45.5 45.2 45.1 45.2 45.4 45.6 45.8 46.0 46.3 46.5 46.8 47.0 Average Annual Wage (Ths) 57.9 58.1 58.6 59.2 60.0 60.9 61.6 62.3 62.9 63.5 64.1 64.7 65.4 Pct Chg Year Ago 4.0 3.5 2.3 2.7 3.6 4.7 5.0 5.2 4.7 4.4 4.1 3.9 4.0 Establishment Employment (Place of Work, Thousands, SA) Total Employment 87.3 86.9 86.1 85.1 84.5 84.1 83.9 83.9 83.8 83.6 83.6 83.6 83.6 Pct Chg Year Ago 3.5 2.5 2.2 -1.4 -3.3 -3.2 -2.6 -1.4 -0.9 -0.5 -0.4 -0.3 -0.2 Manufacturing 3.6 3.6 3.6 3.6 3.5 3.5 3.4 3.4 3.4 3.4 3.4 3.3 3.3 Pct Chg Year Ago 2.8 4.2 2.8 -1.9 -4.5 -5.1 -4.6 -3.6 -2.2 -2.1 -2.4 -2.3 -2.1 Nonmanufacturing 83.7 83.3 82.5 81.5 81.0 80.6 80.5 80.4 80.4 80.3 80.2 80.2 80.3 Pct Chg Year Ago 3.6 2.4 2.2 -1.4 -3.2 -3.1 -2.5 -1.3 -0.8 -0.5 -0.3 -0.2 -0.1 Construction & Mining 7.5 7.5 7.3 7.0 6.9 6.8 6.6 6.5 6.4 6.3 6.2 6.1 6.0 Pct Chg Year Ago 7.3 6.6 2.3 -6.6 -8.0 -9.1 -8.6 -7.3 -7.5 -7.6 -7.0 -7.1 -7.0 Trade, Trans, & Utilities 17.2 17.1 17.2 16.8 16.7 16.4 16.3 16.3 16.2 16.2 16.1 16.1 16.1 Pct Chg Year Ago 2.7 1.6 2.5 -0.4 -2.9 -4.0 -4.8 -3.2 -2.6 -1.7 -1.4 -1.1 -1.1 Wholesale Trade 2.4 2.5 2.5 2.4 2.5 2.5 2.5 2.5 2.5 2.5 2.5 2.5 2.5 Retail Trade 12.9 12.8 12.9 12.6 12.4 12.2 12.1 12.1 12.0 11.9 11.9 11.9 11.8 Trans, Wrhsng, & Util 1.9 1.8 1.8 1.8 1.8 1.8 1.8 1.8 1.8 1.8 1.8 1.8 1.8 Information 0.8 0.8 0.7 0.7 0.7 0.7 0.7 0.7 0.7 0.7 0.7 0.7 0.7 Pct Chg Year Ago 1.9 -8.9 -12.9 -5.8 -7.3 -5.0 -3.0 -3.3 -1.4 -0.4 -0.3 0.8 0.5 Financial Activities 5.7 5.7 5.6 5.5 5.5 5.5 5.5 5.5 5.5 5.5 5.5 5.5 5.4 Pct Chg Year Ago 1.4 0.0 2.1 -0.4 -2.9 -2.7 -2.5 -0.9 -0.6 -0.3 -0.1 -0.6 -0.8 Prof & Business Services 10.1 10.1 9.8 9.5 9.3 9.2 9.2 9.2 9.3 9.4 9.5 9.6 9.7 Pct Chg Year Ago 2.1 1.6 -1.3 -5.2 -7.9 -8.5 -5.9 -3.0 -0.1 1.9 2.7 3.9 4.9 Educ & Health Services 10.8 10.8 10.9 10.9 11.0 11.1 11.1 11.2 11.1 11.1 11.1 11.1 11.1 Pct Chg Year Ago 5.5 6.2 5.7 3.6 2.0 2.3 2.5 2.0 1.2 0.4 -0.4 -0.6 -0.4 Leisure & Hospitality 14.9 14.5 14.1 13.9 13.8 13.8 13.8 13.8 13.9 14.0 14.0 14.1 14.1 Pct Chg Year Ago 5.3 0.4 -0.7 -5.7 -7.1 -4.7 -2.5 -0.4 0.9 1.2 2.0 1.7 1.3 Other Services 2.9 2.9 2.9 2.9 2.9 3.0 3.0 3.0 3.1 3.1 3.1 3.1 3.1 Pct Chg Year Ago 1.2 2.4 2.0 1.1 1.7 3.0 5.0 4.6 3.8 3.4 3.0 2.9 2.8 Federal Government 4.1 4.1 4.2 4.2 4.2 4.2 4.2 4.2 4.2 4.2 4.1 4.1 4.1 Pct Chg Year Ago 0.9 3.7 8.7 5.6 3.0 1.2 -0.3 -0.4 -0.5 -0.7 -1.2 -1.5 -1.6 State & Local Government 9.8 9.9 9.9 9.9 9.9 9.9 10.0 10.0 9.9 9.9 9.9 9.9 9.9 Pct Chg Year Ago 2.4 2.7 4.4 1.7 1.1 0.9 0.7 0.3 -0.1 -0.3 -0.6 -0.8 -0.7 Other Economic Indicators Population (Ths) 199.5 200.3 201.0 201.6 202.1 202.6 203.0 203.4 203.8 204.2 204.6 204.9 205.3 Pct Chg Year Ago 2.0 1.8 1.6 1.5 1.3 1.2 1.0 0.9 0.8 0.8 0.8 0.7 0.7 Labor Force (Ths) 93.9 94.3 94.5 94.5 94.4 94.2 94.1 94.1 94.1 94.0 94.0 94.1 94.1 Pct Chg Year Ago 2.4 2.0 1.8 1.2 0.5 0.0 -0.4 -0.4 -0.3 -0.2 -0.1 0.0 0.0 Unemployment Rate (%) 2.6 3.1 3.8 4.5 5.0 5.2 5.2 5.2 5.2 5.1 5.1 5.0 4.9 Total Housing Starts 2250.4 1849.4 1576.4 1423.5 1333.1 1325.3 1327.6 1380.1 1448.7 1484.9 1511.5 1517.4 1529.7 Single-Family 2069.3 1643.4 1341.2 1153.2 1024.9 940.5 898.8 893.8 921.3 924.1 922.3 910.7 909.6 Multifamily 181.1 206.0 235.2 270.3 308.2 384.7 428.8 486.2 527.4 560.8 589.2 606.7 620.1
PROFILES
The Pensacola–Ferry Pass–Brent MSA is comprised of Escambia County and Santa Rosa County. Located in the northwest corner of Florida bordering Alabama, the region is home to the Pensacola Naval Air Station, Blue Angels, and the National Museum of Naval Aviation. This area has been referred to as the “Cradle of Naval Aviation.”
QUICK FACTS
• Metro population estimate of 488,246 as of 2019 (5-Year Estimate) (U.S. Census Bureau).
• Escambia County population estimate of 318,316 as of 2019 (5-Year Estimate) (U.S. Census Bureau).
• Santa Rosa County population estimate of 184,313 as of 2019 (5-Year Estimate) (U.S. Census Bureau).
• Civilian labor force of 239,581 in November 2022 (Florida Research and Economic Database).
• An unemployment rate of 2.6% as of November 2022, not seasonally adjusted. This amounts to 6,250 unemployed people (Florida Research and Economic Database).
OUTLOOK SUMMARIES
The Pensacola—Ferry Pass—Brent Metropolitan Statistical Area (MSA) will experience average levels of economic growth in the studied indicators. Gross Metro Product will be $20,980.60. Average annual wage growth will be 3.5 percent, leading to an average annual wage of $66,100. Personal income growth will be 4.2 percent, placing the per capita income level at $47,600. Pensacola’s population will grow by an average rate of 1.0%. Employment growth in the MSA will fall by 0.2 percent, and the unemployment rate will be 4.5 percent. The Financial Service sector will be the fastest growing sector in Pensacola with a 3.2 percent average annual growth rate. The Other Services sector will grow at the second-fastest rate in the MSA at 2.1 percent. The Education and Health Services sector will place third at
1.7 percent average annual growth. The Construction and Mining Sector is expected to experience a contraction of -4.0%.
METRO NEWS SUMMARIES
Port of Pensacola seeks $53 million from Triumph Gulf Coast to upgrade and redevelop port
• Port Director Clark Merritt told the City Council in September that the city submitted a pre-application to Triumph Gulf Coast, the organization set up by the state to award BP oil spill settlement funds to economic development projects in the eight counties impacted by the spill.
• The application calls for upgrading and improving the port’s infrastructure such as ship berths, roads and cargo facilities, as well as moving the port’s security perimeter to allow for the redevelopment of the northern section of the port.
• Merritt said the Port of Pensacola has seen a 68% increase in vessel traffic and a 150% increase in the amount of cargo moving through the port in the last three years.
Source: Pensacola News Journal, September 13, 2022
Pensacola law firm gives $2.5 million to new UWF leadership center
• The Aylstock, Witkin, Kreis & Overholtz law firm gave a $2.5 million check to UWF at a Tuesday ceremony, creating the Aylstock, Witkin, Kreis & Overholtz Center for Leadership housed within the university’s College of Business.
• The center was established this spring with the hiring of a leadership staff headed by the center’s new director, retired U.S. Navy Capt. Tim Kinsella, the former commanding officer of Naval Air Station Pensacola.
• The center plans to launch academic offerings to students and professional development seminars to business executives as early as fall 2023.
Source: Pensacola News Journal, September 21, 2022
P ENSACOLA – F ERR y P ASS – B RENT Institute for Economic Forecasting 105
Expansion project planned for Pensacola International Airport
• As the Pensacola International Airport breaks records when it comes to the number of travelers, city and airport officials say it’s time to expand the airport. “We look at numbers, roughly, the population of Pensacola going through the airport every eight days and that has its wear and tear,” Airport Director Matt Coughlin said.
• The terminal’s last expansion was in 2011. Since 2017, the airport saw record numbers of travelers until the pandemic in 2020. Now, numbers are climbing again which means another expansion is being proposed.
• The $70 million plan includes a larger security area and five new gates added to the 12 the airport already has. This will increase the airport’s capacity by 50 percent, according to Coughlin.
Source: WKRG, October 24, 2022
FloridaWest has a new, 5-year strategy for bringing jobs to Pensacola
• FloridaWest unveiled its new five-year strategic plan Tuesday at the Studer Community Institute building in downtown Pensacola. The new plan was developed in partnership with the PensacolaEscambia Development Commission, Escambia County and the city of Pensacola.
• The three main goals of the plan are to support new business recruitment, increase business retention and expansion, and support innovation and entrepreneurship in the community.
• The plan also recommends focusing on three types of industries to target for recruitment, with the top one being information technology and cybersecurity, followed by aerospace and defense firms, and finally, manufacturing and chemical production companies.
Source: Pensacola News Journal, October 26, 2022
Great Gulfcoast Arts Festival brings economic impact to Downtown Pensacola
• In October the 50th Annual Great Gulfcoast Arts Festival returned to Pensacola with over 200 vendors this year. To participate in the festival, artists must be selected by a jury panel.
• “It’s definitely a high-quality festival, people come from all over the United States to exhibit their work and it definitely draws the top-notch artists out here -- as you look around it’s really quality work,” Artist Jessica Ladd said.
• The event is the second largest economic event in the area, with artists helping out the local economy by eating out and experiencing the local flavors of Pensacola while staying for the weekend.
Source: WKRG 5, November 4, 2022
$110M Community Maritime Park apartment project deemed ‘financially infeasible’
• As inflation and other economic woes threaten individuals, a planned $110 million dollar development in downtown Pensacola is now currently being deemed financially infeasible under current market conditions.
• Inspired Communities of Florida sent a letter to the city of Pensacola on Monday notifying the city that its proposed project for lots 4 and 5 at Community Maritime Park had become “financially infeasible” and asked the city to consider extending its lease option until the market conditions improve.
• The developer, along with its partner EJ Smith Enterprises, owned by famed NFL running back and Pensacola native Emmitt Smith, had proposed to build up to 600 apartment units, a 900-space parking garage and up to 50,000 square feet of retail space on the two key Maritime Park lots.
Source: Pensacola News Journal, November 8, 2022
P ENSACOLA – F ERR y P ASS – B RENT 106 Florida & Metro Forecast / Winter 2023
Pensacola - Ferry Pass - Brent MSA
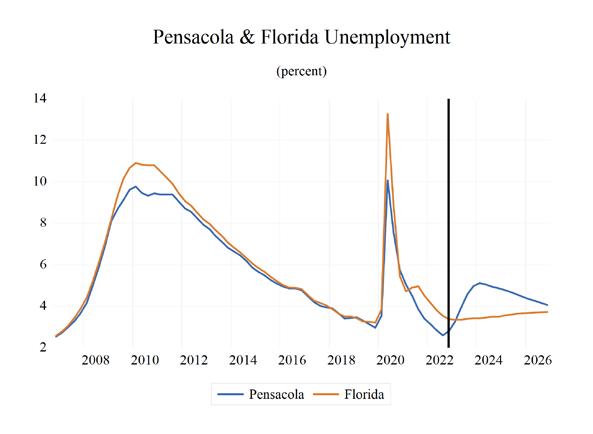
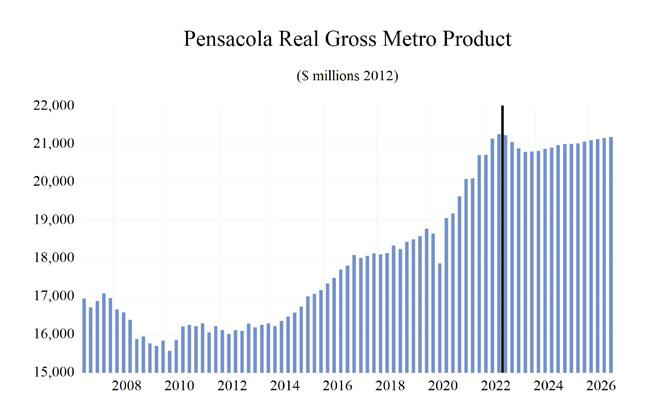
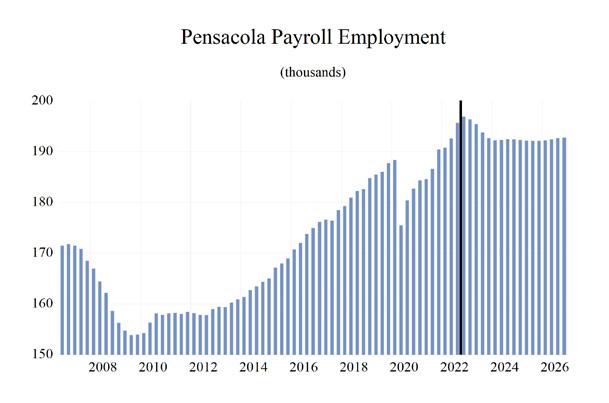
Industry Location Quotients
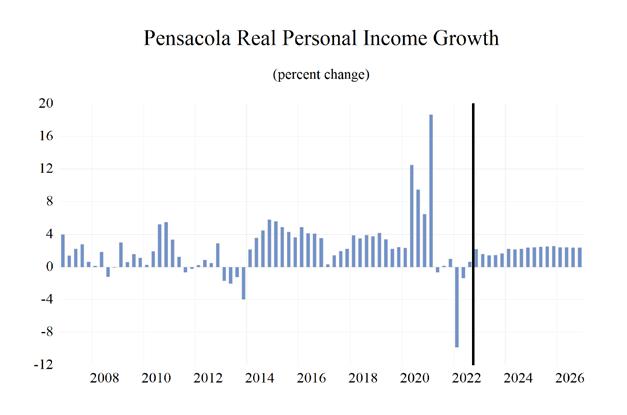
P ENSACOLA – F ERR y P ASS – B RENT Institute for Economic Forecasting 107 0 0.2 0.4 0.6 0.8 1 1.2 1.4 Total Nonagricultural Employment Total Private Goods Producing Service Producing Private Service Providing Mining, Logging, and Construction Manufacturing Trade, Transportation, and Utilities Wholesale Trade Retail Trade Transportation, Warehousing, and Utilities Information Financial Activities Professional and Business Services Educational and Health Services Leisure and Hospitality Other Services Government
Long-Term Outlook for Pensacola-Ferry Pass-Brent, FL December 2022 Forecast
P ENSACOLA – F ERR y P ASS – B RENT 108 Florida & Metro Forecast / Winter 2023
2018 2019 2020 2021 2022 2023 2024 2025 2026 Personal Income (Billions $) Total Personal Income 21.6 23.1 24.9 27.1 28.3 29.5 30.7 32.1 33.4 Pct Chg Year Ago 3.6 6.6 7.9 9.0 4.4 4.1 4.0 4.6 4.2 Wages and Salaries 9.4 10.0 10.4 11.4 12.8 13.1 13.5 13.9 14.4 Nonwage Income 12.2 13.0 14.4 15.7 15.6 16.4 17.2 18.2 19.0 Real Personal Income (12$) 21.0 22.4 23.9 25.0 24.5 24.7 25.1 25.8 26.3 Pct Chg Year Ago 3.5 6.5 6.8 4.5 -1.8 0.8 1.7 2.5 2.2 Per Capita Income (Ths) 43.6 45.7 48.6 52.5 54.4 55.9 57.5 59.6 61.7 Real Per Capita Income (12$) 42.3 44.3 46.6 48.3 47.1 46.9 47.1 47.9 48.6 Average Annual Wage (Ths) 48.3 50.1 53.3 56.6 60.7 62.3 65.1 67.4 69.8 Pct Chg Year Ago 2.2 3.8 6.3 6.2 7.4 2.6 4.5 3.5 3.5 Establishment Employment (Place of Work, Thousands, SA) Total Employment 181.2 186.0 181.7 186.4 194.0 194.5 192.3 192.1 192.5 Pct Chg Year Ago 2.4 2.6 -2.3 2.6 4.0 0.3 -1.1 -0.1 0.2 Manufacturing 6.5 7.1 6.9 7.2 7.3 7.2 6.7 6.4 6.4 Pct Chg Year Ago 5.2 9.7 -2.3 4.1 0.9 -0.7 -7.9 -3.2 -1.0 Nonmanufacturing 174.8 178.9 174.8 179.2 186.7 187.3 185.7 185.7 186.1 Pct Chg Year Ago 2.4 2.4 -2.3 2.5 4.2 0.3 -0.9 0.0 0.2 Construction & Mining 11.7 12.2 12.0 12.7 13.3 13.3 12.4 11.8 11.3 Pct Chg Year Ago 1.7 4.3 -1.3 5.3 5.3 -0.2 -6.6 -5.2 -3.9 Trade, Trans, & Utilities 33.6 33.8 33.5 34.7 36.3 35.1 34.1 33.9 34.0 Pct Chg Year Ago 1.4 0.4 -0.8 3.7 4.6 -3.4 -2.7 -0.5 0.1 Wholesale Trade 5.7 5.7 5.7 6.0 6.3 6.5 6.5 6.5 6.5 Retail Trade 23.8 23.8 23.5 24.1 25.3 24.1 23.1 22.9 22.9 Trans, Wrhsng, & Util 4.2 4.3 4.3 4.6 4.7 4.5 4.5 4.5 4.5 Information 1.8 1.7 1.5 1.5 1.6 1.5 1.5 1.5 1.5 Pct Chg Year Ago -8.1 -4.7 -9.5 0.8 3.7 -3.8 -2.8 -0.3 -2.4 Financial Activities 14.0 14.9 15.2 15.3 16.3 17.3 17.8 18.1 18.5 Pct Chg Year Ago 8.4 6.3 1.8 0.9 6.6 5.9 3.0 1.8 2.1 Prof & Business Services 24.3 24.4 24.5 25.7 27.4 26.7 24.8 24.9 25.0 Pct Chg Year Ago 6.9 0.5 0.5 5.1 6.6 -2.9 -7.1 0.7 0.3 Educ & Health Services 30.2 31.0 30.5 30.8 31.7 33.3 34.1 34.0 34.0 Pct Chg Year Ago 0.8 2.8 -1.6 0.8 3.1 5.1 2.4 -0.4 -0.1 Leisure & Hospitality 24.6 25.8 22.8 24.1 25.6 25.1 25.6 25.9 26.3 Pct Chg Year Ago 1.8 4.9 -11.7 5.8 6.4 -2.0 2.1 1.1 1.3 Other Services 6.3 6.6 6.5 6.9 7.2 7.3 7.5 7.7 7.8 Pct Chg Year Ago 2.2 4.1 -0.5 5.3 3.8 2.5 2.3 2.1 1.5 Federal Government 6.6 6.6 6.8 6.7 6.7 7.0 6.9 6.8 6.6 Pct Chg Year Ago -0.6 1.1 2.8 -1.3 0.0 4.1 -1.0 -2.1 -2.3 State & Local Government 21.8 22.0 21.5 20.8 20.4 20.7 20.9 21.1 21.2 Pct Chg Year Ago 0.4 0.8 -2.3 -3.1 -1.7 1.1 1.0 1.0 0.8 Other Economic Indicators Population (Ths) 496.2 504.6 511.9 516.6 520.6 527.1 533.2 537.9 541.7 Pct Chg Year Ago 1.5 1.7 1.4 0.9 0.8 1.2 1.2 0.9 0.7 Labor Force (Ths) 222.7 226.7 226.6 230.6 236.8 240.5 240.1 240.2 240.5 Percent Change, Year Ago 1.4 1.8 0.0 1.8 2.7 1.5 -0.2 0.0 0.1 Unemployment Rate (%) 3.6 3.2 6.7 4.2 2.8 4.2 5.0 4.6 4.2 Total Housing Starts 2481.6 3312.0 4097.0 3507.8 3569.5 2441.4 2276.5 2400.6 2424.1 Single-Family 2448.4 2778.2 3884.5 3110.5 3271.8 2297.4 2150.3 2239.1 2208.6 Multifamily 33.2 533.7 212.5 397.3 297.6 144.0 126.2 161.5 215.4
Short-Term Outlook for Pensacola-Ferry Pass-Brent, FL December 2022 Forecast
P ENSACOLA – F ERR y P ASS – B RENT Institute for Economic Forecasting 109
2022:4 2023:1 2023:2 2023:3 2023:4 2024:1 2024:2 2024:3 2024:4 2025:1 2025:2 2025:3 2025:4 Personal Income (Billions $) Total Personal Income 28.9 29.2 29.3 29.5 29.8 30.2 30.5 30.8 31.2 31.6 31.9 32.3 32.6 Pct Chg Year Ago 5.8 5.9 4.2 3.4 3.0 3.2 3.9 4.4 4.7 4.7 4.7 4.6 4.5 Wages and Salaries 13.1 13.1 13.1 13.1 13.1 13.3 13.4 13.6 13.7 13.8 13.9 14.0 14.1 Nonwage Income 15.9 16.2 16.3 16.5 16.7 16.9 17.1 17.3 17.5 17.8 18.1 18.3 18.5 Real Personal Income (12$) 24.6 24.7 24.7 24.7 24.8 24.9 25.1 25.2 25.4 25.5 25.7 25.8 26.0 Pct Chg Year Ago 0.1 1.2 0.9 0.5 0.5 0.9 1.5 2.1 2.4 2.5 2.5 2.5 2.5 Per Capita Income (Ths) 55.4 55.7 55.8 56.0 56.3 56.8 57.2 57.8 58.3 58.9 59.4 59.9 60.4 Real Per Capita Income (12$) 47.1 47.0 46.9 46.8 46.8 46.9 47.0 47.2 47.4 47.6 47.8 48.0 48.2 Average Annual Wage (Ths) 61.3 61.5 61.9 62.5 63.3 64.1 64.8 65.5 66.0 66.6 67.1 67.7 68.3 Pct Chg Year Ago 4.0 3.0 1.9 2.2 3.1 4.2 4.6 4.8 4.4 4.0 3.6 3.3 3.4 Establishment Employment (Place of Work, Thousands, SA) Total Employment 196.9 196.3 195.4 193.8 192.6 192.2 192.3 192.4 192.4 192.2 192.1 192.1 192.1 Pct Chg Year Ago 3.4 2.9 1.5 -1.0 -2.2 -2.1 -1.6 -0.7 -0.1 0.0 -0.1 -0.2 -0.1 Manufacturing 7.4 7.4 7.4 7.2 6.9 6.8 6.7 6.6 6.5 6.5 6.5 6.4 6.4 Pct Chg Year Ago 2.6 4.2 2.1 -2.2 -6.5 -8.2 -9.0 -8.1 -6.0 -4.5 -3.6 -2.7 -2.0 Nonmanufacturing 189.4 189.0 188.0 186.6 185.7 185.4 185.6 185.8 185.8 185.8 185.7 185.7 185.7 Pct Chg Year Ago 3.4 2.9 1.4 -0.9 -2.0 -1.9 -1.3 -0.4 0.1 0.2 0.1 -0.1 -0.1 Construction & Mining 13.8 13.7 13.4 13.1 12.9 12.7 12.5 12.3 12.2 12.0 11.9 11.7 11.6 Pct Chg Year Ago 8.3 7.0 3.6 -4.3 -6.2 -7.5 -7.2 -5.9 -5.9 -5.6 -5.1 -5.1 -5.0 Trade, Trans, & Utilities 36.1 35.6 35.5 34.8 34.5 34.3 34.1 34.1 34.0 34.0 33.9 34.0 33.9 Pct Chg Year Ago 1.1 -2.4 -2.6 -4.2 -4.6 -3.7 -4.1 -2.0 -1.3 -1.0 -0.4 -0.3 -0.3 Wholesale Trade 6.4 6.5 6.5 6.5 6.5 6.5 6.5 6.5 6.5 6.5 6.5 6.5 6.5 Retail Trade 25.1 24.6 24.5 23.8 23.5 23.3 23.0 23.0 23.0 22.9 22.9 22.9 22.9 Trans, Wrhsng, & Util 4.6 4.6 4.5 4.5 4.5 4.5 4.5 4.5 4.5 4.5 4.5 4.5 4.5 Information 1.6 1.6 1.5 1.5 1.5 1.5 1.5 1.5 1.5 1.5 1.5 1.5 1.5 Pct Chg Year Ago 0.5 -2.3 -4.0 -3.3 -5.6 -4.2 -3.0 -3.1 -1.0 -0.2 -0.4 0.0 -0.7 Financial Activities 16.7 17.1 17.3 17.3 17.5 17.6 17.8 17.8 17.9 18.0 18.1 18.1 18.2 Pct Chg Year Ago 6.2 6.0 6.9 6.1 4.4 3.1 3.0 3.3 2.7 2.2 1.7 1.7 1.7 Prof & Business Services 28.3 28.2 27.1 26.1 25.2 24.8 24.7 24.7 24.7 24.9 24.9 25.0 25.0 Pct Chg Year Ago 5.1 8.2 -0.1 -7.8 -10.9 -12.1 -8.8 -5.0 -1.8 0.1 0.7 0.9 1.1 Educ & Health Services 32.6 32.8 33.2 33.6 33.8 34.0 34.2 34.2 34.1 34.1 34.0 34.0 33.9 Pct Chg Year Ago 5.2 6.1 5.6 5.0 3.7 3.6 3.1 2.0 1.1 0.2 -0.6 -0.7 -0.5 Leisure & Hospitality 25.6 25.0 25.0 25.3 25.2 25.2 25.6 25.8 25.9 25.9 25.9 25.9 26.0 Pct Chg Year Ago 2.4 -1.0 -2.9 -2.4 -1.7 0.8 2.5 2.1 2.9 2.6 1.3 0.4 0.1 Other Services 7.3 7.3 7.3 7.3 7.4 7.4 7.5 7.5 7.6 7.6 7.6 7.7 7.7 Pct Chg Year Ago 6.5 5.9 2.8 0.7 0.6 1.4 2.8 2.8 2.4 2.3 2.2 2.0 1.9 Federal Government 6.8 6.9 7.0 7.0 7.0 7.0 6.9 6.9 6.9 6.8 6.8 6.8 6.7 Pct Chg Year Ago 1.3 3.8 6.1 4.5 2.1 0.3 -1.2 -1.5 -1.5 -1.8 -2.1 -2.2 -2.3 State & Local Government 20.5 20.6 20.7 20.7 20.7 20.8 20.8 20.9 21.0 21.0 21.1 21.1 21.1 Pct Chg Year Ago -1.1 -0.5 2.4 1.6 1.1 1.1 0.8 1.1 1.0 1.1 1.1 0.9 0.9 Other Economic Indicators Population (Ths) 522.7 524.6 526.2 527.9 529.6 531.1 532.6 534.0 535.2 536.3 537.4 538.4 539.5 Pct Chg Year Ago 0.9 1.1 1.2 1.3 1.3 1.2 1.2 1.1 1.1 1.0 0.9 0.8 0.8 Labor Force (Ths) 239.0 239.9 240.6 240.7 240.6 240.3 240.1 240.0 240.0 240.0 240.1 240.3 240.3 Pct Chg Year Ago 2.4 2.2 1.9 1.4 0.7 0.2 -0.2 -0.3 -0.2 -0.1 0.0 0.1 0.1 Unemployment Rate (%) 2.8 3.2 3.9 4.6 5.0 5.1 5.0 4.9 4.9 4.8 4.7 4.6 4.5 Total Housing Starts 3110.9 2720.1 2470.6 2340.1 2234.7 2204.2 2277.1 2268.4 2356.4 2382.2 2401.1 2404.0 2415.1 Single-Family 2906.7 2548.6 2319.0 2213.8 2108.1 2071.3 2141.4 2157.9 2230.5 2243.0 2249.3 2229.6 2234.7 Multifamily 204.1 171.5 151.7 126.3 126.6 132.8 135.7 110.5 125.8 139.2 151.9 174.5 180.4
PROFILES
The Port St. Lucie MSA is a city on the Atlantic coast of southern Florida. Located in St. Lucie County, this municipality is the most populous in the county. Known for its Botanical Gardens and the waterways of the North Fork St. Lucie Aquatic Preserve which are home to manatees, river otters, egrets and alligators.
QUICK FACTS
• Metro population estimate of 472,012 as of 2019 (5-Year Estimate) (U.S. Census Bureau).
• Martin County population estimate of 159,065 as of 2019 (5-Year Estimate) (U.S. Census Bureau).
• St. Lucie County population estimate of 312,947 as of 2019 (5-Year Estimate) (U.S. Census Bureau).
• Civilian labor force of 233,300 in November 2022 (Florida Research and Economic Database).
• An unemployment rate of 2.8% as of November 2022, not seasonally adjusted. This amounts to 6,569 unemployed people (Florida Research and Economic Database).
OUTLOOK SUMMARIES
The Port St. Lucie Metropolitan Statistical Area (MSA) is expected to show slightly below average levels of growth in its economic indicators. Port St. Lucie’s Gross Metro Product will be $17,809.23. Average annual wage growth of 3.2 percent will lead to an average annual wage of $62,200, ranking 20th in the state. Personal incomes will grow by 4.6 percent. This will lead to a per capita income level of $57,700, the 4th highest in the state. Population growth will average 1.2 percent.
Employment growth is expected to average a rate of 0.3 percent annually. The unemployment rate is estimated to average 5.5 percent.
The Other Service sector will lead Port St. Lucie at an average annual growth rate of 3.4 percent. The Education and Health Services sector and the Financial Services sector will expand at 2.2 percent each.
METRO NEWS SUMMARIES
Florida homeowners hit with higher insurance costs as property values rise
• Across South Florida and the Treasure Coast, property values are skyrocketing. It’s great news for homeowners gaining equity in their homes, but some are realizing that in addition to insurance rate hikes, coverage to replace their homes is going up too.
• “I did receive a notice from the property appraiser that the value of my property went up $40,000, and my homeowner’s insurance celebrated with charging me $800 more,” says Martin Jacobson, a St. Lucie resident. Jacobson, like many others, are experiencing higher home insurance prices due to rapid home price increases.
• “As the homes, the rebuild cost or the replacement cost increases, so does the insurance price,” Robert Norberg, president of Arden Insurance in Lantana, said. Norberg said some homeowners who have paid off their mortgages are considering dropping coverage altogether or tweaking it.
Source: WPTV, September 9, 2022
Altitude International secures world-class property for global headquarters in Port St. Lucie
• Altitude International Holdings has announced a newly formed wholly owned subsidiary, Altitude Hospitality, which is taking over the 216-acre Port St. Lucie property formerly known as Club Med Sandpiper Bay.
• The resort will operate under its new name, Sandpiper Bay Resort. The property will serve as the global headquarters for Altitude International Holdings and its wholly owned subsidiaries.
• The ramp-up for an extensive renovation is underway with expected completion over the next two years to the 200 acres of property that features a 335-room waterfront hotel, an onsite golf course and driving range, tennis and
PORT ST. LUCIE 110 Florida & Metro Forecast / Winter 2023
pickleball courts, volleyball courts, a marina, and all the amenities of a full-service resort. The resort will remain open throughout the renovation process.
Source: WQCS, September 13, 2022
Port St. Lucie, FL will be among the fastest growing cities by 2060
• Results from the 2020 census reveal some notable changes in population distribution over the last decade.
• The population of the Port St. Lucie metro area in Florida is projected to grow from 511,300 in 2022 to 920,600 in 2060. The 80.1% projected population growth in the metro area is the 10th highest of all 384 U.S. metro areas.
• Economic opportunity is one of the most common reasons people move within the United States. Over the same period, employment in Port St. Lucie is projected to grow by 110.3% by 2060, while personal income per capita is projected to grow from $67,863 in 2022 to $375,760 in 2060.
Source: The Center Square, September 16, 2022
Lerner Enterprises purchases Parc at Gatlin Commons Apartments in Port St. Lucie, Florida for $65M
• Lerner Enterprises, a Rockville, Md.-based multifamily developer and manager owned by Washington Nationals’ principal owner Mark Lerner, has purchased Parc at Gatlin Commons, a 200-unit apartment community in Port St. Lucie.
• The community is located on a 14.4-acre site at 1900 Aledo Lane in Port St. Lucie’s Newport Isles neighborhood. Rental rates range from $1,800 to $2,970, according to Rosewood Realty.
• Miami-based JSB Capital sold the property to Lerner for $65 million
Source: Rebusiness Online, November 16, 2022
King’s Landing: population growth on Treasure Coast leads new development St. Lucie County
• The massive $155 million King’s Landing development is slated to become a waterfront destination in Fort Pierce, featuring plenty for those who live and visit St. Lucie Countyincluding the first two rooftop bars on the entire Treasure Coast.
• The piles of rubble will eventually become more than a hundred homes, a Marriott hotel, multiple restaurants and more than 50,000 square feet of retail space in Fort Pierce all to accommodate the population explosion in the region.
• Dale Matteson is the CEO of the company developing King’s Landing, Audubon Development. He says the project will be a huge boost to the area needing to keep up with that growth. “It’s going to be a real shot in the arm for Fort Pierce, St. Lucie County,” Matteson said. “We’ll employ about 350 people. It’ll be a $5 million annual economic boost to the city.”
Source: 12 News, November 18th 2022
ACRE announces launch of leasing at ‘Havens at Central Park’ in Port St. Lucie, Fla.
• ACRE, a global real estate private equity firm, announced it has officially begun leasing at Havens at Central Park, a high-quality, 158-unit single-family build-to-rent (BTR) development located in Port St. Lucie, Florida.
• Located 15 miles south of Fort Pierce within Verano - a newly developed, master-planned community - Havens at Central Park will feature a mix of one-, two- and three-bedroom residences, with an average size of 949 square feet.
• The project is being developed in partnership with Fort Lauderdale-based Stellar Communities. With construction underway, Havens at Central Park is scheduled to officially open in late Spring 2023.
Source: Business Wire, December 1, 2022
PORT ST. LUCIE Institute for Economic Forecasting 111
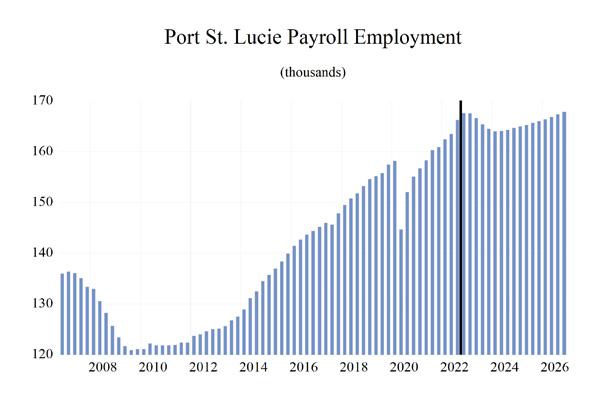
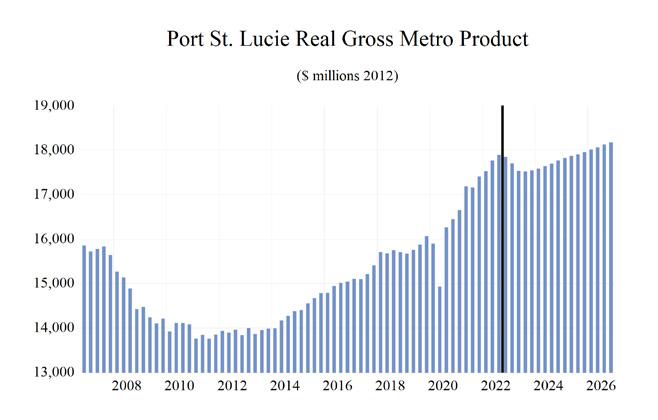
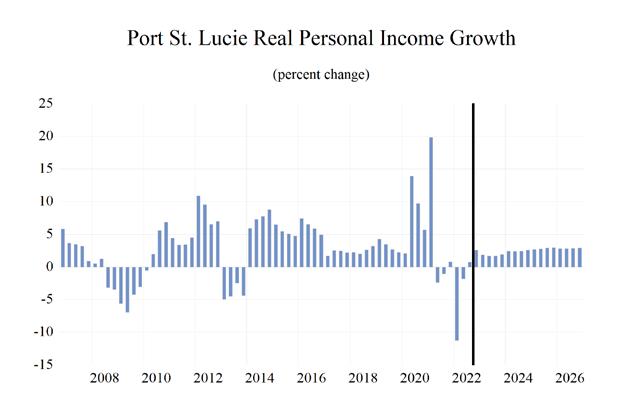

PORT ST. LUCIE 112 Florida & Metro Forecast / Winter 2023 0 0.2 0.4 0.6 0.8 1 1.2 1.4 1.6 Total Nonagricultural Employment Total Private Goods Producing Service Producing Private Service Providing Mining, Logging, and Construc�on Manufacturing Trade, Transporta�on, and U�li�es Wholesale Trade Retail Trade Transporta�on, Warehousing, and U�li�es Informa�on Financial Ac�vi�es Professional and Business Services Educa�onal and Health Services Leisure and Hospitality Other Services Government Port St. Lucie MSA Industry Loca�on Quo�ents
Long-Term Outlook for Port St. Lucie, FL December 2022 Forecast
PORT ST. LUCIE Institute for Economic Forecasting 113
2018 2019 2020 2021 2022 2023 2024 2025 2026 Personal Income (Billions $) Total Personal Income 26.5 28.6 30.2 33.6 34.7 36.3 37.8 39.8 41.6 Pct Chg Year Ago 4.8 7.8 5.7 11.0 3.5 4.7 4.1 5.3 4.5 Wages and Salaries 6.9 7.3 7.6 8.6 9.5 9.8 10.1 10.5 11.0 Nonwage Income 19.6 21.2 22.6 25.0 25.2 26.5 27.7 29.3 30.7 Real Personal Income (12$) 24.5 27.1 28.3 30.1 29.3 29.7 30.3 31.2 32.0 Pct Chg Year Ago 3.1 10.3 4.5 6.4 -2.7 1.4 1.8 3.1 2.5 Per Capita Income (Ths) 56.0 59.4 61.5 66.5 67.2 69.2 71.2 74.3 76.8 Real Per Capita Income (12$) 51.8 56.3 57.6 59.7 56.8 56.6 57.0 58.2 59.0 Average Annual Wage (Ths) 45.3 46.8 49.8 53.5 57.5 58.9 61.5 63.3 65.2 Pct Chg Year Ago 2.3 3.3 6.4 7.4 7.5 2.4 4.3 3.1 3.0 Establishment Employment (Place of Work, Thousands, SA) Total Employment 151.3 155.7 152.5 159.0 164.9 166.0 164.2 165.4 167.1 Pct Chg Year Ago 3.5 2.9 -2.1 4.3 3.7 0.6 -1.0 0.7 1.0 Manufacturing 7.0 7.5 7.4 7.7 8.0 8.0 7.4 7.3 7.3 Pct Chg Year Ago 2.5 8.3 -1.7 3.7 4.9 -1.0 -6.7 -1.7 0.5 Nonmanufacturing 144.3 148.2 145.1 151.4 156.9 158.0 156.8 158.1 159.7 Pct Chg Year Ago 3.6 2.7 -2.1 4.3 3.6 0.7 -0.8 0.8 1.0 Construction & Mining 11.3 12.0 12.3 12.6 12.6 12.7 12.2 11.9 11.8 Pct Chg Year Ago 10.6 5.9 2.3 2.9 -0.2 0.7 -3.7 -2.7 -1.0 Trade, Trans, & Utilities 31.2 31.0 31.3 32.7 33.3 32.2 31.2 31.1 31.3 Pct Chg Year Ago 0.7 -0.6 0.8 4.6 1.7 -3.3 -3.2 -0.1 0.5 Wholesale Trade 5.1 5.2 5.0 4.8 4.9 5.3 5.4 5.5 5.5 Retail Trade 21.5 21.2 20.9 21.9 22.2 20.9 19.7 19.6 19.7 Trans, Wrhsng, & Util 4.6 4.6 5.3 6.0 6.2 6.0 6.1 6.0 6.0 Information 1.2 1.2 1.1 1.2 1.2 1.2 1.2 1.2 1.2 Pct Chg Year Ago -5.2 -1.4 -9.1 6.8 3.1 -1.0 -1.1 0.6 -1.6 Financial Activities 5.5 5.9 6.0 6.2 6.4 6.7 6.9 6.9 7.0 Pct Chg Year Ago -0.6 7.1 1.7 2.5 3.4 4.9 2.1 1.1 0.5 Prof & Business Services 19.2 20.7 22.0 23.1 24.3 24.1 23.3 24.0 24.6 Pct Chg Year Ago 9.0 8.1 5.9 5.4 5.1 -0.8 -3.4 2.9 2.7 Educ & Health Services 27.6 28.6 27.8 28.2 29.2 30.9 31.9 31.9 31.9 Pct Chg Year Ago 2.8 3.7 -2.8 1.7 3.5 5.7 3.1 0.0 0.2 Leisure & Hospitality 20.5 20.9 18.0 20.2 21.8 21.2 20.7 21.1 21.6 Pct Chg Year Ago 6.0 2.3 -14.1 12.5 7.9 -2.8 -2.6 2.2 2.1 Other Services 8.2 8.0 7.6 8.0 8.5 8.8 9.2 9.5 9.7 Pct Chg Year Ago 2.3 -2.1 -5.6 6.1 6.3 3.6 4.0 3.3 2.5 Federal Government 1.0 1.0 1.1 1.0 1.0 1.0 1.0 1.0 1.0 Pct Chg Year Ago 0.0 2.5 4.8 -6.6 0.0 0.7 -1.9 -0.1 -0.1 State & Local Government 18.6 18.7 18.0 18.0 18.5 19.1 19.4 19.5 19.6 Pct Chg Year Ago 0.7 0.6 -3.8 0.0 2.6 3.6 1.1 0.8 0.6 Other Economic Indicators Population (Ths) 473.5 481.3 491.7 504.8 516.5 525.3 531.0 536.3 542.3 Pct Chg Year Ago 1.5 1.6 2.2 2.7 2.3 1.7 1.1 1.0 1.1 Labor Force (Ths) 213.9 218.0 218.3 223.8 229.2 234.0 233.7 233.5 233.7 Percent Change, Year Ago 2.0 1.9 0.1 2.5 2.4 2.1 -0.1 -0.1 0.1 Unemployment Rate (%) 4.3 3.8 7.8 4.5 3.1 4.8 6.1 5.8 5.4 Total Housing Starts 3576.5 4081.3 4940.6 7644.9 7703.5 4862.2 3849.1 4039.2 4049.8 Single-Family 2790.9 3565.1 4590.7 6234.6 5194.9 3333.1 3065.4 3149.0 3061.7 Multifamily 785.5 516.2 350.0 1410.2 2508.6 1529.1 783.7 890.2 988.2
Short-Term Outlook for Port St. Lucie, FL December 2022 Forecast
PORT ST. LUCIE 114 Florida & Metro Forecast / Winter 2023
2022:4 2023:1 2023:2 2023:3 2023:4 2024:1 2024:2 2024:3 2024:4 2025:1 2025:2 2025:3 2025:4 Personal Income (Billions $) Total Personal Income 35.5 36.0 36.2 36.4 36.8 37.2 37.6 38.0 38.5 39.1 39.6 40.1 40.5 Pct Chg Year Ago 6.1 6.3 5.0 4.1 3.4 3.3 3.9 4.4 4.9 5.1 5.5 5.4 5.1 Wages and Salaries 9.8 9.8 9.8 9.8 9.9 10.0 10.1 10.2 10.3 10.4 10.5 10.6 10.7 Nonwage Income 25.8 26.2 26.3 26.6 26.9 27.2 27.5 27.8 28.2 28.7 29.1 29.5 29.8 Real Personal Income (12$) 29.5 29.7 29.7 29.7 29.8 30.0 30.1 30.3 30.6 30.9 31.1 31.3 31.5 Pct Chg Year Ago 0.3 1.6 1.7 1.2 1.0 1.0 1.5 2.1 2.6 3.0 3.2 3.2 3.1 Per Capita Income (Ths) 68.3 68.9 68.9 69.2 69.7 70.3 70.8 71.5 72.3 73.2 73.9 74.6 75.2 Real Per Capita Income (12$) 56.7 56.8 56.6 56.5 56.5 56.7 56.8 57.1 57.4 57.8 58.1 58.3 58.5 Average Annual Wage (Ths) 58.1 58.2 58.6 59.1 59.8 60.5 61.2 61.8 62.3 62.7 63.1 63.5 64.0 Pct Chg Year Ago 3.9 2.8 1.8 2.1 3.0 4.1 4.4 4.6 4.1 3.6 3.1 2.8 2.8 Establishment Employment (Place of Work, Thousands, SA) Total Employment 167.5 167.5 166.6 165.3 164.4 164.0 164.0 164.3 164.6 164.9 165.2 165.6 166.0 Pct Chg Year Ago 4.2 3.1 1.9 -0.5 -1.9 -2.1 -1.5 -0.6 0.1 0.6 0.7 0.8 0.8 Manufacturing 8.1 8.1 8.1 7.9 7.7 7.6 7.5 7.4 7.3 7.3 7.3 7.3 7.3 Pct Chg Year Ago 2.7 1.8 0.8 -1.4 -5.3 -7.0 -7.9 -6.9 -4.9 -3.1 -2.1 -1.1 -0.5 Nonmanufacturing 159.4 159.4 158.5 157.4 156.7 156.4 156.6 156.9 157.3 157.6 157.9 158.3 158.7 Pct Chg Year Ago 4.2 3.2 2.0 -0.5 -1.7 -1.8 -1.2 -0.3 0.4 0.7 0.9 0.9 0.9 Construction & Mining 12.9 12.9 12.8 12.6 12.5 12.4 12.3 12.2 12.1 12.0 11.9 11.9 11.8 Pct Chg Year Ago 2.5 3.2 3.0 -1.0 -2.4 -4.0 -3.9 -3.3 -3.4 -3.2 -2.7 -2.4 -2.3 Trade, Trans, & Utilities 33.2 32.7 32.5 31.9 31.6 31.4 31.1 31.1 31.1 31.1 31.1 31.2 31.2 Pct Chg Year Ago -0.1 -2.2 -2.0 -4.2 -4.7 -4.1 -4.4 -2.4 -1.6 -0.9 0.0 0.2 0.3 Wholesale Trade 5.1 5.2 5.2 5.3 5.3 5.3 5.4 5.4 5.4 5.4 5.5 5.5 5.5 Retail Trade 21.8 21.3 21.2 20.6 20.3 20.0 19.6 19.6 19.6 19.6 19.6 19.7 19.6 Trans, Wrhsng, & Util 6.2 6.1 6.0 6.0 6.0 6.0 6.1 6.1 6.0 6.0 6.0 6.0 6.0 Information 1.2 1.2 1.2 1.2 1.2 1.2 1.2 1.2 1.2 1.2 1.2 1.2 1.2 Pct Chg Year Ago 0.8 -0.5 1.6 -1.3 -3.9 -2.6 -1.2 -1.1 0.5 1.1 0.7 0.7 0.1 Financial Activities 6.5 6.7 6.7 6.7 6.7 6.8 6.8 6.9 6.9 6.9 6.9 6.9 6.9 Pct Chg Year Ago 5.3 5.6 5.9 5.1 3.1 1.7 1.9 2.7 2.3 1.8 1.2 0.8 0.4 Prof & Business Services 24.9 25.0 24.4 23.8 23.3 23.2 23.2 23.3 23.5 23.7 23.9 24.1 24.3 Pct Chg Year Ago 6.2 5.1 2.3 -3.8 -6.4 -7.3 -4.8 -1.9 0.9 2.3 2.9 3.1 3.3 Educ & Health Services 30.2 30.6 30.7 31.0 31.3 31.6 31.9 32.0 32.0 31.9 31.8 31.9 31.8 Pct Chg Year Ago 6.9 7.8 6.8 4.7 3.5 3.3 3.9 3.1 2.2 1.0 -0.1 -0.4 -0.4 Leisure & Hospitality 22.0 21.5 21.3 21.2 20.9 20.5 20.6 20.6 20.9 20.9 21.1 21.2 21.3 Pct Chg Year Ago 5.7 1.5 -3.6 -4.1 -4.8 -4.2 -3.2 -2.6 -0.2 1.8 2.4 2.5 2.1 Other Services 8.8 8.8 8.8 8.9 9.0 9.1 9.2 9.2 9.3 9.4 9.5 9.5 9.6 Pct Chg Year Ago 7.6 6.3 3.8 2.3 2.3 3.1 4.6 4.4 4.0 3.7 3.4 3.2 2.9 Federal Government 1.0 1.0 1.0 1.0 1.0 1.0 1.0 1.0 1.0 1.0 1.0 1.0 1.0 Pct Chg Year Ago -2.7 -1.8 1.2 3.1 0.6 -1.2 -2.8 -2.3 -1.3 -0.6 0.1 0.1 0.0 State & Local Government 18.8 19.0 19.1 19.2 19.3 19.3 19.3 19.4 19.4 19.5 19.5 19.5 19.6 Pct Chg Year Ago 3.8 3.8 4.7 3.5 2.3 1.6 1.0 1.0 0.8 0.8 0.8 0.8 0.8 Other Economic Indicators Population (Ths) 520.4 522.7 524.6 526.2 527.6 529.0 530.4 531.8 533.0 534.2 535.6 537.0 538.5 Pct Chg Year Ago 2.1 2.0 1.8 1.6 1.4 1.2 1.1 1.1 1.0 1.0 1.0 1.0 1.0 Labor Force (Ths) 232.3 233.3 234.1 234.3 234.2 233.9 233.7 233.5 233.5 233.4 233.5 233.6 233.6 Pct Chg Year Ago 3.1 3.2 2.8 1.5 0.8 0.3 -0.2 -0.3 -0.3 -0.2 -0.1 0.0 0.0 Unemployment Rate (%) 3.1 3.7 4.5 5.3 5.9 6.1 6.1 6.1 6.0 5.9 5.8 5.7 5.6 Total Housing Starts 7617.2 6092.0 4943.3 4414.4 3999.2 3845.0 3786.7 3809.3 3955.3 4012.2 4047.5 4040.1 4057.1 Single-Family 4656.3 3858.9 3336.9 3126.6 3010.2 2997.3 3020.0 3075.0 3169.3 3176.1 3168.0 3127.1 3125.0 Multifamily 2960.9 2233.1 1606.5 1287.8 989.1 847.8 766.7 734.3 786.0 836.1 879.5 913.0 932.0
PROFILES
The Punta Gorda MSA is located in the southwest segment of the state. Punta Gorda is the County seat of Charlotte County and the only incorporated municipality in the country.
QUICK FACTS
• Metro population estimate of 181,067 as of 2019 (5-Year Estimate) (U.S. Census Bureau).
• Charlotte County population estimate of 181,067 as of 2019 (5-Year Estimate) (U.S. Census Bureau).
• Civilian labor force of 77,278 in November 2022 (Florida Research and Economic Database).
• An unemployment rate of 3.5% as of November 2022, not seasonally adjusted. This amounts to 2,743 unemployed people (Florida Research and Economic Database).
OUTLOOK SUMMARIES
The Punta Gorda Metropolitan Statistical Area (MSA) is expected to show mixed levels of growth in its economic indicators. Punta Gorda’s Gross Metro Product will be $5,835.57. Average annual wage growth of 3.1 percent will lead to an average annual wage of $59,900, among the lowest level in the state. Personal income will grow by 5.1 percent. This will lead to a per capita income level of $43,100. Population growth will average 1.9 percent.
Employment growth is expected to average a rate of 0.1 percent annually. The unemployment rate is estimated to average 5.5 percent.
The Financial sector will lead Punta Gorda at an average annual growth rate of 2.7 percent. The Education and Health sector and the State and Local Government sector will expand at respective rates of 2.1 percent and 1.8 percent.
METRO NEWS SUMMARIES
Affordable Housing moves forward around 600 units planned for Veterans Blvd
• Around 600 affordable housing units are planned for 32 acres of Charlotte County-owned land on Veterans Boulevard. At Tuesday’s meeting, a majority of the county commissioners approved the sale of the property to Palladium Investment Company, of New Jersey, for 600 multifamily rental units at varying levels of affordability.
• Based on the contract, all units will be listed at an AMI rate not-to exceed a rate of 140%, or $106,400 with most having a not-to-exceed rate below this figure.
• In return for making those units available under the current AMI, the county will waive impact fees, saving the developer $2.6 to $3.1 million. Commissioner Joe Tiseo said it’s a win-win for Charlotte County. “Think about the economic impact,” he said. “That’s $200 million when it’s done is going to go on the tax rolls.”
Source: Charlotte Sun, September 16, 2022
New storage facility coming to Bal Harbor Plaza in Punta Gorda
• A new storage facility is coming to Charlotte County near the Punta Gorda Airport. Seagate Development Group will start renovation and construction on the facility, which will become Isles Luxury Storage, this month in Bal Harbor Plaza.
• The facility will include 136 units of varying sizes and an enclosed drive-through loading area. Some of the structure’s existing features will be upgraded, including lighting, HVAC, and security.
• “This will meet the growing population’s demand for space of this kind as well as take a practical approach to what people look for in a shopping center,” said Matt Price, CEO and Partner of Seagate Development Group. The project is scheduled to be completed by the end of the year.
Source: Fox 4, September 21, 2022
PUNTA GORDA Institute for Economic Forecasting 115
Charlotte County discusses roofing solutions for residents
• Because of the combination of 150-mph winds, rain, and storm surge due to Hurricane Ian, many homes in Charlotte County have sustained damage to their roofs, leaving the homes exposed to other natural elements that may cause further damage post-storm.
• A free service coordinated by the U.S. Army Corps of Engineers is available to assist residents by providing temporary repairs for damaged roofs. The service will provide homeowners with a temporary blue cover with fiber-reinforced sheeting, which will be installed to help reduce further damage to property until permanent repairs can be made.
• For longer-term solutions, the county’s department of business and professional regulation has provided an allowance to allow certified and registered general, building and residential contractors to perform roof repairs. “There’s going to be more available resources,” Fuller said. “But right now, we’re certainly in the temporary solution.”
Source: Wink News, October 5, 2022
Governor Ron Desantis awards $2.5 million through the Small Business Emergency Bridge Loan program to help businesses impacted by hurricane Ian
• Governor Ron DeSantis awarded an initial $2.5 million to businesses through the Florida Small Business Emergency Bridge Loan Program.
• The state activated the program following Hurricane Ian to provide short-term, zerointerest loans to small businesses that experienced financial impacts or physical damage due to Hurricane Ian.
• Four businesses in Charlotte County are receiving loans totaling $175,000. The loans are intended to bridge the gap between when a disaster impacts a business and when a company can secure long-term recovery funding. Loans are
available for up to $50,000 per eligible applicant and are short-term, personal loans.
Source: Gulfshore Business, October 11, 2022
Construction, paused by Ian, resumes at 785-room Charlotte Harbor resort
• Construction has resumed on the Sunseeker Resort Charlotte Harbor, about a month after Hurricane Ian caused two of its construction cranes to collapse. Allegiant Travel Co., the Las Vegas-based company behind the upcoming resort on the banks of the Peace River, said last week that it has started work again on Sunseeker, which is scheduled to open in September 2023
• Allegiant has also started construction on the hotel’s Reflections Pool, a 117,074-square- foot, ground-level pool deck next to the resort’s main tower. More than 700 yards of concrete were poured into the base of the pool, which totals 19,420 square feet and will eventually hold 508,500 gallons of water.
• Allegiant plans to hire more than 1,200 employees to staff the resort, which is about 15% of the current leisure and hospitality employment in the Punta Gorda metro area, according to the U.S. Bureau of Labor Statistics. Recruiting efforts for Sunseeker are expected to kick off in the spring, the company said.
Source: Herald-Tribune, October 31, 2022
PUNTA GORDA 116 Florida & Metro Forecast / Winter 2023
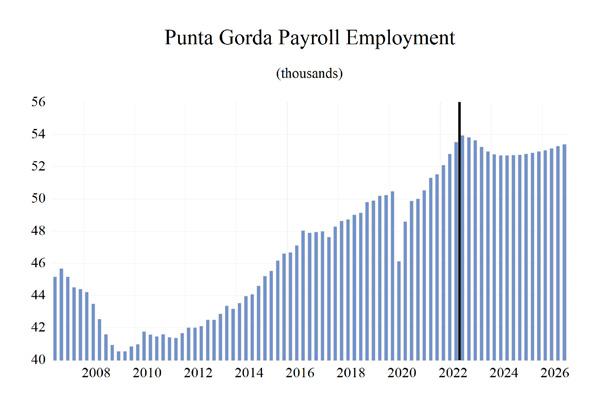
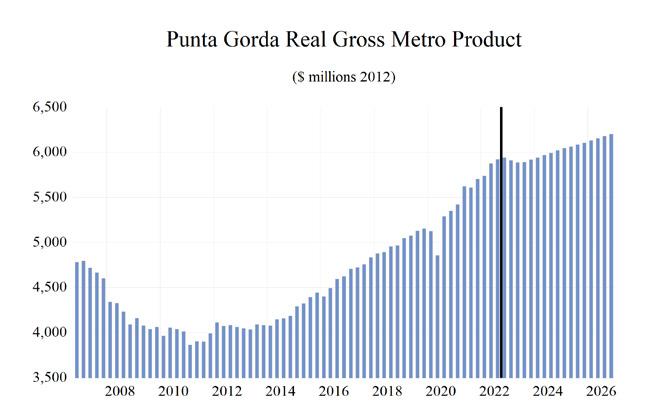
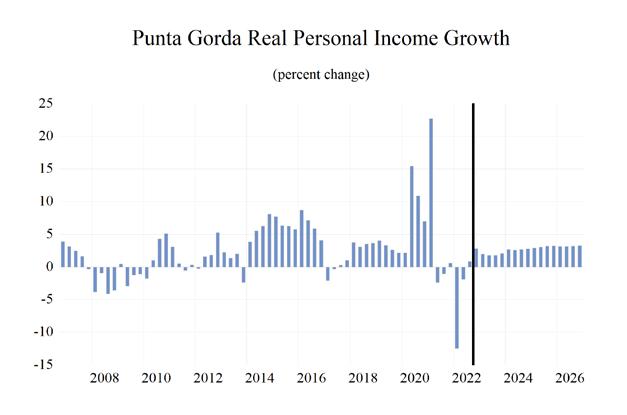
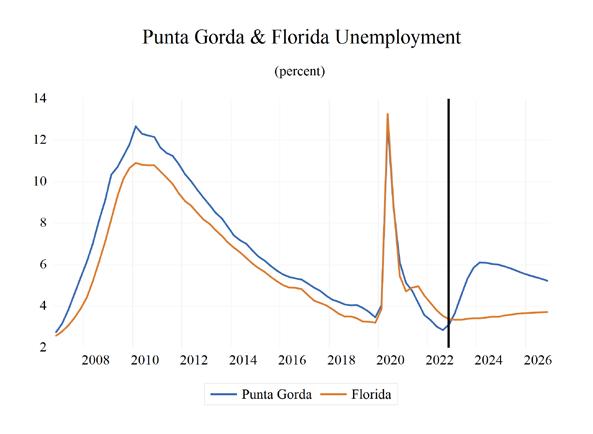
PUNTA GORDA Institute for Economic Forecasting 117 0 0.2 0.4 0.6 0.8 1 1.2 1.4 1.6 1.8 Total Nonagricultural Employment Total Private Goods Producing Service Producing Private Service Providing Mining, Logging, and Construc�on Manufacturing Trade, Transporta�on, and U�li�es Wholesale Trade Retail Trade Transporta�on, Warehousing, and U�li�es Informa�on Financial Ac�vi�es Professional and Business Services Educa�onal and Health Services Leisure and Hospitality Other Services Government Punta Gorda MSA Industry Loca�on Quo�ents
Long-Term Outlook for Punta Gorda, FL
PUNTA GORDA 118 Florida & Metro Forecast / Winter 2023
2018 2019 2020 2021 2022 2023 2024 2025 2026 Personal Income (Billions $) Total Personal Income 7.8 8.6 9.2 10.1 10.3 10.9 11.3 12.0 12.6 Pct Chg Year Ago 5.3 9.8 7.4 9.2 2.5 5.1 4.5 5.7 5.0 Wages and Salaries 2.1 2.2 2.3 2.7 3.0 3.1 3.1 3.2 3.4 Nonwage Income 5.7 6.3 6.9 7.4 7.3 7.8 8.2 8.7 9.2 Real Personal Income (12$) 7.3 8.1 8.6 9.0 8.7 8.8 9.0 9.3 9.6 Pct Chg Year Ago 5.0 10.1 6.1 4.7 -3.6 1.8 2.1 3.5 3.0 Per Capita Income (Ths) 43.5 46.7 48.8 51.5 51.1 52.3 53.5 55.7 57.8 Real Per Capita Income (12$) 40.8 44.0 45.4 46.0 42.9 42.5 42.5 43.4 44.2 Average Annual Wage (Ths) 42.7 44.4 47.7 52.6 55.8 56.9 59.0 60.9 63.0 Pct Chg Year Ago 3.3 3.9 7.3 10.3 6.0 1.9 3.8 3.2 3.6 Establishment Employment (Place of Work, Thousands, SA) Total Employment 48.9 50.0 48.8 50.8 53.1 53.4 52.7 52.8 53.2 Pct Chg Year Ago 1.9 2.4 -2.5 4.3 4.4 0.6 -1.3 0.2 0.7 Manufacturing 0.8 0.8 0.8 0.9 0.9 0.9 0.8 0.8 0.8 Pct Chg Year Ago 1.1 -1.0 -0.2 12.7 -0.2 -1.4 -7.6 -1.3 2.2 Nonmanufacturing 48.1 49.2 48.0 49.9 52.2 52.5 51.9 52.0 52.4 Pct Chg Year Ago 1.9 2.4 -2.6 4.1 4.5 0.6 -1.2 0.2 0.7 Construction & Mining 4.2 4.3 4.4 4.7 4.8 4.8 4.5 4.4 4.4 Pct Chg Year Ago 8.0 3.2 2.9 6.1 2.0 -0.5 -5.3 -3.0 -0.9 Trade, Trans, & Utilities 11.5 11.7 11.6 11.8 12.6 12.4 12.0 11.8 11.8 Pct Chg Year Ago 2.1 2.4 -1.6 2.4 7.0 -1.8 -3.6 -1.2 -0.4 Wholesale Trade 0.8 0.8 0.8 0.8 0.8 0.8 0.9 0.9 0.9 Retail Trade 9.6 9.7 9.5 9.7 10.4 10.1 9.6 9.4 9.4 Trans, Wrhsng, & Util 1.0 1.2 1.2 1.3 1.4 1.5 1.5 1.5 1.5 Information 0.4 0.4 0.3 0.4 0.4 0.4 0.4 0.4 0.4 Pct Chg Year Ago -13.4 -7.5 -12.9 14.5 2.1 2.1 1.0 0.0 -2.2 Financial Activities 2.2 2.3 2.2 2.3 2.4 2.6 2.7 2.7 2.6 Pct Chg Year Ago 4.4 3.4 -3.4 3.9 4.1 8.0 3.0 0.1 -0.4 Prof & Business Services 4.2 4.4 4.5 5.2 5.2 5.0 4.7 4.8 4.9 Pct Chg Year Ago -3.0 2.8 3.6 15.6 -0.5 -3.6 -7.3 2.2 2.8 Educ & Health Services 9.6 10.0 9.6 9.4 9.9 10.4 10.6 10.7 10.8 Pct Chg Year Ago 3.0 3.5 -3.5 -2.0 4.9 4.6 2.7 0.6 0.8 Leisure & Hospitality 7.7 7.8 6.9 7.5 8.2 8.1 8.0 8.1 8.2 Pct Chg Year Ago 1.3 0.3 -11.4 9.2 8.7 -0.6 -0.8 0.9 1.3 Other Services 2.1 2.2 2.3 2.4 2.6 2.6 2.7 2.7 2.8 Pct Chg Year Ago 2.9 4.7 4.7 4.9 6.0 0.3 2.1 2.4 1.6 Federal Government 0.3 0.3 0.3 0.3 0.3 0.3 0.3 0.3 0.3 Pct Chg Year Ago -0.1 5.4 9.9 -13.2 -1.1 -4.1 -0.2 4.2 5.3 State & Local Government 5.7 5.8 5.7 5.8 5.8 6.0 6.1 6.1 6.2 Pct Chg Year Ago 0.3 2.1 -2.2 1.4 -0.1 2.9 1.7 1.4 1.3 Other Economic Indicators Population (Ths) 179.8 183.7 188.9 195.6 201.9 207.4 211.8 214.9 217.5 Pct Chg Year Ago 1.5 2.2 2.8 3.5 3.3 2.7 2.1 1.5 1.2 Labor Force (Ths) 70.2 71.3 71.4 73.2 75.6 77.3 77.2 77.3 77.5 Percent Change, Year Ago 1.0 1.5 0.1 2.6 3.2 2.2 0.0 0.1 0.3 Unemployment Rate (%) 4.2 3.8 7.9 4.4 3.1 4.8 6.1 5.8 5.4 Total Housing Starts 1881.1 2178.6 2575.4 3912.4 5269.0 2579.8 1995.6 2053.6 2010.0 Single-Family 1816.1 2076.8 2370.9 3264.0 4237.8 2163.4 1653.4 1606.5 1514.4 Multifamily 65.0 101.9 204.5 648.4 1031.3 416.4 342.2 447.1 495.6
December 2022 Forecast
Short-Term Outlook for Punta Gorda, FL
PUNTA GORDA Institute for Economic Forecasting 119
2022:4 2023:1 2023:2 2023:3 2023:4 2024:1 2024:2 2024:3 2024:4 2025:1 2025:2 2025:3 2025:4 Personal Income (Billions $) Total Personal Income 10.6 10.7 10.8 10.9 11.0 11.1 11.2 11.4 11.6 11.7 11.9 12.1 12.2 Pct Chg Year Ago 6.6 6.7 5.1 4.6 4.0 3.9 4.2 4.6 5.1 5.4 5.8 5.9 5.6 Wages and Salaries 3.0 3.0 3.1 3.1 3.1 3.1 3.1 3.1 3.2 3.2 3.2 3.2 3.3 Nonwage Income 7.5 7.7 7.7 7.8 7.9 8.1 8.1 8.2 8.4 8.5 8.7 8.8 8.9 Real Personal Income (12$) 8.7 8.8 8.8 8.8 8.9 8.9 9.0 9.0 9.1 9.2 9.3 9.4 9.4 Pct Chg Year Ago 0.8 2.0 1.8 1.7 1.5 1.5 1.9 2.3 2.9 3.2 3.6 3.7 3.5 Per Capita Income (Ths) 51.8 52.2 52.2 52.3 52.6 53.0 53.2 53.7 54.2 54.9 55.5 56.0 56.5 Real Per Capita Income (12$) 42.7 42.7 42.5 42.4 42.3 42.4 42.4 42.5 42.8 43.0 43.3 43.5 43.7 Average Annual Wage (Ths) 56.1 56.2 56.6 57.0 57.6 58.2 58.7 59.3 59.8 60.3 60.6 61.1 61.6 Pct Chg Year Ago 2.4 2.1 1.3 1.8 2.7 3.5 3.7 4.0 3.8 3.6 3.2 3.0 2.9 Establishment Employment (Place of Work, Thousands, SA) Total Employment 53.9 53.8 53.6 53.2 52.9 52.8 52.7 52.7 52.7 52.7 52.8 52.9 52.9 Pct Chg Year Ago 4.7 3.3 1.6 -0.6 -1.8 -2.0 -1.7 -1.0 -0.4 -0.1 0.2 0.3 0.4 Manufacturing 0.9 0.9 0.9 0.9 0.9 0.8 0.8 0.8 0.8 0.8 0.8 0.8 0.8 Pct Chg Year Ago 0.0 1.7 3.1 -2.8 -7.2 -8.3 -9.1 -7.6 -5.1 -2.8 -2.2 -0.6 0.4 Nonmanufacturing 53.0 52.9 52.7 52.3 52.1 51.9 51.9 51.9 51.9 51.9 52.0 52.1 52.1 Pct Chg Year Ago 4.7 3.3 1.6 -0.5 -1.7 -1.8 -1.6 -0.9 -0.4 0.0 0.2 0.3 0.4 Construction & Mining 4.9 4.9 4.8 4.7 4.7 4.6 4.5 4.5 4.5 4.4 4.4 4.4 4.4 Pct Chg Year Ago 2.1 2.2 2.4 -2.0 -4.3 -6.0 -5.9 -4.8 -4.5 -3.9 -3.0 -2.6 -2.4 Trade, Trans, & Utilities 12.7 12.6 12.6 12.3 12.2 12.1 12.0 11.9 11.9 11.8 11.8 11.8 11.8 Pct Chg Year Ago 4.9 1.4 -0.9 -3.6 -4.0 -3.7 -4.8 -3.1 -2.8 -2.2 -1.2 -0.7 -0.6 Wholesale Trade 0.8 0.8 0.8 0.8 0.8 0.9 0.9 0.9 0.9 0.9 0.9 0.9 0.9 Retail Trade 10.4 10.3 10.3 10.0 9.9 9.7 9.6 9.5 9.5 9.4 9.4 9.4 9.4 Trans, Wrhsng, & Util 1.5 1.5 1.5 1.5 1.5 1.5 1.5 1.5 1.5 1.5 1.5 1.5 1.5 Information 0.4 0.4 0.4 0.4 0.4 0.4 0.4 0.4 0.4 0.4 0.4 0.4 0.4 Pct Chg Year Ago 8.1 7.7 1.5 1.2 -1.6 0.1 1.7 0.8 1.5 1.2 -0.5 -0.1 -0.5 Financial Activities 2.5 2.6 2.6 2.6 2.6 2.6 2.7 2.7 2.7 2.7 2.7 2.7 2.6 Pct Chg Year Ago 6.9 10.7 9.1 7.5 4.9 3.4 3.1 3.2 2.1 1.1 0.2 -0.3 -0.6 Prof & Business Services 5.3 5.3 5.1 4.9 4.7 4.7 4.6 4.7 4.7 4.7 4.7 4.8 4.8 Pct Chg Year Ago 1.3 3.2 0.2 -6.7 -10.6 -12.2 -9.3 -5.3 -1.6 1.0 2.2 2.6 3.0 Educ & Health Services 10.2 10.2 10.3 10.4 10.5 10.6 10.6 10.7 10.7 10.7 10.7 10.7 10.7 Pct Chg Year Ago 7.3 5.8 5.1 4.4 3.0 3.0 3.2 2.5 2.0 1.2 0.4 0.3 0.4 Leisure & Hospitality 8.3 8.1 8.1 8.2 8.1 8.0 8.0 8.1 8.1 8.1 8.1 8.1 8.2 Pct Chg Year Ago 7.4 3.8 -1.1 -2.2 -2.6 -1.4 -0.8 -1.3 0.1 0.9 1.0 0.9 0.9 Other Services 2.6 2.6 2.6 2.6 2.6 2.6 2.6 2.7 2.7 2.7 2.7 2.7 2.7 Pct Chg Year Ago 7.0 3.7 -0.4 -1.1 -0.7 0.6 2.4 2.7 2.7 2.6 2.5 2.4 2.0 Federal Government 0.3 0.3 0.3 0.3 0.3 0.3 0.3 0.3 0.3 0.3 0.3 0.3 0.3 Pct Chg Year Ago -5.9 -12.2 -9.8 5.3 2.6 0.8 -0.9 -1.0 0.5 2.1 3.8 5.3 5.6 State & Local Government 5.8 5.9 5.9 6.0 6.0 6.0 6.0 6.1 6.1 6.1 6.1 6.1 6.2 Pct Chg Year Ago 0.5 1.3 3.8 3.7 2.7 2.1 1.6 1.6 1.4 1.4 1.4 1.5 1.4 Other Economic Indicators Population (Ths) 204.2 205.6 206.9 208.1 209.2 210.3 211.3 212.3 213.1 213.9 214.6 215.2 215.9 Pct Chg Year Ago 3.1 3.0 2.8 2.6 2.5 2.3 2.2 2.0 1.9 1.7 1.5 1.4 1.3 Labor Force (Ths) 76.6 77.0 77.3 77.4 77.4 77.3 77.2 77.2 77.2 77.2 77.3 77.3 77.4 Pct Chg Year Ago 3.6 3.3 2.8 1.8 1.0 0.4 0.0 -0.2 -0.2 -0.1 0.0 0.2 0.2 Unemployment Rate (%) 3.1 3.7 4.5 5.3 5.9 6.1 6.1 6.0 6.0 5.9 5.8 5.7 5.6 Total Housing Starts 4060.0 3299.9 2687.7 2276.8 2055.0 1948.4 1949.1 2011.3 2073.7 2082.3 2076.3 2040.3 2015.3 Single-Family 3490.1 2753.8 2221.5 1928.7 1749.7 1648.7 1636.6 1648.1 1680.4 1661.9 1633.4 1582.6 1548.0 Multifamily 570.0 546.1 466.2 348.1 305.3 299.7 312.5 363.2 393.4 420.4 442.9 457.7 467.4
December 2022 Forecast
PROFILES
The Sebastian MSA is located in central east Florida and is comprised of the Indian River County. Sebastian is home to Pelican Island, America’s first National Wildlife refuge, and is known for its Atlantic-facing beaches.
QUICK FACTS
• Metro population estimate of 153,989 as of 2019 (5-Year Estimate) (U.S. Census Bureau).
• Indian River County population estimate of 153,989 as of 2019 (5-Year Estimate) (U.S. Census Bureau).
• Civilian labor force of 67,546 in November 2022 (Florida Research and Economic Database).
• An unemployment rate of 3.0% as of November 2022, not seasonally adjusted. This amounts to 2,022 unemployed people (Florida Research and Economic Database).
OUTLOOK SUMMARIES
The Sebastian Metropolitan Statistical Area (MSA) is expected to show about-average growth in the economic indicators studied in this forecast. The MSA’s Gross Metro Product level will be at $6,781.79. Average annual wage growth of 2.9 percent will lead the average annual wage level to $65,300. The per capita income level of $84,000, the second highest in the state MSAs, will be boosted by personal income growth of 5.2 percent. Population growth will be 1.2 percent.
The Sebastian MSA will experience the highest employment growth rate in the state at 0.4 percent annually. Sebastian’s unemployment rate should average 6.1 percent.
The Information Services sector is expected to be the fastest-growing sector in the area, averaging 6.1 percent growth annually. The Other Services sector will see the second-highest average annual growth rate at 4.8 percent. The Construction and Mining sector will experience the largest contraction in the MSA at -2.9 percent.
METRO NEWS SUMMARIES
Breeze Airways confirms it will begin Vero Beach service Feb. 2; three destinations named
• In September, Breeze Airways announced that it would begin to offer flights to three destinations out of Vero Beach Regional Airport beginning February 2, 2023. The move will expand the offerings for the one year old airline and bring tourism to the region.
• Flights will be offered to three destinations in the northeast: Hartford Connecticut, Westchester County New York, and Norfolk Virginia.
• This move will mark the return of passenger service to Vero Beach Regional Airport after Elite Airways, which began flights in 2015 to the airport, stopped service this year. Previously the airport was served by American Eagle up until 1996.
Source: TC Palm, October 19, 2022
Upcoming development projects excite Indian River County Officials
• In October, top officials from Vero Beach, Sebastian, Fellsmere and Indian River County appeared at a symposium at the Indian River Mall last Monday to talk about future real estate development in the county.
• One of the largest projects is the Three Corners Project coming to Vero Beach. It is a large mixed-use project with shops, restaurants, docks, a hotel and public recreation space that is planned for the site of the city’s decommissioned power plant on the shore of the Indian River Lagoon.
• Fellsmere City Manager Mark Mathes said he is excited about a number of upcoming subdivisions and civic improvements in his city, including the redevelopment of what he called “the Broadway Corridor” in downtown Fellsmere and a planned historic train village adjacent to downtown that
SEBASTIAN - VERO BEACH 120 Florida & Metro Forecast / Winter 2023
will include a station, jail, businesses and other structures and activities intended draw visitors and give them a sense of what life was like in Fellsmere early in the 20th century.
Source: Vero News, October 9, 2022
Beachfront businesses in Vero Beach reopen after Hurricane Nicole
• Businesses in Vero Beach wasted no time in reopening following Hurricane Nicole which made landfall along Florida’s treasure coast.
• One local business, Beachfront businesses in Vero Beach reopened after Hurricane Nicole closed down at 6pm on a wednesday and was reopen the next day in time for lunch after a check with police city officials on the safety of the bridge.
• Other business owners were not as lucky including Gerre Rhodes, owner of clothing retailer GT Rhodes. She was unable to leave her neighborhood following the storm due to flooding which resulted in her business being closed for two days.
Source: WPTV, November 14, 2022
New hotels for Indian River County could change tourism game
• As local hotels struggle to keep up with the demand of tourism in Indian River County, hotels arriving soon will be able to help ease the strain on the overcrowded hotels nd help attract new events to the region.
• “There’s a lot of vacation-type resort hotels in the Sebastian area, but sometimes a standard hotel room is what people need,” said County Commissioner Joe Flescher, who also sits on the county’s Tourism Development Council.
• Hotel space was a concern when Jerusha Stewart founded the Vero Beach Film Festival. When it launched in 2016, Stewart, now executive director emeritus of the festival, and her organizers decided one way to ensure plenty of hotel availability would be to hold it in June, when tourism slides in Florida because of the heat.
Source: TC Palm, November 16, 2022
SEBASTIAN - VERO BEACH Institute for Economic Forecasting 121
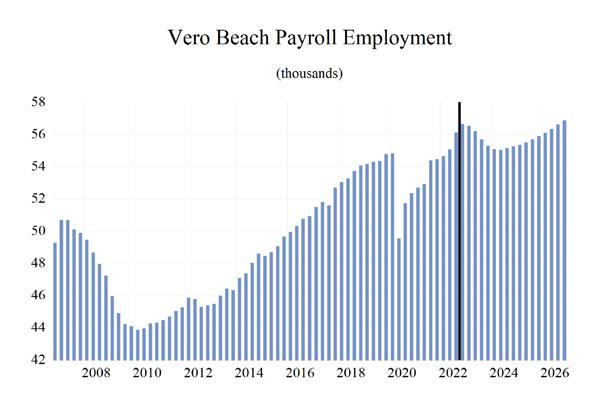
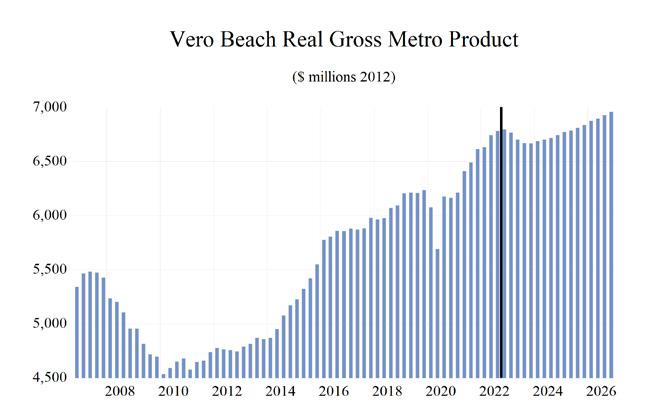
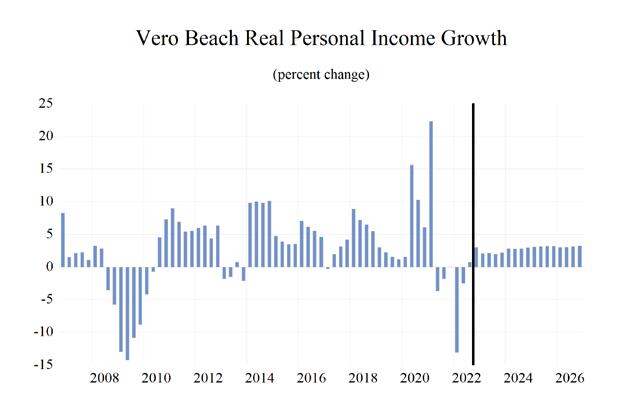
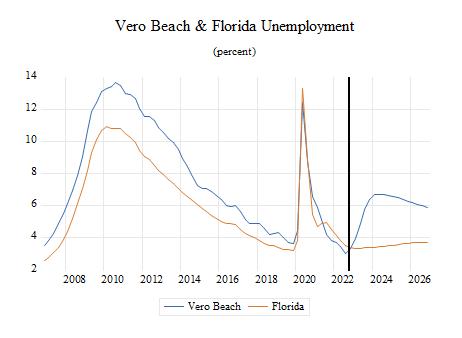
SEBASTIAN - VERO BEACH 122 Florida & Metro Forecast / Winter 2023 0 0.2 0.4 0.6 0.8 1 1.2 1.4 1.6 Total Nonagricultural Employment Total Private Goods Producing Service Producing Private Service Providing Mining, Logging, and Construc�on Manufacturing Trade, Transporta�on, and U�li�es Wholesale Trade Retail Trade Transporta�on, Warehousing, and U�li�es Informa�on Financial Ac�vi�es Professional and Business Services Educa�onal and Health Services Leisure and Hospitality Other Services Government Sebas�an-Vero Beach MSA Industry Loca�on Quo�ents
Long-Term Outlook for Sebastian-Vero Beach, FL December 2022 Forecast
SEBASTIAN - VERO BEACH Institute for Economic Forecasting 123
2018 2019 2020 2021 2022 2023 2024 2025 2026 Personal Income (Billions $) Total Personal Income 12.6 13.7 14.3 15.6 15.9 16.8 17.5 18.5 19.5 Pct Chg Year Ago 8.7 8.8 4.4 8.7 2.3 5.4 4.3 5.9 5.2 Wages and Salaries 2.6 2.7 2.8 3.1 3.4 3.5 3.6 3.7 3.9 Nonwage Income 10.0 11.0 11.6 12.5 12.5 13.3 14.0 14.8 15.6 Real Personal Income (12$) 12.3 13.1 13.5 14.1 13.6 13.8 14.1 14.6 15.1 Pct Chg Year Ago 6.3 6.3 3.3 4.3 -3.8 2.1 2.0 3.7 3.1 Per Capita Income (Ths) 81.0 86.8 89.1 95.0 95.6 99.5 102.5 107.4 111.7 Real Per Capita Income (12$) 79.1 82.8 84.0 86.0 81.4 82.0 82.6 84.8 86.5 Average Annual Wage (Ths) 47.8 49.2 52.6 57.5 61.0 62.1 64.2 66.2 68.4 Pct Chg Year Ago 2.7 2.9 7.0 9.2 6.2 1.8 3.4 3.1 3.3 Establishment Employment (Place of Work, Thousands, SA) Total Employment 53.5 54.4 52.1 53.6 55.6 55.9 55.1 55.6 56.5 Pct Chg Year Ago 3.1 1.7 -4.2 2.9 3.7 0.5 -1.4 0.9 1.6 Manufacturing 2.2 2.3 2.2 2.1 2.2 2.2 2.0 2.0 2.0 Pct Chg Year Ago 12.8 4.8 -6.8 -3.4 6.0 -1.1 -8.9 -1.9 3.1 Nonmanufacturing 51.3 52.1 50.0 51.5 53.4 53.7 53.1 53.7 54.5 Pct Chg Year Ago 2.8 1.5 -4.1 3.1 3.6 0.6 -1.1 1.0 1.5 Construction & Mining 4.3 4.5 4.4 4.5 4.6 4.5 4.3 4.1 4.1 Pct Chg Year Ago 6.8 3.6 -1.3 2.1 3.0 -1.9 -5.9 -3.0 -0.9 Trade, Trans, & Utilities 10.8 10.6 10.5 10.8 11.2 11.0 10.7 10.6 10.7 Pct Chg Year Ago 3.6 -1.9 -0.7 3.0 3.5 -1.8 -2.9 -0.5 0.4 Wholesale Trade 0.9 0.9 1.0 1.1 1.2 1.2 1.2 1.2 1.2 Retail Trade 9.0 8.7 8.6 8.8 9.0 8.7 8.3 8.3 8.3 Trans, Wrhsng, & Util 0.9 0.9 0.9 0.9 1.0 1.1 1.1 1.2 1.2 Information 0.6 0.6 0.5 0.4 0.4 0.4 0.5 0.5 0.5 Pct Chg Year Ago 0.0 -5.7 -14.7 -17.3 -0.3 5.2 8.8 6.8 3.7 Financial Activities 2.7 2.8 2.8 2.9 3.0 3.2 3.2 3.3 3.3 Pct Chg Year Ago 2.2 3.4 0.3 6.1 2.9 5.2 1.9 1.3 0.7 Prof & Business Services 6.2 6.4 6.2 6.6 6.7 6.3 5.7 5.8 6.2 Pct Chg Year Ago 5.1 4.1 -4.0 6.1 2.0 -6.4 -9.7 2.9 6.2 Educ & Health Services 10.5 10.9 10.7 10.7 11.1 11.5 11.8 11.9 12.0 Pct Chg Year Ago 1.1 3.9 -1.8 -0.2 3.7 4.2 2.5 0.6 0.8 Leisure & Hospitality 8.1 8.3 7.1 7.6 8.2 8.3 8.2 8.4 8.6 Pct Chg Year Ago 1.0 2.3 -15.0 7.8 7.6 0.7 -0.9 2.9 2.5 Other Services 2.9 2.8 2.7 2.9 3.1 3.3 3.5 3.6 3.7 Pct Chg Year Ago 4.0 -3.0 -2.1 7.2 5.6 5.9 6.2 4.1 2.9 Federal Government 0.4 0.4 0.4 0.4 0.4 0.4 0.4 0.4 0.4 Pct Chg Year Ago -6.8 9.4 4.2 -3.9 -9.5 2.2 0.4 0.9 0.6 State & Local Government 4.9 4.9 4.7 4.7 4.8 4.9 5.0 5.0 5.0 Pct Chg Year Ago 1.8 -0.9 -3.5 -0.3 1.3 3.2 1.6 0.4 0.1 Other Economic Indicators Population (Ths) 155.4 158.0 160.8 163.9 166.5 168.7 170.9 172.6 174.5 Pct Chg Year Ago 1.7 1.6 1.8 2.0 1.6 1.3 1.3 1.0 1.1 Labor Force (Ths) 64.5 65.1 64.1 65.1 66.7 68.2 68.3 68.4 68.6 Percent Change, Year Ago 1.6 1.0 -1.5 1.5 2.4 2.3 0.1 0.1 0.3 Unemployment Rate (%) 4.5 3.9 8.0 4.8 3.4 5.3 6.7 6.4 6.0 Total Housing Starts 1292.4 1445.3 1129.2 1546.1 1168.2 1188.7 1309.0 1397.2 1398.4 Single-Family 1254.2 1410.5 1120.7 1542.2 1161.4 1084.2 1128.0 1169.1 1136.7 Multifamily 38.2 34.8 8.5 3.9 6.9 104.5 181.0 228.1 261.7
Short-Term Outlook for Sebastian-Vero Beach, FL December 2022 Forecast
SEBASTIAN - VERO BEACH 124 Florida & Metro Forecast / Winter 2023
2022:4 2023:1 2023:2 2023:3 2023:4 2024:1 2024:2 2024:3 2024:4 2025:1 2025:2 2025:3 2025:4 Personal Income (Billions $) Total Personal Income 16.4 16.6 16.7 16.8 17.0 17.2 17.4 17.6 17.9 18.2 18.4 18.7 18.9 Pct Chg Year Ago 6.8 7.1 5.9 4.8 3.8 3.6 4.0 4.5 5.1 5.5 6.0 6.1 5.8 Wages and Salaries 3.5 3.5 3.5 3.5 3.5 3.5 3.5 3.6 3.6 3.6 3.7 3.7 3.8 Nonwage Income 12.9 13.1 13.2 13.4 13.5 13.7 13.8 14.0 14.3 14.5 14.7 15.0 15.1 Real Personal Income (12$) 13.7 13.8 13.8 13.8 13.9 14.0 14.0 14.1 14.3 14.4 14.6 14.7 14.8 Pct Chg Year Ago 1.0 2.4 2.5 1.9 1.4 1.3 1.7 2.2 2.9 3.3 3.8 4.0 3.7 Per Capita Income (Ths) 97.8 99.0 99.1 99.6 100.2 101.2 101.8 102.8 104.1 105.6 106.8 108.0 109.0 Real Per Capita Income (12$) 81.9 82.2 82.0 81.9 81.9 82.2 82.3 82.7 83.2 83.9 84.5 85.1 85.5 Average Annual Wage (Ths) 61.3 61.5 61.8 62.2 62.9 63.5 64.0 64.4 65.0 65.5 66.0 66.5 67.0 Pct Chg Year Ago 2.1 1.9 1.2 1.6 2.5 3.4 3.5 3.4 3.4 3.2 3.0 3.2 3.0 Establishment Employment (Place of Work, Thousands, SA) Total Employment 56.7 56.5 56.2 55.7 55.3 55.1 55.0 55.1 55.3 55.4 55.5 55.7 55.9 Pct Chg Year Ago 4.0 3.4 2.1 -0.8 -2.4 -2.6 -2.1 -1.0 -0.1 0.5 0.9 1.0 1.2 Manufacturing 2.2 2.2 2.2 2.2 2.1 2.0 2.0 2.0 1.9 1.9 1.9 2.0 2.0 Pct Chg Year Ago 3.8 0.9 1.6 -0.9 -6.1 -8.6 -10.2 -9.7 -7.3 -4.8 -2.8 -0.7 0.8 Nonmanufacturing 54.4 54.3 54.0 53.5 53.2 53.0 53.0 53.2 53.3 53.4 53.6 53.7 53.9 Pct Chg Year Ago 4.0 3.5 2.1 -0.8 -2.2 -2.3 -1.7 -0.6 0.2 0.7 1.0 1.1 1.2 Construction & Mining 4.7 4.7 4.6 4.5 4.4 4.4 4.3 4.2 4.2 4.2 4.2 4.1 4.1 Pct Chg Year Ago 2.1 2.3 -0.6 -3.7 -5.5 -6.9 -6.6 -5.4 -4.8 -4.1 -3.0 -2.4 -2.3 Trade, Trans, & Utilities 11.2 11.1 11.1 10.9 10.8 10.8 10.6 10.6 10.6 10.6 10.6 10.6 10.6 Pct Chg Year Ago 3.3 -0.3 -0.4 -3.1 -3.5 -3.0 -4.1 -2.4 -2.0 -1.5 -0.4 -0.1 0.1 Wholesale Trade 1.2 1.2 1.2 1.2 1.2 1.2 1.2 1.2 1.2 1.2 1.2 1.2 1.2 Retail Trade 9.0 8.8 8.8 8.6 8.5 8.4 8.3 8.3 8.3 8.3 8.3 8.3 8.3 Trans, Wrhsng, & Util 1.0 1.0 1.1 1.1 1.1 1.1 1.1 1.1 1.1 1.1 1.2 1.2 1.2 Information 0.4 0.4 0.4 0.4 0.4 0.4 0.5 0.5 0.5 0.5 0.5 0.5 0.5 Pct Chg Year Ago -1.9 -1.6 5.2 9.3 8.1 9.2 10.0 8.0 8.2 8.0 6.6 6.7 5.9 Financial Activities 3.1 3.2 3.2 3.2 3.2 3.2 3.2 3.2 3.3 3.3 3.3 3.3 3.3 Pct Chg Year Ago 4.1 6.4 6.7 5.0 3.0 1.6 1.6 2.4 2.2 1.9 1.6 1.1 0.7 Prof & Business Services 6.8 6.7 6.4 6.1 5.8 5.7 5.6 5.6 5.7 5.7 5.8 5.9 5.9 Pct Chg Year Ago 0.5 0.9 -3.5 -9.2 -13.7 -15.5 -12.2 -7.4 -2.8 0.5 2.3 3.8 5.0 Educ & Health Services 11.3 11.4 11.5 11.6 11.6 11.7 11.8 11.8 11.8 11.9 11.9 11.9 11.9 Pct Chg Year Ago 4.8 5.4 5.1 4.0 2.5 2.5 3.0 2.4 2.0 1.2 0.4 0.3 0.4 Leisure & Hospitality 8.5 8.3 8.3 8.3 8.2 8.1 8.1 8.2 8.3 8.3 8.4 8.5 8.5 Pct Chg Year Ago 8.4 6.7 2.1 -2.1 -3.3 -2.5 -1.6 -0.9 1.4 2.9 3.3 2.8 2.5 Other Services 3.2 3.2 3.2 3.3 3.3 3.4 3.4 3.5 3.5 3.6 3.6 3.6 3.6 Pct Chg Year Ago 7.2 7.7 7.5 4.3 4.5 5.6 7.0 6.6 5.7 5.0 4.3 3.7 3.4 Federal Government 0.4 0.4 0.4 0.4 0.4 0.4 0.4 0.4 0.4 0.4 0.4 0.4 0.4 Pct Chg Year Ago -11.4 -1.8 2.0 5.6 3.0 1.3 -0.3 0.0 0.7 0.9 1.2 0.9 0.6 State & Local Government 4.9 4.9 4.9 4.9 5.0 5.0 5.0 5.0 5.0 5.0 5.0 5.0 5.0 Pct Chg Year Ago 3.4 4.5 4.7 2.2 1.7 1.9 1.8 1.7 1.0 0.6 0.4 0.2 0.2 Other Economic Indicators Population (Ths) 167.3 167.8 168.4 169.0 169.6 170.1 170.6 171.1 171.6 172.0 172.4 172.9 173.3 Pct Chg Year Ago 1.4 1.3 1.3 1.3 1.4 1.4 1.3 1.2 1.2 1.1 1.0 1.0 1.0 Labor Force (Ths) 67.6 67.9 68.2 68.3 68.4 68.3 68.3 68.3 68.3 68.3 68.3 68.4 68.4 Pct Chg Year Ago 2.8 3.1 3.0 1.8 1.2 0.6 0.1 -0.1 -0.2 -0.1 0.1 0.2 0.2 Unemployment Rate (%) 3.3 3.9 4.9 5.8 6.4 6.7 6.7 6.7 6.7 6.6 6.5 6.4 6.3 Total Housing Starts 1171.4 1141.5 1169.6 1209.0 1234.9 1283.2 1276.5 1311.8 1364.4 1389.2 1399.8 1397.2 1402.6 Single-Family 1181.0 1100.6 1069.0 1074.7 1092.7 1113.5 1098.6 1131.2 1168.7 1177.3 1176.6 1161.5 1161.0 Multifamily -9.6 40.9 100.7 134.3 142.2 169.7 178.0 180.6 195.7 212.0 223.3 235.7 241.6
PROFILES
The Sebring MSA is comprised of Highlands County and is located in the South central portion of the state. Sebring is nicknamed “The City of the Circle” in reference to Circle Drive, the center of the Sebring Downtown Historic District. Sebring is the home of the Sebring International Raceway, created on a former airbase and it is currently known as the host of the 12 Hours of Sebring, an annual WeatherTech SportsCar Championship Race.
QUICK FACTS
• Metro population estimate of 103,437 as of 2019 (5-Year Estimate) (U.S. Census Bureau).
• Highlands County population estimate of 103,437 as of 2019 (5-Year Estimate) (U.S. Census Bureau).
• Civilian labor force of 34,252 in November 2022 (Florida Research and Economic Database).
• An unemployment rate of 4.2% as of November 2022, not seasonally adjusted. This amounts to 1,452 unemployed people (Florida Research and Economic Database).
OUTLOOK SUMMARIES
The Sebring Metropolitan Statistical Area (MSA) is expected to have low levels of growth in its economic indicators. Sebring’s Gross Metro Product will be the lowest in the state at a level of $2,591.76. An average annual wage growth of 3.7 percent will lead to an average annual wage of $57,500, the 2nd lowest in the state. Personal incomes will grow by 4.3 percent. This will lead to a per capita income level of $37,700, the lowest in the state. Population growth will average 0.6 percent.
Employment growth is expected to contract on average at a rate of -0.4 percent annually, while the unemployment rate is estimated to average 6.8 percent, the highest in the state.
The Information Services sector will see the highest annual growth rate in the MSA at 5.5 percent. The Leisure and Hospitality sector will follow with a growth rate of 4.9 percent. The Manufacturing, as well as the Federal Government sectors, will contract at rates of -6.1 and -1.1 percent respectively.
METRO NEWS SUMMARIES
Agritourism venues look to expand business
• Visit Sebring held its first Agritourism Forum in September at the Highlands County Extension Office in Sebring. The event drew more than 30 participants, not just from Highlands County, but also DeSoto, Hardee, Martin, Okaloosa, and St. Lucie counties.
• Casey Hartt, lead marketing consultant for Visit Sebring, said subjects covered included how to finance operations, manage liability risks of having people on your farm and looking at new ways to have people learn about your business.
• Hartt said the forum came about after the 2021 stakeholder meetings, when agricultural stakeholders asked for a forum to learn more about how to make their operations touristfriendly and marketable.
Source: Highland News Sun, September 30, 2022
New business in store for Sebring
• Sebring Building Official Greg Griffin said the city had a preliminary meeting about two months ago on a site layout with Culver’s. He believes the restaurant chain will come back with a site plan in the not-too-distant future.
• In addition to the Culvers, a former Ruby Tuesdays is seeing new development as well with permits for a marijuana dispensary being filed for half of the site. The other half is being built to house a food service restaurant; however no permits have been filed for this unit yet.
• Finally, Chick-fil-a is in talks with Highlands County for a restaurant at the corner of Bayview
SEBRING Institute for Economic Forecasting 125
Drive and U.S. 27. This would mark the fast-food giants first foray into the Sebring area.
Source: Highland News Sun, October 16, 2022
World Racing League returns to Sebring
• A full field of 75 World Racing League (WRL) sports cars returned to Sebring in October, continuing a fall season of incredible racing at the Birthplace of American Endurance Racing.
• The race lasts 24 hours with 75 competitors. In comparison, the most famous race in Sebring, the annual 12 hours of Sebring, started with only 53 racers.
• The WRL’s 2021 Sebring event was the first continuous 24-hour endurance race in the history of the historic track. It was won by W2W Racing, with the team covering more than 1,993 miles in the victory.
Source: Highland News Sun, October 22, 2022
FEMA and SBA assisting in Hurricane Ian recovery locally
• In November, FEMA and the Small Business Administration hosted an informational session in partnership with Highlands County on how to help weather the lasting effects of Hurricane Ian.
• FEMA also began the process of hiring over 300 local employees to assist in their disaster relief efforts in the region
• SBA is providing two types of loans to small business owners in the area that need assistance with disaster relief. The first loan is the physical damage loan that covers damage to physical property. The other is the economic injury loan to help businesses that suffered financial damage as a result of the hurricane.
Source: Highland News-Sun, November 21, 2022
SEBRING 126 Florida & Metro Forecast / Winter 2023
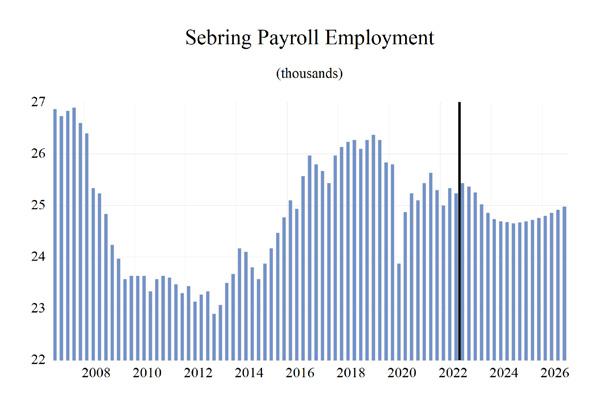
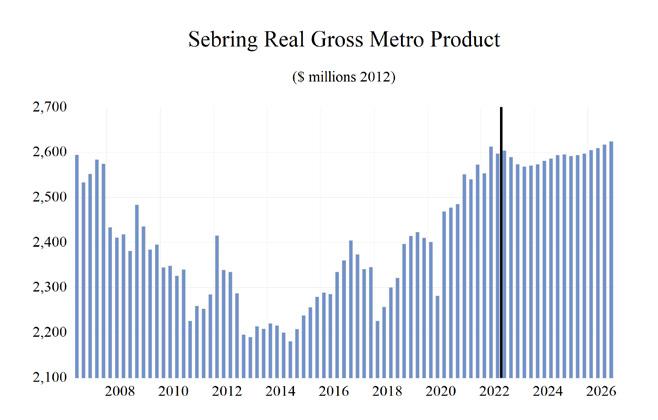
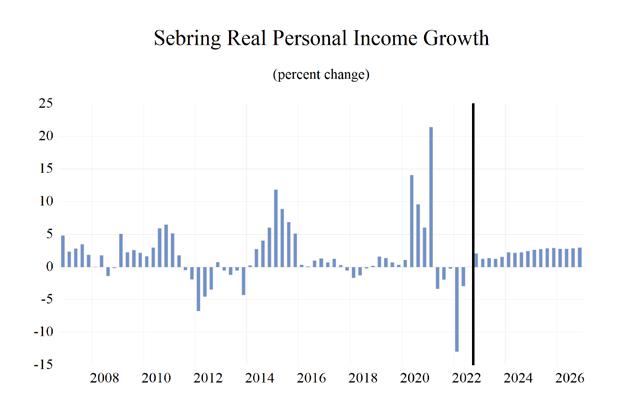
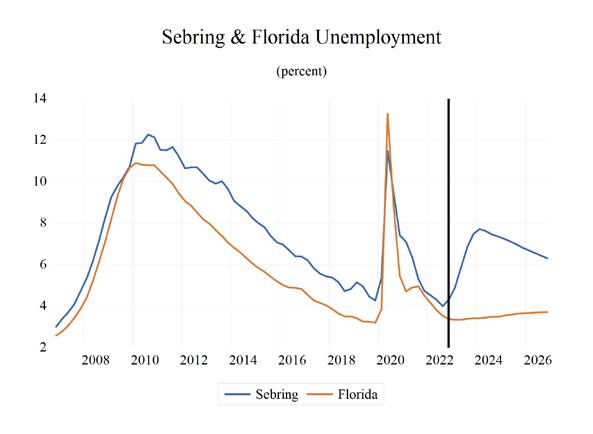
SEBRING Institute for Economic Forecasting 127 0 0.2 0.4 0.6 0.8 1 1.2 1.4 1.6 Total Nonagricultural Employment Total Private Goods Producing Service Producing Private Service Providing Government Sebring MSA Industry Loca�on Quo�ents
Long-Term Outlook for Sebring, FL December 2022 Forecast
SEBRING 128 Florida & Metro Forecast / Winter 2023
2018 2019 2020 2021 2022 2023 2024 2025 2026 Personal Income (Billions $) Total Personal Income 3.4 3.7 4.0 4.3 4.3 4.5 4.7 4.9 5.1 Pct Chg Year Ago 0.8 6.6 8.0 8.3 0.8 4.2 4.0 4.9 4.4 Wages and Salaries 1.1 1.1 1.2 1.2 1.3 1.4 1.4 1.5 1.5 Nonwage Income 2.3 2.5 2.8 3.0 3.0 3.1 3.3 3.5 3.6 Real Personal Income (12$) 3.5 3.7 3.9 4.1 3.9 3.9 4.0 4.1 4.2 Pct Chg Year Ago -3.5 4.4 7.2 3.9 -5.2 0.9 1.7 2.7 2.4 Per Capita Income (Ths) 34.3 36.3 39.0 41.5 41.1 42.3 43.7 45.7 47.6 Real Per Capita Income (12$) 35.1 36.4 38.8 39.6 36.9 36.8 37.2 38.1 38.9 Average Annual Wage (Ths) 41.7 43.3 46.2 48.9 52.6 54.0 56.7 58.7 60.7 Pct Chg Year Ago 0.8 3.9 6.5 6.0 7.4 2.7 5.0 3.5 3.4 Establishment Employment (Place of Work, Thousands, SA) Total Employment 26.2 26.2 24.9 25.4 25.3 25.1 24.7 24.7 24.9 Pct Chg Year Ago 1.8 0.0 -4.7 1.7 -0.5 -0.5 -1.7 0.1 0.7 Manufacturing 0.7 0.6 0.7 0.6 0.6 0.6 0.5 0.4 0.4 Pct Chg Year Ago -7.5 -5.5 2.3 -12.0 2.6 -6.5 -17.2 -7.2 -2.1 Nonmanufacturing 25.5 25.5 24.3 24.8 24.7 24.6 24.2 24.3 24.5 Pct Chg Year Ago 2.1 0.1 -4.9 2.1 -0.5 -0.4 -1.4 0.2 0.8 Construction & Mining 1.4 1.5 1.6 1.6 1.7 1.7 1.6 1.5 1.5 Pct Chg Year Ago 8.2 6.9 6.3 5.2 3.2 1.0 -4.9 -4.7 -3.1 Trade, Trans, & Utilities 5.8 5.8 5.5 5.6 5.4 5.3 5.2 5.2 5.2 Pct Chg Year Ago 2.7 -0.6 -3.7 0.2 -3.3 -1.3 -2.0 -0.4 0.3 Wholesale Trade 0.8 0.8 0.8 0.8 0.8 0.8 0.8 0.8 0.8 Retail Trade 4.0 4.0 3.8 3.8 3.7 3.6 3.5 3.5 3.5 Trans, Wrhsng, & Util 1.0 1.0 0.9 0.9 0.9 0.9 0.9 0.9 0.9 Information 0.2 0.2 0.1 0.2 0.2 0.2 0.1 0.1 0.1 Pct Chg Year Ago 2.7 -11.1 -8.0 35.0 -17.2 -5.6 -6.0 1.6 0.5 Financial Activities 0.9 1.0 0.9 0.9 0.8 0.9 0.9 0.9 0.9 Pct Chg Year Ago 3.9 7.0 -4.7 -0.8 -6.9 4.1 0.8 2.0 1.8 Prof & Business Services 2.6 2.3 2.1 2.5 2.6 2.4 2.2 2.2 2.3 Pct Chg Year Ago -13.5 -9.2 -8.0 16.2 5.6 -7.4 -9.6 0.5 2.9 Educ & Health Services 6.1 6.3 6.1 6.0 6.0 6.1 6.2 6.1 6.2 Pct Chg Year Ago 1.1 2.8 -3.2 -0.8 -0.9 2.0 0.6 -0.3 0.2 Leisure & Hospitality 3.6 3.6 3.1 3.2 3.3 3.2 3.2 3.4 3.5 Pct Chg Year Ago 9.9 0.1 -12.4 3.1 2.8 -1.6 -0.5 3.8 3.1 Other Services 0.7 0.7 0.6 0.6 0.6 0.6 0.6 0.6 0.7 Pct Chg Year Ago 6.1 -1.5 -7.3 -5.2 2.4 1.4 2.3 2.3 1.6 Federal Government 0.3 0.3 0.3 0.3 0.3 0.3 0.3 0.3 0.3 Pct Chg Year Ago -2.5 6.7 9.1 -9.8 2.7 -0.6 2.3 1.6 1.7 State & Local Government 4.1 4.1 3.8 3.9 3.8 3.8 3.9 3.9 3.9 Pct Chg Year Ago 5.4 -0.2 -5.5 0.9 -2.6 1.7 1.0 0.0 0.0 Other Economic Indicators Population (Ths) 100.5 101.2 101.6 103.5 105.2 106.4 107.1 107.5 107.8 Pct Chg Year Ago 0.3 0.7 0.4 1.9 1.7 1.1 0.7 0.4 0.3 Labor Force (Ths) 36.2 35.5 34.6 35.0 34.7 35.4 35.6 35.7 35.9 Percent Change, Year Ago 0.1 -1.9 -2.6 1.2 -0.9 2.2 0.5 0.2 0.5 Unemployment Rate (%) 5.0 4.7 8.4 5.9 4.3 6.3 7.5 7.0 6.5 Total Housing Starts 224.8 243.2 358.0 564.1 524.3 420.6 366.5 380.4 391.7 Single-Family 202.4 235.5 354.7 549.8 502.9 324.8 312.3 320.0 307.5 Multifamily 22.4 7.8 3.4 14.3 21.3 95.8 54.1 60.3 84.2
Short-Term Outlook for Sebring, FL
SEBRING Institute for Economic Forecasting 129
2022:4 2023:1 2023:2 2023:3 2023:4 2024:1 2024:2 2024:3 2024:4 2025:1 2025:2 2025:3 2025:4 Personal Income (Billions $) Total Personal Income 4.4 4.5 4.5 4.5 4.6 4.6 4.7 4.7 4.8 4.8 4.9 4.9 5.0 Pct Chg Year Ago 4.2 5.3 4.1 4.0 3.3 3.3 3.8 4.2 4.6 4.7 5.0 5.0 4.8 Wages and Salaries 1.4 1.4 1.4 1.4 1.4 1.4 1.4 1.4 1.4 1.4 1.5 1.5 1.5 Nonwage Income 3.1 3.1 3.1 3.2 3.2 3.2 3.3 3.3 3.3 3.4 3.4 3.5 3.5 Real Personal Income (12$) 3.9 3.9 3.9 3.9 3.9 4.0 4.0 4.0 4.0 4.1 4.1 4.1 4.1 Pct Chg Year Ago -1.5 0.6 0.9 1.1 0.8 1.0 1.4 1.9 2.3 2.6 2.8 2.8 2.8 Per Capita Income (Ths) 41.7 42.1 42.2 42.4 42.7 43.1 43.5 43.9 44.4 45.0 45.5 46.0 46.4 Real Per Capita Income (12$) 36.8 36.9 36.8 36.8 36.8 36.9 37.1 37.2 37.4 37.7 38.0 38.2 38.4 Average Annual Wage (Ths) 53.0 53.2 53.6 54.2 54.9 55.7 56.4 57.1 57.5 58.0 58.4 58.9 59.4 Pct Chg Year Ago 3.5 2.9 1.9 2.5 3.6 4.8 5.2 5.3 4.7 4.1 3.6 3.2 3.2 Establishment Employment (Place of Work, Thousands, SA) Total Employment 25.4 25.4 25.3 25.0 24.9 24.7 24.7 24.7 24.7 24.7 24.7 24.7 24.8 Pct Chg Year Ago 0.5 1.5 -0.3 -0.8 -2.3 -2.5 -2.2 -1.4 -0.8 -0.3 0.0 0.2 0.4 Manufacturing 0.6 0.6 0.6 0.5 0.5 0.5 0.5 0.5 0.4 0.4 0.4 0.4 0.4 Pct Chg Year Ago 3.0 1.4 -2.9 -9.2 -15.1 -17.6 -19.2 -17.5 -14.3 -10.4 -8.0 -5.7 -4.3 Nonmanufacturing 24.8 24.8 24.7 24.5 24.3 24.2 24.2 24.2 24.2 24.2 24.3 24.3 24.3 Pct Chg Year Ago 0.5 1.5 -0.3 -0.6 -2.0 -2.1 -1.8 -1.0 -0.5 -0.1 0.2 0.3 0.5 Construction & Mining 1.7 1.7 1.7 1.7 1.7 1.7 1.6 1.6 1.6 1.6 1.6 1.5 1.5 Pct Chg Year Ago 7.5 6.7 2.3 -1.3 -3.3 -4.8 -5.1 -4.6 -5.1 -5.3 -4.7 -4.5 -4.3 Trade, Trans, & Utilities 5.4 5.3 5.3 5.3 5.3 5.2 5.2 5.2 5.2 5.2 5.2 5.2 5.2 Pct Chg Year Ago -4.2 -1.3 -0.7 -1.5 -1.9 -1.9 -2.7 -1.8 -1.6 -1.1 -0.5 0.1 0.1 Wholesale Trade 0.8 0.8 0.8 0.8 0.8 0.8 0.8 0.8 0.8 0.8 0.8 0.8 0.8 Retail Trade 3.7 3.7 3.7 3.6 3.6 3.5 3.5 3.5 3.5 3.5 3.5 3.5 3.5 Trans, Wrhsng, & Util 0.9 0.9 0.9 0.9 0.9 0.9 0.9 0.9 0.9 0.9 0.9 0.9 0.9 Information 0.2 0.2 0.2 0.2 0.2 0.1 0.1 0.1 0.1 0.1 0.1 0.1 0.1 Pct Chg Year Ago -19.6 -6.3 -2.6 -5.3 -7.9 -7.3 -7.0 -6.6 -3.1 -0.3 1.5 2.9 2.3 Financial Activities 0.9 0.9 0.9 0.9 0.9 0.9 0.9 0.9 0.9 0.9 0.9 0.9 0.9 Pct Chg Year Ago -0.8 4.6 5.5 4.4 2.1 0.5 -0.1 1.4 1.5 2.1 2.4 1.9 1.7 Prof & Business Services 2.6 2.6 2.5 2.4 2.3 2.2 2.2 2.2 2.2 2.2 2.2 2.2 2.2 Pct Chg Year Ago -1.0 0.8 -5.4 -10.8 -14.3 -15.4 -11.3 -7.0 -3.4 -1.2 -0.3 1.2 2.4 Educ & Health Services 6.1 6.1 6.1 6.1 6.1 6.2 6.2 6.2 6.1 6.1 6.1 6.1 6.1 Pct Chg Year Ago 0.4 2.1 2.0 2.8 1.0 1.2 0.9 0.3 0.1 -0.1 -0.5 -0.4 -0.1 Leisure & Hospitality 3.3 3.3 3.2 3.3 3.2 3.2 3.2 3.3 3.3 3.3 3.3 3.4 3.4 Pct Chg Year Ago 8.8 1.3 -2.3 -2.4 -2.9 -2.4 -1.5 0.0 2.1 4.0 4.5 3.4 3.1 Other Services 0.6 0.6 0.6 0.6 0.6 0.6 0.6 0.6 0.6 0.6 0.6 0.6 0.6 Pct Chg Year Ago 4.2 2.6 0.9 1.2 0.9 1.5 2.6 2.7 2.5 2.5 2.5 2.2 2.0 Federal Government 0.3 0.3 0.3 0.3 0.3 0.3 0.3 0.3 0.3 0.3 0.3 0.3 0.3 Pct Chg Year Ago -3.6 -7.1 -4.5 5.9 4.3 3.5 2.6 1.6 1.7 1.4 1.1 1.9 1.8 State & Local Government 3.8 3.8 3.8 3.8 3.9 3.9 3.9 3.9 3.9 3.9 3.9 3.9 3.9 Pct Chg Year Ago -0.1 2.7 0.0 2.5 1.6 1.3 1.2 1.1 0.4 0.1 -0.2 -0.1 0.1 Other Economic Indicators Population (Ths) 105.8 106.1 106.3 106.5 106.7 106.9 107.0 107.2 107.3 107.4 107.5 107.5 107.6 Pct Chg Year Ago 1.6 1.4 1.2 1.1 0.9 0.8 0.7 0.6 0.6 0.5 0.4 0.3 0.3 Labor Force (Ths) 34.9 35.2 35.4 35.6 35.6 35.6 35.6 35.6 35.6 35.6 35.7 35.7 35.8 Pct Chg Year Ago 0.5 1.7 2.6 2.6 2.0 1.3 0.6 0.1 -0.1 0.0 0.2 0.4 0.4 Unemployment Rate (%) 4.3 4.9 5.9 6.8 7.5 7.7 7.6 7.5 7.4 7.2 7.1 7.0 6.8 Total Housing Starts 464.7 441.8 420.0 420.4 400.3 381.2 364.1 352.1 368.4 377.3 380.7 381.3 382.1 Single-Family 435.3 372.6 318.5 306.4 301.6 305.5 309.3 312.1 322.4 324.4 322.5 317.2 315.9 Multifamily 29.3 69.2 101.5 114.0 98.7 75.8 54.8 40.0 46.1 52.8 58.2 64.1 66.2
December 2022 Forecast
PROFILES
The Tallahassee MSA is comprised of Gadsden, Jefferson, Leon, and Wakulla Counties. It is located between Pensacola and Jacksonville. Tallahassee is the capital city of Florida and houses Florida State University and Florida A&M University.
QUICK FACTS
• Metro population estimate of 382,197 as of 2019 (5-Year Estimate) (U.S. Census Bureau).
• Gadsden County population estimate of 45,660 as of 2019 (5-Year Estimate) (U.S. Census Bureau).
• Jefferson County population estimate of 14,246 as of 2019 (5-Year Estimate) (U.S. Census Bureau).
• Leon County population estimate of 293,582 as of 2019 (5-Year Estimate) (U.S. Census Bureau).
• Wakulla County population estimate of 33,739 as of 2019 (5-Year Estimate) (U.S. Census Bureau).
• Civilian labor force of 205,321 in November 2022 (Florida Research and Economic Database).
• An unemployment rate of 2.7% as of November 2022, not seasonally adjusted. This amounts to 5,588 unemployed people (Florida Research and Economic Database).
OUTLOOK SUMMARIES
The Tallahassee MSA is expected to show average levels of growth in this forecast’s studied indicators. Tallahassee’s Gross Metro Product will be $17,349.17. Average annual wage growth of 3.3 percent should put the average annual wage at $63,700. Personal incomes will grow by 4.0 percent annually, placing the per capita income level at $48,300. Population growth will be 0.4 percent, the lowest in the state.
Average annual employment will remain unchanged, leading to an unemployment rate of 4.5 percent for the MSA.
The Leisure & Hospitality sector will lead Tallahassee at an average annual growth rate of 4.1 percent. The Other Services sector will expand at 3.9 percent. The Professional and Business Services sector will experience an average annual contraction of -2.5 percent.
METRO NEWS SUMMARIES
City of Tallahassee approves final negotiations with Burrell Aviation Tallahassee
• In September the City of Tallahassee approved another plan to further expand business at Tallahassee International Airport.
• The City of Tallahassee’s commissioners authorized either the city manager or a designee to finalize negotiations and execute the necessary agreements with Burrell Aviation Tallahassee, LLC for the lease and development of airport property and facilities at the Tallahassee International Airport.
• It is projected that the business venture at the airport will create 291 permanent jobs and over 250 temporary construction jobs during the development with a total economic impact exceeding $60 million.
Source: WXTL, September 22, 2022
Amazon last-mile facility delayed until 2023
• Amazon’s plans to build a last-mile facility in Tallahassee are still moving forward despite a delay and the company downshifting national expansion plans.
• Amazon hasn’t made an official announcement about building a last-mile facility; however several signs affirm the company’s interest: land purchased by the Amazon Services LLC and permit documents.
• Operating under the name Project Cyprus, the distribution center is slated for the southside of Northwest Passage off Capital Circle Northwest near Home Depot — roughly 15 miles away from the massive under-construction fulfillment center on Mahan Drive.
Source: Tallahassee Democrat, September 19, 2022
T ALLAHASSEE 130 Florida & Metro Forecast / Winter 2023
Florida State University breaks ground on new College of Business building
• In October, Florida State University broke ground on a new building for the College of Business named Legacy Hall. The building will be located next to the Donald L. Tucker Civic Center and will stand 5 stories tall.
• Once the project is complete, the building will become the largest academic building at Florida State. The new building will feature a financial trading room, a 300-seat auditorium, a central atrium, and space to accommodate future growth.
• The current building used by the College of Business has room to accommodate approximately 3000 students. The current enrollment of the college is over 8000 and growing so university officials hope the new building will help boost the national and global prestige of the college.
Source: WXTL, October 15, 2022
Tallahassee officials expect larger economic boost from FAMU’s homecoming vs pre-covid years
• Florida A&M University’s homecoming is a huge economic driver for the city of Tallahassee. According to Visit Tallahassee Officials. In 2019, pre-covid, FAMU’s homecoming brought in over 10,000 visitors and 3.5 million dollars in economic impact.
• Ren Williams is the owner of Kings Empire Entertainment. A company geared towards event production that helps create and develop events for artists, companies, and universities. Williams has worked with FAMU’s homecoming for the last 3 years adding that the week-long event alone drives 45% of his yearly revenue.
• A slew of upgrades to FAMU’s football stadium in addition to a marketing partnership with Nike is expected to create an even larger boost to the region’s economy than prior to the Covid-19 pandemic.
Source: WXTL, October 27, 2022
Leon County Commission approves $1 million for Tallahassee Housing Authority Orange Ave. Redevelopment
• In November, the Leon County Commission approved $1 million for the Orange Avenue Redevelopment project with the goal of stimulating economic development in the city’s Southside community.
• The Orange Avenue Redevelopment project which is set to bring over 400 new affordable housing units in 3 phases when it’s complete.
• Phase 1 is paid for, but Phase 2 needs a $2 million boost due to inflation, rising interest rates, supply chain issues, and increasing construction costs. The City of Tallahassee approved $1 million to the project and the $1 million from the Leon County Commission will provide the other half necessary for the development.
Source: WXTL, November 22, 2022
T ALLAHASSEE Institute for Economic Forecasting 131
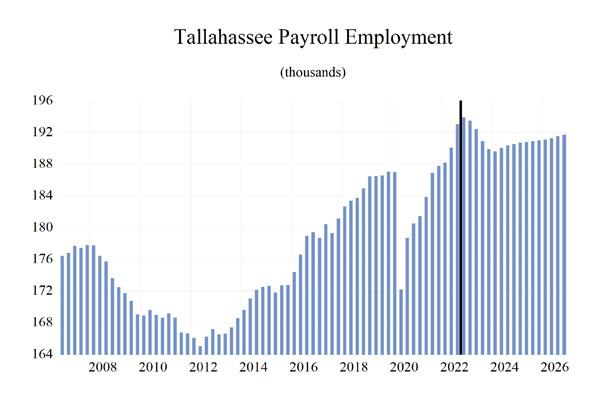
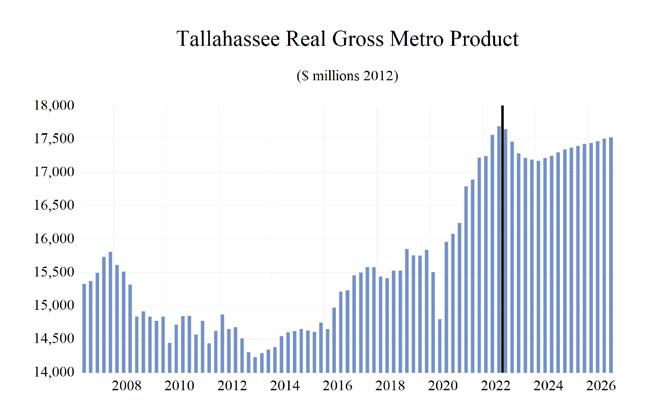
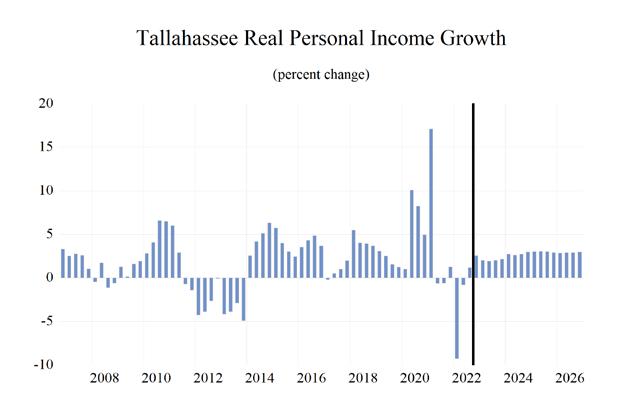
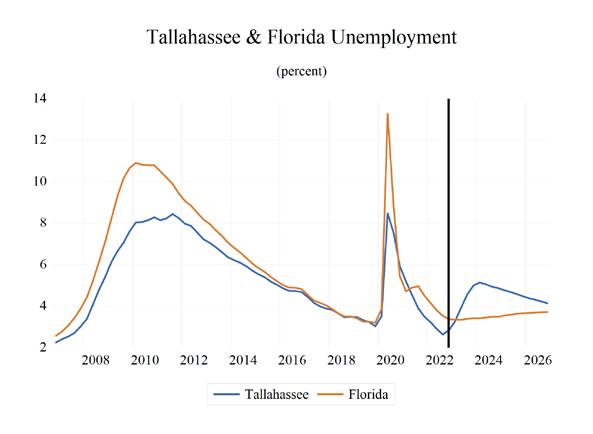
T ALLAHASSEE 132 Florida & Metro Forecast / Winter 2023 0 0.5 1 1.5 2 2.5 3 Total Nonagricultural Employment Total Private Goods Producing Service Producing Private Service Providing Mining, Logging, and Construc�on Manufacturing Trade, Transporta�on, and U�li�es Wholesale Trade Retail Trade Transporta�on, Warehousing, and U�li�es Informa�on Financial Ac�vi�es Professional and Business Services Educa�onal and Health Services Leisure and Hospitality Other Services Government Tallahassee MSA Industry Loca�on Quo�ents
Long-Term Outlook for Tallahassee, FL December 2022 Forecast
T ALLAHASSEE Institute for Economic Forecasting 133
2018 2019 2020 2021 2022 2023 2024 2025 2026 Personal Income (Billions $) Total Personal Income 16.3 17.2 18.4 20.2 21.1 21.8 22.6 23.7 24.7 Pct Chg Year Ago 4.9 5.5 6.9 9.5 4.4 3.5 3.8 4.7 4.1 Wages and Salaries 8.5 8.9 9.2 10.2 11.3 11.6 12.0 12.4 12.9 Nonwage Income 7.8 8.3 9.2 10.0 9.8 10.2 10.7 11.3 11.8 Real Personal Income (12$) 16.0 16.8 17.8 18.6 18.3 18.4 18.6 19.1 19.5 Pct Chg Year Ago 6.5 4.9 5.8 5.0 -1.8 0.3 1.5 2.5 2.1 Per Capita Income (Ths) 42.8 44.9 47.9 52.3 54.4 56.0 57.9 60.4 62.7 Real Per Capita Income (12$) 42.0 43.8 46.2 48.4 47.4 47.2 47.7 48.8 49.6 Average Annual Wage (Ths) 46.3 47.7 51.1 55.0 58.8 60.1 62.7 64.9 67.1 Pct Chg Year Ago 2.4 3.0 7.2 7.7 6.9 2.2 4.3 3.5 3.4 Establishment Employment (Place of Work, Thousands, SA) Total Employment 183.7 186.7 179.6 185.0 191.3 191.7 190.1 190.9 191.4 Pct Chg Year Ago 2.1 1.6 -3.8 3.0 3.4 0.2 -0.8 0.4 0.3 Manufacturing 3.2 3.4 3.4 3.7 3.9 3.8 3.5 3.5 3.4 Pct Chg Year Ago 0.3 4.6 1.5 10.0 4.0 -2.1 -7.1 -2.6 -0.9 Nonmanufacturing 180.5 183.3 176.2 181.2 187.4 187.8 186.6 187.4 188.0 Pct Chg Year Ago 2.1 1.6 -3.9 2.9 3.4 0.2 -0.7 0.4 0.3 Construction & Mining 8.0 8.7 8.3 8.2 8.0 8.0 7.7 7.6 7.5 Pct Chg Year Ago 8.2 9.4 -4.7 -2.2 -1.5 -0.6 -3.3 -2.2 -0.8 Trade, Trans, & Utilities 24.5 24.6 23.6 24.7 25.9 25.6 24.9 24.6 24.4 Pct Chg Year Ago 0.8 0.3 -4.0 4.5 5.0 -1.1 -2.7 -1.3 -0.8 Wholesale Trade 3.8 3.9 3.8 3.9 4.0 4.2 4.3 4.3 4.3 Retail Trade 18.5 18.5 17.6 18.4 19.4 18.8 17.9 17.6 17.4 Trans, Wrhsng, & Util 2.1 2.2 2.2 2.4 2.5 2.6 2.7 2.7 2.7 Information 3.1 3.1 3.1 3.4 3.4 3.3 3.2 3.1 3.1 Pct Chg Year Ago -8.3 0.0 0.8 7.6 1.4 -3.8 -3.7 -0.6 -2.6 Financial Activities 7.9 7.8 7.6 7.9 8.4 8.6 8.5 8.5 8.5 Pct Chg Year Ago 2.1 -2.2 -2.3 4.7 5.9 2.3 -0.9 0.2 0.1 Prof & Business Services 21.6 22.3 22.9 24.9 26.3 24.9 23.2 23.8 24.5 Pct Chg Year Ago 6.5 3.3 2.9 8.5 5.9 -5.3 -7.1 2.7 2.9 Educ & Health Services 24.0 24.8 24.5 24.7 25.5 26.3 26.8 26.8 26.8 Pct Chg Year Ago 3.4 3.2 -1.2 1.0 3.1 3.1 1.9 -0.1 0.0 Leisure & Hospitality 20.4 21.0 16.6 18.8 20.7 20.6 21.2 21.6 21.6 Pct Chg Year Ago 1.8 2.8 -20.6 12.8 10.4 -0.5 2.9 1.7 0.3 Other Services 9.4 9.0 8.7 8.5 9.1 9.3 9.7 10.1 10.4 Pct Chg Year Ago 6.3 -4.0 -4.0 -2.0 7.2 2.0 4.7 4.0 3.2 Federal Government 2.0 2.1 2.2 2.1 2.2 2.2 2.2 2.2 2.2 Pct Chg Year Ago -2.8 4.1 3.2 -2.7 2.5 3.5 -0.4 -1.0 -1.2 State & Local Government 59.5 60.0 58.6 58.2 57.9 59.0 59.2 59.1 59.0 Pct Chg Year Ago 0.3 0.7 -2.2 -0.8 -0.5 2.0 0.2 0.0 -0.2 Other Economic Indicators Population (Ths) 381.5 383.5 384.6 385.6 386.7 388.9 390.7 391.9 393.2 Pct Chg Year Ago 0.3 0.5 0.3 0.3 0.3 0.6 0.5 0.3 0.3 Labor Force (Ths) 191.1 192.8 189.3 194.5 199.7 203.0 202.0 201.3 200.8 Percent Change, Year Ago 1.1 0.9 -1.8 2.8 2.7 1.6 -0.5 -0.3 -0.2 Unemployment Rate (%) 3.6 3.3 6.4 4.3 2.9 4.2 5.0 4.6 4.3 Total Housing Starts 2982.4 2320.8 2350.6 2616.6 2729.8 1807.1 1714.1 1940.5 2006.7 Single-Family 2014.1 1184.9 1292.1 1541.9 1376.3 935.8 946.9 987.7 962.0 Multifamily 968.3 1135.9 1058.4 1074.7 1353.5 871.4 767.1 952.9 1044.7
Short-Term Outlook for Tallahassee, FL
T ALLAHASSEE 134 Florida & Metro Forecast / Winter 2023
December
2022:4 2023:1 2023:2 2023:3 2023:4 2024:1 2024:2 2024:3 2024:4 2025:1 2025:2 2025:3 2025:4 Personal Income (Billions $) Total Personal Income 21.5 21.7 21.7 21.8 22.0 22.2 22.5 22.8 23.0 23.3 23.6 23.8 24.1 Pct Chg Year Ago 5.9 5.8 3.7 2.5 2.2 2.6 3.6 4.4 4.8 4.8 4.8 4.6 4.4 Wages and Salaries 11.5 11.5 11.5 11.6 11.6 11.7 11.9 12.1 12.2 12.3 12.4 12.5 12.6 Nonwage Income 10.0 10.1 10.2 10.3 10.4 10.5 10.6 10.7 10.9 11.0 11.2 11.3 11.5 Real Personal Income (12$) 18.4 18.4 18.4 18.3 18.4 18.5 18.6 18.7 18.8 19.0 19.1 19.2 19.3 Pct Chg Year Ago 0.1 1.1 0.4 -0.3 -0.2 0.3 1.2 2.1 2.5 2.7 2.6 2.5 2.4 Per Capita Income (Ths) 55.5 55.8 55.9 56.1 56.4 57.0 57.6 58.2 58.9 59.6 60.1 60.7 61.3 Real Per Capita Income (12$) 47.4 47.4 47.2 47.1 47.1 47.3 47.6 47.9 48.1 48.4 48.7 48.9 49.1 Average Annual Wage (Ths) 59.3 59.4 59.8 60.3 61.0 61.7 62.4 63.1 63.6 64.2 64.6 65.1 65.7 Pct Chg Year Ago 3.5 2.6 1.6 1.9 2.9 4.0 4.4 4.6 4.3 3.9 3.5 3.2 3.2 Establishment Employment (Place of Work, Thousands, SA) Total Employment 193.9 193.5 192.4 190.9 189.9 189.6 190.0 190.4 190.5 190.7 190.8 190.9 191.0 Pct Chg Year Ago 3.3 2.8 1.2 -1.1 -2.1 -2.0 -1.2 -0.3 0.3 0.6 0.4 0.3 0.3 Manufacturing 3.9 3.9 3.9 3.8 3.7 3.6 3.6 3.5 3.5 3.5 3.5 3.4 3.4 Pct Chg Year Ago 4.1 1.9 0.3 -3.5 -6.7 -8.0 -8.3 -7.1 -5.0 -3.6 -2.9 -2.2 -1.7 Nonmanufacturing 190.0 189.6 188.5 187.1 186.2 186.0 186.5 186.8 187.0 187.2 187.3 187.5 187.6 Pct Chg Year Ago 3.3 2.8 1.2 -1.1 -2.0 -1.9 -1.1 -0.1 0.5 0.6 0.5 0.3 0.3 Construction & Mining 8.1 8.1 8.0 7.9 7.9 7.8 7.7 7.7 7.7 7.6 7.6 7.5 7.5 Pct Chg Year Ago 0.4 1.2 1.6 -2.0 -3.2 -4.0 -3.7 -2.7 -2.7 -2.7 -2.1 -2.0 -2.0 Trade, Trans, & Utilities 26.1 25.9 25.9 25.4 25.2 25.1 24.9 24.9 24.8 24.7 24.6 24.6 24.5 Pct Chg Year Ago 3.4 1.5 0.4 -3.0 -3.4 -3.1 -3.8 -2.1 -1.8 -1.6 -1.2 -1.2 -1.1 Wholesale Trade 4.1 4.1 4.2 4.2 4.2 4.2 4.3 4.3 4.3 4.3 4.3 4.3 4.3 Retail Trade 19.5 19.2 19.2 18.6 18.4 18.2 17.9 17.9 17.8 17.7 17.6 17.6 17.5 Trans, Wrhsng, & Util 2.5 2.6 2.6 2.6 2.6 2.7 2.7 2.7 2.7 2.7 2.7 2.7 2.7 Information 3.4 3.4 3.3 3.3 3.2 3.2 3.2 3.2 3.2 3.2 3.1 3.1 3.1 Pct Chg Year Ago 2.0 0.0 -4.0 -4.2 -7.0 -5.5 -4.1 -3.7 -1.6 -0.6 -0.7 -0.3 -0.8 Financial Activities 8.6 8.7 8.6 8.5 8.5 8.5 8.5 8.5 8.5 8.5 8.5 8.5 8.5 Pct Chg Year Ago 4.4 5.2 3.5 1.2 -0.8 -1.9 -1.4 -0.1 0.0 0.3 0.2 0.2 0.1 Prof & Business Services 26.6 26.5 25.4 24.3 23.5 23.1 23.1 23.1 23.3 23.5 23.7 23.9 24.1 Pct Chg Year Ago 4.6 2.3 -2.9 -8.4 -12.0 -12.9 -9.2 -4.8 -0.8 1.6 2.6 3.1 3.3 Educ & Health Services 26.1 26.1 26.2 26.4 26.4 26.6 26.8 26.9 26.8 26.8 26.8 26.7 26.7 Pct Chg Year Ago 5.0 5.0 4.0 2.3 1.2 1.9 2.4 1.9 1.6 0.7 -0.2 -0.5 -0.4 Leisure & Hospitality 20.9 20.5 20.5 20.7 20.7 20.8 21.2 21.4 21.5 21.6 21.6 21.6 21.6 Pct Chg Year Ago 7.3 3.6 -2.7 -1.7 -1.0 1.2 3.4 3.2 4.0 3.8 1.9 0.9 0.1 Other Services 9.3 9.2 9.2 9.3 9.4 9.6 9.7 9.8 9.9 10.0 10.1 10.2 10.2 Pct Chg Year Ago 6.0 3.8 1.5 1.3 1.6 3.3 5.4 5.2 4.9 4.6 4.1 3.9 3.6 Federal Government 2.2 2.2 2.3 2.3 2.2 2.2 2.2 2.2 2.2 2.2 2.2 2.2 2.2 Pct Chg Year Ago 2.4 3.2 4.8 3.9 1.9 0.6 -0.8 -0.8 -0.7 -0.8 -0.9 -1.0 -1.1 State & Local Government 58.6 58.9 59.1 59.1 59.1 59.2 59.2 59.2 59.2 59.2 59.2 59.1 59.1 Pct Chg Year Ago 0.4 2.3 3.5 1.3 0.9 0.5 0.1 0.2 0.1 0.0 0.0 -0.1 -0.1 Other Economic Indicators Population (Ths) 387.7 388.2 388.6 389.0 389.5 390.1 390.6 391.0 391.3 391.5 391.8 392.0 392.4 Pct Chg Year Ago 0.5 0.6 0.6 0.6 0.5 0.5 0.5 0.5 0.5 0.4 0.3 0.3 0.3 Labor Force (Ths) 202.0 202.7 203.2 203.1 202.8 202.4 202.0 201.8 201.6 201.4 201.3 201.3 201.1 Pct Chg Year Ago 3.0 2.7 2.1 1.2 0.4 -0.1 -0.6 -0.6 -0.6 -0.5 -0.4 -0.3 -0.3 Unemployment Rate (%) 2.8 3.3 3.9 4.6 5.0 5.1 5.1 4.9 4.9 4.8 4.7 4.6 4.5 Total Housing Starts 2426.3 2146.2 1819.9 1680.6 1581.9 1600.0 1665.7 1753.8 1836.8 1897.2 1939.6 1952.4 1972.8 Single-Family 1143.6 1059.3 923.0 890.4 870.3 885.6 943.0 968.9 990.4 997.5 991.0 980.2 981.9 Multifamily 1282.6 1086.9 896.9 790.1 711.6 714.4 722.7 784.9 846.5 899.6 948.6 972.2 990.9
2022 Forecast
PROFILES
The Tampa–St. Petersburg–Clearwater MSA is comprised of Hernando, Hillsborough, Pasco, and Pinellas counties. Located centrally on the west coast of Florida, this region includes Tarpon Springs, Sponge Docks, Ybor City, Bush Gardens, the University of South Florida, and the University of Tampa. The Tampa Bay Buccaneers and the Tampa Bay Rays call this region home.
QUICK FACTS
• Metro population estimate of 3,097,859 as of 2019 (5-Year Estimate) (U.S. Census Bureau).
• Hernando County population estimate of 193,920 as of 2019 (5-Year Estimate) (U.S. Census Bureau).
• Hillsborough County population estimate of 1,471,968 as of 2019 (5-Year Estimate) (U.S. Census Bureau).
• Pasco County population estimate of 553,947 as of 2019 (5-Year Estimate) (U.S. Census Bureau).
• Pinellas County population estimate of 974,996 as of 2019 (5-Year Estimate) (U.S. Census Bureau).
• Civilian labor force of 1,663,311 in November 2022 (Florida Research and Economic Database).
• An unemployment rate of 2.6% as of November 2022, not seasonally adjusted. This amounts to 42,670 unemployed people (Florida Research and Economic Database).
OUTLOOK SUMMARIES
The Tampa—St. Petersburg—Clearwater Metropolitan Statistical Area (MSA) is expected to show below-average levels of growth in the economic indicators relative to the other MSAs studied. The Tampa MSA will contribute the second-highest level of Gross Metro Product in the state at $162,380.83. Average annual wage growth of 3.5 percent will give the MSA the 6th highest annual wage in the state at $75,700. Personal income growth of 4.3 percent, ranking 18th in the state, will place the per capita income level at $49,400. Tampa will experience a modest population growth of 1.0 percent. Employment is expected to contract by -0.5 percent
annually. The MSA’s unemployment rate should average 5.1 percent.
The fastest growing sector in the Tampa area will be the Other Services sector with an average annual growth rate of 2.8 percent. This is followed by the Financial Services sector with an average annual growth rate of 2.0 percent. The Professional and Business Services sector will experience a contraction of -3.5% annually.
METRO NEWS SUMMARIES
Tampa Airport’s first new airside terminal gets final approval
• The third and final phase of a yearslong master plan has at last been made concrete as the Hillsborough County Aviation Authority approves the $787.4 million in funding needed for a new terminal’s construction. Funding for the project came from airport-issued bonds and federal and state grants.
• The pandemic caused delays to this project, and these delays—combined with inflation—raised cost estimates by nearly $100 million.
• The new wing will add 16 new gates and will be a step closer to TPA’s goal of increasing passenger capacity by 13 million before 2037. The airport has not undergone such a major project since spending $135 million to add 16 additional gates to Airside C in 2005.
Source: Axios, September 9, 2022
Tampa rental assistance program now accepting applications after 6-month pause
• In March, the Rental & Move-In Assistance Program (RMAP) first went online, proceeded to receive over 960 applications, and promptly shut down again. Now, 6 months later, they have partially reopened to accept 250 additional applications.
• Originally allocation was $1 million, but the city recognized the need and added $4 million in funds with the intent to approve another $1 million in 2023.
T AMPA – S T . P ETERSBURG – C LEARWATER Institute for Economic Forecasting 135
• Awards average about $10,000. Landlords are not an obstacle in receiving aid, and the maximum duration of support is 12 months. The current rent crisis means a qualifying applicant could potentially be a single individual making up to $80,000.
Source: WTSP, October 5, 2022
Infrastructure repairs happening in East Tampa, West Tampa with pipe lining
• Kiewit Infrastructure South Co. has been contracted to repair 25 miles of pipe using an innovative technique called “pipelining,” which is low-cost and does not require excavation and destruction of property. Instead, old pipes are reinforced from the inside using resin, which extends their lifespan and prevents serious backups or other complex issues.
• Tampa’s wastewater piping is old, with some pipes being around for nearly a century and caveins becoming over 25% more frequent in the past 2 years.
• This project is part of PIPES (Progressive Infrastructure Planning to Ensure Sustainability). Since the program’s inception 3 years ago, more than 100 miles of essential wastewater reconstructions have been approved, costing $61 million.
Source: City of Tampa, November 16, 2022
New multipurpose sports field, fitness trail & courts coming to Forest Hills Park
• Tampa’s city council has approved the Forest Hills Park Renovation & Recreation Trail Improvement Project, which will include over $4.2 million in upgrades. Construction is expected to be completed in Fall 2023.
• Enhancements include basketball, pickleball, and tennis courts; a 0.6-mile fitness trail; and a sports field with bleachers allowing for a broad range of community fitness events.
• Aside from new facilities, there will be ADA access improvements as well as stormwater drainage solutions. For example, the new fields and courts will be built at higher elevations to prevent flooding.
Source: City of Tampa, November 29, 2023
Tampa CRA boosts funding for affordable housing
• The city of Tampa has a serious housing shortage for low-income people and families. The city’s CRA (Community Redevelopment Agency) has nearly doubled the budget for affordable housing to over $50 million for the 2023 fiscal year— reaching their 30% budget goal.
• The money comes from interest earnings and increment revenue from Tampa’s 8 CRA districts.
• Areas with substandard buildings and living conditions can be designated as Community Redevelopment Areas by the local government. All the tax revenue from an area must go toward that same area’s redevelopment initiatives.
Source: City of Tampa, December 9, 2022
Tampa Convention Center – Capital Improvements
• The $38 million Capital Improvement Plan will be the convention center’s largest renovation in history, with a total allocation of $38 million. The construction is intended to improve customer experience, increase efficiency, and save money. The expected completion date is June 2023.
• Existing meeting rooms will be refurbished, and 18 new rooms will be added for an additional 16,000 square feet of usable space, including new waterfront rooms with an attached terrace.
• The renovations will span two different floors and will include a new service elevator and a set of new restrooms.
Source: City of Tampa, December 15, 2022
T AMPA – S T . P ETERSBURG – C LEARWATER 136 Florida & Metro Forecast / Winter 2023

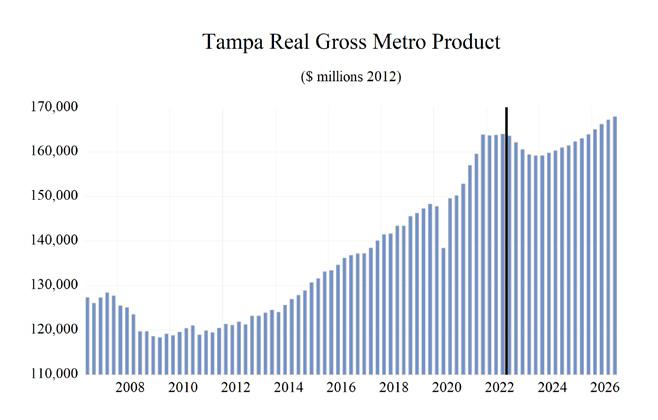
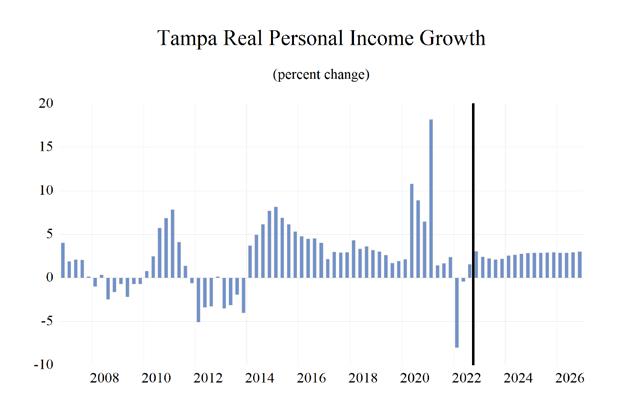
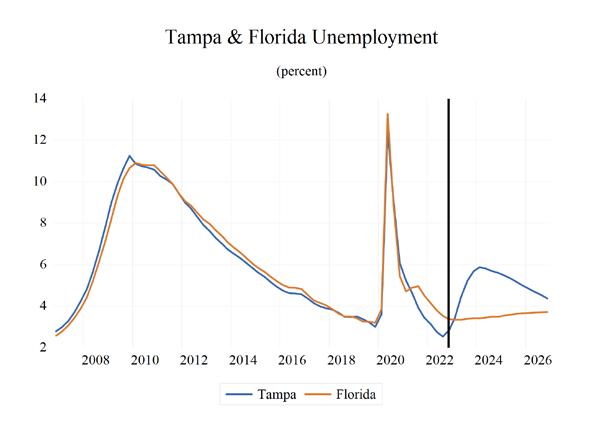
T AMPA – S T . P ETERSBURG – C LEARWATER Institute for Economic Forecasting 137 0 0.2 0.4 0.6 0.8 1 1.2 1.4 Total Nonagricultural Employment Total Private Goods Producing Service Producing Private Service Providing Mining, Logging, and Construc�on Manufacturing Trade, Transporta�on, and U�li�es Wholesale Trade Retail Trade Transporta�on, Warehousing, and U�li�es Informa�on Financial Ac�vi�es Professional and Business Services Educa�onal and Health Services Leisure and Hospitality Other Services Government Tampa - St. Petersburg - Clearwater Industry Loca�on Quo�ents
Long-Term Outlook for Tampa-St. Petersburg-Clearwater, FL December 2022 Forecast
T AMPA – S T . P ETERSBURG – C LEARWATER 138 Florida & Metro Forecast / Winter 2023
2018 2019 2020 2021 2022 2023 2024 2025 2026 Personal Income (Billions $) Total Personal Income 149.2 159.4 171.4 187.7 195.7 202.6 209.7 220.7 231.5 Pct Chg Year Ago 5.4 6.8 7.5 9.5 4.3 3.5 3.5 5.2 4.9 Wages and Salaries 74.8 79.5 83.0 92.5 102.6 104.1 105.8 109.8 115.1 Nonwage Income 74.4 79.9 88.5 95.3 93.1 98.4 103.9 111.0 116.4 Real Personal Income (12$) 144.8 150.8 155.5 163.3 160.2 160.5 162.5 167.5 172.4 Pct Chg Year Ago 4.9 4.1 3.1 5.0 -1.9 0.2 1.2 3.1 2.9 Per Capita Income (Ths) 47.9 50.6 53.8 58.2 59.9 61.3 62.8 65.4 68.0 Real Per Capita Income (12$) 46.5 47.9 48.8 50.7 49.0 48.5 48.7 49.7 50.7 Average Annual Wage (Ths) 54.9 56.9 61.3 65.5 69.6 71.5 74.6 77.1 79.8 Pct Chg Year Ago 3.5 3.7 7.8 6.9 6.1 2.8 4.3 3.4 3.5 Establishment Employment (Place of Work, Thousands, SA) Total Employment 1351.2 1384.5 1341.1 1397.8 1463.2 1444.1 1406.9 1412.3 1430.9 Pct Chg Year Ago 2.3 2.5 -3.1 4.2 4.7 -1.3 -2.6 0.4 1.3 Manufacturing 67.3 69.0 66.9 68.6 71.4 69.8 65.4 64.5 65.1 Pct Chg Year Ago 1.3 2.5 -3.0 2.6 4.1 -2.3 -6.3 -1.3 0.8 Nonmanufacturing 1283.9 1315.5 1274.2 1329.1 1391.8 1374.4 1341.5 1347.8 1365.9 Pct Chg Year Ago 2.3 2.5 -3.1 4.3 4.7 -1.3 -2.4 0.5 1.3 Construction & Mining 78.4 81.9 83.0 86.2 87.7 86.6 83.6 82.6 83.1 Pct Chg Year Ago 6.0 4.6 1.3 3.8 1.8 -1.2 -3.5 -1.2 0.6 Trade, Trans, & Utilities 249.0 252.1 248.9 260.1 274.6 268.5 261.2 259.4 259.0 Pct Chg Year Ago 0.7 1.2 -1.2 4.5 5.6 -2.2 -2.7 -0.7 -0.1 Wholesale Trade 53.1 54.3 54.5 56.5 61.6 63.7 64.6 64.9 65.1 Retail Trade 160.4 158.7 153.7 160.3 166.8 158.4 150.1 148.1 147.5 Trans, Wrhsng, & Util 35.5 39.0 40.8 43.3 46.1 46.4 46.5 46.4 46.4 Information 25.8 25.8 24.6 26.7 28.1 27.6 27.2 27.7 27.5 Pct Chg Year Ago 2.0 0.0 -4.4 8.4 5.1 -1.8 -1.2 1.6 -0.5 Financial Activities 116.9 121.7 123.9 129.2 136.2 136.6 141.0 144.4 147.2 Pct Chg Year Ago 3.8 4.1 1.8 4.3 5.4 0.3 3.2 2.5 1.9 Prof & Business Services 241.0 247.8 247.9 263.2 273.2 250.0 220.3 222.0 234.0 Pct Chg Year Ago 2.5 2.8 0.1 6.2 3.8 -8.5 -11.9 0.8 5.4 Educ & Health Services 211.0 218.7 213.9 217.7 223.4 230.9 235.4 235.8 236.5 Pct Chg Year Ago 2.8 3.7 -2.2 1.8 2.6 3.4 2.0 0.1 0.3 Leisure & Hospitality 158.9 162.7 133.8 148.3 168.0 168.3 163.3 163.6 163.9 Pct Chg Year Ago 3.7 2.4 -17.8 10.9 13.3 0.2 -3.0 0.2 0.2 Other Services 46.8 47.5 43.3 44.9 48.5 51.4 52.8 53.7 54.2 Pct Chg Year Ago 2.5 1.4 -8.8 3.7 8.1 5.9 2.9 1.7 0.8 Federal Government 25.2 26.7 28.4 28.7 28.9 28.7 28.9 29.2 29.4 Pct Chg Year Ago 1.8 5.8 6.3 1.2 0.5 -0.7 0.8 1.0 0.9 State & Local Government 131.0 130.6 126.5 124.2 123.2 125.8 127.7 129.4 130.9 Pct Chg Year Ago -0.4 -0.3 -3.2 -1.8 -0.8 2.1 1.6 1.3 1.1 Other Economic Indicators Population (Ths) 3113.6 3150.2 3187.2 3223.9 3267.4 3306.0 3339.7 3373.7 3403.0 Pct Chg Year Ago 1.4 1.2 1.2 1.2 1.3 1.2 1.0 1.0 0.9 Labor Force (Ths) 1513.9 1541.8 1543.3 1574.1 1626.0 1651.5 1653.9 1658.9 1665.3 Percent Change, Year Ago 1.3 1.8 0.1 2.0 3.3 1.6 0.1 0.3 0.4 Unemployment Rate (%) 3.6 3.3 7.8 4.3 2.8 4.7 5.7 5.2 4.6 Total Housing Starts 16712.6 21450.7 20383.2 23148.4 25021.6 21221.9 19990.7 21357.0 21653.8 Single-Family 13666.2 14867.1 15630.2 18706.1 15493.4 12214.8 14267.6 15242.3 15026.0 Multifamily 3046.4 6583.5 4753.0 4442.3 9528.2 9007.0 5723.1 6114.7 6627.8
Short-Term Outlook for Tampa-St. Petersburg-Clearwater, FL December 2022 Forecast
T AMPA – S T . P ETERSBURG – C LEARWATER Institute for Economic Forecasting 139
2022:4 2023:1 2023:2 2023:3 2023:4 2024:1 2024:2 2024:3 2024:4 2025:1 2025:2 2025:3 2025:4 Personal Income (Billions $) Total Personal Income 199.9 202.1 202.0 202.6 203.5 206.0 208.4 211.0 213.6 216.7 219.5 222.1 224.6 Pct Chg Year Ago 5.3 5.8 3.9 2.5 1.8 1.9 3.1 4.1 4.9 5.2 5.3 5.3 5.2 Wages and Salaries 104.8 104.6 104.3 103.9 103.8 104.3 105.3 106.3 107.2 108.1 109.2 110.3 111.5 Nonwage Income 95.1 97.5 97.7 98.8 99.7 101.6 103.1 104.7 106.4 108.6 110.3 111.8 113.1 Real Personal Income (12$) 160.9 161.4 160.6 160.1 159.8 160.8 162.0 163.1 164.1 165.7 167.0 168.2 169.3 Pct Chg Year Ago -0.4 1.2 0.7 -0.4 -0.6 -0.3 0.8 1.8 2.7 3.0 3.1 3.1 3.1 Per Capita Income (Ths) 60.9 61.4 61.2 61.2 61.3 61.9 62.5 63.1 63.7 64.5 65.1 65.8 66.4 Real Per Capita Income (12$) 49.0 49.0 48.6 48.4 48.2 48.3 48.6 48.8 49.0 49.3 49.6 49.8 50.0 Average Annual Wage (Ths) 70.1 70.4 71.1 71.9 72.6 73.5 74.3 75.0 75.6 76.2 76.8 77.4 78.0 Pct Chg Year Ago 2.1 2.1 2.4 3.1 3.6 4.3 4.4 4.3 4.1 3.7 3.4 3.2 3.2 Establishment Employment (Place of Work, Thousands, SA) Total Employment 1483.4 1473.1 1454.2 1432.5 1416.8 1408.5 1406.2 1406.3 1406.4 1407.8 1410.2 1413.7 1417.7 Pct Chg Year Ago 4.2 2.3 -0.1 -2.9 -4.5 -4.4 -3.3 -1.8 -0.7 -0.1 0.3 0.5 0.8 Manufacturing 72.4 71.6 70.8 69.3 67.4 66.2 65.7 65.0 64.7 64.5 64.5 64.5 64.5 Pct Chg Year Ago 3.1 2.0 -0.3 -3.8 -6.9 -7.5 -7.3 -6.2 -4.0 -2.6 -1.7 -0.8 -0.2 Nonmanufacturing 1411.0 1401.5 1383.4 1363.2 1349.4 1342.3 1340.6 1341.3 1341.7 1343.2 1345.7 1349.2 1353.1 Pct Chg Year Ago 4.2 2.4 -0.1 -2.8 -4.4 -4.2 -3.1 -1.6 -0.6 0.1 0.4 0.6 0.8 Construction & Mining 88.6 88.5 87.1 85.7 85.3 84.4 83.6 83.3 83.1 82.7 82.7 82.5 82.5 Pct Chg Year Ago 0.9 1.3 0.1 -2.5 -3.7 -4.6 -4.0 -2.8 -2.6 -2.0 -1.1 -0.9 -0.7 Trade, Trans, & Utilities 276.0 272.6 270.9 266.0 264.5 263.0 261.0 260.7 260.1 259.5 259.3 259.5 259.2 Pct Chg Year Ago 4.3 0.3 -1.2 -3.7 -4.2 -3.5 -3.7 -2.0 -1.7 -1.3 -0.7 -0.5 -0.3 Wholesale Trade 63.5 63.8 63.4 63.6 63.9 64.2 64.5 64.7 64.8 64.8 64.8 64.9 65.0 Retail Trade 165.9 162.1 161.0 156.2 154.4 152.2 149.8 149.5 148.9 148.3 148.0 148.2 147.8 Trans, Wrhsng, & Util 46.6 46.7 46.5 46.2 46.3 46.5 46.6 46.5 46.4 46.4 46.4 46.4 46.4 Information 28.4 28.0 27.7 27.4 27.1 27.0 27.2 27.3 27.3 27.5 27.6 27.8 27.7 Pct Chg Year Ago 2.5 0.9 -0.2 -3.1 -4.7 -3.5 -1.7 -0.5 1.0 1.8 1.6 1.7 1.3 Financial Activities 138.4 137.5 135.6 136.0 137.5 139.0 140.5 141.6 142.6 143.6 144.3 144.6 145.2 Pct Chg Year Ago 4.5 2.1 0.6 -0.7 -0.7 1.1 3.7 4.1 3.7 3.3 2.6 2.1 1.8 Prof & Business Services 273.1 270.6 257.5 242.1 230.0 223.3 220.4 219.0 218.3 219.1 220.5 222.8 225.7 Pct Chg Year Ago 1.1 -0.7 -5.9 -11.6 -15.8 -17.5 -14.4 -9.5 -5.1 -1.9 0.0 1.7 3.4 Educ & Health Services 228.9 229.7 229.8 231.6 232.5 234.1 235.6 236.1 235.9 235.9 235.6 235.8 235.8 Pct Chg Year Ago 4.2 4.9 4.8 2.2 1.6 1.9 2.5 2.0 1.4 0.8 0.0 -0.2 0.0 Leisure & Hospitality 173.5 170.0 169.7 168.2 165.2 163.1 163.1 163.2 163.8 163.4 163.7 163.6 163.9 Pct Chg Year Ago 13.4 7.2 0.3 -1.5 -4.8 -4.1 -3.9 -2.9 -0.8 0.2 0.3 0.2 0.0 Other Services 50.7 51.1 51.1 51.5 51.9 52.4 52.7 53.0 53.3 53.5 53.7 53.8 53.9 Pct Chg Year Ago 10.3 11.4 7.3 3.1 2.2 2.5 3.3 3.1 2.7 2.3 1.8 1.5 1.2 Federal Government 28.7 28.6 28.6 28.7 28.7 28.8 28.9 28.9 29.0 29.1 29.1 29.2 29.3 Pct Chg Year Ago -0.8 -2.1 -0.4 -0.2 0.0 0.5 0.9 0.9 0.9 1.0 1.0 1.0 0.9 State & Local Government 124.5 124.9 125.4 126.1 126.7 127.1 127.5 128.0 128.3 128.8 129.2 129.6 130.0 Pct Chg Year Ago 0.8 1.8 2.8 2.1 1.7 1.8 1.7 1.5 1.3 1.3 1.3 1.2 1.3 Other Economic Indicators Population (Ths) 3283.1 3293.1 3302.2 3310.3 3318.2 3326.7 3335.5 3343.9 3352.8 3361.7 3370.2 3377.9 3385.0 Pct Chg Year Ago 1.3 1.3 1.2 1.1 1.1 1.0 1.0 1.0 1.0 1.1 1.0 1.0 1.0 Labor Force (Ths) 1642.6 1647.2 1651.7 1653.2 1654.1 1653.5 1653.2 1653.9 1655.1 1656.2 1657.9 1660.2 1661.2 Pct Chg Year Ago 3.2 2.6 1.9 1.1 0.7 0.4 0.1 0.0 0.1 0.2 0.3 0.4 0.4 Unemployment Rate (%) 2.8 3.4 4.5 5.2 5.7 5.9 5.8 5.7 5.6 5.5 5.3 5.2 5.0 Total Housing Starts 26376.6 23957.1 21358.0 20152.2 19420.3 19466.7 19628.9 20082.6 20784.5 21101.3 21382.8 21425.0 21519.1 Single-Family 13042.4 12222.3 11807.7 12154.8 12674.4 13292.0 13998.1 14607.7 15172.6 15288.6 15307.4 15175.8 15197.4 Multifamily 13334.2 11734.7 9550.2 7997.4 6745.8 6174.7 5630.7 5474.9 5611.9 5812.7 6075.4 6249.2 6321.7
PROFILES
The Villages MSA is located in the north-central portion of the state and is comprised of Sumter County. The villages shares its name with a broader masterplanned age-restricted community that spreads into portions of Lake and Marion Counties.
QUICK FACTS
• Metro population estimate of 125,044 as of 2019 (5-Year Estimate) (U.S. Census Bureau).
• Sumter County population estimate of 125,044 as of 2019 (5-Year Estimate) (U.S. Census Bureau).
• Civilian labor force of 36,322 in November 2022 (Florida Research and Economic Database).
• An unemployment rate of 3.8% as of November 2022, not seasonally adjusted. This amounts to 1,367 unemployed people (Florida Research and Economic Database).
OUTLOOK SUMMARIES
The Villages Metropolitan Statistical Area (MSA) is expected to show mixed levels of growth in its economic indicators. The Villages Gross Metro Product will be the third lowest in the state at a level of $4,665.36. Average annual wage growth of 3.4 percent will lead to an average annual wage of $64,100. Personal incomes will grow by 6.5 percent, the highest rate of growth in the state. This will lead to a per capita income level of $55,500. Population growth will average 2.7 percent, the highest in the State.
Employment growth is expected to remain unchanged. The unemployment rate is estimated to average 6.3 percent, the 3rd lowest in the state.
The Education and Health Services sector will lead The Villages at an average annual growth rate of 3.5 percent. The Federal Government sector and the State and Local Government sector will expand at respective rates of 2.3 percent and 1.7 percent. The Information Services sector will experience the largest contraction in the MSA at -5.8 percent annually.
METRO NEWS SUMMARIES
Bowlero Corp continues its growth with acquisitions in Florida
• Bowlero Corp, which owns the Professional Bowlers Association and has over 300 locations across North America, has acquired two 32lane bowling alleys in The Villages as part of an initiative to expand its presence in promising metro areas.
• The Villages are well-known for their dedicated bowling community, and by the end of September, Fiesta Bowl and Spanish Springs Lanes will both be under Bowlero management.
• The move will help bolster this community and further support the competitive and social leagues which exist at both locations.
Source: PR Newswire, September 7, 2022
Encompass Health announces plans to build a 50-bed inpatient rehabilitation hospital in The Villages, Florida
• Encompass Health is the largest owner/operator of rehabilitation centers in the nation, with 153 locations around the nation. This new hospital will be its 20th inpatient facility in Florida.
• Specializing in the recovery of serious illnesses and complex injuries, the hospital will boast 24hour nursing care, all private rooms, advanced technology, a therapy gym, and a courtyard.
• The company identified Wildwood as underserved for inpatient rehab services and is yet another positive indicator of the city’s continual growth.
Source: PR Newswire, September 26, 2022
Sinkhole repair will cost $100,000 at golf course in The Villages
• On Sep 30, as Hurricane Ian subsided, sinkholes appeared at El Diablo Executive Golf Course. The area’s Amenity Authority Committee (AAC) will spend roughly $100,000 to repair the gaping voids—two of which are each able to conveniently fit one golf cart.
THE VILLAGES 140 Florida & Metro Forecast / Winter 2023
• The AAC is constrained by other budgetary events like spikes in chlorine prices; a $20 million “placeholder” for the upcoming rebuild of the Paradise Recreation Center; and recent economic woes leading plentiful fixed-income residents to request a 1-year freeze on amenity rates.
• The conditions for the sinkholes likely preceded the hurricane, but the storm simply accelerated the process—according to a committee member who was rightfully concerned about the poor hurricane constantly being blamed for everything.
Source: Villages-News, October 14, 2022
The Pickleball Club secures fifth Florida location at The Villages
• Pickleball is a sport for all ages, especially seniors, and its popularity has been taking off around the U.S., with Florida as the epicenter. The Pickleball Club LLC. has acquired 4.69 acres of land in The Villages for yet another facility, and the 40,773 square-foot building’s construction will start in April 2023. Completion should be in early 2024.
• With over 50 shareholders so far, they have raised $6 million in equity in the last 1.5 years. Wanting to be the market leader, the company intends to secure 15 total locations around Florida and spend over $180 million.
• The private club will be a unique amenities-based experience with 16 indoor courts and 4 outdoor bocce ball courts.
Source: Business Wire, October 19, 2022-
Wildwood sets pace for Florida growth
• Over a 24-month period, Wildwood, FL has grown about 57%. A rate quicker than just about any other city in the entire state, if isolating those with populations of at least 5000.
• Every region of the city is seeing new developments, and since 2010, the city’s population has more than tripled. As of April 2022, the city’s population is at 24,681. This is an increase of around 9,000 from 2020’s census data.
• The enormous and continual influx of Northerners has certainly been a contributing factor, as they seek a lower latitude, so they may wear their sandals with attitude. With more new residents, the city has found itself with a tax base of around $4.4 billion for 2022-2023, a 46% increase from the prior year.
Source: The Villages Daily Sun, December 11, 2022
Sumter County extends contract for ambulance service
• Due to several complaints, Sumter County sought to phase out American Medical Response (AMR) since Sep ’21, and anticipated spending $5.1 million for hiring 63 ambulance personnel during the ’22-’23 fiscal year.
• A transitional contract with AMR was in place while the city hired enough paramedics for all their ambulances; it was set to expire on Dec 31.
• However, the transfer of responsibilities has been a slow one, and AMR will continue helping Sumpter County Fire and EMS into 2023, with no specific exit plan.
Source: The Villages Daily Sun, December 14, 2022
THE VILLAGES Institute for Economic Forecasting 141
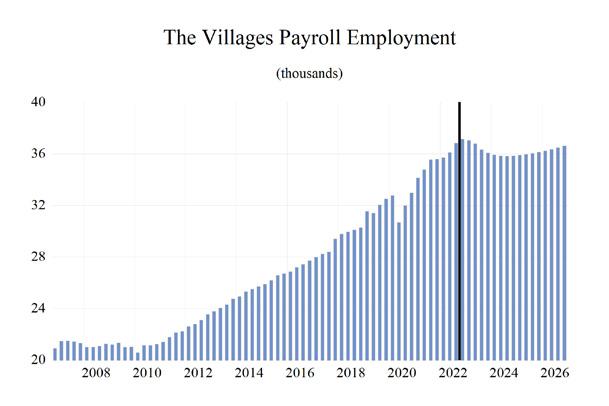
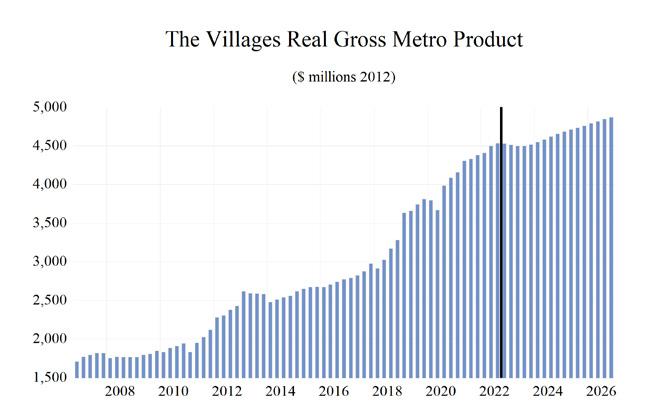
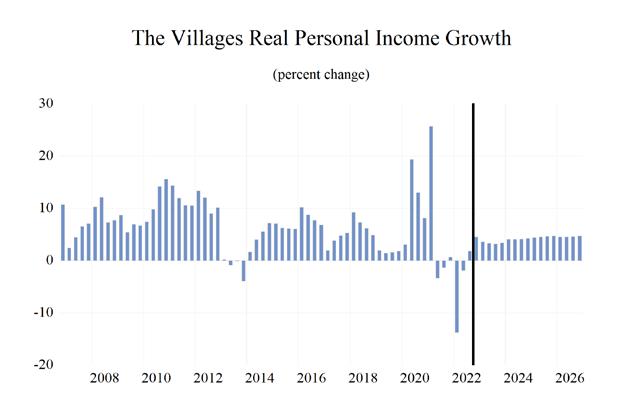
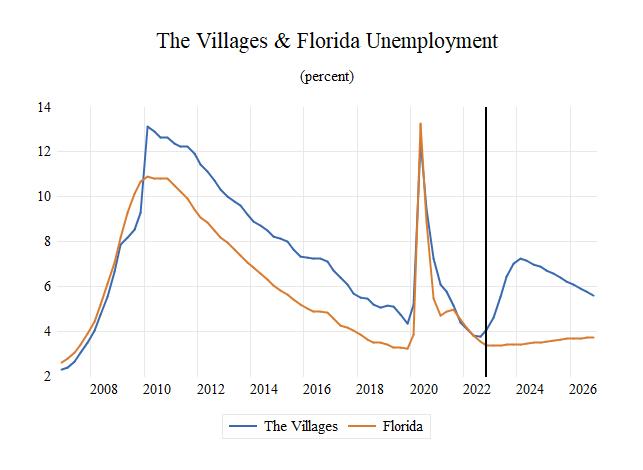
THE VILLAGES 142 Florida & Metro Forecast / Winter 2023 0 0.2 0.4 0.6 0.8 1 1.2 1.4 1.6 Total Nonagricultural Employment Total Private Goods Producing Service Producing Private Service Providing Government The Villages MSA Industry Loca�on Quo�ents
Long-Term Outlook for The Villages, FL
THE VILLAGES Institute for Economic Forecasting 143
December
2018 2019 2020 2021 2022 2023 2024 2025 2026 Personal Income (Billions $) Total Personal Income 6.3 7.5 8.0 8.7 9.0 9.6 10.1 10.8 11.5 Pct Chg Year Ago 9.4 18.8 6.2 9.4 2.9 7.0 5.5 7.0 6.3 Wages and Salaries 1.4 1.5 1.6 1.9 2.2 2.2 2.3 2.4 2.5 Nonwage Income 4.9 6.0 6.3 6.8 6.8 7.4 7.8 8.5 9.0 Real Personal Income (12$) 6.1 7.1 7.5 7.9 7.6 7.9 8.1 8.5 8.9 Pct Chg Year Ago 2.6 16.3 5.0 4.9 -3.3 3.6 3.2 4.8 4.3 Per Capita Income (Ths) 51.5 59.3 60.6 64.1 63.8 66.3 68.0 71.0 73.8 Real Per Capita Income (12$) 50.0 56.4 57.0 57.8 54.1 54.4 54.6 55.9 56.9 Average Annual Wage (Ths) 45.8 47.4 50.6 54.8 58.9 60.5 63.2 65.3 67.4 Pct Chg Year Ago 3.1 3.4 6.7 8.2 7.5 2.7 4.6 3.3 3.1 Establishment Employment (Place of Work, Thousands, SA) Total Employment 30.0 31.9 32.1 35.0 36.4 36.6 35.9 36.0 36.4 Pct Chg Year Ago 5.3 6.2 0.7 9.1 4.1 0.3 -1.9 0.4 1.2 Manufacturing 1.2 1.3 1.3 1.3 1.6 1.6 1.5 1.4 1.4 Pct Chg Year Ago 12.0 8.8 -0.8 5.3 17.9 0.5 -6.2 -4.8 -4.0 Nonmanufacturing 28.8 30.6 30.8 33.7 34.9 35.0 34.4 34.6 35.1 Pct Chg Year Ago 5.0 6.1 0.8 9.2 3.6 0.3 -1.7 0.6 1.4 Construction & Mining 3.4 3.6 3.7 4.1 4.2 4.2 4.0 3.9 3.8 Pct Chg Year Ago 5.7 8.4 1.1 11.5 2.2 1.1 -4.4 -3.7 -1.7 Trade, Trans, & Utilities 6.3 6.4 6.5 6.5 6.6 6.5 6.4 6.4 6.4 Pct Chg Year Ago 12.8 1.5 1.9 0.3 1.0 -0.4 -2.7 0.1 0.9 Wholesale Trade 0.9 0.9 0.9 0.9 0.9 1.0 1.0 1.0 1.1 Retail Trade 4.3 4.4 4.5 4.5 4.5 4.4 4.2 4.1 4.1 Trans, Wrhsng, & Util 1.0 1.1 1.1 1.1 1.1 1.1 1.2 1.2 1.2 Information 0.2 0.2 0.2 0.2 0.3 0.3 0.3 0.3 0.3 Pct Chg Year Ago 5.5 14.0 -13.5 29.7 48.2 1.1 -3.8 -8.2 -12.2 Financial Activities 1.3 1.5 1.6 1.8 2.0 2.1 2.2 2.2 2.1 Pct Chg Year Ago 9.8 15.0 10.6 11.2 10.2 6.4 2.0 -0.7 -1.0 Prof & Business Services 2.1 2.3 2.4 2.9 3.3 3.1 2.7 2.7 2.8 Pct Chg Year Ago 8.2 5.9 8.0 17.7 14.5 -5.8 -11.4 -1.3 3.0 Educ & Health Services 5.6 6.4 6.7 6.8 6.9 7.1 7.4 7.6 7.9 Pct Chg Year Ago 2.0 13.2 5.9 0.6 1.1 4.0 4.2 2.5 3.2 Leisure & Hospitality 4.4 4.5 3.9 5.5 5.7 5.3 4.9 5.1 5.3 Pct Chg Year Ago 4.7 1.7 -12.9 41.3 2.5 -7.2 -5.9 4.0 3.7 Other Services 0.5 0.6 0.5 0.6 0.8 0.9 0.9 0.9 0.9 Pct Chg Year Ago -10.3 21.2 -6.8 12.3 36.1 6.5 4.5 -1.3 -3.2 Federal Government 1.6 1.6 1.7 1.7 1.6 1.6 1.6 1.7 1.7 Pct Chg Year Ago -6.0 0.1 5.7 1.4 -7.2 2.8 0.8 2.8 2.8 State & Local Government 3.5 3.6 3.5 3.5 3.5 3.7 3.8 3.8 3.8 Pct Chg Year Ago 1.5 2.9 -2.0 -0.4 0.8 5.1 1.3 0.4 0.2 Other Economic Indicators Population (Ths) 122.6 126.5 131.5 136.1 140.5 144.8 148.8 152.5 156.1 Pct Chg Year Ago 2.6 3.1 3.9 3.6 3.2 3.0 2.8 2.5 2.3 Labor Force (Ths) 31.1 32.3 32.7 34.6 35.8 36.8 37.0 37.2 37.4 Percent Change, Year Ago 3.5 3.9 1.0 5.9 3.5 2.8 0.6 0.4 0.6 Unemployment Rate (%) 5.3 4.8 8.6 5.4 3.9 5.9 7.1 6.5 5.8 Total Housing Starts 2043.1 2850.6 3437.7 4297.3 4374.3 2264.1 2030.8 2177.8 2170.2 Single-Family 2043.1 2689.9 2889.3 3845.2 3784.5 2110.2 1980.7 2115.1 2097.3 Multifamily 0.0 160.6 548.5 452.1 589.8 153.9 50.1 62.7 72.9
2022 Forecast
Short-Term Outlook for The Villages, FL December 2022 Forecast
THE VILLAGES 144 Florida & Metro Forecast / Winter 2023
2022:4 2023:1 2023:2 2023:3 2023:4 2024:1 2024:2 2024:3 2024:4 2025:1 2025:2 2025:3 2025:4 Personal Income (Billions $) Total Personal Income 9.3 9.5 9.5 9.6 9.8 9.9 10.0 10.2 10.4 10.6 10.7 10.9 11.1 Pct Chg Year Ago 9.0 9.4 7.4 6.1 5.1 4.7 5.2 5.7 6.3 6.6 7.2 7.3 7.0 Wages and Salaries 2.2 2.2 2.2 2.2 2.2 2.2 2.3 2.3 2.3 2.3 2.4 2.4 2.4 Nonwage Income 7.1 7.2 7.3 7.4 7.5 7.7 7.8 7.9 8.1 8.2 8.4 8.5 8.7 Real Personal Income (12$) 7.7 7.8 7.9 7.9 7.9 8.0 8.1 8.2 8.3 8.4 8.5 8.6 8.7 Pct Chg Year Ago 3.0 4.6 4.1 3.1 2.6 2.4 2.8 3.4 4.0 4.4 4.9 5.1 4.9 Per Capita Income (Ths) 65.3 66.0 66.1 66.3 66.7 67.2 67.6 68.3 69.0 69.9 70.7 71.4 72.1 Real Per Capita Income (12$) 54.4 54.6 54.4 54.3 54.2 54.4 54.5 54.7 55.0 55.4 55.7 56.0 56.3 Average Annual Wage (Ths) 59.5 59.7 60.1 60.6 61.4 62.2 62.9 63.6 64.2 64.7 65.1 65.6 66.1 Pct Chg Year Ago 4.2 3.3 2.0 2.3 3.2 4.3 4.7 4.9 4.5 3.9 3.5 3.0 2.9 Establishment Employment (Place of Work, Thousands, SA) Total Employment 37.2 37.0 36.8 36.3 36.1 35.9 35.8 35.8 35.8 35.9 36.0 36.0 36.1 Pct Chg Year Ago 4.4 3.8 1.9 -1.4 -2.9 -3.1 -2.6 -1.4 -0.6 0.0 0.3 0.6 0.8 Manufacturing 1.6 1.6 1.6 1.6 1.5 1.5 1.5 1.5 1.5 1.5 1.4 1.4 1.4 Pct Chg Year Ago 18.4 7.1 2.8 -2.0 -5.5 -6.8 -7.1 -5.8 -4.9 -4.5 -4.8 -5.2 -4.7 Nonmanufacturing 35.5 35.4 35.2 34.7 34.5 34.4 34.3 34.3 34.4 34.4 34.5 34.6 34.7 Pct Chg Year Ago 3.8 3.6 1.9 -1.3 -2.8 -2.9 -2.4 -1.2 -0.4 0.2 0.6 0.8 1.0 Construction & Mining 4.3 4.3 4.3 4.2 4.2 4.1 4.1 4.0 4.0 3.9 3.9 3.9 3.9 Pct Chg Year Ago 4.9 8.2 3.2 -2.4 -3.9 -4.8 -4.4 -4.0 -4.3 -4.3 -4.0 -3.4 -3.1 Trade, Trans, & Utilities 6.6 6.6 6.6 6.5 6.4 6.4 6.4 6.3 6.3 6.3 6.3 6.4 6.4 Pct Chg Year Ago 1.1 1.0 1.4 -1.4 -2.6 -2.7 -3.6 -2.5 -2.0 -1.2 -0.1 0.8 0.9 Wholesale Trade 0.9 1.0 1.0 1.0 1.0 1.0 1.0 1.0 1.0 1.0 1.0 1.0 1.1 Retail Trade 4.6 4.5 4.5 4.4 4.3 4.2 4.2 4.1 4.1 4.1 4.1 4.1 4.1 Trans, Wrhsng, & Util 1.1 1.1 1.1 1.1 1.1 1.2 1.2 1.2 1.2 1.2 1.2 1.2 1.2 Information 0.4 0.3 0.3 0.3 0.3 0.3 0.3 0.3 0.3 0.3 0.3 0.3 0.3 Pct Chg Year Ago 52.8 20.3 -3.3 -3.1 -5.8 -4.5 -3.1 -3.5 -4.1 -5.4 -7.8 -9.5 -10.0 Financial Activities 2.1 2.1 2.1 2.1 2.1 2.2 2.2 2.2 2.2 2.2 2.2 2.1 2.1 Pct Chg Year Ago 8.1 8.6 7.9 5.7 3.5 2.5 2.2 2.2 1.0 0.1 -0.6 -1.1 -1.3 Prof & Business Services 3.4 3.3 3.2 3.0 2.8 2.8 2.7 2.7 2.7 2.7 2.7 2.7 2.7 Pct Chg Year Ago 12.9 4.2 -1.7 -10.1 -15.1 -17.1 -13.8 -8.7 -4.9 -2.7 -1.8 -1.2 0.7 Educ & Health Services 6.9 7.0 7.1 7.2 7.3 7.4 7.4 7.5 7.5 7.6 7.6 7.6 7.7 Pct Chg Year Ago 2.9 2.9 4.1 4.2 4.8 5.2 4.6 3.6 3.3 2.6 2.4 2.4 2.7 Leisure & Hospitality 5.7 5.5 5.3 5.1 5.0 4.9 4.9 4.9 5.0 5.1 5.1 5.2 5.2 Pct Chg Year Ago -1.1 0.6 -5.7 -11.0 -12.4 -11.1 -7.8 -3.9 -0.3 2.9 4.2 4.9 4.2 Other Services 0.9 0.9 0.9 0.9 0.9 0.9 0.9 0.9 0.9 0.9 0.9 0.9 0.9 Pct Chg Year Ago 29.7 9.2 6.8 5.7 4.6 5.2 5.7 4.8 2.3 0.5 -0.9 -2.3 -2.6 Federal Government 1.6 1.6 1.6 1.6 1.6 1.6 1.6 1.6 1.7 1.7 1.7 1.7 1.7 Pct Chg Year Ago -5.8 -2.4 4.0 6.3 3.5 1.6 0.0 0.2 1.3 2.1 2.9 3.2 3.0 State & Local Government 3.7 3.7 3.7 3.7 3.7 3.8 3.8 3.8 3.8 3.8 3.8 3.8 3.8 Pct Chg Year Ago 3.6 6.2 7.6 4.1 2.5 1.9 1.3 1.2 0.7 0.6 0.5 0.2 0.4 Other Economic Indicators Population (Ths) 142.2 143.2 144.2 145.3 146.3 147.4 148.3 149.2 150.2 151.1 152.0 153.0 153.9 Pct Chg Year Ago 3.2 3.1 3.0 3.0 2.9 2.9 2.8 2.7 2.6 2.5 2.5 2.5 2.5 Labor Force (Ths) 36.3 36.5 36.8 36.9 37.0 37.0 37.0 37.0 37.1 37.1 37.2 37.2 37.3 Pct Chg Year Ago 3.4 3.4 3.2 2.6 1.9 1.3 0.7 0.3 0.2 0.3 0.4 0.5 0.6 Unemployment Rate (%) 4.1 4.6 5.5 6.4 7.0 7.2 7.1 7.0 6.9 6.7 6.6 6.4 6.2 Total Housing Starts 3452.6 2809.3 2288.5 2038.6 1919.8 1937.0 1978.9 2060.5 2146.7 2173.9 2185.8 2171.3 2180.3 Single-Family 3082.3 2517.9 2112.5 1949.5 1860.9 1890.2 1934.7 2007.8 2090.2 2113.8 2123.0 2107.7 2116.0 Multifamily 370.2 291.4 176.0 89.2 58.9 46.8 44.2 52.7 56.5 60.2 62.8 63.7 64.3
PROFILES
The West Palm Beach-Boca Raton-Boyton Beach MSA stretches from the state’s Atlantic coast into the rural center and includes the northern edge of the everglades national park. It is known for its numerous golf courses along the coastline and its sandy beaches.
QUICK FACTS
• Metro population estimate of 1,496,770 as of 2019 (5-Year Estimate) (U.S. Census Bureau).
• Palm Beach County population estimate of 1,496,770 as of 2019 (5-Year Estimate) (U.S. Census Bureau).
• Civilian labor force of 770,015 in November 2022 (Florida Research and Economic Database).
• An unemployment rate of 2.6% as of November 2022, not seasonally adjusted. This amounts to 19,909 unemployed people (Florida Research and Economic Database).
OUTLOOK SUMMARIES
The West Palm Beach–Boca Raton area is expected to show relatively slow levels of growth in the economic indicators. Personal income is expected to grow an average of 4.1 percent annually, the 5th slowest in the state. The average real per capita income level of $75,200 is third highest in the state. Average annual wage growth will be 2.3 percent, the slowest in the state; however, the average annual wage level is expected to be $82,900, the highest of the studied metropolitan areas. West Palm Beach is expected to average a population growth of 0.9 percent each year. The area has one of the highest Gross Metro Product of the MSAs studied at an average level of $84,136.51 million.
Employment is expected to grow at an average rate of -0.7 percent each year, while Unemployment is expected to be relatively moderate at an average rate of 5.4 percent.
West Palm Beach’s fastest growing sector is expected to be the by the Other Service sector, which will experience 1.6 percent average annual growth, followed by the Financial Services sector, which will grow at an average of 1.3 percent.
METRO NEWS SUMMARIES
Palm Beach County programs offer $75,000 for housing rehabilitation assistance
• Palm Beach County leaders are already looking ahead to next year’s hurricane season to improve the integrity of homes during a storm.
• “We’re doing impact windows and impact doors,” said Jonathan Brown, director of housing and economic development in Palm Beach County. “The benefit for that is it ensures that our low to moderate income families are not in the big box stores come hurricane season trying to find plywood and trying to figure out how to protect their homes.”
• Once the rehabilitation project is complete, the county will do a wind mitigation report and a four-point inspection so homeowners can share that information with their insurance company and ultimately lower their insurance costs.
Source: WPTV 5, October 25, 2022
Palm Beach County unemployment rate falls again ahead of big-time tourism hiring
• Palm Beach County’s unemployment rate dropped to a near-record low just as the region enters the hiring-heavy winter tourism season. On Friday, CareerSource Palm Beach County and the Florida Department of Economic Opportunity reported the county’s jobless rate dropped in September to 2.6%, down from 2.9% in August.
• This means that unemployment is just 0.3 percentage points from the all-time low, as the region heads into this year’s high season.
• Just this week, more than 60 hotels, restaurants, and attractions throughout Palm Beach County held the Palm Beaches Hospitality and Tourism Job Fair. In the past year, of the 31,100 jobs added in the county (a 4.9% increase), roughly a third were in the tourism and hospitality industry.
Source: The Palm Beach Post, October 25, 2022
W EST P ALM B EACH - B OCA R ATON - B O y NTON B EACH Institute for Economic Forecasting 145
Palm Beach County receives extra $12.5 million for rental assistance
• Millions of dollars in federal aid are on the way to Palm Beach County for those behind on their rent. The county was granted an additional $12.5 million in reallocated funds from the American Rescue Plan, the largest award amount in the state.
• The funds are for low-income residents facing eviction. For example, families of four making less than $73,000 a year or single residents earning less than $51,000 are eligible.
• Returning and new applicants can receive up to 12 months of assistance plus three additional months if needed.
Source: WPTV 5, November 2, 2022
Despite poverty for many in Glades, some residents find hope amid economic despair
• Numbers from the U.S. Census Bureau for Belle Glade, Pahokee and South Bay tell a somber story for some people in the Glades, 40 miles west of the coast in Palm Beach County. Poverty touches 27 to 40% of the roughly 27,000 residents. In some cases, that’s more than three times the county average of 11%.
• The median household income across Palm Beach County is $70,000, but in the Glades, it ranges from $28,000 to $40,000.
• Just this week, Palm Beach County commissioners approved $2.5 in funding to assist with improvements and renovations for housing units in the Okeechobee and Osceola centers — a large housing complex in Belle Glade.
Source: WPTV 5, November 5, 2022
November jobs report shows strong labor market, affirms job security
• According to the latest jobs report for the month of November, 263,000 jobs were added nationally, wages continued to climb and the unemployment rate is holding steady at 3.7%.
• Locally things are looking good. According to CareerSource Palm Beach County, the county’s unemployment rate has stayed at or below 3% for nine consecutive months. For more than a year, the leisure/hospitality industry has led the county in job growth.
• “The job market is still remarkably robust,” Mark Hamrick, Bankrate economic analyst, said. “A lot of people look at this and say that’s an affirmation of job security and that’s absolutely true.”
Source: WPTV 5, December 2, 2022
First-time homebuyers in Palm Beach County could receive up to $100K
• Applications are now open for funds through Palm Beach County’s Department of Housing and Economic Development from the State Housing Initiative Partnership under the Purchase Assistance Program.
• First-time homebuyers can get up to $100,000 on a first-come, first-served basis. Homes, condos, and apartments with a price tag of up to $382,194 are eligible. Money received will go towards things like renovations, down payments, and closing costs, among other things.
• “It really is a great opportunity to work with our prospective buyers, work with the realtors, work with the lenders, to find affordable housing throughout the county,” Jonathan Brown, director of housing and economic sustainability in Palm Beach County, said.
Source: WPBF 25 News, December 28, 2022
W EST P ALM B EACH - B OCA R ATON - B O y NTON B EACH 146 Florida & Metro Forecast / Winter 2023
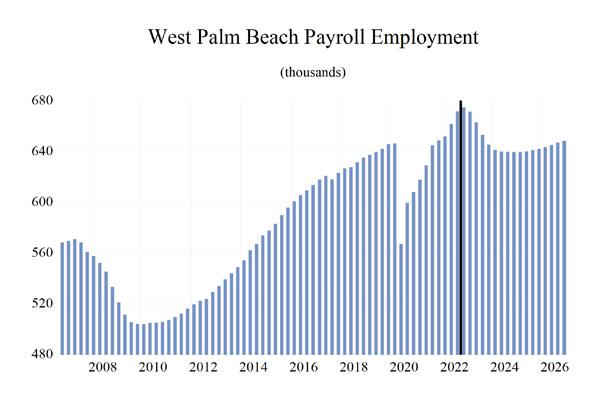
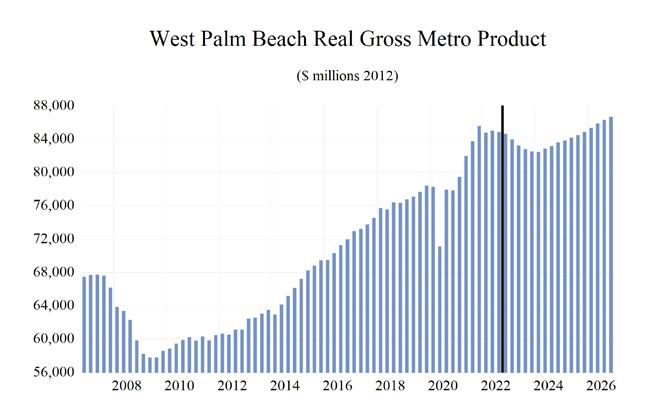
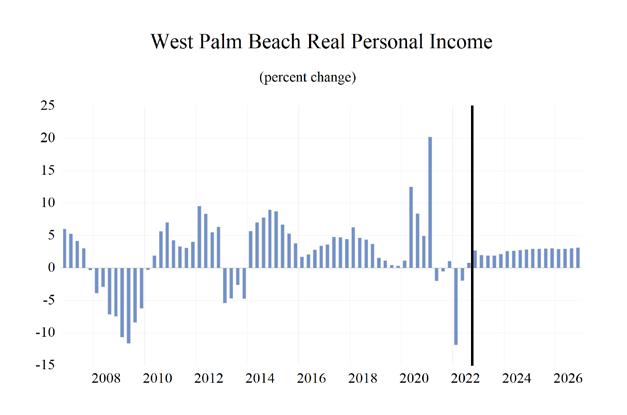
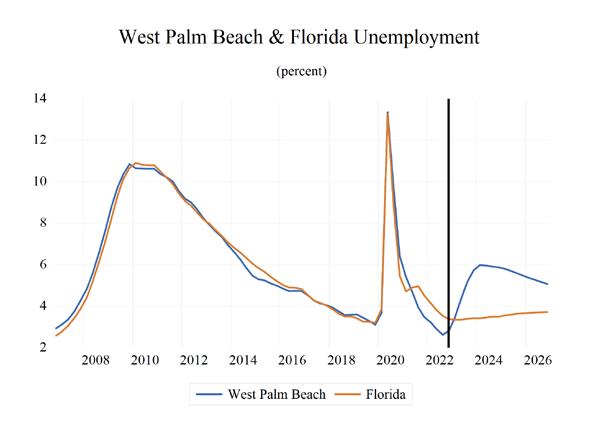
W EST P ALM B EACH - B OCA R ATON - B O y NTON B EACH Institute for Economic Forecasting 147 0 0.2 0.4 0.6 0.8 1 1.2 1.4 1.6 Total Nonagricultural Employment Total Private Goods Producing Service Producing Private Service Providing Mining, Logging, and Construc�on Manufacturing Trade, Transporta�on, and U�li�es Wholesale Trade Retail Trade Transporta�on, Warehousing, and U�li�es Informa�on Financial Ac�vi�es Professional and Business Services Educa�onal and Health Services Leisure and Hospitality Other Services Government Palm Beach County MSA Industry Loca�on Quo�ents
Long-Term Outlook for West Palm Beach-Boca Raton-Delray Beach, FL (Division of Miami MSA) December 2022 Forecast
W EST P ALM B EACH - B OCA R ATON - B O y NTON B EACH 148 Florida & Metro Forecast / Winter 2023
2018 2019 2020 2021 2022 2023 2024 2025 2026 Personal Income (Billions $) Total Personal Income 122.2 132.5 138.5 150.8 152.7 157.2 162.3 171.2 179.5 Pct Chg Year Ago 6.9 8.5 4.5 8.9 1.3 3.0 3.2 5.5 4.8 Wages and Salaries 37.7 39.5 40.9 47.7 52.6 52.7 52.5 53.9 55.9 Nonwage Income 84.5 93.0 97.6 103.1 100.0 104.5 109.8 117.4 123.6 Real Personal Income (12$) 102.5 110.6 113.2 118.2 112.6 112.3 113.3 117.1 120.4 Pct Chg Year Ago 3.5 7.9 2.3 4.4 -4.8 -0.3 0.9 3.3 2.8 Per Capita Income (Ths) 82.8 89.1 92.7 100.6 101.2 103.4 105.9 110.7 115.0 Real Per Capita Income (12$) 69.5 74.4 75.8 78.9 74.6 73.9 73.9 75.7 77.1 Average Annual Wage (Ths) 59.5 61.4 67.3 74.7 78.8 79.8 81.7 83.8 86.2 Pct Chg Year Ago 2.5 3.1 9.6 11.0 5.6 1.3 2.3 2.6 2.9 Establishment Employment (Place of Work, Thousands, SA) Total Employment 630.3 641.0 605.1 635.1 665.0 658.1 640.0 640.7 646.0 Pct Chg Year Ago 1.7 1.7 -5.6 5.0 4.7 -1.0 -2.8 0.1 0.8 Manufacturing 20.2 20.2 19.5 20.5 21.4 21.1 19.8 19.5 19.7 Pct Chg Year Ago 1.9 0.0 -3.5 5.0 4.3 -1.5 -5.7 -1.6 0.7 Nonmanufacturing 610.0 620.8 585.6 614.6 643.7 637.1 620.2 621.1 626.3 Pct Chg Year Ago 1.7 1.8 -5.7 5.0 4.7 -1.0 -2.7 0.2 0.8 Construction & Mining 37.7 38.8 37.8 39.1 40.1 39.0 37.5 37.1 37.4 Pct Chg Year Ago 4.9 2.8 -2.7 3.5 2.5 -2.6 -3.9 -1.2 0.9 Trade, Trans, & Utilities 117.1 116.7 112.3 117.5 122.6 118.6 115.1 114.2 114.4 Pct Chg Year Ago 0.8 -0.3 -3.8 4.6 4.4 -3.3 -2.9 -0.8 0.2 Wholesale Trade 24.2 23.6 22.8 23.3 24.0 23.9 24.5 24.9 25.4 Retail Trade 79.8 79.6 74.7 77.0 80.5 76.8 72.6 71.3 71.1 Trans, Wrhsng, & Util 13.0 13.6 14.8 17.1 18.2 18.0 18.0 18.0 18.0 Information 11.0 10.6 9.8 10.0 10.6 10.6 10.5 10.7 10.7 Pct Chg Year Ago -5.1 -3.4 -7.5 2.2 5.2 0.1 -0.5 2.0 0.0 Financial Activities 41.8 43.1 43.4 45.7 47.1 46.7 47.8 48.8 49.6 Pct Chg Year Ago 3.3 3.2 0.6 5.4 3.1 -1.0 2.5 2.1 1.6 Prof & Business Services 114.3 116.4 114.7 123.8 124.9 114.7 102.8 103.9 108.2 Pct Chg Year Ago 1.1 1.8 -1.4 8.0 0.9 -8.2 -10.4 1.1 4.1 Educ & Health Services 101.9 106.0 102.4 103.3 108.1 111.6 113.3 112.9 112.8 Pct Chg Year Ago 2.8 4.0 -3.4 0.9 4.7 3.2 1.6 -0.3 -0.1 Leisure & Hospitality 88.7 90.5 73.8 82.0 92.9 95.9 91.9 91.6 91.2 Pct Chg Year Ago 1.5 2.1 -18.5 11.1 13.3 3.2 -4.2 -0.2 -0.5 Other Services 33.1 33.0 30.2 31.0 34.4 35.8 36.5 36.7 36.6 Pct Chg Year Ago 0.1 -0.3 -8.4 2.5 11.2 3.9 2.0 0.7 -0.2 Federal Government 6.8 7.0 7.2 6.9 6.8 6.6 6.7 6.8 6.9 Pct Chg Year Ago 0.6 2.6 3.4 -4.0 -1.0 -3.0 1.1 1.5 1.4 State & Local Government 57.7 58.7 54.1 55.3 56.1 57.6 58.1 58.3 58.4 Pct Chg Year Ago 2.1 1.8 -7.9 2.3 1.4 2.8 0.7 0.4 0.2 Other Economic Indicators Population (Ths) 1475.2 1487.4 1493.0 1498.2 1508.0 1520.0 1533.0 1547.2 1561.5 Pct Chg Year Ago 0.8 0.8 0.4 0.4 0.7 0.8 0.9 0.9 0.9 Labor Force (Ths) 721.2 728.9 715.5 733.5 756.3 761.8 764.0 768.2 773.5 Percent Change, Year Ago 0.6 1.1 -1.8 2.5 3.1 0.7 0.3 0.5 0.7 Unemployment Rate (%) 3.7 3.4 8.3 4.4 2.9 4.7 5.9 5.6 5.2 Total Housing Starts 4533.8 4959.2 6882.4 6846.4 6510.0 6705.9 6392.1 6963.0 7267.5 Single-Family 2888.4 3290.6 4052.6 4283.2 3368.8 3707.5 4234.7 4447.4 4378.8 Multifamily 1645.4 1668.6 2829.8 2563.2 3141.2 2998.4 2157.4 2515.5 2888.6
Short-Term Outlook for West Palm Beach-Boca Raton-Delray Beach, FL (Division of Miami MSA) December 2022 Forecast
W EST P ALM B EACH - B OCA R ATON - B O y NTON B EACH Institute for Economic Forecasting 149
2022:4 2023:1 2023:2 2023:3 2023:4 2024:1 2024:2 2024:3 2024:4 2025:1 2025:2 2025:3 2025:4 Personal Income (Billions $) Total Personal Income 155.6 157.3 156.8 157.2 157.6 159.6 161.2 163.2 165.3 168.0 170.2 172.4 174.4 Pct Chg Year Ago 4.4 5.7 3.2 1.9 1.3 1.5 2.8 3.8 4.9 5.3 5.6 5.6 5.5 Wages and Salaries 53.6 53.3 53.0 52.5 52.1 52.1 52.3 52.6 52.9 53.3 53.7 54.1 54.6 Nonwage Income 102.1 104.0 103.9 104.7 105.5 107.4 108.9 110.6 112.4 114.7 116.6 118.3 119.8 Real Personal Income (12$) 112.8 113.2 112.4 112.0 111.5 112.3 112.9 113.7 114.5 115.7 116.7 117.6 118.4 Pct Chg Year Ago -1.2 1.0 0.0 -1.0 -1.1 -0.8 0.5 1.5 2.6 3.1 3.4 3.5 3.4 Per Capita Income (Ths) 102.9 103.8 103.3 103.3 103.4 104.5 105.3 106.3 107.5 108.9 110.2 111.3 112.3 Real Per Capita Income (12$) 74.6 74.7 74.0 73.6 73.2 73.5 73.7 74.1 74.4 75.1 75.5 75.9 76.3 Average Annual Wage (Ths) 79.1 79.1 79.6 80.1 80.5 81.0 81.4 81.9 82.4 83.0 83.5 84.1 84.6 Pct Chg Year Ago 1.2 1.0 0.9 1.4 1.8 2.4 2.3 2.2 2.4 2.4 2.6 2.6 2.7 Establishment Employment (Place of Work, Thousands, SA) Total Employment 674.8 671.4 662.9 653.0 645.3 641.4 639.8 639.6 639.3 639.5 640.1 641.0 642.1 Pct Chg Year Ago 4.0 3.0 0.2 -2.8 -4.4 -4.5 -3.5 -2.1 -0.9 -0.3 0.0 0.2 0.4 Manufacturing 21.7 21.5 21.3 20.9 20.4 20.1 19.9 19.7 19.6 19.6 19.5 19.5 19.5 Pct Chg Year Ago 4.2 2.1 1.0 -3.2 -5.8 -6.6 -6.6 -5.7 -3.9 -2.7 -1.9 -1.1 -0.5 Nonmanufacturing 653.1 649.9 641.5 632.0 624.9 621.3 619.9 619.8 619.7 620.0 620.5 621.4 622.6 Pct Chg Year Ago 4.0 3.0 0.1 -2.8 -4.3 -4.4 -3.4 -1.9 -0.8 -0.2 0.1 0.3 0.5 Construction & Mining 40.4 40.1 39.2 38.5 38.4 37.9 37.5 37.4 37.3 37.1 37.1 37.1 37.1 Pct Chg Year Ago 1.9 0.3 -1.4 -4.0 -5.1 -5.3 -4.2 -3.1 -2.8 -2.2 -1.2 -0.8 -0.6 Trade, Trans, & Utilities 122.4 120.6 119.8 117.4 116.6 115.9 115.0 114.9 114.6 114.3 114.1 114.2 114.2 Pct Chg Year Ago 1.9 -1.3 -2.6 -4.5 -4.7 -3.9 -4.0 -2.1 -1.7 -1.4 -0.8 -0.6 -0.4 Wholesale Trade 23.9 23.9 23.7 23.8 24.0 24.2 24.4 24.6 24.7 24.8 24.9 25.0 25.1 Retail Trade 80.1 78.5 78.1 75.7 74.7 73.7 72.5 72.3 72.0 71.5 71.2 71.3 71.1 Trans, Wrhsng, & Util 18.3 18.2 17.9 17.9 17.9 18.0 18.1 18.0 18.0 18.0 18.0 18.0 18.0 Information 10.7 10.7 10.6 10.5 10.4 10.4 10.5 10.5 10.6 10.6 10.7 10.8 10.7 Pct Chg Year Ago 3.7 3.8 -0.3 -0.6 -2.5 -2.3 -1.2 -0.1 1.5 2.1 1.8 2.2 1.7 Financial Activities 47.5 47.2 46.4 46.4 46.8 47.3 47.7 48.0 48.3 48.6 48.8 48.9 49.0 Pct Chg Year Ago 0.8 0.2 -1.1 -1.5 -1.4 0.2 2.9 3.6 3.3 2.9 2.3 1.7 1.5 Prof & Business Services 124.5 123.5 117.6 111.3 106.4 103.8 102.7 102.3 102.2 102.7 103.3 104.3 105.3 Pct Chg Year Ago -1.6 -0.9 -6.2 -11.0 -14.6 -15.9 -12.7 -8.1 -4.0 -1.0 0.6 1.9 3.1 Educ & Health Services 110.8 111.0 111.1 111.9 112.2 112.9 113.4 113.6 113.3 113.2 112.9 112.8 112.7 Pct Chg Year Ago 6.1 4.6 4.6 2.3 1.2 1.7 2.1 1.5 1.0 0.3 -0.5 -0.7 -0.5 Leisure & Hospitality 97.2 97.2 97.1 95.8 93.6 92.2 91.8 91.7 91.9 91.7 91.8 91.6 91.6 Pct Chg Year Ago 14.4 12.6 4.8 0.3 -3.7 -5.2 -5.5 -4.3 -1.8 -0.5 0.0 -0.2 -0.3 Other Services 35.8 35.7 35.5 35.7 36.0 36.3 36.4 36.6 36.6 36.7 36.7 36.7 36.7 Pct Chg Year Ago 12.8 9.7 5.1 0.6 0.6 1.5 2.6 2.4 1.7 1.3 0.8 0.5 0.2 Federal Government 6.7 6.6 6.6 6.6 6.6 6.7 6.7 6.7 6.7 6.8 6.8 6.8 6.8 Pct Chg Year Ago -4.5 -6.2 -3.8 -1.2 -0.5 0.5 1.3 1.4 1.5 1.5 1.5 1.5 1.4 State & Local Government 57.2 57.3 57.5 57.8 57.9 58.0 58.0 58.1 58.1 58.2 58.3 58.3 58.4 Pct Chg Year Ago 1.5 4.7 3.8 1.6 1.2 1.1 0.9 0.6 0.4 0.4 0.4 0.3 0.4 Other Economic Indicators Population (Ths) 1511.8 1515.0 1518.5 1521.7 1524.7 1527.8 1531.1 1534.6 1538.2 1541.9 1545.4 1548.9 1552.4 Pct Chg Year Ago 0.7 0.7 0.8 0.8 0.9 0.8 0.8 0.8 0.9 0.9 0.9 0.9 0.9 Labor Force (Ths) 762.5 761.4 761.0 762.0 762.9 763.1 763.4 764.2 765.2 766.1 767.4 769.0 770.1 Pct Chg Year Ago 2.5 1.9 1.1 -0.1 0.1 0.2 0.3 0.3 0.3 0.4 0.5 0.6 0.6 Unemployment Rate (%) 2.8 3.5 4.4 5.2 5.7 6.0 6.0 5.9 5.9 5.8 5.7 5.6 5.5 Total Housing Starts 8329.2 7531.3 6762.2 6384.8 6145.2 6201.9 6256.9 6419.7 6690.0 6827.1 6932.5 7020.1 7072.1 Single-Family 3987.6 3738.4 3594.2 3679.8 3817.6 3982.5 4168.4 4322.6 4465.3 4478.3 4467.5 4421.8 4422.1 Multifamily 4341.6 3792.9 3168.0 2705.0 2327.6 2219.4 2088.5 2097.1 2224.8 2348.8 2465.1 2598.3 2649.9

