Marketing and Communications
Fiscal Year 2021-2022 Annual Report Back

2 2021-2022 Annual Marketing Report Back Table of Contents Primary Department Goals 3 Website Performance 4 News Content Performance 8 Social Media Performance 11 Video Performance 14 Brand and Design 17 Advertising Performance 20 Email Performance 27
Primary Department Goals
Supporting Merage School’s Strategic Priorities
The Marketing & Communications department works with all programs, centers, departments and the Dean’s Suite to carry out the School’s vision of being at the forefront of education and research among globally preeminent business schools. The mission and vision of the Merage School are built around two key principles which are ingrained in all that we do:
Leadership for a Digitally Driven World
Inclusive Excellence
We build our strategy and budget around efforts to aid in evolving the School’s approach towards research, teaching and external engagement and to guide the School toward its vision. Our plan focuses on five strategic initiatives:
• Enhance the distinctiveness and competitiveness of the Merage School
• Research that addresses the management and societal challenges associated with the impact of technology on companies and their industries
• Reimagine our degree and non-degree offerings to meet evolving market needs
• Enhance the digital technology capability within the Merage School
• Increase the diversity of the business technology ecosystem
Our Objectives
1. Increase awareness of the Merage School brand regionally, nationally and internationally to our target audiences (prospective students, current students, alumni, the business community, donors, campus and other business schools).
Key Performance Indicators:
• Website traffic (direct and quality of referral)
• Earned media value
• Share of voice (benchmarking)
• Owned media metrics (newsletter, email and social media)
• Audience surveys
2. Provide expert marketing strategies to generate and nurture leads which support the enrollment goals of the degree programs and all other departments striving towards customer conversions.
Key Performance Indicators:
• Masters programs lead funnel reporting top-of-funnel metrics (CPL, CPC, CVR)
• Annual marketing plan per program outlining all channel strategy and spend
• Acquisition reports for all enrolled
3. Provide consultative marketing services to internal school partners to achieve their goals and promote the Merage School brand
Key Performance Indicators:
• Employee surveying (feedback reports)
Our Clients • Undergraduate Programs • Graduate Programs
Full-Time MBA
Fully Employed MBA
Executive MBA
Master of Professional Accountancy
Master of Finance
Master of Science in Business Analytics » Master of Innovation and Entrepreneurship » Master of Science in Biotech Management
• PhD Program
• Leadership Development Institute • Centers of Excellence » Beall Center for Innovation and Entrepreneurship » Center for Digital Transformation
Center for Global Leadership
Center for Health Care Management and Policy
Center for Investment and Wealth Management
Center for Real Estate • Advancement • External Relations • Career Center • Dean’s Suite • Faculty and Research
3 2021-2022 Annual Marketing Report Back
»
»
»
»
»
»
»
»
»
»
Website Performance
4 2021-2022 Annual Marketing Report Back
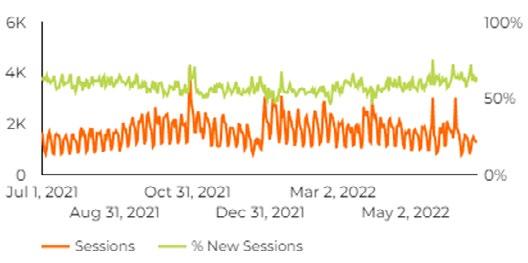
Website performance in 2021-2022 was comparable to previous years. The following are some highlights using data from Google Analytics:
• Requests: The web team completed 1,063 requests during FY 21-22 compared to 1,078 in FY 20-21.
• Traffic Sources: Our main two sources of website traffic is based on organic direct traffic and search engines. These two sources combined accounted for 93% of our traffic, a slight increase from 90% last year. Overall, our traffic sources remain about the same each year.
• Traffic Engagement: With 93% of sessions coming from either organic search or direct traffic, the average bounce rate was about 54%. On the homepage, there were 71,980 visits with a 39% bounce rate. These indicators show that users are engaged with the site when visiting.
• Device Usage: 25% of visitors used a mobile device to access the website. This was a 4% decrease from last year. Visitors using desktop/laptop increased by 4% to 75%. On desktop/laptop, users have a lower bounce rate and longer session duration. This indicates
that users may have a desktop/laptop readily available in an education setting and browsing may be easier compared to mobile devices.

• Geo: Almost 70% of sessions come from the United States, while India (6.6%) and China (6.2%) were a close tie from other countries. Within the United States, 67% of sessions came from California. The majority came from Irvine with 29%, followed by Los Angeles, Anaheim, Santa Ana and San Diego.
• Content: The highest number of page views is on the homepage with 151,877 views. For the majority of websites, the homepage receives the highest views. The Undergraduate Program is the second most visited with 63,022 views followed by Master of Science in Business Analytics (48,593 views) and Admissions (40,740 views). On average, most pages on the site take 2-3 seconds to load. Depending on the amount and type of content per page, this will determine the loading speed.
Completed Projects in fiscal year 21-22 (March 2021-June 2022 )
• Web Accessibility Project: After a thorough audit on our site, there were several areas that needed attention to make accommodations for visitors with disabilities. The majority of changes were completed behind the scenes and did not affect the site visually, however, it will be an improvement to users who need additional assistance to view the site.
5
Annual Marketing Report Back
2021-2022
Recommendations for Next Year
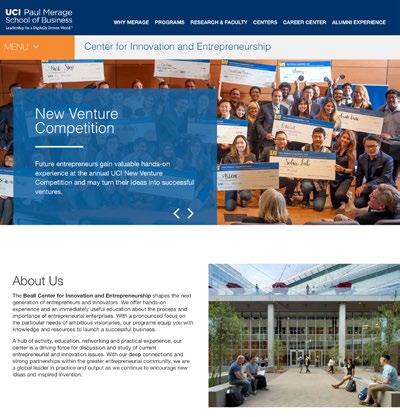
• Centers of Excellence Template Redesign: From our content drill down and engagement data, we see the opportunity to re-engage Centers of Excellence users. High bounce rates (70%) on these pages indicate users are interested in the subject matter, but likely find the user experience lacking. The goal for this project is to use the design elements and ideas established in the academic programs template and homepage template to create a more consistent and engaging user experience.
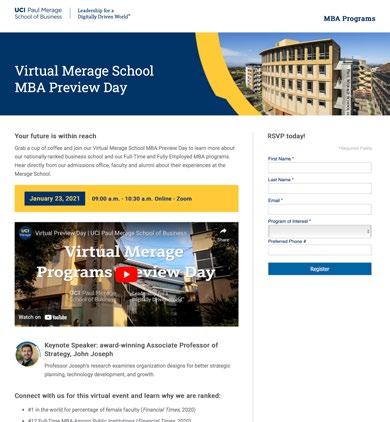
• Landing Page
Template Design and Integration into
CMS: A redesign of the landing page template presents an opportunity to integrate into our CMS (content management system). This would mean we have more control over the user experience and managing updates. The design will be structurally similar (basic elements will still be there), but with a layer of design that is updated and more cohesive with the current direction of our main website design.
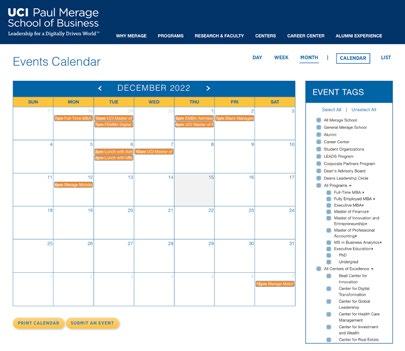
• Events Calendar: With more events gradually returning to be hosted in person, we saw a need to update the events calendar to make it more visually appealing and user friendly. We would like to display more information per event rather than having the user click multiple times to view information. The new design of the calendar will remain within the current design standards of the site.
6 2021-2022 Annual Marketing Report Back
Device
67/100 Accessibility Score 75.8/100 SEO Score Desktop Mobile Pageviews - 1,161,304 Pageviews - 345,377 Sessions - 433,347 Sessions - 179,279
Website KPIs
Engagement
Year Over Year Comparison Traffic and Trends
2020-2021 Percent Change 2021-2022
Number of Users 353,337 +1.5% 358,478 Pageviews 1,505,376 +0.8% 1,518,131
Sessions 606,718 +1.5% 615,943 Bounce Rate 52% +4.1% 54% Time/Session 2:31 -3.0% 2:27 Pages/Session 2.48 -0.7% 2.46
Top 10 Countries – highest sessions & pageviews
Country Sessions Pageviews
U.S. 407,779 982,380 China 50,019 108,102 India 37,444 105,444 Taiwan 12,654 35,717 South Korea 7,655 24,615 Hong Kong 6,680 17,234 United Kingdom 5,942 15,426 Canada 5,025 12,782 Iran 2,756 10,433 Japan 3,732 10,131
Top 10 Visited Pages – longest sessions & pageviews
Page
merage.uci.edu
Top 10 Traffic Sources – highest sessions & pageviews
Source Sessions Pages/Session
Google 302,067 2.62 Direct 255,022 2.3 Bing 8,703 2.68 linkedin.com 5,963 1.44 Google/cpc 4,679 2.61 baidu 2,777 2.06 yahoo 2,764 2.61 cn.bing.com 2,176 2.78 secure.touchnet.net 1,726 2.18 ucimerageschool. secure.force.com 1,649 2.48
Session Duration Pageviews
1:17 142,588
/undergraduate/index.html 1:15 60,973
/master-science-business-analytics/index.html 1:21 47,464
/master-science-business-analytics/admissions.html 2:56 39,525 /full-time-mba/index.html 1:04 36,262
/master-finance/index.html 1:23 33,523
/master-finance/admissions.html 2:56 25,194 /full-time-mba/admissions.html 3:03 24,713 /programs/mba/index.html 0:54 23,514 /fully-employed-mba/index.html 1:03 22,270
7
Annual Marketing Report Back
2021-2022
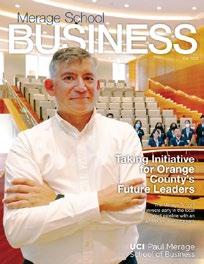
News Content Performance
8 2021-2022 Annual Marketing Report Back
This year, our Newsroom performance improved significantly. In selecting stories for our Newsroom, we use a scoring system to vet the relevance of the proposed article. The themes we look for are: Inclusive Excellence, Leadership for a Digitally Driven World focus, entrepreneurship, Brilliant Future campaign, faculty research, and relevance to current news cycle. The more themes the story checks off, the more likely our team is to pursue the lead and produce an article. All our top stories in our newsroom met one or more of these themes. Of course, there will always be stories we feature that have none of these elements, but the goal is to stay as on brand and on message as we can.
Another measure of a good story is: is there a clear beginning, middle and end? For example, did an alum have a story of humble beginnings, learning and growing period at the Merage School, and then achieved success? What role did the Merage School play? These are the questions we want to answer in our newsroom as we tell the central brand story of Why Merage
KPIs
In FY21-22, the Merage School newsroom published: • 55 stories • 18 press releases • Average of 5 news stories per month • Newsroom received 40,382 pageviews, average time on page is 1:53 minutes.
Year-Over-Year
9 2021-2022 Annual Marketing Report Back
2,320
2,305
2020-2021
Number
Visitors 1,347 9.9% 1,481 Pageviews 859
861 Average
Page 1:23
1:05 Bounce Rate
53%
Performance In FY 20-21 the newsroom received a total of 6,898 views (485% increase) Main Newsroom Page – https://merage.uci.edu/news/ 2020-2021 Percent Change 2021-2022 Number of Visitors
-0.6%
Pageviews 1,975 -1.3% 1,950 Average Time on Page 0:52 -19.2% 0:42 Bounce Rate 50% 6.0% 53% Newsroom Stories Homepage –https://merage.uci.edu/news/browse-stories.html
Percent Change 2021-2022
of
0.2%
Time on
-21.7%
26% -103.8%
Top 10 Highest Performing Newsroom Stories
News Article Pageviews
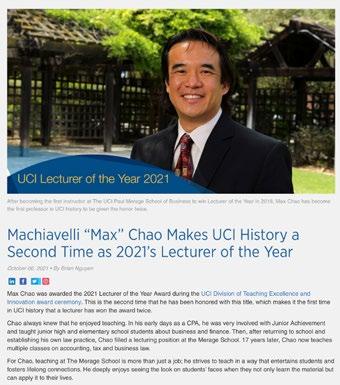
Machiavelli “Max” Chao Makes UCI History a Second Time as 2021’s Lecturer of the Year 808
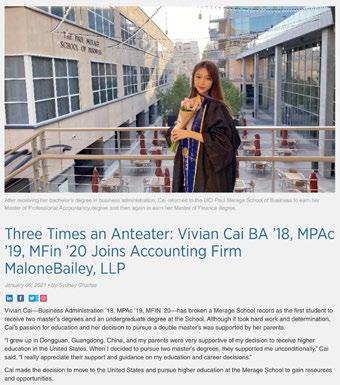
Three Times an Anteater: Vivian Cai BA ’18, MPAc ’19, MFin ’20 Joins Accounting Firm MaloneBailey, LLP 718
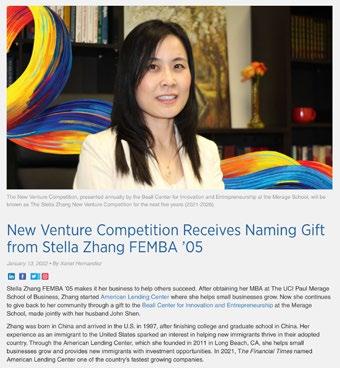
New Venture Competition Receives Naming Gift from Stella Zhang FEMBA ’05 711
New Scholarship Fund Will Support Undergraduate Global Experiences 710
A Transfer Student’s Journey to Deloitte 692
TikTok’s Nick Tran MBA ’11 Named Chair of Dean’s Leadership Circle 672
Former NBA Player Josh Childress Establishes Scholarship at UCI’s Merage School 652
Inside the Chipotle Test Kitchen: Meet Nevielle Panthaky EMBA ’22 511
Danny Granados MFin ’20 and His Journey to Goldman Sachs AYCO 489
Advancing Diversity in the Tech Workspace 473
Earned Media Performance
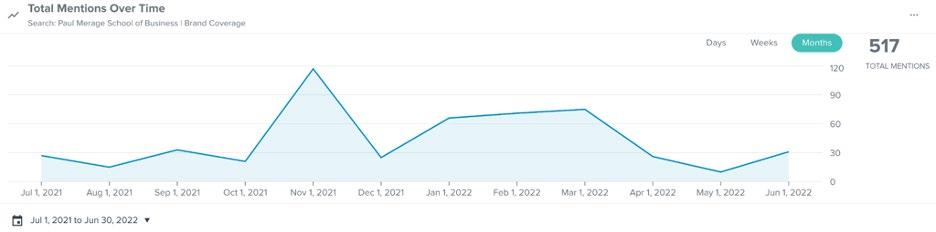
Our newsroom and social media represents a portion of our owned media. This year we also began tracking our earned media (mentions in the news, internet, etc) through Cision.
This year we had 517 total mentions – that’s a 23% YOY increase from last FY (420 mentions).
Top 5 Articles with highest readership: Eureka Building Presents Eureka Fest 2022
• Outlet: Yahoo!
• Program feature: MIE
Hoping to lure back retail investors, Robinhood is handing out dogecoin in Burger King sweepstakes
• Outlet: MSN
• Faculty expert feature: Chris Schwarz
The influence of 'the pink tax' is about more than just higher prices. Here's how it works and how it affects women's finances
• Outlet: MSN
• Faculty expert feature: Tonya Bradford
Why the 'sophomore slump' of adulthood hits so hard
• Outlet: BBC:
• Faculty expert feature: Ian Williamson
New App Rewards Your ‘Healthy Actions’ with Money Off Wellness Brands
• Outlet: Healthline
• Faculty expert feature: Behnaz Bojd
10 2021-2022 Annual Marketing Report Back


11 2021-2022 Annual Marketing Report Back
Social Media Performance
Our social media continues to complement our newsroom as our main outlet of disseminating news and school spotlights. Our social media strategy this year focused on establishing visual branding and promoting underrepresented minority (URM) groups within the Merage School. With an emphasis on our strongest platforms (LinkedIn and Instagram), Facebook and Twitter took a back seat. Soft launching our TikTok, the Social Media Team aims to expand our reach.
KPIs
Social media KPIs include:
• Follower count
Year-Over-Year Performance
Facebook
• Page Like Count: 6,358
• Page Like Growth: +98 (+1.57%)
• Total engagement
• Total impressions
• Annual Engagement Growth: -2,428 (-30.68%)
Instagram
• Total Follower Count: 4,384
• Annual Follower Growth: +710 (+19.32%)
• Annual Engagement Growth: +524 (+4.78%)
Commentary and Recommendations for Next Year
1. LinkedIn: As the platform with our most desired target audience, LinkedIn has sustained its impressive performance, growing in follower count and overall impressions. Faculty, alumni and graduate spotlights garner the most views and engagement, likely due to the honoree’s larger network and subsequent shares. We should continue with this strategy by paying attention to details like tagging where applicable and always including a visual element into each post.
2. Instagram: With a focus on audience engagement and feed aesthetic, our Instagram has grown significantly over the past year. Unlike the other platforms, undergraduate posts and event recaps are received better than professionally created graphics. Moving forward, we should emphasize posting more organiclooking photos, highlighting the people and activities that make up the Merage School.
LinkedIn
• Total Follower Count: 26,674
• Annual Follower Growth: +4,091 (+18.12%)
• Annual Impression Growth: +120,040 (+14.77%)
Twitter
• Total Follower Count: 5,600
• Annual Follower Growth: +158 (+2.90%)
• Annual Impression Growth: -128,298 (-50.97%)
3. Facebook & Twitter: While both platforms continue to decline in overall user popularity, we should not completely neglect our accounts. With an older audience demographic, it is important for a top-ranked school to maintain visibility. While Twitter prefers shorter headlines, Facebook enjoys longer personalized stories of our staff and students. Utilizing hashtags and tags will be the key to increasing our reach on these platforms.
4. TikTok: Despite having a slow start, we still recognize the potential value of an official account. We should prepare a calendar schedule for the upcoming school year with video creation assistance from our Marketing Team. We want to post high-quality, informative videos with a fun, lighthearted energy to appeal to the platform’s younger demographic audience. TikToks can be reposted as Instagram Reels for added bonus.
Marketing Report Back
13 2021-2022 Annual
Video Performance
14 2021-2022 Annual Marketing Report Back
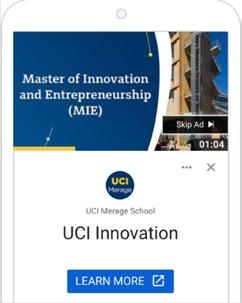
Throughout FY 21-22, our video production team worked with all our programs, departments, Centers of Excellence, and the Dean’s Suite to provide pre-production strategy, filming/photography, and post-production needs in both an in-person and remote environment. Outside of individual client needs, we also supplied school-associated webinar production and content, ensuring the promotion of the overall mission and the main four goals of the school.
During the year, we produced program features, Dean’s Thought Leadership segments, updated program webinars as well as created program and career specific YouTube ads for the school. We also provided full production support for the school to help with community relations, through video for vaccine updates and DEI programs. We established video coverage timelines and video content needs including animation features for our departments, Centers of Excellence and the Dean’s Suite virtual events and programs. The video team successfully managed the production, promotion and coverage of all virtual and in-person events that were required throughout the year. The virtual and in-person event coverage, video features and promotional pieces listed above were shared through social media channels and video hosting services such as YouTube, Vimeo and MBATube, and/or internally with our clients via .mp4 files.
During FY 21-22, the video production team produced over 60+ unique videos. This includes 5 program webinar updates, 20 Dean’s Thought Leadership Videos, as well as numerous zoom webinar and promotional videos. Our main goals for video content in FY 21-22 were:
1. Increasing awareness of both the Merage School and our programs to our target audiences (prospective students, current students, alumni, the business community, donors, campus and the local business community) through our video content.
2. Increasing engagement of our content by utilizing clients’ stylistic preferences and messaging that fits specific target audience’s unique needs.
3. Building upon our brand messaging of “Leadership for a Digitally Driven World” throughout our video content.
Marketing Report Back
15 2021-2022 Annual
KPIs 1. Increasing awareness 2. Increasing engagement YouTube Vimeo MBATube MasterTube Total # of Videos Published 61 11 N/A N/A 72 # of Views 531,617 741 19,844 6,340 558,542 Avg. View Duration (MM:SS) 1:09 3:00 N/A N/A 2:04 Total Watch Time (Hours) 10,205.6 37.1 N/A N/A 10,242.7 *Numbers do not include social media videos. *Numbers do not include social media videos. YouTube Vimeo MBATube MasterTube Total Shares 846 0 0 0 846 Subscribes 191 0 N/A N/A 191 Likes 488 0 8 2 498 Comments 26 0 N/A N/A 26
3. Building on our brand messaging
• Key Messaging: include tagline and keywords such as Digital Leadership, Digitally Driven, Digital World
• Featured Stories: focus on how we live the Leadership for a Digitally Driven World tagline as well as how we provided a diverse and inclusive environment here at the Merage School.
Year-Over-Year Performance
2020-2021
2021-2022 % Change
Views 185,377 531,617 286%
Avg. View Duration (MM:SS)
Total Watch Time (Hours)
1:33 1:09 -26%
4839 10,205.6 210%
Impressions 573,799 452,144 -22%
Subscribers 175 191 109%
Likes 379 488 128%
Shares 792 846 106%
Commentary and Recommendations for Next Year
As we begin FY 22/23, we continue to:
• Increase awareness of both the Merage School and our programs by targeting the local business community, rather than solely marketing towards our current student population.
• Increase engagement by featuring stories that draw positive emotions intertwined with our brand messaging while maintaining program-specific stylistic preferences targeted toward our various audiences. Looking to increase stylistic video pieces to engage and provide thoughtful information to our audiences from a different perspective.
• Build brand identity of “Leadership for a Digitally Driven World” under our new leadership by producing video features of students, alumni and faculty that are using both digital transformation as well as Diversity, Equity and Inclusion to positively impact their communities both locally and globally.
16 2021-2022 Annual Marketing Report Back
Sample videos from FY 21/22
Brand and Design
17 2021-2022 Annual Marketing Report Back
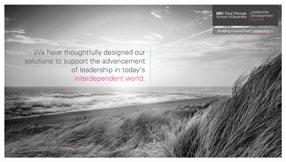
To keep the Merage School brand fresh in FY 21-22, our look and feel is getting an update. Much of the new design you will see incorporates the “authentic illustration” style where we incorporate design elements (circles, curves and the digi pattern) that tie us back to the previous years around actual photos of our faculty and students. We will continue to use graduated screens as they are still trending in the design world and they add a bit of flare.
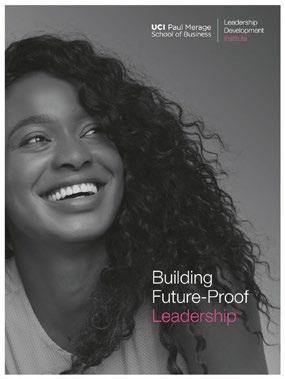
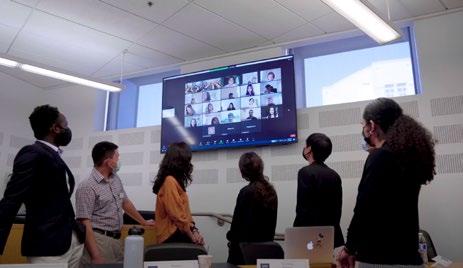
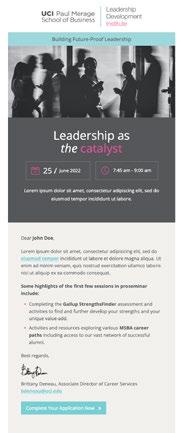
Additionally, we are working with Strat Comm to set guidelines for sub-brands within the Merage School house of brands. Once we have gotten the go-ahead from the main campus, we will work with certain segments of the school to establish subbrand guidelines for those areas. One sub-brand that we have worked extensively on in the past few months is for the Leadership Development Institute –formerly Executive Education. Physical
18 2021-2022 Annual Marketing Report Back
pieces
pieces
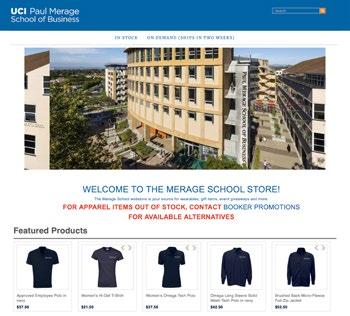
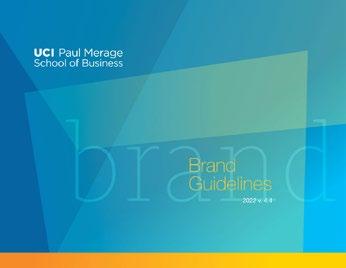
links: • Brand Guidelines • Marketing & Communications web page • Merchandise Store Merage School Brand Guidelines Marketing & Communications web page Merage School Merchandise Store LDI Brochure LDI Email Template LDI Web, Social and PPT graphics
printed
are being produced more this year, however, digital
are still preferred because they are substantially more cost effective and can be tracked providing valuable data such as clicks, reads, devices used, the average time readers are spending in a publication and where our readers are located around the world. Important
KPIs
Creative team KPIs are subjective and more difficult to track. Overall, the consensus is that the team consistently provides work that meets client satisfaction year-over-year. These are the metrics tracked:
• Lead time per project – the amount of time it takes from the start of a project to final delivery. Below is a general outline followed for design projects with the understanding that some projects may take longer if they are larger or the design is more involved.
1. Respond to design requests within 24 hours
2. Produce initial drafts with 72 hours of acceptance
3. Respond to review comment (edits on proofs) within 24 hours
4. Deliver complete document by agreed completion date/time


• Estimated vs. actual project time – compares what
Year-Over-Year Performance
the team said we would do to what we actually did. The estimated time is calculated for a maximum of 3 proofs. Often that number is surpassed which extends the time spent on those projects.
• Estimated vs. actual project budget – produce good work within budget; provide and communicate estimates for approval. While in-house design services are provided at no cost to our departments, management of other expenses (printing, writing, photography, etc.) is essential to make sure we are fiscally responsible. Occasionally, it is necessary to send projects to outside designers. In those cases, the cost for that service will be provided to the client for approval prior to the start. Any outside expense will receive estimates for prior approval unless declined by the client. We pledge to get the best price for the best quality work for our clients.
• Client satisfaction – did the work provided meet/ exceed the client’s expectations.

The creative team produced more than 800 design projects in FY 21-22 and that’s not including collaborations on other marketing initiatives and projects. We continue to look for new ways to creatively meet our clients’ needs.

Recommendations for Next Year
Our goal is to guard our brand and maintain brand integrity by translating marketing objectives into clear creative strategies. To further live out the Leadership for a Digitally Driven World brand, the following initiatives/projects are in the works for FY 22-23:
• Design Evolution – implement design updates across all school touchpoints.
• Building Decor Updates – updating the faculty posters, courtyard flags and display case posters as well as looking at other ways to improve and “brand” our physical spaces.
19 2021-2022 Annual Marketing Report Back
The Paul Merage School of Business is committed to serving and building relationships within the public sector of the Orange County community. In line with this goal, we are pleased to offer the County of Orange Scholarship Program. County staff members who are nominated by their manager or department head and meet the scholarship criteria may be eligible for up to a 25 percent reduction in tuition. The amount of the scholarship will be determined by the strength of the candidate’s application. A limited number of scholarships will be awarded each academic year for the Fully Employed MBA (FEMBA) and Executive MBA (EMBA) Take the next step and contact us to schedule personal consultation. Spring 2023 (FEMBA only) applications are due by February 1st, 2023. Fall 2023 applications are due by June 1st, 2023. Fall candidates will be notified of the decision by the end of June, 2023. County of Orange scholarship candidates must meet all admissions criteria as specified. Learn more at: merage.uci.edu/programs The GMAT or GRE is waived for all applicants. Please also include Letter of Nomination from your department head or direct manager with your application. Program tuition different program. Visit merage.uci.edu more about each program’s Tuition Aid. County of Orange Scholarship Program Contact: Jennifer Risner, jrisner@uci.edu Director, Admissions Executive MBA EMBA Class of 2024 Representative Titles Director Manager 24% VP 20% C-Suite Healthcare Clinician 7% Technical Expert 2% Communications/PR Customer Experience Education Engineer General Management Healthcare Clinician Resources Information Management Legal Counsel Logistics Marketing Operations Product Development Public Affairs Quality Assurance Research Development Sales Supply Chain Industries Represented Aerospace Automotive Conservation Consumer Products Defense Education Finance Government Healthcare Hospitality Manufacturing Nonprofit Public Utilities Real Estate Technology & Leisure Core Class Program Length In-Person 7:00-9:50 p.m. Tuesdays and Thursdays on-campus Weeknights, Saturdays, hybrid/online 24-33 months; or summers Hybrid FEMBA a.m.-3:50 p.m. four Saturdays per quarter oncampus, plus online learning Weeknights, Saturdays, hybrid/online 24-33 months; or summers A World-Class MBA for the Digital Age Why wait any longer to take your career to the next level? You’re ready to earn your MBA. Start this September as a part of our Merage School FEMBA Fall 2023 class and gain access to our full-service Career Center, executive mentoring and networking opportunities. Immediately start exploring career paths through electives and our centers of excellence. UCI’s Fully Employed MBA (FEMBA) program, ranked the #5 part-time MBA program in California U.S. News World Report 2022) is specifically designed to maximize career impact and prepare you for leadership in a digitally driven world. FEMBA Flexibility Start in Fall 2023 and choose the core class format that best fits your busy work schedule and learning style either in-person or blend of in-person and online sessions (Hybrid). All FEMBA students participate in team-based learning and build strong relationships with peers and faculty. As your schedule permits, all FEMBAs are encouraged to take advantage of high-level networking events, competitions, and leadership opportunities. Fully MBAEmployed Program Fall Feature During FEMBA program, was promoted to senior which required more travel responsibility. The ability to take Hybrid classes allowed access the modules anywhere, on any device, at any time. While was initially drawn to campus and the collegiate experience, was reassuring to know that the Hybrid options delivered the same academic rigor and high degree of engagement as being on-campus. Not to mention, the fintech tools now use in the workplace were first introduced to me in the FEMBA program. This experience ultimately gave me more well-rounded and relevant skill set—preparing me to move into tech savvy, fast moving organizations.” Robert Reza, FEMBA at Home Trust Company Dare to Define Your Future As our lives become more digitally mediated, we must adapt both ourselves and our businesses for the disruption inherent in the digital environment. With this reality in mind, The Paul Merage School of Business has specifically designed its curricula to give you the tools and skills necessary to become an effective leader in a digitally driven world. Located in the heart of Orange County’s Tech Coast, the Merage School is surrounded by network of cutting-edge businesses including Amazon, Google and Western Digital, and digitally-savvy firms including Capital Group, Disney, Experian, Hyundai, Pacific Life and Taco Bell. It is in this environment that we prepare you for the disruption you will encounter as future business Transformative Experience and Culture Whether you are looking to enter new profession, enhance your current career path or start your own entrepreneurial venture, the Merage School Full-Time MBA will help you become confident and respected leader. Each student receives personalized attention from staff and faculty within our collaborative culture – you are not just another number in the classroom. Our rigorous curriculum is complimented by specialized tracks of study, new research insights and case studies that challenge students with the realities brought by digital disruption across every industry. Key Program Highlights Applied Consulting Work directly with leading companies such as Disney, Experian and Amazon to create specific deliverables and action plans. New Venture Competition Put your entrepreneurial skills to the test and compete substantial prizes by forming team, launching startup and potenitally funding business idea –five months. International Focus Engage in week-long, faculty-led international intensive experience. Case Competitions Put your skills to the test in a competition, extending your network and exposing you to highly engaged employers such as Targus and Niagra seeking new talent. Presentation Skills Workshop Gain personalized, specific feedback from an executive coach to develop your presentation skills and improve your performance under pressure. Immersion Options Delve deeper into an area of interest, completing curricular and co-curricular activities in Digital Transformation, Innovation and Entrepreneurship, Health Care Management and Policy, or Real Estate and Urban Development. Full-Time MBA Program #8 Public University Best Colleges #1 Irvine: Safest Big City #25 Full-Time U.S. #1 the world for percentage of female faculty UCI Paul Merage School of Business 2022-2025 Strategic Plan Program Flyers Merage School Magazine Merage School Strategic Plan
Advertising Performance
20 2021-2022 Annual Marketing Report Back
All Graduate Programs
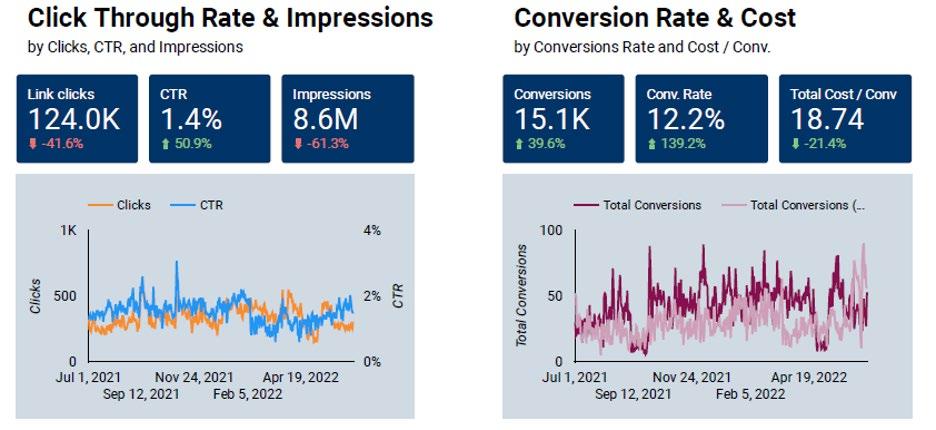
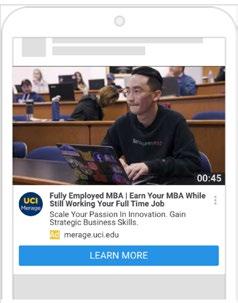
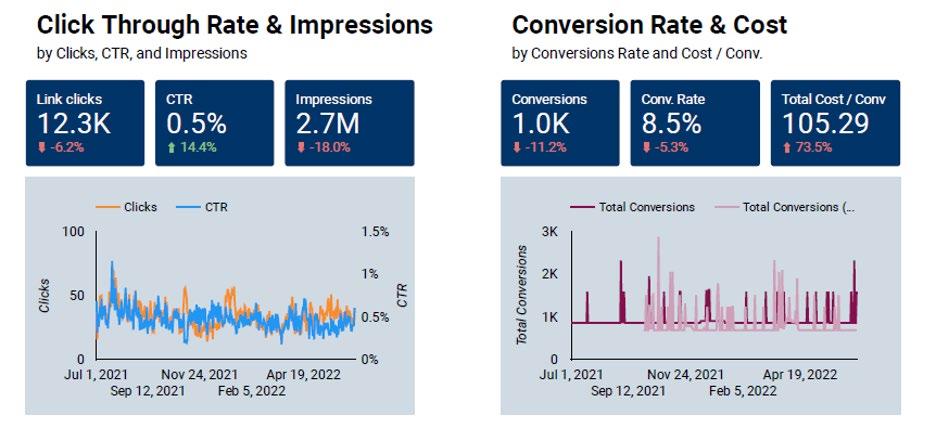
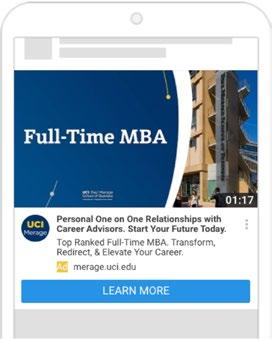
We run a variety of Google Ads to support our brand awareness and program enrollment goals. Last year we utilized Google Search, Display, Retargeting and YouTube. Google Search continues to be the best performing channel for Merage School programs and typically captures a potential new student while they are actively looking, so farther down the funnel on consideration. While Retargeting and YouTube have been recent additions to our strategy, they have capitalized on some low hanging fruit and helped us fill the funnel with additional leads. Our Google portfolio approach helps us to connect with potential students throughout their online experience and keep the Merage School and our programs top of mind.

Recommendations for Next Year
In FY22/23 we will continue to invest in these channels. They continue to be the best performing channels for Merage School programs. Next year we would like to find a more
streamlined approach to tracking these leads so that we can find their full value in the student life-cycle helping us to make even more informed decisions on ROI.
21 2021-2022 Annual Marketing Report Back
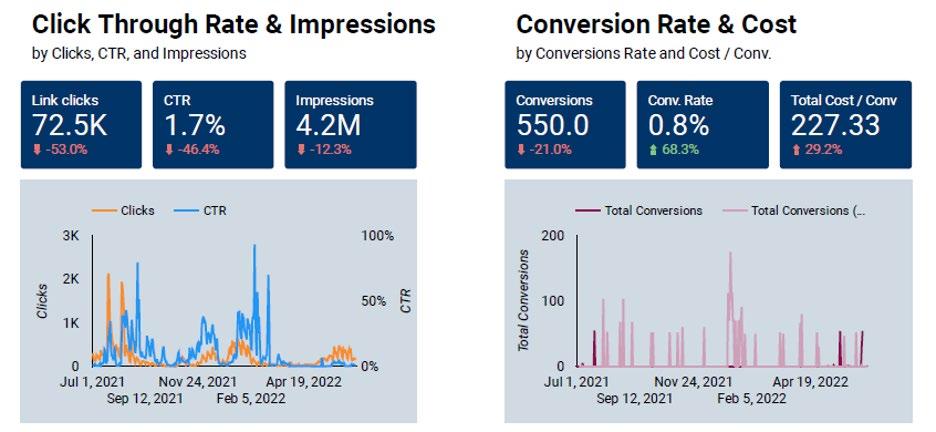
Like other ad platforms, there isn’t a set cost for a LinkedIn campaign. However, LinkedIn typically has higher CPCs (cost-perclick) than other advertising platforms. And while CPCs are typically higher on LinkedIn, when compared to other platforms conversion rate is generally a lot higher on LinkedIn. In 2023 LinkedIn is changing their advertising opportunities to Click to Message ads and Conversation Starter ads.


Recommendations for Next Year
We recommend using the Click to Message ads as they will be a lower cost and add more awareness. This campaign will target users based on specified location, demographic, and groups with certain online behavioral interests and patterns and directs to the respective program landing page or an in-platform lead capturing form within LinkedIn, both allowing the prospect to self-select which program best suits them. With the changes to InMail and the low performance last year, we recommend not testing that platform this fiscal year.
22 2021-2022 Annual Marketing Report Back
Facebook continues to have the highest number of monthly users (2 billion per month), allowing businesses to reach almost any type of consumer. We can target specific audiences with Facebook ads and serve up several different options of ads.
• Video: Highlights product features and attracts users with sound and motion
• Collection: Encourages shopping by displaying user-customized items from a product catalog
• Canvas: Allows users to open a full-screen, mobile-optimized experience
• Carousel: Showcases up to ten images or videos, each with its own link
• Slideshow: Uses motion, sound and text to advertise on any connection speed
• Lead Generation: Image, video or carousel ad followed by a lead capture form to collect info from interested prospects
This platform is best for teasing a prospect into taking further action like searching or visiting the website. The change to the Meta platform by Facebook allows campaigns to be fluid between the two social networks of Facebook and Instagram. The platform serves ads to the targeted audience on both networks and learns which network is performing best for the campaign based on the goals set.

Last year’s Meta ads had mixed results where some programs performed better than others. As a result we are doing a complete ad refresh this year.
Recommendations for Next Year
We will be refreshing the All MBA Meta campaign (Facebook & Instagram) in November 2022 in order to optimize assess creative and drive additional leads through this channel focusing on updating campaign goals to meet current KPIs and testing look-a-like campaigns. Meta lead gen efforts will
target users based on specified location, demographic and groups with certain online behavioral interests and patterns and directs to either the program landing page or an inplatform lead capturing form, both allowing the prospect to self-select which program best suits them.
23 2021-2022 Annual Marketing Report Back
Email Performance
24 2021-2022 Annual Marketing Report Back
All Graduate Programs
Email marketing remains the most direct and effective way of connecting with leads/inquiries, nurturing them and turning them into applicants, consistently winning out over all other marketing channels.
All lead nurturing marketing emails for the graduate program prospects are done through the Salesforce Pardot email marketing platform. Consistently, our emails have outperformed industry average and our Open Rates and Click Thru Rates have substantially increased year over year.
KPIs
FY21/22 Efforts Report Back – Ad Hoc Emails:
Emails
Sent
Open Rate Bounce CTR Opt-Out Rate
All SMP 3 22% 0.02% 14% 0%
MPAc 26 29% 0.01% 16% 0%
MFin 21 26% 0.01% 17% 0%
MSBA 18 19% 0.02% 12% 0%
MIE 18 26% 0.02% 16% 0%
EMBA 41 22% 0.1% 15% 0%
FEMBA 37 27% 0.01% 24% 0% FTMBA 33 24% 0.01% 16% 0% Benchmark NA 19.56% 7.16% 6.93% NA
FY21/22 Efforts Report Back – Drip Emails:
Emails Sent Open Rate Bounce CTR
Opt-Out Rate
MPAc 8 21% 0.01% 13.71% 0.01% MFin 8 22.3% 0.01% 13.5% 0.01%
MSBA 8 19.5% 0.02% 11.38% 0.01%
MIE 8 21% 0.02% 13.82% 0.01%
EMBA 11 24% 0% 12.66% 0.1%
FEMBA 9 25% 0.01% 18.83% 0.1% FTMBA 10 24% 0.01% 15.77% 0.1%
Recommendations for Next Year
Next year we will be designing a new template for the drip emails to keep them updated with our new brand look and feel. We will also be doing a content update in Q1 FY23/24.
Ad Hoc emails will continue to be created as needed with a typical cadence of 2-4 emails per month depending on the program’s needs.
25 2021-2022 Annual Marketing Report Back
Alumni and Community Newsletter
The strategy around alumni and community newsletters has continued to evolve. Currently they are released on the first Thursday of the month, along with a Zotmail.
KPIs
Emails Sent Open Rate CTR
Alumni 12 27.13% 0.73% Community 12 16.08% 2.29%
Year-Over-Year Performance Open Rate CTR
FY 20-21 FY 21-22
Alumni 21% 27.13% Community 15.36% 16.08%
FY 20-21 FY 21-22
Alumni 1% 0.73% Community 1.04% 2.29%
26 2021-2022 Annual Marketing Report Back
Contact
If you have any questions, please contact the Marketing Department:
Levi Eastwood Director, Marketing & Communications leastwoo@uci.edu
Laura Irons
Senior Associate Director of Marketing ironsl@uci.edu
Catherine Cheung Associate Director of Web Communications cheunc12@uci.edu
Maureen Bresse Associate Creative Director mbresse@uci.edu
Jethro Rothe-Kushel Associate Director of Communications jrotheku@uci.edu
Tyler Robinson Manager of Video Production Services ttrobins@uci.edu
27 2021-2022 Annual Marketing Report Back
