
3 minute read
CHAPTER 2: COMMUNITY NEED ASSESSMENT Community Survey


CHAPTER 2: COMMUNITY NEED ASSESSMENT
This section describes the need assessment, documenting common problems that could affect the study areas’ socio-economic and ecological conditions.
Advertisement
COMMUNITY SURVEY
Public participation and local knowledge are the keys to efficient infrastructure planning. The information input from residents can provide insights on, e.g., the types of places the residents find pleasant, calming, accommodating, inconvenient, unsafe, etc., the types of activities they appreciate, and the types of environment supporting or impeding these activities15 .
To better understand the condition in the study area, students in PLAN 642 conducted two short community surveys during their site visit. The survey participants were randomly selected in public gather places (e.g. parks, community centers, marketplace, bus stops, library) near the proposed rail station. A total of 70 people participated in two surveys. 21 participants were surveyed for their opinions on transportation problems. 49 were surveyed for their perception for green spaces and drainage issues in Waipahu.
The survey uses rating questions to assess participants’ key concerns, quality of existing infrastructures, and desired improvements. The rating questions enable survey respondents to rate on the of 1-6 (least severe to most severe, least important to most important, least desirable to most desirable). The survey also used map to collect location information for the most utilized community facilities , their most/least favorite places, and places/facilities that need upgrade and improvement (see figure 14-16).
Figure 17-20 portray the results of community survey. About 90 % of survey respondents ranked traffic congestion as the number one issue in the neighborhood, followed by inadequate parking, bus stops, unsafe sidewalks, and bike lanes. Similarly, the information from community survey for green space and drainage issues indicated safety as the most concerned issue. The safety problem includes flooding, crime, street light, pedestrian and bike facilities safety. While the desired improvements is based off of the issues being raised, it is worth noting that more respondents felt urgent to see improved parking and more bus stops, followed by the provision of linear open space such as parks and multi-use natural greenways rather than a typical street corridor.
We need to acknowledge that due to the time constraint, a limitation of this needs assessment exercise is the small sample size. Increase the sample size would make help to ensure the results are representative. However, despite the small sample size, the survey helped the students to better understand the local concerns and revealed some issues that are consistent with previous studies in the area. In the Waipahu Community Survey (2012), DPP used a larger random sample of 2,700 residents who lived within a half mile of the Waipahu and West Loch Transit Centers. The top two concerns relating to mobility are sidewalks and parking. Approximately 60% of residents, particularly homeowners wanted to see improved sidewalks, as well as those who live near the Waipahu transit center, whereas 45% of respondents, particularly those who live closer to the West Loch station wanted more car parking16. These all reinforce community’s desire for better walkability, better corridor, and solutions for insufficient parking.
15 Juhola, S., Driscoll, P., Mendler de Suarez, J., & Suarez, P. (2013). Social strategy games in communicating trade-offs between mitigation and adaptation in cities. Urban Climate, 4, 102–116. 16 City and County of Honolulu Department of Planning and Permitting. (2017).
Rail station connectivity for TOD Waipahu, p. 16-17.
Figure 14. Map of community favorite place from PLAN 642 survey.
Figure 15. Map of community most often used place from PLAN 642 survey.
Figure 16. Map of community least favorite place from PLAN 642 survey.

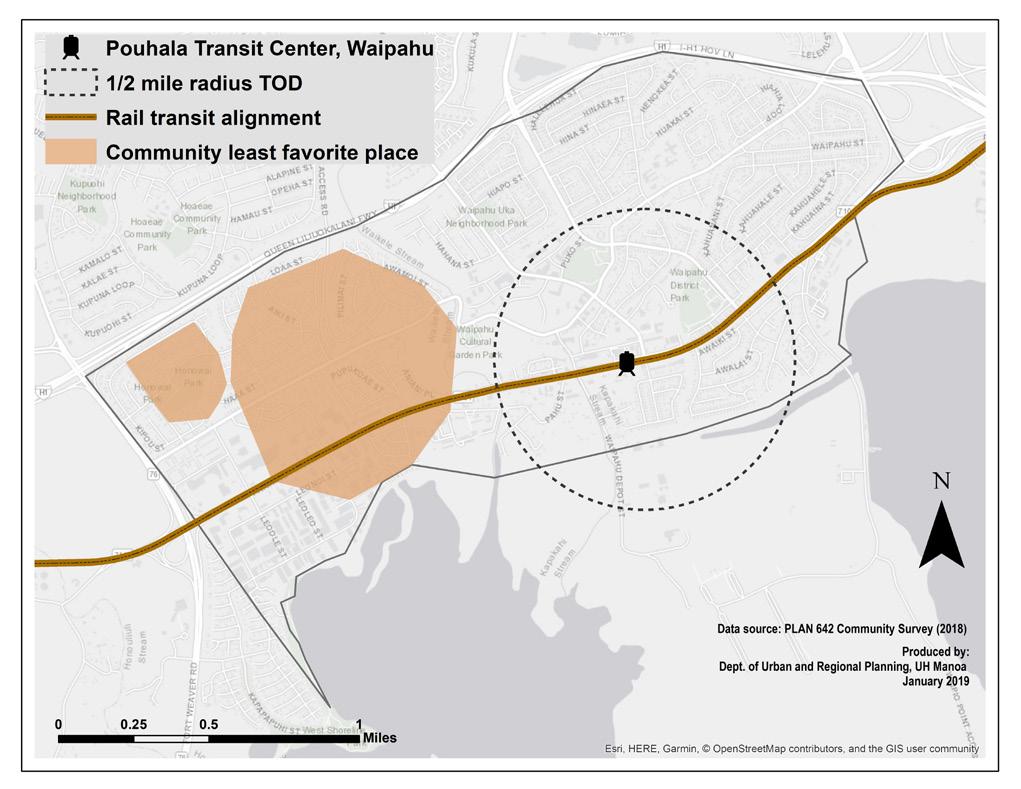
Figure 17. Average Rating of the Severity of transportation problems.

Figure 18. Average Rating of the severity of issues rated to green spaces
Figure 19. Survey of the desired improvement in transportation.
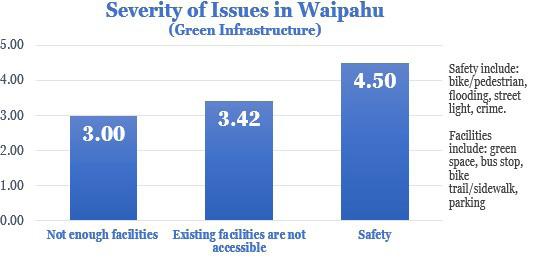
Figure 20. Survey of the desired improvement in regarding green spaces.”


