
12 minute read
CHAPTER 4: SUITABILITY ANALYSIS Multi-modal Transportation Green-Infrastructure


CHAPTER 4: SUITABILITY ANALYSIS
Demand analysis in Chapter 3 reveals that under the built out scenario there are potential shortfalls in road capacity, parking, and wastewater infrastructures, and a significant increase in stormwater runoff due to more impervious surfaces. Given the limited land availability under the built out scenario, it is difficult to expand certain infrastructure such as the roads and parking facilities. To address these problems and accommodate the community needs identified in Chapter 2, we suggest prioritizing improvements in multimodal transportation facilities and adopting green infrastructure when possible. Improving multimodal transportation facilities could help to promote non-auto travel and reduce the needs for additional road and parking facilities. Green infrastructure, if designed properly, could provide the means to reduce stormwater runoff, improve water quality, fulfill the community’s needs for open spaces, parks, greenways, and great bike trails all at the same time. To facilitate the strategic planning of these strategies, this section conducts two GIS-based suitability analyses to 1) prioritize where to improve multimodal transportation facilities in the TOD area, and to 2) identify the most suitable places in the adjacent three watersheds (i.e. Kapakahi, Wahiawa, and Waikele) to implement green infrastructures. Suitability analysis is a commonly used decision-making tool for planners to identify the most or least suitable locations for a specific land use purpose 36. By integrating a variety of factors, suitability analysis provides planners a unitary view of the interaction between the environmental processes and development activities. Figure 27 describes the general process for suitability analysis, which often involves the selection of the suitability criteria, determining the weight of each criterion, calculating the suitability index in GIS environment, visualization and interpretation of the suitability maps. Table 10 summarizes the data and data source used in the following suitability analyses.
Advertisement
Table 10. Variables and data source for suitability analysis.
Data/variables Data Source
Population American Census Survey (2014) Census tracts Census blocks Bus stops City and County of Honolulu, Open Geospatial Data Portal (2018b) Bike facilities City and County of Honolulu, Open Geospatial Data Portal (2018b) Place of interest City and County of Honolulu, Open Geospatial Data Portal (2018b) Zoning City and County of Honolulu, Open Geospatial Data Portal (2018b) Land ownership City and County of Honolulu, Open Geospatial Data Portal (2018b) Parks City and County of Honolulu, Open Geospatial Data Portal (2018b) Streams City and County of Honolulu, Open Geospatial Data Portal (2018b) Crash/accident Hawaii Department of Transportation Cloud Numetric for Crash and Safety Analysis (2012-2014) Tree canopy National Land Cover Database (2011) Impervious surface National Land Cover Database (2011) Community favorites University of Hawai‘i, PLAN 642 (Urban Infrastructure) Site Visit (2018) Improvement sites University of Hawai‘i, PLAN 642 (Urban Infrastructure) Site Visit (2018)
36 ESRI (n.d).
Select criteria Determine Weight
Figure 27. Steps in suitability analysis.
Index Calculation Suitability Map
SUITABILITY ANALYSIS: MULTIMODAL TRANSPORTATION
This section conducts a suitability analysis with the intent to facilitate the achievement of the following objectives:
a. Improve multimodal transportation (i.e. bus, bike, pedestrian) service accessibility, comfort and efficiency; b. Maximize redevelopment potential through land use and transit integration, recognizing transfer points as “multimodal hubs” that provide a seamless transition between travel modes, and reducing conflicts between pedestrians, bicyclists, and motorists or car users through the identification of safe, direct pathways to desired destinations; c. Achieve a multimodal transportation network for Waipahu; d. Increase safety for pedestrians and bicyclists.
Table 11. Criteria and weighting for multi-modal transportation analysis. Criteria Sub-criteria (factors) Weight Value
Demand Population density 0.11 normalized population density Employment density 0.11 normalized employment density Place of interest 0.11 0 = outside 1,000feet 1 = within 1,000 feet
Supply Bike facilities 0.165 0 = within 1,000 feet 1 = outside 1,000 feet
Bus stops
Safety Crash 0.165 0 = within 1,000 feet 1 = outside 1,000 feet 0.33 Normalized crash counts
TRANSPORTATION SUITABILITY = Pop (w) + E (w) + PoI (w) + Bi (w) + Bu (w) + C (w)
Where:
Pop = Population density
E = Employment density
PoI = Place of interest
Bi = Bike facility
Bu = Bus Stop
C = Crash
Figure 28. Factors used to compute multimodal transportation suitability analysis.
Collection and collation of data
Selection of appropriate factors
Standardization of factors • Weight factors
Raster-based computation • Analysis tool (extract, proximity) • Spatial analyst tool (distance, reclass, density) • Conversion tool (to raster) • Normalize data
Standardization of factors • Evaluate suitability
Result analysis • Suitability map of potential multimodal transportation
Figure 29. Transportation suitability analysis procedure. • Define population and employment density • Identify place of interest • Document bike and bus services • Accident count
Essentially, the locations where people go to school, library, retail, cultural attraction, park, etc., are weigh-in factors. For example, in 2005, the Congress created the Safe Routes to School (SRT) program to improve safety and increase the number of children walking and biking to and from school through education efforts, encouragement programs, and road improvements at or near schools. It is equally important to take into consideration where people live and work. More walking trips can be made in areas with higher population and employment density if good facilities are provided. High-density place also serves more populations. Additionally, traffic safety for pedestrians and bicyclists is another major factor for consideration.
As a result, the suitability analysis considers factors such as existing multimodal transportation infrastructure accessibility, point of interest in the region, population density, and traffic safety, which could be classified into three criteria: community demand, infrastructure supply, and safety concerns. The analysis would prioritize areas for multimodal facilities improvement if it has higher population density, higher employment density, within 1000 feet to point of interest (e.g. school, grocery store, parks, hospital, etc.), with no bike facilities within 1000 feet, no bus stops within 1000 feet, and more traffic accidents.
Figure 28 shows the factors and sub-criteria used to conduct the multi-modal transportation suitability analysis. Table 11 lists the weighting and value for each criterion. Without expert inputs, the three criteria are weighted equally and the sub-criteria are also weighted equally within each category. Figure 29 outlines the schematic diagram for the analysis procedure. All sub-criteria factors have been standardized and normalized to have a value between 0-1. Table 12 describes the formula to calculate the suitability index.
RESULT (figure 30-31):
The results of the transportation multimodal suitability analysis indicate special attention and improvements should be prioritized to the several areas within the larger Waipahu region. Scoring values range from 0.4 (red) which shows the most suitable for improvement to 0.2 (green) as the least suitable. Areas in need for improvment are generally located along Farrington Hwy, inland between Managers Dr. and Paiwa St., as well as east of Waipahu in between

Figure 30. Multimodal transportation suitability map for the larger Waipahu area.

Figure 31. Multimodal transportation suitability analysis showing places that are suitable and least suitable within Waipahu 1/2 mile TOD area.
Waipahu St. and Farrington Hwy.
Among these areas identified, areas between Paiwa St. - Farrington Hwy - Awainui St., Mokuola St. - Farrington Hwy. - Awalau St., and Farrington Hwy. - Waipahu Depot, are included due to multiple crashes involving vehicle and pedestrian/bicyclist. Although bike facilities are present in these locations, they could be upgraded to further promote the safety of bike users. Other places along the streets should be given attention due to lack of sidewalks. O‘ahu Pedestrian Plan (2017) suggest residents are 65% more likely to walk in a neighborhood with sidewalks. Furthermore, special attention should be given to improve the Mauka side residential area’s multimodal accessibility to the TOD area.
SUITABILITY ANALYSIS: GREEN INFRASTRUCTURE
Green infrastructure refers to a series of vegetated spaces, facilities or elements that are engineered to mimic natural processes and are used to provide ecosystem services and environmental benefits to humans, flora and fauna37. In the context of sustainability, green infrastructure becomes particularly important as it could be used to address the triple bottom line (social, environmental/ecological, and financial) comprehensively. Addressing issues using green infrastructure solution require consideration of best management practices (BMPs) that are multifunctional, meaning they can provide many ecosystem services at once (e.g. evapotranspiration, carbon sequestration, or reduced temperatures), and interact with the social, cultural, economic and environmental of one place38. Multifunctionality should be the basis of design and planning green infrastructure. This dynamic should be the framework to ensure that green infrastructure is beneficial not only to the environment, but also individual, families, and communities, and to the economy.
37 Environmental Protection Agency, 2017; Young et al., 2014. 38 Benedict, 2006; Landscape Institute, 2017; Pakzad et al., 2016; Tzoulas et al., 2007; Weber et al., 2006.
GREEN INFRASTRUCTURE SUITABILITY =
I (w) + C (w) + FA (w) + Pop (w) + CF (w) + IS (w) + Z (w) + L (w) + P (w)
Where:
I = impervious surface C = flow accumulation FA = tree canopy Pop = population density CF = community favorites IS = improvement sites Z = zoning L= land ownership P = proximity to park
Criteria Sub-criteria (factors) Weight Value
Physical Impervious surface 0.11 Percentage of impervious surface coverage Tree canopy 0.11 normalized value with 0 as highest coverage and 1 as lowest coverage Flow accumulation 0.11 normalized flow accumulation value, 1 as highest Community Population density 0.11 normalized population density, 1 as highest Community favorites 0.11 1 if selected, 0 if not Improvement sites 0.11 1 if selected, 0 if not Implementation Zoning 0.11 0.2 = residential 0.4 = high density residential 0.6 = medium density apartment, Business mixed-use 0.8 = low density apartment, Neighborhood business, Community business, Industrial, district 1 = preservation, Agriculture, Federal and military Land ownership 0.11 0.5 = private lands 1 = public lands
Proximity to existing green space 0.11 0 = within 1,000 feet
1 = outside 1,000 feet
This section conducts a suitability analysis to identify the most suitable places to implement green infrastructure in the study area and adjacent watersheds. Because green infrastructure works better at the watershed scale, the suitability analysis covers four watersheds adjacent to Waipahu TOD area, namely Waikele, Honouliuli, Kapakahi, and Waipio watersheds. It considers physical environment, implementation feasibility, community preference and benefits to address the multifunctionality. figure 36 lists the criteria and factors considered in green infrastructure suitability analysis. Criteria are selected based on academic literature review. For physical environment, this suitability analysis considers factors such as impervious surface, flow accumulation, and tree canopy coverage. It prioritizes places with more impervious surface, less tree canopy coverage, and more flow accumulation to target places that are more likely to be flooded and has less absorption capacity. For community preference and benefits, it includes population density and community’s inputs on favorite sites and areas for improvement. The analysis prefers areas that are frequently used by the community, have been identified as in need of improvement, and have the potential to serve more population. Finally, from implementation perspective, it considers the zoning, land ownership, and proximity to existing green spaces. It assigns higher weights on places zoned as preservation or low-density apartment/business/ mixed-use, government owned land and without green spaces, and gives lower weights on places zoned as residential, private land, and within 1000 ft of existing green spaces.
Table 13 shows the weight and value for each factor. All criteria and sub-criteria are weighted equally. The value of each factor has been standardized and normalized to between 0-1. Table 12 presents the formula for suitability index calculation. Figure 37 describes the schematic diagram for the analysis procedure.

Figure 36. Factors used to compute green infrastructure suitability analysis.
Collection and collation of data
Selection of appropriate factors
Standardization of factors • Weight factors • Reclassification • Define population and employment density • Identify impervious surface, tree canopy, flow accumulation, existing space/ park • Understand zoning and land use types • Document land ownership
Raster-based computation • Analysis tool (extract, proximity) • Data management tool (general) • Spatial analyst tool (distance, reclass, density, hydrology, math) • Conversion tool (to raster) • Normalize data • Raster calculator
Multicriteria evaluation • Evaluate suitability • Create multi-category suitability map
Result analysis • Suitability map of potential green infrastructure
RESULT (figure 32-33):
The results of the green infrastructure suitability analysis based on the nine factors combined indicate that specific locations in Waipahu and the TOD area are more suitable to implement green infrastructure than the others. Scoring value range from 0.86 (red shaded) which indicates high suitable for improvement to 0.04 (green shaded) for the least suitable. Generally, areas along Farrington Hwy, and between Queen Liliuokalani Fwy and Farrington Hwy are the most suitable. These locations are best suited for bioswales, permeable pavements, and green roofs type of green infrastructure. The location along Farrington Hwy was identified as one of the best suited areas for bioswales due to the stormwater runoff and flooding issue that occur adjacent to the rail station, as well as its land use type. Figure 34-35 depict the currently underused small pockets at the proposed locations (e.g., sidewalk setbacks and central corridor under the rail structures), where the area’s stormwater management may be enhanced with green infrastructure. Other places with retail, office and high-rise apartment land use are selected for possible implementation of green roofs. These locations currently have higher percentage of impervious surface and less green space. In particular, the state parcels near the rail station could be a suitable area to implement green infrastructure. However, in order to eliminate the flooding problem in the lower watershed, green infrastructure and stormwater facilities in the whole watersheds need to be improved. It is worth noting that the suitability identified in this analysis is the general suitability. Green infrastructure types and functionalities differ across

Figure 32. Green infrastructure suitability analysis showing places that are suitable and least suitable of the larger watershed area.
Figure 33. Green infrastructure suitability analysis showing places that are suitable and least suitable within ½ mile TOD area.
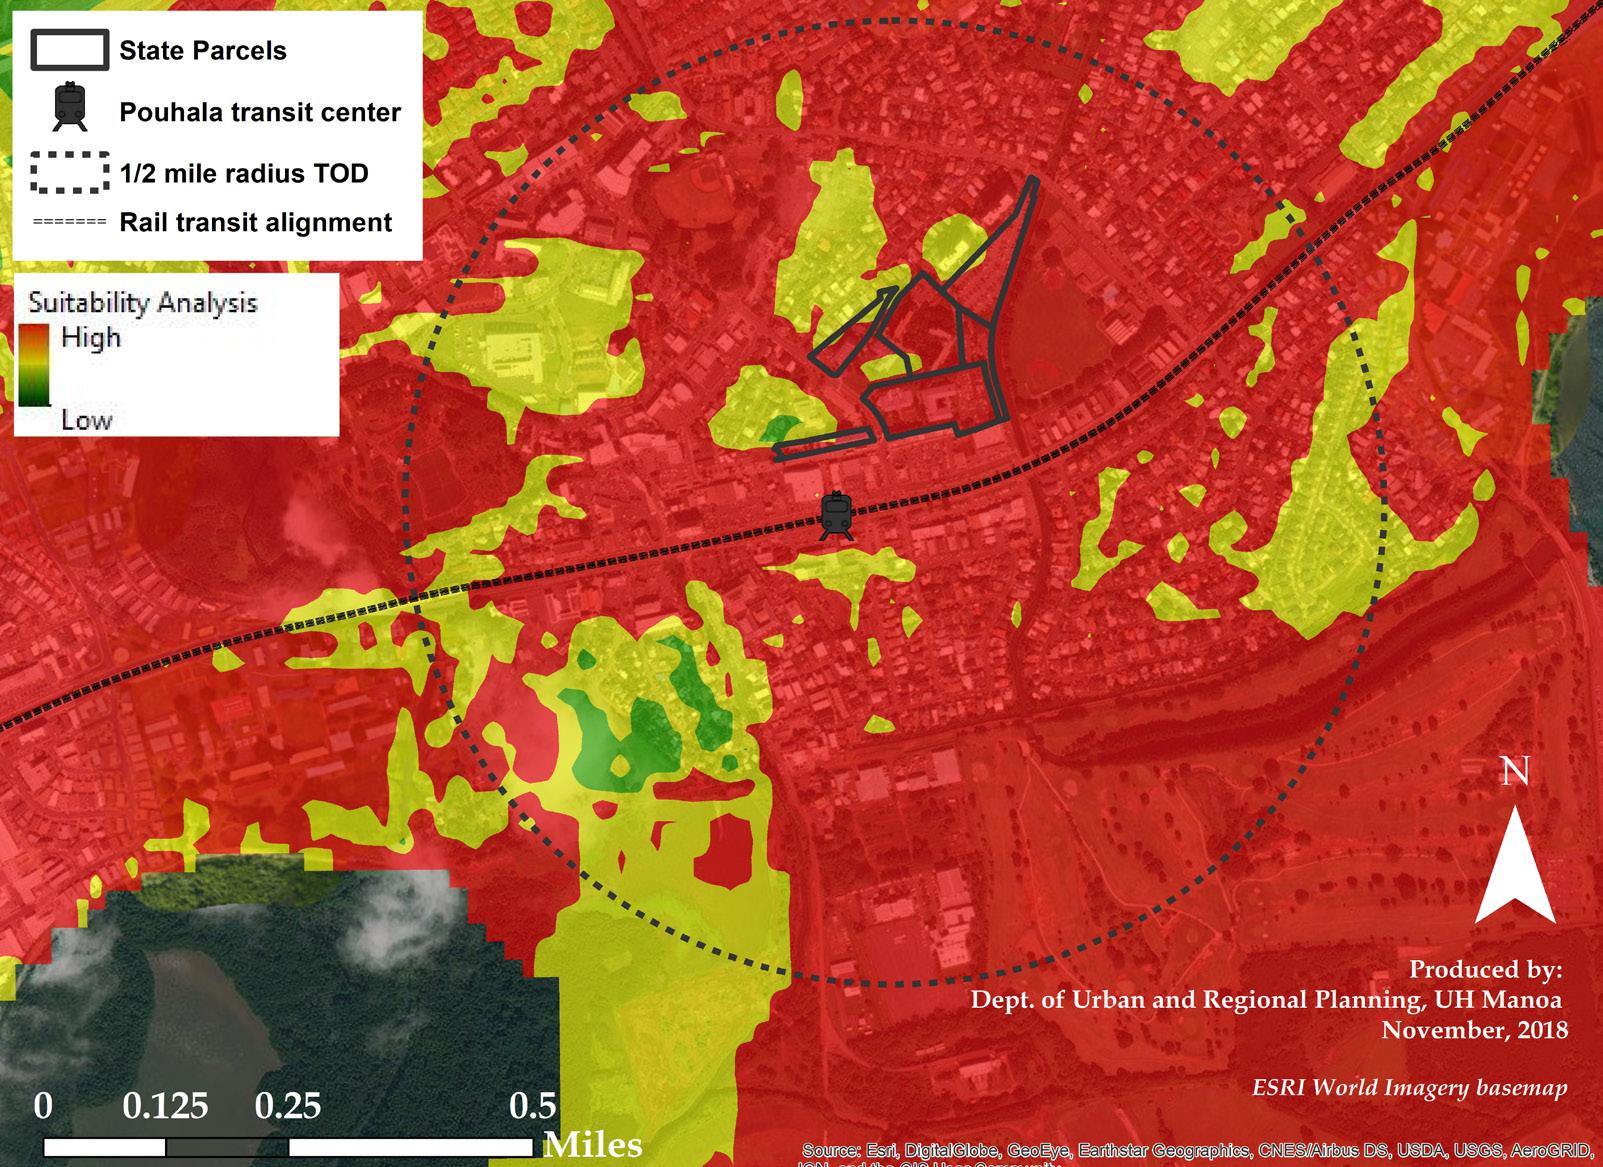

Figure 34-35. Example of potential locations for green infrastructure projects.

