Value Proposition
➢ Shooting rimfire firearms is popular due to cost, recoil, and availability.
➢ Autoloading rimfires use shot energy to cycle cartridges.
➢ Cycling failures cost the shooter time and money.
➢ Chamber pressure curves are available, but there is little other information correlated to reliable cycling.
➢ Our goal is to help quantify the forces during firing, to better understand how they correlate to proper cycling, allowing manufacturers to reduce failure rates.
Key Requirements
Design a fixture that will:
➢ Measure forces on breech (axial)
➢ Measure forces on chamber (radial)
➢ Simultaneously record forces vs time
Concept Design

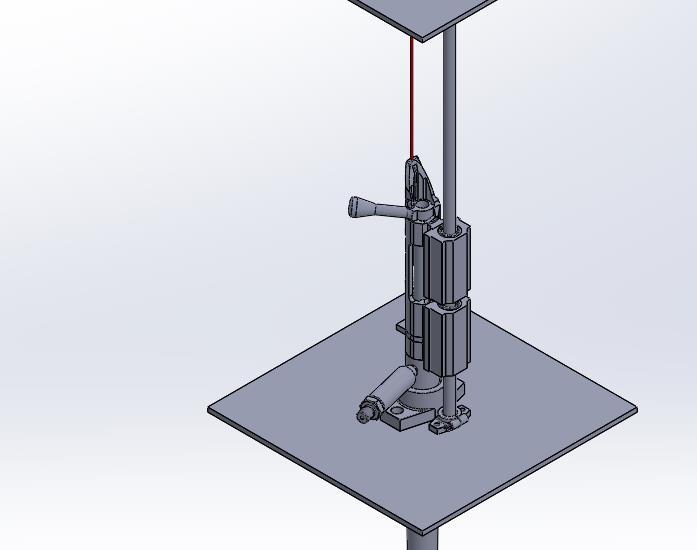
Three designs were evaluated that would meet the requirements


T Block design chosen due advantages in:
➢ Sensor sampling rate and resolution
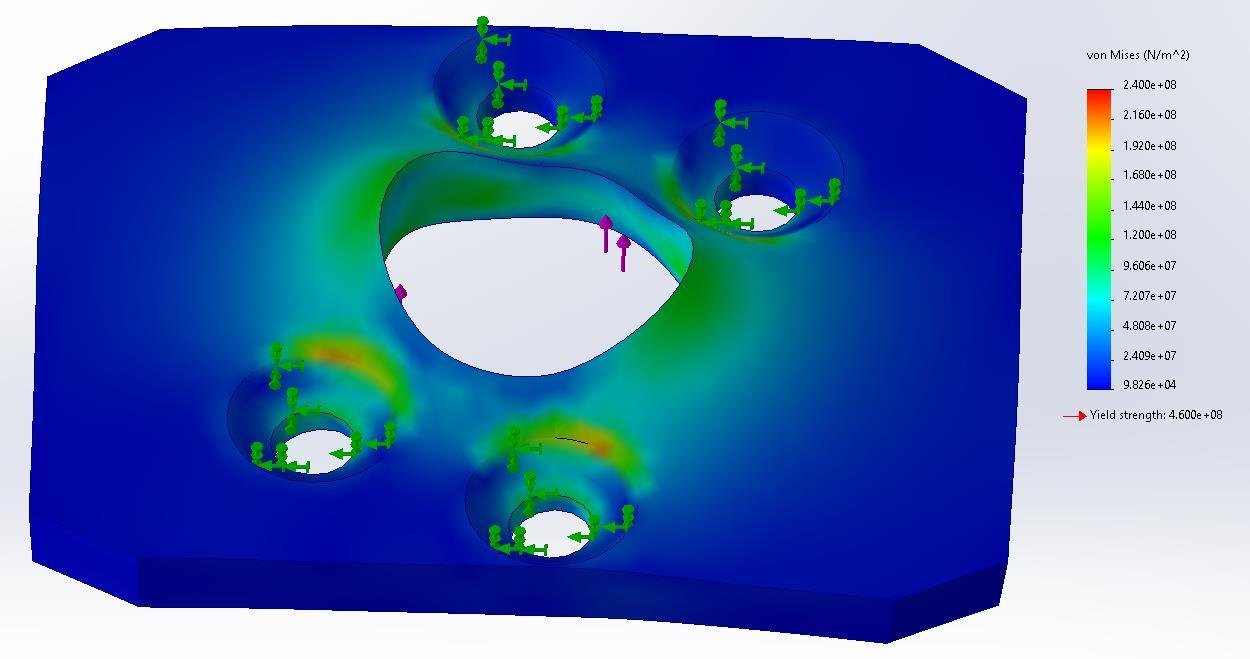
➢ Longevity and safety
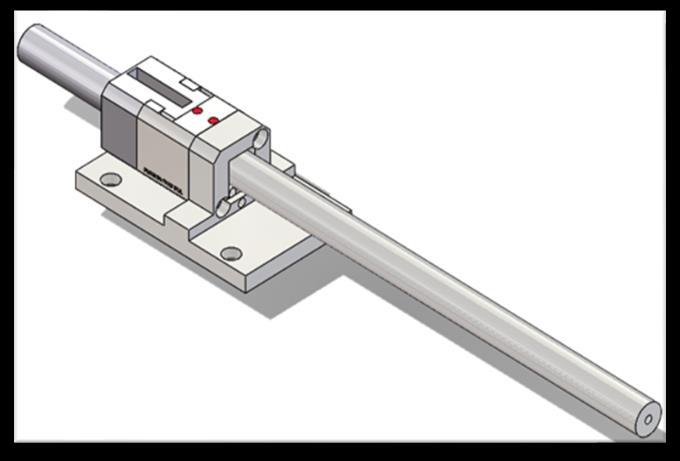
Displacement Modified 10/22 T-Block
Pat Chmelik, Kyle Christopher, Shane ElmoseFinal Design
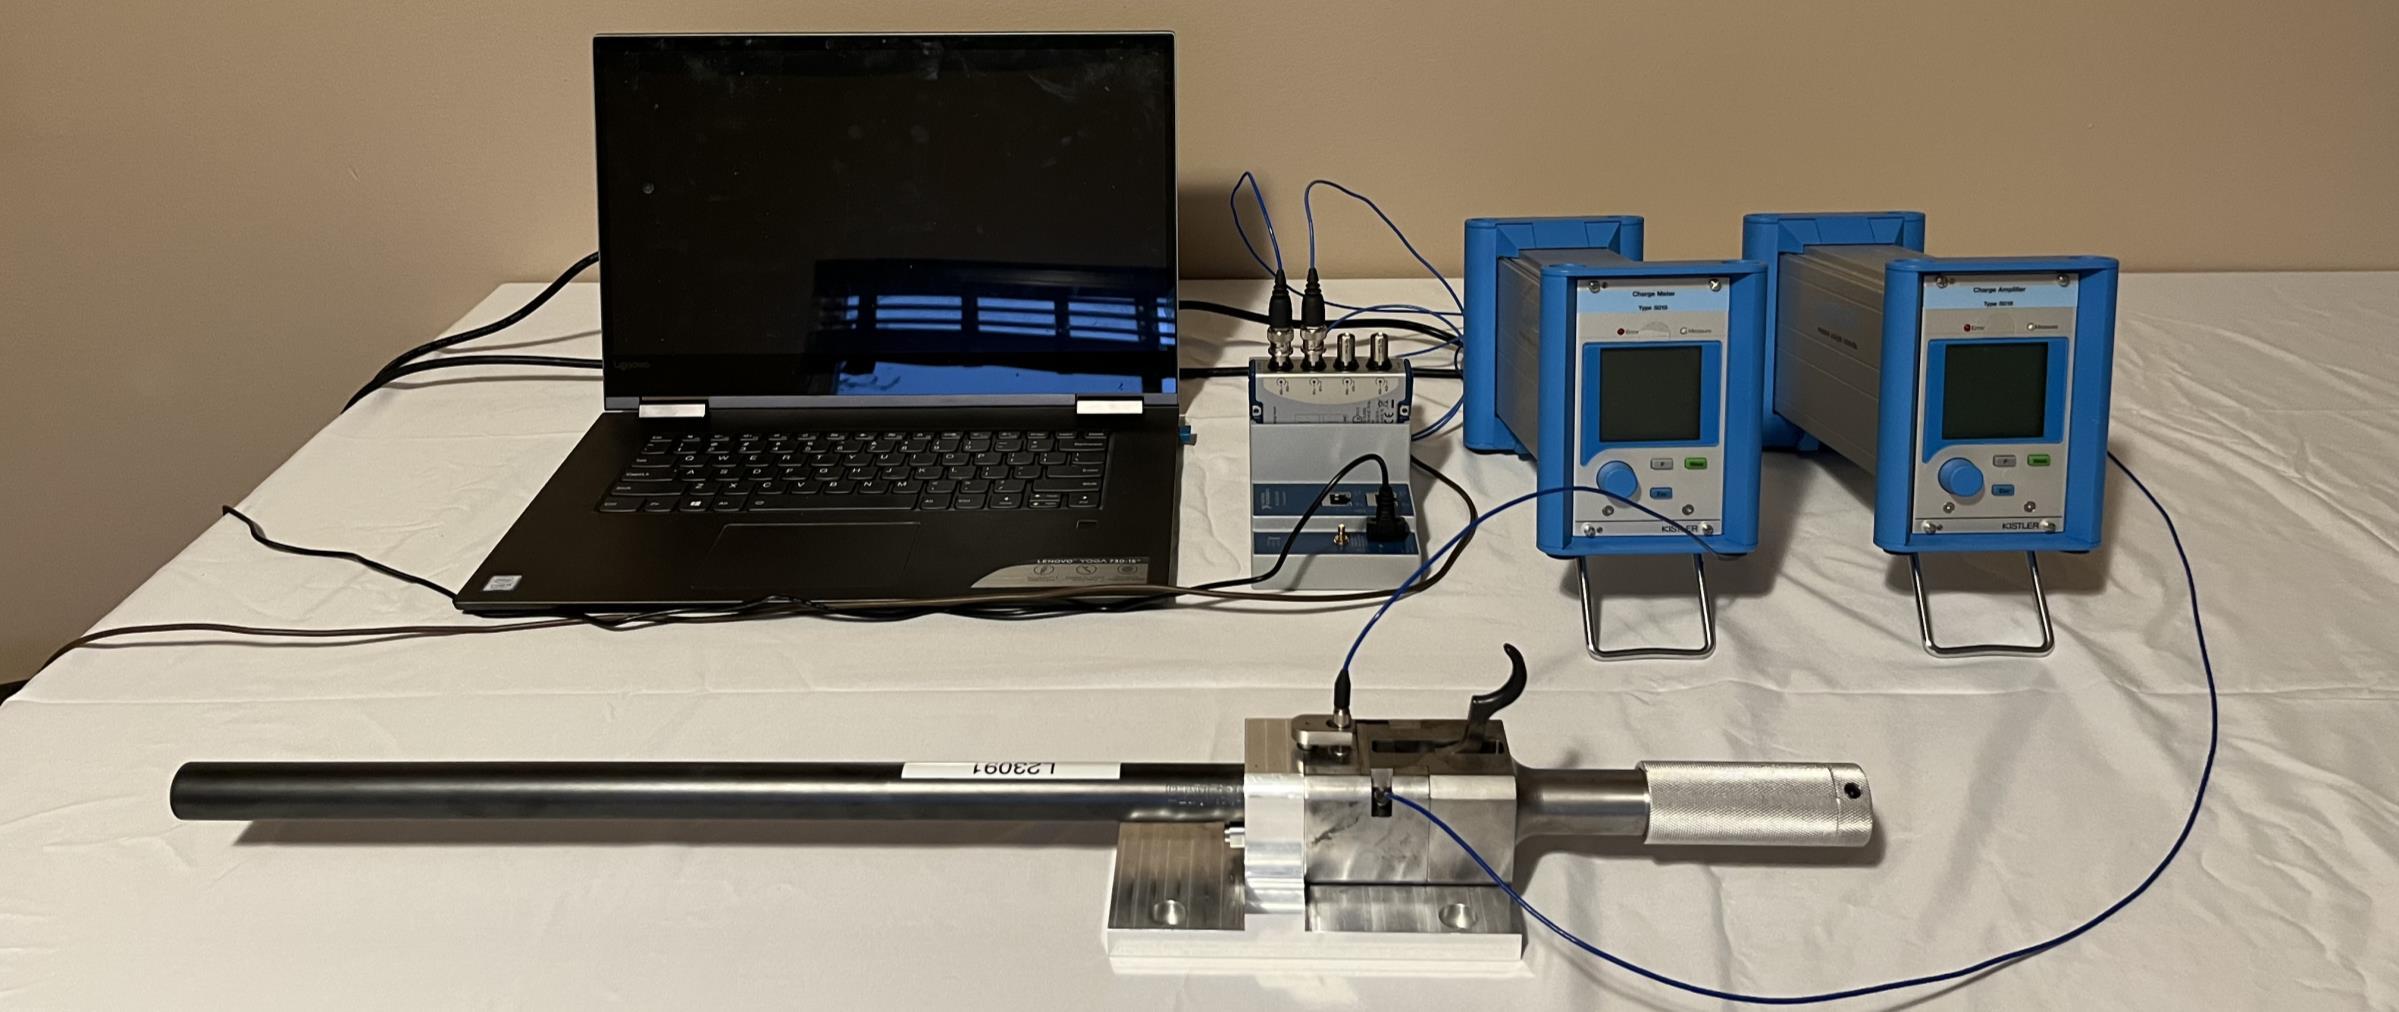
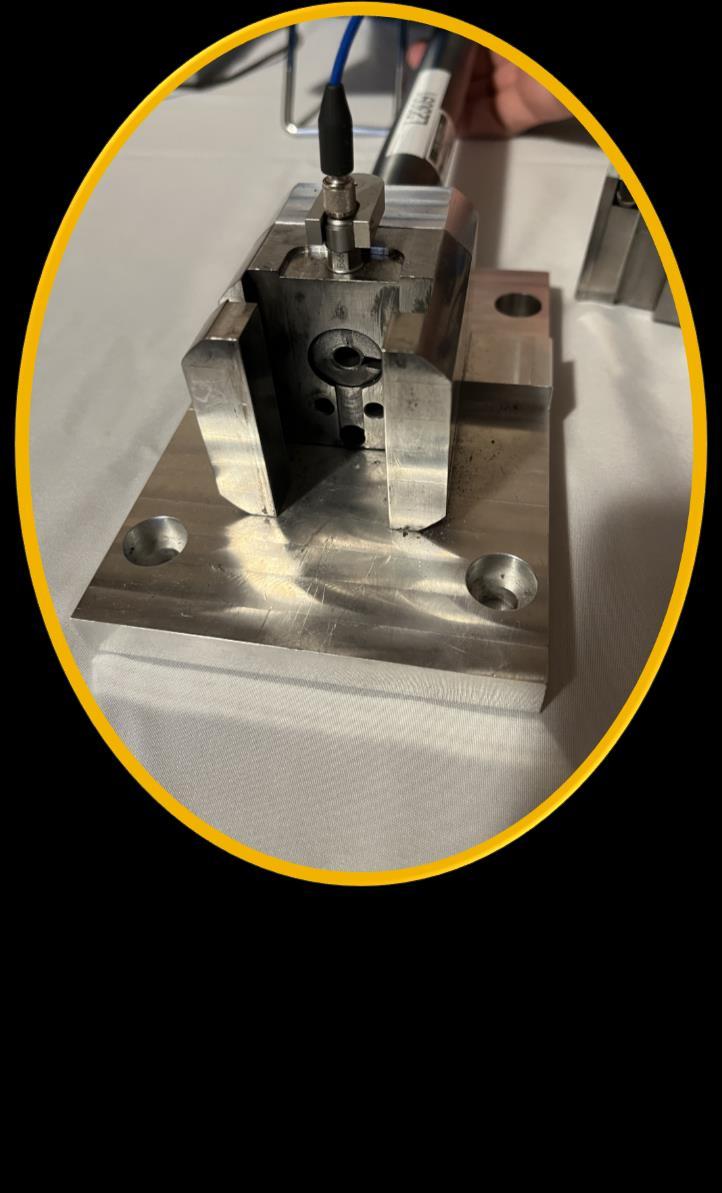
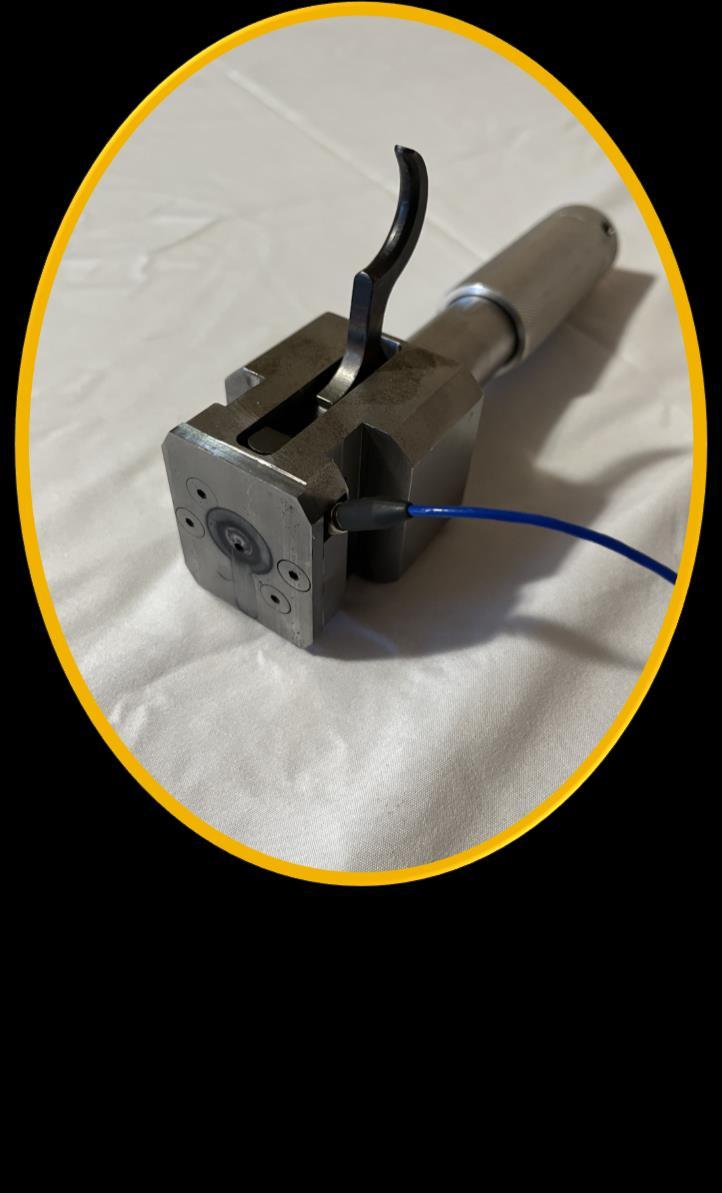
The test fixture was equipped with a pair of piezoelectric sensors that were strategically positioned to measure both radial and axial forces. One sensor was placed behind the breech face while the other was situated in the barrel. To facilitate signal amplification and transfer, two charge amplifiers [A] were used in conjunction with a data acquisition (DAQ) [B] system. The DAQ was configured using LabVIEW, while data analysis was performed using MATLAB.
* [A] and [B] reference image immediately below
Data Acquisition/Testing
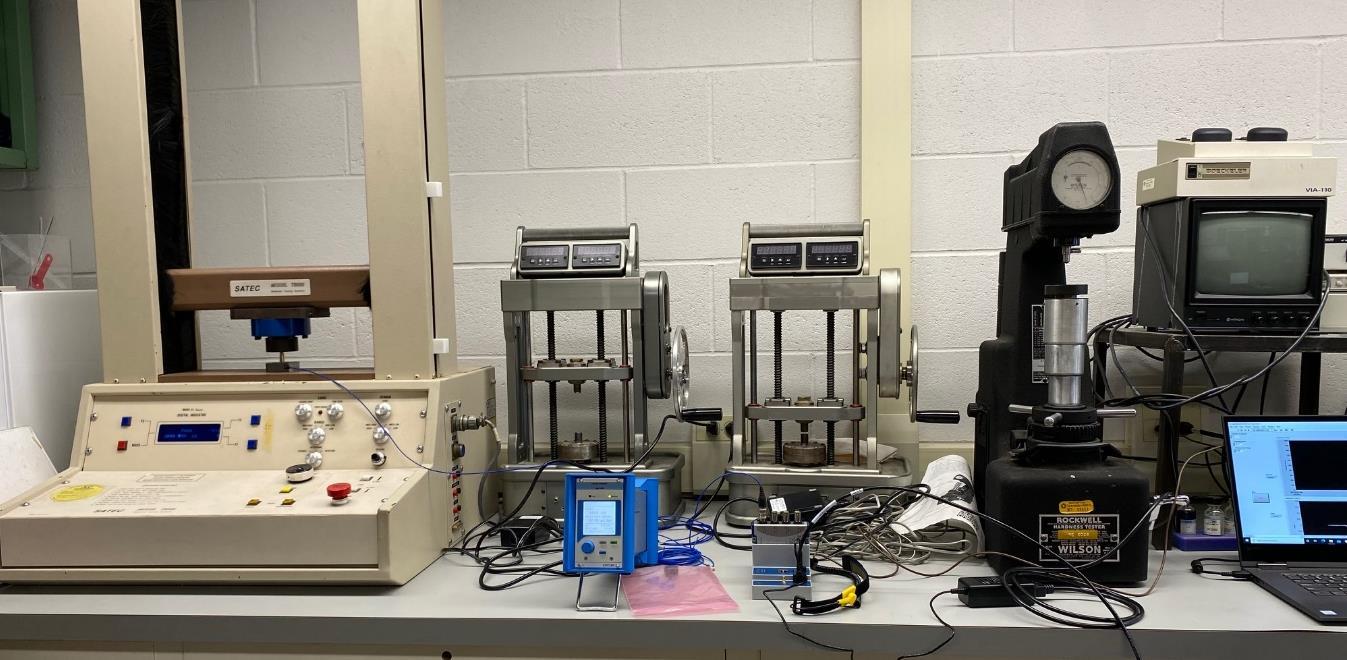
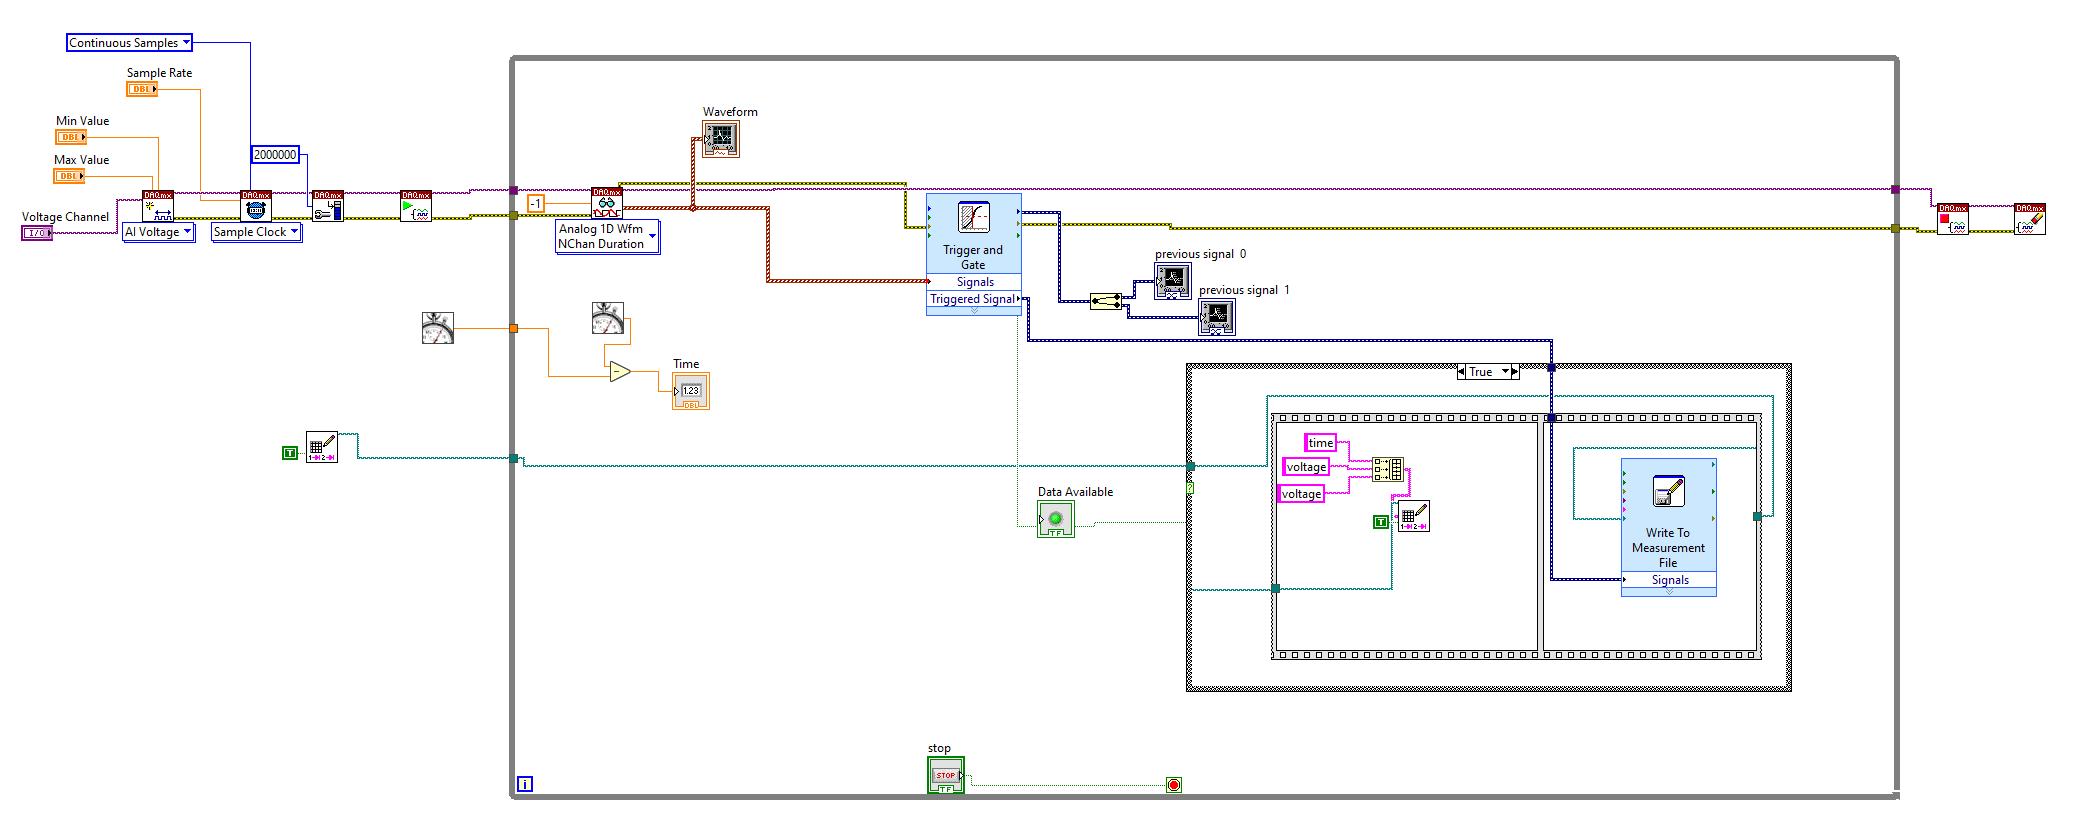
➢ 200 kHz sampling rate
➢ 0.1 V reference trigger record 200 pre trigger samples and 400 post-trigger
➢ Data stored as text file with time, axial force voltage, and radial pressure voltage
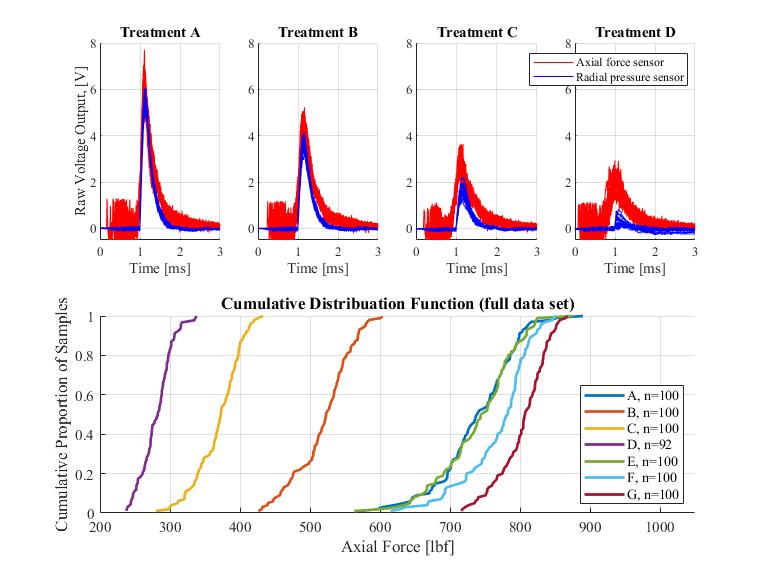
➢ Test 7 different treatments, 100 cartridges each
Results
Calibration
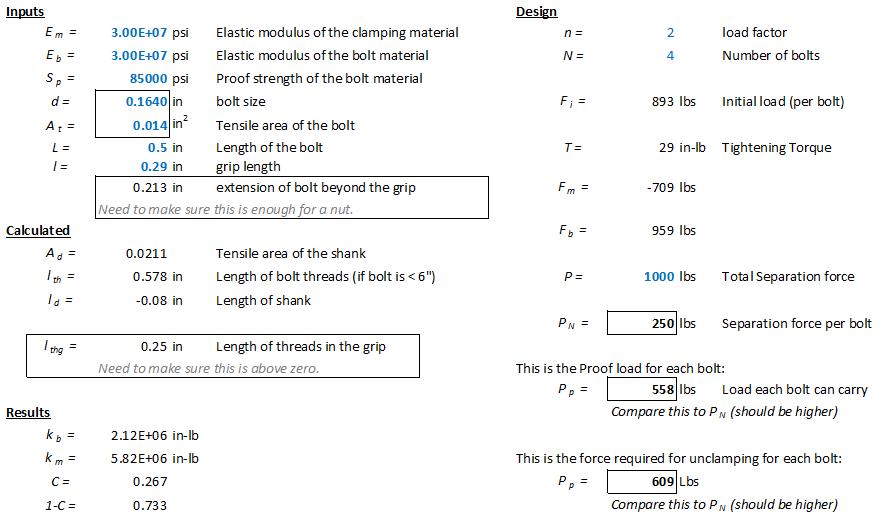
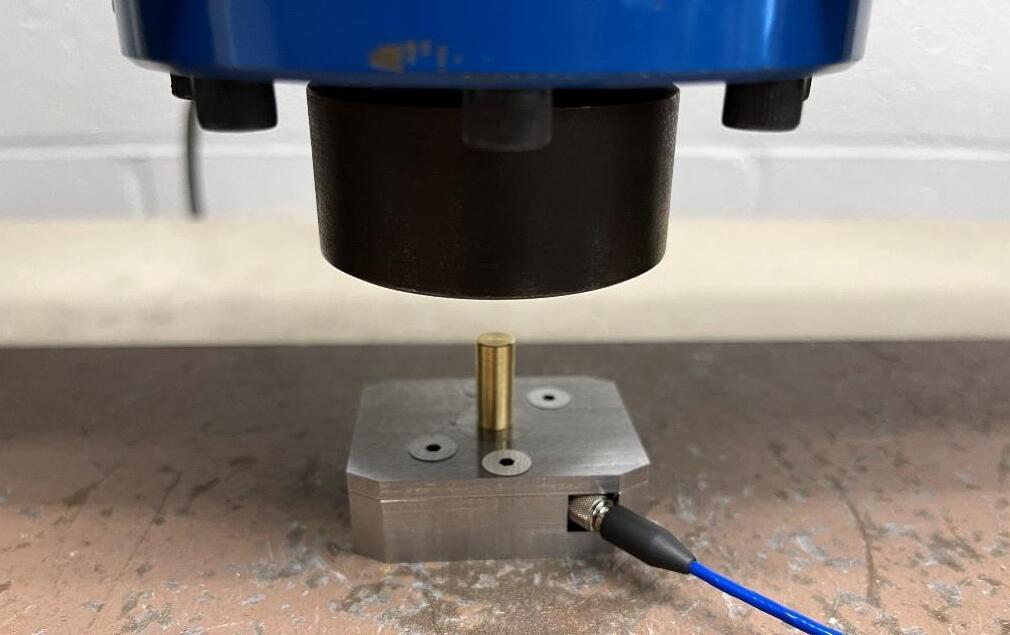
Sensors were calibrated to establish a correlation between measured voltage levels and force. In the case of the axial force sensor, a preload of 1000 lbf was necessary to ensure a linear relationship with the applied force. However, achieving this pre-load required extremely tight tolerances while machining the fixture.

Design Analysis

