12 minute read
UNDERSTANDING BACKGROUND CONDITIONS AND PATTERNS OF CHANGE


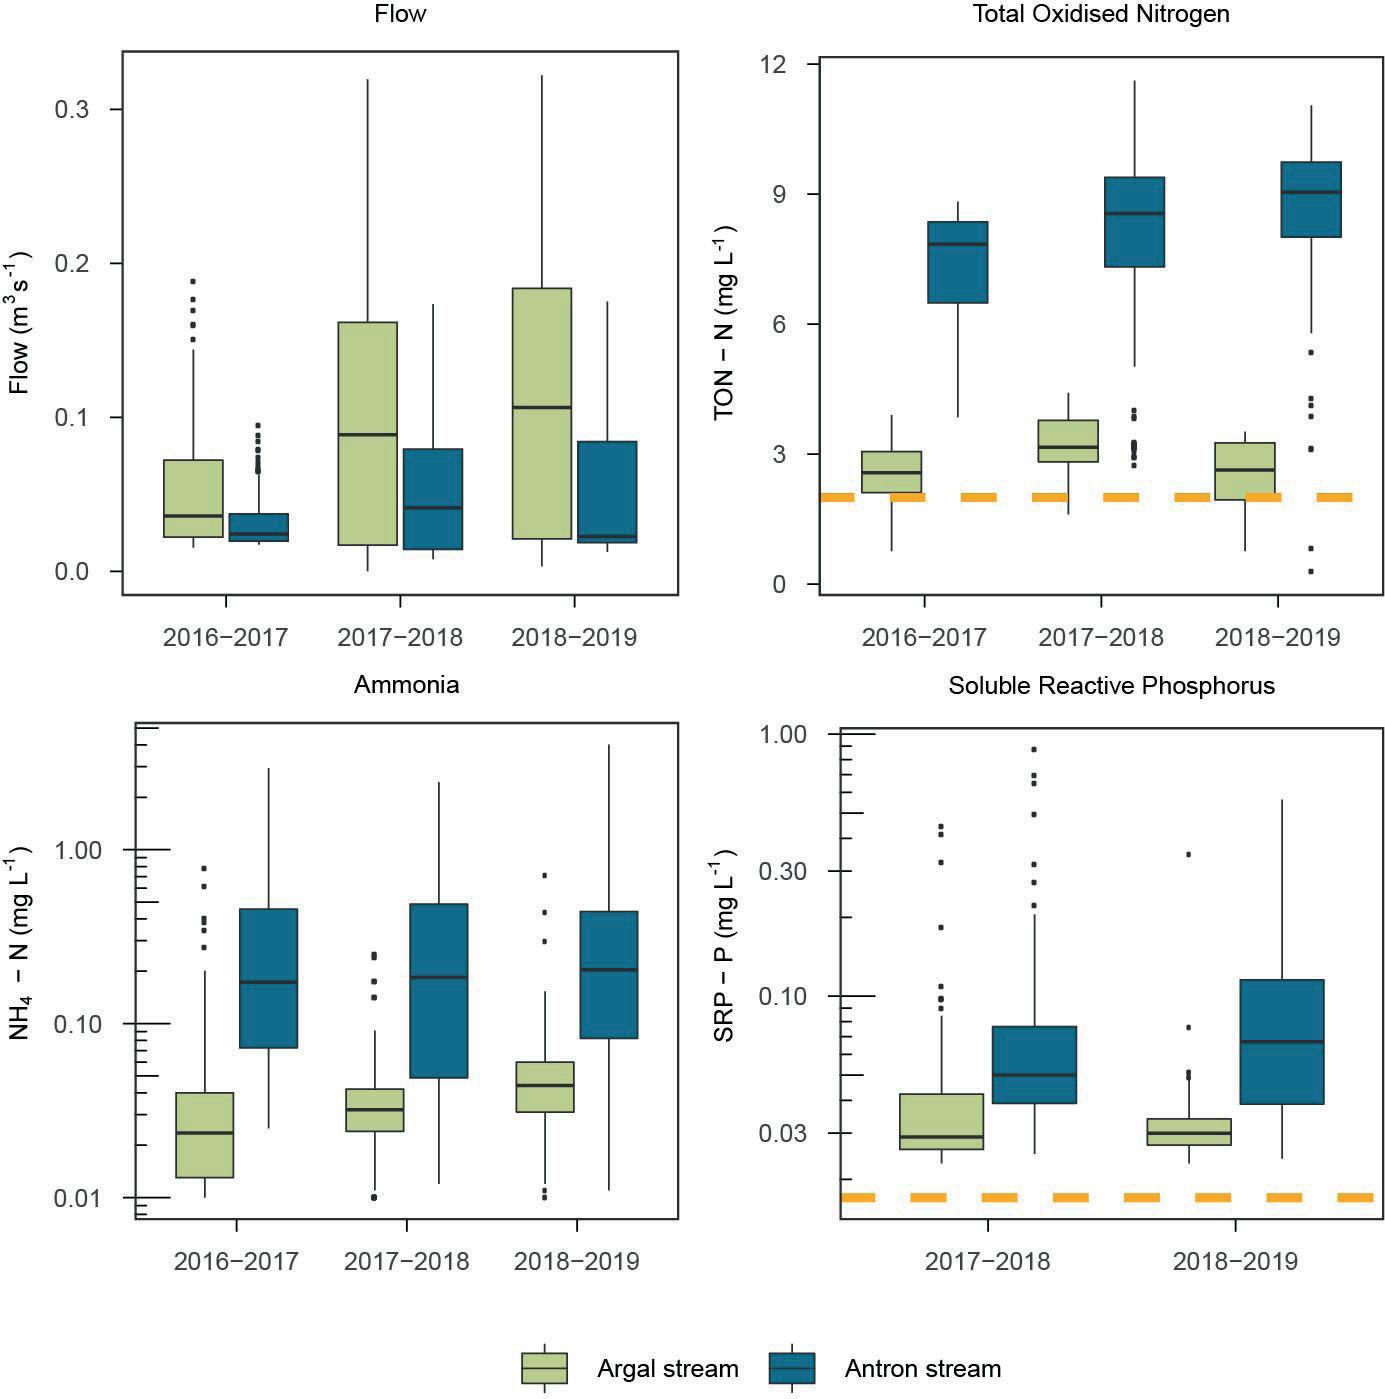
Figure 3 Flow (m3 s-1), Total Oxidised Nitrogen,
ammonium and Soluble Reactive Phosphorus concentrations in feeder streams to Argal lake, with the Antron Stream experiencing worse water quality consistently than the Argal Stream. For both sites, concentrations are consistently above the orange lines representing SWW’s limit of 2 mg L-1 for Total Oxidised Nitrogen, and the Water Framework Directive good status limit of 0.017 mg L-1 for Total Phosphorus in the reservoir, both used as a target for quantifying impacts of the project.
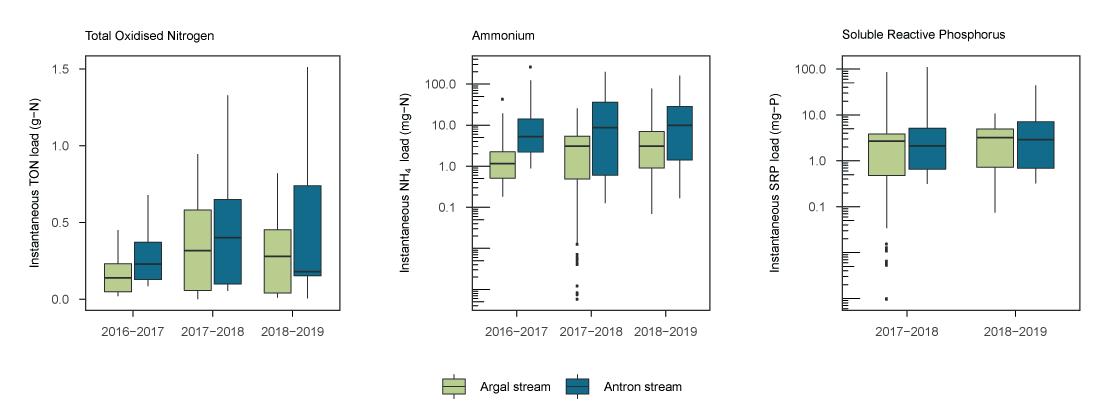
Figure 4 Total Oxidised
Nitrogen (mg-N), ammonium (mg-N) and Soluble Reactive Phosphorus (mg-P) loads measured by the project in the two feeder streams to Argal lake between 20162017 and 2018-2019: despite lower streamflow, nutrients loadings at the Antron Stream are significantly higher for all nutrients due to particulalry high concentrations.
Water quality and diffuse pollution during rainfall events
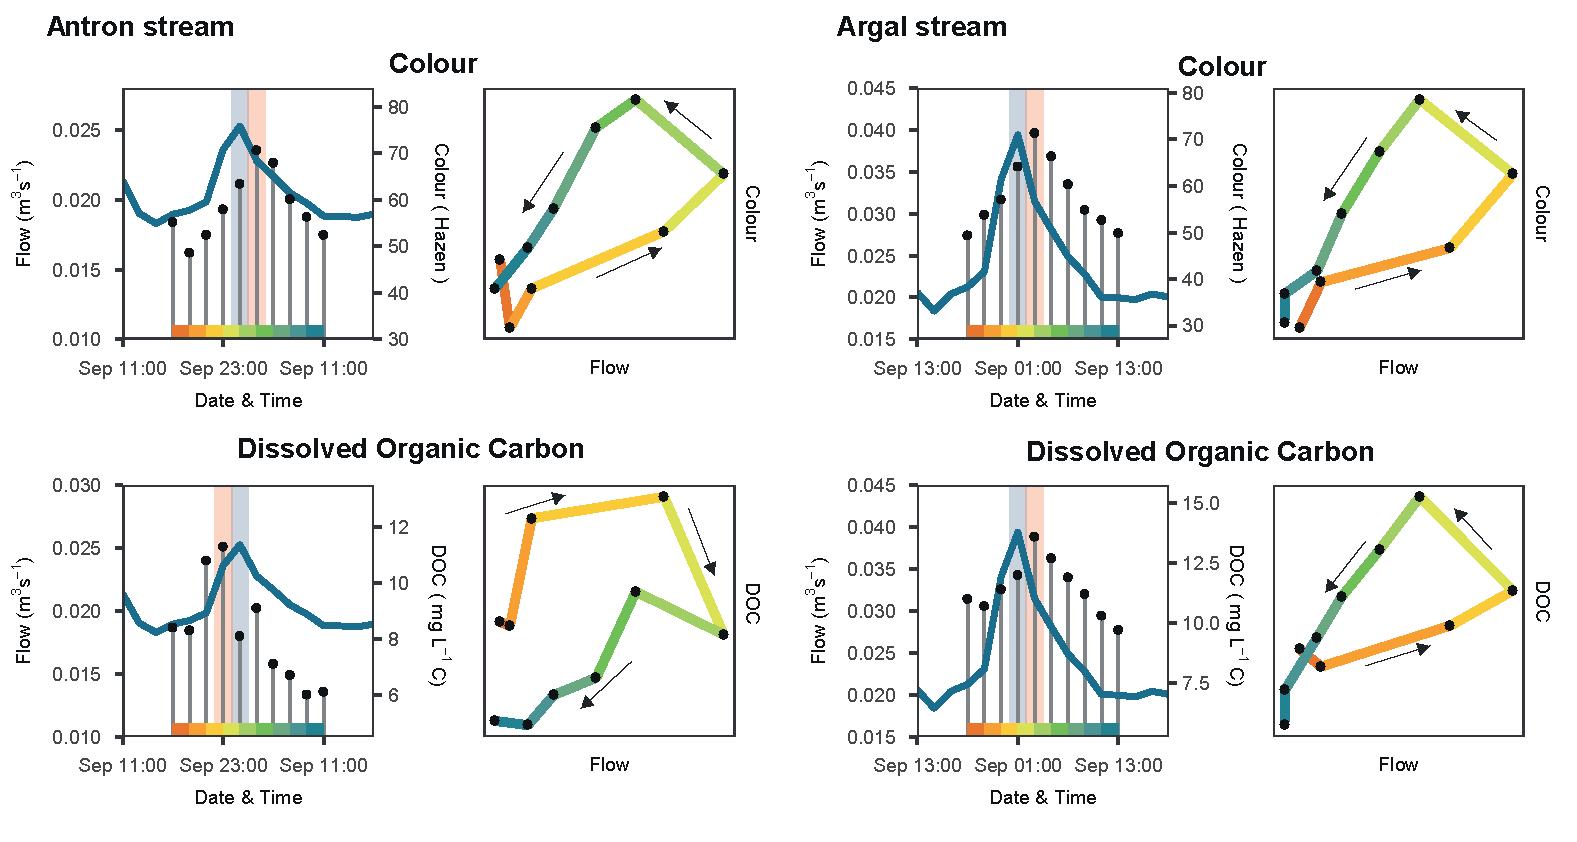
In addition, the hysteresis behaviour of DOC and colour between sites during rainfall events gives interesting information on the origin of pollution during storms within the catchment. In the Argal Stream, the maximum concentration (highlighted in red) of both DOC and colour occurs soon after the maximum stream flow (highlighted in blue) (Figure 5A), which is materialised by two similar anticlockwise hysteresis loops. However, in the Antron Stream, the peak of DOC is desynchronised and occurs earlier than that of colour, as shown by a clockwise loop (Figure 5B). It is likely that DOC peaks earlier because it originates from a different and closer source than colour, for example fields or farmyard hard standings close to the reservoir. However, in the Argal Stream, it is likely that the source of both DOC and colour is the same and further away from the reservoir. This is useful information to investigate pollution sources within catchments, as it allows the project partners to target the most problematic areas.
Figure 5 Relationship between flow (m3 s-1) and water quality parameters (i.e.
Dissolved Organic Carbon (DOC) and colour in mg L-1) for both Argal feeder streams for one storm event, with associated hysteresis loop: the events considered show an anticlockwise loop for colour and a clockwise loop for DOC at the Antron stream, whereas both hysteresis loops are anticlockwise for the Argal stream, highlighting a difference of behaviour for DOC losses between the two streams.
Blue-green algae and nutrient content in the reservoir
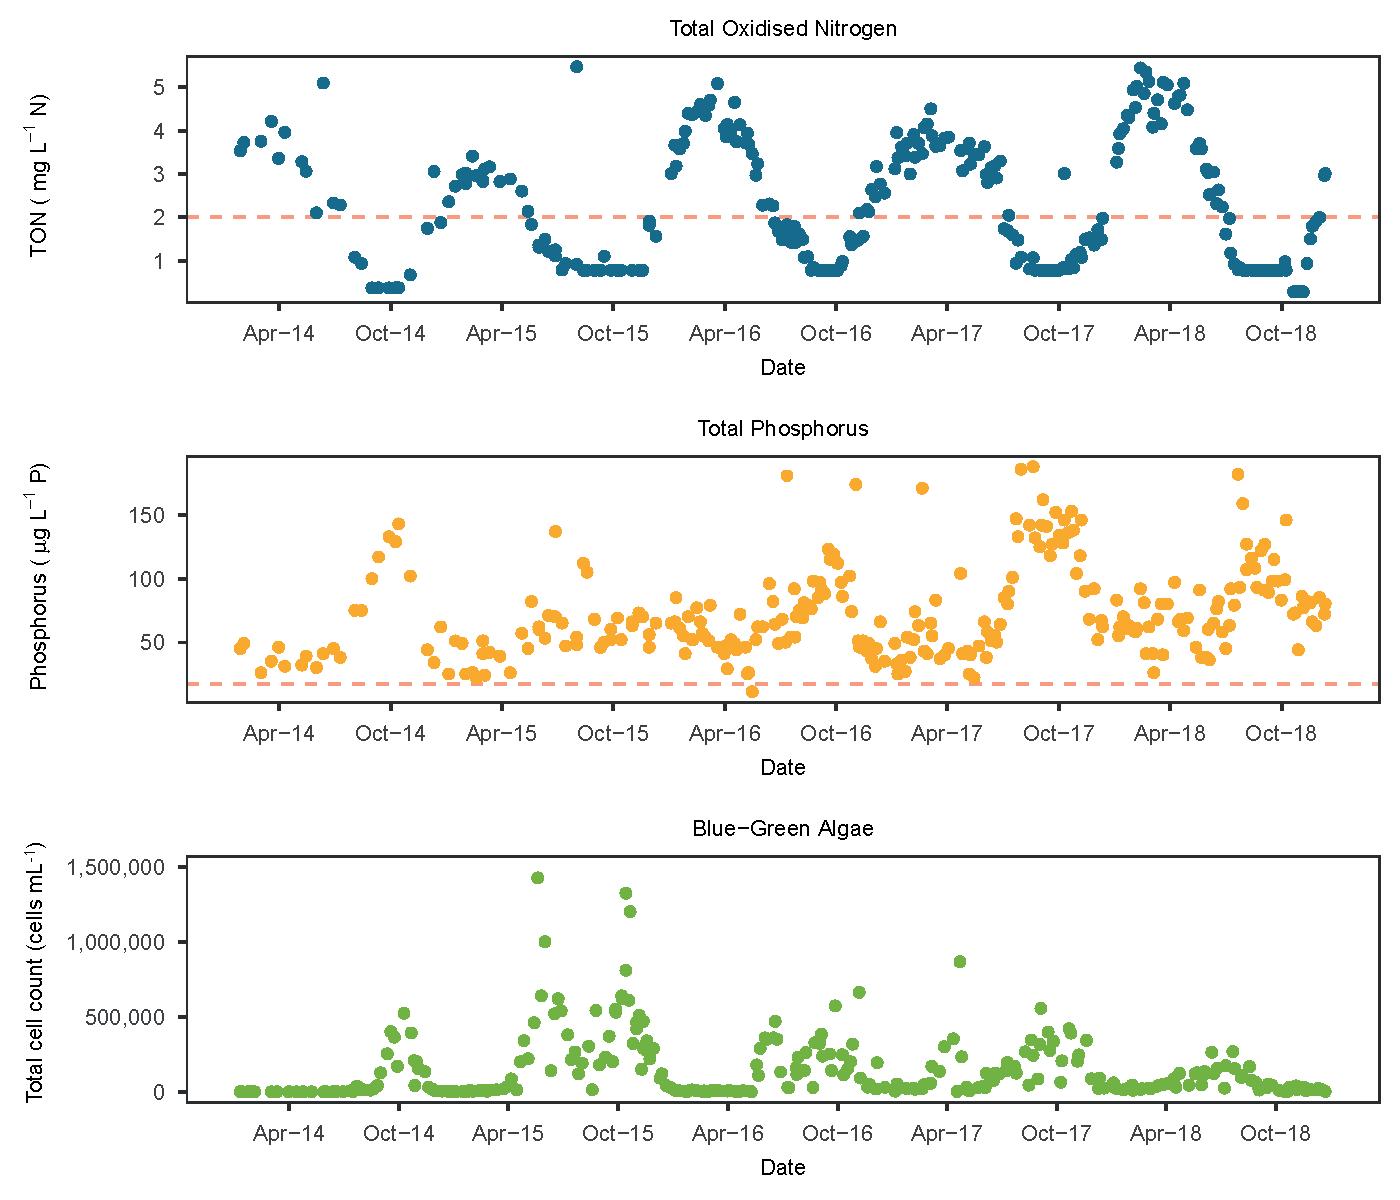
Blue-green algal blooms are a major problem for Argal reservoir (Figure 6). The study of algae content is coupled with that of nutrients in the reservoir (Figure 7) as these are a major driver for eutrophication. Overall, data from Argal reservoir shows that this reservoir experiences some of the worst blooms across the region (see Figure 4 p23), with concentrations going up to 1,500,000 cells mL-1. Overall, all parameters show a seasonal pattern, although these do not always coincide with algal blooms. TON concentrations in the reservoir reach their maximum around April and exceed the 2 mg L-1 target set by SWW as evidence of successful impact of incatchment measures for part of the year, making spring the most at-risk period for the treatment of water. Overall, most TP samples collected since 2014 show concentrations higher than the WFD good status targets for total phosphorus. Phosphorus tends to peak in autumn (i.e. October) (Figure 7, middle), although this seasonal trend is less clear. As blue-green algal blooms generally occur in summer/autumn (Figure 7 bottom and Figure 8), blooms are concomitant with P concentrations but not N. Incatchment efforts to limit nutrient input to the reservoir should therefore focus on the reduction of P to reduce blue-green algal blooms, and the significant costs and risks to health that they pose.
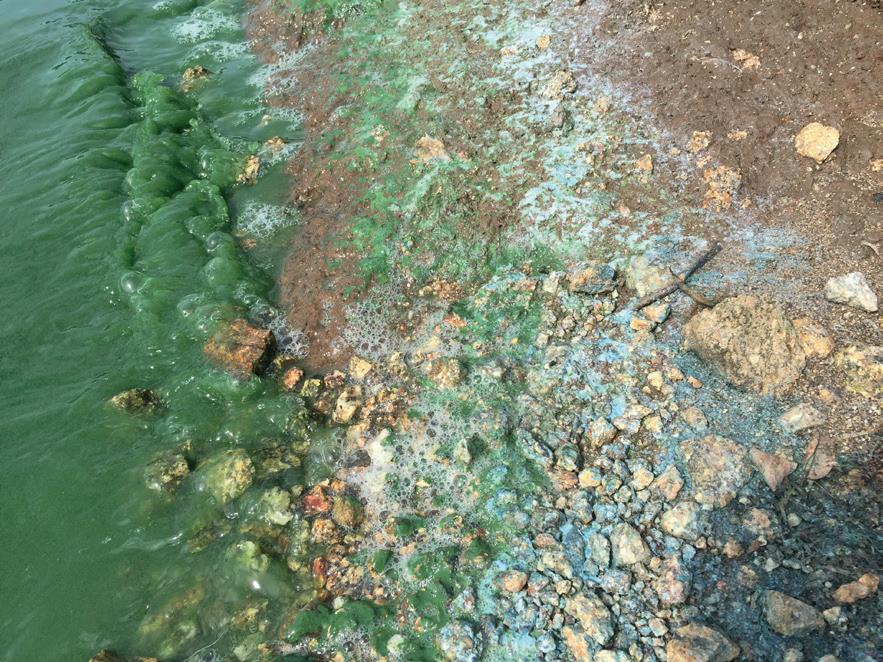
Figure 6 Detail of
blue-green algal bloom in Argal reservoir, with marks left on the shore (photo by Emilie GrandClement).
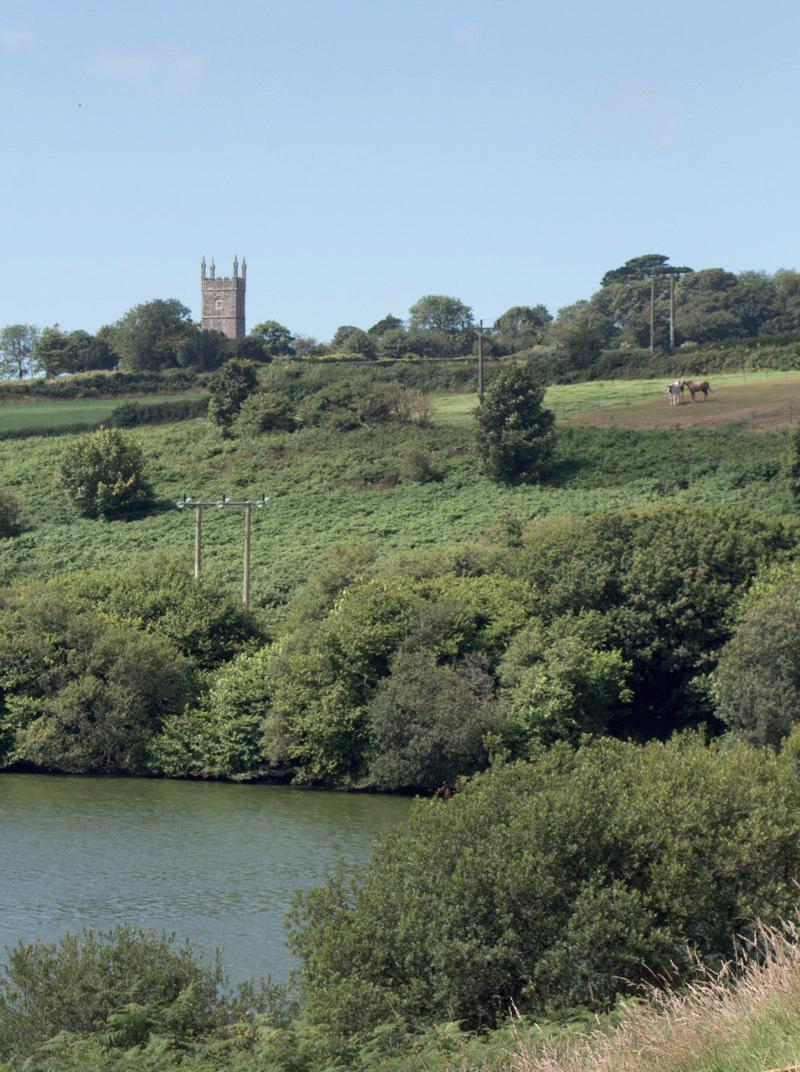
Figure 7 Total Oxidised Nitrogen
(TON-N, top), Total Phosphorus PO4-P, ( middle) and blue-green algae cell count (bottom) between 2014 and 2018 in raw water at Argal WTW; red lines indicate the target limits for each nutrient concentrations in the reservoir.
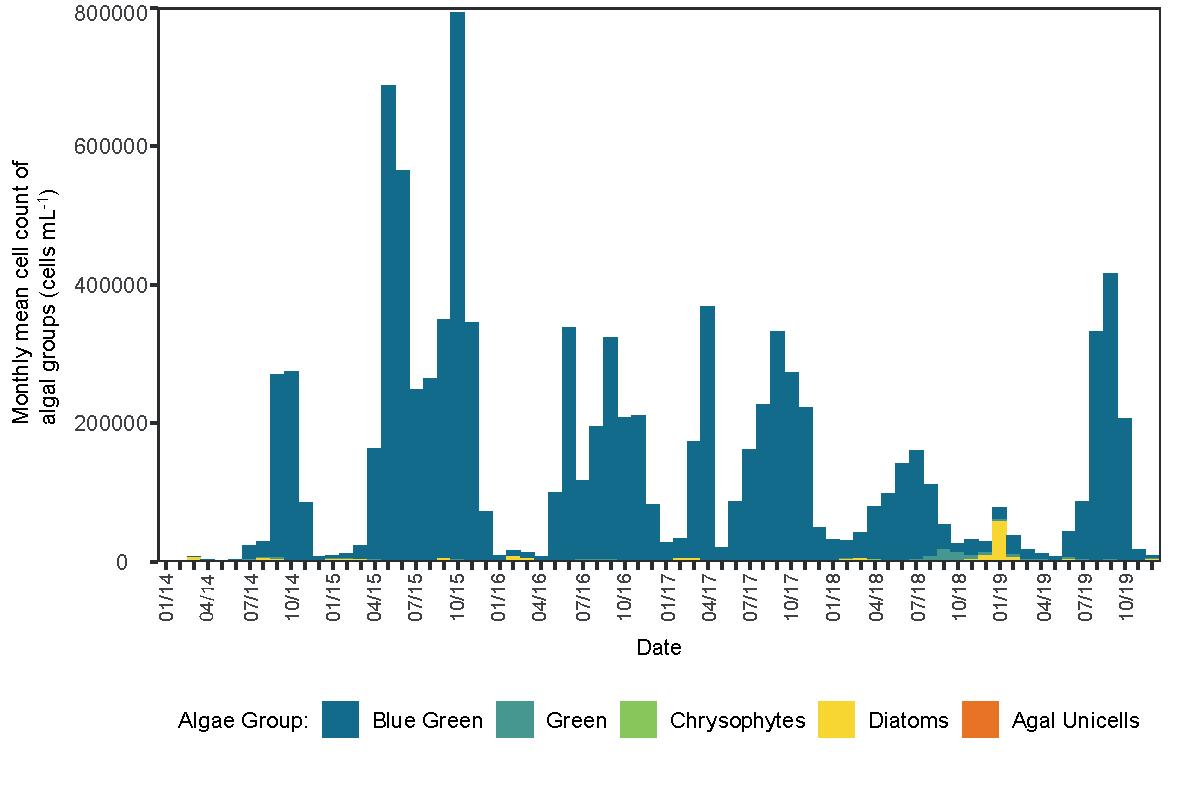
Figure 8 Monthly mean cell
count of algae per group species between 2014 and 2018 Argal reservoir.
Figure 8 highlights not only the high cell counts of cyanobacteria (i.e. blue-green algae) that can be experienced in Argal Lake during algal blooms (e.g. peaks of monthly mean cell count of ca 800,000 cells mL-1 in 2015), but it also shows the overwhelming proportion that blue-green algae make amongst the total algal and diatoms species. This is particularly problematic for the treatment of water, but also for the risk posed by the production of toxins and taste and odour compounds by cyanobacteria. The problems experienced at Argal Lake are particularly challenging and indeed costly for SWW and drinking water production. These results show the need to use catchment management to decrease nutrient input, but also to consider in-reservoir dynamics to understand and predict future blooms, and thus when water is very costly to treat.
The Argal stream (photo by Emilie Grand-Clement).
In-situ monitoring equipment by UoE within the Argal catchment (photo by Emilie Grand-Clement).
Pesticides detections within the reservoirs
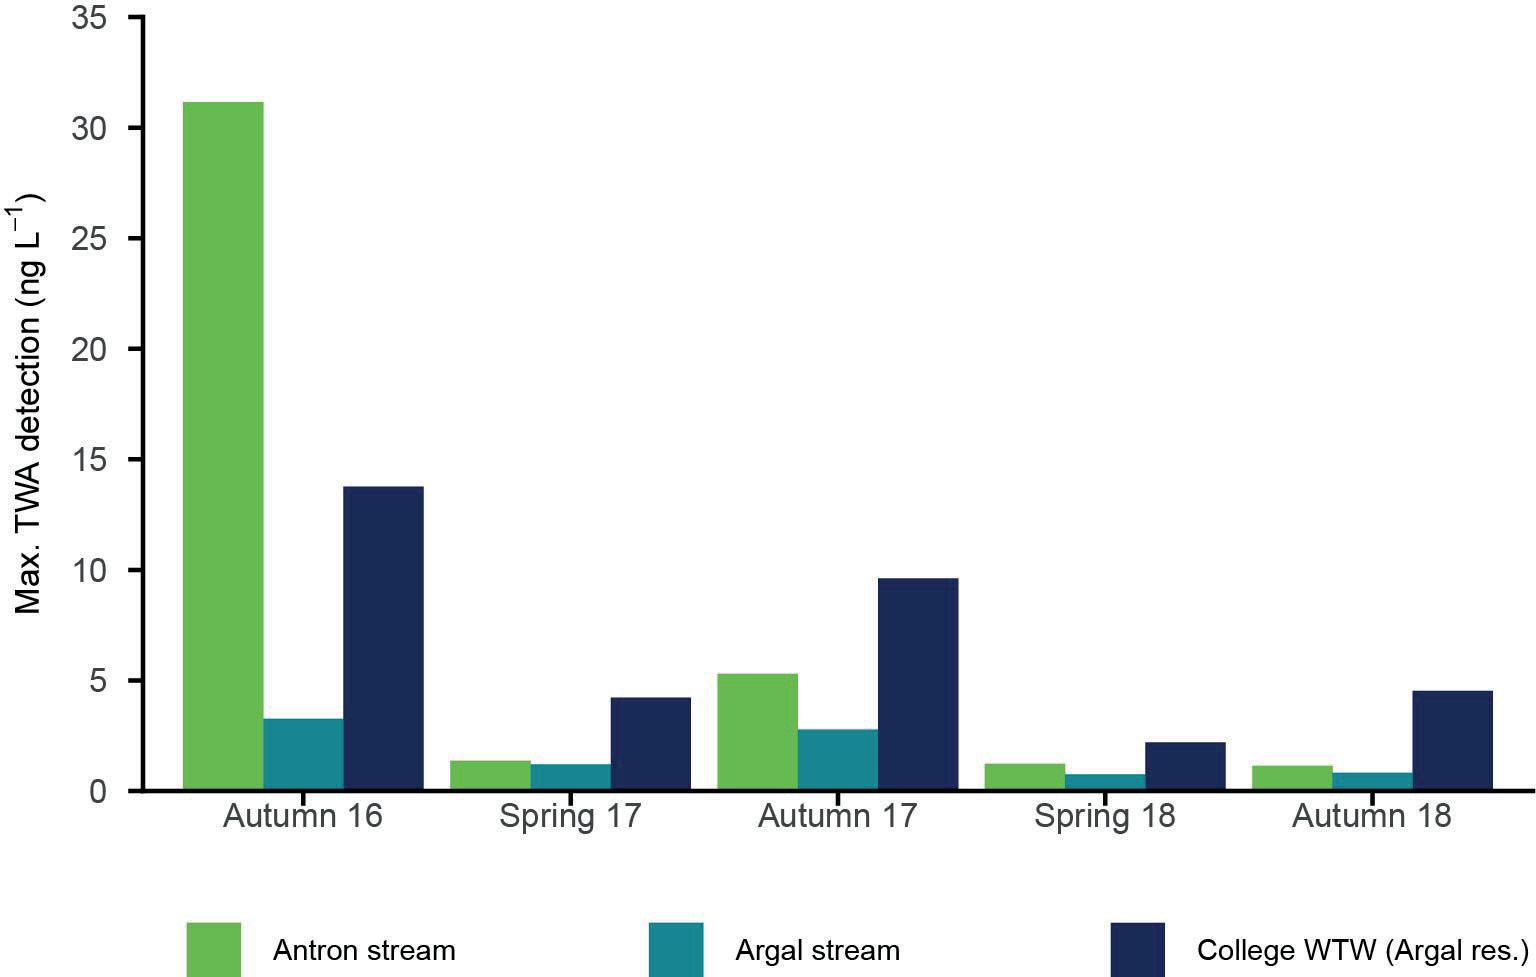
Another water quality issue in the catchment is pesticides. In particular, metaldehyde was highlighted by the EA as a pesticide of specific concern. This compound is particularly difficult to remove from raw water. These concerns are confirmed by the results from the passive sampling deployment campaigns (Figure 9). Measurements show that metaldehyde was detected in all locations (i.e. both feeder streams and at the WTW) during each spring and autumn deployment periods. More precisely, detections in the streams feeding the reservoirs show an input of metaldehyde at the time of deployment in the catchment whilst measurements at the WTW (i.e. in reservoir water) show the persistence of the compounds in the water body. This explains the higher concentrations being measured at WTW compared to input to the reservoir, which is a serious problem and costly for water treatment. The maximum concentrations detected in the passive samplers are generally low (i.e. below 35 ng L-1), and well below the regulatory 100 ng L-1 limit per compound. However, these are averaged over a period of time, and are therefore likely to hide short-lived spikes that might have occurred during each deployment period, as the pesticides were washed off the farmland that they had been applied to. Finally, a consistent decrease in concentrations between autumn deployments can be observed across all sites and monitoring years, including at the reservoir. This is a very positive result as it shows the potential for changes in the practical application of pesticides to improve water quality. However, variability in the general period of metaldehyde application (i.e. start and end of usage) and that of monitoring periods might also have prevented the detection of the compound in these locations. More work is clearly needed to reduce the input of pesticides from agriculture in such catchments.
Argal reservoir (photos by Emilie Grand-Clement)
Figure 9 Maximum Metaldehyde
detections (as time weighted average) during chemcatcher deployments in the Fal catchment between Autumn 2016 and Autumn 2018 on the Antron Stream, Argal Stream and raw water at College WTW.
Argal reservoir (photos by Emilie Grand-Clement)
About the catchment
Background site information
Drift Reservoir is located in far west Cornwall, within the Penwith Peninsula (EA) Operational Catchment which falls within the Cornwall West and the Fal (EA) Management Catchment.
Catchment Challenges
Drift Reservoir (Figure 1) is challenged by pesticides (specifically linuron, mecoprop, metaldehyde and pendimethalin) and blue-green algal blooms driven by nutrient enrichment. Interventions in the catchments were led by Cornwall Wildlife Trust (CWT). § Water quality challenges in the reservoir are pesticides and blue-green algal blooms driven by nutrient enrichment; § Detrending analysis of turbidity data between 2012 and 2018 shows that most of the high peaks were driven by climatic conditions (particularly high rainfall): differences in sediment pollution were due to interannual variability rather than catchment management interventions; no statistically significant change in water quality can be observed throughout the duration of the project; § In feeder streams, all Total Oxidised Nitrogen (TON) concentrations input to the reservoir during rainfall events are higher than the SWW target of 2 mg L-1 in the reservoir, highlighting high nutrient input from the catchment; § Although high TON concentrations were observed during rainfall events in the Sancreed Brook, low river flow in the catchment resulted in lower loads from that site; § Most Soluble Reactive Phosphorus samples fall within the “moderate” category; nutrient input during rainfall events do not yet meet the criteria set by the EA for reservoir water. § Levels of individual pesticide detections in the reservoir were below 0.1 µg L-1 throughout the monitoring periods.
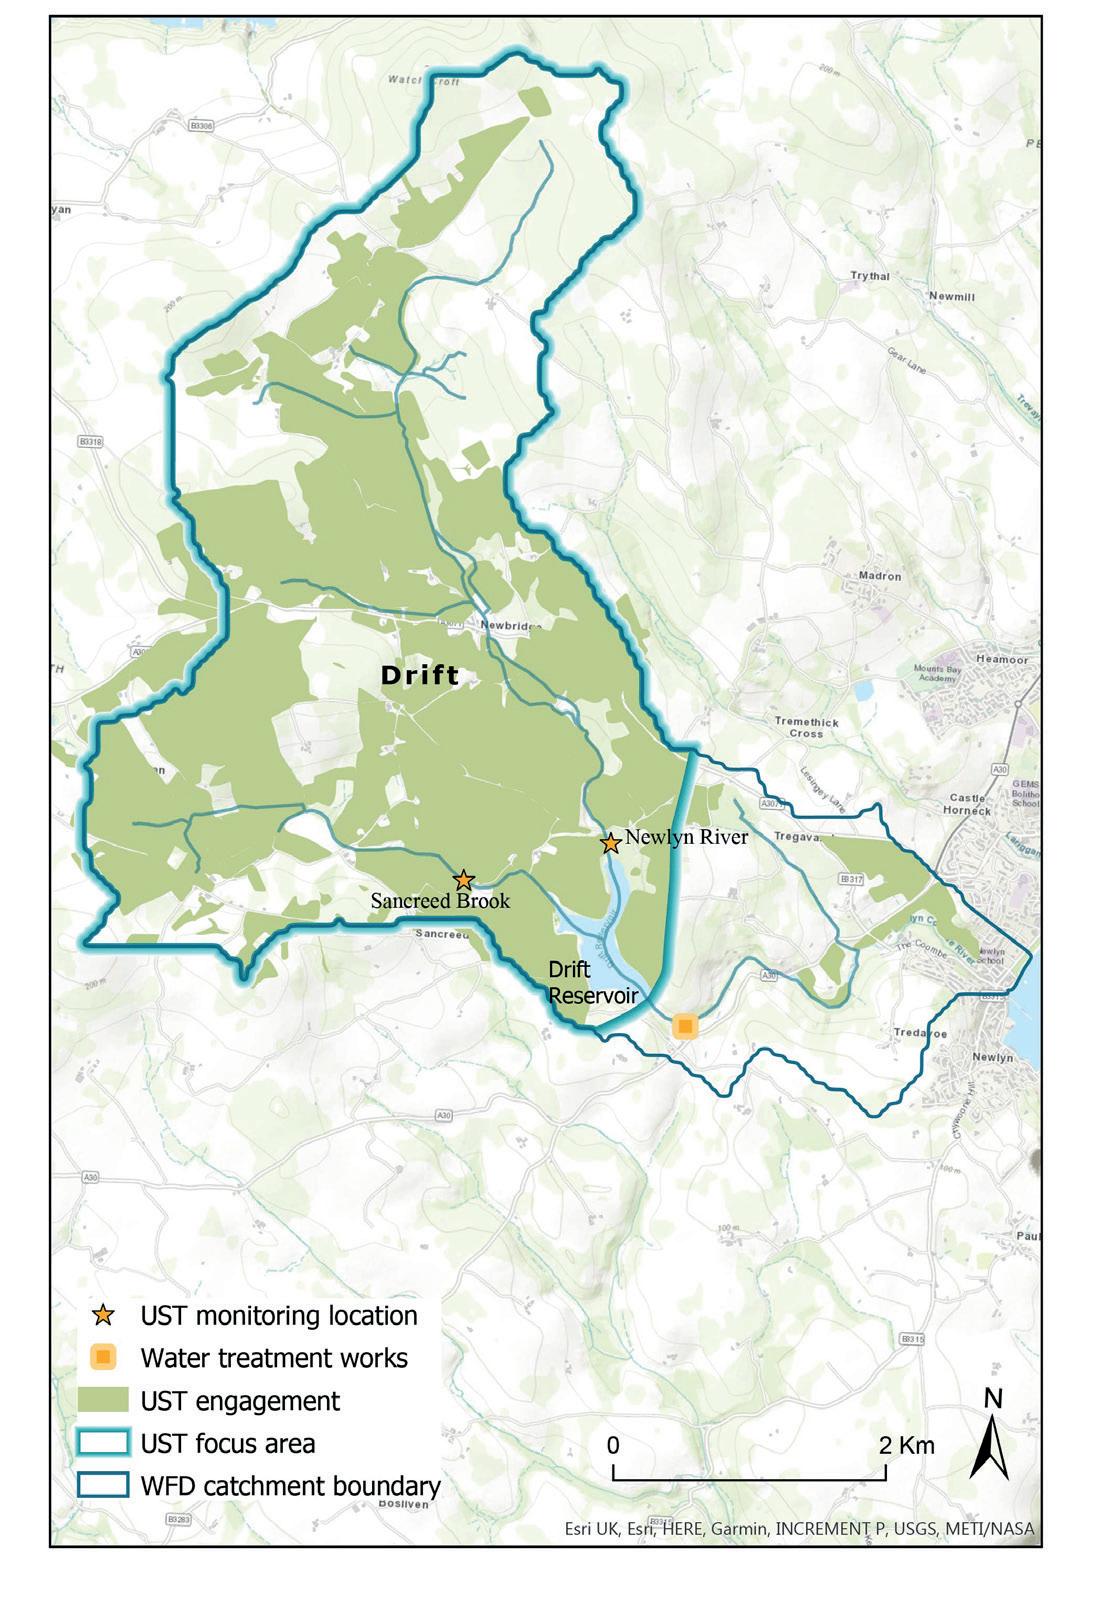
Figure 2 Map of
engagement by the CWT as part of UsT in the Drift catchment.
Catchment Activities
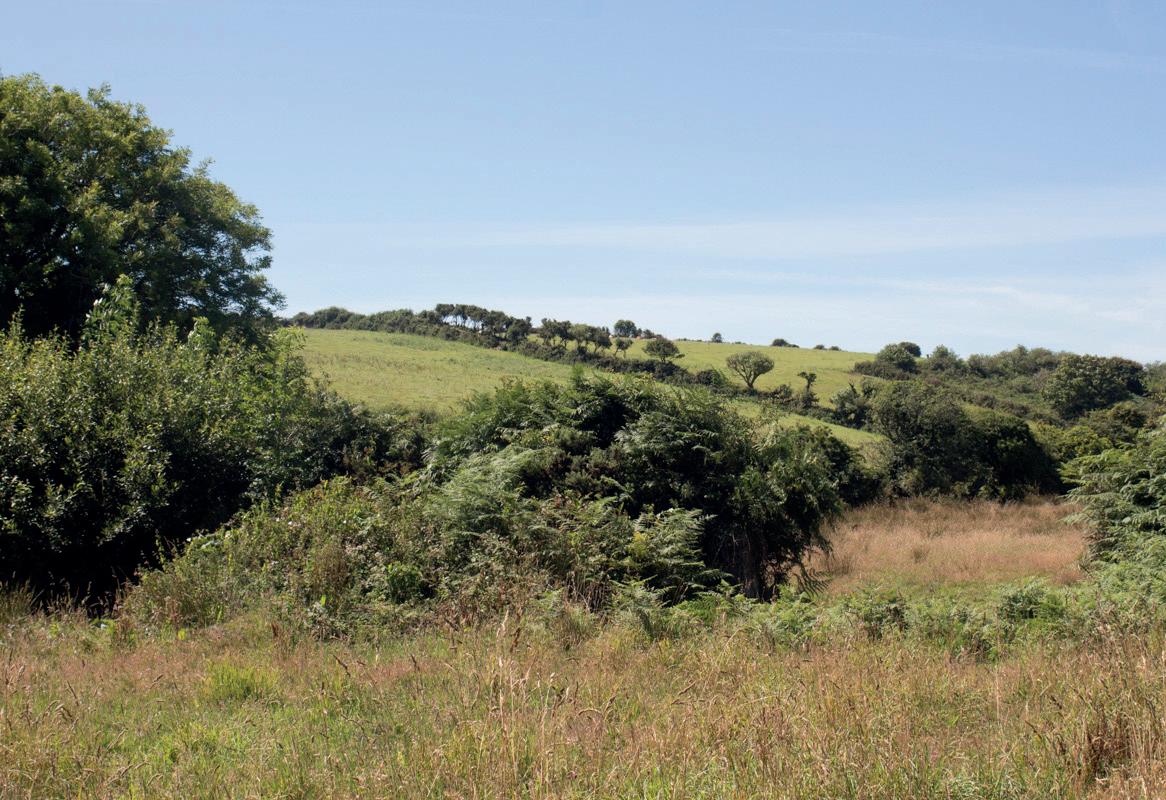
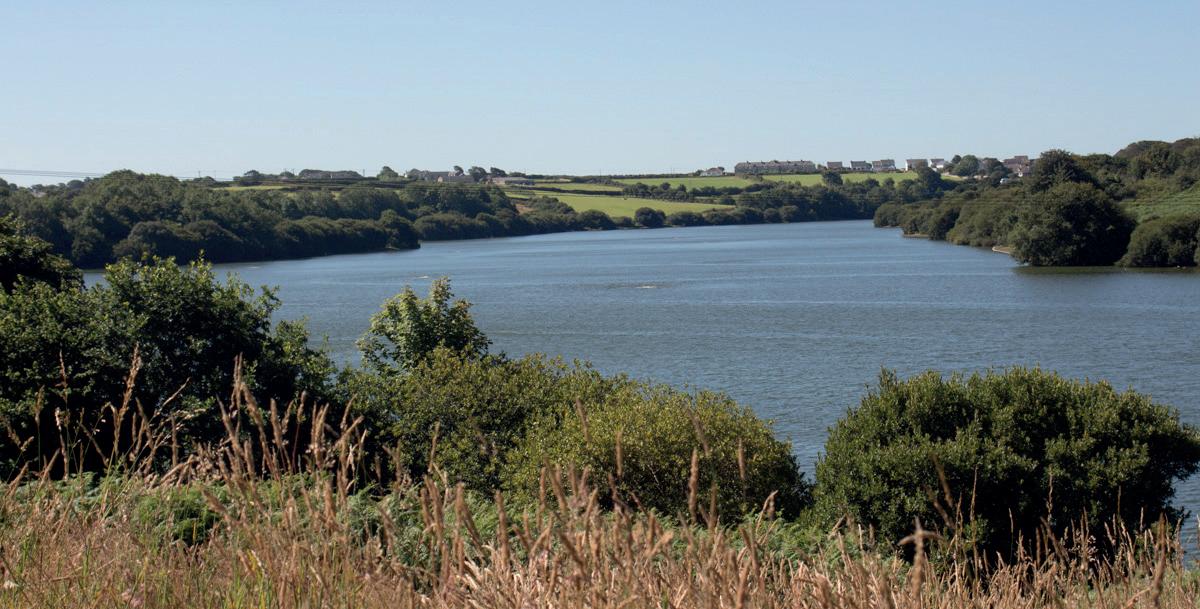
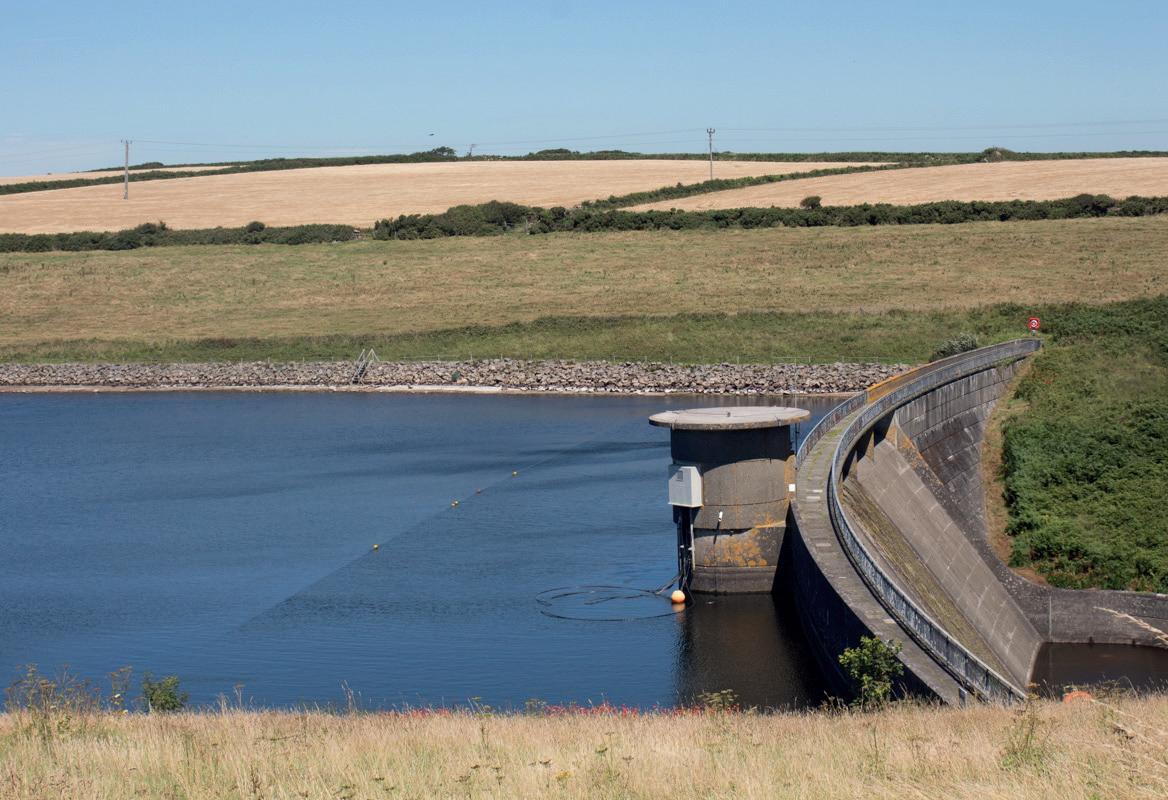
Figure 1 Drift reservoir (left) within the
catchment (right), illustrating the prevalence of intensive arable farming above the reservoir; photos by Emilie Grand-Clement.
Catchment activities in the Drift catchment focussed on measures to decrease phosphate inputs and better manage land to improve its ability to intercept nutrients and pesticides. Figure 2 illustrates the level of farm engagement in Upstream Thinking 2 within the Drift reservoir catchment. 73% of the catchment area has been engaged in the programme, including farm visits by an advisor, the provision of a farm plan or physical interventions and behaviour changes. Physical interventions completed via Upstream Thinking, which were quantifiable within the Farmscoper software, amounted to a cumulative total of 482 ha. The most commonly used interventions are shown in Figure 3. Slurry store improvements and dirty water management all impact on phosphorus losses, whilst establishing new hedges and better farm track management can also provide benefits by reducing sediment losses.
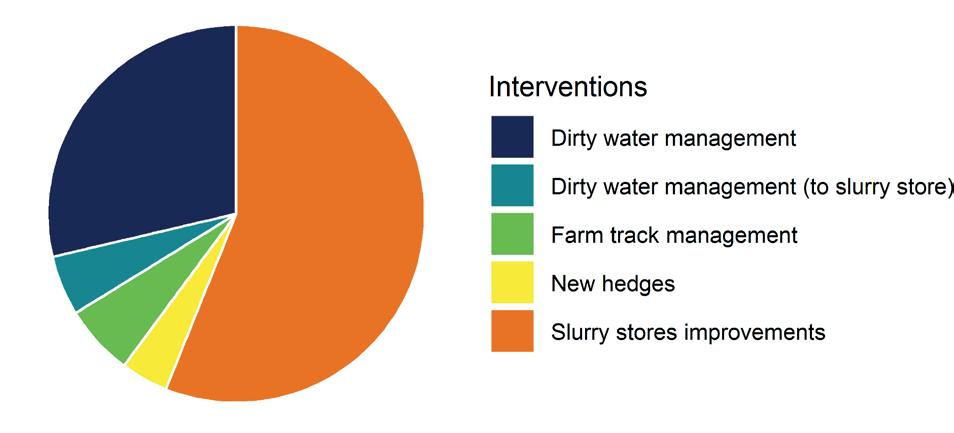
Figure 3 Top 5
interventions (quantified in Farmscoper) used in the Drift catchment.
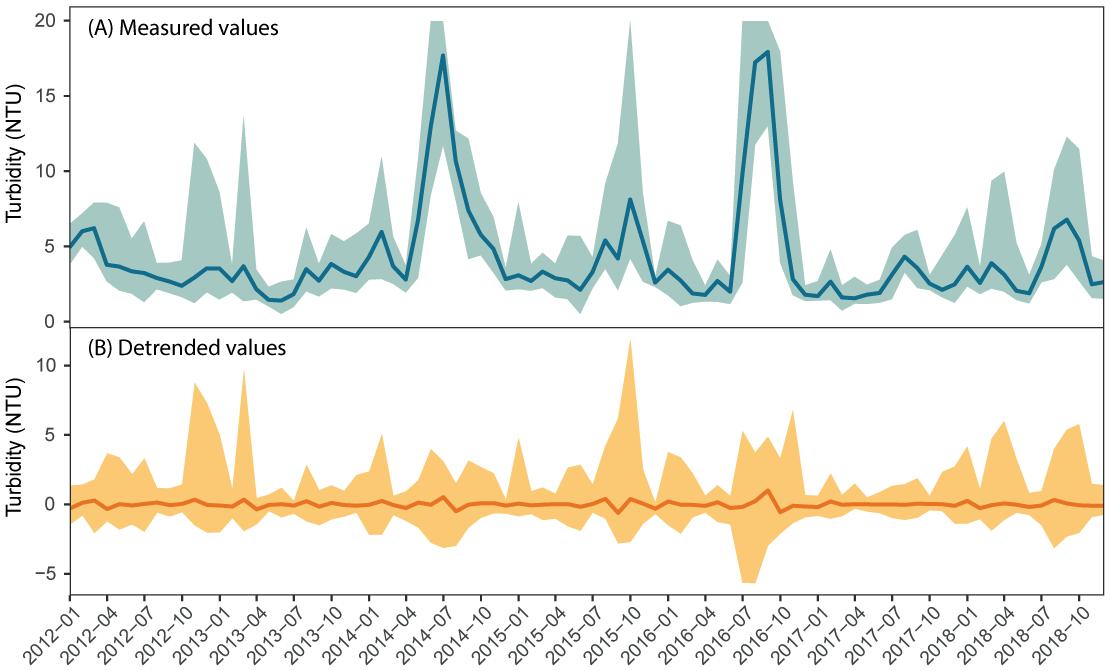
Figure 4 Monthly turbidity variations in Drift reservoir between 2012 and 2018 (A) and
detrended monthly averages for the same time period (B), with full line indicating the monthly mean and the ribbon area the associated range of data.
Water quality in the Drift catchment
Turbidity in Drift reservoir
Continuous measurements of turbidity in Drift reservoir enable an understanding of rapid variations in the suspended sediment signal, and is also an invaluable resource to study long-term, seasonal and inter-annual variations of sediment input to the reservoir. Measured turbidity variations at Drift reservoir (Figure 4A) show a cyclic pattern with an annual peak generally occurring in spring to summer, with high turbidity values measured in the summers of 2014 and 2016 (with maximum values reaching ca. 30 NTU). The occurrence of these high peaks is linked to a combination of catchment management, climatic and environmental factors. For instance, low vegetation cover following tillage leaves soils vulnerable to erosion (as well as to losing carbon to the atmosphere); combined with high rainfall and steep slopes, this could have had detrimental impact on water quality in the reservoir. Figure 4B shows the detrended turbidity signal: in this signal, the influence of climate has been removed from the dataset. This resulting dataset clearly shows the disappearance of the high peaks of summers 2017 and 2016, which can therefore be linked to seasonal conditions, including high energy summer rain storms. Other peaks, however, remain (e.g. January 2013 and October 2015). These events are likely to be driven by environmental conditions in the catchment. While no clear impact of catchment management to improve water quality can be seen since 2015, there is also no deterioration in the water quality over this period. Further interventions would be required to reduce the loss of soil from agricultural fields into the reservoir.
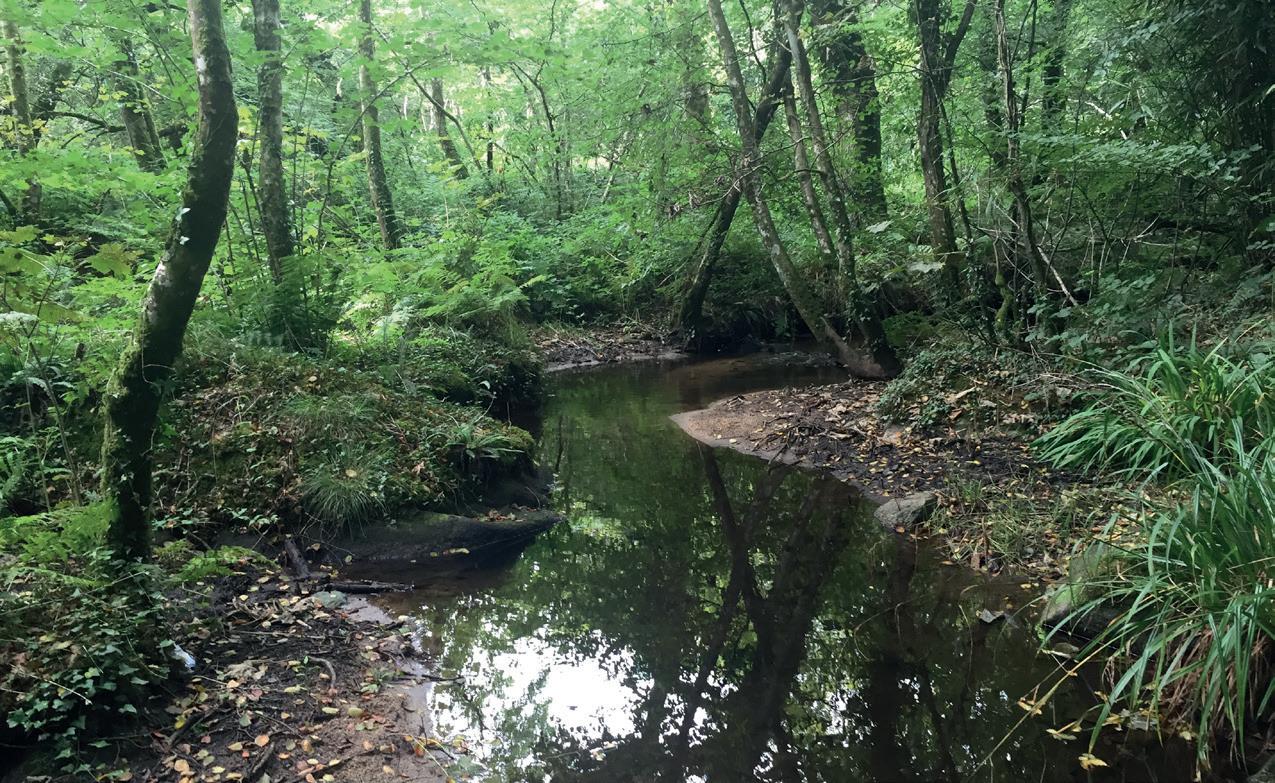
Figure 5 The Sancreed Brook; Photo by Emilie Grand-Clement (UoE).
Nutrient content in feeder streams
Nutrient inputs to the reservoir from the two feeder streams, the Sancreed Brook (Figure 5) and the Newlyn River (Figure 6), were measured during a number of rainfall events. Results (Figure 7) show significantly higher TON concentrations in the Sancreed Brook (e.g. mean concentrations between 3.7 mg L-1 and 4.7 mg L-1) than in the Newlyn River (e.g. mean concentrations between 2.5 mg L-1 and 3.05 mg L-1) for each hydrological year; for both sites these values are consistently above the target of 2 mg L-1 set by SWW in the reservoir as an indicator of improvement. For phosphate losses during rainfall events, there are little differences between sites. Overall, phosphate values in the catchments place both streams in the “moderate” category, whilst some samples occasionally fall in both “good” and “poor” categories”. Overall, the nutrient input during rainfall events do not yet meet the criteria set by the EA for in reservoir water.
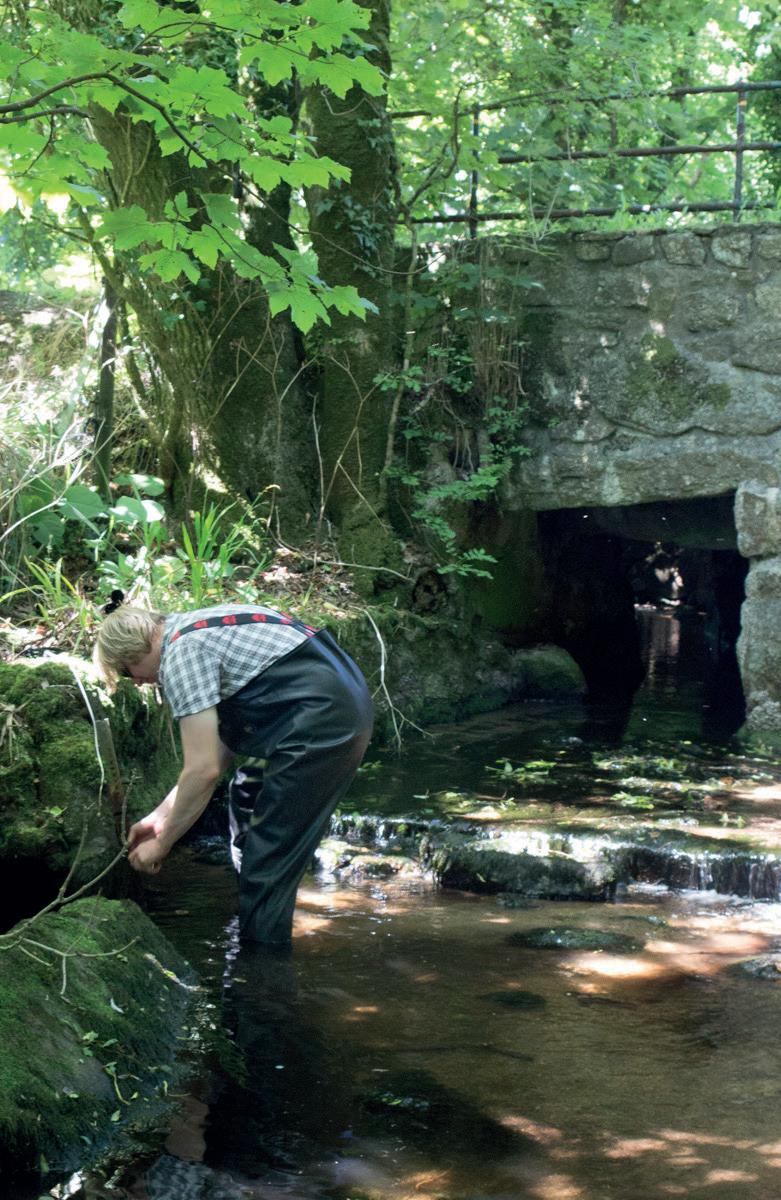
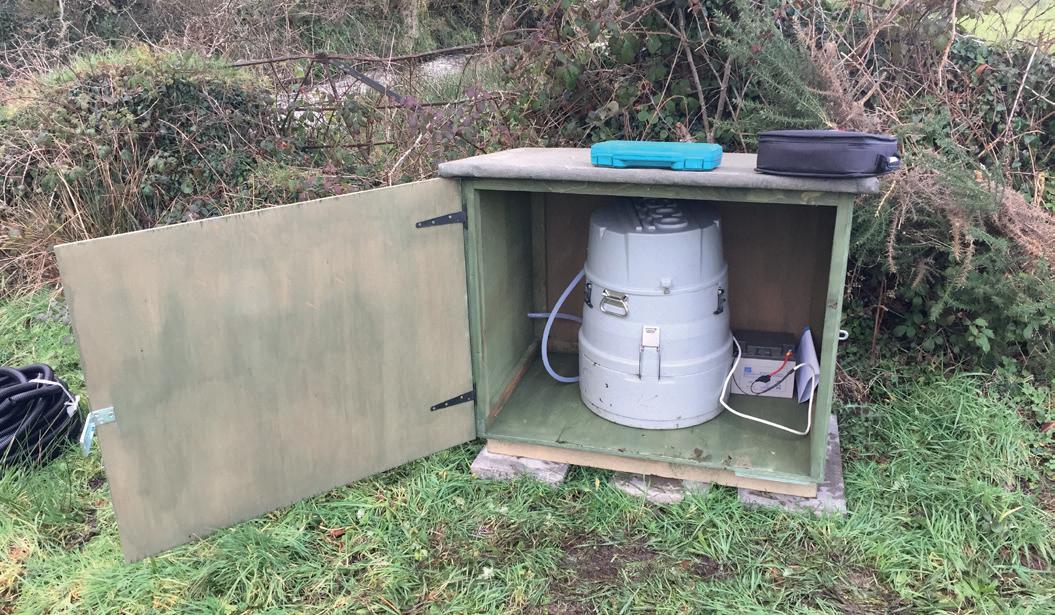
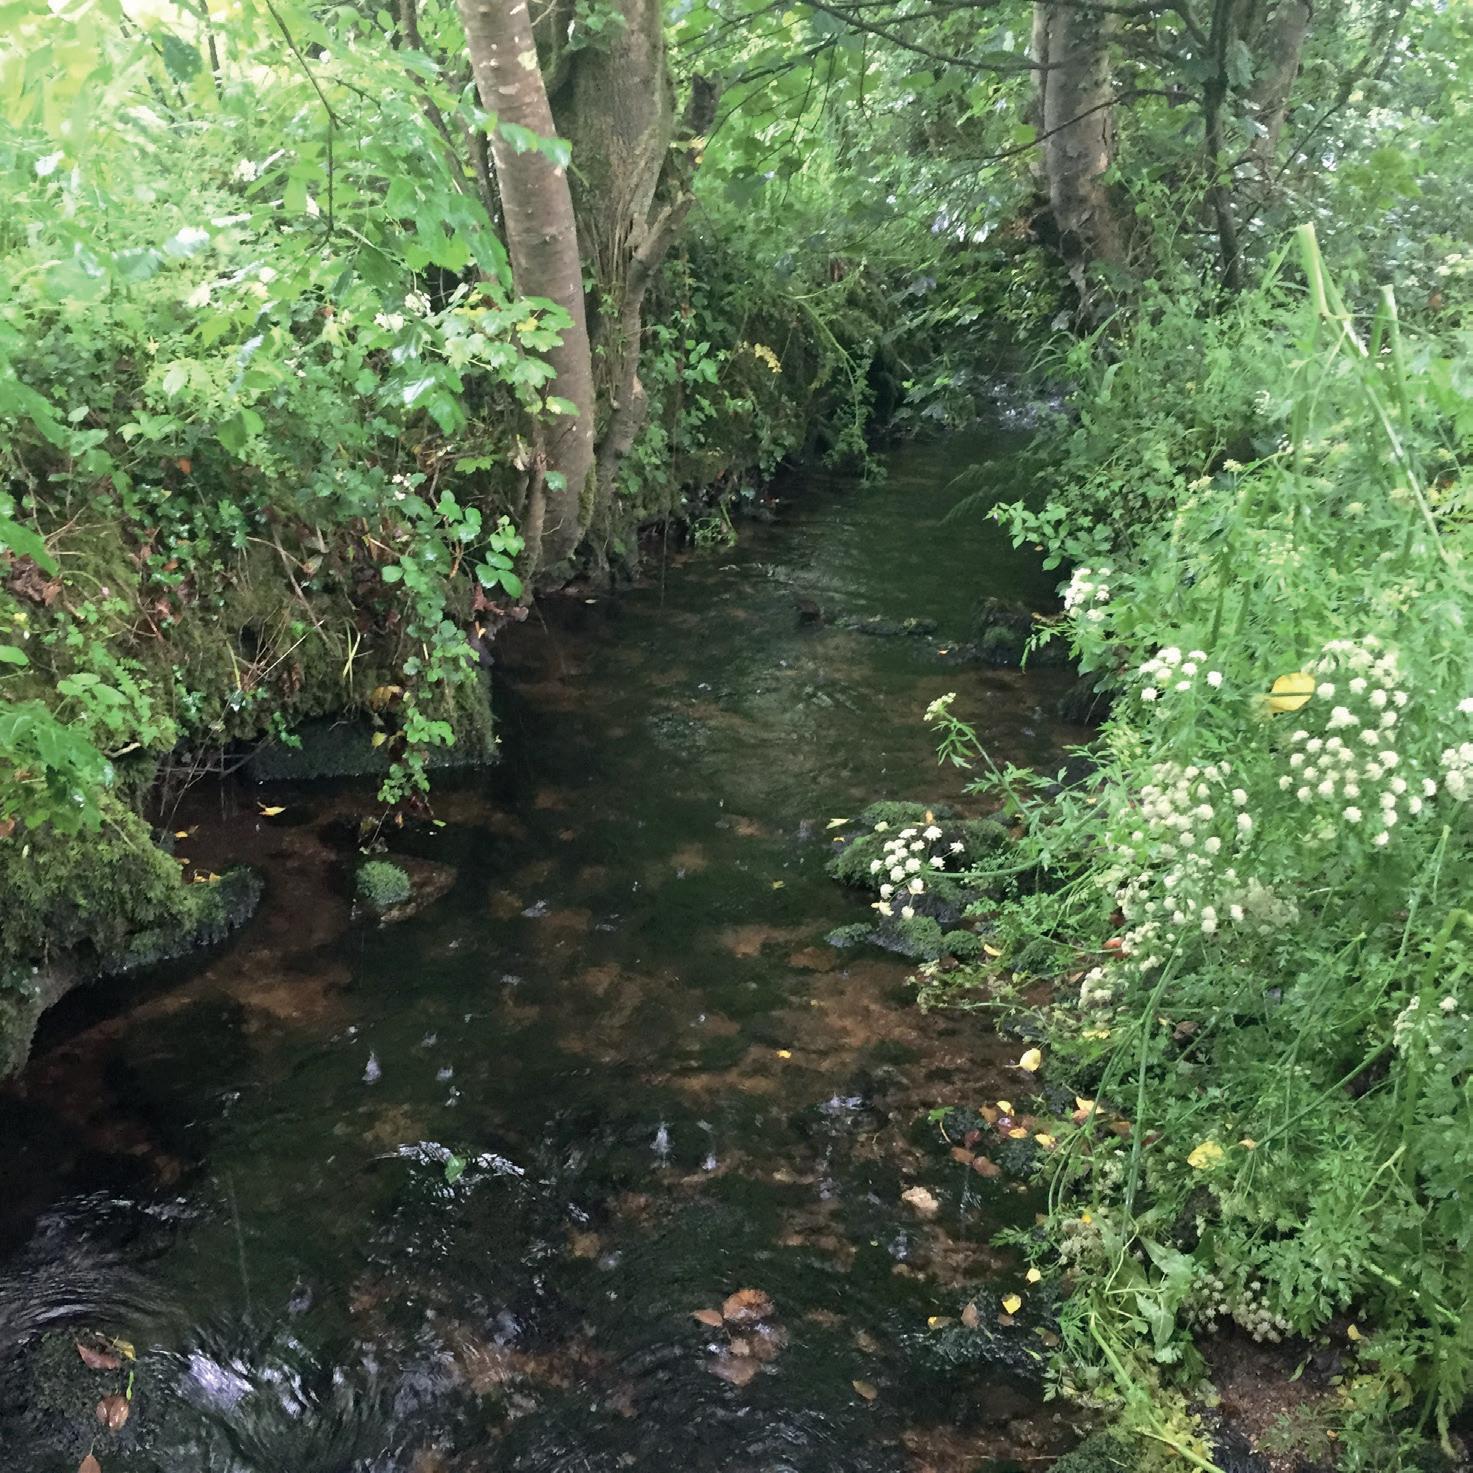
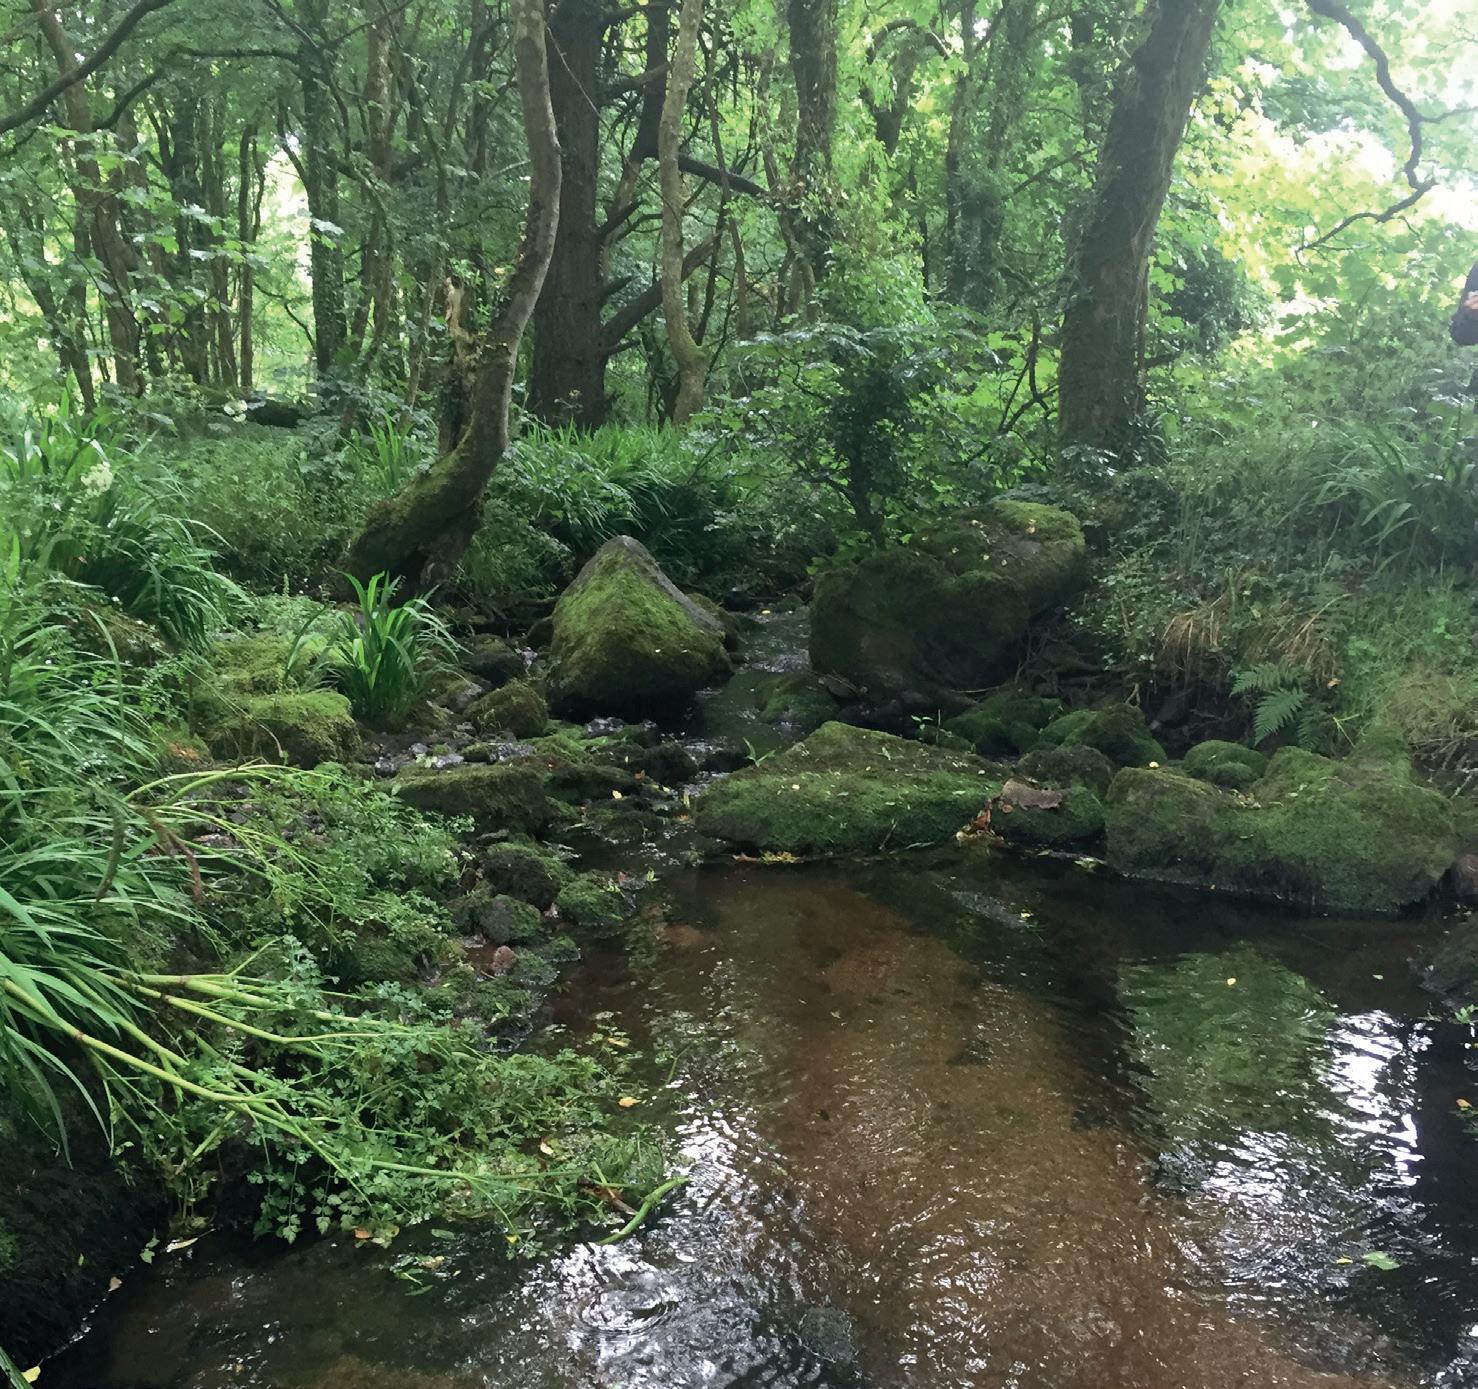
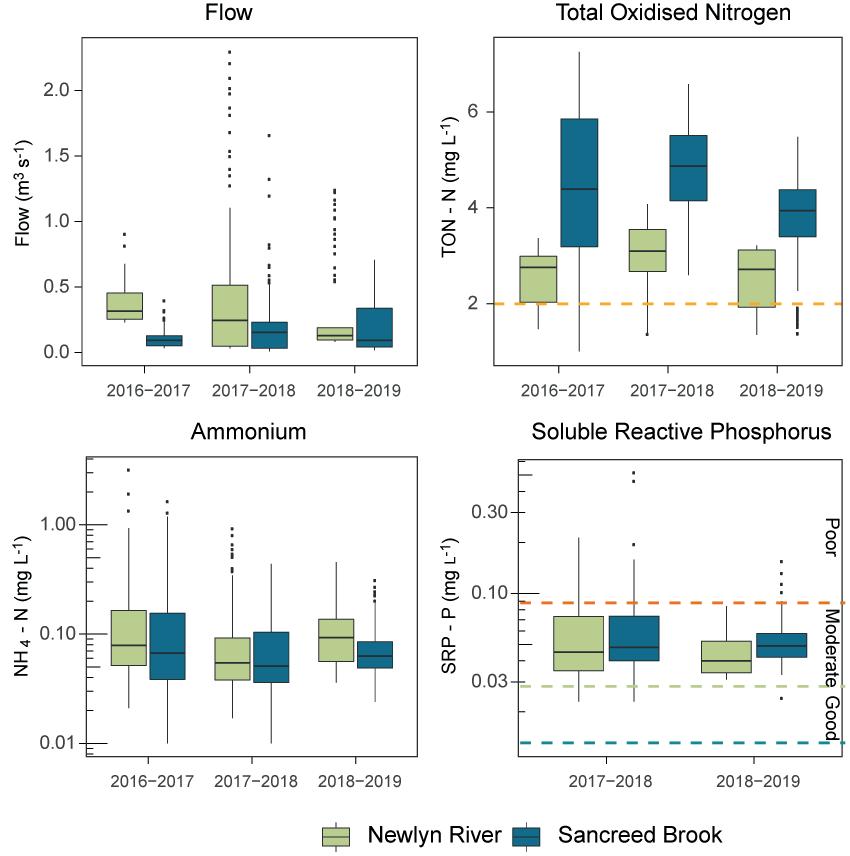
Figure 7 Flow Total Oxidised Nitrogen,
ammonium and Soluble Reactive Phosphorus concentrations in the feeder streams to Drift reservoir, with dashed lines representing the regulatory limits for Total Oxidised Nitrogen and total phosphorus respectively.
Figure 7 also shows that the Newlyn River tends to have higher stream flow during monitored events than the Sancreed Brook for 20162017 and 2017-2018 monitoring years. This results in slightly higher nutrient loads (i.e. the actual mass of nutrient carried by the stream to the reservoir) compared to Sancreed Brook, despite experiencing lower concentrations (Figure 8). This has implications for catchment management, as interventions in the Newlyn River sub-catchment will have a slightly higher impact on the delivery of nutrients during high flows, thus future catchment interventions could be more valuable in this sub-catchment.
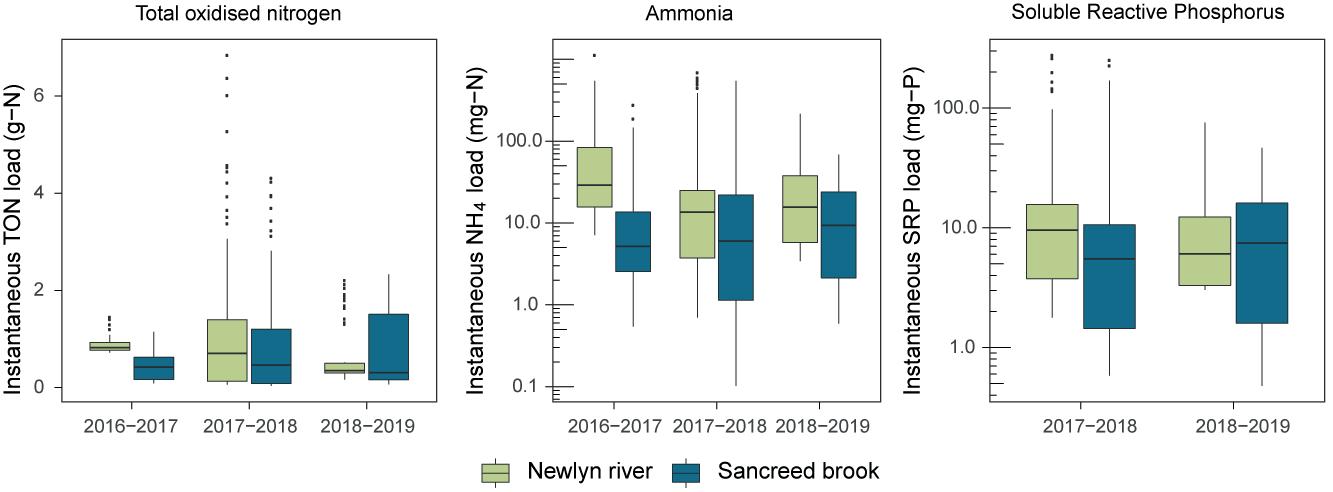
Figure 8 Total Oxidised


